1. Introduction
Controlled delivery of specific cells to correct defective or damaged tissue has become a significant research goal in tissue regenerative therapies. However, design of supports to promote cell attachment is highly complex and the determinants of cell adhesion range from surface charge [
1,
2], hydrophilic/hydrophobic balance [
1,
3,
4,
5,
6,
7], functional group type and content [
1,
7,
8,
9], to surface roughness and topology [
10,
11]. For cell culture and delivery applications, it is usually important to generate materials which exhibit high cellular affinity during the cell growth and transport stages, but low affinity when the cells are in their desired site of action or expansion. It is also desirable to be able to switch on or off these cell surface interactions via a simple stimulus, as traditional cell harvesting methods (e.g., high shear or proteases) are not applicable in vivo.
Synthetic polymers have many properties which can be systematically altered, and thus have advantages over natural polymers when tuning of function is required. Certain polymers exhibit changes of solubility in aqueous solutions in response to changes in temperature, and those materials with Lower Critical Solution Temperature (LCST)-type phase transitions, have been widely studied for tissue engineering [
12,
13], drug delivery [
14,
15], and cellular binding [
8,
9,
16]. However, there has been relatively little work focused on polymers with Upper Critical Solution Temperature (UCST)-type phase transition behavior for these applications. The limited evaluation of UCST transitions in practical applications to date is possibly because only a few polymers exhibit UCST behavior in aqueous media [
17,
18,
19,
20,
21]. PNAGAm (poly(
N-acryloyl glycinamide)) and related materials (e.g., poly(
N-acryloylasparaginamide), PNAAAm) have been the most studied reversible hydrogen bonding based UCST polymers, as a result of their phase transitions being adjustable to body temperature in ionic solutions [
19,
20,
22,
23]. For biomedical applications, examples have been demonstrated for PNAGAm based hydrogels as thermo-responsive drug delivery systems [
24], but not for controllable cell culture and delivery. However, we have recently shown that variants of PNAGAm based polymer brushes may be suitable for applications in tissue engineering and regenerative medicine through temperature-controlled cell attachment [
25]. On the other hand, of particular note is the controlled UCST-type behavior for ureido-modified polypeptide poly(
l-ornithine)-
co-poly(
l-citrulline) (POC) under physiological conditions, the transition temperature of which can be adjusted up to 31 °C by ureido content [
26]. Importantly, modified polypeptides of this type potentially offer the advantages of biocompatibility, biodegradability and cellular affinity, allowing them to be good candidate materials for cell delivery.
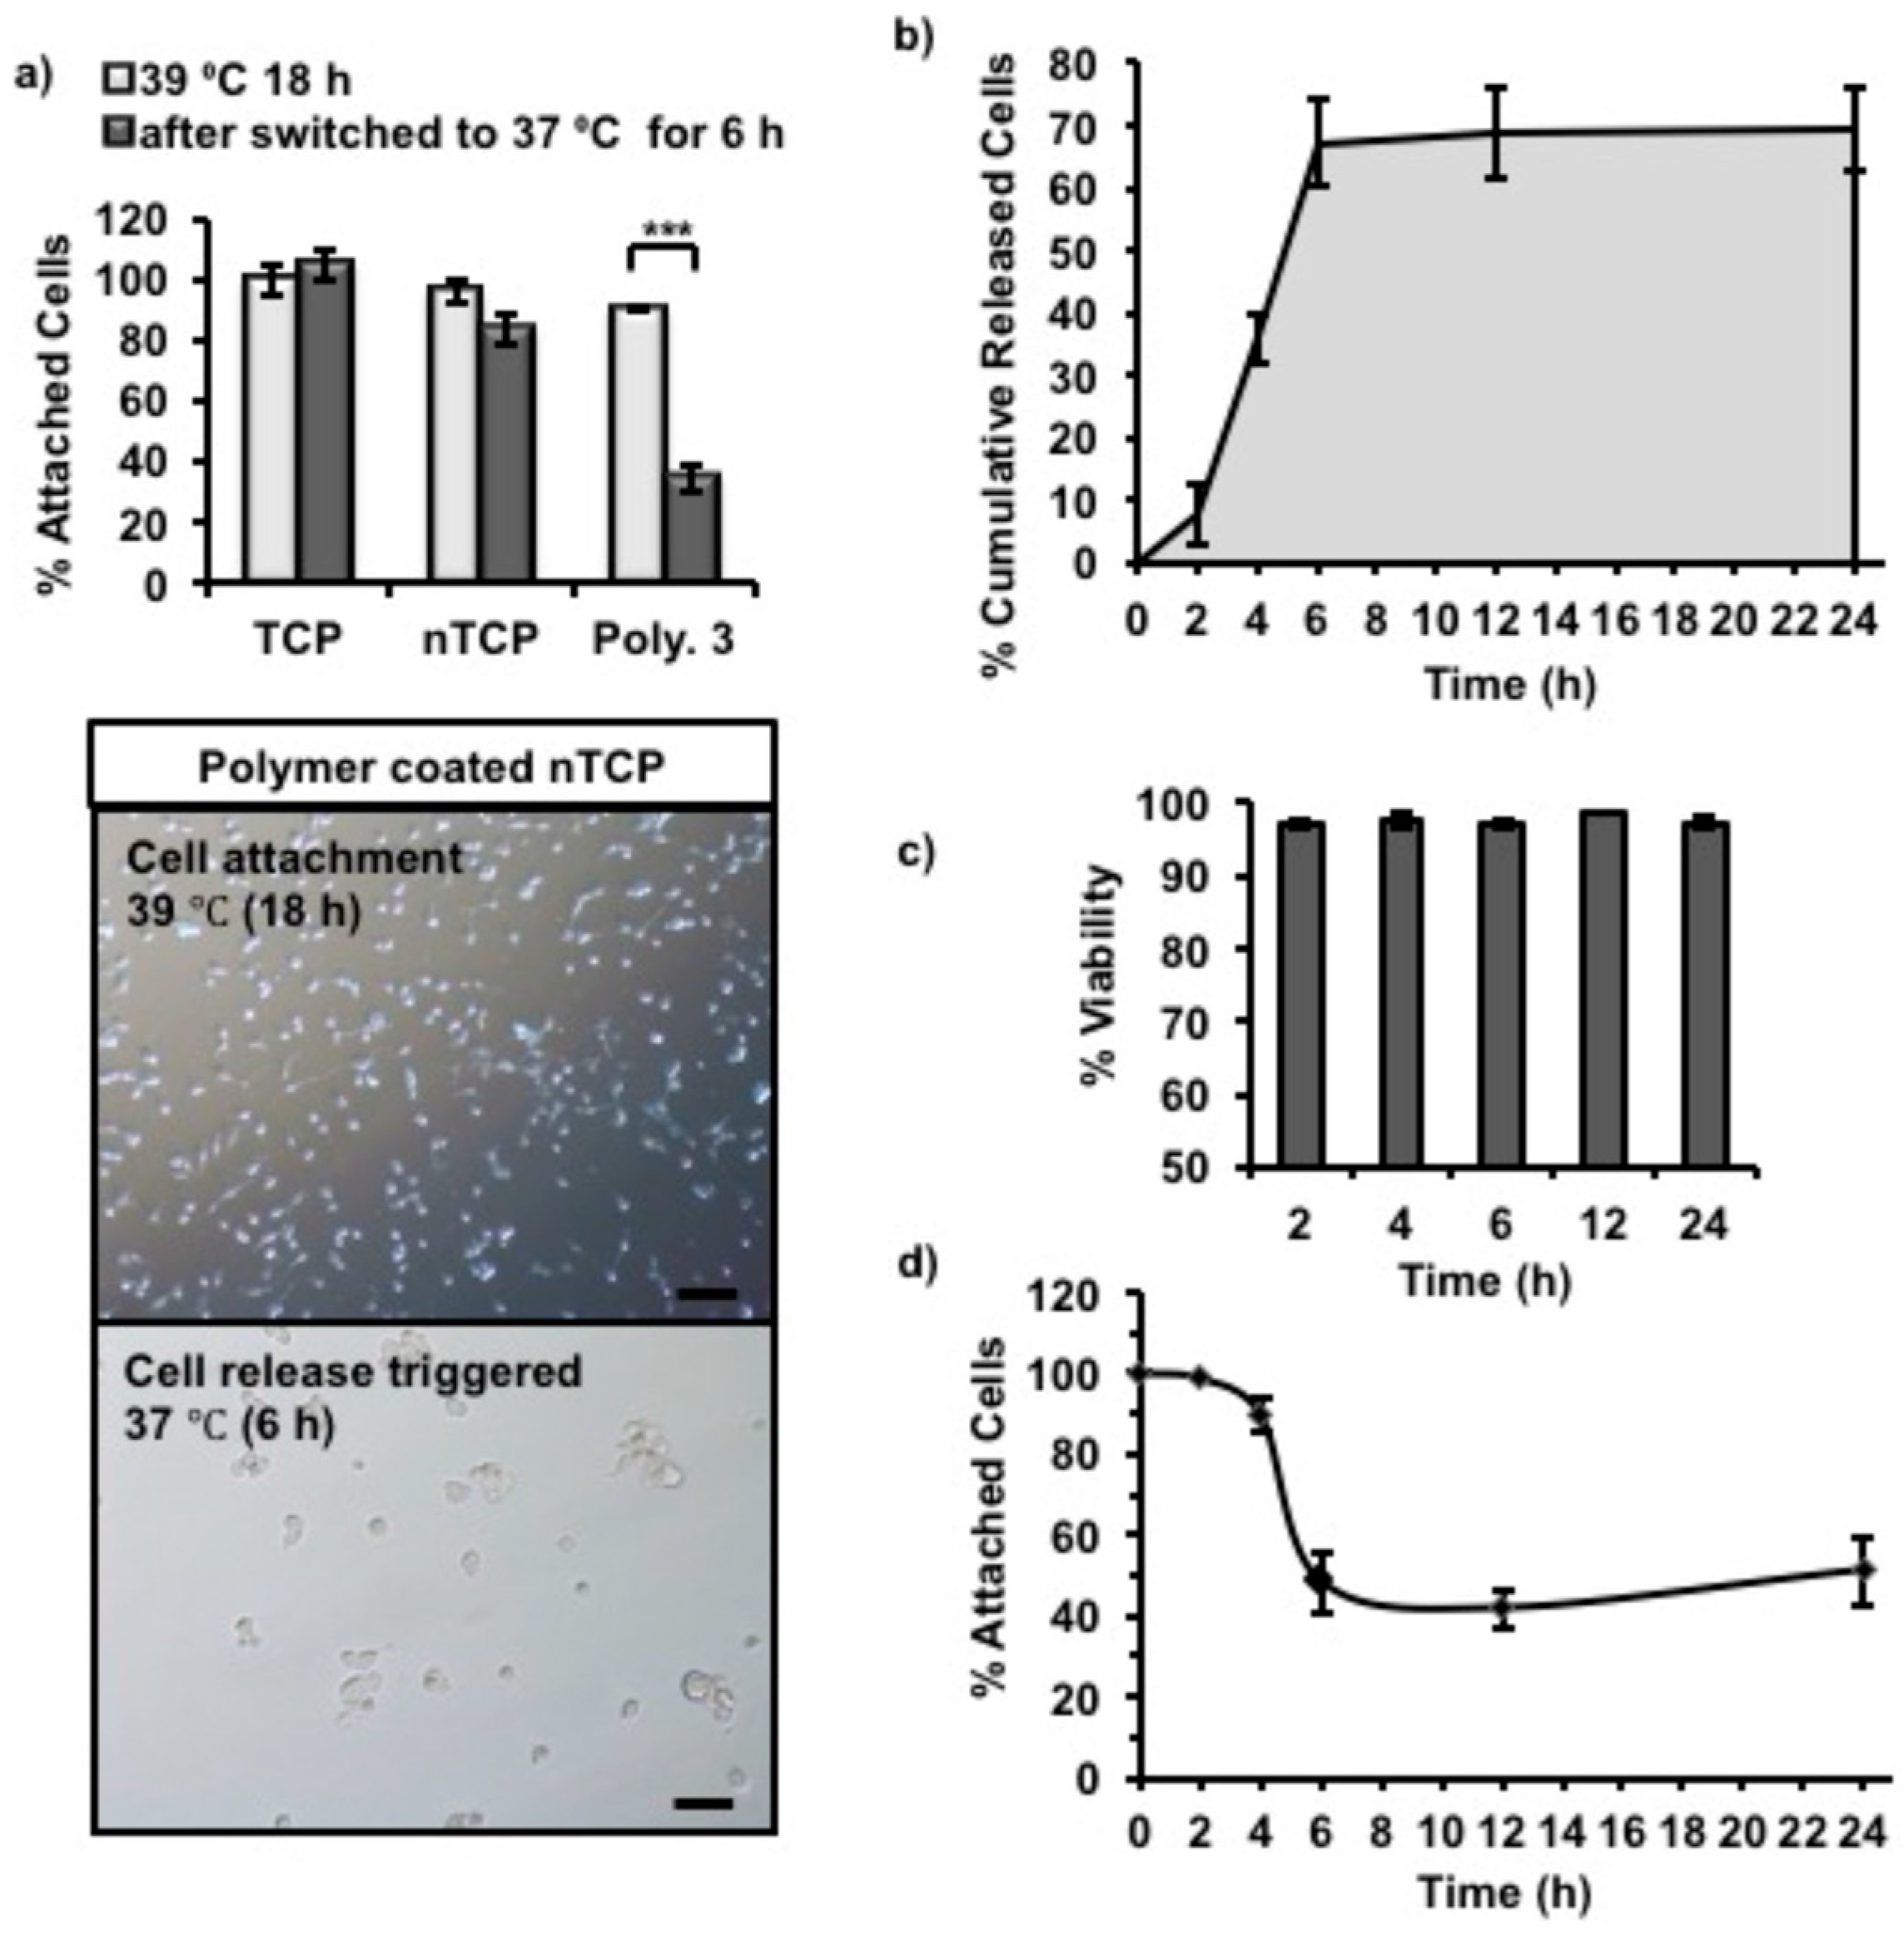
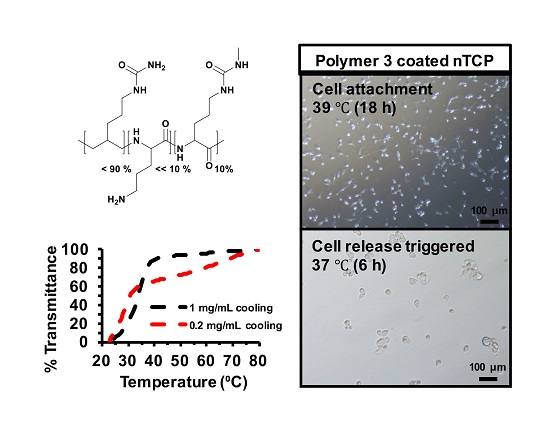
Here, we report the synthesis and characterization of polypeptides with UCST-type behavior, utilizing ureido and methyl isocyanate modification of poly(l-ornithine) hydrobromide. The resultant materials showed reversible phase separation from phosphate-buffered saline (PBS) buffer (pH 7.4, 100 mM) at physiological temperatures. The polymer was adsorbed from solution to coat non tissue culture treated plastic plate (nTCP) at its transition temperature (39 °C). The resultant coating gave similar 3T3 cell attachment at 39 °C to uncoated cell culture treated plastic, while cell detachment was triggered by a temperature change to 37 °C. Approximately 65% of attached cells were released within 6 h in response to the temperature change and more than 96% of the released cells were viable at all tested time points.
3. Discussion
In order to probe the surface hydrophobicity change after coating with polymers, plastic coverslips were again coated with Polymer
1–
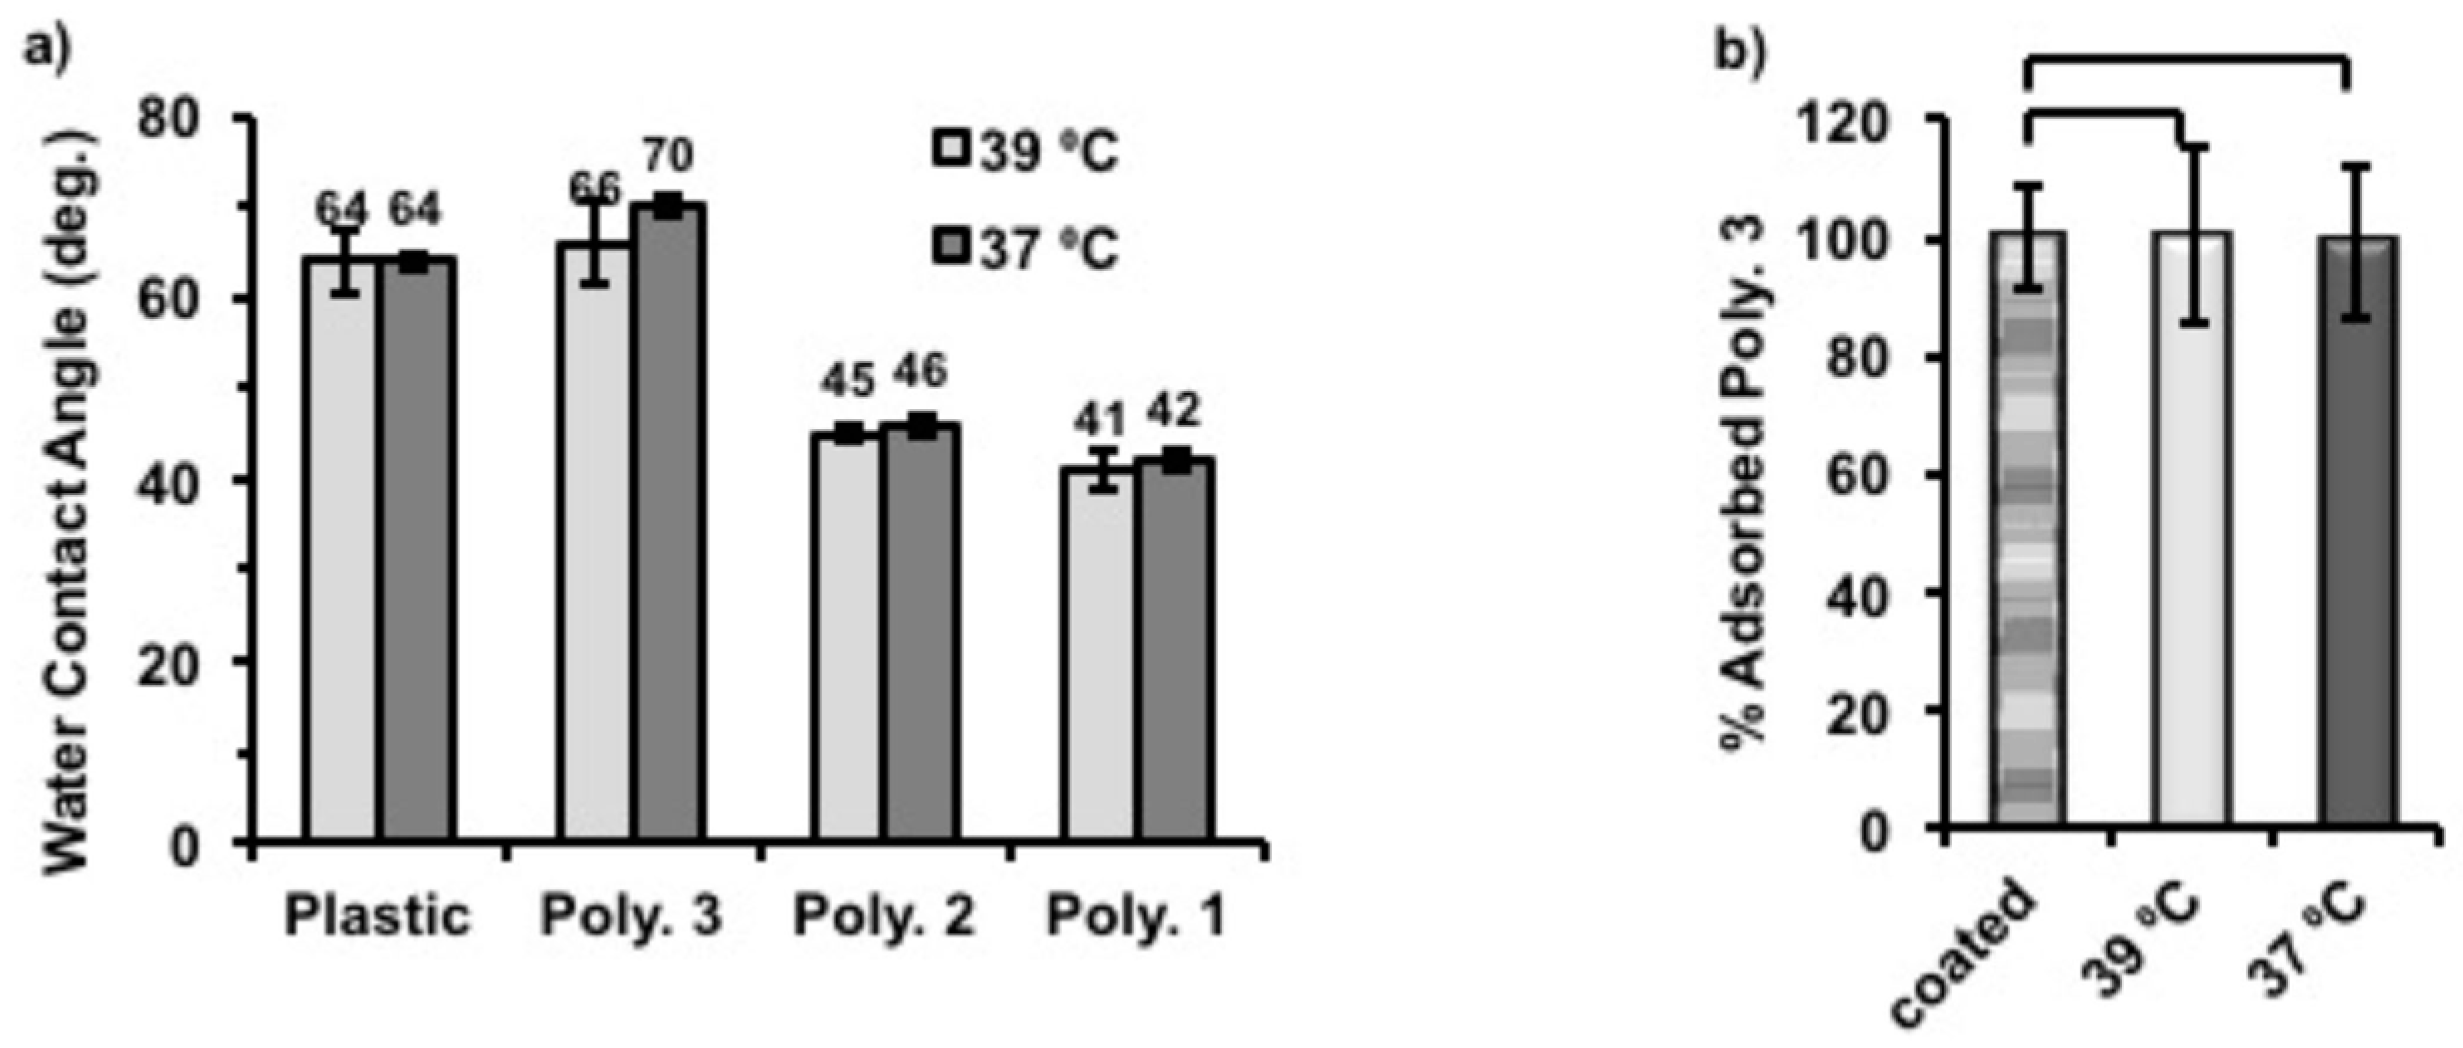
3 using the same protocol described above. Static water contact angles were then measured for each sample at 39 and 37 °C. (
Figure 5a) The static water contact angles of coated substrates decreased, with the increase of hydrophilicity of coating polymers (Polymer
1 ˃ Polymer
2 ˃ Polymer
3). Thus, the surfaces became more hydrophilic with Polymer
1 coatings than when coated with Polymer
3, which is also in accord with their structural compositions. Particularly, the static water contact angle of Polymer
3-coated surface showed the closest values (66° at 39 °C, and 70° at 37 °C) to uncoated plastic (around 64° at both temperatures) which were found to be within the range that gives maximum adhesion of fibroblasts [
31,
32], while those of Polymer
1 and Polymer
2 were between 40° and 50° at both temperatures. Also, we found that Polymer
3-coated surfaces became more hydrophobic (4° higher) when the assay temperature was changed from 39 to 37 °C. Although the same response to temperature was also observed for Polymer
1 and
2 coated surfaces, the contact angle difference for them was only 1° between two temperatures. It was anticipated that the phase transition temperatures of Polymers
1 and
2 were lower or just in between the applied temperatures and the solubility of these polymers would not vary much due to such a small temperature change. However, the chains of Polymer
3 were expected to vary in conformation across the assay as the phase transition temperature of Polymer
3 was close 39 °C on cooling cycles. Therefore, we believe that this temperature related surface hydrophobicity change of Polymer
3 was the cause of cell release when altering the culture temperature. As expected, uncoated plastic coverslips used as control surfaces did not show temperature-dependent behavior.
To understand better the mechanism of temperature triggered cell release from Polymer
3 coated nTCP, the amount of Polymer
3 on each well after incubation at different temperatures was quantified by using a Pierce Quantitative Colorimetric Peptide Assay. In this experiment, the amount of Polymer
3 on each well immediately after coating was approximately 0.70 µg/cm
2. Two coated plates were then incubated with 500 μL of deionised H
2O in each well for 6 h at 37 °C and 39 °C, respectively. The remaining amount of Polymer
3 after this was quantified and compared to that of the initially coatings (0.70 µg/cm
2 set to be 100%). As shown in
Figure 5b, more than 99% of initially coated Polymer
3 remained on the surfaces after incubation at both temperatures, indicating that this polymer did not detach from the surface in aqueous media at both tested temperatures. The standard curve made to quantify the adsorbed polymers can be found in
Figure S8.
To evaluate protein adsorption on polymer coated surfaces, nTCPs were used as the substrates for polymer coating and as a negative control. TCPs were used as positive control to compare the effect of polymer coating investigated. Polymer
4 was used as a non thermoresponsive control coating polymer. The protein resistance of Polymer
4 is from the low fouling non-ionic polyethylene glycol (PEG) at its surface. A relatively high concentration of (Monomeric red fluorescent protein1) mRFP1 solution (200 μg/mL) was used in this experiment in order to give readable fluorescent intensities of mRFP1 as its surface adsorption was low. Proteins were allowed to adsorb on surfaces over 24 h to ensure that the adsorption reached a maximum [
33]. In order to evaluate the correlation between protein adsorption and its charge, two variant mRFP1s, with both positive (pI = 9.66) and negative (pI = 5.65) net overall charges in deionized H
2O solution at pH 7, were incubated in coated wells at 37 °C for 24 h, and handling time thereafter was reduced as short as possible. The supernatants from each well were therefore removed after incubation. The plates were rinsed with copious amount of PBS twice and deionized water once to remove all the improperly adsorbed protein. The emission collection band width in our assay spanned the excitation wavelength, therefore the excitation wavelength was set up to be 620 nm, instead of 607 nm as reported elsewhere [
34].
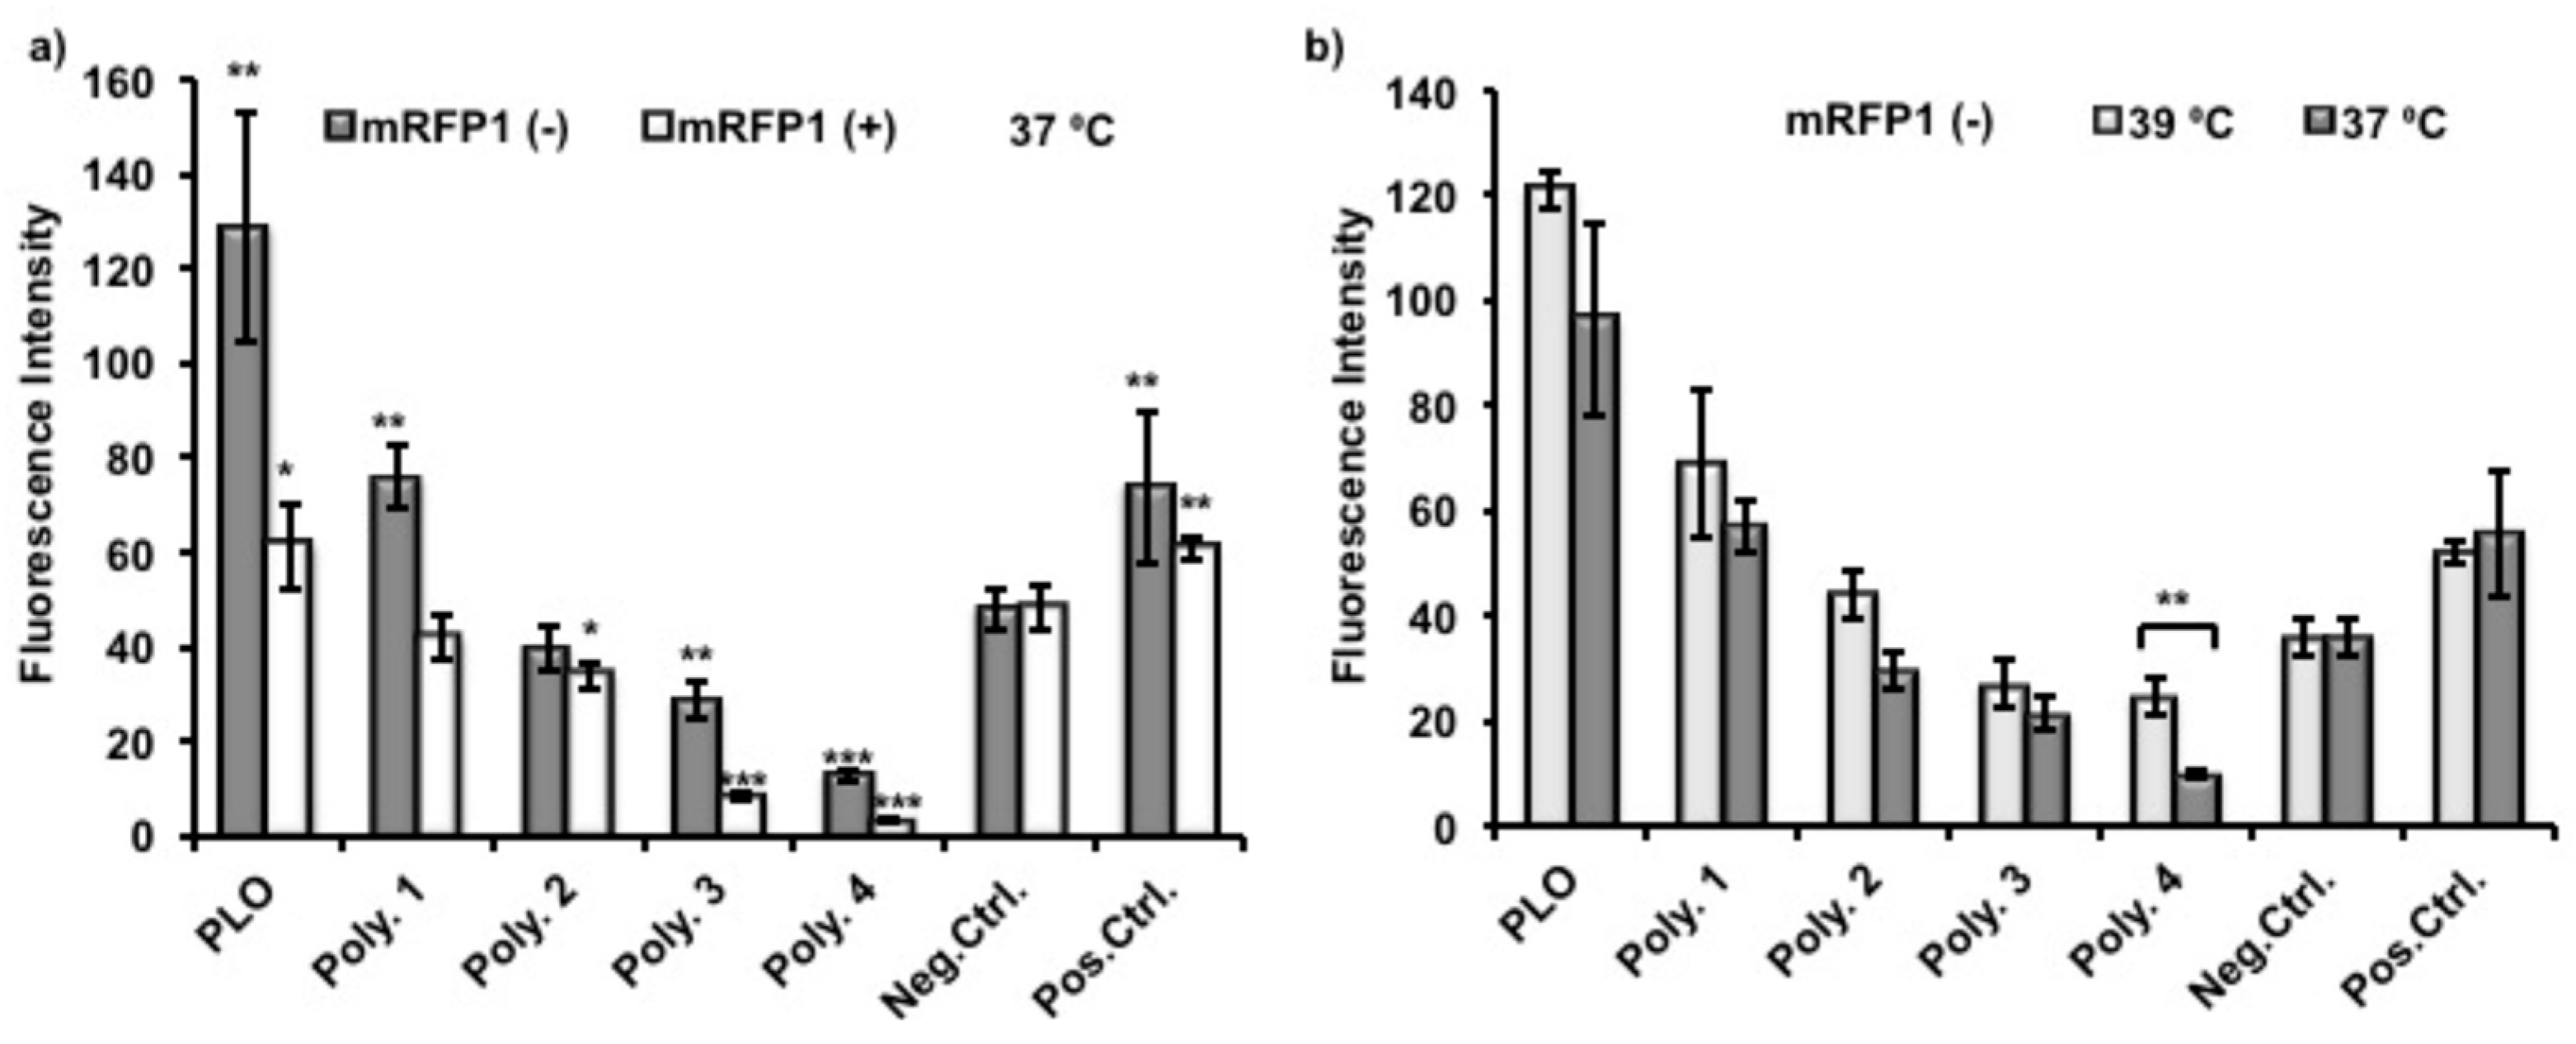
As shown in
Figure 6a, the fluorescence intensities from adsorbed protein were normalized and therefore giving the same readings of negative control between different experiments. Poly(
l-ornithine) (PLO)-coated surfaces showed the highest fluorescence intensities from adsorbed mRFP1, and therefore indicated significant enhancement of protein adhesion compared to uncoated nTCP (negative control). The fluorescence intensities from adsorbed mRFP1 with either charge on Polymer
1 coated surfaces were higher than those with Polymer
2 coatings which were higher than those coated with Polymer
3. These results suggest that the chemical modification, to some extent, conferred protein resistance to Polymers
1–
3 compared to unmodified PLO. The more hydrophobic polymers with fewer primary amines demonstrated reduced protein attachment. The fluorescence intensities of Polymer
3 and
4 coated surfaces were significantly lower than those of uncoated nTCP (negative control) and TCP (positive control), indicating detectable protein resistance capability. However, this effect was less significant on negatively charged mRFP1. In all cases, lower fluorescence intensities were observed from adsorbed positively charged mRFP1 than that from negatively charged mRFP1. We expected that the amino residues in the polymers were partially protonated at this experimental condition (pH 7.4), and the charge-to-charge repellence between coating polymers and positively charged protein would enhance the overall effect of protein resistance. The temperature response experiment was performed by using negatively charged mRFP1 at the two practical temperatures. Although the fluorescence intensities were apparently lower, meaning less proteins were adsorbed, when the temperature was decreased from 39 to 37 °C, only Polymer
4 showed significant differences in fluorescence (
Figure 6b).
Serum plays an important role in cell attachment as the adhesion proteins can be adsorbed onto appropriate plastic surfaces and facilitate attachment [
35]. To further understand the mechanism of the cell attachment on Polymer
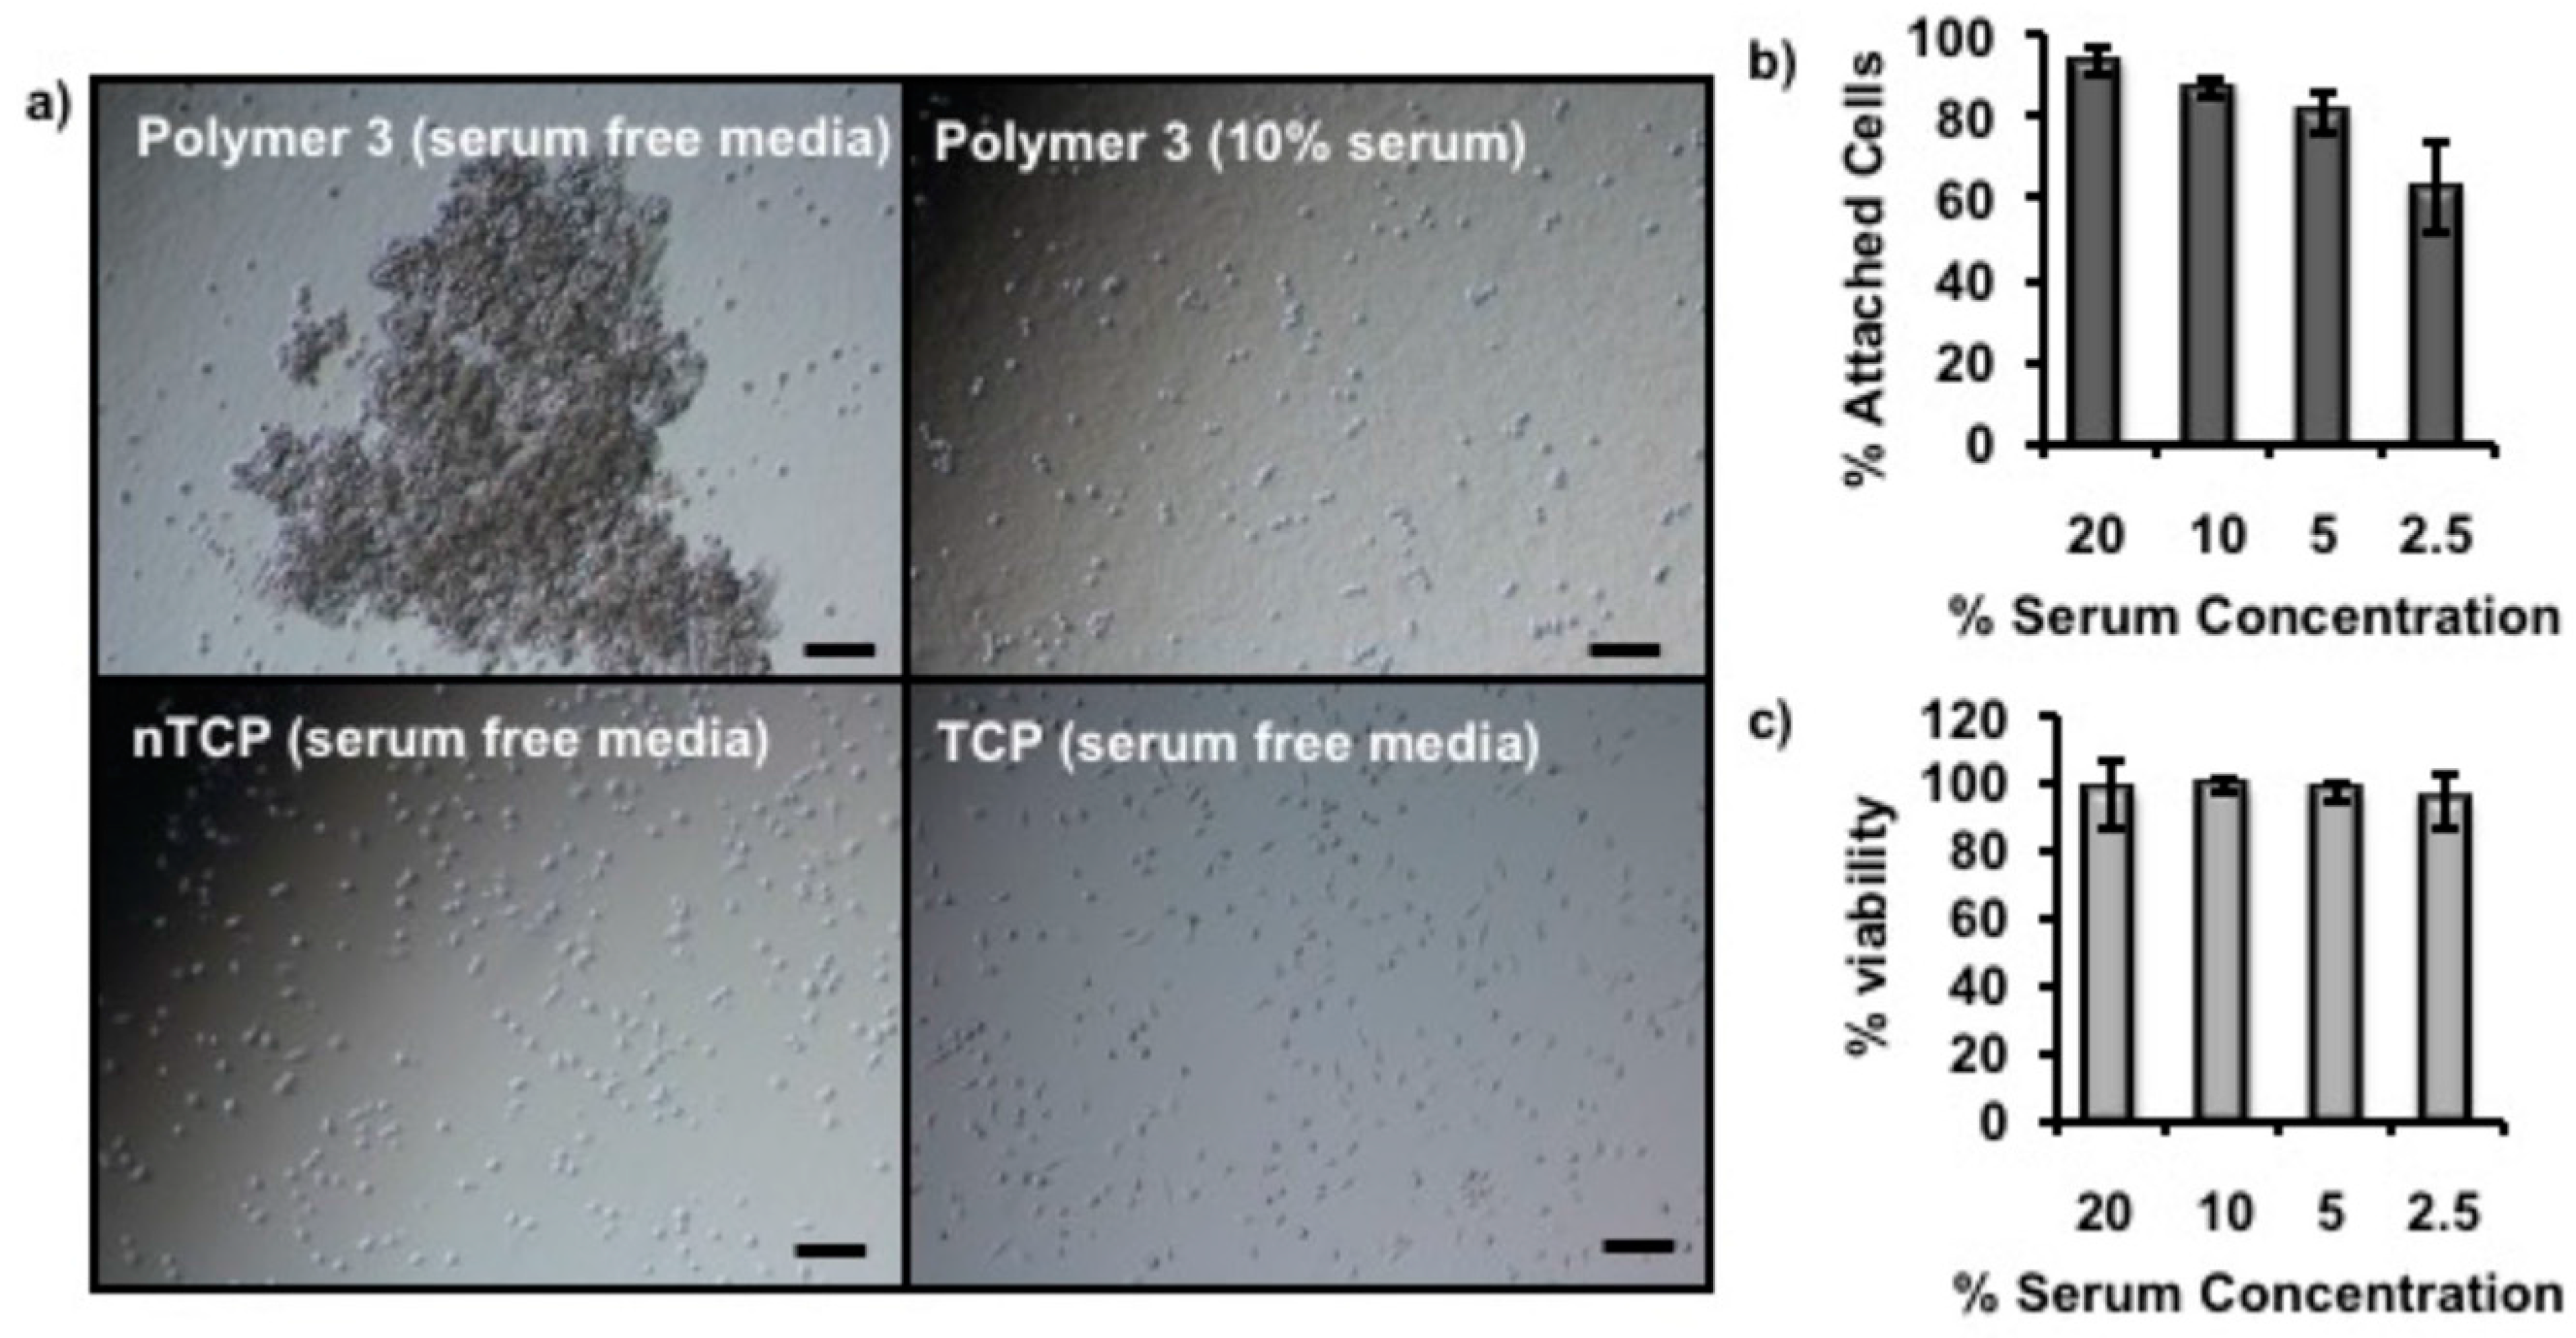
3 coated nTCP, a serum depletion experiment was carried out with 3T3 cells cultured at 39 °C for 5 h. The cell attaching time was shortened to be 5 h rather than 18 h in this experiment. This is because the cells may start to die in the absence of serum in the culture media for long incubation time. As shown in microscopy images in
Figure 7a, a large cell aggregate was observed on Polymer
3 coated nTCP with no serum in the media, while individual cell attachments were observed with 10% serum in the media on the same surface during this incubation time. Interestingly, more regular cell attachment was shown on both uncoated nTCP and TCP even in the absence of serum in the media as shown in
Figure 7a. Further experiments were performed with 3T3 cells in the same condition with different concentrations of serum in the media, the results of which are shown in
Figure 7b. These data indicate that the percentage of attached cells was reduced with diluted serum concentration in the media. In all cases, more than 94% of the cells were viable during this experiment (
Figure 7c).
We found overall that the cell attachment was serum concentration-dependent and considerable cell aggregation was observed in the absence of serum in the media. Therefore, we believe that serum adsorption to the polymer surfaces was important in the increase in 3T3 cell attachment. Although the results of protein adsorption experiments (
Figure 6) showed that fewer proteins were adsorbed on the Polymer
3 coated nTCP compared to the uncoated nTCP, there were still quantifiable proteins adsorbed on the coated surface, especially the negatively charged proteins which established electrostatic interaction with positively charged coating Polymer
3. A key example of such a protein is bovine serum albumin (BSA) which is a major component of fetal calf serum (FCS) and exhibits a net negative charge at physiological pH [
36]. Additionally, different types of proteins respond to the surface hydrophobicity differently as reported previously [
32], and thus we intend to test the adsorption behavior of more specific examples of proteins in future experiments. However, from the results presented so far, we believe that the rich variety of proteins in FCS is essential to successful cell attachment on the proposed coated surfaces.
4. Materials and Methods
4.1. Materials
Poly(l-ornithine) hydrobromide (Mw: ˃ 100,000), Poly(l-lysine) hydrobromide (Mw: 15,000–30,000), methoxypolyethylene glycol succinate N-hydroxysuccinimide (mPEG-NHS, Mw: 5000, 90%), N-succinimidyl N-methylcarbamate (97.0%), used as a safe methyl isocyanate substitute, and potassium cyanate (96%), sodium tetraborate (99%), imidazole buffer (1 M, pH 9–10), trifluoroacetic acid (TFA, 99%), phosphate buffered saline tablets and deuterium oxide (D2O; 99.9 atom% D) were purchased from Sigma Aldrich (Dorset, UK) and used as received. Solvents were obtained from Fisher Scientific (Loughborough, UK) and used as received. Deionized water was obtained from an Elga Pure Nanopore 18.2 MΩ water purification system (High Wycombe, UK). Aqueous HCl and NaOH solutions were used to adjust the solution pH as desired. Dialysis membrane with 1000 MWCO and 6000–8000 MWCO were purchased from Spectrumlabs (Rancho Dominguez, CA, USA).
Dulbecco’s modified Eagle media (DMEM), 10% fetal calf serum (FCS), 1% antibiotic/antimycotic solution and 1% l-glutamine (2 mM) were purchased from Sigma Aldrich (Dorset, UK). Presto blue cell viability reagent was obtained from Invitrogen (Hemel Hempstead, UK). Trypan blue solution (0.4%, prepared in 0.81% sodium chloride and 0.06% potassium phosphate, dibasic) was purchased from Sigma Aldrich (Dorset, UK). CyQUANT™ NF cell proliferation assay kit (Invitrogen) was purchased from Fisher Scientific (Loughborough, UK). Monomeric red fluorescent protein1 (mRFP1) with either negative (pI: 5.65, Mw: 25.4 kDa) or positive (pI: 9.66, Mw: 29.4 kDa) charges at physiological pH were kindly provided by Dr. James Dixon from the same group. Pierce quantitative colorimetric peptide assay kit was purchased from ThermoFisher Scientific (Hemel Hempstead, UK).
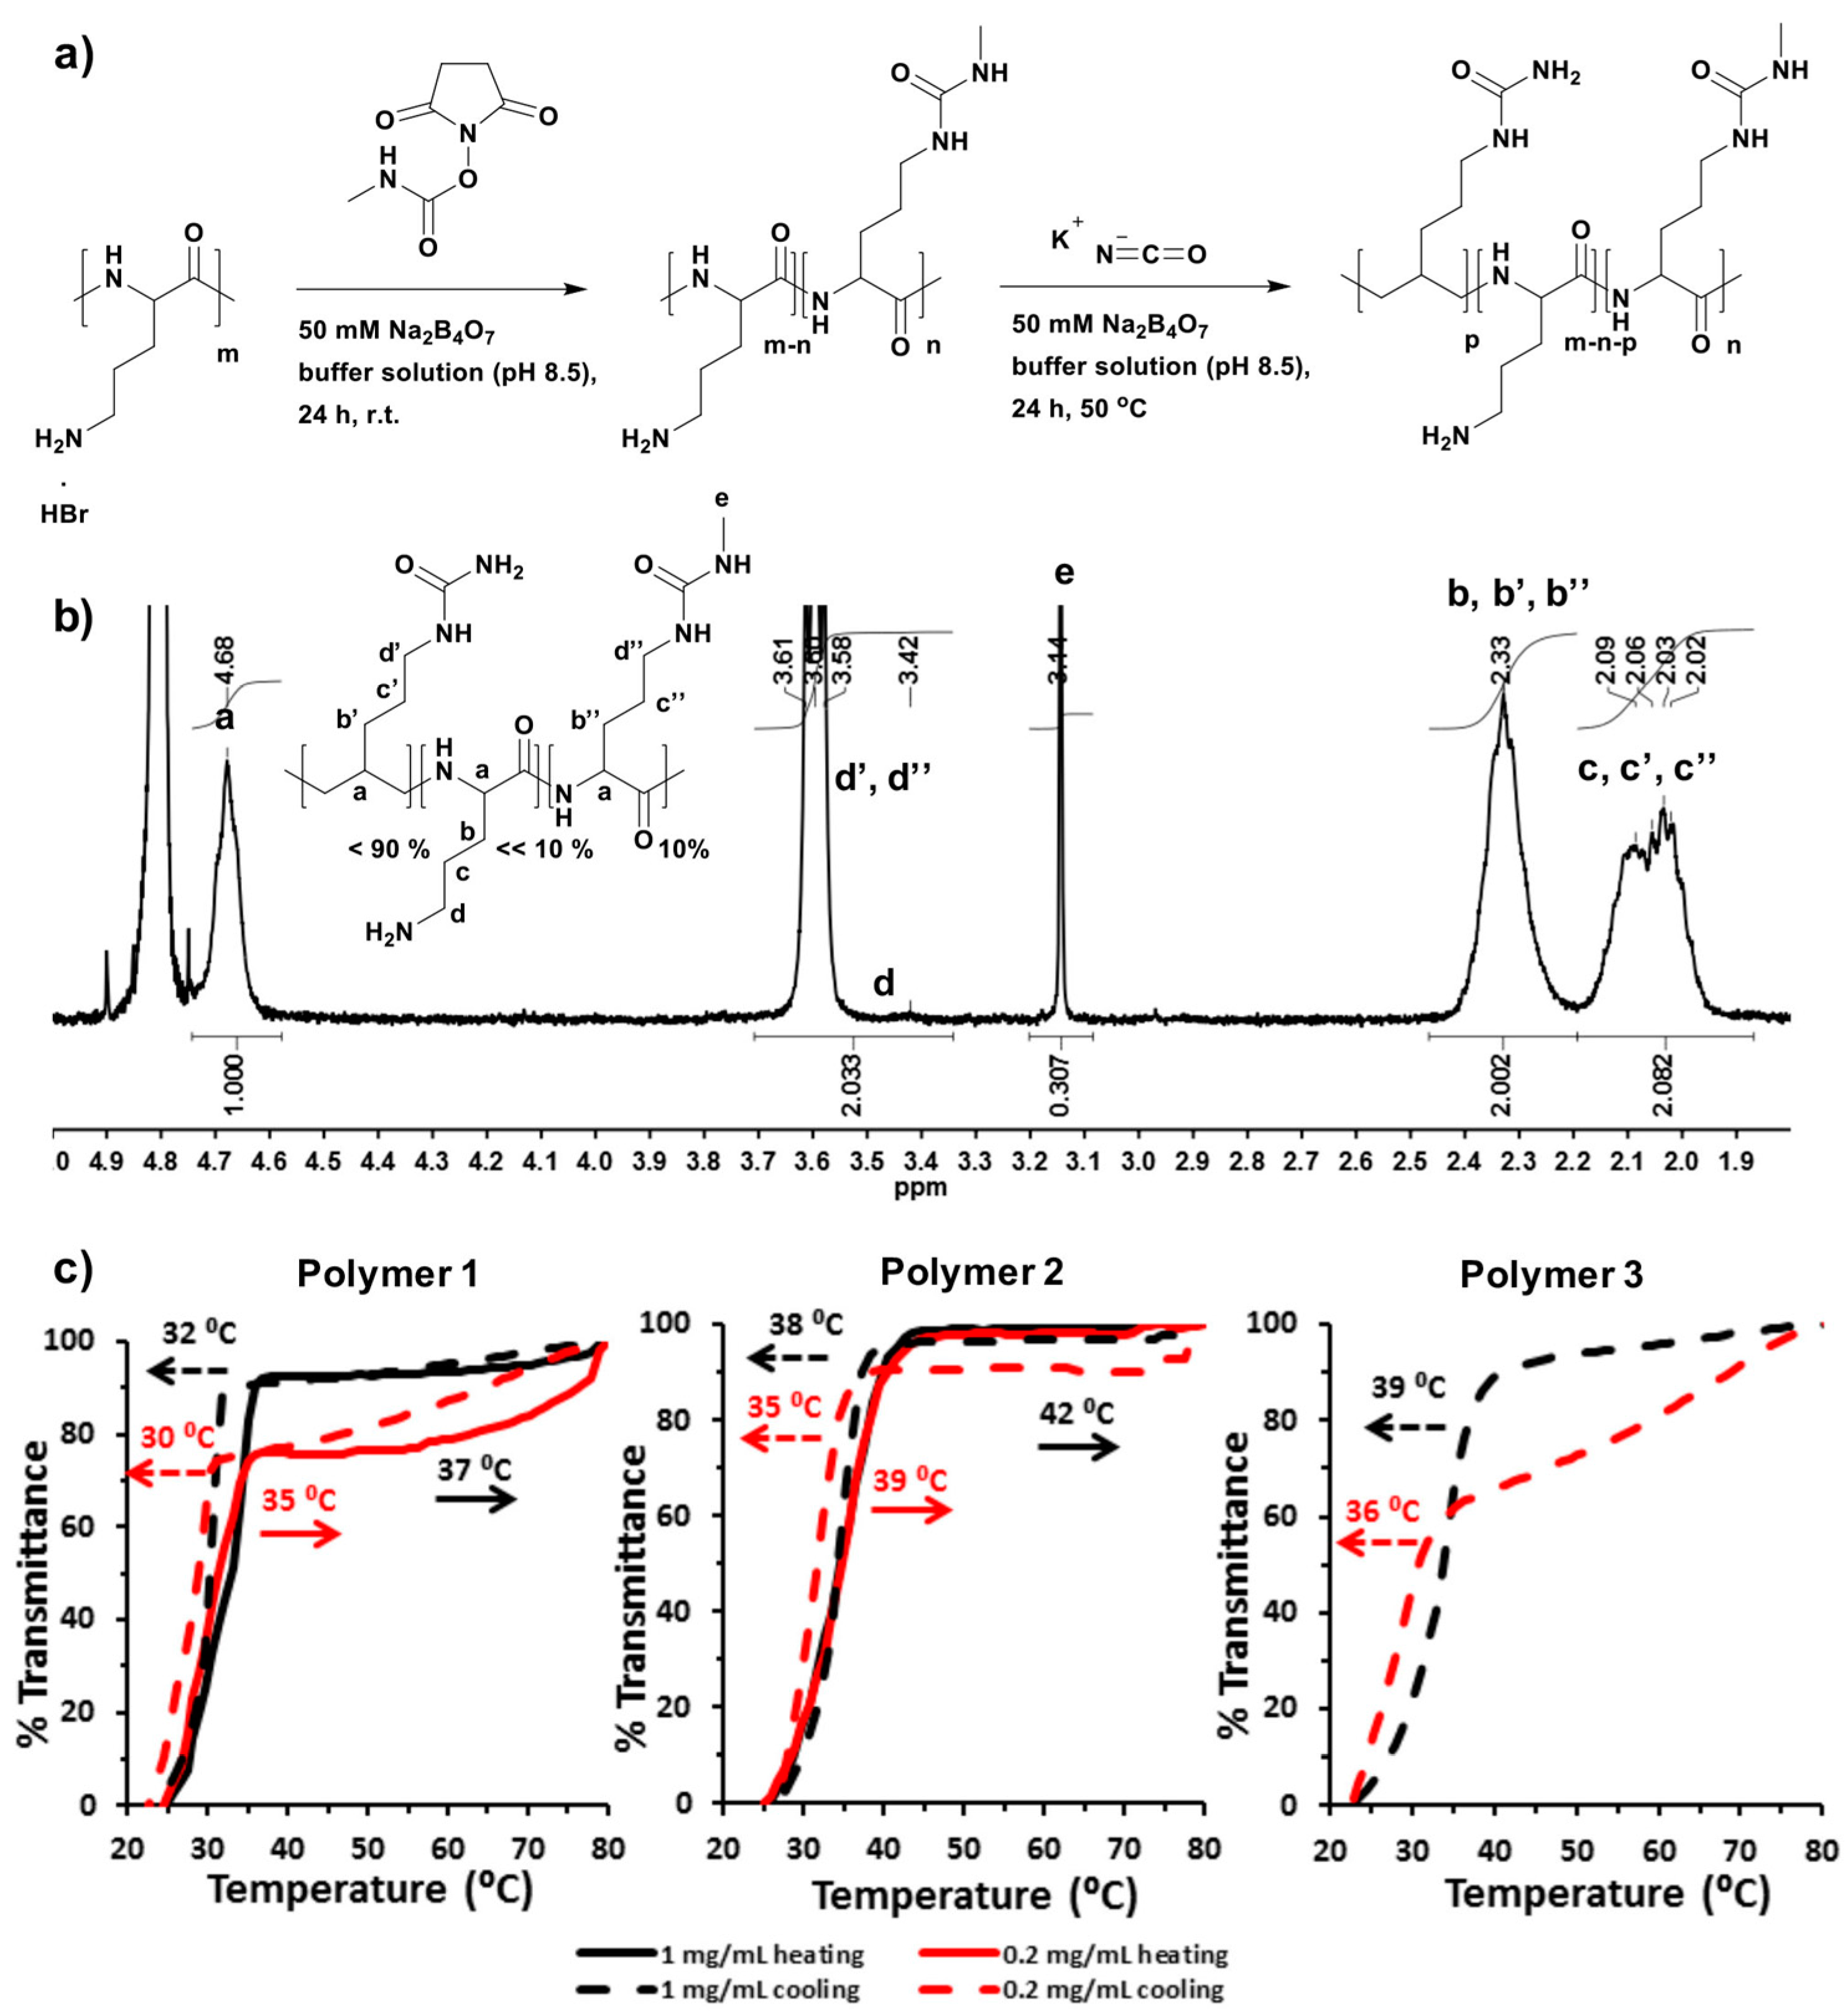
4.2. Synthesis of Poly(l-ornithine)-co-poly(l-citrulline)(POC)—Polymer 1
Poly(
l-ornithine) hydrobromide (
Mw: ˃ 100,000, 84.0 mg, 0.43 mmol of
l-ornithine) and potassium cyanate (43.7 mg, 0.52 mmol) was weighed in a glass vial, and dissolved in imidazole buffer solution (1 M, pH 7.0, 4 mL). The reaction was started by placing the sealed glass vial an oil bath at 50 °C and then kept stirring for 24 h. The reaction was stopped by cooling down to room temperature. The crude product was purified by dialysis against deionized H
2O (0.1% trifluoroacetic acid, TFA) with 1000 MWCO dialysis membrane for 2 days. Then, water was removed by freeze-drying. The product was stored at −80 °C [
26].
4.3. Synthesis of Methyl Isocyanate Modified Poly(l-ornithine)-co-Poly(l-citrulline) (Methyl Isocyanate Modified POC)—Polymer 2 and 3
Typically, poly(l-ornithine) hydrobromide (Mw: ˃ 100,000, 84.0 mg, 0.43 mmol of l-ornithine) and N-succinimidyl N-methylcarbamate (7.6 mg, 0.043 mmol) was weighed in a glass vial, and dissolved in sodium tetraborate buffer solution (50 mM, pH 8.5, 4 mL) with continuous stirring at room temperature for 24 h. Potassium cyanate (43.7 mg, 0.52 mmol) was then added in the reaction solution. The sealed glass vial was placed in an oil bath at 50 °C and kept stirring for another 24 h. The reaction was stopped by cooling down to room temperature. The crude product was purified by dialysis against deionized H2O (0.1% trifluoroacetic acid, TFA) with 6000–8000 MWCO dialysis membrane for 2 days. Then, water was removed by freeze-drying. The product was stored at −80 °C.
4.4. Synthesis of PEG Grafted Poly(l-lysine) (PEG-g-PLL)—Polymer 4
Poly(
l-lysine) hydrobromide (
Mw: 20,000, 21.0 mg, 0.10 mmol of
l-lysine) and methoxypolyethylene glycol succinate N-hydroxysuccinimide (mPEG-NHS,
Mw: 5000, 55.8 mg, 0.01 mmol) was weighed in a glass vial, and dissolved in sodium tetraborate buffer solution (50 mM, pH 8.5, 1 mL) with continuously stirring at room temperature for 6 h. The reaction was stopped by adding a large volume of deionized H
2O, and purified by dialysis against deionized H
2O with 6000–8000 MWCO dialysis membrane for 2 days. Then, water was removed by freeze-drying. The product was stored at −80 °C [
27].
4.5. Nuclear Magnetic Resonance (NMR) Spectroscopy
1H-NMR and 13C-Heteronuclear Single Quantum Correlation (13C-HSQC) spectroscopies were recorded with an average of 64 scans per spectrum at 70 °C in D2O using a Bruker AV400 spectrometer (Coventry, UK) fitted with a 5 mm auto-tunable broad-band (BBFO) probe. Spectra were analyzed with MestReNova 6.2 software (Mestrelab, Santiago de Compostela, Spain). Chemical shifts were recorded in ppm (δ).
4.6. Cloud Point Measurements by Ultraviolet-Visible (UV-Vis) Spectroscopy
Polymers were dissolved in PBS (100 mM, pH 7.4) to give a concentration of either 1 mg/mL or 0.2 mg/mL. For the UCST type thermal responsive polymers, heating was applied to dissolve the polymers. The solution was transferred into the cells immediately. Absorbance at 500 nm of the polymer solutions in a 10 mm quartz cell were recorded on Shimadzu UV-1650PC UV-visible spectrophotometer (Milton Keynes, UK) equipped with a Peltier temperature controller (Southampton, UK) at scanning rate of 1 °C/min either from 20 °C to 80 °C or reversely from 80 °C to 20 °C.
4.7. Preparation of Thermal Responsive Polypeptides Coated Non-Tissue Culture Plates
Polymers (1 mg/mL) in deionized H2O were ultra-sonicated at 70 °C for 15 min to give transparent solutions. Warm polymer solutions were sterilized by filtering through 0.22 µm membranes, and then transferred into 24-well non-tissue culture plate (300 µL for each well) immediately. The plate was then incubated at 39 °C overnight. The solutions were then removed. The coated wells were rinsed with PBS buffer once, and dried in the fume hood before use.
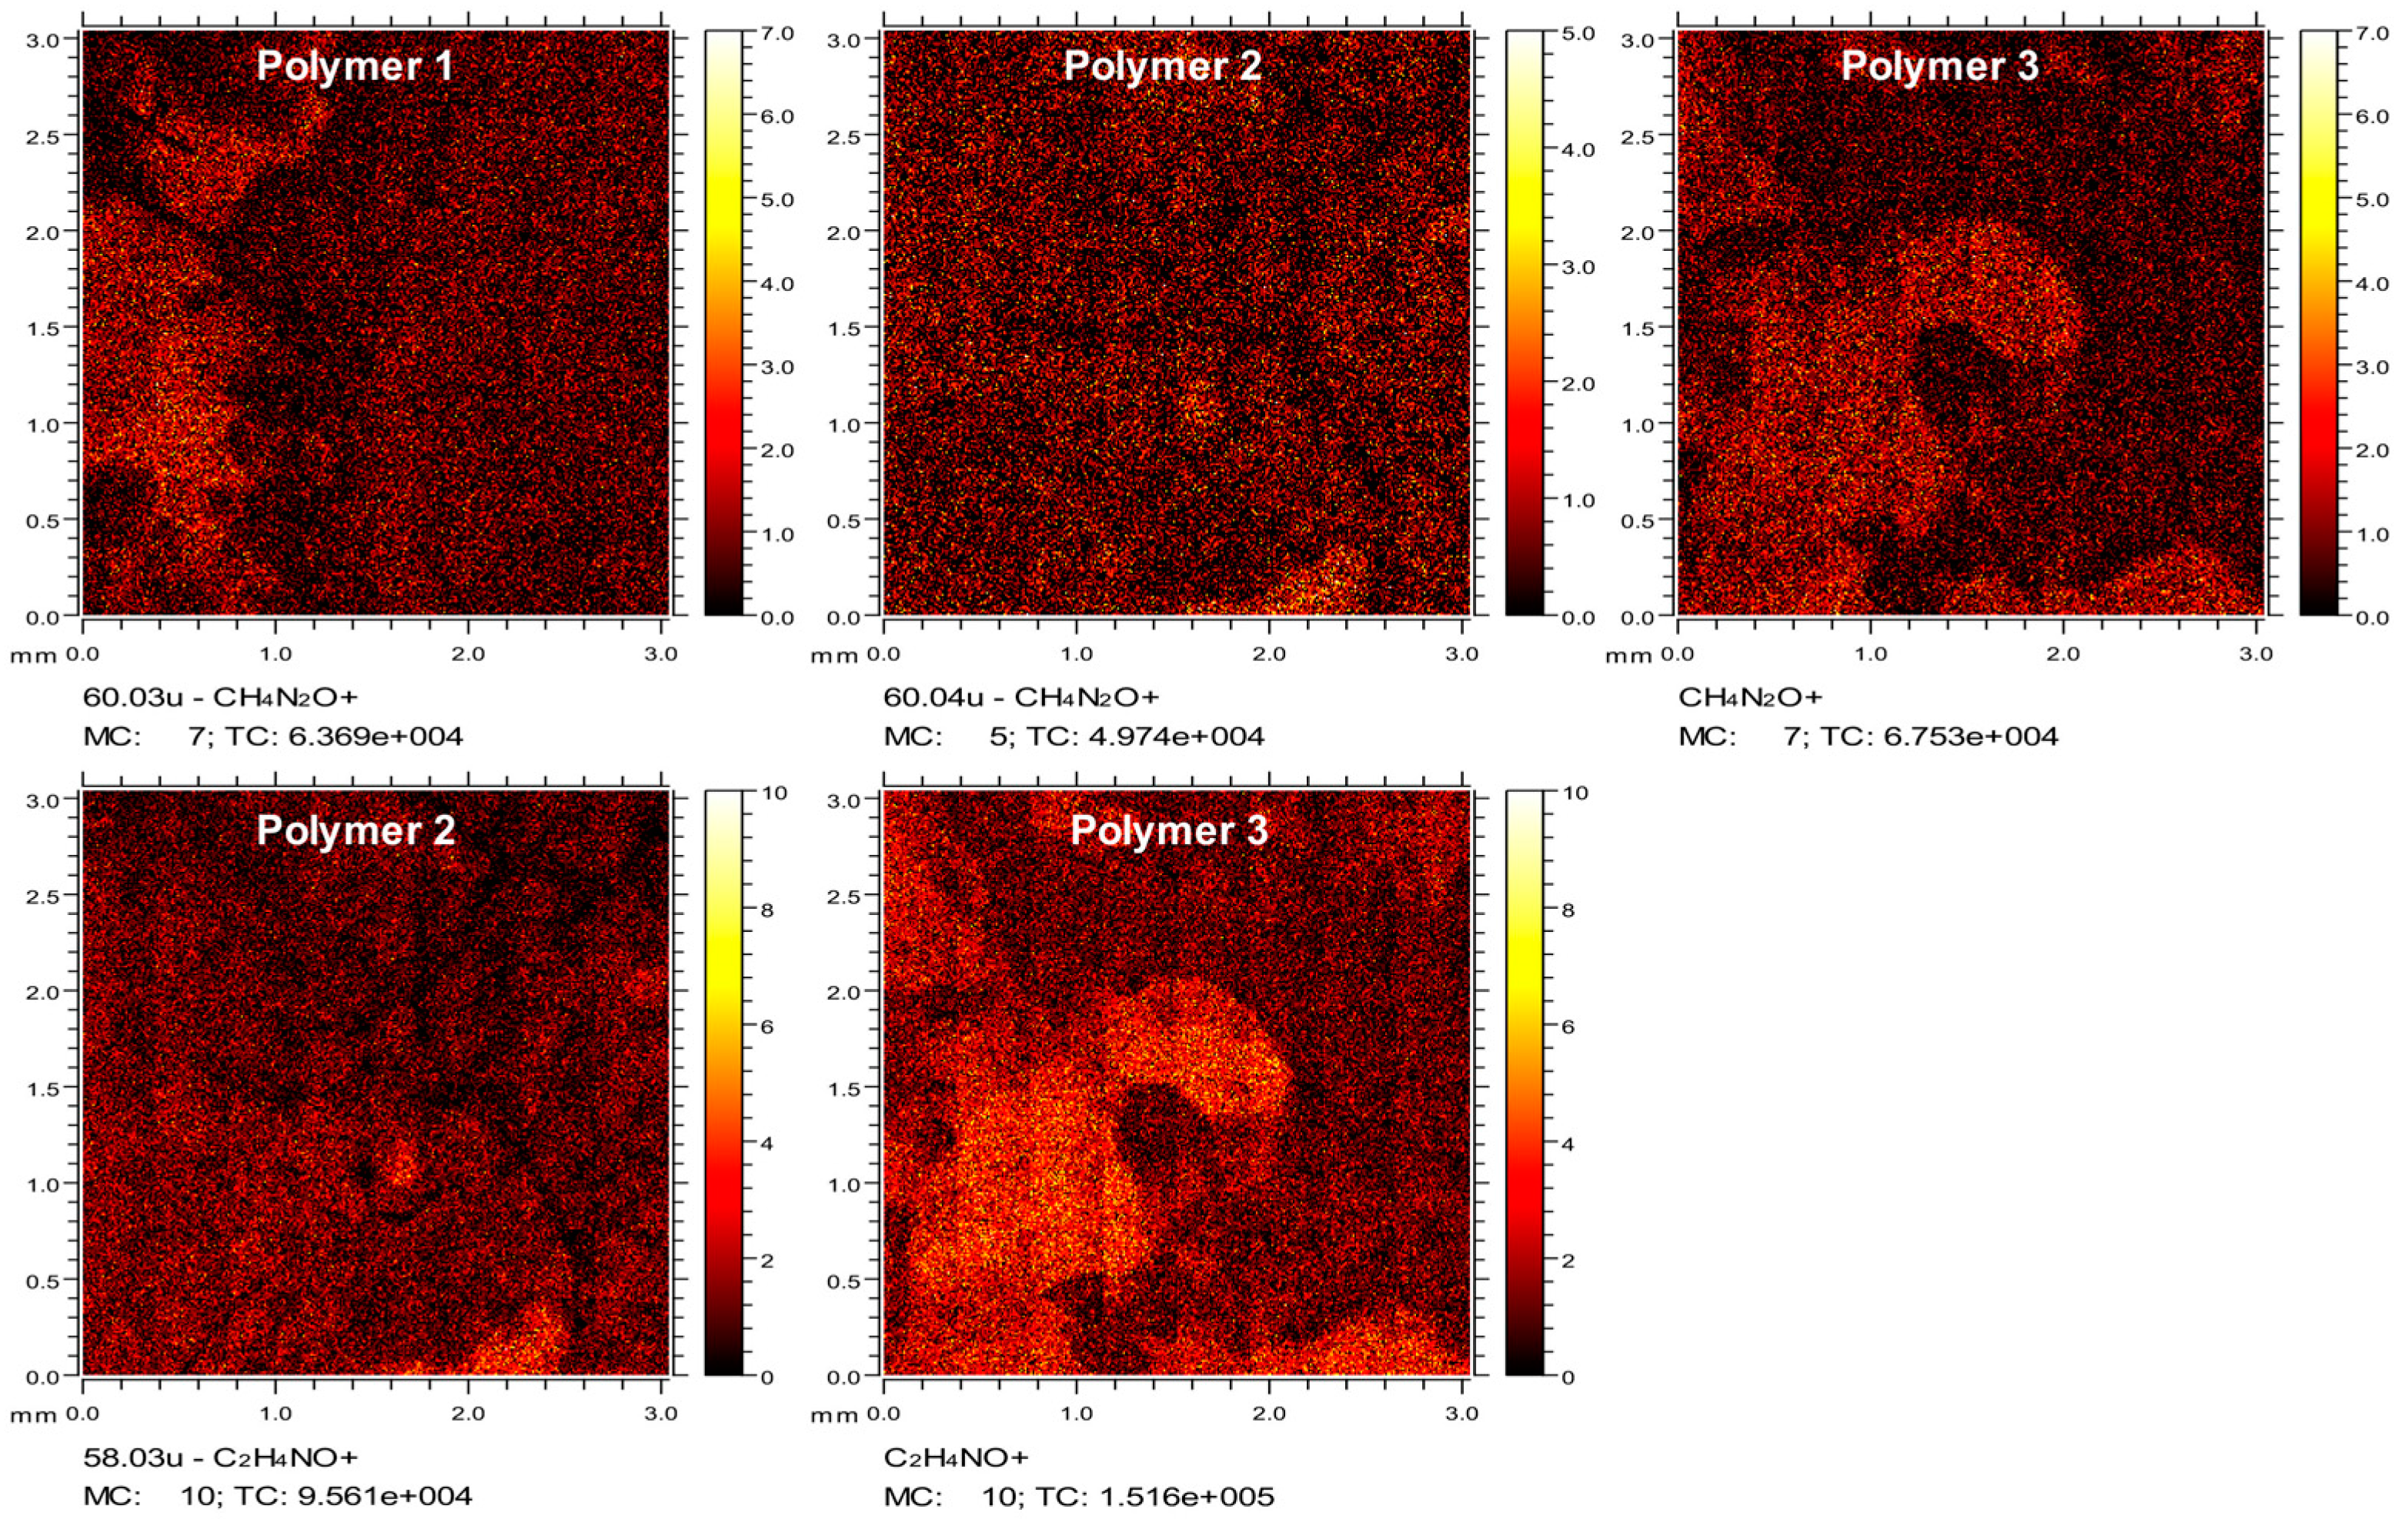
4.8. Time of Flight Secondary Ion Mass Spectrometry (ToF-SIMS)
ToF-SIMS data were collected using a ToF-SIMS IV instrument (ION-TOF GmbH., Münster, Germany) equipped with a bismuth liquid metal ion gun and a single-stage reflectron analyzer. Bi3+ primary ion energy of 25 kV and a pulsed target current of approximately 1.3 pA were used in this measurement. Low-energy electrons (20 eV) were used to compensate for surface charging due to the positively charged primary ion beam on the insulating surfaces. Rastered areas of 3 × 3 mm2 were analyzed at a resolution of 100 pixels per mm and 15 frames per patch. The total primary ion beam dose for each analyzed area was kept below 1 × 10¹² ions per cm2, ensuring static conditions. Data acquisition and analysis were performed using IONTOF SurfaceLab6 software (IONTOF, Munster, Germany).
4.9. Cell Adhesion for Screening Coating Polymers
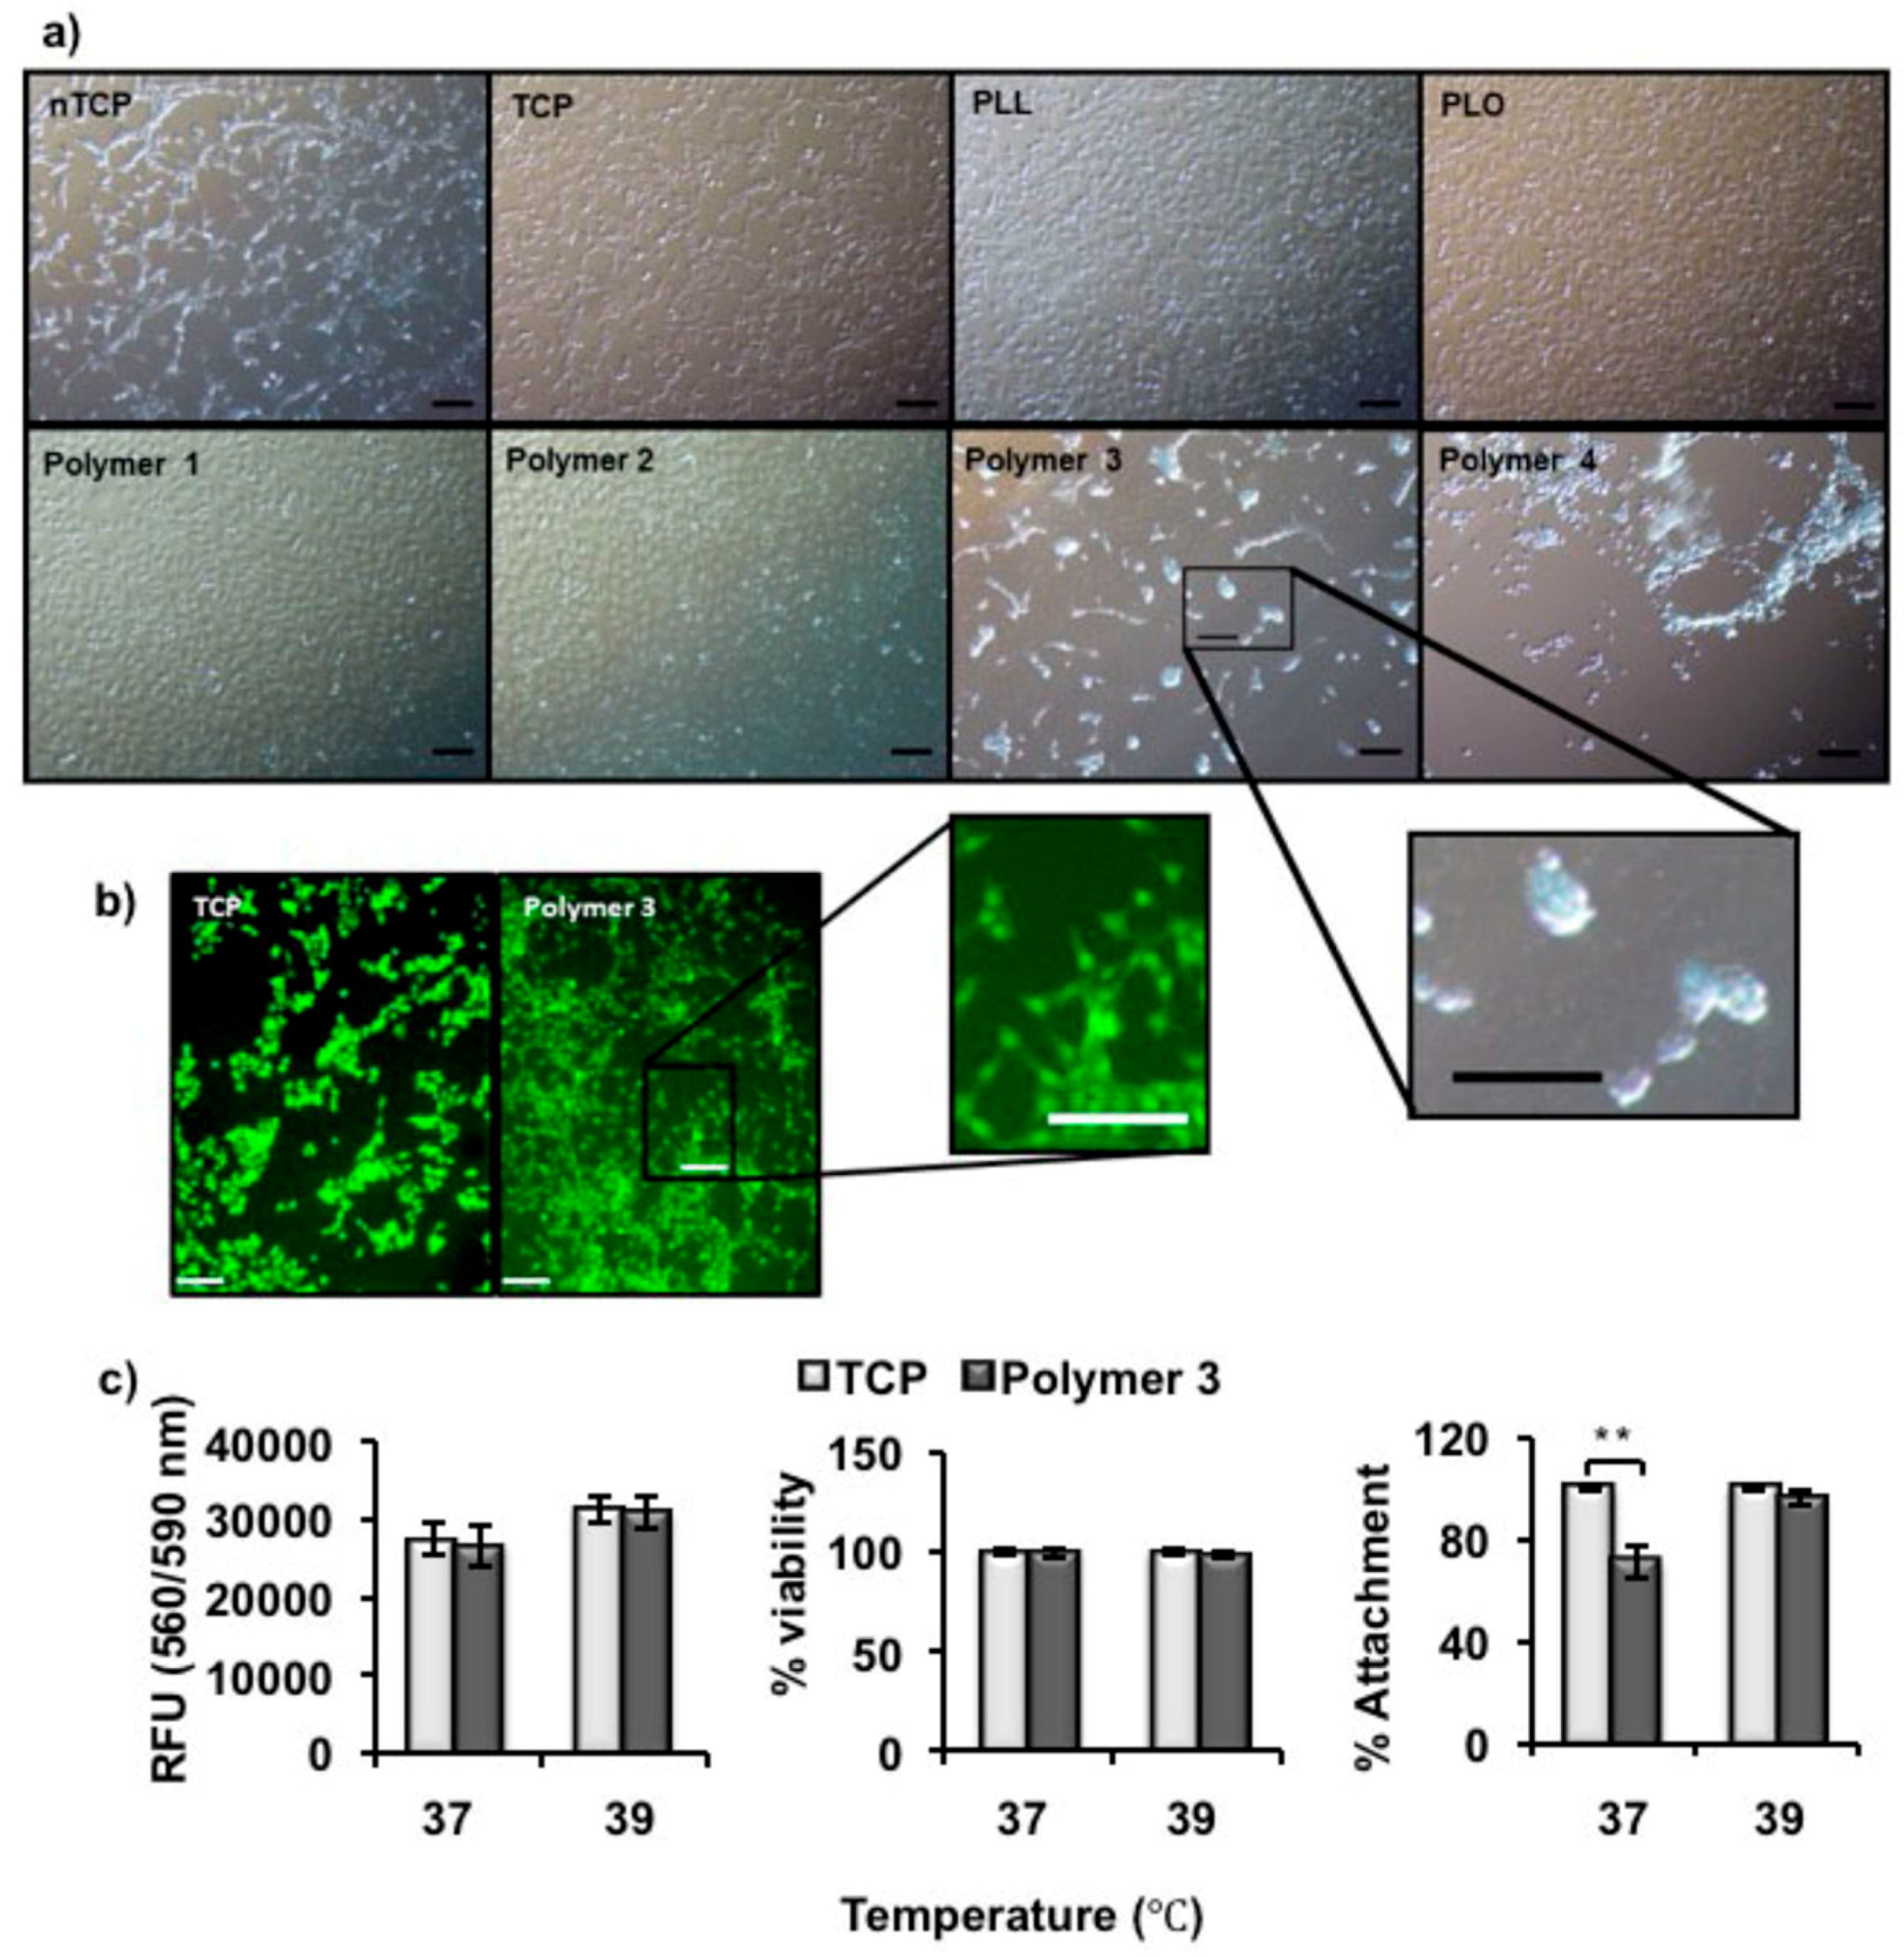
NIH-3T3 fibroblast cells were grown in DMEM with 10% FCS, 1% antibiotic/antimycotic solution and 1% l-glutamine (2 mM). Tissue culture-treated plates, non-tissue culture-treated plates, and either poly(l-lysine) or poly(l-ornithine) coated wells were used as controls. 3T3 cells were added (1 × 10⁵ cells per well), and incubated at 37 °C overnight to allow cells to attach. Microscope images were taken after incubation for 24 h. Alexa Fluor 488 Phalloidin (ThermoFisher Scientific, UK) that binds intracellular F-actin, was used to visualize the attached cells, and the microscope images were recorded again. After cell attachment in the polymer coated plates, Live/Dead® Viability/Cytotoxity kit (Invitrogen) was used to differentiate live cells which take up the green fluorescent Calcein AM and dead cells which take up Ethidium homodimer-1. The cells were treated with the stain at 39 °C for 15 min and imaged using fluorescence microscope. The culture temperature was changed to 37 °C and the Live/Dead stained cells were imaged after 2 h.
4.10. In Vitro Cell Release Studies
3T3 cells were seeded (1 × 10
5 cells per well) into Polymer 3 coated non-tissue culture treated 24-well plates with 500 µL of cell culture media in each well, and incubated at 39 °C overnight (16 h) to allow cells to attach. The unattached cells along with the cell culture media were removed from the wells. The wells were then refilled with the same volume (500 µL) of fresh cell culture media and incubated at 37 °C (cell release triggered). The metabolic activity of attached cells was measured by using Presto blue assay at every time point. The cell numbers were inferred from the standard curve experiment with cell numbers and fluorescence readings. The released cells in the supernatant was quantified by using CyQUANT™ (ThermoFisher Scientific, UK) NF cell proliferation assay kit Invitrogen, and the viability was tested by using Trypan blue assay. The cells that were released in to the supernatant were centrifuged, trypsinized and counted using Trypan blue in one set of experiments. The cells were treated with CyQUANT as described in the manufacturer’s protocol and the fluorescence intensity was measured in a microplate reader with excitation 485 nm and emission detection at 530 nm. The released cell numbers were determined using a standard curve by plotting the fluorescence unit against different cell numbers. The experimental design of the release study is given as a schematic in
Figure S9. These steps were repeated at determined time points (e.g., 2 h, 4 h, 6 h, 12 h and 24 h) until no more cells were released into the supernatant.
4.11. Contact Angle (CA) Measurement
Static water contact angle measurements were made on each polymer coated surface using a CAM 200 Optical Contact Angle Meter (KSV Instruments Ltd., Helsinki, Finland). This instrument was fitted with a thermostated mental cell, connected to a refrigerated/heated bath circulator (Fisherbrand, UK) to maintain the temperature of the sample.
4.12. Quantification of Polymers Adsorbed on nTCP
Polymer 3 was coated on three non-tissue culture treated 24-well plates as described above. In one plate, the amount of coated Polymer c on each well was quantified by using a Pierce quantitative colorimetric peptide assay kit. The other two plates were then incubated with freshly added deionized H2O (500 µL per well) for 6 h at 37 °C and 39 °C, respectively. The remaining amount of Polymer c on each well in these two plates was then quantified.
4.13. Adsorption of Proteins to Polymer Coated Surfaces
The method to prepare red fluorescent mRFP1 protein was adapted from Campbell et al. [
34]. To determine the protein adsorption to surfaces, mRFP1 was diluted to 200 μg/mL with PBS buffer (100 nM, pH 7.4). This protein solution was added to the polymer-coated 24-well plates (300 μL per well). The plates were then incubated at 39 °C, 37 °C or room temperature for 24 h. The wells were rinsed with PBS buffer (300 μL) twice and then deionized water (300 μL) once. The adsorption of mRFP1 on surfaces was quantified by the reading of fluorescent intensity (excitation wavelength 584 nm, emission wavelength 620 nm) on a Tecan (Theale, UK) plate reader (infinite M200).
4.14. Serum Depletion Experiment
3T3 cells were seeded (1 × 10⁵ cells per well) into Polymer 3-coated non-tissue culture treated 24-well plates with 500 µL of cell culture media (containing 20%, 10%, 5%, 2.5% and 0%, v/v FCS, respectively) in each well, and incubated at 39 °C for 5 h. Microscope images were then taken. The number and viability of the cells in the supernatant was then counted using a Haemocytometer combined with Trypan blue assays.
4.15. Statistical Analysis
Statistical comparisons were carried out using GraphPad Prism (6.01, GraphPad Software, Inc. San Diego, CA, USA). The statistical significance was determined using a one-way analysis of variance (ANOVA) followed by Dunnet’s test for viability and cell release experiments; Student’s t test was carried out for protein adsorption experiments. Results were considered significant at p < 0.05.

 ,
, 


