Article

EMD-Based Feature Extraction for Power Quality Disturbance Classification Using Moments

by
Misael Lopez-Ramirez
1,
Luis Ledesma-Carrillo
1,
Eduardo Cabal-Yepez
1,
Carlos Rodriguez-Donate
1,*,
Homero Miranda-Vidales
2 and
Arturo Garcia-Perez
1
1
Division de Ingenierias, Campus Irapuato-Salamanca, Universidad de Guanajuato/Carr. Salamanca-Valle km 3.5+1.8, Comunidad de Palo Blanco, Salamanca 36700, Guanajuato, Mexico
2
Facultad de Ingenieria, Universidad Autonoma de San Luis Potosi, Av. Manuel Nava 8, Zona Universitaria, San Luis Potosi 78290, Mexico
*
Author to whom correspondence should be addressed.
Energies 2016, 9(7), 565; https://doi.org/10.3390/en9070565
Submission received: 30 May 2016 / Revised: 4 July 2016 / Accepted: 12 July 2016 / Published: 20 July 2016

Abstract

:
In electric power systems, there are always power quality disturbances (PQDs). Usually, noise contamination interferes with their detection and classification. Common methods perform frequency or time-frequency analyses on the power distribution signal for detecting and classifying a limited number of PQDs with some difficulties at low signal-to-noise ratio (SNR). In this regard, recently proposed methodologies for PQD detection estimate several parameters and apply distinct signal processing techniques to improve the detection of PQD. In this work, a novel methodology that merges empirical mode decomposition (EMD), the moments of a random variable, and an artificial neural network (ANN) is proposed for detecting and classifying different PQD. The proposed method estimates skewness, kurtosis, and Shannon entropy from the EMD of one-phase voltage/current signal. Then, an ANN is in charge of classifying the input signal into one of nine different classes for PQD, receiving these parameters as inputs. The effectiveness of the proposed method was verified through computer simulations and experimentation with real data. Obtained results demonstrate its high effectiveness reaching an outstanding 100% of accuracy in detecting and classifying all treated PQD through a few number of parameters, outperforming most of previously proposed approaches.

1. Introduction

Actual electric power distribution systems have abundant contents of disturbances of the supplied signal. These disturbances are induced by the continuous increment of non-linear loads; furthermore, power distribution systems can be affected by environmental conditions too [1]. Electric power disturbances produce malfunctioning of machinery and appliances with a consequent reduction of their lifetime. Standard regulations for quality control and reliability on the supplied electric signal are called power quality (PQ), and they are defined by various standards such as IEEE 1159-2009 [2], IEC 61000 [3] and EN 50160 [4]. The most common electrical disturbances causing low PQ are interruptions, wave faults, voltage sag/swell, and harmonic distortion [3]. Electric supply networks require full attention and complex planning for maintaining an adequate PQ, and avoiding intensive operations induced by disturbances [5]. Each kind of disturbance can be generated by different conditions or defects in the electric network; for example, the source of voltage sags might be a short circuit, a motor starting-up, a transformer energizing, or reacceleration of a motor. Voltage sag phenomena in light sources has been an issue since the beginning of power distribution systems, and the problem grew rapidly because of the increase on the number of customers and power installations. For these reasons, it is necessary to detect and classify power quality disturbances (PQDs) to perform timely corrections and increase PQ in electric distribution systems.
The common method for PQD detection is to perform a frequency spectrum analysis on the power distribution signal [6,7,8,9,10,11], however, this method does not provide information on frequency distribution through time. On the other hand, there are few methodologies that consider time-frequency analysis allowing the detection and classification of two or more PQD [12,13,14,15,16,17,18,19,20,21,22]. For instance, in [23], a research on voltage fluctuation and flicker measurement based on fast Fourier transform (FFT), is proposed. The approach implements a LabWindows/CVI virtual instrument utilizing C language programming for voltage measurement. In [24], a technique for the extraction of fundamental and harmonic components in voltage/current signals using FFT and STFT is proposed. The approach plots the spectrum of the distorted signal utilizing MATLAB and classifies the disturbance as odd or even harmonic contamination. In [25], the event detection performance of spectral kurtosis is introduced as a signal-separating tool in the frequency domain utilizing FFT. In [19], a pattern recognition approach for current differential relaying of power transmission lines is proposed. This method uses energy-spectrum information obtained by a fast discrete S-transform for current differential protection on a transmission line fed from both ends. In [20], a method based on the combination of binary classifiers and wavelet transform is proposed for PQD classification. The methodology is able to classify voltage sags/swells, harmonic distortions and interruptions. In [26], a sag/swell detection algorithm is proposed based on WT. The algorithm is the hybrid combination of Daubechies wavelets of order 2 and order 8. An approach based on the combination of WT, covariance, linear Kalman filter, voltage signal features, and a fuzzy expert system is proposed in [22] for identifying and classifying interruptions, sags, and swells. Most of the approaches in the reviewed literature apply combined analyses to detect PQD utilizing different techniques. For instance, in [27], a voltage waveform segmentation algorithm is proposed for sag detection. The algorithm uses the strength of the tensor concept for voltage signals, to generate a pattern of deformation in three-phase systems. A modification of the Kalman filter is proposed for adjusting the system to sudden changes. In [28], an intelligent method that integrates discrete wavelet transform and hyperbolic S-transform for automatic detection of sags, swells, interruptions, harmonics, transients, and flickers is presented. The approach uses orthogonal forward selection by incorporating the Gram Schmidt procedure for extracting the best subset features, which are fed to different classifiers based on particle swarm optimization; then, obtained results are empirically compared. In [29], a technique based on local non-linear relation and non-linear fuzzy functions is proposed to classify transient, sag, swell and harmonics. Non-linear Gaussian functions extract any change in the patterns of PQ events. The kinetic energy is found from fuzzy lattices expressed in the form of Schrödinger equation. The kinetic energy value embedded in a two-dimension space is used to distinguish PQ events. In [30], a PQ prediction approach for the common coupling points between wind farms and the network is proposed. To obtain PQ data a trend analysis model is established, which incorporates a distance-based cluster analysis, probability distribution analysis based on polynomial fitting, pattern matching based on similarity, and Monte Carlo random sampling.
On the other hand, empirical mode decomposition (EMD) method was designed to decompose signals into components referred to as intrinsic mode functions (IMF) for studying and analyzing their instantaneous frequencies and amplitudes. Among the main advantages of EMD are the extraction of a reduced number of components in comparison to other techniques and its application to linear and nonlinear signals [31]; hence several works have exploit the EMD features for PQD detection and classification [5,32,33]. For instance, in [34], the merits of EMD technique are explored for PQD classification using S-transform and support vector machines SVM. Various indices such as energy, the spread of the instantaneous temporal energy density and deviation of the instantaneous temporal energy density are computed in order to identify a healthy condition and a line-to-ground or line to line to line faults. In [35], power system faults classification using EMD and support vector machines is proposed. EMD is used for decomposing voltages of transmission line into IMF. Hilbert Huang transform is used for extracting characteristic features from IMFs. A multiple SVM model classifies the short circuit fault condition as single line to ground, line to line, and three phase faults. In [36], EMD is applied for extracting features from non-linear, non-stationary, non-periodic electrical signals which along with the degree of coherence, the time-correlation and the periodicity from the original electric signal are able to characterize smart grids in the presence of strongly nonlinear loads and intermittent ones. In [37], two EMD-based de-noising techniques are applied for PQ assessment. These de-noised signals are then subjected to Hilbert transform for feature extraction. Fuzzy product aggregation reasoning rule-based intelligent classifier is used for classification of sag, swell, harmonic, flicker, notch, spike, and transient faults. From the stated above, it is clear that recently proposed methodologies for PQD detection compute several parameters, which are processed through various techniques to detect from two to six PQD. However, it is clear that new PQ monitoring techniques are required to safely obtain useful and accurate data for understanding how PQ phenomena affects the power system and end-user equipment [2,38].
PQD detection and classification is an open research subject, where few new methods that select the most suitable features for PQD detection and classification have been proposed [32]. Hence, in this paper, a novel methodology for detecting and classifying PQD through minimum parameter estimation is proposed. Different from recently introduced methodologies in reviewed literature where PQD are detected by extracting several characteristics from the analyzed signal, which are processed by the combination of diverse techniques [39,40,41]. The introduced approach takes advantage of the EMD merits by extracting a reduced number of components from voltage/current signal to obtain the IMF, from which Entropy and the third and fourth central moments (i.e., kurtosis, and skewness) are obtained as classification parameters. An artificial neural network (ANN) is in charge of identifying different disturbances through the analysis of these statistical parameters. Results obtained by applying the proposed methodology on acquired data from computer models and real experimentations, demonstrate the high efficiency of the proposed approach, reaching an accuracy of 100% on detecting and classifying all treated PQD from voltage/current signals in the power supply network.

2. Theoretical Background

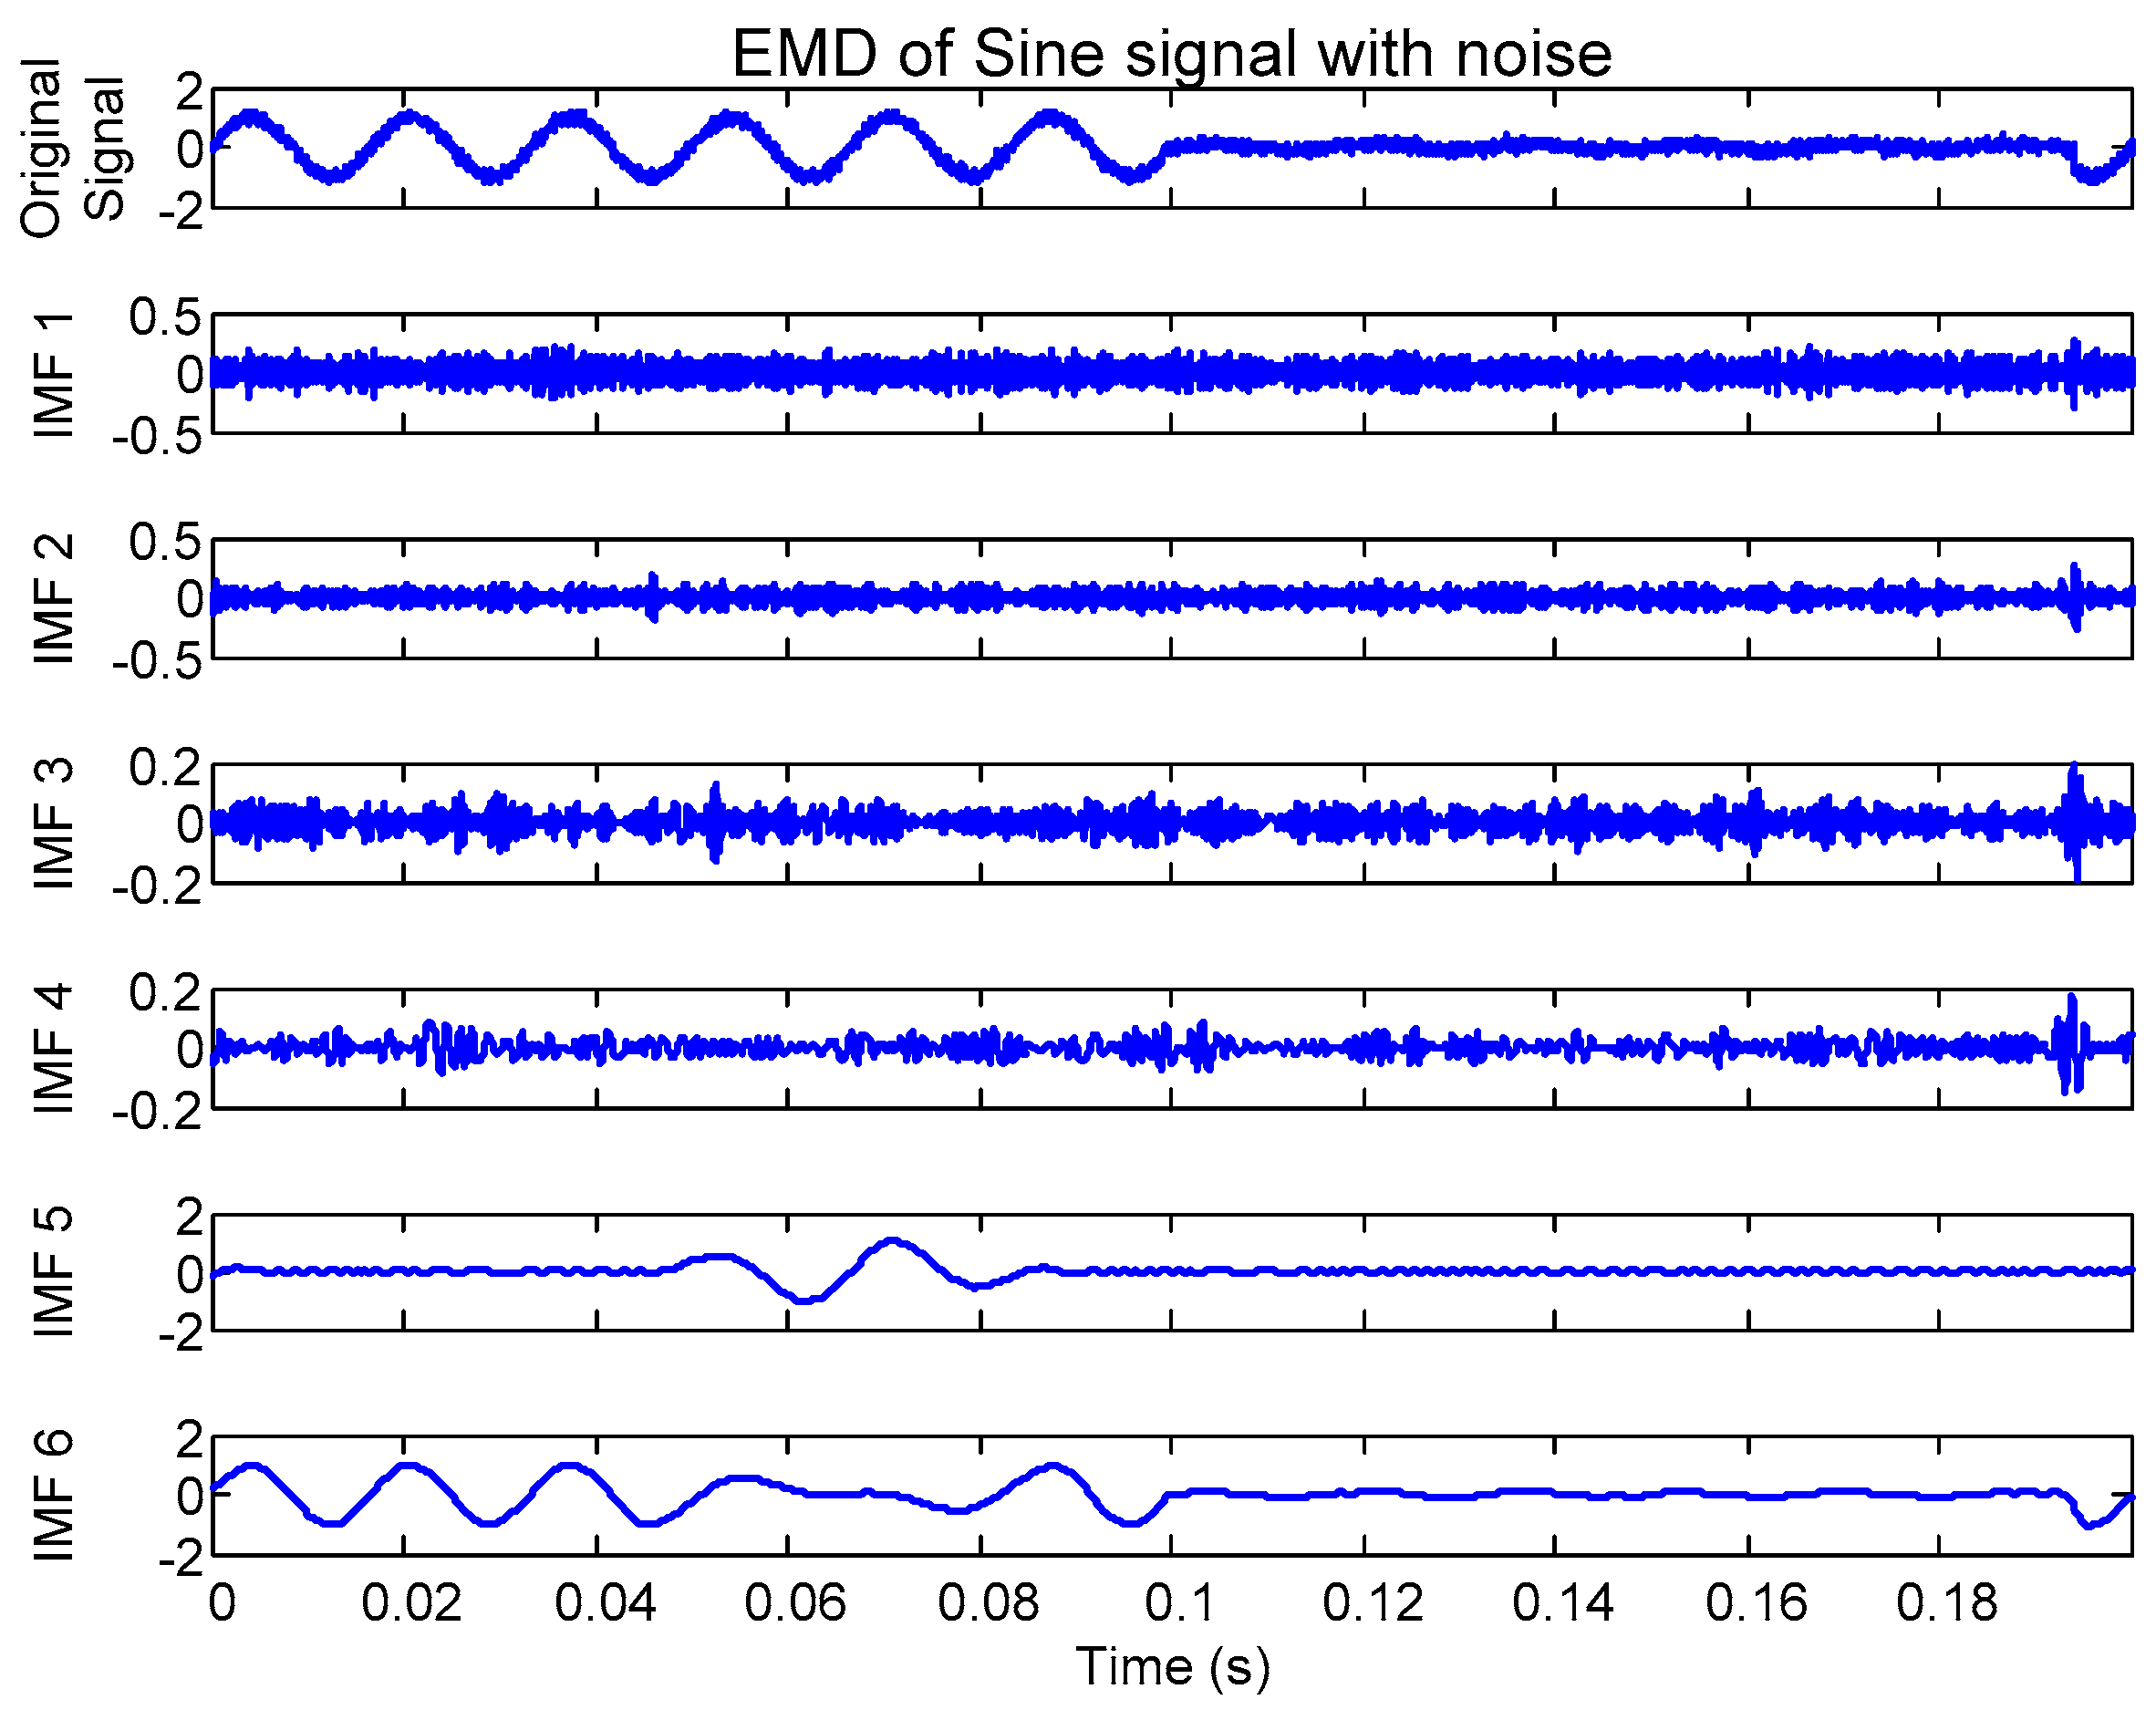
2.1. Empirical Mode Decomposition

The EMD extracts single components and symmetric components from non-linear and non-stationary signals by removing the lowest frequency information until only the highest frequency remains. The EMD separates a signal into so-called IMF, which are mono components containing a single frequency or a narrow band of frequencies. Huang [31] defined an oscillating wave as an IMF if and only if it satisfies the following two conditions:
  • For a data set, the number of extrema and the number of zero crossings points must be either equal or differ at most by one.
  • The mean value of the envelope defined by the local maxima and the local minima must be zero at any point.
The algorithm for extracting an IMF is described below:
Step 1: The upper and the lower envelopes are constructed by connecting all the maxima and all the minima with cubic splines.
Step 2: Take the mean of the two envelopes m(t) and subtract it from the original signal x(t) to get a component h1(t) as:
h1(t) = x(t) − m(t),
Step 3: If h1(t) satisfies the two conditions above to be classified as an IMF; then, h1(t) is the first IMF; else, h1(t) is treated as the original function and steps 1 to 3 are repeated to get component h11(t) as:
h11(t) = h1(t) − m(t),
Step 4: The above sifting process is repeated k times to comply with the two above conditions for IMF; then, h1k(t) becomes the first IMF and it is known as IMF1. Separate IMF1 from x(t) and let it be r1(t) as:
r1(t) = x(t) − h1k(t),
Step 5: The signal r1(t) is now taken as the original signal, and steps 1 to 4 are repeated to obtain the second IMF (IMF2).
The above procedure is repeated n times so that n IMFs are obtained. The stopping criterion for the decomposition process is when rn(t) becomes a monotonic function from which no more IMF can be extracted. Figure 1 depicts the first 6 IMF of a sine signal with noise.

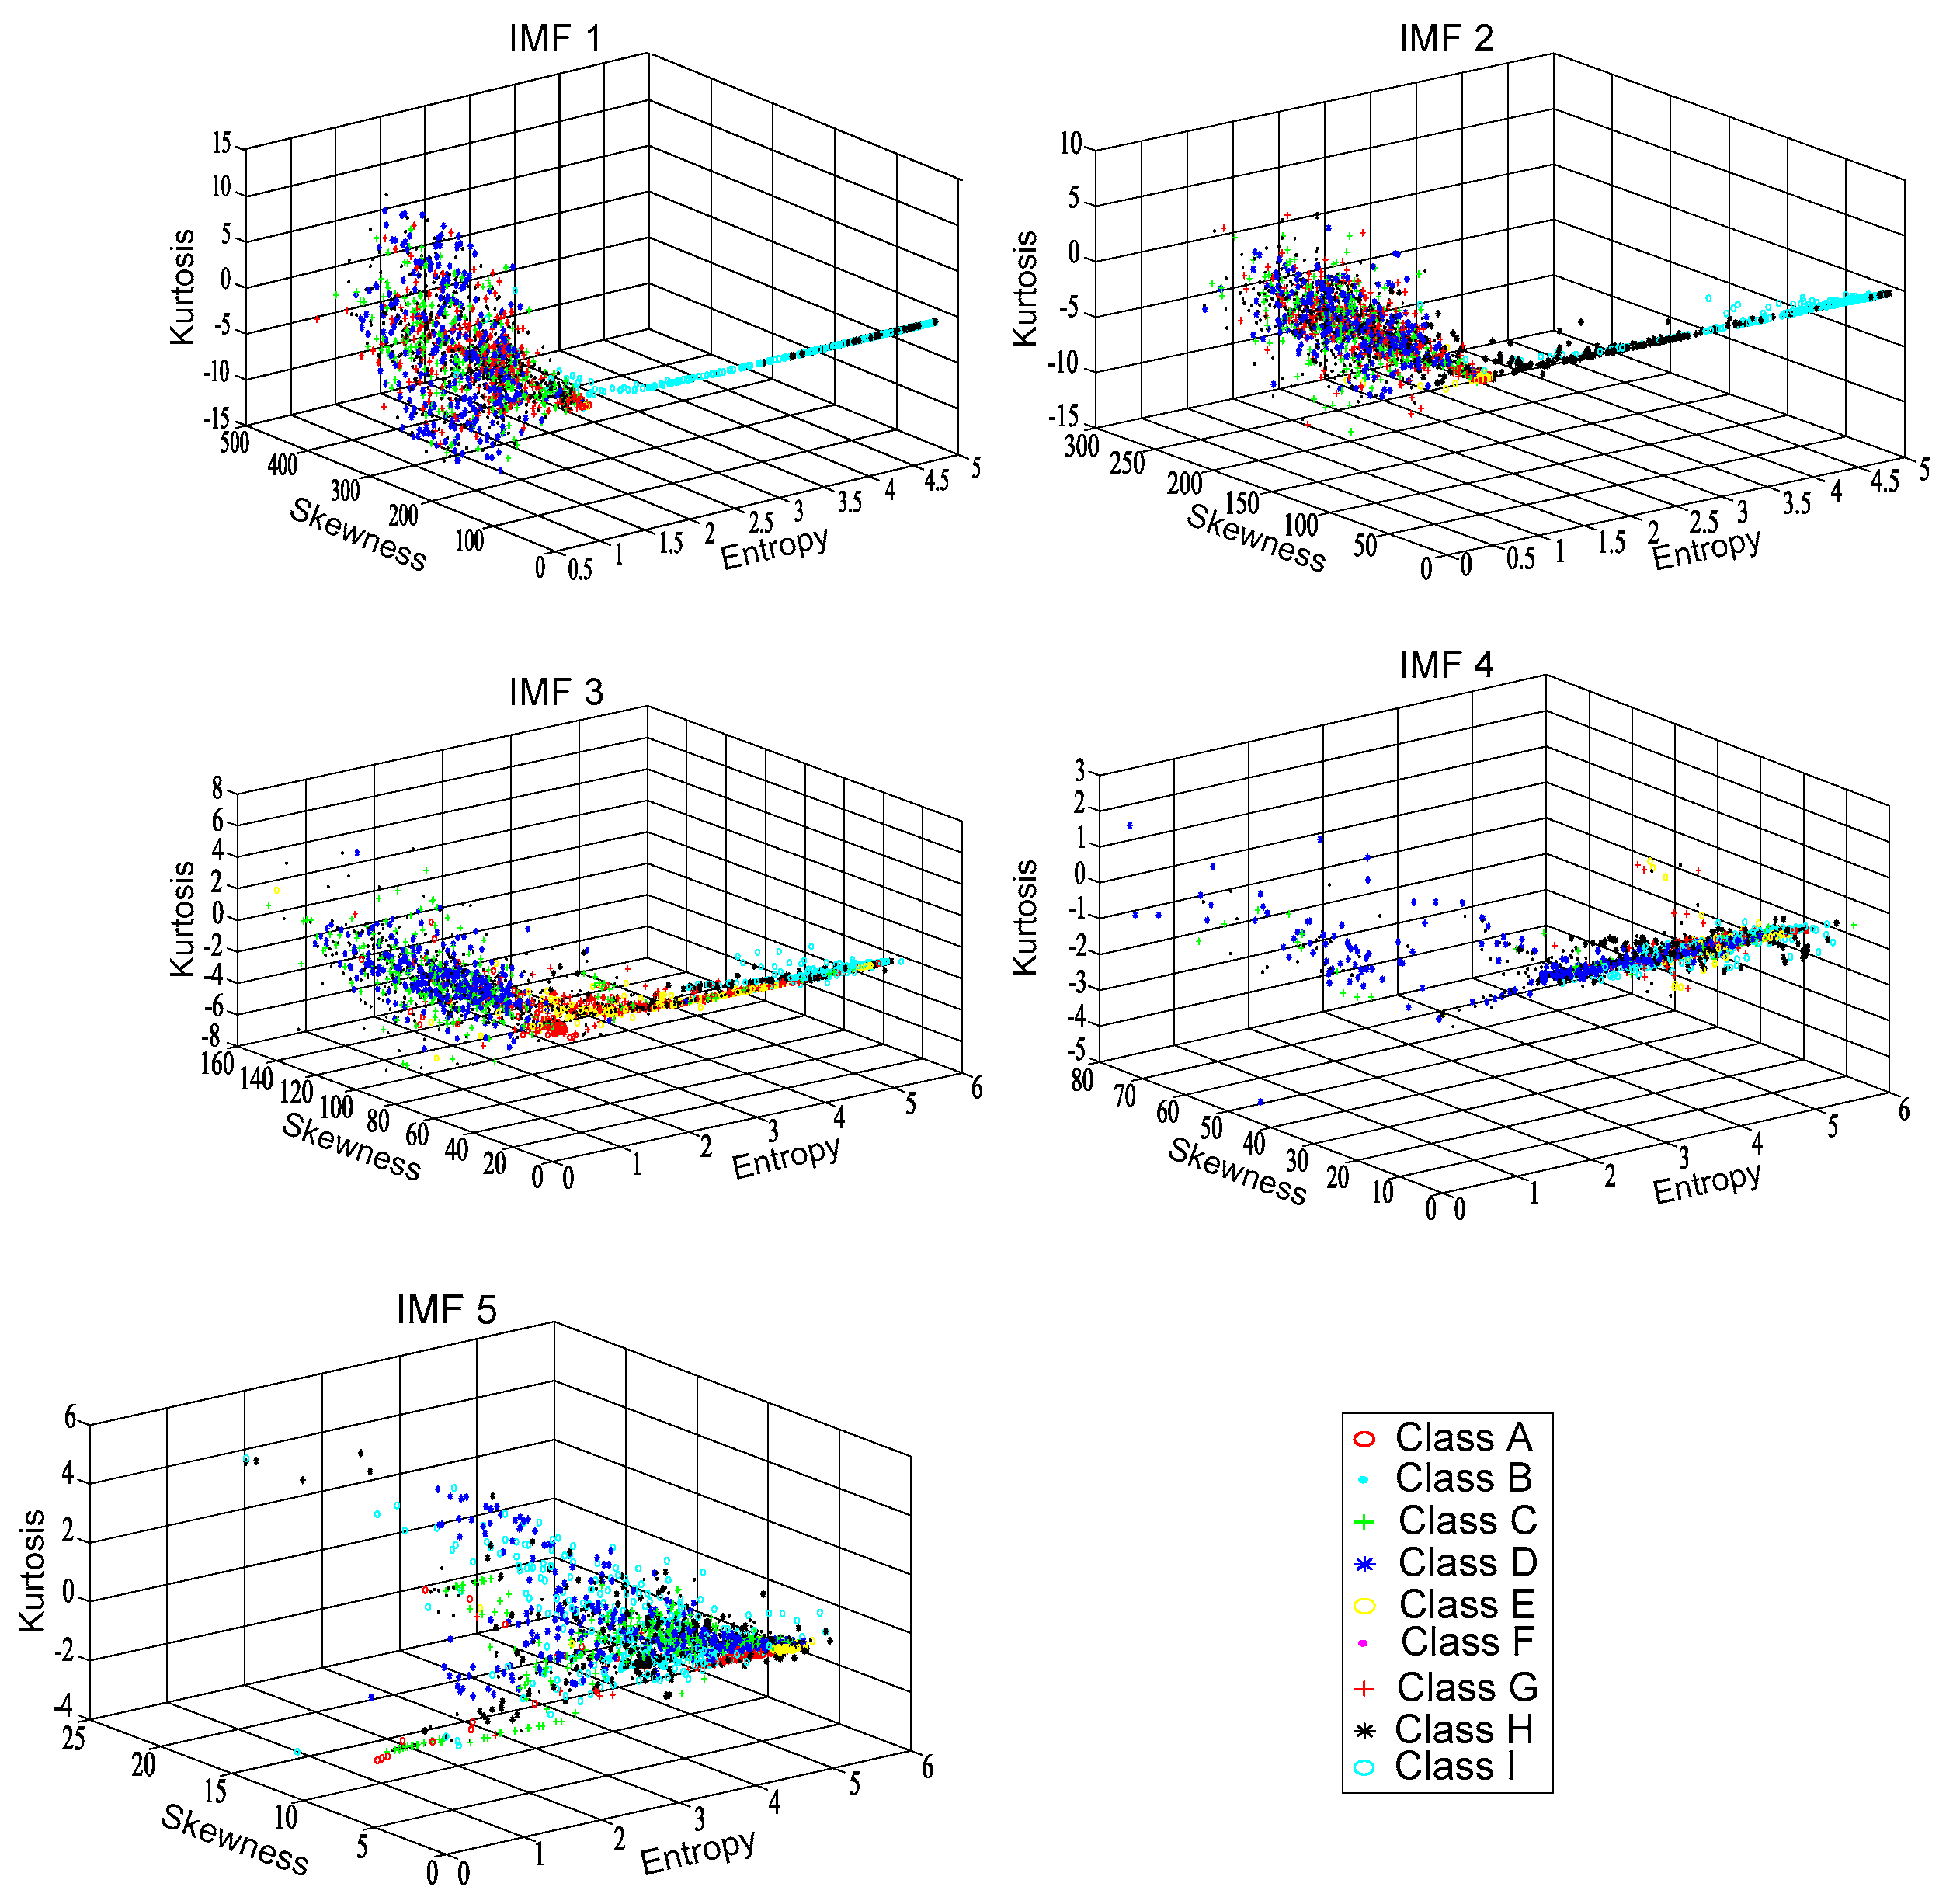
2.2. Shannon Entropy

Shannon defined entropy as a measure of the average information contents associated with a random outcome [42]. Considering a random event Y with n possible outcomes y1, y2, y3, … yn, and every yi (i = 1, ..., n) has a probability p(yi); the information entropy H(Y) of a random event Y is given by:
H ( Y ) = i = 1 n p ( y i ) log 2 ( p ( y i ) ) ,
If the total number of outcomes in the random event Y is N, the probability p(yi) is given by:
p ( y i ) = ρ i N ,
where ρi represent the incidence rate of each possible outcome yi and the total number of outcomes N is given as:
N = i = 1 n ρ i ,

2.3. Skewness

The skewness (also known as the third central moment) for a normal distribution is zero, and any symmetric data should have a skewness near to zero. Negative values for skewness indicate that data are skewed left, whereas positive values indicate that data are skewed right. If the analyzed data are multi-modal, then the sign of the skewness might be affected. The skewness of a random event Y is defined as:
E [ Y 3 ] = i = 1 n ( y i μ ) 3 σ 3 ,
where µ and σ are the mean and standard deviation of Y, respectively.

2.4. Kurtosis

Kurtosis (also known as the fourth central moment) is a measure of whether the data are peaked or flat relative to a normal distribution. Data sets with high kurtosis tend to have distinct peak near to the mean, decline rather rapidly, and have heavy tails. Data sets with low kurtosis tend to have a flat top near the mean rather than a sharp peak. A uniform distribution would be the extreme case. The kurtosis of a random event Y is defined as:
K [ Y 4 ] = i = 1 n ( y i μ ) 4 σ 4 ,

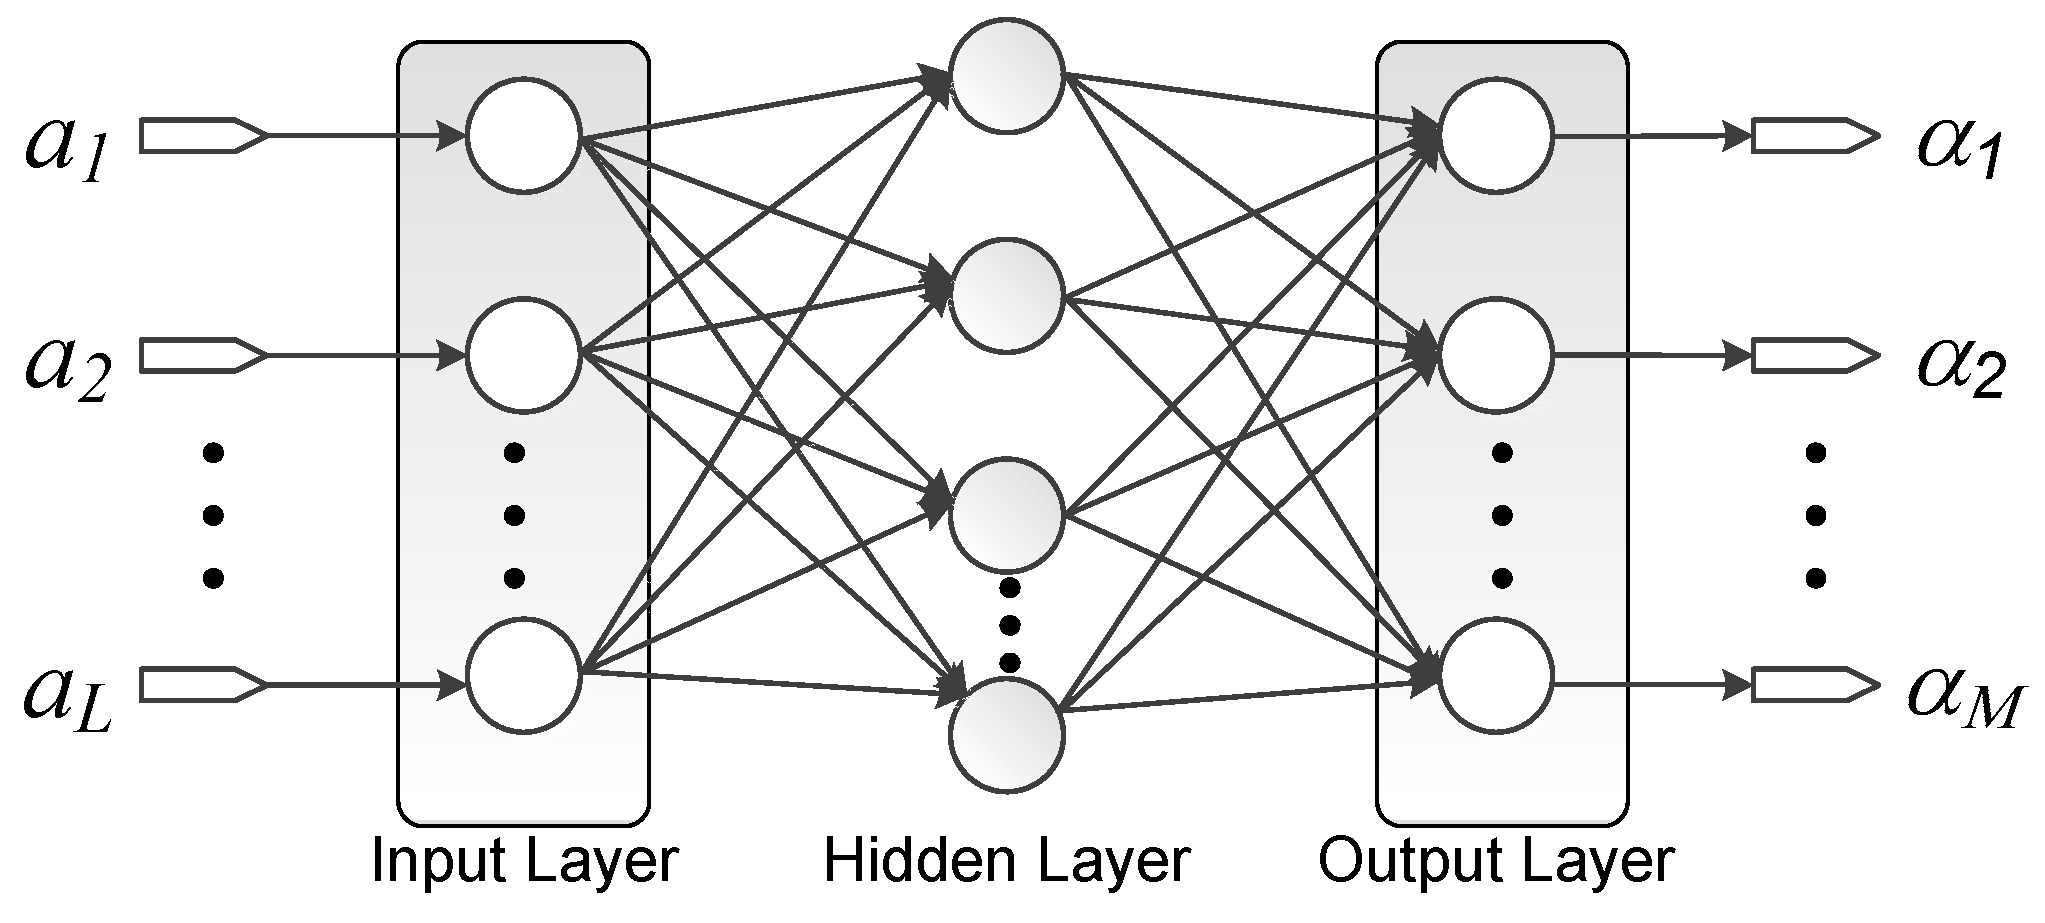
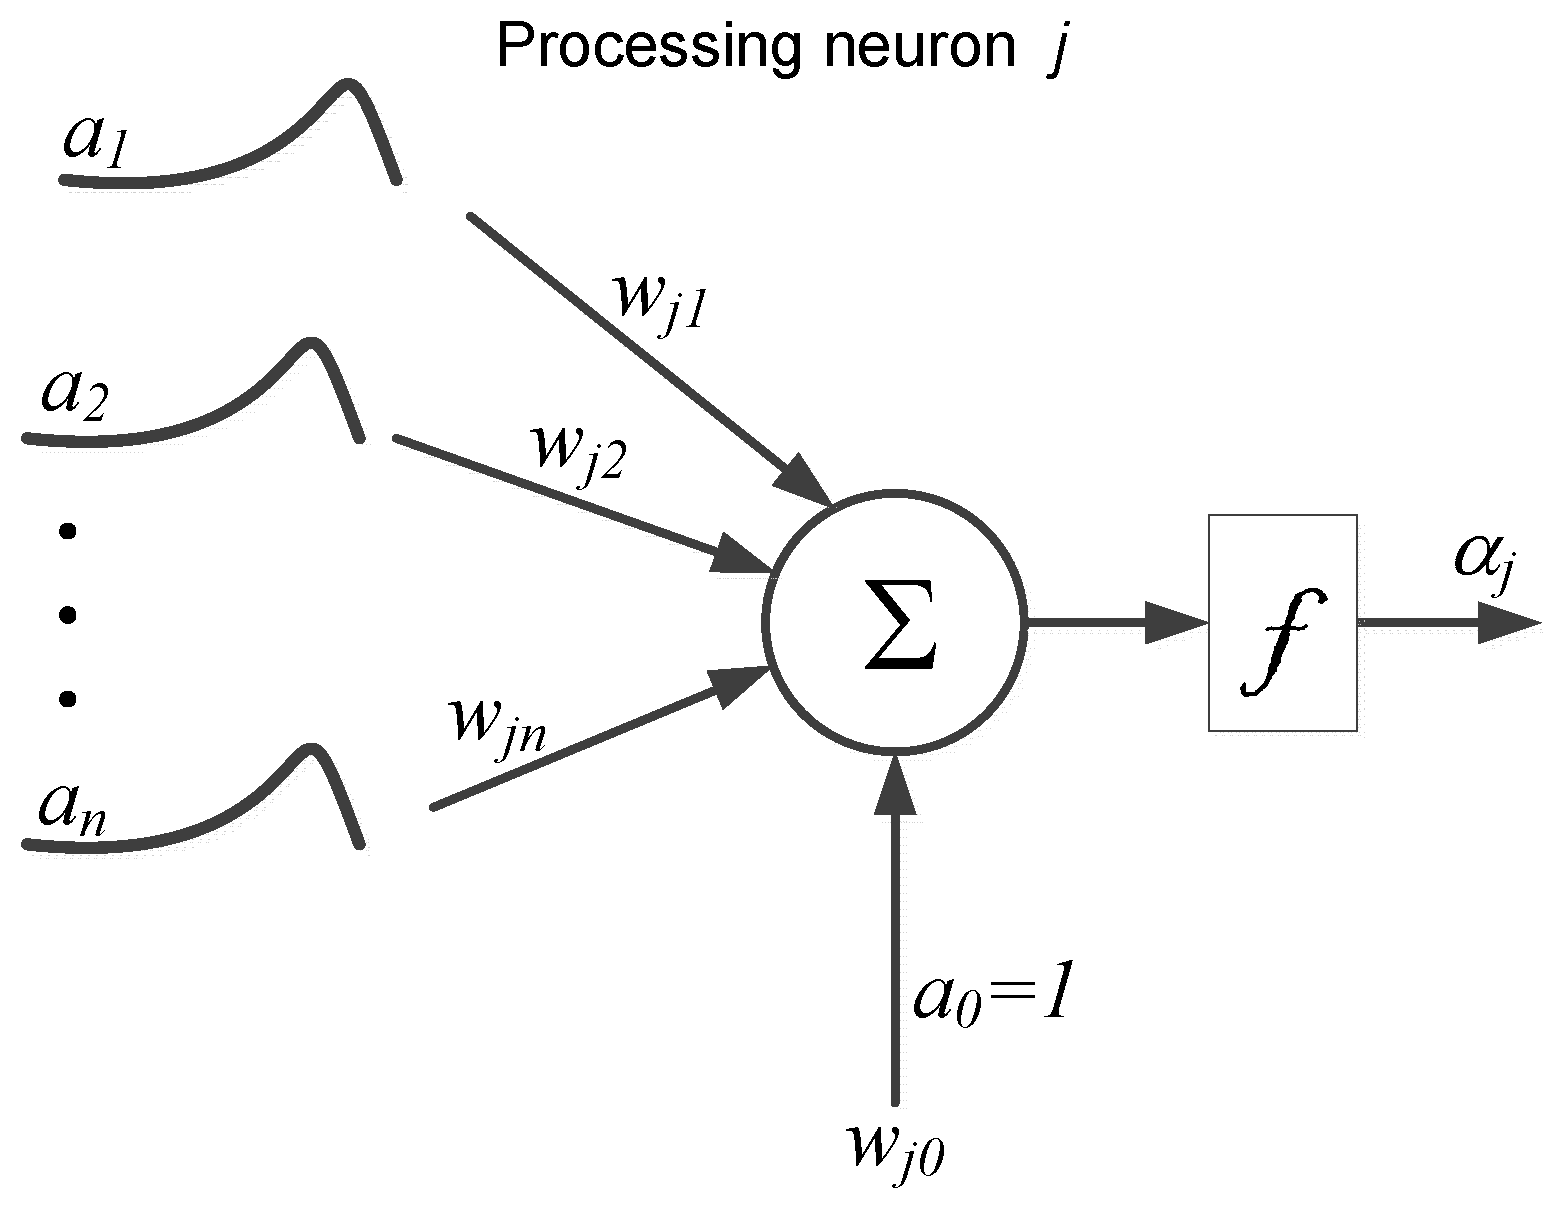
2.5. Artificial Neural Networks

ANN are inspired by models of living neurons and network communication [43,44]. A neuron is a node in an ANN that performs a nonlinear summing function to process information. Neuron connections (synaptic strengths) translate into weighting factors along the network interconnections. In ANN, these internal weights are adjusted during a “training” process, whereby input data along with corresponding desired or known output values are submitted to the network repetitively and, on each repetition, the weights are adjusted incrementally to bring the network output closer to the desired values. Specific neurons are dedicated to input or output functions, and others (“hidden layer”) are internal to the network in a multi-layer perceptron (MLP) configuration for further information processing, as illustrated in Figure 2.
Figure 3 shows an ANN processing unit (neuron). Each unit is a nonlinear summing node Sj defined by Equation (9).
S j = i = 0 n w j i a i ,
where w i j is the weighting factor from unit i to neuron j (j = 1, 2, …, 52), and α j is the activation value defined by:
α j = 1 1 + exp ( S j ) ,

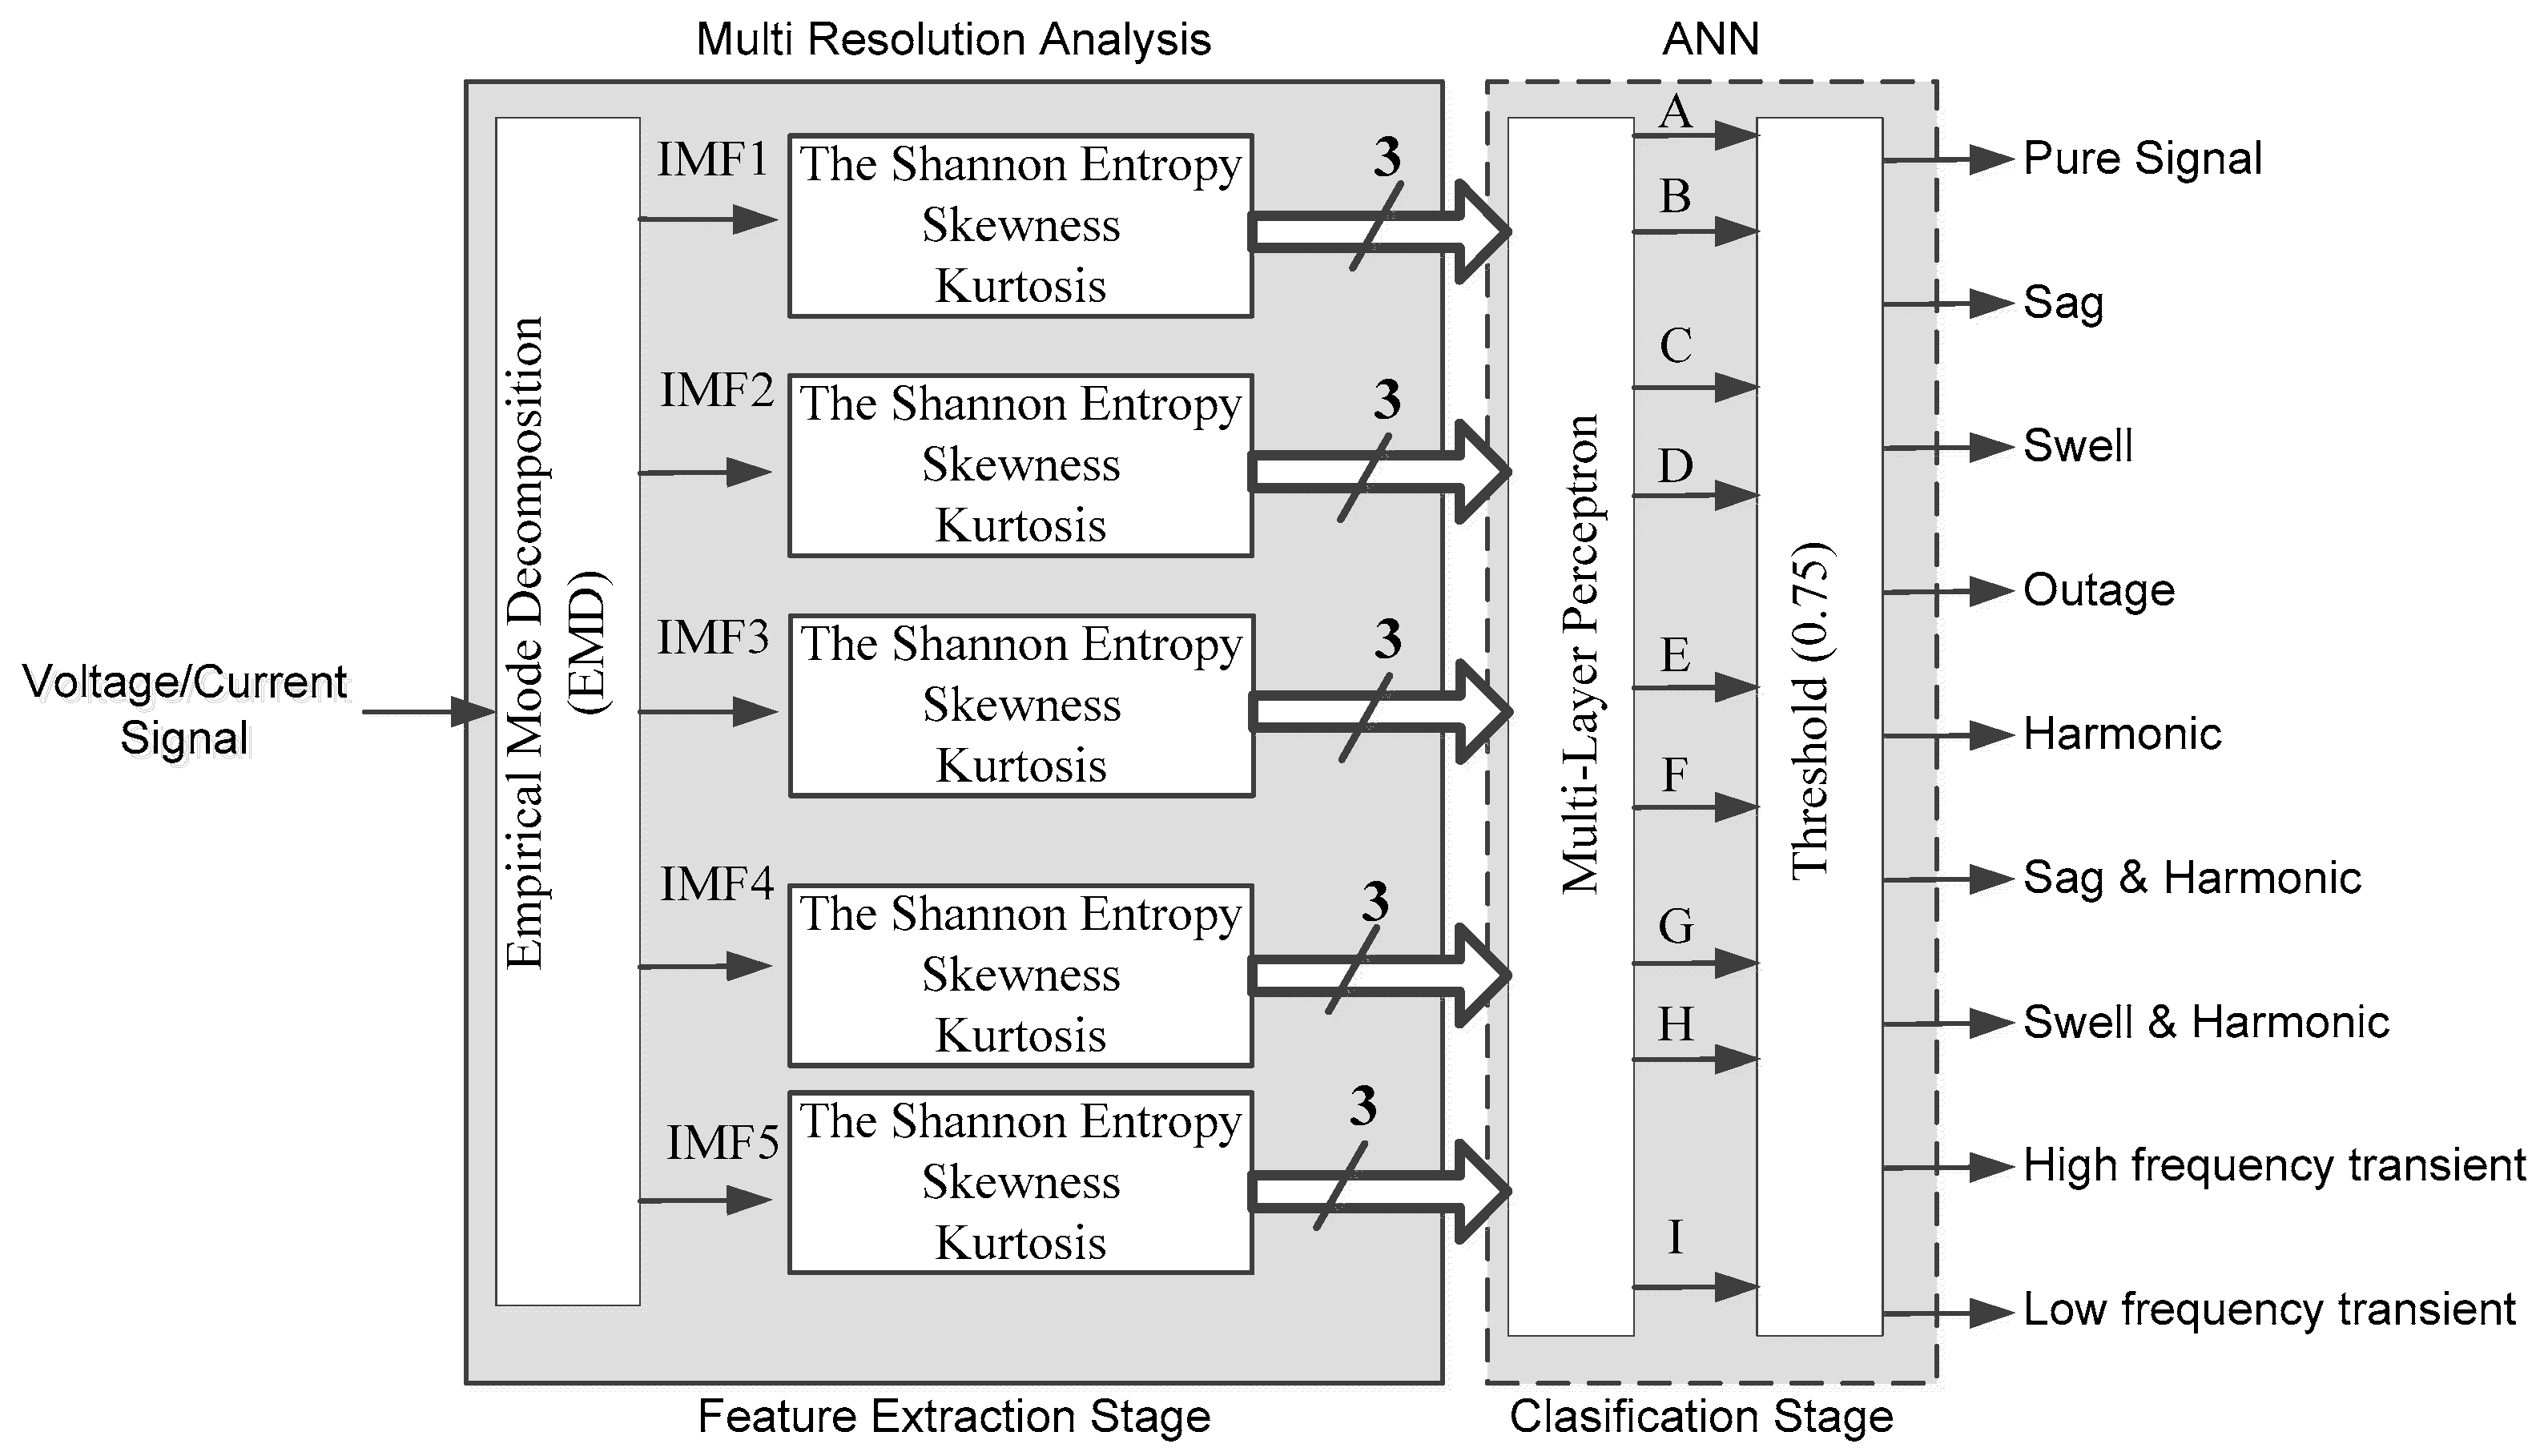
2.6. Proposed Methodology

The proposed methodology is divided into two steps. The first step involves feature extraction from the voltage/current signal for PQD classification. The second step implicates the intelligent system (ANN) design. Feature extraction applies the EMD to obtain the first five IMF. The obtained functions are used for calculating the estimation parameters (Shannon entropy, skewness and kurtosis); hence, a total of 15 features are collected from the analyzed voltage/current signal; then, these features are forwarded to the designed ANN with nine output neurons; where, each one of them represents a treated PQD. The identification threshold for each disturbance is set at 0.75 in the activation function. The proposed methodology is shown in Figure 4.

3. Experimentation

A set of signals artificially obtained through computer models, and a set of experimentally obtained real signal are used to validate the proposed approach for PQD detection and classification. In this work, the studied cases are pure normal-class sinusoidal signals (hereafter pure sine), which can vary its amplitude within 10% of its ideal magnitude, and the PQD sags, swells, outage, harmonic contamination, sag with harmonics, swell with harmonics, high and low frequency transients.

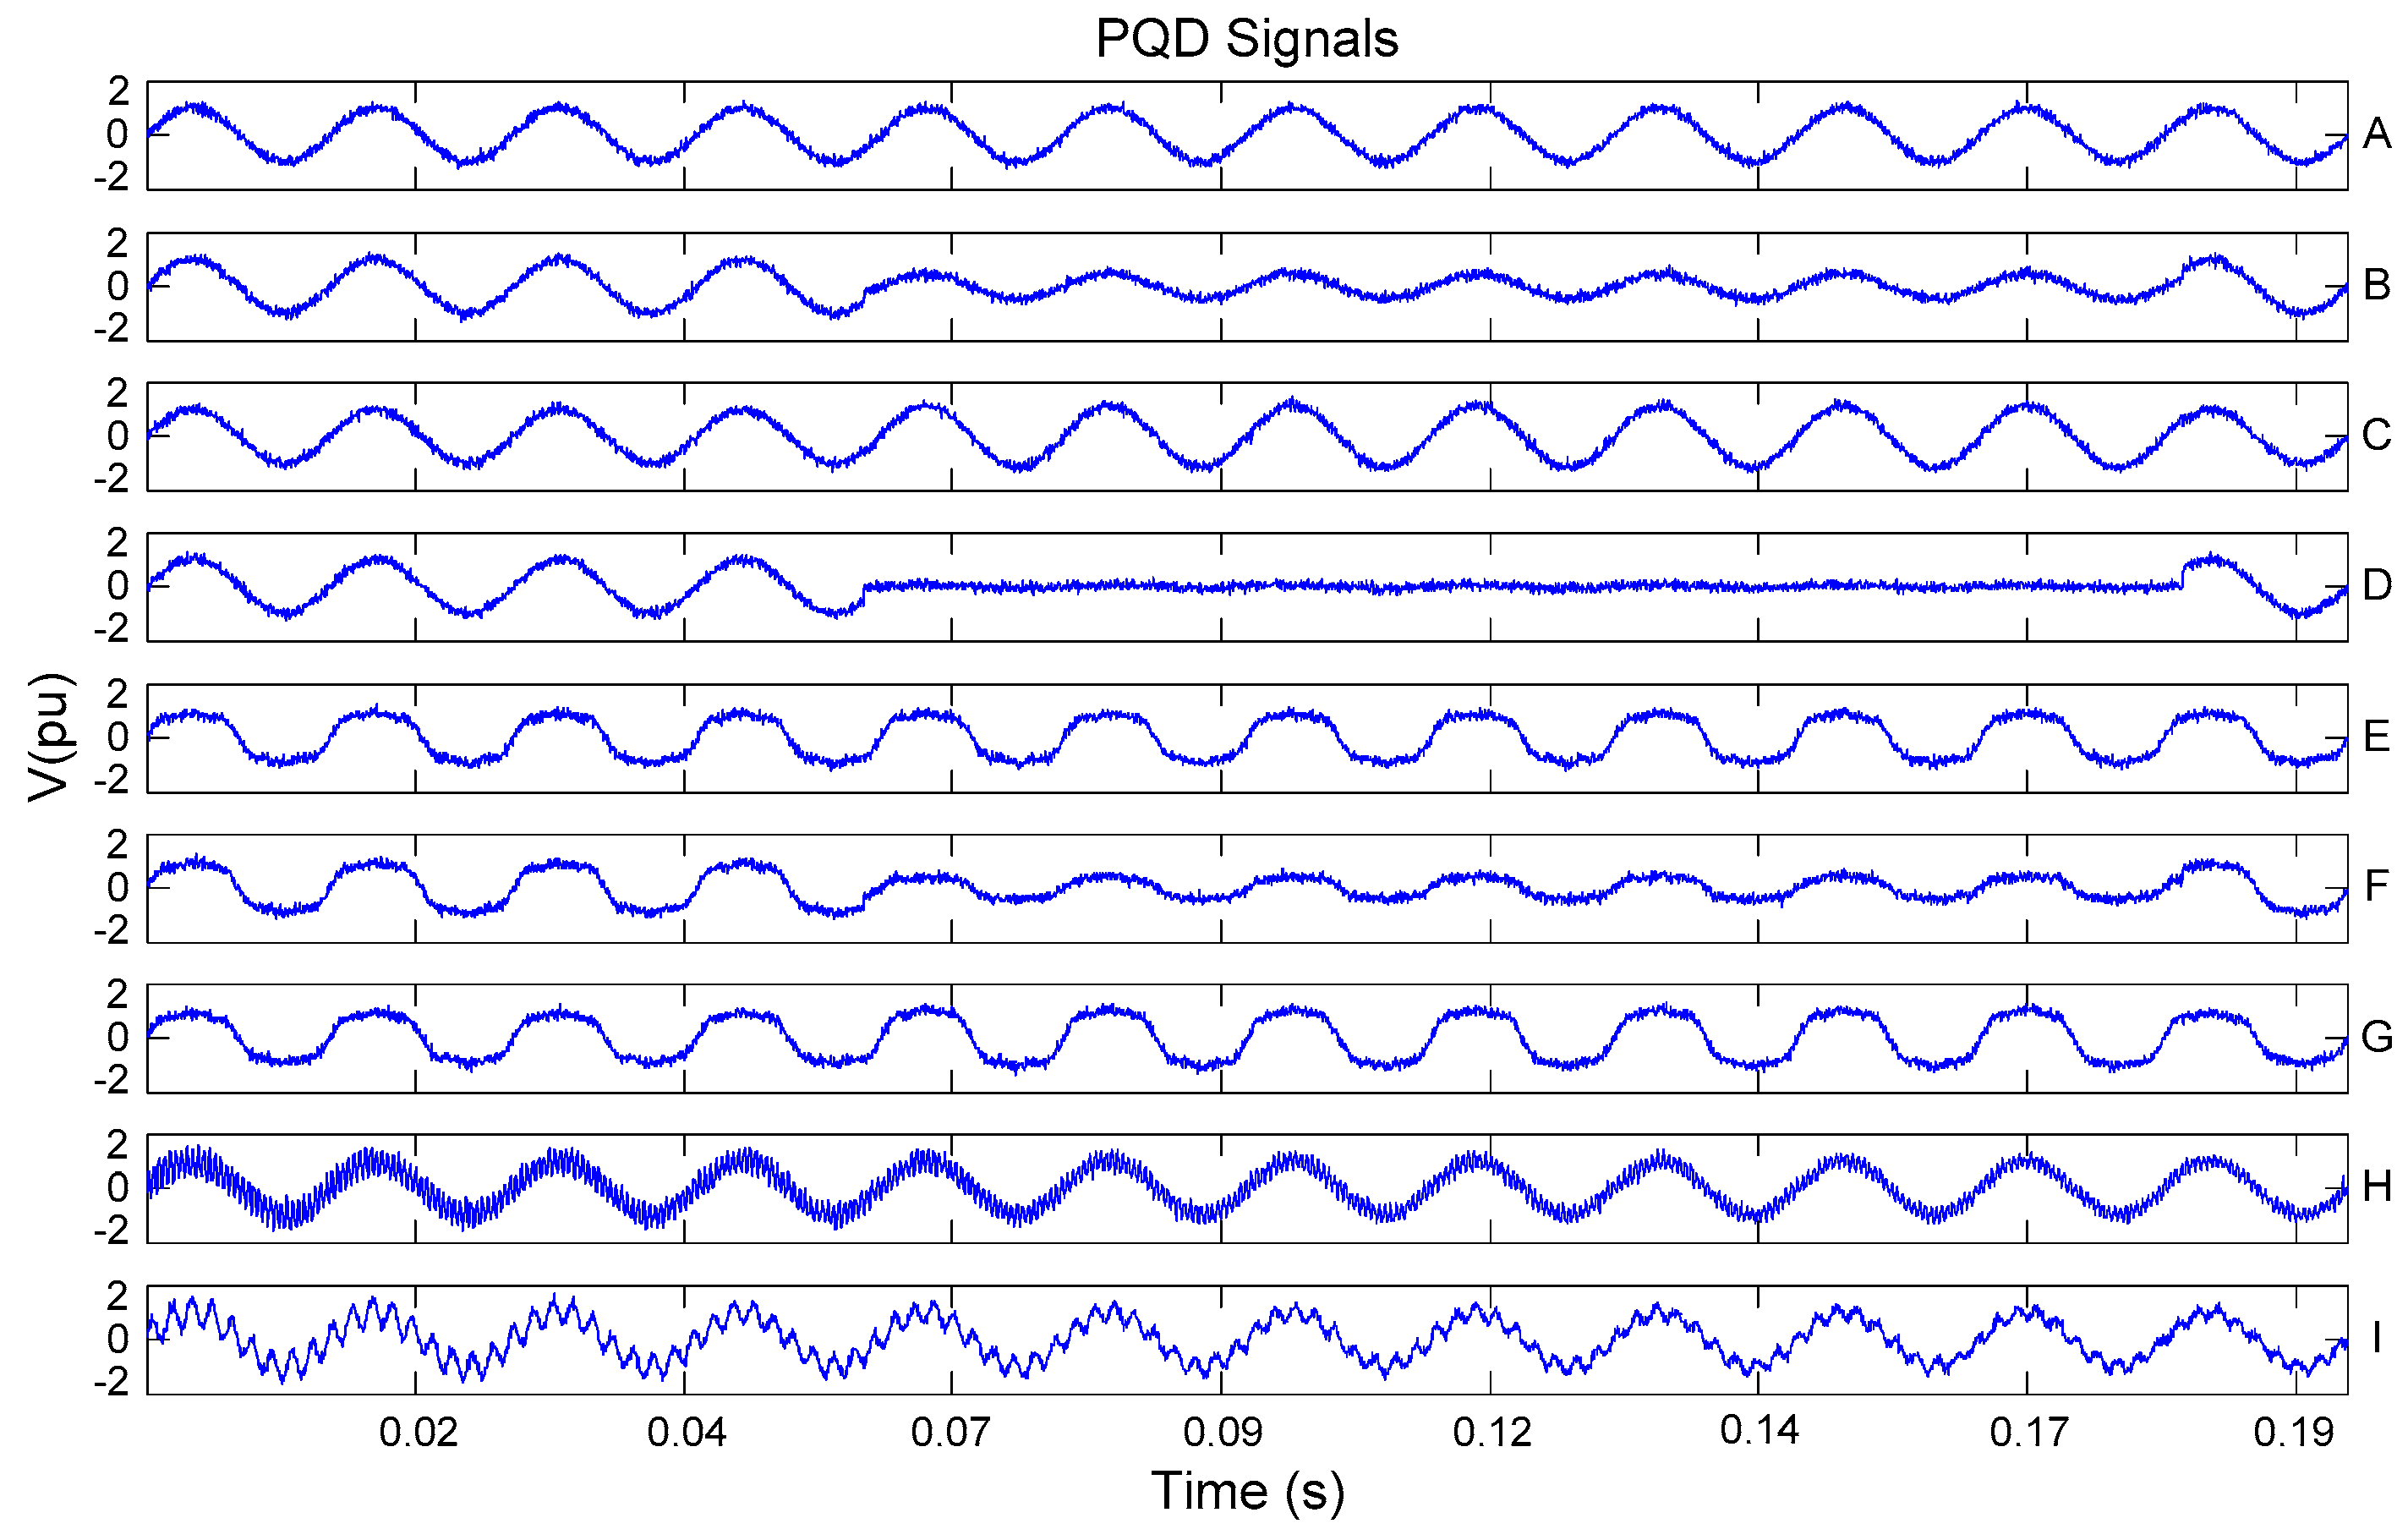
3.1. Computer Simulation of PQD

In reviewed literature [17,28,39,40,41,45,46], computer models of treated PQD are obtained by using parametric descriptions as shown in Table 1, which provides the mathematical descriptions for the corresponding real-life phenomenon.
In Table 1, A and ω are the amplitude and angular frequency of the signal, respectively. The u(t) function is known as Heaviside step function. It is worth noticing that in [41] classes D and E of the disturbances are considered as the same one; this is indicated with (*). On the other hand, [17] is the only work that considers disturbance H and I separately from other classes. The analyzed signal for each PQD was obtained by describing its corresponding mathematical definition, given in Table 1, using MATLAB. The ANN training, validation and test were performed in MATLAB using the neural network toolbox. On the other hand, the parametric descriptions of PQD allow varying their features in a wide range; therefore, 300 signals for each PQD class, with different signal-to-noise ratio (SNR), were generated for training and validating the ANN. The signals were sampled at 20.48 KHz in 200 ms, contain a total of 4096 samples. This is the standard-defined basic window for PQ monitoring [2,3]. The PQD signals are shown in Figure 5.
The units for all treated signals are defined as per-unit (pu), so that the proposed methodology can be applied to any voltage/current range. In classes E, F and G, harmonic contamination is induced considering the first five harmonics; hence, the total harmonic distortion (THD) for each signal is given in Table 2, with noise contamination in a range from 20 to 50 dB for each single-phase.
The treated cases of study in this paper consider just short-duration disturbances according to the IEC and IEEE standards (16.66 ms–150 ms, 110%–180% and 10%–90% in swell and sag) [47,48], this is depicted in Figure 6.
The probability that distribution signals in real power systems will be contaminated with noise is quite high [44,46]; therefore, Gaussian noise contamination at different SNR is considered in this work. The SNR is given as:
S N R ( d b ) = 10 * log ( P s P n ) ,
where Ps and Pn are the signal and noise power, respectively.

3.2. EMD Estimation on Voltage/Current Signals

In all treated cases, the EMD algorithm is implemented through cubic-spline interpolation to calculate the upper and lower envelopes from local maximum and minimum, respectively, in voltage/current signals. A third-order polynomial fi(x) is used to describe a piecewise continuous curve for each interval [x–xi], defined as:
f i ( x ) = a i ( x x i ) 3 + b i ( x x i ) 2 + c i ( x x i ) + d i ,
where ai, bi, ci, and di are spline coefficients and xi is the abscissa of the known values, for i = 1, 2, …, n−1. There are a total of n−1 intervals (with n1 corresponding to polynomials f1(x), f2(x), …, fn1(x)) for n data points.

3.3. ANN Training

During the classification stage, the proposed EMD features (Kurtosis, Skewness and Entropy) are used as inputs to an ANN, which has an MLP architecture. The outputs from the ANN are the different treated PQD. The MLP structure and training parameters used in this study are given in Table 3.
Figure 7 shows a three-dimensional projection of the training set with the three considered features from the analyzed voltage/current signal.

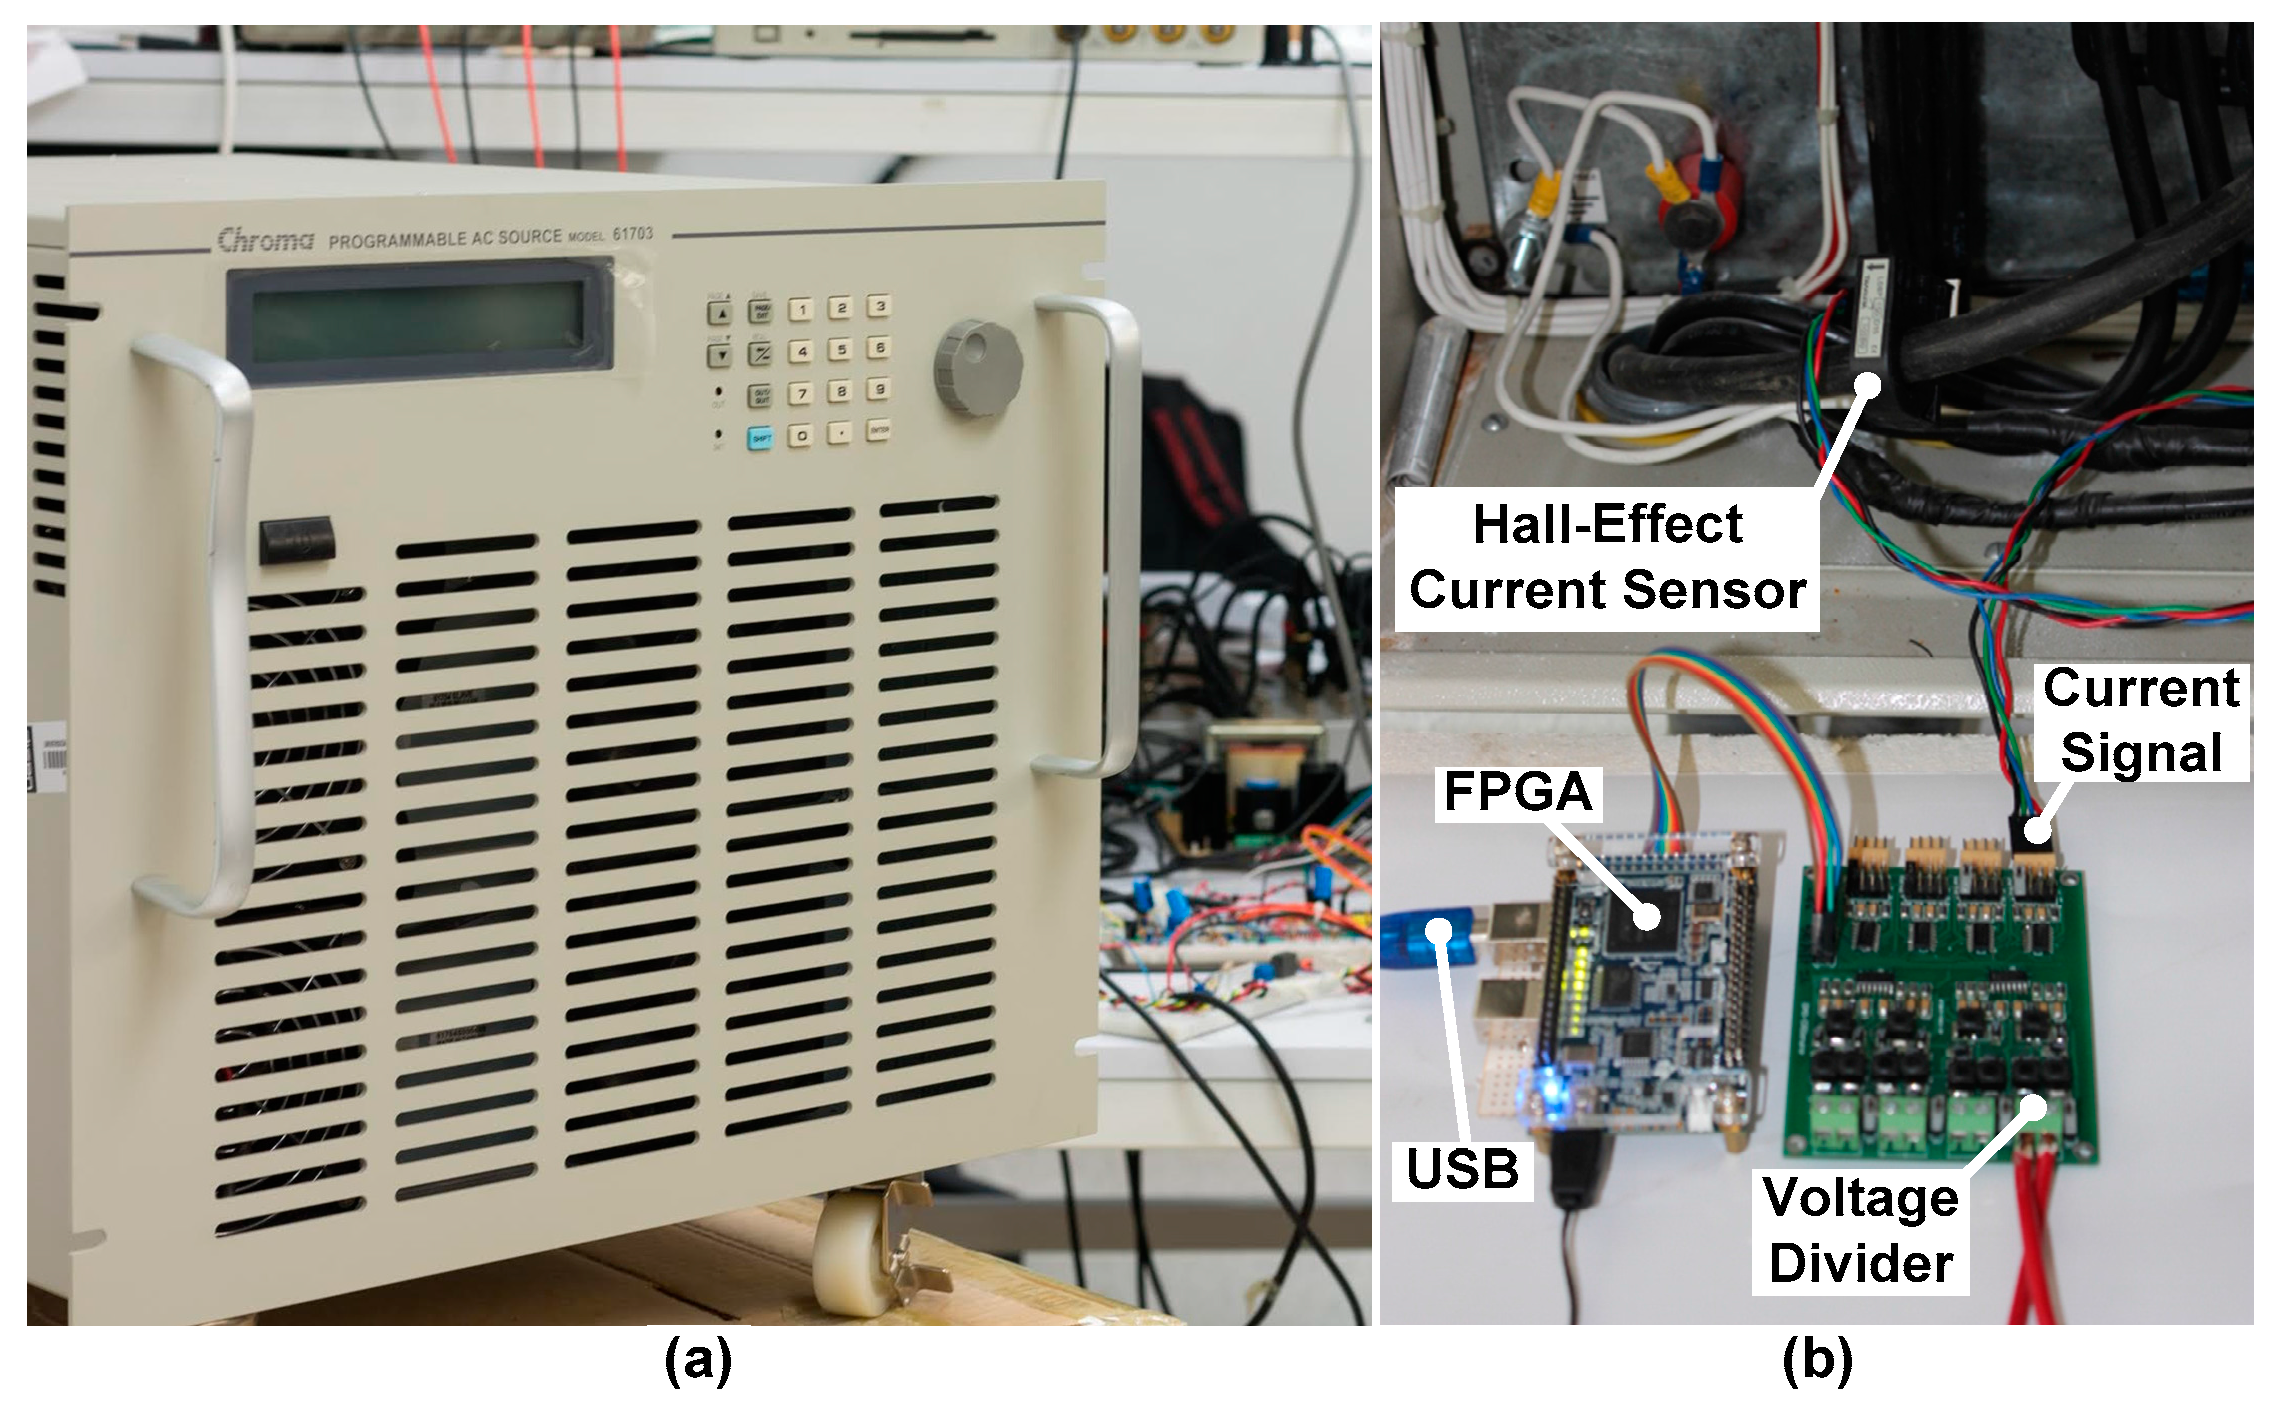
3.4. Experimental Setup for PQD

The experimental setup to test the performance of the proposed method, considers real signals obtained from a Chroma Programmable AC Power Source model 61703 [50]. Some of the main features of this power source are that it generates a harmonic component pattern on voltage/current signal, short-duration voltage sags and swells on one single phase or the three phases, with intermittences in frequency and amplitude; in this way, being able to generate a wide variety of electric power disturbances that are produced by amplitude and phase deviations on three-phase power systems. Furthermore, to test nonlinear loads, a 5 KW rectifier circuit is designed, and a load requiring 3 KW is connected for a 27.23% THD. On the other hand, a 12-bit, 8-channel serial-output analog-to-digital converter ADC128S022 from Texas Instruments Inc. (Dallas, Texas, United States) is used in the data acquisition system (DAS) for acquiring the supplied voltage signal. The instrumentation system utilizes a sampling frequency f0 = 20.48 KHz, obtaining 4096 samples. Figure 8 shows the instrumentation for voltage-signal acquisition.
In Figure 8, one-phase voltage/current signal is acquired through a voltage divider/hall-effect current sensor. The acquired signal is conditioned and analog-to-digital (A/D) converted in the DAS. The FPGA provides control and synchronization signals during data acquisition, and works as a link to transmit the resulting digital information into a PC utilizing an USB interface, for applying the proposed methodology. Figure 9 shows the acquired PQD signals obtained by the test bed in Figure 8.

4. Results

The proposed method takes around 200 ms for computing IMF and extracting their corresponding features (i.e., information entropy, skewness, and kurtosis). The disturbance classification through ANN takes over 10 ms; hence, the PQD classification is performed in about 210 ms considering a 12-cycle analysis window as defined in the standards IEEE 1159-2009 [2], and IEC 61000 [3].
The effectiveness of the proposed methodology for PQD detection and classification is assessed in terms of four different sensitive metrics, as defined in:
A c c u r a c y      ( % ) = T P + T N T P + T N + F P + F N ,
where TP, TN, FP, and FN, are the true positive, true negative, false positive, and false negative rates, respectively, whose values are given as the occurrence of the correctly and incorrectly identified outcomes during a signal classification, positive (correctly classified) and negative (incorrectly classified) results [28].

4.1. ANN Validation Results

Table 4 shows the classification effectiveness of the designed ANN during the validation stage for PQD classification with different SNR. The results reported in this table indicates the high effectiveness of the proposed methodology.

4.2. Simulation Results

Table 5 shows the performance of the proposed methodology during classification of different PQD in a voltage/current signal with noise contamination in a range from 20 to 50 dB. It is worth it to notice that the signals used for testing the proposed methodology through computer simulation are different from those used during the ANN training. In both sets, the signals under analysis were obtained by randomly varying all parameters (magnitude of the disturbance, period, position, etc.).

4.3. Experimental Results

Table 6 shows the performance of the proposed methodology during detection and classification of different PQD in real voltage/current signals obtained from the experimental test bed described in Section 3.4 in 50 trials for each class. It is noteworthy the high effectiveness of the proposed methodology for detecting and classifying different PQD in real voltage/current signals.

4.4. Discussion

Table 7 summarizes a performance comparison of the proposed method against previous works in reviewed literature, through percentage of effectiveness. In [17,39,40,41], the PQD H and I in Table 1 are considered as the same disturbance; therefore, these two classes are not included in the comparison table. On the other hand, in [28], just the overall percentage of effectiveness during PQD classification is reported. These figures were obtained from the best performance of the corresponding methodology [17,28,39,40,41], considering the lowest SNR treated on each of them.
From Table 7, it is clear that the proposed methodology is able to correctly classify more different PQDs than any other method from the reviewed literature, using less features from the analyzed voltage/current signal. In three of the computer simulation cases, the proposed methodology reaches lower certainty during the classification of two PQD than some of the methods in reviewed literature; however, the proposed approach reaches a higher classification performance overall than any of the reported methods, and for those cases where the proposed methodology reaches lower certainty, the difference is not that significant. On the other hand, the proposed methodology extracts just three classification features from each of the five IMF to carry out the PQD identification; whereas, in [39], a 10-level wavelet decomposition is performed on the voltage signal to extract 11 features from each decomposition; hence, 121 classification features are input to an SVM for categorizing seven different PQD. In [40], one feature vector, with nine different characteristics obtained from an 8-level wavelet decomposition, is extracted using the voltage signal. The vector is used as an input to two ANN linked through an Inter-ART module to perform the PQD classification. In [41], genetic algorithms are implemented to find the optimal number of classification features; which can go from 16 to 128 to perform the PQD classification. Furthermore, the proposed method reached an outstanding 100% of effectiveness detecting and classifying all treated PQD in real voltage/current signals; hence, outperforming previous methodologies in reviewed literature. From the stated above, the proposed methodology is able to identify more PQD by extracting less classification features from the voltage/current signal, offering a remarkable high certainty for detecting and categorizing PQD.

5. Conclusions

Common methods for PQD detection perform a frequency analysis on the power distribution signal; others, consider time-frequency analysis for detecting and classifying a limited number of PQD; however, most of them present problems when analyzing signals with low SNR. Therefore, in this work a novel methodology is proposed for detecting and classifying PQD through EMD and minimum parameter estimation (Shannon entropy, skewness, and kurtosis) from one-phase voltage/current signals and ANN. From the obtained results, and an effectiveness analysis, it was demonstrated that the proposed approach achieves higher classification performance than any previously proposed method in the reviewed literature; detecting and identifying nine different PQD even under high noise contamination at 20 dB. This is confirmed by the results obtained from computer simulations, and backed up by experimentation on real data analysed through the proposed method, with a remarkable 100% effectiveness during PQD detection and classification for all treated cases, exceeding previously proposed approaches.

Acknowledgments

This work was supported in part by Direccion de Apoyo a la Investigacion y al Posgrado, Universidad de Guanajuato, under Research Project number 978/2016, in part by the National Council on Science and Technology (CONACYT), Mexico, under Scholarships 254860 and 254859, and in part by the Council on Science and Technology of Guanajuato (CONCYTEG) under Grant 120/2015 UG.

Author Contributions

Misael Lopez-Ramirez and Luis M. Ledesma-Carrillo conceived methodology, performed the experimentation and compile the mathematical definition for the treated PQD; Eduardo Cabal-Yepez and Carlos Rodriguez-Donate wrote the paper, analyzed obtained results and discussed the application, besides Carlos Rodriguez-Donate designed and implemented the data acquisition system; Homero Miranda-Vidales provided the equipment and guided the obtaining of the real signals used for validating the proposed approach; Arturo Garcia-Perez provided the theoretical background for envisaging the proposed methodology.

Conflicts of Interest

The authors declare no conflict of interest.

Abbreviations

The following abbreviations are used in this manuscript:
A/D
Analog-to-Digital
ANN
Artificial Neural Network
DAS
Data Acquisition System
EMD
Empirical Mode Decomposition
FFT
Fast Fourier Transform
IMF
Intrinsic Mode Functions
MLP
Multi-Layer Perceptron
PQ
Power Quality
PQD
Power Quality Disturbances
pu
Per-Unit
SNR
Signal-to-Noise Ration
THD
Total Harmonic Distortion

References

  1. Chattopadhyay, S.; Mitra, M.; Sengupta, S. Electric Power Quality, 1st ed.; Springer: New York, NY, USA, 2011. [Google Scholar]
  2. IEEE Std 1159–2009 (Revision of IEEE Std 1159–1995), IEEE Recommended Practice for Monitoring Electric Power Quality; IEEE Power & Energy Society: New York, NY, USA, 2009.
  3. CEI/IEC 61000–4-30 International Standard. Testing and Measurement Techniques—Power Quality Measurement Methods, 1st ed.; International Electrotechnical Commission: Geneva, Switzerland, 2003.
  4. Markiewicz, H.; Klajn, A. Standard EN 50160-Voltage Characteristics of Public Distribution Systems, Voltage Disturbances; Copper Development Association: Hemel Hempstead, UK, 2004. [Google Scholar]
  5. Mahela, O.P.; Shaik, A.G.; Gupta, N. A critical review of detection and classification of power quality events. Renew. Sustain. Energy Rev. 2015, 41, 495–505. [Google Scholar] [CrossRef]
  6. Ferreira, D.D.; de Seixas, J.M.; Cerqueira, A.S. A method based on independent component analysis for single and multiple power quality disturbance classification. Electr. Power Syst. Res. 2015, 119, 425–431. [Google Scholar] [CrossRef]
  7. Moreno, R.; Visairo, N.; Nunez, C.; Rodriguez, E. A novel algorithm for voltage transient detection and isolation for power quality monitoring. Electr. Power Syst. Res. 2014, 114, 110–117. [Google Scholar] [CrossRef]
  8. Dai, Z.; Lin, H.; Yin, H.; Qiu, Y. A novel method for voltage support control under unbalanced grid faults and grid harmonic voltage disturbances. IET Power Electron. 2015, 8, 1377–1385. [Google Scholar] [CrossRef]
  9. Yılmaz, I.; Durna, E.; Ermis, M. Design and implementation of a hybrid system for the mitigation of PQ problems of medium-frequency induction steel-melting furnaces. IEEE Trans. Ind. Appl. 2016, 52, 2700–2713. [Google Scholar] [CrossRef]
  10. Yau, H.-T.; Wang, M.-H.; Wang, T.-Y.; Chen, G. Signal clustering of power disturbance by using chaos synchronization. Int. J. Electr. Power Energy Syst. 2015, 64, 112–120. [Google Scholar] [CrossRef]
  11. Real-Calvo, R.; Moreno-Munoz, A.; Gonzalez-de-la-Rosa, J.J.; Pallares-Lopez, V.; Gonzalez-Redondo, M.J.; Moreno-Garcia, I.M. An embedded system in smart inverters for power quality and safety functionality. Energies 2016, 9, 1–25. [Google Scholar] [CrossRef]
  12. Ahila, R.; Sadasivam, V.; Manimala, K. An integrated PSO for parameter determination and feature selection of ELM and its application in classification of power system disturbances. Appl. Soft Comput. 2015, 32, 23–37. [Google Scholar] [CrossRef]
  13. Dehghani, H.; Vahidi, B.; Naghizadeh, R.A.; Hosseinian, S.H. Power quality disturbance classification using a statistical and wavelet-based hidden Markov model with Dempster–Shafer algorithm. Int. J. Electr. Power Energy Syst. 2013, 47, 368–377. [Google Scholar] [CrossRef]
  14. Kanirajan, P.; Kumar, V.S. Power quality disturbance detection and classification using wavelet and RBFNN. Appl. Soft Comput. 2015, 35, 470–481. [Google Scholar] [CrossRef]
  15. Biswal, B.; Biswal, M.; Hasan, S.; Dash, P.K. Nonstationary power signal time series data classification using LVQ classifier. Appl. Soft Comput. 2014, 18, 158–166. [Google Scholar] [CrossRef]
  16. Upadhyaya, S.; Mohanty, S.; Bhende, C.N. Hybrid methods for fast detection and characterization of power quality disturbances. J. Control Autom. Electr. Syst. 2015, 26, 556–566. [Google Scholar] [CrossRef]
  17. Deokar, S.A.; Waghmar, L.M. Integrated DWT–FFT approach for detection and classification of power quality disturbances. Int. J. Electr. Power Energy Syst. 2014, 61, 594–605. [Google Scholar] [CrossRef]
  18. Zafar, T.; Morsi, W.G. Power quality and the un-decimated wavelet transform: An analytic approach for time-varying disturbances. Electr. Power Syst. Res. 2013, 96, 201–210. [Google Scholar] [CrossRef]
  19. Krishnanand, K.R.; Dash, P.K.; Naeem, M.H. Detection, classification, and location of faults in power transmission lines. Int. J. Electr. Power Energy Syst. 2015, 67, 75–86. [Google Scholar] [CrossRef]
  20. De Yong, D.; Bhowmik, S.; Magnago, F. An effective power quality classifier using wavelet transform and support vector machines. Expert Syst. Appl. 2015, 42, 6075–6081. [Google Scholar] [CrossRef]
  21. Huang, N.; Zhang, S.; Cai, G.; Xu, D. Power quality disturbance recognition based on multiresolution generalizaed S-transform and a PSO-improved decision tree. Energies 2015, 8, 549–572. [Google Scholar] [CrossRef]
  22. Abdelsalam, A.A.; Eldesouky, A.A.; Sallam, A.A. Classification of power system disturbances using linear Kalman filter and fuzzy-expert system. Int. J. Electr. Power Energy Syst. 2012, 43, 688–695. [Google Scholar] [CrossRef]
  23. Shi, S.; Gao, L.; Ma, L.; Chen, Z.; Zhang, Y. Research on flicker measurement algorithm based on FFT. Energy Procedia 2012, 14, 1709–1716. [Google Scholar] [CrossRef]
  24. Ingale, R. Harmonic analysis using FFT and STFT. Int. J. Signal Process. Image Process. Pattern Recogn. 2014, 7, 345–362. [Google Scholar] [CrossRef]
  25. Gonzalez-de-la-Rosa, J.J.; Sierra-Fernandez, J.M.; Palomares-Salas, J.C.; Aguera-Perez, A.; Jimenez-Montero, A. An application of spectral kurtosis to separate hybrid power quality events. Energies 2015, 8, 9777–9793. [Google Scholar] [CrossRef]
  26. Latran, M.B.; Teke, A. A novel wavelet transform based voltage sag/swell detection algorithm. Int. J. Elec. Power. 2015, 71, 131–139. [Google Scholar] [CrossRef]
  27. Arias, S.; Ustariz, A.J.; Cano, E.A. Detection of power quality disturbances using deformation tensor parameters. IEEE Lat. Am. Trans. 2015, 13, 2106–2113. [Google Scholar] [CrossRef]
  28. Hajian, M.; Foroud, A.A. A new hybrid pattern recognition scheme for automatic discrimination of power quality disturbances. Measurement 2014, 51, 265–280. [Google Scholar] [CrossRef]
  29. Kapoor, R.; Gupta, R. Classification of power quality disturbances using non-linear dimension reduction. Electr. Eng. 2013, 95, 147–156. [Google Scholar] [CrossRef]
  30. Bai, J.; Gu, W.; Yuam, X.; Li, Q.; Xue, F.; Wang, X. Power quality prediction, early warning, and control for points of common coupling with wind farms. Energies 2015, 8, 9365–9382. [Google Scholar] [CrossRef]
  31. Huang, N.E.; Shen, Z.; Long, S.R.; Wu, M.C.; Shih, H.H.; Zheng, Q.; Yen, N.C.; Tung, C.C.; Liu, H.H. The empirical mode decomposition and the Hilbert spectrum for nonlinear and non-stationary time series analysis. R. Soc. Lond. Proc. Ser. A 1998, 454, 903–995. [Google Scholar] [CrossRef]
  32. Khokhar, S.; Zin, A.A.B.M.; Mokhtar, A.S.B.; Pesaran, M. A comprehensive overview on signal processing and artificial intelligence techniques applications in classification of power quality disturbances. Renew. Sustain. Energy Rev. 2015, 51, 1650–1663. [Google Scholar] [CrossRef]
  33. Khatri, M. Power quality event detection, monitoring and improvement: A survey. Int. J. Technol. Enhance. Emerg. Eng. Res. 2015, 3, 67–73. [Google Scholar]
  34. Perveen, R.; Kishor, N.; Mohanty, S.R. Fault detection for offshore wind farm connected to onshore grid via voltage source converter-high voltage direct current. IET Gener. Transm. Dis. 2015, 9, 2544–2554. [Google Scholar] [CrossRef]
  35. Ramesh-Babu, N.; Jagan-Mohan, B. Fault classification in power systems using EMD and SVM. Ain Shams Eng. J. 2016, PP, 1–9. [Google Scholar] [CrossRef]
  36. Vergura, S.; Zivieri, R.; Carpentieri, M. Indices to study the electrical power signals in active and passive distribution lines: A combined analysis with empirical mode decomposition. Energies 2016, 9, 211. [Google Scholar] [CrossRef]
  37. Shukla, S.; Mishra, S.; Singh, B. Power quality event classification under noisy conditions using EMD-based de-noising techniques. IEEE Trans. Ind. Infrom. 2014, 10, 1044–1054. [Google Scholar] [CrossRef]
  38. Mahela, O.P.; Shaik, A.G. Topological aspects of power quality improvement techniques: A comprehensive overview. Renew. Sustain. Energy Rev. 2016, 58, 1129–1142. [Google Scholar] [CrossRef]
  39. Eristi, H.; Ucar, A.; Demir, Y. Wavelet-based feature extraction and selection for classification of power system disturbances using support vector machines. Electr. Power Syst. Res. 2010, 80, 743–752. [Google Scholar] [CrossRef]
  40. Decanini, J.G.M.S.; Tonelli-Neto, M.S.; Malange, C.V.; Minussi, C.R. Detection and classification of voltage disturbances using a Fuzzy-ARTMAP-wavelet network. Electr. Power Syst. Res. 2011, 81, 2057–2065. [Google Scholar] [CrossRef]
  41. Manimala, K.; Selvi, K.; Ahila, R. Optimization techniques for improving power quality data mining using wavelet packet based support vector machine. Neurocomputing 2012, 77, 36–47. [Google Scholar] [CrossRef]
  42. Shannon, C.E. A mathematical theory of communication. Bell Syst. Tech. J. 1948, 27, 379–423. [Google Scholar] [CrossRef]
  43. Hernandez-Vargas, M.; Cabal-Yepez, E.; Garcia-Perez, A. Real-time SVD-based detection of multiple combined faults in induction motors. Comput. Electr. Eng. 2014, 40, 2193–2203. [Google Scholar] [CrossRef]
  44. Deperlioglu, O.; Kose, U. An educational tool for artificial neural networks. Comput. Electr. Eng. 2011, 37, 392–402. [Google Scholar] [CrossRef]
  45. Khokhar, S.; Mohd Zin, A.A.; Mokhtar, A.S.; Ismail, N. MATLAB/Simulink based modeling and simulation of power quality disturbances. In Proceedings of the 2014 IEEE Conference on Energy Conversion (CENCON), Johor Bahru, Malaysia, 13–14 October 2014; pp. 445–450.
  46. Hooshmand, R.; Enshaee, A. Detection and classification of single and combined power quality disturbances using fuzzy systems oriented by particle swarm optimization algorithm. Electr. Pow. Syst. Res. 2010, 80, 1552–1561. [Google Scholar] [CrossRef]
  47. Bollen, M.H.J.; Gu, I.Y.H. Characterization of voltage variations in the very-short time-scale. IEEE Trans. Power Deliv. 2005, 20, 1198–1199. [Google Scholar] [CrossRef]
  48. Bollen, M.H.J. What is power quality? Electr. Power Syst. Res. 2003, 66, 5–14. [Google Scholar] [CrossRef]
  49. Bollen, M.H.J. Understanding Power Quality Problems: Voltage Sags and Interruptions, 1st ed.; Wiley-IEEE Press: Piscataway, NJ, USA, 1999. [Google Scholar]
  50. Programmable AC Power Source—Model. 61700 Series; Chroma ATE Inc.: Taoyuan County, Taiwan, 2000; Available online: http://www.chromausa.com/document-library/user-manuals-61700/ (accessed on 19 January 2016).
Figure 1. First six IMFs of a sine signal with noise.
Energies 09 00565 g001
Figure 2. Architecture of an MLP ANN.
Energies 09 00565 g002
Figure 3. Architecture of an ANN processing neuron j.
Energies 09 00565 g003
Figure 4. Flow chart of the proposed methodology for PQD classification.
Energies 09 00565 g004
Figure 5. Signals obtained from the mathematical models described in Table 1, for PQD detection and classification.
Energies 09 00565 g005
Figure 6. Event Magnitude vs. its duration (event duration) for disturbance designation [49].
Energies 09 00565 g006
Figure 7. Three-dimensional projections for first five IMFs.
Energies 09 00565 g007
Figure 8. Experimental test bed for testing the proposed methodology performance on detecting and classifying PQD. (a) Chroma Programmable AC Power Source; (b) Instrumentation for the DAS.
Energies 09 00565 g008
Figure 9. Experimental PQD signals obtained through the test bed.
Energies 09 00565 g009
Table 1. Mathematical definition for the treated PQD.
ReferencesPQDModel T ≤ t2 − t1 ≤ 9ParametersClass
[17,39,40,41,45,46]Pure Sine f ( t ) = A * s i n ( ω t ) A
[17,39,40,41,45,46]Sag f ( t ) = A ( 1 α ( u ( t t 1 ) u ( t t 2 ) ) ) * s i n ( ω t ) 0.1 ≤ α ≤ 0.9B
[17,39,40,41,45,46]Swell f ( t ) = A ( 1 + α ( u ( t t 1 ) u ( t t 2 ) ) ) * s i n ( ω t ) 0.1 ≤ α ≤ 0.8.C
[17],[39,40,41]*,[45,46]Outage f ( t ) = A ( 1 α ( u ( t t 1 ) u ( t t 2 ) ) ) * s i n ( ω t ) 0.9 ≤ α ≤ 1D
[17],[39,40,41]*,[45,46]Harmonic f ( t ) = A ( s i n ( ω t ) + α 3 s i n ( 3 ω t ) + α 5 s i n ( 5 ω t ) ) 0.1 ≤ α3 ≤ 0.2
0.05 ≤ α5 ≤ 0.1
0.1 ≤ α ≤ 0.9
E
[28,39,40,41,46]Harmonic sag f ( t ) = A ( 1 α ( u ( t t 1 ) u ( t t 2 ) ) ) *     ( s i n ( ω t ) + α 3 s i n ( 3 ω t ) + α 5 s i n ( 5 ω t ) ) F
[28,39,40,41,46]Harmonic swell f ( t ) = A ( 1 + α ( u ( t t 1 ) u ( t t 2 ) ) ) *     ( s i n ( ω t ) + α 3 s i n ( 3 ω t ) + α 5 s i n ( 5 ω t ) ) 0.1 ≤ α3 ≤ 0.2
0.05 ≤ α5 ≤ 0.1
0.1 ≤ α ≤ 0.8
G
[17,28,39,40,41,46]High frequency transient f ( t ) = A s i n ( ω t ) + α e t λ s i n ( b ω t ) 20 ≤ b ≤ 80
0.1 ≤ λ ≤ 0.2
0.1 ≤ α ≤ 0.9
H
[17,28,39,40,41,46]Low frequency transient f ( t ) = A s i n ( ω t ) + α e t λ s i n ( b ω t ) 5 ≤ b ≤ 20
0.1 ≤ λ ≤ 0.2
0.1 ≤ α ≤ 0.9
I
Table 2. Maximum and minimum THD (%) for each class.
ClassABCDEFGHI
THD min0.183.592.9215.9112.0912.6612.382.644.70
THD max5.596.665.9721.1321.7421.9621.966.4611.53
Table 3. MLP structure and training parameters.
Architecture
Number of layers3
Number of Neurons in the layersInput = 15, hidden = 28, output = 9
Initial weights and biasesRandom
Activation functionSigmoid
Training
Learning ruleLevenberg-Marquardt back-propagation
Mean-square error1 × 10−8
Table 4. PQD classification through voltage/current signals with random noise.
ClassABCDEFGHIAccuracy %
A30000000000100
B03000000000100
C00300000000100
D00030000000100
E00003000000100
F00000300000100
G00000030000100
H00000003000100
I00000000300100
Overall success rate100
Table 5. PQD classification effectiveness (%) of the proposed methodology.
Class20 dB30 dB40 dB50 dB
A100100100100
B99.3399.66100100
C9799.66100100
D10095.669999.66
E1009899.66100
F1009597.33100
G98.6610097.3399.66
H10010099.66100
I10010010099.33
Overall99.4498.6699.2299.85
Table 6. PQD classification effectiveness (%) of the proposed methodology analyzing real voltage/current signals in 50 trials.
ClassABCDEFGHI
Effectiveness100%100%100%100%100%100%100%100%100%
Table 7. Effectiveness (%) comparison of the proposed methodology against previous approaches in reviewed literature.
ClassABCDEFGHIOverall
[17] DWT-FFT10098.295.610098.198.298.6----98.498.4
[28] DWT-Hyperbolic S-Transform------------------------------------99.2
[39] Wavelet-SVM10092.51009998.59798--------97.9
[40] Fuzzy-ARTMAP -wavelet----98.510010099.799.2100--------99.6
[41] WPT-SVM----96.710093.310096.7100--------97.8
ProposedSimulation10099.39710010010098.710010099.4
MethodExperimental100100100100100100100100100100

