Article

Understanding the Contribution of Mining and Transportation to the Total Life Cycle Impacts of Coal Exported from the United States

1
Contractor to the National Energy Technology Laboratory, 626 Cochrans Mill Road, P.O. Box 10940, Pittsburgh, PA 15236, USA
2
National Energy Technology Laboratory, 626 Cochrans Mill Road, P.O. Box 10940, Pittsburgh, PA 15236, USA
*
Author to whom correspondence should be addressed.
Energies 2016, 9(7), 559; https://doi.org/10.3390/en9070559
Submission received: 15 April 2016 / Revised: 17 June 2016 / Accepted: 30 June 2016 / Published: 19 July 2016
(This article belongs to the Special Issue Life-Cycle Assessment of Energy Systems in Current and Evolving Grids)

Abstract

:
The construction of two marine bulk terminals in the Pacific Northwest region of the United States are currently under review and would open up additional thermal coal exports to Asia on the order of almost 100 million additional tonnes per year. The major exporters of coal to Asian markets include Indonesia and Australia. This life cycle analysis (LCA) seeks to understand the role of transportation and mining in the cradle-to-busbar environmental impacts of coal exports from the Powder River Basin (PRB) to Asian countries, when compared to the competitor countries. This LCA shows that: (1) the most significant greenhouse gas (GHG) impacts in the cradle-to-busbar life cycle of coal for power generation come from the combustion of coal in a power plant, even when 90% carbon capture is applied; (2) for non-GHG air impacts, power plant combustion impacts are less dominant and variations in upstream impacts (mining and transportation) are more important; and (3) when comparing impacts between countries, upstream impacts vary for both GHG and non-GHG results, but conclusions that rank countries cannot be made. Future research should include expansion to include non-air impacts, potential consequential effects of coal exports, and a better understanding around the characterization of non-GHG ocean transport impacts.

Graphical Abstract

1. Introduction

The production and consumption of coal in the United States (U.S.) has declined in recent years due to low natural gas prices, stagnant growth of electricity demand, and stricter environmental regulations [1,2,3]. From 2005 to 2012, U.S. coal consumption was down by 19%, but production was only down by 10%, resulting in an increase of coal available for export [4,5,6]. Much of the available coal is from the Powder River Basin (PRB), a region in Montana and Wyoming that produces subbituminous coal [6]. To facilitate a potential increase in coal exports, there are proposed export terminals or expansions of existing terminals on both coasts of the United States, with those on the West Coast specifically focused exports of thermal coal to Asia [7,8]. Two projects under review are the Gateway Pacific Terminal and the Millennium Bulk Terminal, both in the state of Washington, with a combined potential export capacity of approximately 100 million metric tons (mmt) [7]. A previous life cycle assessment/analysis (LCA) study by Bohnengal et al. on coal exports compared the environmental impact of exporting coal for power versus using it domestically for power, with a focus on some of the possible consequential effects [9]. This LCA looks at the environmental implications of using imported coal to generate electricity in Asian markets, with a particular focus on the differences that mining and transportation from the United States and other potential exporters have on the results.
The scope of this LCA is a cradle-to-busbar (material extraction to electricity generation) comparison of one megawatt hour (MWh) of electricity generated at an unspecified power plant in Asia using PRB coal exported from the United States with the same MWh generated from regional coal alternatives. Indonesia and Australia are deemed to be competitor countries to the United States, because they are significant exporters (at 423 mmt and 182 mmt, respectively in 2013) [10], while Japan, South Korea and Taiwan are assumed to be the destinations, because they currently import large amounts of coal [11]. There are 12 unique modeled cases in this analysis in order to represent each potential combination of export and import country (including two coal types in Indonesia). In addition, the results include scenarios with and without 90% carbon capture and storage (CCS) of carbon dioxide (CO2) emissions at the power plant.
This analysis does not scale the results based on the relative contribution of coal exports by each country; each country is assumed to export the amount of coal necessary to produce one MWh of electricity. This LCA assumes that the power plant in each importing country is an advanced technology power plant with best available technology emission controls (i.e., an ultra-super critical pulverized coal (USCPC) plant). The USCPC plant design was previously modeled by The National Energy Technology Laboratory (NETL) [12]. The USCPC assumption is made because the increase in coal imports by the destination countries is assumed to satisfy the marginal demand for electricity (i.e., the exported coal is utilized to generate additional electricity in a new power plant rather than displacing existing sources of electricity). As such, this analysis is attributional in nature. No consequential effects, such as the displacement of other power generation technologies, have been considered. The boundaries of the system for this study are shown in Figure 1.
Publically available data and studies on the coal supply chain and cradle-to-busbar LCAs on coal power production are limited. NETL has conducted LCA research on coal power production and Bohnengal et al. produced a study on coal exports [9,13,14]. The scope of this study is broader than previous studies. The Bohnengal et al. [9] study was focused on the impact of a coal exports from a specific coal terminal facility in Oregon, while this study seeks to compare multiple exporters. Previous NETL studies do not include the exportation of coal within their study boundaries, while this study does. Coal exports are studied more extensively from an economic perspective. The International Energy Agency (IEA) periodically releases analyses on coal exports trends using economic modeling [11].
This LCA relies on a combination of publically available data and information provided by industry experts on coal export supply chains to construct a life cycle model. The main contribution of this study is to use LCA to put the three coal exporting countries on a common basis, so that the environmental impacts of mining and transportation can be compared. This study focuses mostly on air impacts, especially, greenhouse gases. While other impacts, such as land use impacts, are likely important to the comparative life cycle for each country, they are outside the scope of this study.

2. Results

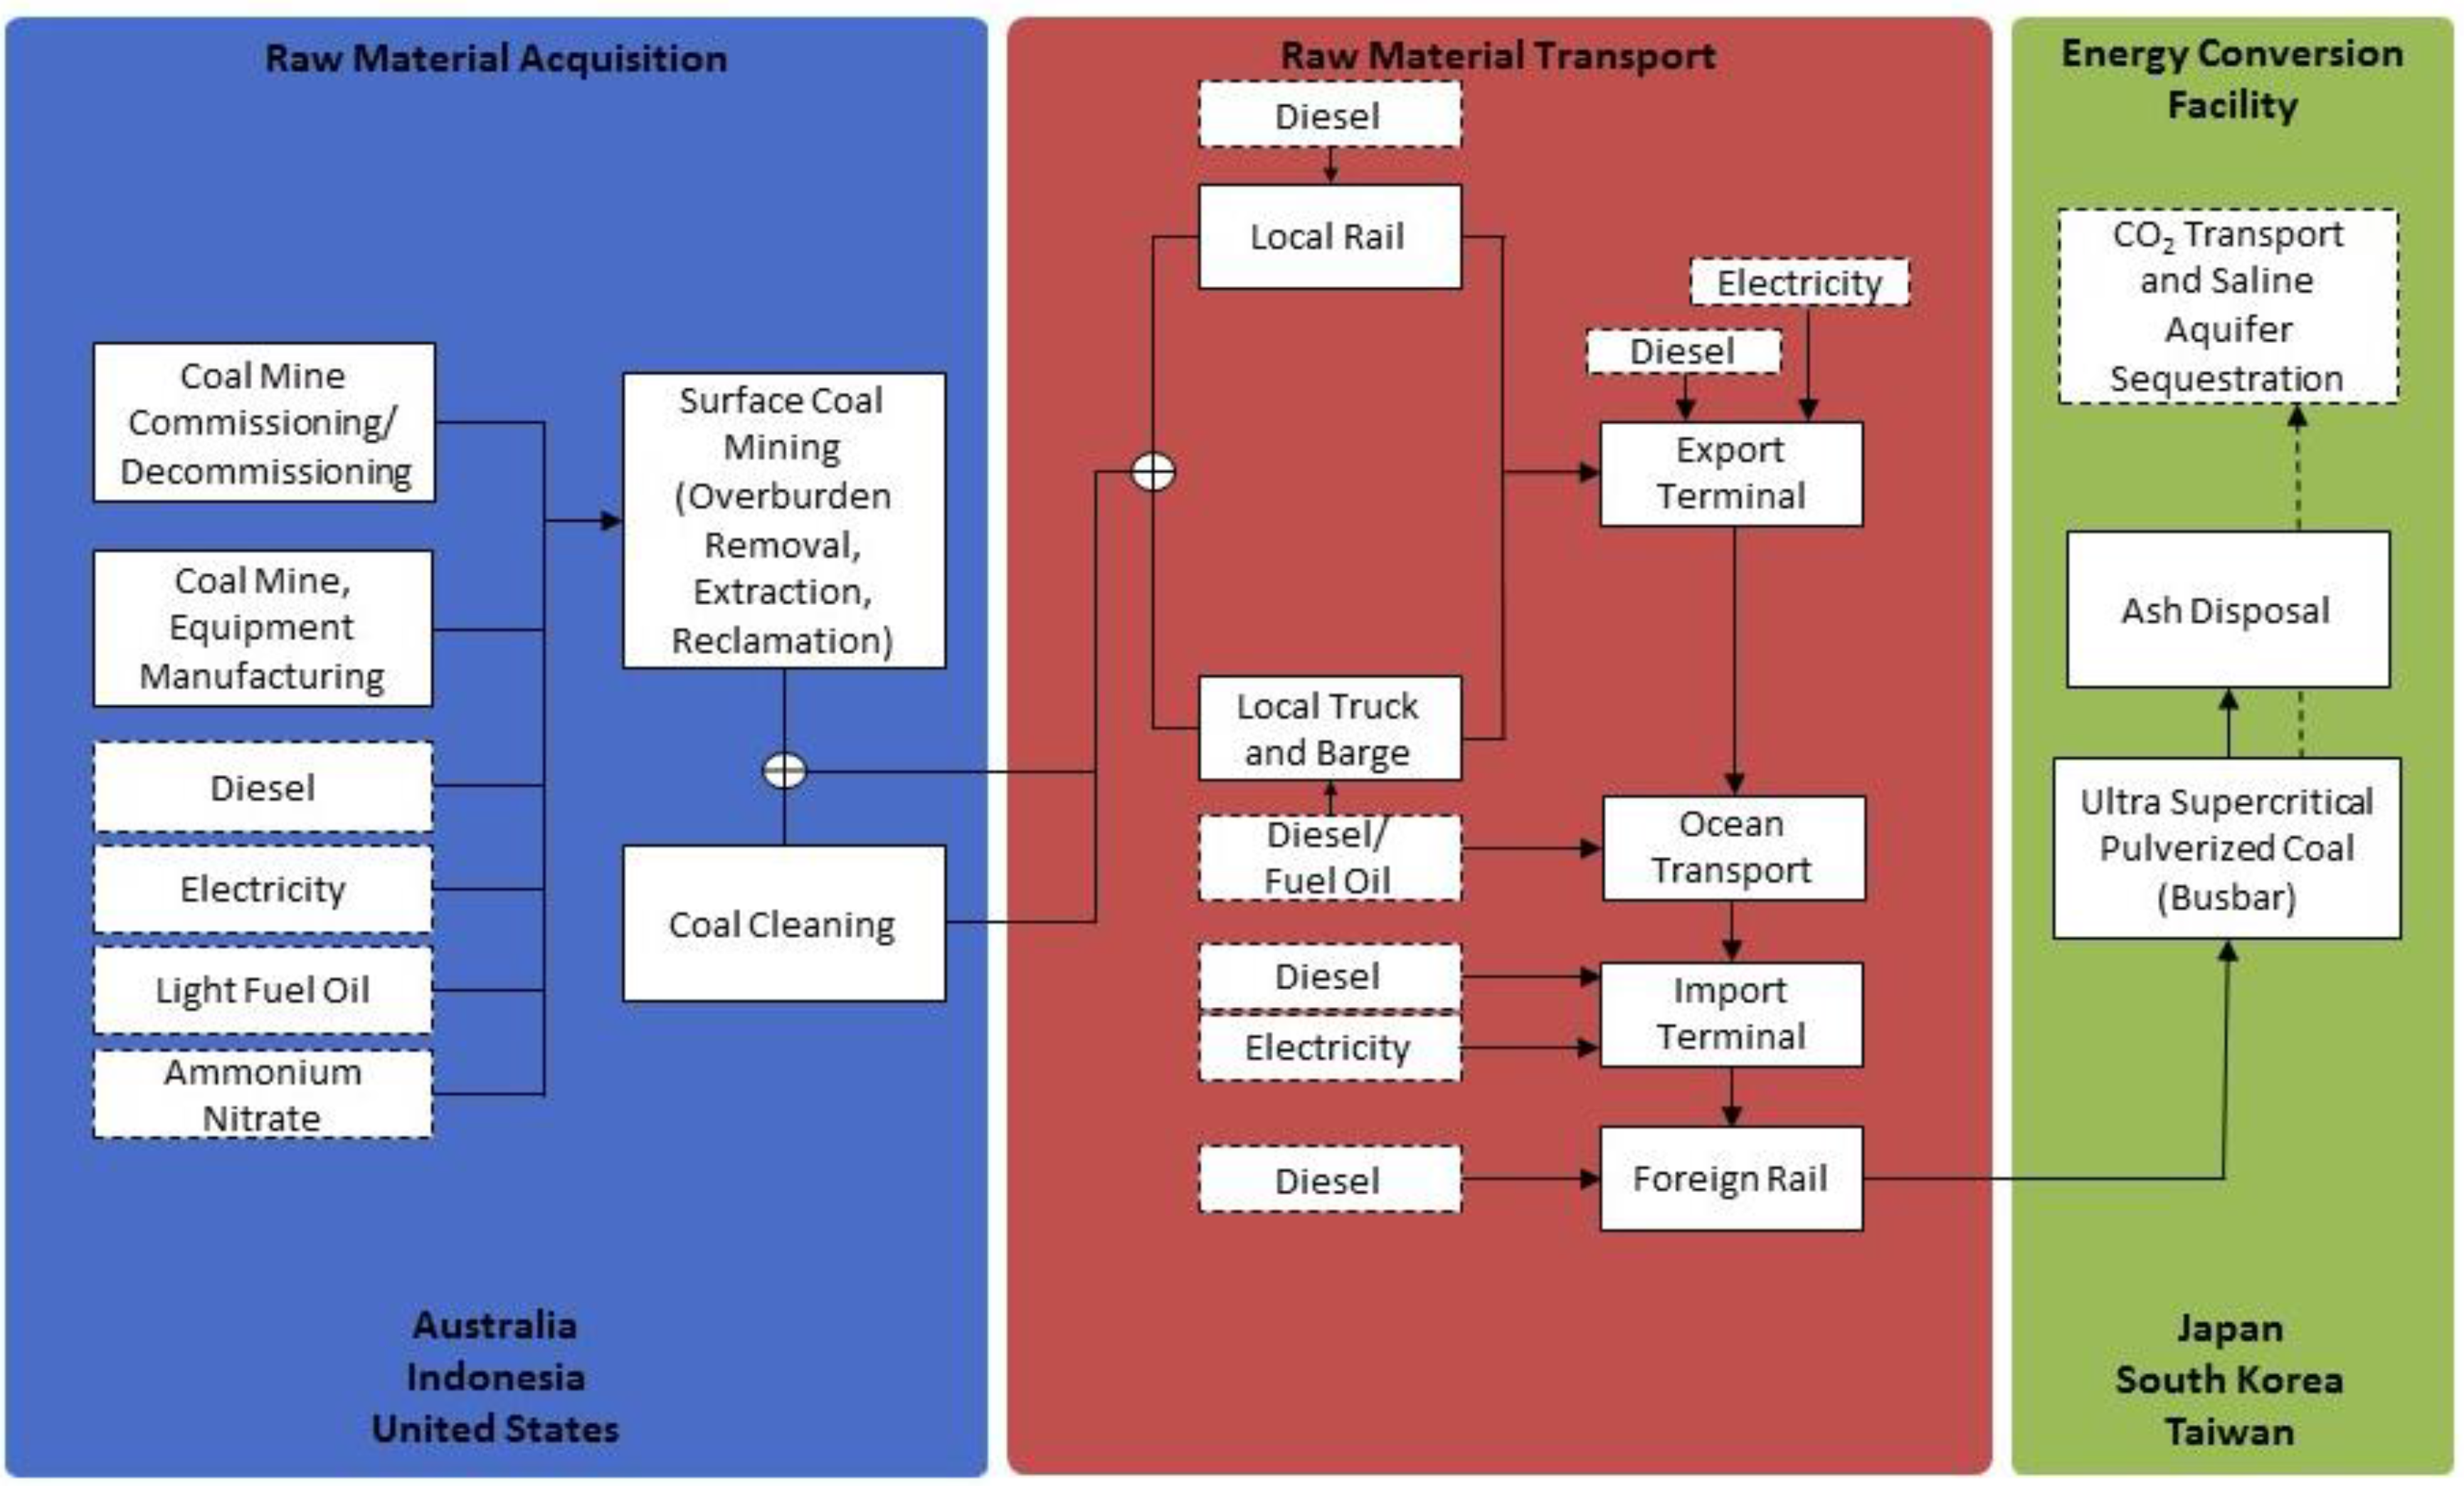
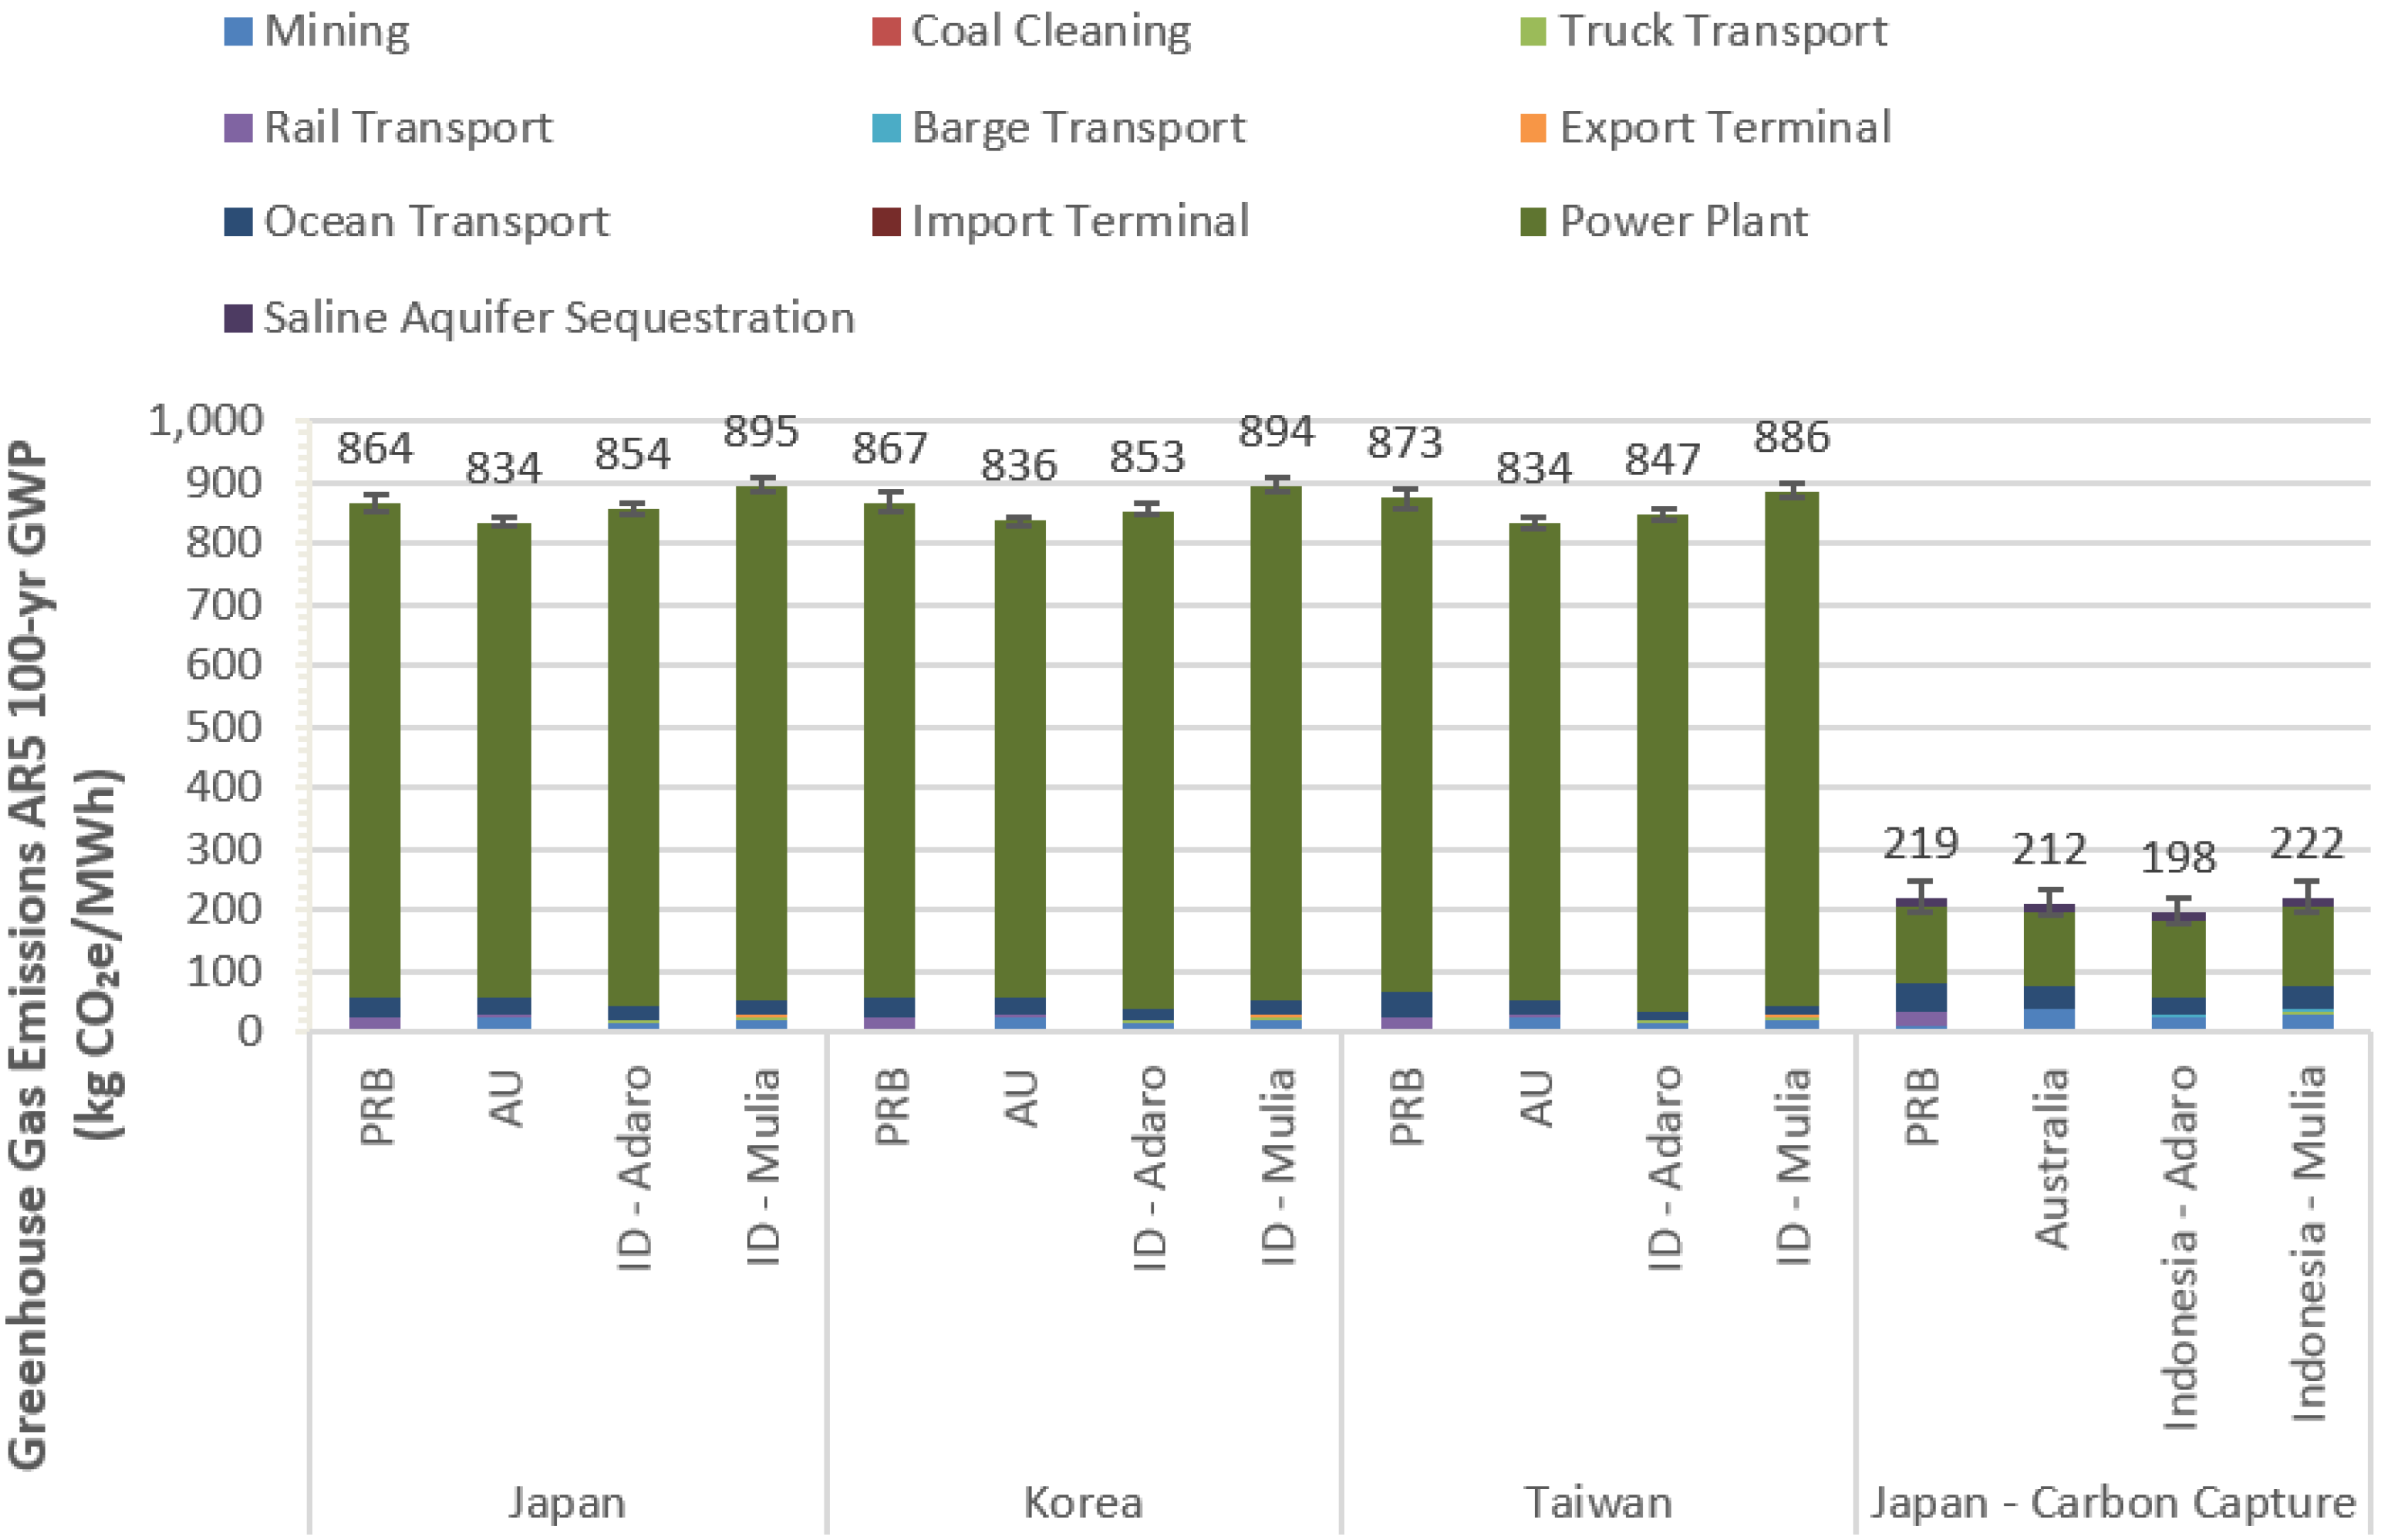
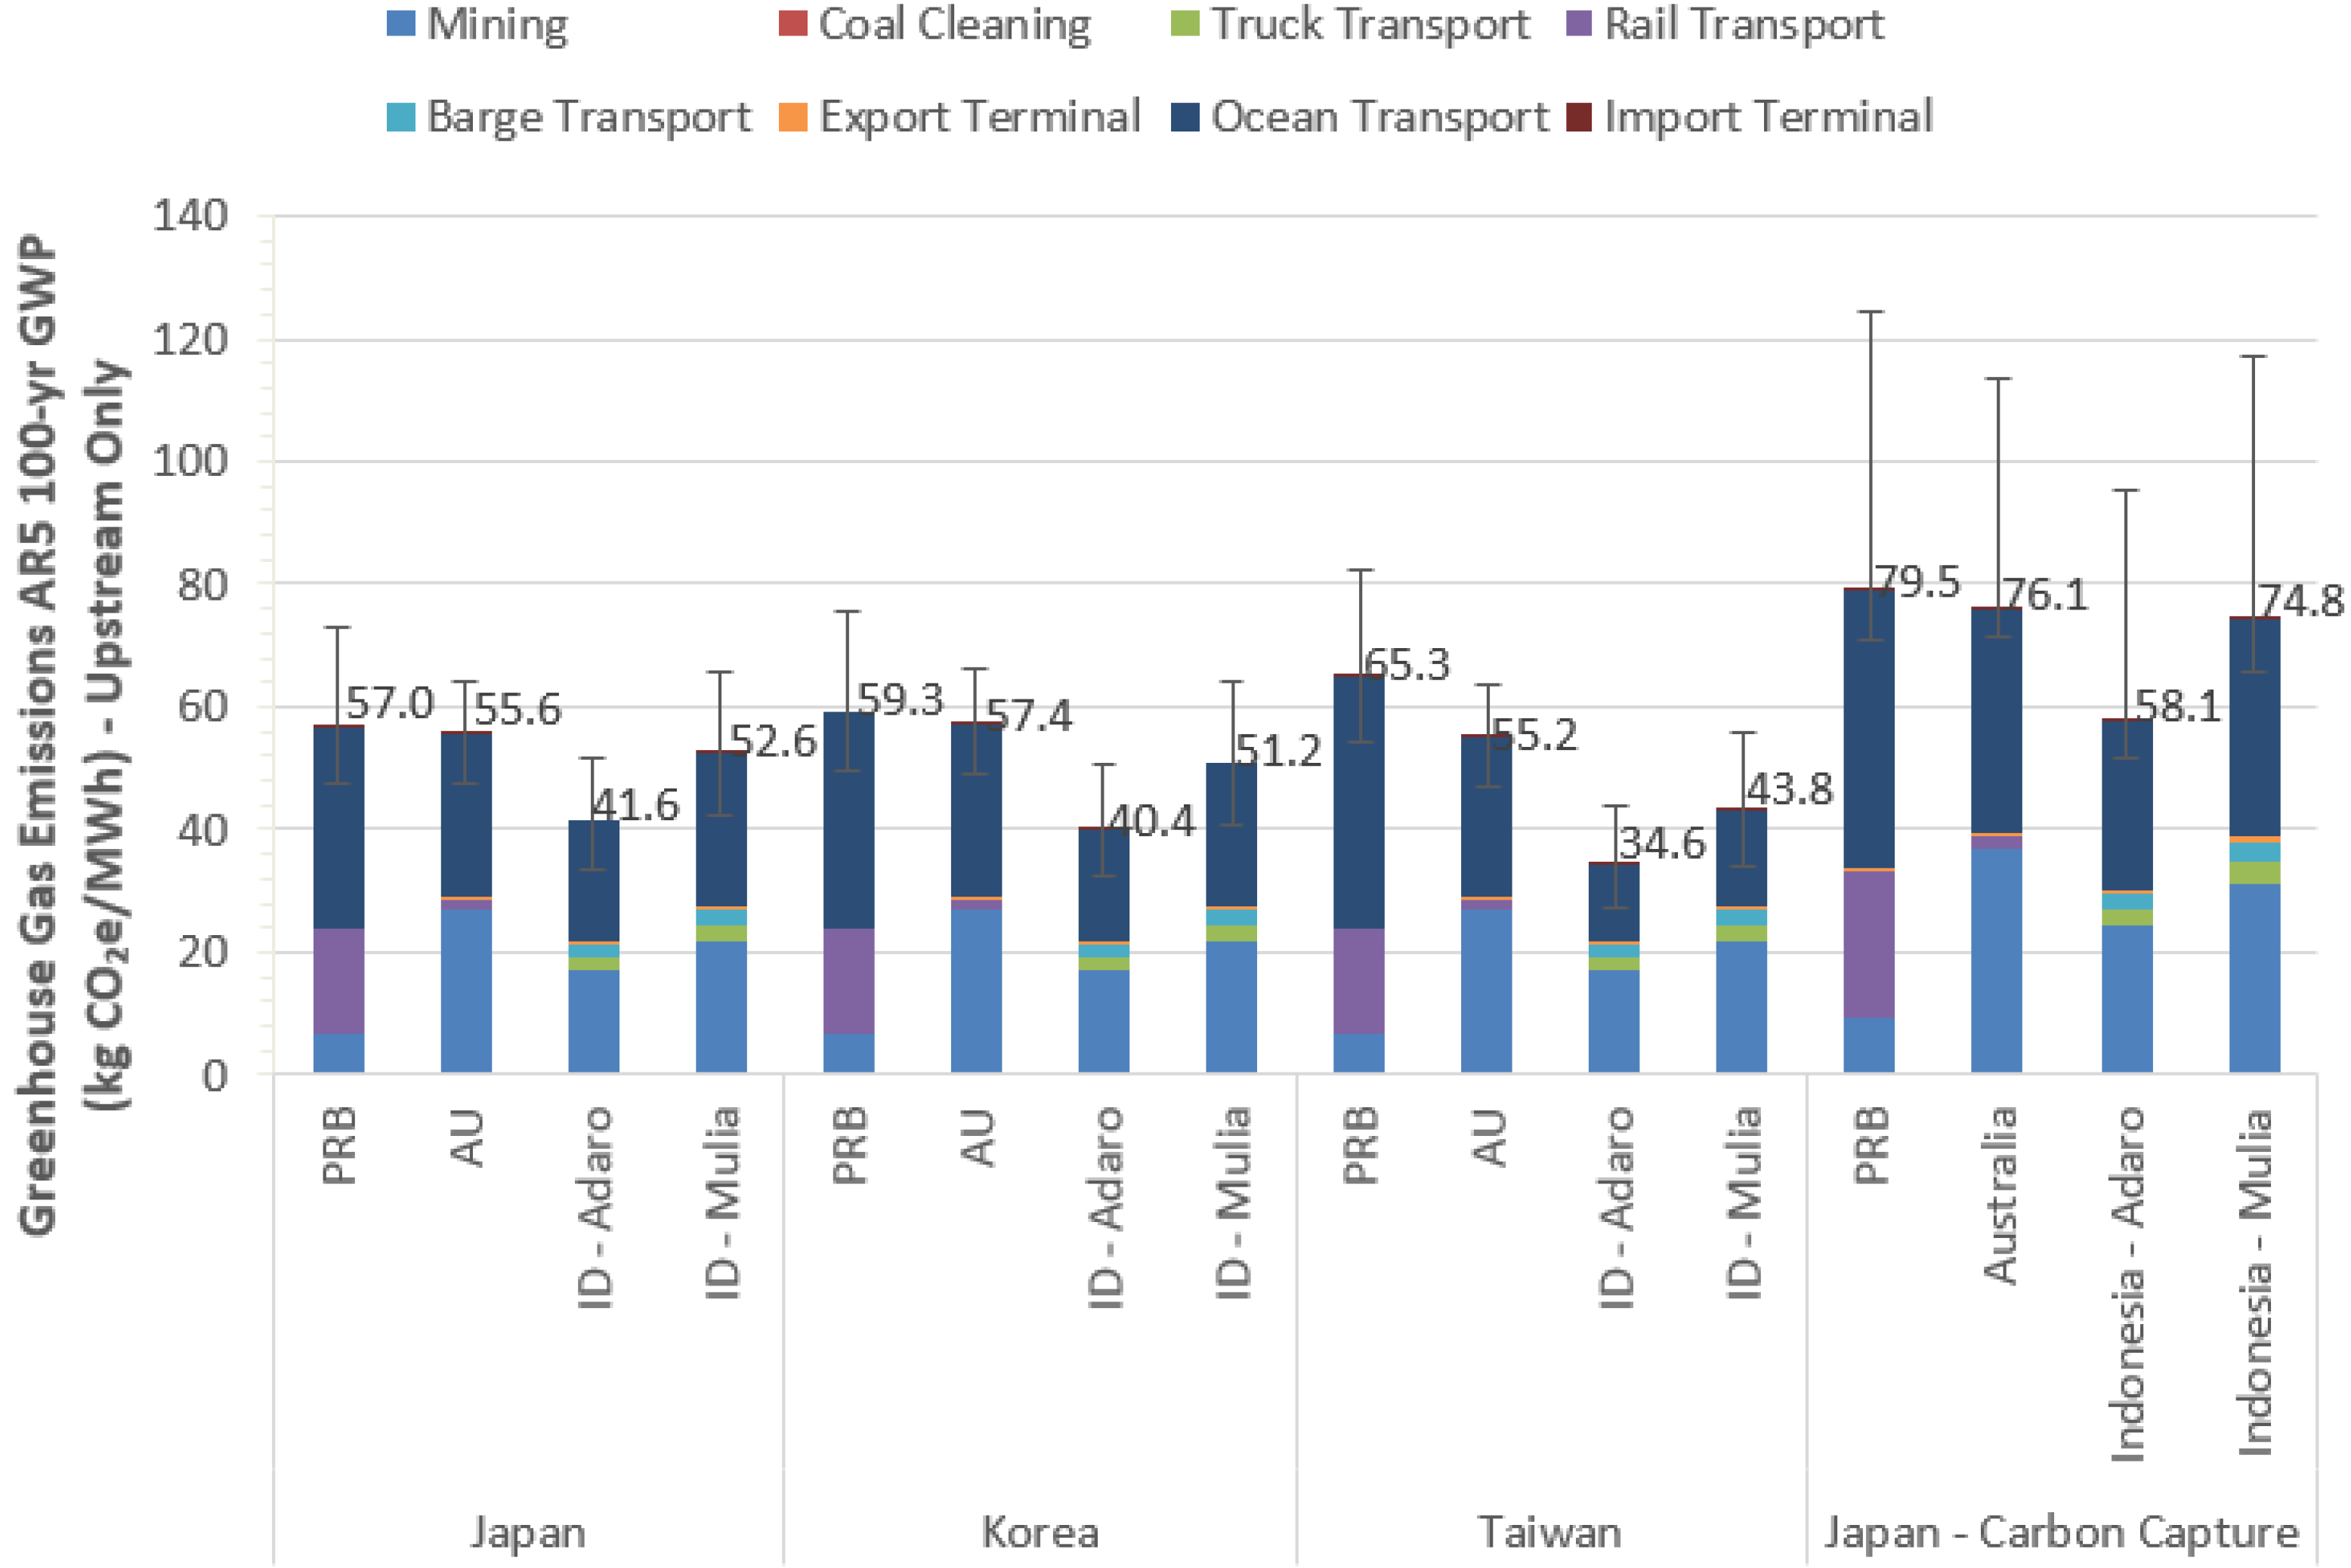
2.1. Life Cycle GHG Results

Figure 2 depicts the cradle-to-busbar life cycle greenhouse gas (GHG) results for all four coal sources (U.S. PRB, Australian Hunter Valley, Indonesian Adaro, and Indonesian Mulia) and three prospective destinations (Japan, South Korea, and Taiwan) in kilograms of carbon dioxide equivalents per MWH (kg CO2e/MWh). Figure 2 also includes 90% CCS cases for Japan only. CCS cases for South Korea and Taiwan are not included because they are very similar to the Japan results. GHGs are reported as 100-year CO2e using the Intergovernmental Panel on Climate Change (IPCC) Fifth Assessment Report (AR5) [15]. The uncertainty bars included in Figure 2 are informed by the parameter ranges detailed in the Materials and Methods section. The width of the bars in Figure 3 represents the uncertainty ranges for all of the scenarios depicted in Figure 2. Tabular results for Figure 2 are available in Table S1 in the Supplementary Materials. Complete tabular results for this study are available in Appendix B.
Depending on the scenario, 92.5% to 96.1% of the cradle-to-busbar emissions are from the combustion of coal at the destination power plant. Coal mining activities account for 0.8% to 3.3%, while transport accounts for 2.0% to 6.7%. Power plant combustion emissions range from 772 kg CO2e/MWh (Australia) to 835 kg CO2e/MWh (Indonesian Mulia). The emissions from the combustion of PRB are approximately 800 kg CO2e/MWh. Differences in the power plant emission factors are driven by the differences in coal quality, which ultimately impacts the efficiency of the power plant.
The results from Figure 2 are shown in Figure 4 with the contributions from the power plant removed. The basis for the results in Figure 4 is still one MWh of electricity. The purpose for excluding the power plant emissions is to allow for closer inspection of the differences between the activities upstream of the coal power plant. Figure 4 shows that mining impacts are highest in Australia and transportation impacts are highest in the PRB. Impacts for CCS in Figure 4 are higher because additional energy is required to capture carbon at the power plant; this additional coal needed increases the upstream impacts. The magnitude of the uncertainty bars are the same as those in Figure 2; they are just easier to see in Figure 4 with power plant combustion removed. Detailed life cycle GHG result with a breakdown of individual GHG contributions (drilldowns) for coal shipped to Japan are provided in Figures S1 and S2 in the Supplementary Materials. Complete tabular results for this study are available in Appendix B.

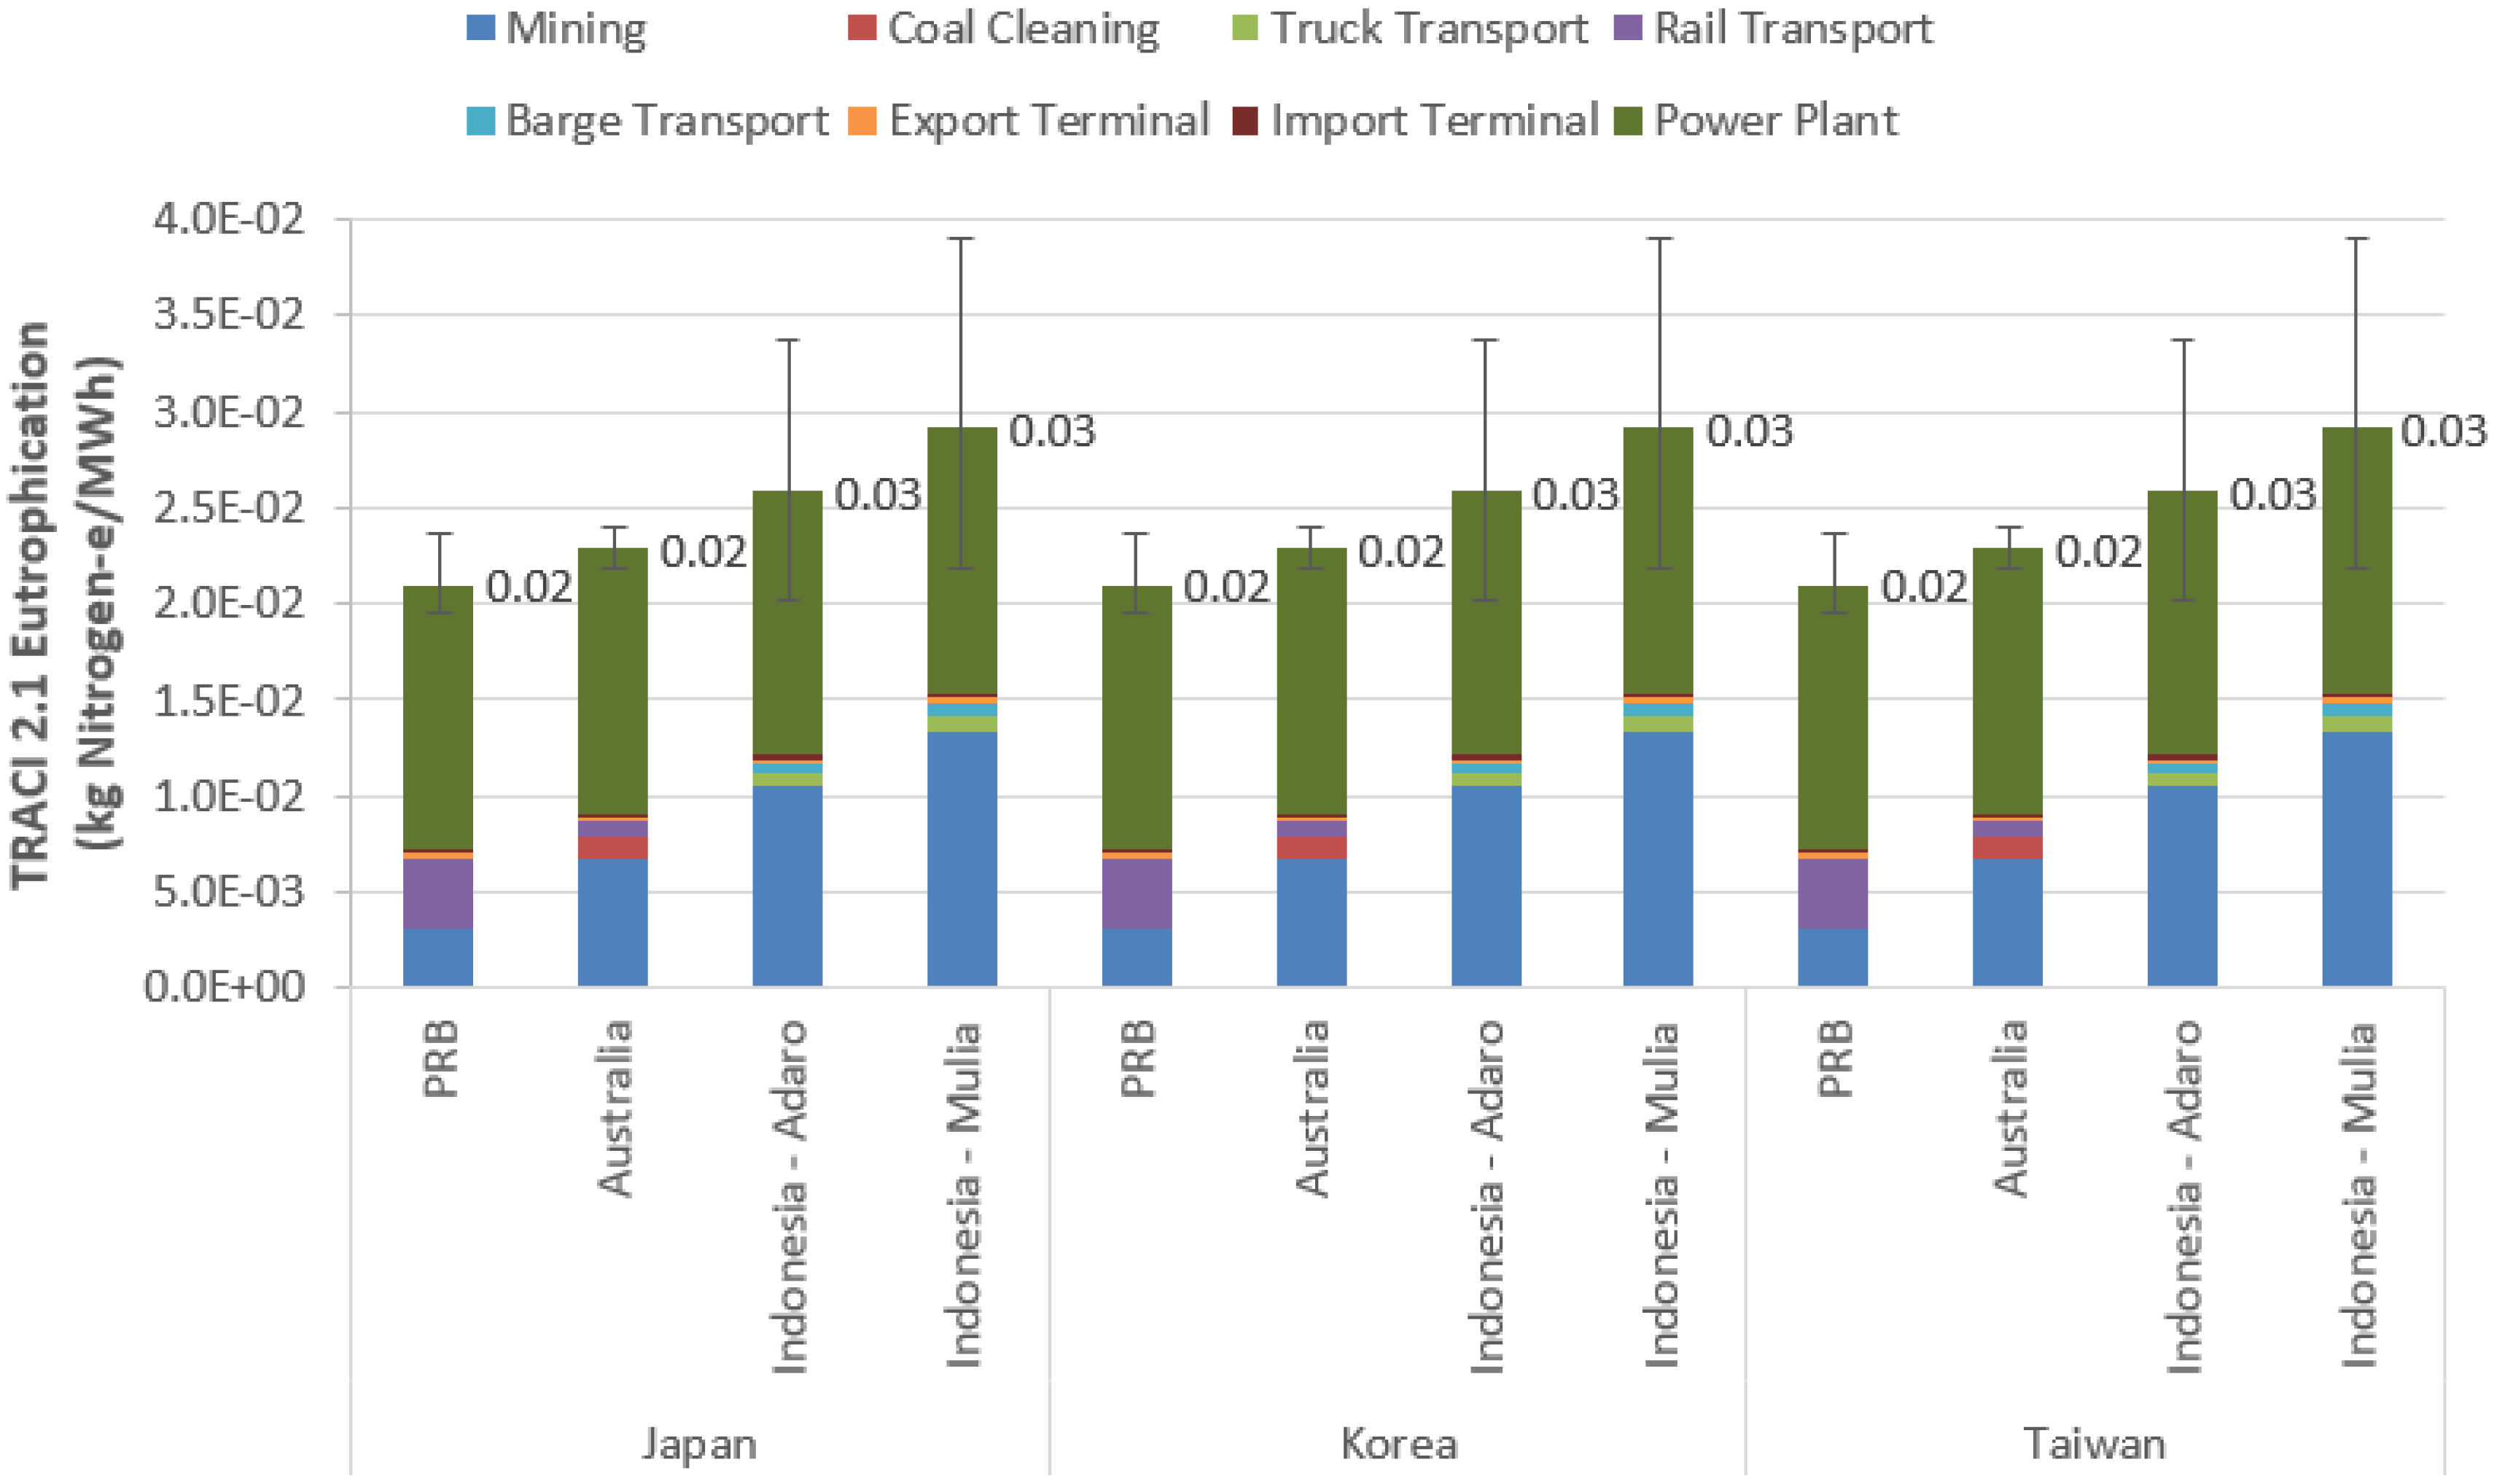
2.2. TRACI 2.1 Impact Assessment Results

Impact assessment results utilizing a modified version of the Environmental Protection Agency’s (EPA’s) Tool for the Reduction and Assessment of Chemical and Other Environmental Impacts (TRACI) Version 2.1 method [16] are presented in this section for the following impact categories: acidification, eutrophication, human health particulate, and smog formation. Five TRACI impact categories are not included in the results of this analysis: global warming, ecotoxicity, human health toxicity (cancer), human health toxicity (non-cancer), and ozone depletion. These categories are not included in the TRACI analysis due to data limitations which did not allow for the proper characterization and interpretation of the comparative impacts across the life cycle of the modeled scenarios. Global warming is analyzed in the GHG analysis described in the previous section and those results are added to the graphs that show TRACI results for comparison.
Figure 5 shows the normalized TRACI 2.1 results plus the previous GHG results, with ocean transport impacts removed. Ocean transport impacts in the four TRACI categories were removed in Figure 5 due to lack of understanding about the implications of reporting localized impacts of air emissions in the middle of the ocean. This is an area for further research as it is not clear what the impacts are given that the ocean is a large sink and not usually close to any human population centers. Figure 6 shows what the results look like when ocean transport is included in the results. The main difference between Figure 5 and Figure 6 is a change in the coal source rankings on the basis of lowest environmental impact.
For the TRACI Eutrophication impact category (measured in nitrogen equivalents (nitrogen-e)), shown in Figure 7, 98% to 99% of the impacts come from emissions of NOx. For the PRB cases, power plant combustion accounts for 31% to 75% of the eutrophication impacts, while rail transport accounts for 10% to 61%. The eutrophication impacts are higher for the Australian and Indonesian sources due to delayed or no implementation of Tier IV diesel engine standards. As a result of the higher strip ratios for Australian and Indonesian coal and higher diesel use for Indonesian extraction, the mining activities account for a larger percentage of the total eutrophication impacts at 29% to 30% and 36% to 46%, respectively.
Similar discussions and detailed results are presented for the acidification, human health particulate, and smog impact categories in the Supplementary Materials. Complete tabular results for this study are available in Appendix B.

3. Discussion

3.1. Implications of the Results

Figure 2 shows that the GHG impacts of coal mining, processing, and transport from one country to another are much smaller than the impact of burning coal in a power plant for electricity generation. This is not an unexpected result, and the significant GHG impact of coal combustion is generally known. More interesting is that Figure 2 also shows that while 90% CCS reduces GHG emissions significantly, power plant impacts are still the major source of GHG emissions.
One key takeaway from the results presented in Figure 2 is that no significant conclusion can be made about the absolute difference between countries. First, the destination for the coal does not contribute much variability to the life cycle results. For example, the results for Australian coal range from 834 to 836 kg CO2e/MWh depending on the destination. Second, the rank order of expected values for the coal sources do not change given the destination. Finally, given the uncertainty in the model parameter values, there is not a definitive difference between the life cycle GHG profiles between sourcing coal from the United States (PRB), Australia, or Indonesia for Japan, South Korea, or Taiwan in this analysis. Figure 3 illustrates that, relative to PRB uncertainty, the other coals’ uncertainties overlap with PRB or are close to overlapping. It may be possible to rank the coals on the extreme edges of the uncertainty range, but generally, no definitive conclusion can be made about the rank order of import/export scenarios by GHG impact; this study cannot say that one export country is a better choice for coal exports than another.
A similar conclusion can be made about the TRACI results. The absolute difference between countries is generally small and uncertainty bars overlap. The uncertainty surrounding the inclusion of ocean transport impacts adds an additional layer that makes such ranking conclusions difficult. What can be said about the TRACI results is that the upstream impacts are more important to the overall lifecycle than they are for the GHG results.
The main area of discussion in this paper is the relative differences between countries in different activity categories. Emissions associated with coal mining activities are much more significant in Australia and Indonesia compared to the PRB. Both countries have considerably higher strip ratios (ratio of overburden to coal) compared to the PRB, meaning that more overburden must be removed for each unit of coal produced. Additionally, the coal mine methane emissions from Australia and Indonesia are 3.5 to 5 times higher than those modeled as the expected value for the PRB. Finally, Australian coal is processed at a coal cleaning facility prior to export. The direct impacts of the coal cleaning facility are small; however, the indirect effects of scaling up mining activities to yield one unit of exportable coal increase the emissions associated with mining.
Transportation activities can be split into two categories: domestic and international. Domestic transportation is required to get the coal from the mine to export terminal. International travel via ocean freighter carries the coal from the export terminal to the import terminal located in the destination country. It is assumed that there is no local travel in the destination country as there are power plants located adjacent to the import terminals. The domestic transportation component is much more significant for coal from the PRB compared to coals sourced from Australia or Indonesia. This is due entirely to the proximity of the coal mine to the export terminal. Coal sourced from the PRB is transported an expected distance of 2000 km by rail, while coal sourced in Australia and Indonesia travels only 225 and 329 km, respectively.
Another important factor impacting emissions from transport and mining is the differences in diesel use and the status of diesel fuel and engine regulations in the exporting country. Based on information from industry experts [17], we assume that Indonesia uses a lot of smaller, diesel-powered equipment, rather than larger diesel equipment or electrically-powered equipment used in the United States and Australia. We account for the inefficiency of using many smaller diesel-powered machines by scaling up the diesel engine impacts for Indonesia in this study.
In the United States, new non-road engines are regulated for pollutants including carbon monoxide (CO), non-methane hydrocarbons (NMHC), NOx and particulate matter (PM) emissions [18]. The United States also has a diesel fuel standard of 15 parts per million (ppm) sulfur [19]. Australia has a diesel fuel standard of 10 ppm sulfur, but currently does not have a standard for new non-road engines, although they are currently working on one [20,21,22]. Indonesia has no engine or fuel standard for non-road engines, with no plans to implement any [23]. The lack of diesel related regulations in Indonesia and lagging of engine regulations in Australia results in increased impacts in some impact categories for these two countries.
The ocean transport distances for coal sourced from the PRB and Australia are very similar for the three destination countries (within 5% to 15%). Ocean transport distances from Indonesia are 50% to 70% less than for Australia and the PRB. The ocean transport emissions in Figure 4 scale according to these assumptions. However, the ocean transport emissions not only scale with distance, but also with the amount of coal that is shipped. The amount of coal required for one MWh of electricity generation is significantly different across the various export grade coals considered. For example, 329 kg of coal sourced from the Hunter Valley of Australia is required to generate one MWh, while the same MWh requires 414 kg of coal sourced from the Decker Mine in the PRB. This explains why the ocean transport emissions shown in Figure 4 are larger for coal sourced from the PRB compared to Australia even though the transport distances are essentially equal.

3.2. Direction for Further Studies

Figure 5 and Figure 6 highlight the impact that including or not including non-GHG, direct ocean impacts can have on the results. When ocean impacts are not included, Indonesia has higher non-GHG impacts comparatively, but when ocean impacts are included, PRB usually has relatively higher impacts. This is mainly due to the greater ocean transport distances for exporting PRB coal. Whether it is appropriate to include direct ocean impacts in an environmental assessment is an open question, because oceans are large sinks that are usually far from population centers.
This is an attributional LCA that does not take into consideration the consequential effects of opening up additional coal exports from the United States to Asia. Additional coal on the market may have the effect of displacing other power sources in developed countries that are not producing large amounts of additional power. Changes in the choice of power and fuel sources affects the overall environmental impact of power production and transportation, for example. Consequential LCA seeks to quantify these impacts by using economic models that can predict real-world scenarios that could occur from opening up additional coal exports from the Powder River Basin.
This analysis focuses mostly on air impacts. Future studies could expand on this work to include other impacts. Land use impacts could be especially interesting to explore. These impacts are expected to vary significantly between the three exporting countries, based on varying reclamation practices and carbon-richness variety in their biomes.

4. Materials and Methods

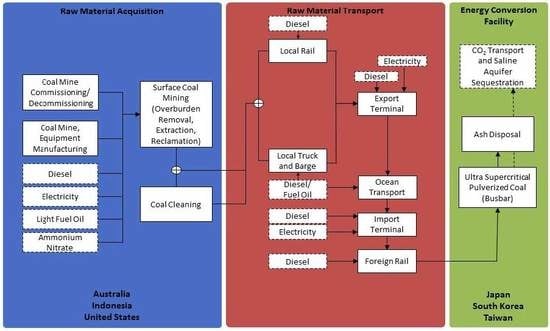
4.1. Study Boundaries

To establish a basis for comparison, the LCA method requires specification of a functional unit, the goal of which is to define an equivalent service provided by the systems of interest. Within the cradle-to-busbar boundary of this analysis, the functional unit is one MWh of coal-fired electricity at the power plant gate.
The unit processes used to build the LCA model mainly focus on air impacts, with only some unit processes including water and land impacts. NETL has chosen build its unit process library [24] based on air impacts, mainly because of the importance of air impacts in fossil power production. NETL continues to expand its unit process library to include water and land impacts.
This study does not account for the differences in land use impacts between the exporting countries. It is likely that direct land disturbance in Indonesia has a greater GHG impact than in the United States and Australia due to Indonesia being part of a carbon rich biome, but quantifying such impacts is beyond the scope of this study. Other differences in environmental practices related to coal mining and transportation are also not included, except for emissions related to diesel fuel combustion. There is evidence that environmental enforcement in Indonesia is lax and illegal mining practices are relatively common, but verifying and quantifying these impacts within an LCA is beyond the scope of the study [25].
The construction of trains, trucks, barges, and ocean freighters for coal transport after mining is not included in this analysis. The construction and maintenance of transportation infrastructure, such as roads and river channels, is also not included, with the exception of marine bulk terminals. One reason transportation infrastructure is not modeled is because of lack of data for apportioning impacts to other commodities that use the same infrastructure as coal transport. For marine bulk terminals, it is assumed that coal is the only commodity being processed, so all of the impacts can be apportioned to coal. The proposed export terminals modeled for this LCA are expected to process mostly or only coal. In any case, construction generally represents a very small portion of life cycle impacts due to the fact that the impact is spread across the lifetime of the constructed item.
Transmission and distribution (T&D) of the electricity generated in the importing countries is also not included in this study, because the data were sparse for the losses associated with these steps in the foreign countries of interest. Adding T&D would yield additional uncertainty in the final results that would complicate the comparison. Differences in the T&D infrastructure and processes between countries are an important consideration, but are considered to fall outside the scope of this analysis.
The temporal characteristics of this analysis include the vintage of data for the coal supply chain and power plants, as well as the lifetimes of coal mines, power plants, and associated infrastructure. Some data included in this analysis pre-dates the time period for these data, but were determined to be the latest or highest quality data available. The sources utilized to represent upstream coal mining are representative of recent operations in the United States and abroad (2000–2015). The detailed coal specifications are a mix of data from 2013 and 2015. The power plant data are based on a study conducted in 2011; however, the power plant performance is considered to be consistent with current state-of-the-art technology. Further advancement of technology during the study period is not considered.
The study period is 30 years, starting in 2020 when Western U.S. coal terminals are assumed to begin operating and ending in 2050 [26]. This period is mainly used to adjust impacts related to changes in electricity grid mix and environmental regulations over time and does not represent the full time period of the life cycle. Some lifecycle activities fall outside of the study period. For example, the construction of existing mines and infrastructure occurred prior to 2020, but are still considered part of the life cycle.
Determining the comparative difference in environmental impacts between alternative sources of coal from the U.S. (PRB), Australia (Hunter Valley), and Indonesia (Adaro and Mulia mines in South Kalimantan) exported to Asia is the main interest of this LCA. The two comparison exporting countries, Australia and Indonesia, were chosen based on their export capacity to Asia. Indonesia is the largest coal exporter with Australia coming in second [11]. The importing countries chosen for this model include Japan, South Korea, and Taiwan. These countries were chosen because they import virtually all of the coal that they use and would be potential customers for PRB coal; the majority of the coal they import currently comes from Indonesia and Australia. NETL’s coal mining models (unit processes) for the U.S. were modified with country-specific data to represent foreign operations.

4.2. Analysis Tools and Methods

The process for building the model starts with the publically-available NETL LCA unit process library [24]. The appropriate unit processes from the library were chosen for the model. Some new unit processes were created and existing unit processes were updated and improved as well. NETL unit processes are Excel spreadsheets that contain the quantitative inputs and outputs related to a discrete activity in relation to a chosen reference unit. NETL unit processes were assembled in thinkstep’s GaBi Version 6 software for LCA. Appendix A provided a mapping of the unit processes as they appear in GaBi and the links between them. Before unit processes were assembled in GaBi, NETL’s Power Plant Flexible Model (PPFM) was used to determine the amount of coal needed to produce one MWh of electricity based on the various coal specifications in Table 1 [27].
Non-GHG impact assessment utilizes a modified version of TRACI 2.1 method for calculating impact assessment results. TRACI impact assessment was run in GaBi; unit process output values (masses of various pollutant species) are the inputs into the TRACI impact assessment method. The following TRACI impact categories are included in this analysis: acidification, eutrophication, photochemical smog formation, and human health particulates. The acidification category is the increased concentration of hydrogen ions in a local environment. This can be from the direct addition of acids, or by indirect chemical reactions from the addition of substances such as ammonia [16]. The eutrophication category is the “enrichment of an aquatic ecosystem with nutrients (nitrogen, phosphorus) that accelerate biological productivity (growth of algae and weeds) and an undesirable accumulation of algal biomass” [33]. The photochemical smog formation category is ground-level ozone, which is formed by the reaction of nitrogen oxides (NOx) and volatile organic compounds (VOCs) in the presence of sunlight [16]. The human health particulates category includes “a mixture of solid particles and liquid droplets found in the air” that are equal to or smaller than 10 microns in diameter (PM10) [34]. These small diameter particles can enter deep inside the lungs and cause a number of serious health problems. Almost all PM health impacts are caused by particles 2.5 microns in diameter or smaller (PM2.5) [35].
TRACI 2.1 human health particulate characterization factors were modified to account for the stack height of emissions at the power plant, which is the largest source of PM emissions in the life cycle. TRACI currently uses an emission-weighted average of ground-stack, low-stack, and high-stack. A high-stack characterization factor of 0.406 is used in this study for power plant emissions instead of the average factor of 0.10 [35]. GHG impact assessment was done post-GaBi processing using IPCC AR5 data [15]. GHGs in this analysis are reported on a common mass basis of CO2e using the global warming potentials (GWPs) of each gas from the IPCC AR5: one gram (g) CO2e per g CO2, 36 g CO2e per g methane (CH4), 298 g CO2e per g nitrous oxide (N2O), and 23,500 g CO2e per g sulfur hexafluoride (SF6) [15]. The default GWP used is the 100-year time frame.

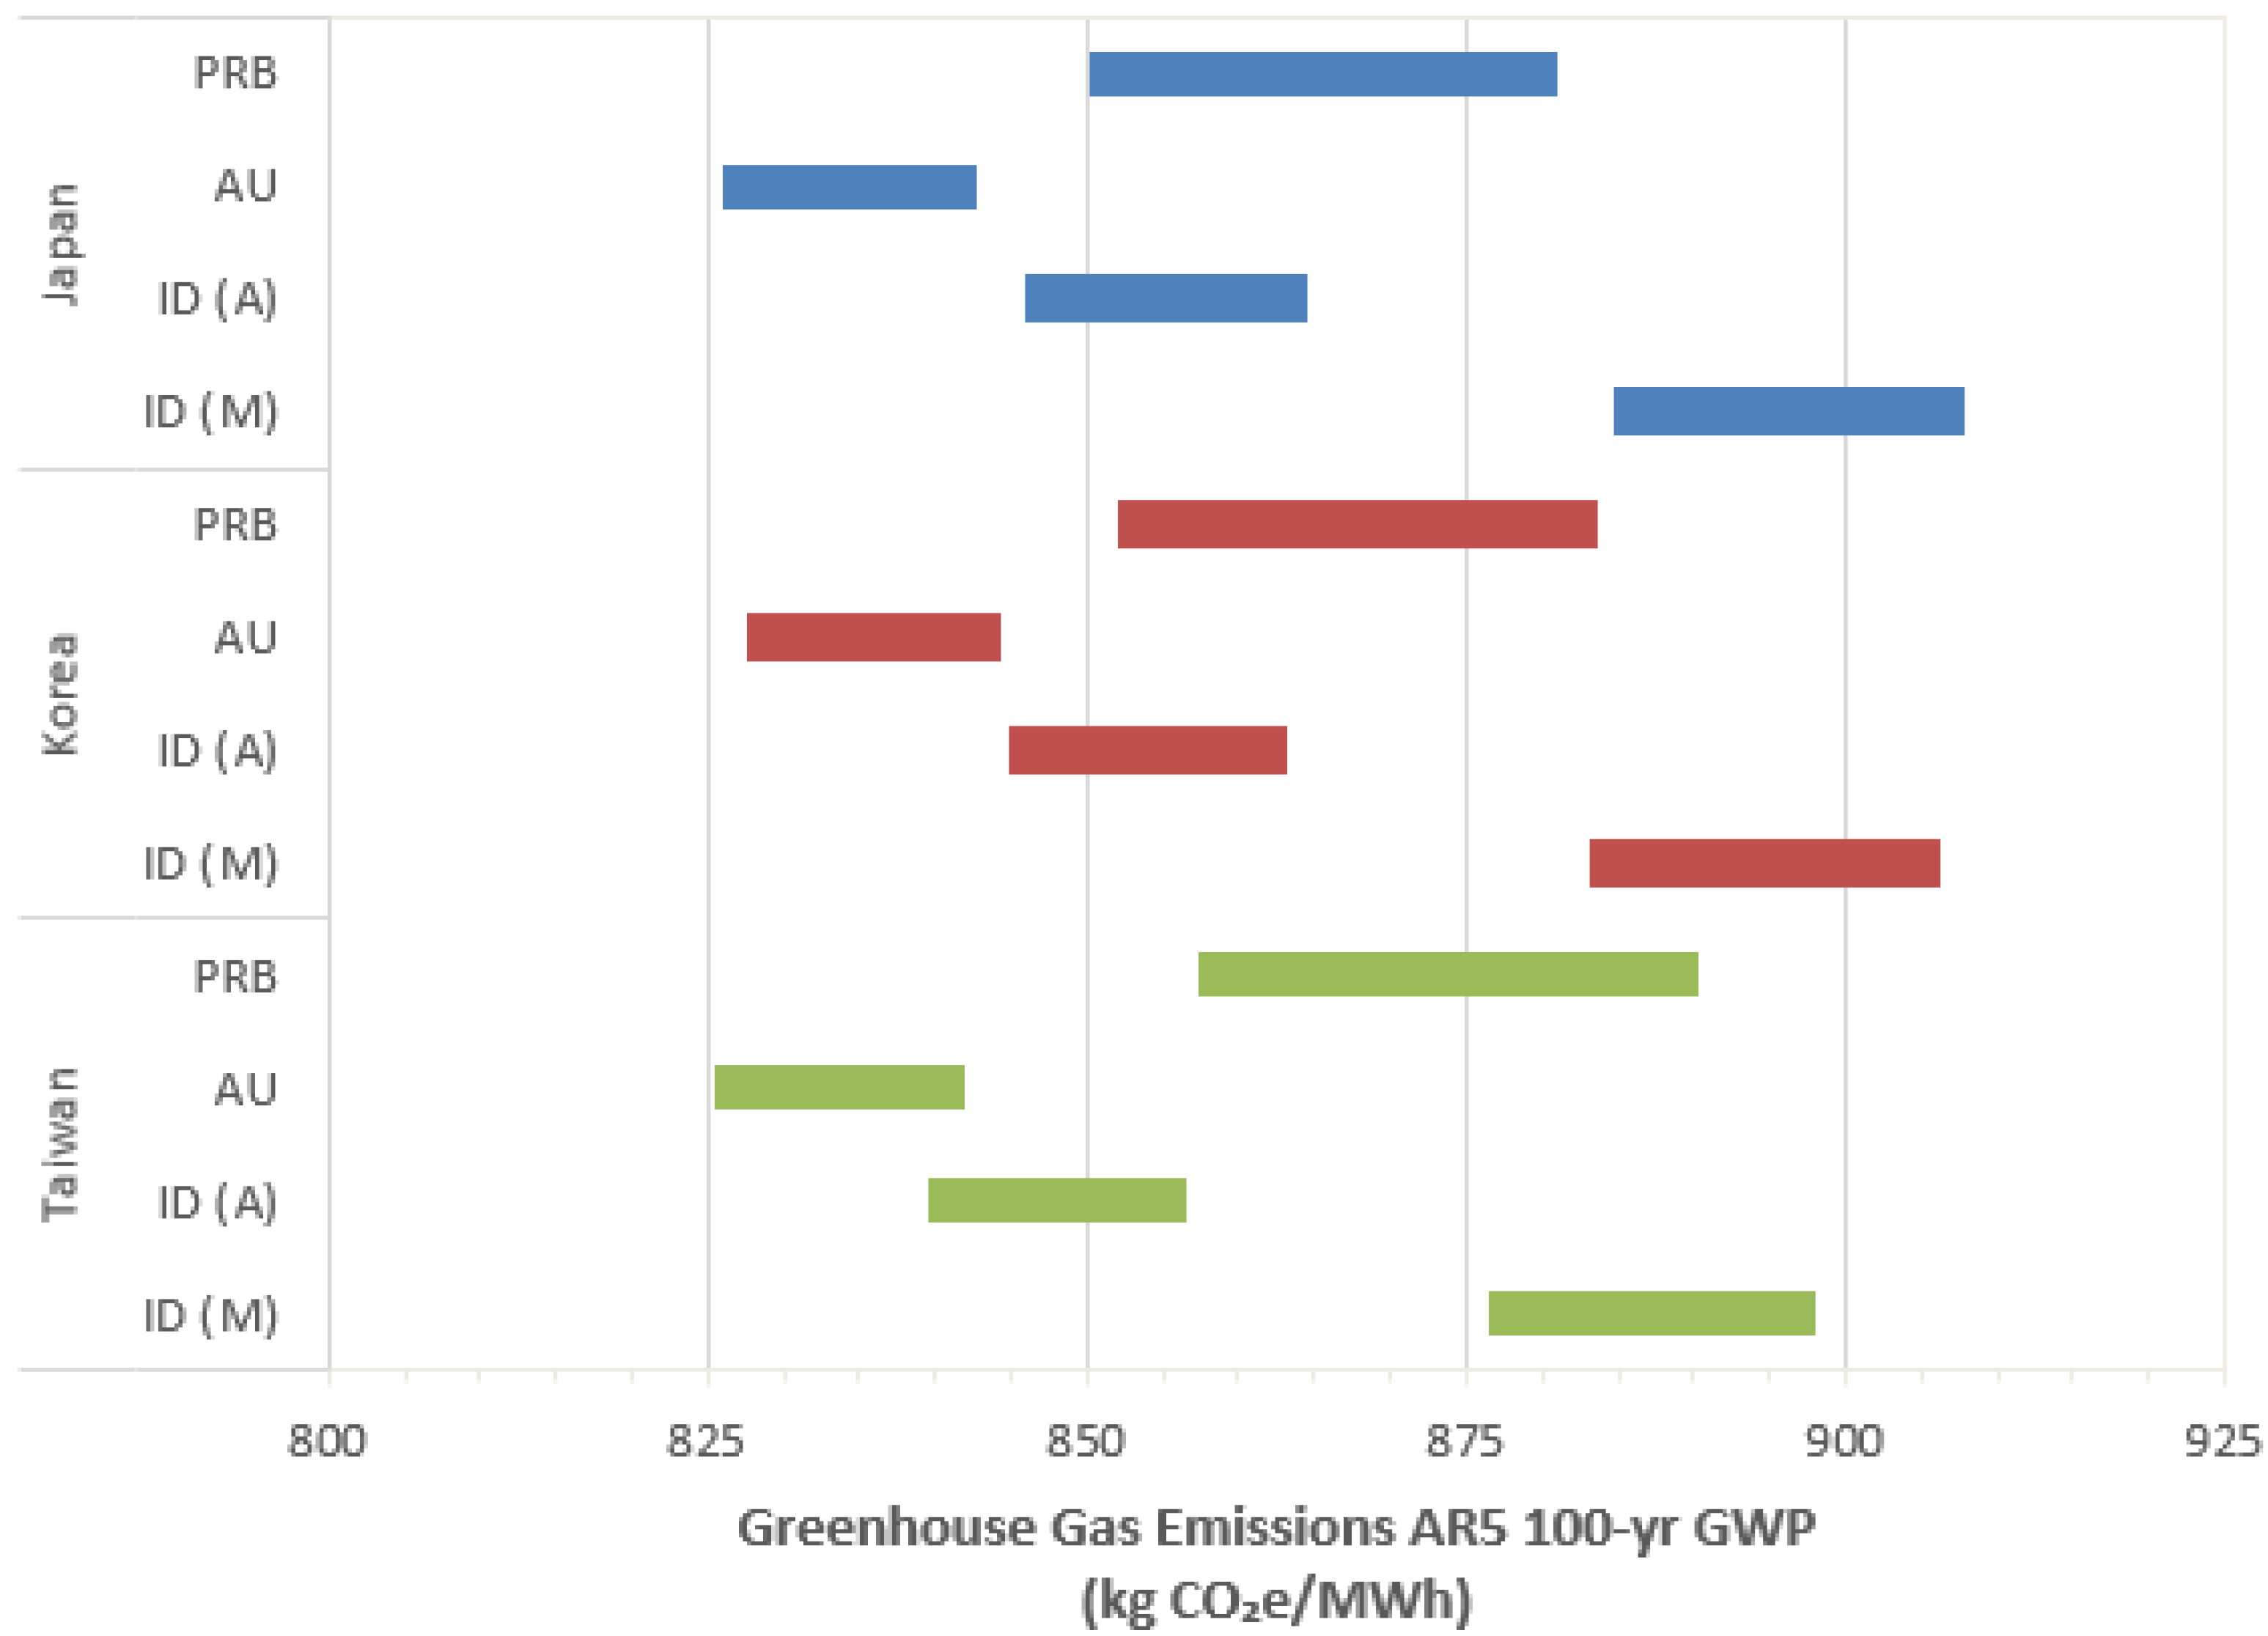
4.3. Life Cycle Modeling Data—Coal Extraction

This LCA assumes that all exporting countries are using surface mining rather than underground mining to extract coal, because U.S. PRB coal is surface mined, and because surface mining is the dominant mining method for coal in Australia and Indonesia [36]. NETL’s surface coal mining unit process is used in this analysis. Previous NETL extraction models using this unit process have been detailed at length in prior NETL LCA studies [13,14,37,38].
Modeling of coal mining is based on a U.S.-based reference mine and then certain parameters are adjusted for the individual exporting countries based on the specific characteristics of coal mining there. Operations of the reference coal mine are based on operations from a compilation of the three largest producers of PRB coal (Peabody Energy’s North Antelope-Rochelle mine, Arch Coal, Inc.’s Black Thunder Mine, and Kennecott Energy’s Cordero Rojo Operation), of which Rosebud is a coal seam. Coal is extracted from the surface coal seam through an open pit mining process. Drilled holes are blasted with ammonium nitrate fuel oil explosives to remove the overburden and expose the coal seam for extraction. The removal of the overburden occurs with the use of draglines, powered by electricity, which pile the overburden in a different location to enable extraction of the coal. The strip ratio of a mine is the amount of overburden needed to be removed for each unit of coal mined. The strip ratio for the reference coal mine in this analysis is 5:1, which is what the mining energy data are based on [39]. After the dragline has removed as much of the overburden as possible, large electric shovels are used for the removal of the remaining overburden. The coal is removed using a truck and shovel approach. The trucks move the coal to the preparation facility for grinding and crushing to the proper size for transport. The coal is not cleaned prior to shipment. A conveyor belt carries the crushed coal from the preparation facility to the loading silo. The coal is then loaded into rail cars for rail transport. The mine reclamation process starts before overburden removal with the storing of the topsoil that covers the overburden. Once the mining of the coal is complete, the mined land is contoured, the topsoil is replaced, and the land is revegetated [40].
The energy to power mining equipment comes from electricity and diesel fuel. The energy requirement for each piece of mining equipment comes from a document produced by The U.S. Department of Energy and the National Mining Association [39]. These values were vetted by operators and determined to be a reasonable representation of current operations. Dragline electricity requirements were sourced from the United States Geological Survey (USGS) [41]. These disaggregated energy requirements are shown by equipment type and phase of the overall mining life cycle in Table S2 in the Supplementary Materials.
The strip ratio is used as a scalar in the model to adjust the impact of the mining equipment energy usage and explosives use when there is more or less overburden to remove than the reference mine. The strip ratio for mines operating in the PRB range from 2:1 to 4:1, while mines in Australia operate at a strip ratio between 8:1 and 10:1 and Indonesian mining between 3:1 and 8:1 [17]. In the case of this LCA, the strip ratio scalar scales up the emissions for Australia and Indonesia, because they are larger than the reference mine strip ratio of 5:1. Conversely, current operations in the PRB tend to have strip ratios that are slightly less than the reference mine.
U.S. and Australian mines rely on both diesel and electrically powered equipment including draglines/cable shovels to remove overburden and coal [39,42]. Indonesian surface mining, on the other hand, is assumed to not be connected to the electricity grid and is reliant on diesel-powered truck and shovel equipment to remove the coal and overburden [11,17]. While the data are sparse, it is also known that because of the lack of electrically powered large-scale equipment, operations at Indonesian coal mines tend to be less efficient than U.S. or Australian operations. For the purposes of this analysis, a scalar is applied to adjust the diesel use for the Indonesian scenarios. In the base case, it is assumed that Indonesian mines require three times as much diesel fuel as the reference PRB mine. The sensitivity of this assumption is tested parametrically and is discussed later in the report.
In the United States, air emissions from non-road diesel engines are regulated in two ways: emission standards for new diesel engines and maximum sulfur content in diesel fuel [18,19]. Diesel equipment used in surface mining are currently regulated under EPA Tier IV regulations for maximum CO, NMHC, NOx and PM emissions. There are different standards based on engine size [18]. For the purpose of this model, dump trucks engines are assumed to be regulated under the standard for engines greater than to equal to 750 horsepower (hp) or 560 kilowatts (kW). The remaining diesel engines used in surface mining are assumed to be regulated under the standard for engines that are less than 750 hp, but greater than to equal to 175 hp (130 kW and 560 kW, respectively) [43]. Additionally, EPA diesel fuel standards require the use of ultra-low sulfur diesel (ULSD). The use of ULSD reduces SO2 emissions when compared to traditional diesel fuel [19].
Because the diesel engine standard only applies to new engines and existing engines tend to be rebuilt several times before being replaced, the model assumes a phase-in period for compliance. Fifty-percent compliance is assumed from 2022 to 2027 and full compliance is assumed from 2027 to 2050 [43]. Non-compliance emissions are based on emission factors for industrial reciprocating diesel engines without NOx control published in EPA’s AP-42, Compilation of Air Pollutant Emission Factors [44].
Australia has regulations for diesel fuel, but does not have regulations for non-road engines. Indonesia does not have any regulations on diesel engines or diesel fuel [21,22]. Australia is expected to pass an engine standard for non-road diesel engines in 2016 [20]. For the purpose of this study, it is assumed that Australia will pass a law in 2016 that is the same as the U.S. law and will have the same implementation schedule as the United States. Combining the time it takes to phase-in the law and for the fleet to replace old engines, the fifty-percent compliance will start in 2034 and full compliance will begin in 2039 [43,45]. It is assumed that Indonesia will pass diesel engine and fuel laws closer to the end of the study period. The impact of including Tier IV and ULSD regulations for Indonesia is minimal, therefore, this study assumes that current lack of standards in Indonesia apply throughout the study period.
Table S3 in the Supplementary Materials summarizes the parameters for diesel engines and fuel used in this study. Diesel fuel specifications are based on sulfur content regulations in the individual exporting countries [19,21,23]. The electricity grid mix used for the U.S. PRB region is based on the generation mix of the dominant energy supplier in the region, Powder River Energy Corporation [46,47]. The electricity grid mix used for Australia in the model is the national grid mix [48]. Table S4 in the Supplementary Materials shows the electric grid mixes for the U.S. PRB region and Australia that are used in this model to calculate emissions from electrically powered mining equipment. This analysis utilized existing models for the diesel and electricity life cycles [49,50].
Subject matter experts provided data on export-grade coals from Australia, Indonesia, and the PRB. It is generally accepted that PRB coal must have a lower heating value (LHV) greater than 8800 British thermal units (Btu) per pound (lb) of coal (Btu/lb) in order to be considered as an export candidate [17]. Table 1 lists the coal quality data for coals in the export regions. Coal specifications for PRB mines were obtained from the two rail companies serving that region [28,29].
Unlike PRB and Indonesian coal, Australian coal must be cleaned prior to export. The specifications provided for the Hunter Valley coal in Table 1 are post-cleaning. As part of the cleaning process, a fraction of the input material is rejected as waste. Based on subject matter expert input, the fraction of waste in the Australian operations ranges between 20% and 30% [17].
There is a wide range in the quality of the export-grade coal considered in this analysis. Lower heating values range from 7105 Btu/lb for the Mulia coal from Indonesia to almost 11,000 Btu/lb for the Hunter Valley coal from Australia. The lower heating values for PRB coal range from 8800 to 9350 Btu/lb. Mulia coal from Indonesia tends to be on the wetter end of the spectrum of coals considered coming in at 35.0%. Conversely, the Hunter Valley coal from Australia is the driest at 9.0% moisture. All of the coals considered have relatively low sulfur content ranging from 0.2% to 0.7%.
Previous NETL life cycle studies of power systems highlight that coal mine methane emissions are the key GHG contributor in coal mining, but due to the lack of mathematical models describing the complex process of coal mine methane emissions, coal mine methane is represented as a single parameter in the coal extraction unit process [14,51]. For underground coals, the majority of emissions are from the ventilation and are required to keep methane concentration low for mine safety. Surface mine methane emissions occur when the overburden is removed and the seam is broken up by mining. These surface emissions are generally harder to quantify because there is not a measureable point emissions source; in general these emissions are estimates based on in-situ coal content and an assumed fraction being emitted. Therefore, data are generally sparse for these emission factors, especially for foreign countries. Since methane concentrations are low, it is assumed that all methane is vented directly to the atmosphere and no flaring occurs.
According to the EPA GHG Inventory, the estimated coal mine methane emission factor for U.S. surface mines was 38.7 standard cubic feet of methane per ton of coal (scf CH4/ton) mined [52]. NETL has previously assumed that approximately 80% of the coalbed methane (CBM) is practically extractable using standard CBM recovery techniques and that all of the remaining 20% is released during the mining process. Based on this assumption, the coal mine methane emission factor would be reduced to 8 scf CH4/ton of coal mined. In the Environmental Impact Statement for a lease modification to the existing Spring Creek Coal Mine, the BLM estimates an emission factor of 0.8 scf CH4/ton of coal mined [53].
The coal mine methane emission factor for surface mined Australian coal is estimated to be 42.9 scf CH4/ton of coal mined [54].The government assessed an uncertainty of 20% associated with this emission factor.
According to the EPA, coal mining in Indonesia in 2010 resulted in 4 mmt CO2e entirely from mine methane emissions [55]. For that same year, Indonesia produced approximately 360 million short tons (mst) of coal. According to the Global Methane Initiative, almost all of the coal mined in Indonesia is extracted via surface mining methods [36]. These values yield a coal mine methane emission factor of 27.9 scf CH4/ton of coal mined. Equation (S2) in the Supplementary Materials steps through the calculation to arrive at 27.9 scf/ton. Coal mine methane for Indonesia is represented as a single value with no available uncertainty.

4.4. Life Cycle Modeling Data—Coal Transport

The transportation steps in this model include transport of coal from the mine to a marine bulk terminal in the exporting country and ocean transport of coal from the marine bulk terminal in the exporting country to a marine bulk terminal in the importing country. Transportation of coal from the marine bulk terminal to the power plants is not included in this model as it is assumed that the power plants are close to the marine bulk terminal.
Train transport is modeled for the transport of PRB coal from mining sites to a marine bulk terminal on the coast of the Pacific Northwest. The distance from the PRB to the Pacific Northwest for export is based on the average of rail distances from the northern (Decker, MT) and southern (Gillette, WY) PRB to the Millennium Bulk Terminals in Longview, WA and the proposed Pacific Gateway Terminal in Cherry Point, WA. The average distance is estimated to be approximately 2000 kilometers (km) with a low of 1900 km and a high of 2100 km [56]. The transport distance for Australian coal to the export terminal in Newcastle is much shorter at just 100 to 200 km [17]. Based on the location of coal reserves in Australia, it is anticipated that new mines during the study period will be located further inland [57]. An assumed rail distance range is, therefore, 150 to 300 km for this study. It is assumed that all of the infrastructure (e.g., railway, roads, etc.) connecting the coal mine and the energy conversion facility is existing.
In the United States, air emissions from non-road diesel engines are regulated in two ways: emission standards for new diesel engines and maximum sulfur content in diesel fuel [18,19]. Line-haul locomotive diesel engines are currently regulated under EPA Tier IV regulations for maximum CO, NMHC, NOx and PM emissions [58]. The standard for locomotive engines is different than the standard for engines in surface mining equipment. Additionally, EPA diesel fuel standards require the use of ULSD. The use of ULSD reduces SO2 emissions when compared to traditional diesel fuel [19].
Because the diesel engine standard only applies to new engines and existing engines tend to be rebuilt several times before being replaced, the model assumes a phase-in period for compliance. Fifty-percent compliance is assumed from 2020 to 2025 and full compliance is assumed from 2025 to 2050 [43]. Non-compliance emissions are based on emission factors for industrial reciprocating diesel engines without NOx control published in EPA’s AP-42, Compilation of Air Pollutant Emission Factors [44].
Australia has regulations for diesel fuel, but does not have regulations for non-road engines. Australia is expected to pass an engine standard for non-road diesel engines in 2016 [20]. For the purpose of this study, it is assumed that Australia will pass a law in 2016 that is the same as the U.S. law and will have the same implementation schedule as the United States. Combining the time it takes to phase-in the law and for the fleet to replace old engines, the 50% compliance will start in 2028 and full compliance will begin in 2033 [43,58]. Table S3 in the Supplementary Materials lists the phase-in schedule and diesel specifications for line-haul locomotives.
In Indonesia, it is assumed that truck and river barge transport is used to transport coal to the export terminal [59]. Truck emissions are modeled based on a unit process developed by the National Renewable Energy Laboratory for diesel-powered passenger trucks. River barge emissions are based on a model developed by Argonne National Laboratory for marine Category 2 engines. It is assumed that Indonesia will pass and enforce diesel engine and fuel laws closer to the end of the study period. The impact of including Tier IV and ULSD regulations for Indonesia is minimal, therefore, this study assumes that lack of standards in Indonesia apply throughout the study period. Table S3 in the Supplementary Materials summarizes the parameters for diesel engines and fuel used in this study.
Coal handling at the export terminal includes the impact of construction and operation of a marine bulk terminal, with a terminal in the Pacific Northwest as a reference terminal. The emission factors used to model this process come from the Gateway Pacific Terminal Air Quality Technical Report Revised Site Layout [60]. It includes emission factors for CO2e, PM2.5, PM10, SO2, CO, and nitrogen dioxide (NO2). Coal handling impacts are assumed to be the same for all of the export countries and import countries.
Ocean vessel engine emissions are based on a model developed by Argonne National Lab for marine Category 3 engines. Table S5 in the Supplementary Materials shows the ocean transport distances between coal sources and destination ports. The assumed source and destination ports were chosen based on current operations in the exporting and importing countries. For the purposes of this analysis the focus is on exports from the Pacific Northwest, so the Millennium Bulk Terminals facility, located in Longview, WA, was chosen as the port of departure from the United States. The shipping distances were determined by utilizing the Sea Rates port distance calculator [61]. The high and low ocean transport distances are modeled as ±10% of the expected value.

4.5. Life Cycle Modeling Data—Power Plant Operations

This LCA assumes that the power plant in each importing country is a best available technology power plant with advanced emission controls. This assumption is made because the increase in coal imports by the destination countries is assumed to satisfy the marginal demand for electricity. For the purposes of this analysis, a USCPC plant was selected. The USCPC plant design fired with sub-bituminous coal (PRB Rosebud) was previously modeled by NETL [12]. The version of the configuration without carbon capture operates at an efficiency of 39.8% (higher heating value (HHV)) yielding a net power output of 550 megawatts (MW). When operated with an amine-based post-combustion capture system, this configuration operates at an efficiency of 28.0% (HHV) yielding a net power output of 537 MW. The USCPC plant is fitted with a fabric filter for PM control, activated carbon injection for mercury control, selective catalytic reduction (SCR) for NOx control, and a dry flue-gas desulfurization (FGD) unit for sulfur oxide (SOx) removal. The plant utilizes a hybrid condenser configuration, with 50% of the plant cooling supplied by an air-cooled condenser.
To evaluate the impacts of the different coal sources, this analysis utilizes the NETL PPFM [27]. NETL PPFM simulates combustion-based power plant electrical output, emissions, material usage, and costs for a fully-configurable mix of boiler and steam plant types, feedstocks, and emissions control equipment.
Fly ash from the power plant is transported to a landfill for disposal. The air emissions associated with diesel combustion to transport the fly ash to the landfill and for the operations of equipment at the landfill are included in the boundary of the analysis. Additionally, the leachate emissions to water are also considered. For the plant configuration with post-combustion carbon capture, all of the energy and emissions associated with the amine capture equipment and compression are accounted for inside the boundary of the plant.
Table S6 in the Supplementary Materials provides the plant inputs, outputs and specifications for each of the coal types considered in this analysis. As expected, the drier coal (higher HHV) in Hunter Valley, Australia, results in higher net plant efficiencies (and lower CO2 emissions) than coals with a higher moisture content (lower HHV).
For the power plant configurations equipped with post-combustion CO2 capture, the model is adapted to include the transport via CO2 pipeline 100 miles to a saline aquifer for final disposal and sequestration. Saline aquifers are geological formations that are saturated with brine water. In the United States, saline aquifers have a broader geographical distribution than oil and gas reservoirs and have a large capacity potential for long-term CO2 storage. The CO2 storage capacity of saline aquifers in the United States has been estimated from 2.1 to 20 trillion tonnes of CO2 [62].
The life cycle models utilized for the construction and operation of the CO2 pipeline and saline aquifer are consistent with the details provided in previous NETL analyses [37,38]. The construction of the pipeline, pipeline maintenance via pigging, and operation, including boost compression and pipeline leakage have been modeled. The life cycle model for the saline aquifer accounts for the following activities: site preparation, well construction, CO2 sequestration operations, site monitoring, brine management, well closure, and land use.
Table 2 summarizes the parameter data used to create scenarios for each export location and to create uncertainty ranges (low, expected, and high values). Scalars scale model results with a multiplier and switches turn on (1) or off (0) a parameter in the model.

Supplementary Materials

The following are available online at www.mdpi.com/1996-1073/9/7/559/s1. Figure S1: Cradle-to-busbar LCA results for PRB coal exported to Japan, Figure S2: Cradle-to-busbar LCA results for PRB coal exported to Japan—upstream results only, Figure S3: TRACI 2.1 acidification results, Figure S4: TRACI 2.1 Human Health particulate results, Figure S5: TRACI 2.1 Smog Formation results, Table S1: Summary of GHG results—AR5 100-yr GWP (kg CO2e/MWh), Table S2: Energy use for reference mine, Table S3: Diesel engine and fuel parameters, Table S4: Grid mix for electrically-powered equipment, Table S5: Ocean transport distance (km), Table S6: NETL PPFM model output by coal source, Equations (S1) and (S2). Appendix A: Unit Process Maps; Appendix B: Tabular Emissions Results.

Author Contributions

Michele Mutchek, Gregory Cooney and Timothy Skone conceived and designed the experiments; Michele Mutchek and Gregory Cooney performed the experiments; Michele Mutchek and Gregory Cooney analyzed the data; Michele Mutchek., Gregory Cooney, Gavin Pickenpaugh and Joe Marriott wrote the paper.

Conflicts of Interest

The authors declare no conflict of interest.

References

  1. U.S. Energy Information Administration (EIA). Monthly Energy Review; U.S. Energy Information Administration: Washington, DC, USA, 2016. [Google Scholar]
  2. EIA. Short-Term Energy Outlook; U.S. Energy Information Administration: Washington, DC, USA, 2016. [Google Scholar]
  3. Porzio, M.U.S. Coal Production and Prices Decline in 2015. Available online: http://www.forbes.com/sites/mattporzio/2016/01/19/u-s-coal-production-and-prices-decline-in-2015/#5a31ac226ba9 (accessed on 12 April 2016).
  4. EIA. Annual Coal Report 2013; U.S. Energy Information Administration: Washington, DC, USA, 2015. [Google Scholar]
  5. EIA. Coal: Data; U.S. Energy Information Administration: Washington, DC, USA, 2015. [Google Scholar]
  6. EIA. Quarterly Coal Report; U.S. Energy Information Administration: Washington, DC, USA, 2015. [Google Scholar]
  7. Cornot-Gandolphe, S. US Coal Exports: The Long Road to Asian Markets; Oxford Institute for Energy Studies: Oxford, UK, 2015. [Google Scholar]
  8. Campbell, K. Coal Scorecard: Your Guide to Coal in the Northwest. Available online: http://www.opb.org/news/article/coal-score-card/ (accessed on 24 June 2015).
  9. Bohnengel, B.; Patiño-Echeverri, D.; Bergerson, J. Environmental implications of united states coal exports: A comparative life cycle assessment of future power system scenarios. Environ. Sci. Technol. 2014, 48, 9908–9916. [Google Scholar] [CrossRef] [PubMed]
  10. World Coal Association. Coal Facts 2014. Available online: https://web.archive.org/web/20160202160918/https://www.worldcoal.org/sites/default/files/coal_facts_2014%2812_09_2014%29.pdf (accessed on 2 February 2016).
  11. IEA. Coal Medium-Term Market Report 2014: Market Analysis and Forecasts to 2019; International Energy Agency: Paris, France, 2014. [Google Scholar]
  12. NETL. Low rank coal to electricity: Combustion cases. In Cost and Performance Baseline for Fossil Energy Plants; National Energy Technology Laboratory: Pittsburgh, PA, USA, 2011; Volume 3. [Google Scholar]
  13. NETL. Life Cycle Analysis: Supercritical Pulverized Coal (SCPC) Power Plant; National Energy Technology Laboratory: Pittsburgh, PA, USA, 2010. [Google Scholar]
  14. NETL. Life Cycle Analysis: Integrated Gasification Combined Cycle (IGCC) Power Plant, Revision 2, June 2013. Available online: http://www.netl.doe.gov/File%20Library/Research/Energy%20Analysis/Life%20Cycle%20Analysis/IGCC-LCA-Report.zip (accessed on 11 July 2016).
  15. IPCC. Climate Change 2013 the Physical Science Basis; Intergovernmental Panel on Climate Change; Cambridge University Press: New York, NY, USA, 2013. [Google Scholar]
  16. Bare, J. Tool for the Reduction and Assessment of Chemical and Other Environmental Impacts (TRACI): Traci Version 2.1—User’s Manual; U.S. EPA National Risk Management Laboratory: Cincinnati, OH, USA, 2012. [Google Scholar]
  17. Mewing, M. International Coal Specifications and Operations; Cooney, G., Ed.; National Energy Technology Laboratory: Pittsburgh, PA, USA, 2015. [Google Scholar]
  18. U.S. Environmental Protection Agency (EPA). Control of Emissions from New and in-Use Nonroad Compression-Ignition Engines: Emission Standards and Related Requirements, 40 C.F.R. §1039.101; U.S. Environmental Protection Agency: Washington, DC, USA, 2005. [Google Scholar]
  19. EPA. Diesel Fuel. Available online: https://web.archive.org/web/20150922140217/http://www3.epa.gov/otaq/fuels/dieselfuels/index.htm (accessed on 22 September 2015).
  20. Australian Government Department of the Environment. Working towards a National Clean Air Agreement: Discussion Paper; Department of the Environment, Commonwealth of Australia: Canberra, Australia, 2015. [Google Scholar]
  21. Australian Government Department of the Environment. Diesel Fuel Quality Standard. Available online: https://web.archive.org/web/20151217204223/https://www.environment.gov.au/topics/environment-protection/fuel-quality/standards/diesel (accessed on 17 December 2015).
  22. NSW EPA. Cleaner Non-Road Diesel Plant and Equipment. Available online: https://web.archive.org/web/20151217202839/http://www.epa.nsw.gov.au/air/nonroaddiesel.htm (accessed on 17 December 2015).
  23. United Nations Environment Programme (UNEP). Status of Fuel Quality and Vehicle Emission Standards in Asia-Pacific. Available online: https://web.archive.org/web/20151211203916/http://www.unep.org/transport/new/pcfv/pdf/Maps_Matrices/AP/matrix/AP_Matrix_Jan2015.pdf (accessed on 7 July 2016).
  24. NETL. Unit Process Library. Available online: http://www.netl.doe.gov/research/energy-analysis/life-cycle-analysis/unit-process-library (accessed on 7 July 2016).
  25. Fogarty, D. Indonesia Tries to Clamp down on Coal Sector’s Worst Excesses. Available online: http://news.mongabay.com/2014/10/indonesia-tries-to-clamp-down-on-coal-sectors-worst-excesses/ (accessed on 4 December 2015).
  26. Gateway Pacific Terminal. Gateway Pacific Terminal. Available online: http://gatewaypacificterminal.com/the-project/ (accessed on 8 January 2015).
  27. NETL. Power Plant Flexible Model (PPFM); National Energy Technology Laboratory: Pittsburgh, PA, USA, 2013. [Google Scholar]
  28. BNSF Railway. Guide to Coal Mines—Mines Served by Bnsf Railway; Coal Business Unit BNSF Railway: Fort Worth, TX, USA, 2013. [Google Scholar]
  29. Union Pacific. Coal Specifications Table. Available online: http://www.up.com/customers/coal/mines/specs_table/index.htm (accessed on 1 July 2015).
  30. Research Gate. 1.3 Properties of Coal. Availble online: http://www.researchgate.net/publictopics.PublicPostFileLoader.html?id=55101748d5a3f291118b45de&key=099d2483-4e58-44f1-9f50-bd4206c0658f (accessed on 1 July 2015).
  31. NETL. Quality Guidelines for Energy Systems Studies: Detailed Coal Specifications; National Energy Technology Laboratory: Pittsburgh, PA, USA, 2012. [Google Scholar]
  32. World Coal Association. Coal Conversion Statistics. Available online: http://www.worldcoal.org/resources/coal-statistics/coal-conversion-statistics/ (accessed on 1 July 2015).
  33. EPA. Handbook for Developing Watershed Plans to Restore and Protect Our Waters—Glossary; U.S. Environmental Protection Agency: Washington, DC, USA, 2008. [Google Scholar]
  34. EPA. Particulate Matter: Basic Information. Available online: http://www.epa.gov/airquality/particlepollution/basic.html (accessed on 17 June 2013).
  35. Humbert, S. Geographically Differentiated Life-Cycle Impact Assessment of Human Health; University of California: Berkeley, CA, USA, 2009. [Google Scholar]
  36. EPA. Coal Mine Methane Country Profiles. Available online: https://www.globalmethane.org/documents/toolsres_coal_overviewfull.pdf (accessed on 11 July 2016).
  37. NETL. Gate-to-Grave Life Cycle Analysis Model of Saline Aquifer Sequestration of Carbon Dioxide; National Energy Technology Laboratory: Pittsburgh, PA, USA, 2013. [Google Scholar]
  38. NETL. Comprehensive Analysis of Coal and Biomass Conversion to Jet Fuel: Oxygen Blown, Transport Reactor Integrated Gasifier (TRIG) and Fischer-Tropsch (F-T) Catalyst Configurations; National Energy Technology Laboratory: Pittsburgh, PA, USA, 2014. [Google Scholar]
  39. U.S. Department of Energy (DOE). Energy and Environmental Profile of the U.S. Mining Industry; U.S. Department of Energy: Washington, DC, USA, 2002. [Google Scholar]
  40. National Mining Association. Reclamation: Did You Know? Available online: http://www.nma.org/index.php/land/reclamation (accessed on 11 July 2016).
  41. USGS. Estimates of Electricity Requirements for the Recovery of Mineral Commodities, with Examples Applied to Sub-Saharan Africa; U.S. Geological Survey: Reston, VA, USA, 2011; Open-File Report 2011–1253. [Google Scholar]
  42. Mitra, R.; Saydam, S. Surface Coal Mining Methods in Australia; InTech: Rijeka, Croatia, 2012. [Google Scholar]
  43. Miller, K. Epa Tier IV Requirements and Equipment Engine Size; Skone, T.J., Pickenpaugh, G., Cooney, G., Eds.; National Energy Technology Laboratory: Pittsburgh, PA, USA, 2015. [Google Scholar]
  44. EPA. Stationary point and area sources. In Compilation of Air Pollutant Emission Factors; U.S. Environmental Protection Agency: Durham, NC, USA, 1995; Volume I. [Google Scholar]
  45. DieselNet. Nonroad Diesel Engines. Available online: https://www.dieselnet.com/standards/us/nonroad.php (accessed on 18 September 2015).
  46. EIA. Electricity supply, disposition, prices, and emissions, reference case. In Annual Energy Outlook 2015; U.S. Energy Information Administration: Washington, DC, USA, 2015. [Google Scholar]
  47. Maunder, D.; Sersland, D. Utility Provider for the Spring Creek Mine in Montana; Mutchek, M., Ed.; National Energy Technology Laboratory: Pittsburgh, PA, USA, 2015. [Google Scholar]
  48. Australian Bureau of Resources and Energy Economics (BREE). Australian Energy Projections to 2049–50; Australian Bureau of Resources and Energy Economics: Canberra, Australia, 2014. [Google Scholar]
  49. NETL. Development of Baseline Data and Analysis of Life Cycle Greenhouse Gas Emissions of Petroleum-Based Fuels; National Energy Technology Laboratory: Pittsburgh, PA, USA, 2008. [Google Scholar]
  50. NETL. Grid Mix Explorer; National Energy Technology Laboratory: Pittsburgh, PA, USA, 2015. [Google Scholar]
  51. NETL. Life Cycle Analysis of Natural Gas Extraction and Power Generation; U.S. Department of Energy, National Energy Technology Laboratory: Pittsburgh, PA, USA, 2014. [Google Scholar]
  52. EPA. Inventory of U.S. Greenhouse Gas Emissions and Sinks: 1990–2013; U.S. Environmental Protection Agency: Washington, DC, USA, 2015. [Google Scholar]
  53. U.S. Department of Interior Bureau of Land Management (BLM). Environmental Assessment for Spring Creek Coal Lease Modification MTM-069782 and Amendment to Land Use Lease MTM-74913 ea# mt-doi-blm-mt-020-2010-29; U.S. Department of Interior Bureau of Land Management: Miles City, MT, USA, 2010. [Google Scholar]
  54. Australian Government Department of the Environment. The australian government submission to the united nations framework convention on climate change australian national greenhouse accounts. In National Inventory Report 2012; Commonwealth of Australia: Canberra, Australia, 2014; Volume 1. [Google Scholar]
  55. EPA. Summary Report: Global Anthropogenic Non-Co2 Greenhouse Gas Emissions: 1990–2030; U.S. Environmental Protection Agency: Washington, DC, USA, 2012. [Google Scholar]
  56. BNSF Railway. Bnsf Rail Miles Inquiry. Available online: http://www.bnsf.com/bnsf.was6/RailMiles/RMCentralController (accessed on 1 July 2015).
  57. Australian Government Department of Industry. Australian Energy Resource Assessment, 2nd ed.; Economics, Bureau of Resources and Energy Economics: Canberra, Australia, 2014. [Google Scholar]
  58. DieselNet. Locomotives. Available online: http://www.dieselnet.com/standards/us/loco.php (accessed on 24 September 2015).
  59. Lucarelli, B. The History and Future of Indonesia’s Coal Industry: Impact of Politics Regulatory Framework on Industry Structure and Performance; Freeman Spogli Institute for International Studies: Stanford, CA, USA, 2010. [Google Scholar]
  60. ENVIRON International Corporation. Gateway Pacific Terminal Air Quality Technical Report Revised Site Layout; ENVIRON International Corporation: Lynnwood, WA, USA, 2014. [Google Scholar]
  61. SeaRates, L.P. Distance and Time Online Calculator. Available online: http://www.searates.com/reference/portdistance/ (accessed on 1 July 2015).
  62. NETL. Carbon sequestration Atlas of the United States and Canada Fourth Edition, 4th ed.; National Energy Technology Laboratory: Pittsburgh, PA, USA, 2012. [Google Scholar]
Figure 1. Coal Export LCA Process Diagram (Boxes and arrows with dotted lines represent potential or optional upstream or downstream flows in the model).
Energies 09 00559 g001
Figure 2. Cradle-to-busbar GHG emissions for U.S. (PRB), Australian (AU), and Indonesian (ID) coals exported to Japan, South Korea (Korea), and Taiwan, with and without 90% CCS.
Energies 09 00559 g002
Figure 3. Uncertainty ranges for U.S. (PRB), Australian (AU), and Indonesian (ID) coals exported to Japan, South Korea (Korea), and Taiwan (non-CCS cases only).
Energies 09 00559 g003
Figure 4. Cradle-to-busbar GHG emissions for U.S. (PRB), Australian (AU), and Indonesian (ID) coals exported to Japan, South Korea (Korea), and Taiwan, with and without 90% CCS. Only the upstream results are shown—power plant and saline aquifer sequestration results are invisible.
Energies 09 00559 g004
Figure 5. TRACI 2.1 impact assessment results for the Japan scenario with ocean transport impacts removed. Results are normalized to highest contribution in each impact category. Global warming values taken from previous section.
Energies 09 00559 g005
Figure 6. TRACI 2.1 impact assessment results for the Japan scenario with ocean transport impacts included. Results are normalized to highest contribution in each impact category. Global Warming values taken from previous section.
Energies 09 00559 g006
Figure 7. Cradle-to-busbar TRACI 2.1 eutrophication impact category results for U.S. (PRB), Australian (AU), and Indonesian (ID) coals exported to Japan, South Korea (Korea), and Taiwan. Ocean transport impacts are excluded.
Energies 09 00559 g007
Table 1. Coal quality data for export-grade coals.
Coal PropertyU.S. PRBAustraliaIndonesia
DeckerSpring CreekBlack Thunder SouthBlack ThunderAntelopeNorth Antelope/Rochelle ComplexHunterValleyEnshamAdaroMulia
Moisture24.5%26.8%26.0%27.0%26.5%27.6%9.0%11.5%25.0%35.0%
Carbon52.7%55.1%52.4%52.3%52.1%52.1%63.9%63.1%52.2%42.7%
Hydrogen 14.2%4.0%4.0%3.9%4.0%4.0%4.3%4.0%4.8%4.0%
Nitrogen 20.7%0.7%0.7%0.7%0.7%0.7%1.3%1.3%0.7%0.7%
Chlorine 20.0%0.0%0.0%0.0%0.0%0.0%0.3%0.3%0.0%0.0%
Sulfur0.5%0.3%0.2%0.3%0.2%0.2%0.6%0.7%0.2%0.2%
Ash5.1%4.3%4.6%5.2%5.3%4.5%13.5%12.0%2.0%3.9%
Oxygen 312.3%8.8%12.1%10.6%11.2%10.9%7.2%7.2%15.2%13.5%
HHV (Megajoule/kg)21.822.821.721.621.621.626.526.221.617.6
HHV (Btu/lb) 493739820932093009270927011,40611,27192837575
LHV (MJ/kg)20.721.720.620.520.520.525.425.120.516.5
LHV (Btu/lb)89039350885088308800880010,93610,80188137105
Data Source 5[17][28,29][28,29][28,29][28,29][28,29][17][17][17][17]
Notes: 1 Calculated based on a correlation that utilizes fixed ash, fixed carbon, moisture, and volatiles [30]. See Equation (S1) in the Supplementary Materials; 2 Based on the NETL Quality Guidelines for Energy System Studies for either Illinois No. 6 or PRB coal depending on the proximity to the reference heating value [31]; 3 Calculated as the balance component (e.g., the additional fraction required to sum to 100%); 4 Calculated from LHV with a correlation from the World Coal Association [32]; 5 For exceptions to the listed data sources, see footnotes 1–4.
Table 2. Coal exports scenario parameter matrix.
Parameter 1Parameter 2Export Location
PRBAustraliaIndonesia
Coal Mine Methane (scf/ton)Low Value0.834.327.9
Expected Value8.042.9
High Value38.754.4
Diesel ScalarLow Value112
Expected Value3
High Value4
Mine Electricity SwitchN/A110
Strip RatioLow Value283
Expected Value395.5
High Value4108
Coal Cleaning SwitchN/A010
Sulfur Concentration of Diesel Fuel (ppm)N/A15103500
Rail Distance (km)Low Value1900150N/A
Expected Value2000225
High Value2100300
Truck Distance (km)Low ValueN/AN/A44
Expected Value79
High Value114
River Barge Distance (km)Low ValueN/AN/A100
Expected Value250
High Value450
Ocean Distance (km) L/H are ±10%To Japan789280754683
To South Korea845185584380
To Taiwan990478882997
Coal TypeLow ValueSpring CreekHunter Valley 1Adaro, Mulia Modeled Separately
Expected ValueDecker
High ValueNorth Antelope
Notes: 1 Hunter Valley and Ensham coal have nearly identical specifications; thus only Hunter Valley is modeled for this analysis.

