1. Introduction
In recent years, there has been constant growth in the cloud computing paradigm. This is leading to an accelerating expansion of the network infrastructures and data processing centers of the providers of these services. The sector of information technologies (IT) already represents a significant percentage of global electricity consumption. Therefore, to sustain the growth of IT in general and that of data centers in particular, it is necessary to introduce solutions that guarantee energy efficiency.
To this end, there have been a series of recent IT proposals in the literature focused on increasing the energy efficiency of network data centers. The proposals can be classified into two large groups: solutions based on hardware and those based on software [
1]. The goals of the former are to improve the efficiencies of hardware components, both of network devices and physical servers [
2,
3,
4]. The latter focus on aspects such as the operating system, the virtual machines or software applications [
5,
6,
7].
Existing proposals use a great variety of techniques to reduce energy consumption: the turning off and on of servers and switches that are not in use [
8,
9]; the consolidation and dynamic supply of servers, that is, using the minimum number of servers that satisfies the needs of the work load [
10,
11]; virtualization and migration techniques in virtual machines [
10,
12]; proxy servers to turn off inactive nodes while maintaining a presence through the proxy [
8,
9]; and planning of loads to predict traffic behavior in the network to adjust the physical infrastructure [
13,
14].
All the proposals have a common methodology for reducing energy consumption in data centers: they divide the solution into three modules or stages: monitoring, analysis and execution. Monitoring obtains in real time the state of the variables related to energy consumption in the infrastructure. Analysis determines the actions to be executed to minimize the energy consumption while fulfilling the service needs. Execution carries out the actions indicated in the analysis, applying the different techniques mentioned in the previous paragraph.
Clearly, monitoring is a fundamental pillar of these systems, providing the information necessary to make decisions, information that measures different parts of computers and the data center infrastructure, which shows the needs of more complex tools able to monitor a network infrastructure and to trigger energy saving techniques when traffic conditions change [
15]. Therefore, it is essential to optimize the monitoring stage because implementing large monitoring systems (MSs) and collecting large amounts of data can lead to resource demands that are higher than the savings anticipated in the main production environment [
16]. However, while multiple specialized devices for MS loads exist, these tend to be ad hoc for a specific application or scenario. They cannot be integrated or reused in other systems due to being strongly coupled, do not have characteristics such as proactivity and persistence, tend to produce overloads in existing production systems, and lack intelligence; i.e., they do not provide processed information that aids in decision making.
This article conducts an in-depth study of MS to propose a general, comprehensive, autonomous, de-coupled, robust, scalable, flexible, proactive and intelligent model that does not interfere with the main production environment. As a result of the models developed in [
17,
18] and based on simplifying the management of IT infrastructure and services through autonomous devices with minimum management and attention, weak coupling, and self-sufficiency, we propose the design of a monitoring model for energy management to reduce energy consumption. The functionality of the system is offered as services under the service-oriented architecture (SOA) paradigm, implemented through representational state transfer (RESTful) architectural style, to provide higher levels of integration and decoupling with the remaining systems while simultaneously having the capacity to integrate almost immediately with other network devices and services found in heterogeneous environments. To that end, the system is based on the composition of basic management network IT services through the use of standard technologies and protocols to monitor and analyze the loads of network nodes using network standards such as simple network management protocol (SNMP) and remote network MONitoring (RMON).
These services are provided through an embedded network device to provide an accessible technological platform that tolerates errors and does not significantly increase energy consumption. The device has persistence and data processing capacities that make it an intelligent probe. We show how an independent element that is easy to install and manage avoids possible conflicts with management policies of the data center while being able to obtain the minimum information necessary to activate its initial configuration and execute management tasks with minimum human intervention.
The rest of the article has been structured as follows:
Section 2 presents a review and analysis of the state of the art in research proposals and related technologies,
Section 3 describes the methodology followed in the study to obtain the monitoring model,
Section 4 describes a set of scenarios and tests for validation, and finally, we present our main conclusions and future lines of work.
2. Related Work
Recent years have seen an acceleration of publications that address energy efficiency in data centers. As a result of this research activity, many different approaches have been proposed to save energy. They can be categorized into two main spheres: models focused on hardware and models focused on software [
1]. For an in-depth discussion of the different models for energy saving systems, one can turn to the review in [
1]. The present study focuses on the infrastructure monitoring stage present in all the proposals in the literature, which constitutes our main objective.
The approaches focused on hardware are generally based on monitoring load or traffic demand and on dynamically adjusting the network hardware infrastructure to these traffic needs. They mainly use techniques of consolidating servers, switches and links to adapt infrastructure to traffic demand.
Mahadevan et al. [
2] proposed three algorithms to save energy by monitoring data traffic in all the switches in the data center. Based on the usage of each port, the first algorithm adapts the state of each link, the second consolidates switches, and the third consolidates servers. The last approach generates the largest energy savings. This paper shows an analysis of the energy consumption profile of network devices.
ElasticTree monitors the traffic load of data centers and dynamically adjusts the set of active network elements (switches and links) to adapt to changes [
11]. The system is formed by three models: optimizer, routing and power control. The optimizer uses a matrix of monitored traffic, topology, the energy model of each switch and the desired tolerance to errors in order to generate as output the set of active elements leading to minimum power consumption.
In a study presented in [
5], a heuristic algorithm was designed to save energy from the viewpoint of routing; the authors use the term energy-aware routing to describe it. The system monitors the matrix of traffic between servers in the data center; a value of 1 in the matrix indicates the presence of traffic flow between the two servers. The system takes topology and a predefined network performance level into account. The result is the turning off of switches that are not necessary to achieve the specified performance.
Correlation-aware power optimization (CARPO) integrates dynamic consolidation of traffic flows in a set of switches with adaptation of the ratio of links [
14]. In addition, it incorporates an analysis of the weak correlation that usually exists between traffic flows in a data center.
Tarutani et al. [
19] used optical switches instead of electronic ones to reduce energy consumption of the data center network itself. The reduction in energy consumption is produced through the configuration of a virtual network that minimizes the number of necessary ports. It monitors the amount of traffic and determines changes, both frequent and gradual, in the traffic pattern.
Wang et al. [
20] proposed a general framework for saving energy in modern data centers based on traffic engineering and virtualization techniques. It characterizes three different traffic patterns and, depending on the pattern, carries out advanced engineering traffic planning. It monitors traffic demands and, on that basis, determines the traffic pattern and conducts planning by also consolidating switches and balancing traffic flows.
In these previous proposals, the monitoring module has an elevated degree of coupling with the rest of the modules in the system; this leads to inflexible and closed proposals for the proposed solutions. The monitored variables are not based on a set of general variables but instead are specific and defined ad hoc for the proposed application. In addition, the monitoring in these previous studies lacks any type of intelligence or processing (filters, aggregations, etc.); it obtains only basic data without processing.
Within the models focused on software, we found some proposals based on services and others geared toward desktop computers. The former obtain the minimum set of resources associated with the traffic load for the specified service. The latter detect the turning off or suspending of a computer and, at that instant, translate the presence of the computer in the network to a proxy server.
Chen et al. [
13] showed a system that enables energy savings in data centers at the level of Internet service. The system monitors workload traces of 32 different performance variables such as login ratio, connection count, use of memory and central processing unit (CPU) and failed connections. The system exhibits the weakness of being too specific; more precisely, it is centered on the Windows Live Messenger service.
In [
6], the servers and switches continuously monitor the load, combine periodic loads and estimate aggregate performance. Specifically, for each service, they monitor the usage and tail lengths of requests as well as their performance requests. The proposal uses an economic approach in which maximizing the efficiency of resources corresponds to maximizing a utility function for the user.
LiteGreen is an energy savings system that uses virtualization to migrate the physical desktop of the user to a server of virtual machines when the user is inactive. It monitors the computational activity of the user, specifically, CPU, memory, disk, network, and mouse activity.
Reich et al. [
8] proposed a light proxy system to turn off inactive machines while maintaining the presence of the network in the machine. It has the advantage of being a solution that is actually deployed in production environments, in contrast to other studies that use a small set of tests and even simulations. The system monitors a period of inactivity in machines; when the period expires, the machine goes to sleep and the proxy system will address requests directed to the machine, initiating the machine again if necessary. SleepServer is a similar proposal; that is, it uses a proxy to maintain the presence of the machine, but the difference is that it is based on virtualization techniques [
9]. It uses a module in the client machine to detect when it is suspended by the operating system.
Once the proposals in the state of the art were analyzed, the need was identified to have a greater degree of generality and intelligence. Additionally, the proposals are hindered by being designed for very specific services, exhibiting a high degree of coupling.
Table 1 summarizes the information monitored by each of the analyzed proposals.
We have observed that all the analyzed IT energy savings proposals, especially those focused on data centers, use systems that monitor load and consumption of infrastructure associated with the services provided. However, none of the proposals consider the most important characteristics associated with these environments when managing their consumption, such as infrastructure heterogeneity, existing applications and services in the centers, and dynamism and exposure to continuous change, in which new elements continuously arise that will influence energy consumption and must be taken into account in the monitoring process. All the reviewed approaches focus on ad-hoc proposals to monitor very specific parameters necessary for each of the cases being analyzed. These approaches involve highly coupled proposals and depend on the environments of the applications, making them partial, ad-hoc, rigid and hardly scalable solutions, unable to offer an integrated solution and manage the changes that occur in an environment as dynamic as a data center. In addition, all the MS proposals call for a general purpose computing architecture, implying increased power consumption over existing levels.
3. Investigation Methodology
Based on the above analysis identifying limitations in the monitoring processes for the systems in terms of energy savings, a new autonomous and robust model is being proposed that provides a smart monitoring service for energy savings. The proposal is general, integral and scalable and is oriented toward heterogeneous environments. It is valid for any energy-saving system regardless of infrastructure, services, protocols, etc., such as data centers, Cloud infrastructures and business networks; it deftly allows adapting to the needs of a changing and dynamic environment without an additional consumption cost.
A methodology based on business process management has been followed to develop the proposal [
21,
22]. Process management is a strategy that establishes a task sequence to be followed to transform input elements into output elements. This transformation must be aligned with previously defined objectives that are strategic for the organization, satisfying shortcomings and resolving identified problems. Thus, the defined process will allow for achieving the model central to the present study in a systematic way, without straying from the charted objective: solving the problems and shortcomings identified in the existing monitoring proposals for the management of energy consumption in data processing centers.
To define the processes, we have chosen the formal notation of Eriksson-Penker [
23]. It is an extension of the UML Language for representing business processes; it is intuitive and easily comprehended by all the participants in the process.
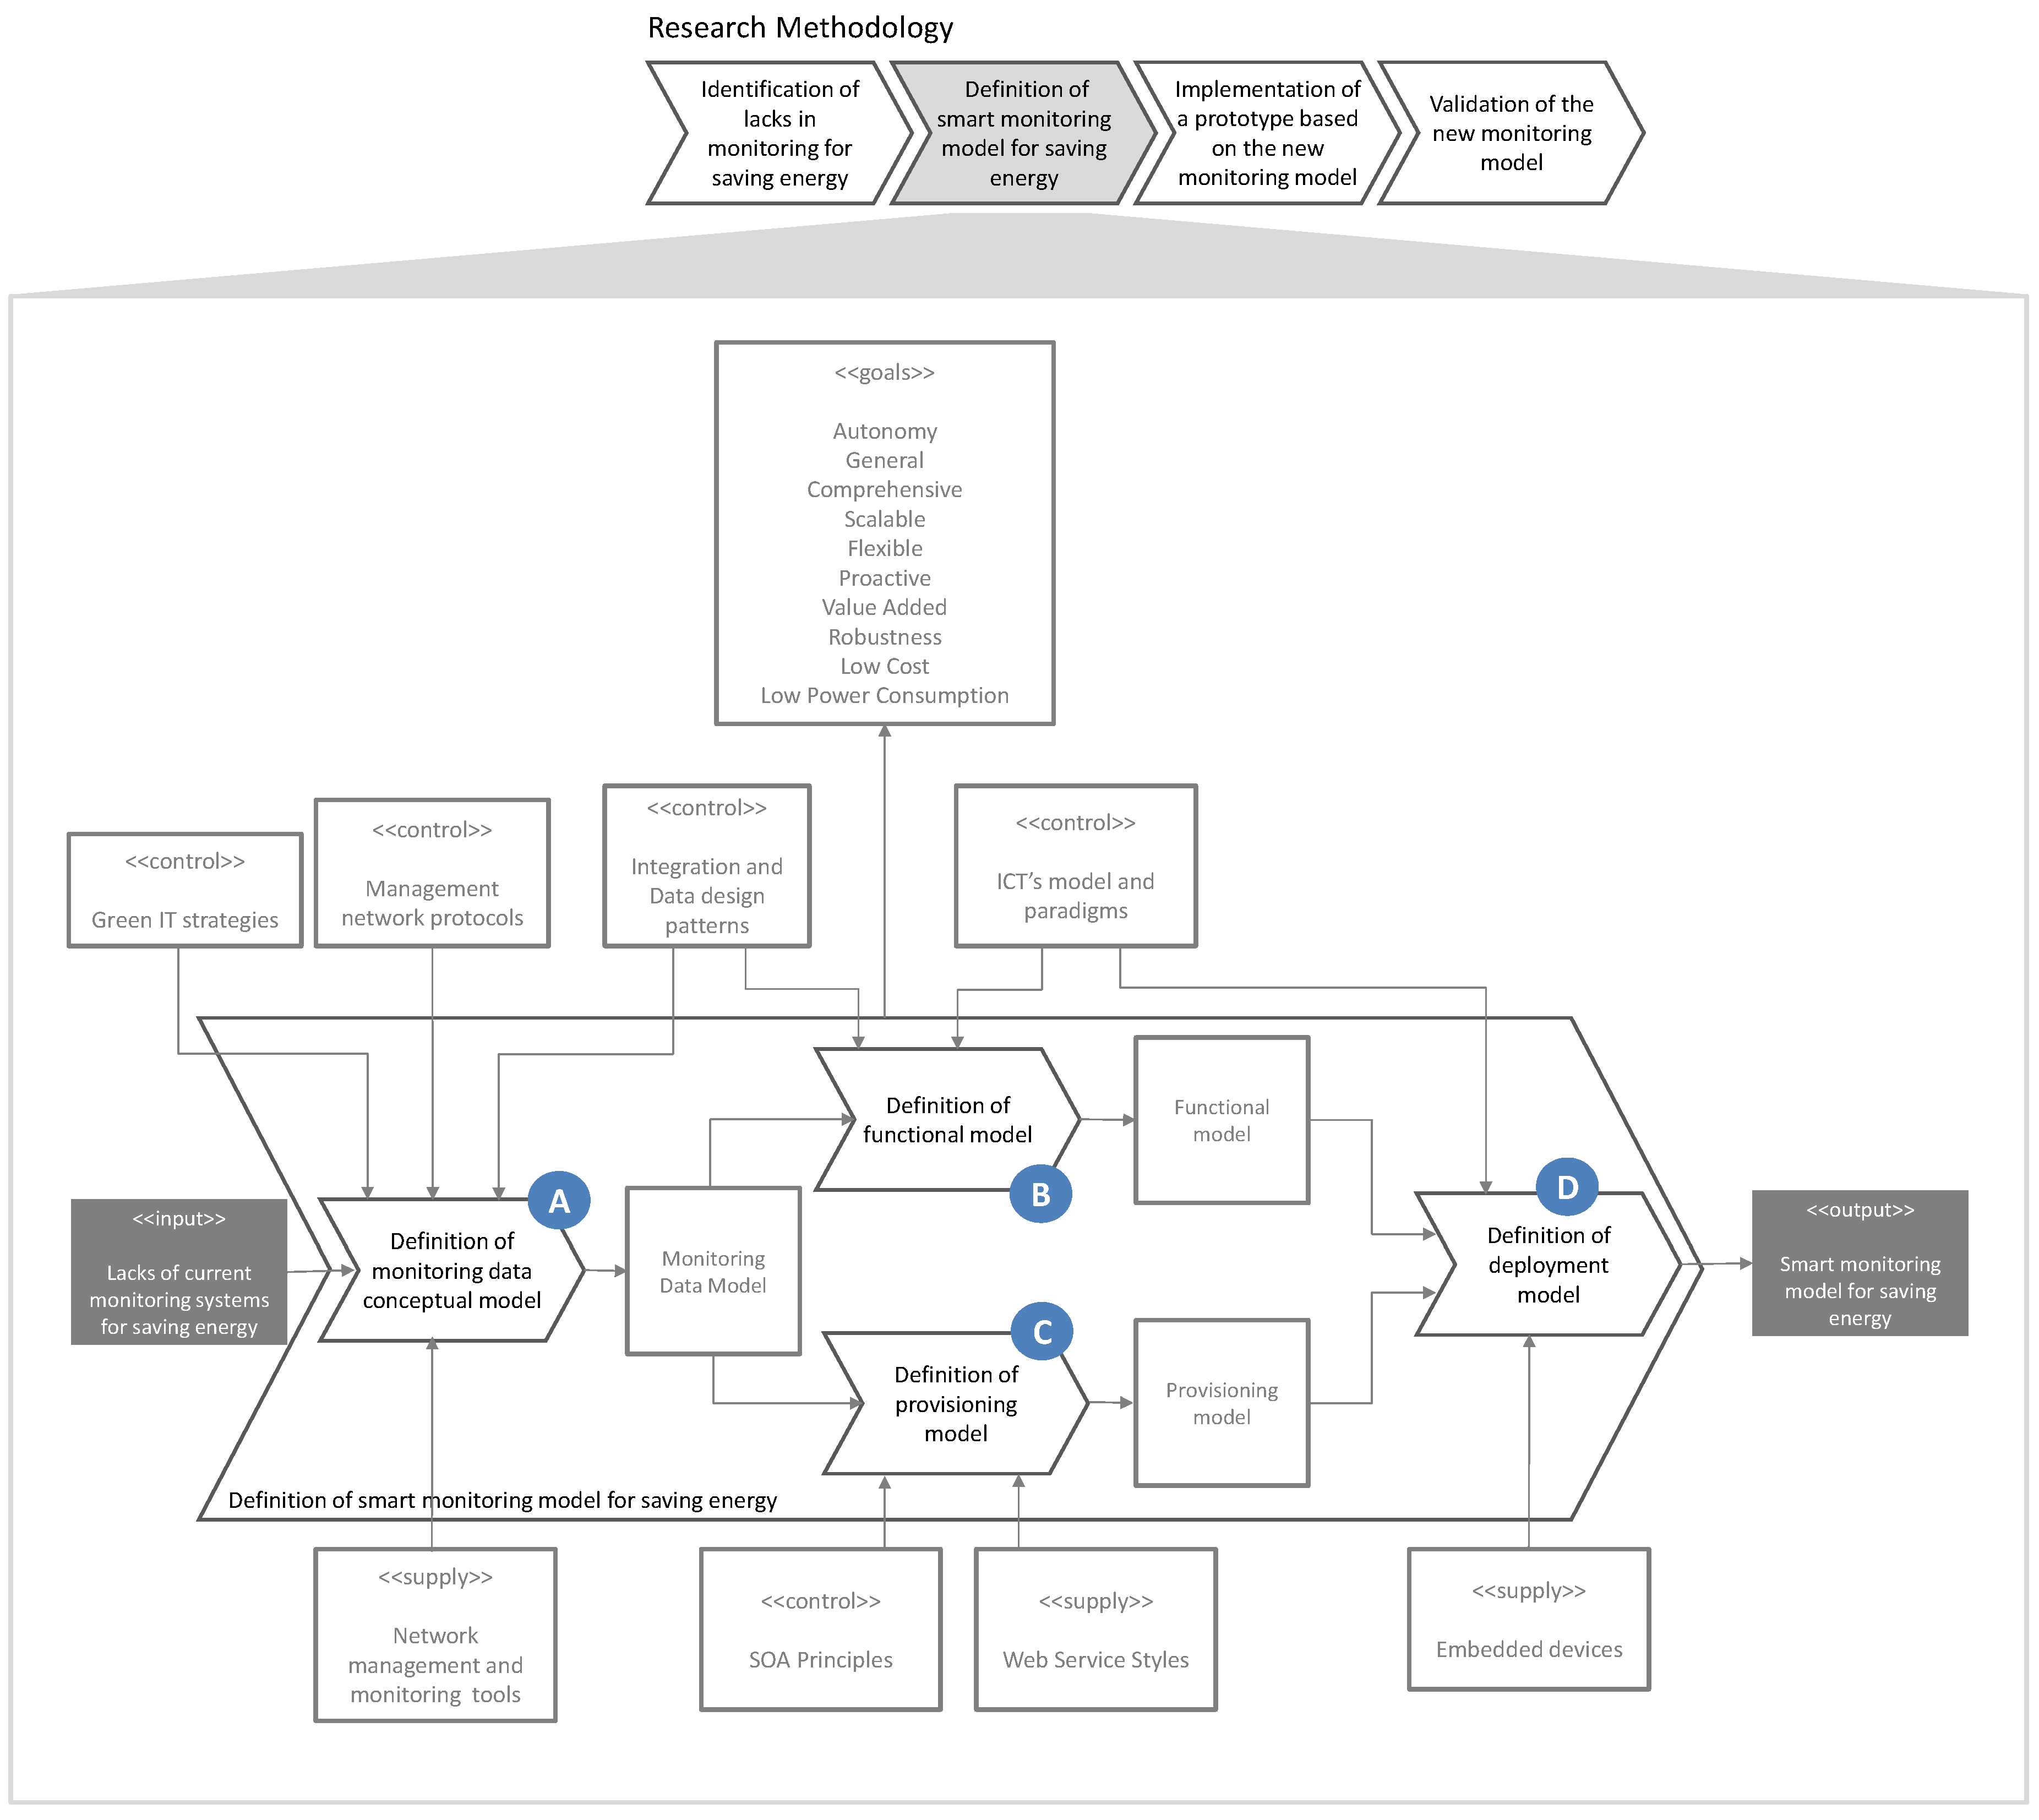
Figure 1 shows the main process conducted in the research, termed Design of smart monitoring service for saving energy. The input element («input») represents current MS for saving energy. This «input» is to be transformed through this process into a novel embedded smart monitoring service for energy saving («output»), addressing the needs and gaps identified previously. These are now represented by the strategic objectives to guide the research process («goals»).
To perform the transformation and achieve the established objectives, one must identify the controllers («Control») and facilitators («supply») needed to guide this transformation. These elements represent strategies, paradigms, techniques and technologies that will be integrated into our proposal. Processes can be split into new sub-processes. This action makes easy the identification and the comprehension of the problem. In our case, a first division was required, as illustrated in
Figure 1.
The resulting sub-processes are, first, the sub-process definition of monitoring data conceptual model, focused on locating the different types of data associated with energy consumption within a data processing center and how they must be structured to achieve the formulated objectives; second, there are two sub-processes: definition of functional model, focused on the identification of functional modules for data acquisition as well as its processing in a heterogeneous and dynamics environment, and definition of provisioning model, focused on defining an interoperable and proactive model for the exposure and provisioning of information to other systems. Finally, the sub-process definition of deployment model, is focused on obtaining a service-provisioning model that reduces consumption and can introduce the proposed monitoring service itself.
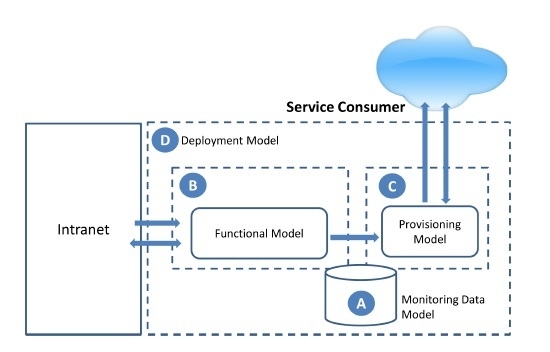
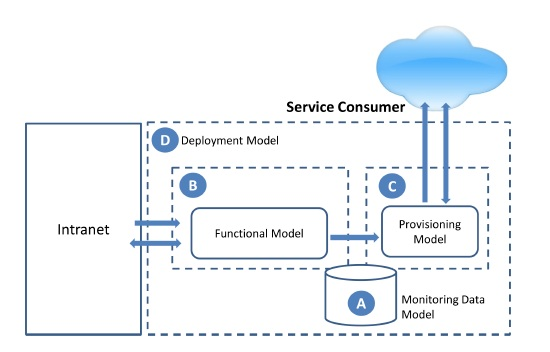
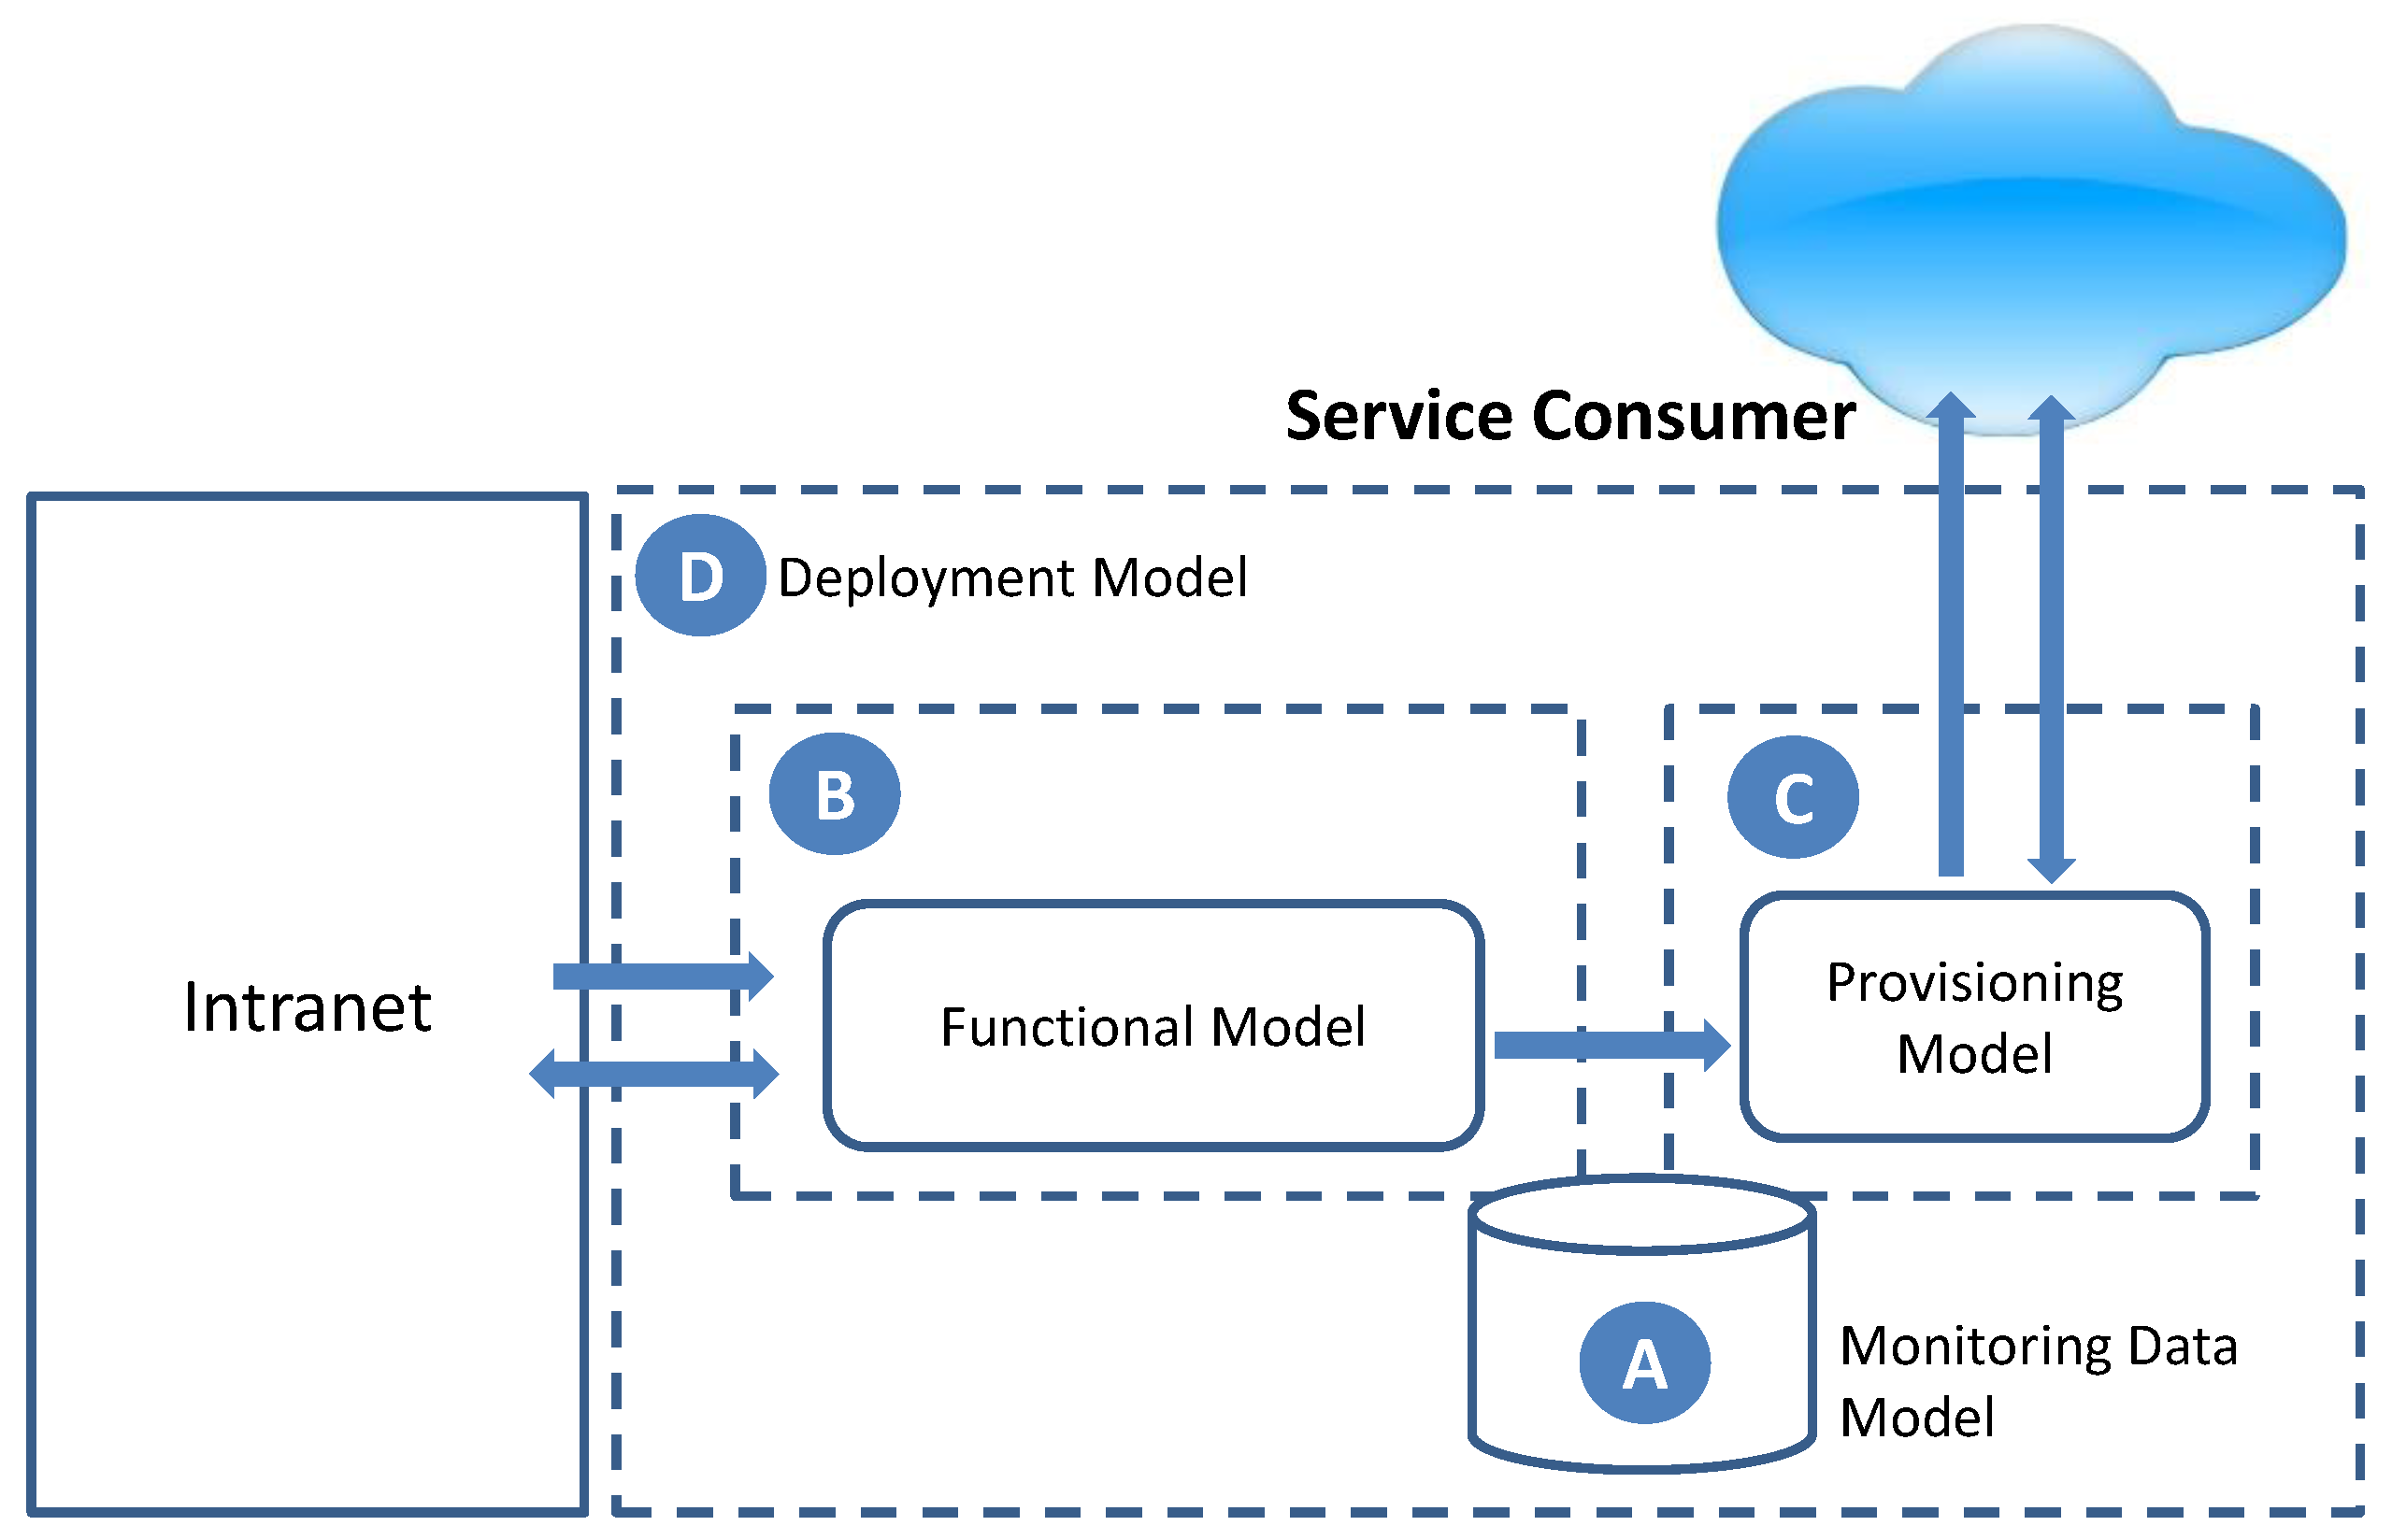
The result of this process will be the smart monitoring model for saving energy, whose general scenario is shown in
Figure 2. It is composed of two decoupled functionalities, the functional model (
Figure 2B), including the necessary functionalities to obtain monitoring information from the environment and process it, and the provisioning model (
Figure 2C), focused on exposing the monitoring data to third-party consumers for their exploitation. Both functionalities are connected through the monitoring data model (
Figure 2A). Finally, the suitable deployment model, aligned with the defined goals, has been identified to support the proposal (
Figure 2D).
3.1. Definition of Monitoring Data Conceptual Model
One of the principal novelties of this study is its attention to the heterogeneity in current energy saving systems in terms of monitoring the various resources that impact energy consumption of the data centers they manage. To achieve the objective, a monitoring solution is necessary that is generic, allowing any of the scenarios that are meant to be controlled to be addressed, comprehensive, allowing the different problems that arise from the solution itself (network hardware, servers, Cloud services and applications, or complementary elements in the environment such as cooling systems) to be addressed, and flexible, allowing customization of the monitoring solution to meet the needs of the organization.
The current sub-process should define the conceptual data model to satisfy the specific requirements intrinsic in data processing environments. To execute the sub-process, the types of data related to energy consumption in the study’s context have been identified, including how they are acquired, processed, stored and offered, as well as the values that are useful in the energy consumption decision-making phase.
The review of the various studies found that a large amount of monitoring data related to energy savings exist.
The most important measure to evaluate energy consumption is power usage effectiveness (PUE), proposed by the green grid. This measure is the ratio between the total energy consumption and the IT equipment energy consumption. The reciprocal of this measure is the data center infrastructure efficiency (DCiE), and it is also often used to evaluate the energy consumption. The corporate average data center efficiency (CADE) is another measure used to evaluate the energy consumption of a data center; it is derived from the product of the Facility Efficiency and the IT asset efficiency.
It is also possible to adapt the key performance indicators (KPIs) used in other environments to measure Energy Efficiency. For example, in [
24], a set of KPIs associated with energy efficiency exist in the industrial domain.
Kipp et al. [
25] proposed energy consumption in IT centers to be characterized through a set of metrics called green performance indicators (GPI). The proposal groups the metrics into four categories: IT resource usage GPIs, application lifecycle KPIs, Energy Impact GPIs and organizational GPIs. The proposal is framed by the European Union (EU) Project, Green Active Management of Energy in IT Service Centres (GAMES), a project oriented toward Green data centers. Anghel et al. [
26] used a set of KPIs and GPIs with the objective of reducing energy consumption.
In our case, and from the point of view of monitoring, we have categorized the existing indicators based on their nature and acquisition method.
Atomic indicators. These measures are obtained through consultation, capturing or soliciting and represent atomic and instantaneous values of the state of a particular element that can be modified. Based on the origin of these data, these measures could be divided as follows:
- ⚪
Device indicators. Values obtained from a particular device: a server, a networking device, SAI, etc. These values are obtained by a probe using networking protocols such as SNMP or hypertext transfer protocol (HTTP). Within this type, we would have common measures of energy saving systems, such as the number of CPUs and amount of memory or storage space, as well as infrastructure data, such as the energy consumption of the data center or of the associated infrastructure.
- ⚪
Applications and services indicators. These measure the performance of the applications and services of the systems to be managed. Examples of these types of measures could be the number of requests processed in an interval by a web or database server. For these cases, given that the probe is an element external to the monitored servers, values would have to be sent to the probe through network protocols.
- ⚪
Network indicators. Values obtained from a traffic analysis of the network connected to the probe. This information can be used to estimate the network load. The measures may be obtained through direct inspection of the network traffic with the probe acting as a network sniffer connected to a hub or to the span port/mirroring port of a switch. In certain scenarios, this information may be collected from the network infrastructure itself through SNMP/RMON.
Calculated indicators. Values from other indicators may be combined into calculated indicators. This allows other data to be used in the creation of indicators such as the CADE, or an indicator such as the mean network load over the last 15 min can be calculated from historic data from a specific time.
Static indicators. These pertain to data that are more or less constant in nature, that cannot be obtained automatically, and that are established in the system administratively. These values have as a main purpose the complementing of certain calculated indicators that depend on values that cannot be monitored, such as the dimensions of an enclosure or the total number of available servers.
Once the different types of indicators that might be monitored by the probe have been identified, a conceptual data model for the MS is proposed, which allows for gathering of all the elements of which it is composed, as well as the existing relationships between them.
The
MS is defined as the set of energy savings indicators
GPI, the set of devices to monitor (Network—
N), the set of rules (
R) that defines how the monitoring is conducted, and the set of values (
V) associated with the indicators that have been monitored and stored.
The indicators, as described previously, are composed of atomic, calculated and static indicators.
AI represents the set of atomic indicators. All of these indicators, , will be formed by a scheme(s) that represents the method or protocol used to obtain the indicator, a filter function (f) that allows determining the cases in which the data should and should not be processed and stored, and a transforming function (t) that allows processing of the data to adapt or normalize them before they are stored.
CI represents the set of calculated indicators, of which each will have a set of input arguments (), where P is the power set, which will carry other monitoring values, and a calculation function () that, given input arguments, returns a new value.
Lastly, SI references the set of static indicators whose values are introduced administratively into the probe.
The rules () allow configuring the fundamental behavior of the MS, capturing which indicators belonging to which devices must be monitored and the corresponding monitoring frequency. Therefore, for each rule, it must be determined which set of indicators are to be monitored (), which elements of the system will be targeted () and how often (time). Additionally, each rule will be associated with a decision function () that, taking as arguments the calculated variables in each iteration, will decide if it executes a notification or alert to another device. It is in this function that the proactivity of the probe is modeled.
Values ) represents the set of values being monitored. This is the set of data captured by the probe that will be exploited by the management systems for energy savings. Each of these values is composed of a datum (d) obtained (from an atomic indicator), calculated (from a calculated indicator) or introduced (from a static indicator), a time stamp (ts), an indicator associated with a value () and, optionally, the device from which it was obtained ().
Data Access Model
To facilitate access to the registered values, a set of procedures is put forward that allows accessing the information in a fast and compact way.
These procedures allow filtering the information through different criteria that can be combined with each other. The filters are as follows:
Temporary range. Allows filtering of the values registered in a specific period.
- ⚪
Date/Time From
- ⚪
Date/Time To
Numeric range. Allows filtering of a maximum number of records to be obtained.
- ⚪
First N records
- ⚪
Last N records
Rule. Allows obtaining the records generated by a specific rule.
Device. Allows obtaining the records generated for a specific device.
Indicator. Allows obtaining the records generated for a specific indicator.
Additionally, once the records are filtered, the procedure allows for indications as to how we wish to obtain the data.
Records: list all the filtered records.
Maximum: record with the maximum value.
Minimum: record with the minimum value.
Mean: average value of all the records (only for numeric values).
Sum: sum of all values (only for numeric values).
Count: number of filtered records.
3.2. Definition of Functional Model
The previous sub-process was the first step to reach part of the objectives; however, it is necessary to solve the limitations of the current proposals with respect to the necessary acquisition of information and how to make that information useful to facilitate decision-making. As described previously, the related studies were focused on ad hoc solutions to solve very specific aspects in controlled environments; they offered only partial solutions. The main functionalities of their monitoring modules were focused only on data acquisition for the specific case study, and such data were offered raw, as captured, to carry out a specific analysis, without previous processing that would allow for decision-making.
Therefore, the objective of the sub-process is to define the functional architecture of the monitoring model with the initial objectives:
- (i)
the acquisition of any information related (necessary for knowledge) to energy consumption transparently, regardless of the environment and the information structure, as long as it can be obtained through the network infrastructure; and
- (ii)
processing the acquired information to transform it into data with value added that aids in decision-making for energy management. Lastly, the proposed model must be directed toward providing an autonomous and reusable approach so that, on its own, it can be used by other energy consumption management systems such as those reviewed in the state of the art.
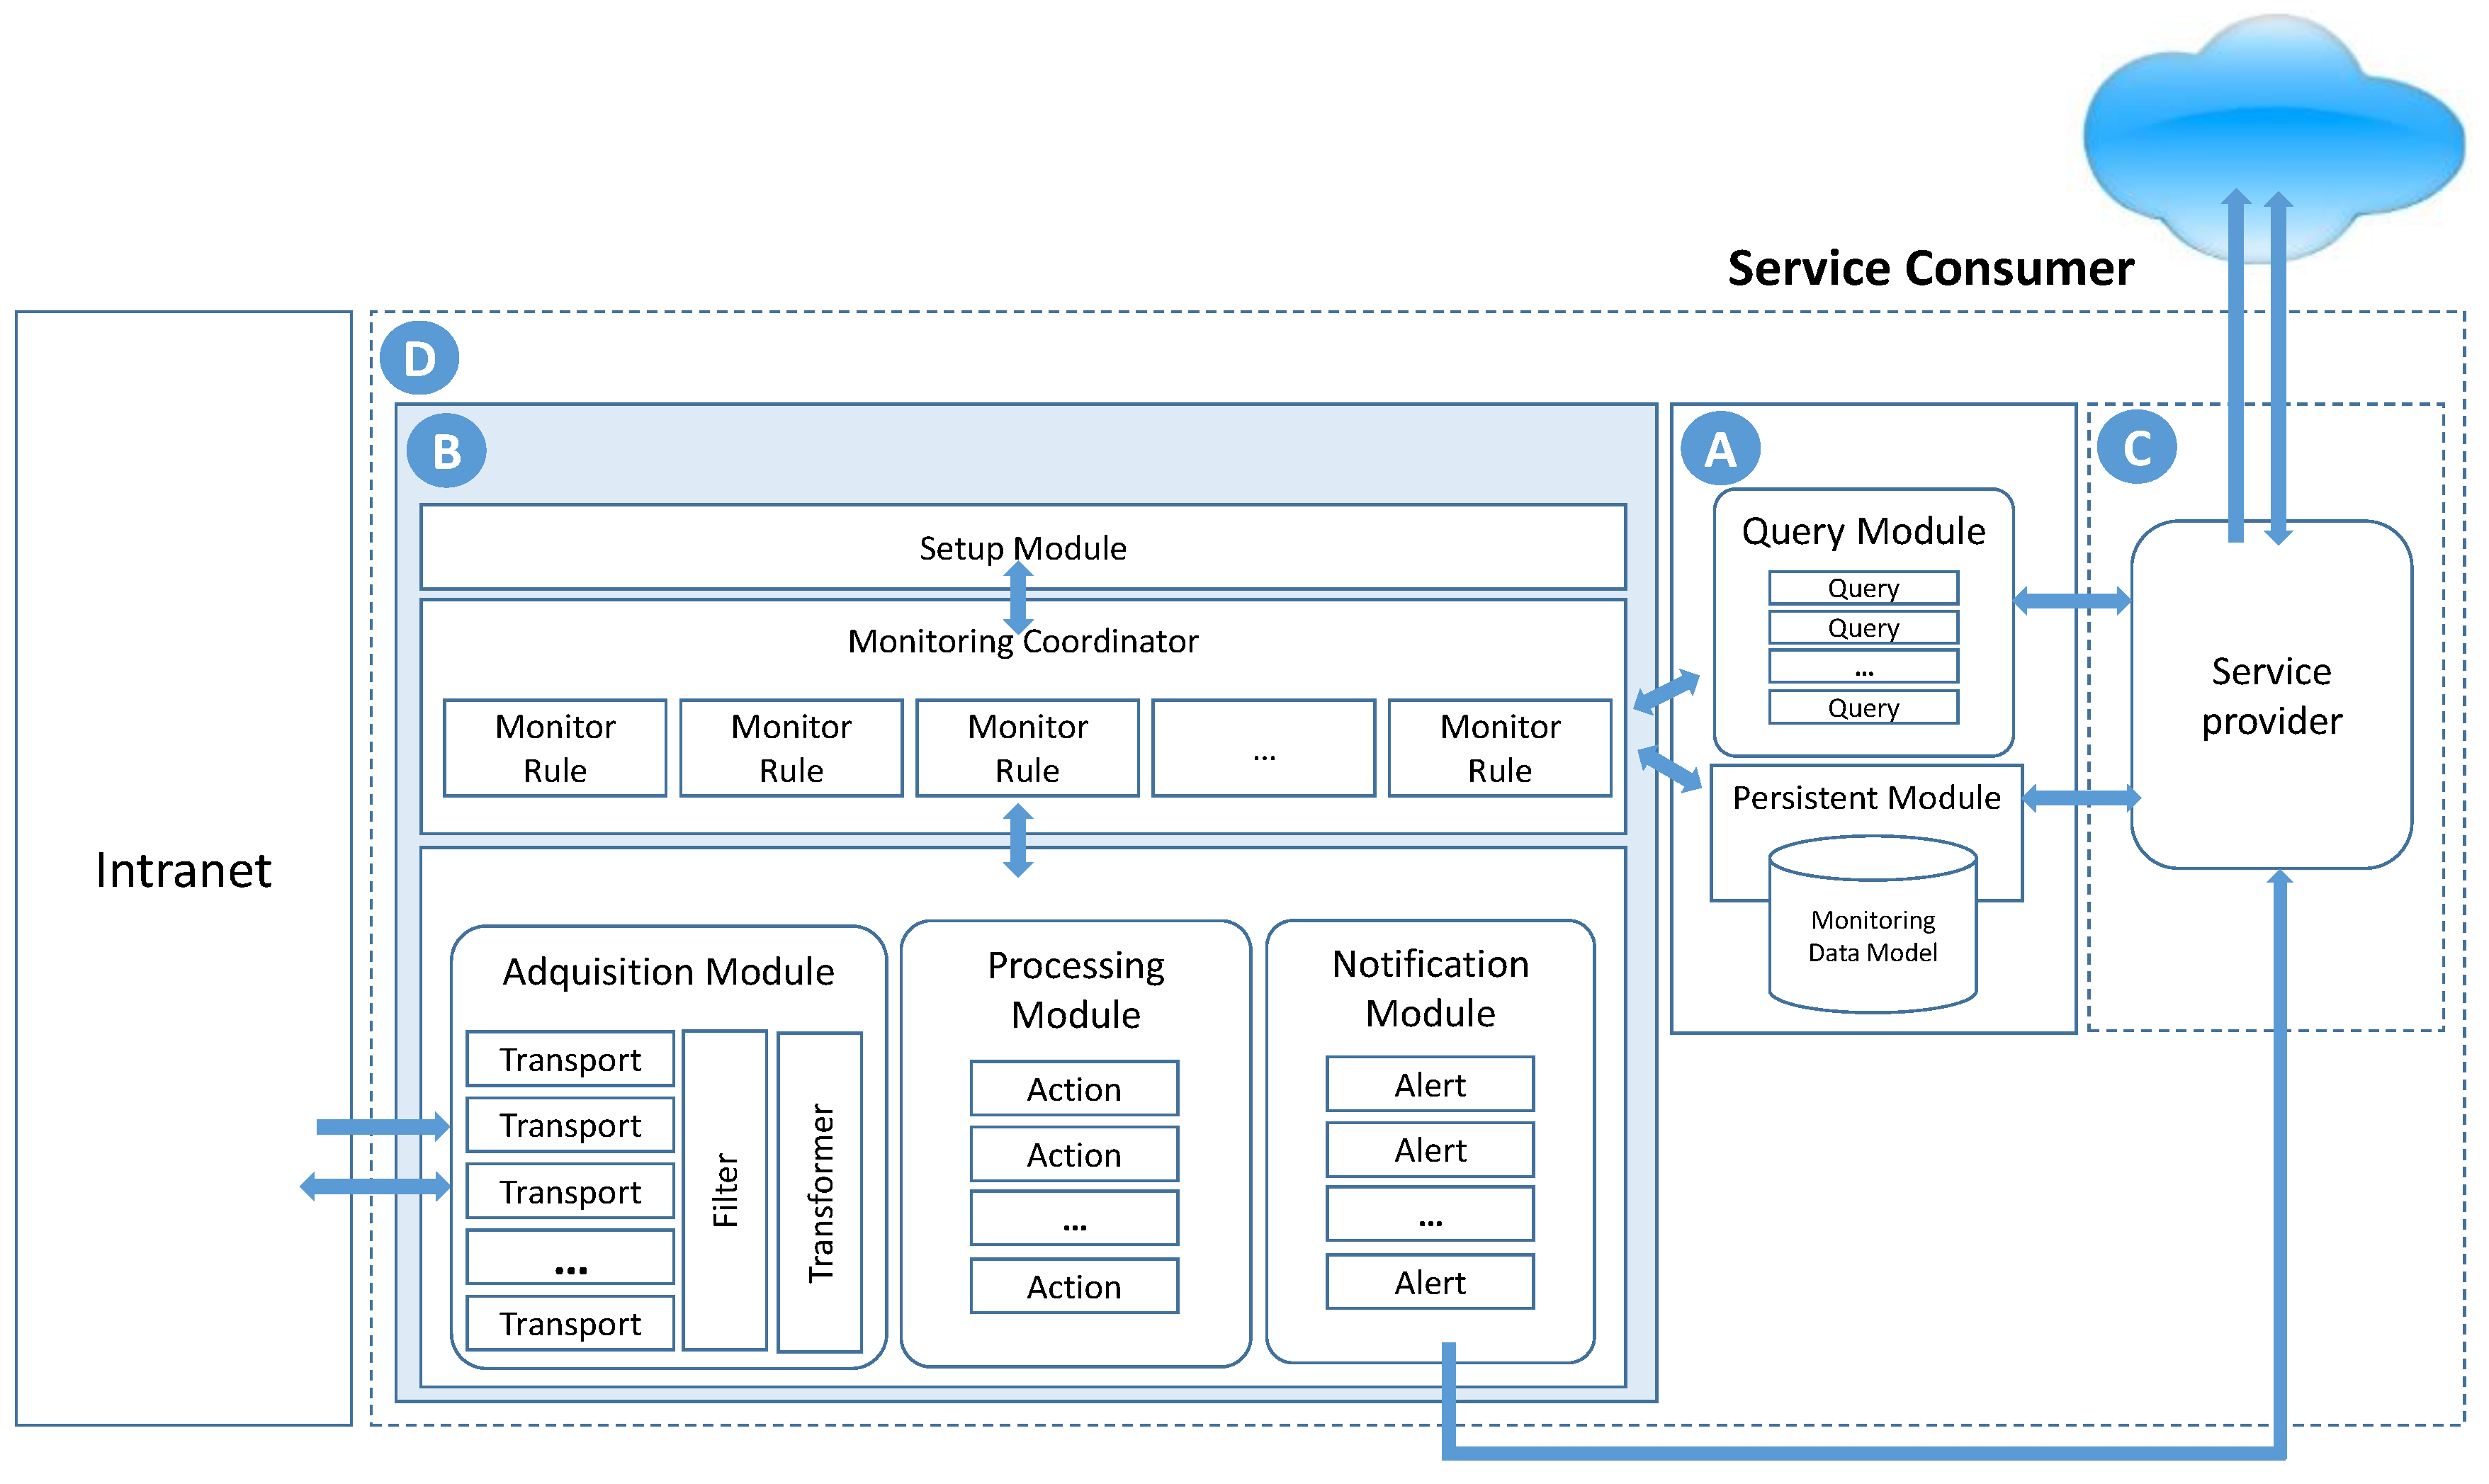
To reach these objectives, the proposed model is composed of three functional modules (acquisition, processing and notification), a configuration module (setup) and a central coordination element (monitoring coordinator), as seen in
Figure 3.
The acquisition module is one of the principal elements of the functional monitoring model; it is responsible for acquiring information (atomic indicators) in heterogeneous environments, such as data processing centers, independently of the source or format. It offers a valid solution for any type of environment for the resources to be monitored. To achieve transparency, this module incorporates integration patterns: denominated bridging, message filter, data model transformation and data format transformation patterns [
27,
28]. The protocol-bridging design pattern is implemented by various transport modules for different schemes and protocols for data acquisition. By means of this, generality and flexibility are contributed to the model, allowing the probe to adapt to the needs of the monitored system. In this way, a set of indicators obtained by different network protocols could be added to the MS including: management protocols, such as SNMP; control protocols, such as internet control message protocol (ICMP); transfer protocols, such as HTTP; log messages protocols, such as Syslog; and, in general, any standard protocol based on Internet standards. This represents one of the main novelties of the proposal, unlike other systems that are dependent on specific protocols. The message filter pattern is implemented by the Filter component, which is responsible for determining which information acquired is valid and which is to be discarded. The other two patterns are implemented by the transformer component, shown in
Figure 3. The objective of the transformer is to normalize the format of the message through which the data were received to store and process the information. In this way, we can automatically remove the heterogeneity problems associated to the message structure, the data format, and the communication protocol used by the acquisition module.
The second component, the processing module, is responsible for transforming the information obtained into useful data for the consumers of the system. To that end, the module is composed of a series of self-contained units termed Actions that determine how the transformation operations are to be performed to obtain the calculated indicators. Each indicator defined by the organization will be associated with an action; this will allow the system to create as many calculated values as needed for decision-making, increasing the capacity for system adaptation and flexibility.
The third functional component, the notification module, gives the system proactivity by establishing a set of alerts and notices that are launched when a monitoring rule detects, for example, that an indicator is outside pre-established values. The notices will be directed to a series of destinations interested in the event. This functionality is encapsulated through the components termed Alert (
Figure 3).
All of the functionalities of the system described previously, along with the setup module, are used by the monitoring coordinator (
Figure 3). This is the central nucleus of the architecture and provides the flexibility characteristics to the proposal by allowing it to adapt quickly to each type of scenario. This element is responsible for asynchronously coordinating the execution of each of the monitoring rules defined previously. Each of these rules represents an autonomous and independent monitoring flow executed through a rule-monitoring agent (monitoring rule) created by the monitoring coordinator. The monitoring coordinator initially uses the setup module to configure and parametrize its own operation and that of the monitoring rules.
The flows executed by each of the monitoring rule agents, through the orchestration of their elements, implement all of the objective functions of the network probe: acquisition of monitoring information, processing of the data, or combinations of both. The objective is to obtain the atomic and calculated indicators and send alerts and notifications.
In one case, a rule agent may launch a flow for acquisition of monitoring information through the acquisition module and its elements. This flow may orchestrate the incorporation of several connectors, filters and transformers to obtain the desired atomic indicators.
A second case is centered on workflows for information processing to obtain the calculated indicators that contribute added value to consumers and aid in decision-making. When the monitoring rule agent is launched by the coordinator, it calls on the action component associated with the indicator in the processing module. The action component requests the necessary information from the monitoring rule agent to carry out the calculations, which, depending on the information required, uses both the acquisition module, obtaining atomic indicators in real time, and the query module, obtaining information from the monitoring history. When the monitoring rule agent responsible for that flow acquires all the information, it returns it to the action component, which calculates the indicator, subsequently returning it to the monitoring rule agent, which stores it in the monitoring database.
The last type of flow is related to the sending of notifications by way of the notification module, as indicated previously.
3.3. Definition of Provisioning Model
Another novel aspect of this proposal with respect to related studies is the interaction with external entities and systems. While monitoring has been presented as an element that is part of the system, with a strong coupling and dependence on the rest of the modules, this proposed model is presented as an interoperable and proactive value-added service, independent and autonomous, capable of offering its results as useful information to third parties to satisfy their needs. These objectives are conducted in the present sub-process.
In addition, due to the distributed approach of the proposal, the system must be capable of growing to support complex environments with large processing needs when acquiring and transforming the information (scalability). The detected absence of this in the current proposals results in an important deficiency for the efficient functioning of data centers.
The service proposed is provided through the two interaction models: B2B (business to business) and B2C (business to customer). In both cases, the proposal is based on providing a service based on the principles of the SOA paradigm [
27,
28], implemented through the RESTful architectural style, and offering the resulting information through the Javascript object notation (JSON) format so that it is light and easily interpreted. Achieving a model aligned with SOA principles (interoperability, discovery, well-defined contract, reusability, autonomy, composable, decoupling, coarse grained functionalities, business-aligned) we derived a set of benefits deemed necessary to resolve the problems found in the related works.
The approach based on the B2B paradigm is geared toward the interaction of the service with external consumers, contributing the consumption indicators through an interoperable application programming interface (API). The external consumers could be, on the one hand, energy management systems that need information from the probe for decision-making or, on the other hand, other monitoring probes that require the indicators to carry out their own monitoring flows. This module implements two types of message exchange patterns. A first approach is based on the request–response pattern, exhibiting passive behavior in the probe when the consumer requests the indicators needed for its operation and the monitoring service provides them. A second novel approach implements the proactive behavior of the monitoring service through a notification pattern, which complies with the SOA eventing principle. In this approach, consumers that were previously configured for specific indicators in the monitoring probe are alerted when the indicators take on anomalous values, also previously parametrized. This last approach offers a more efficient and unattended model.
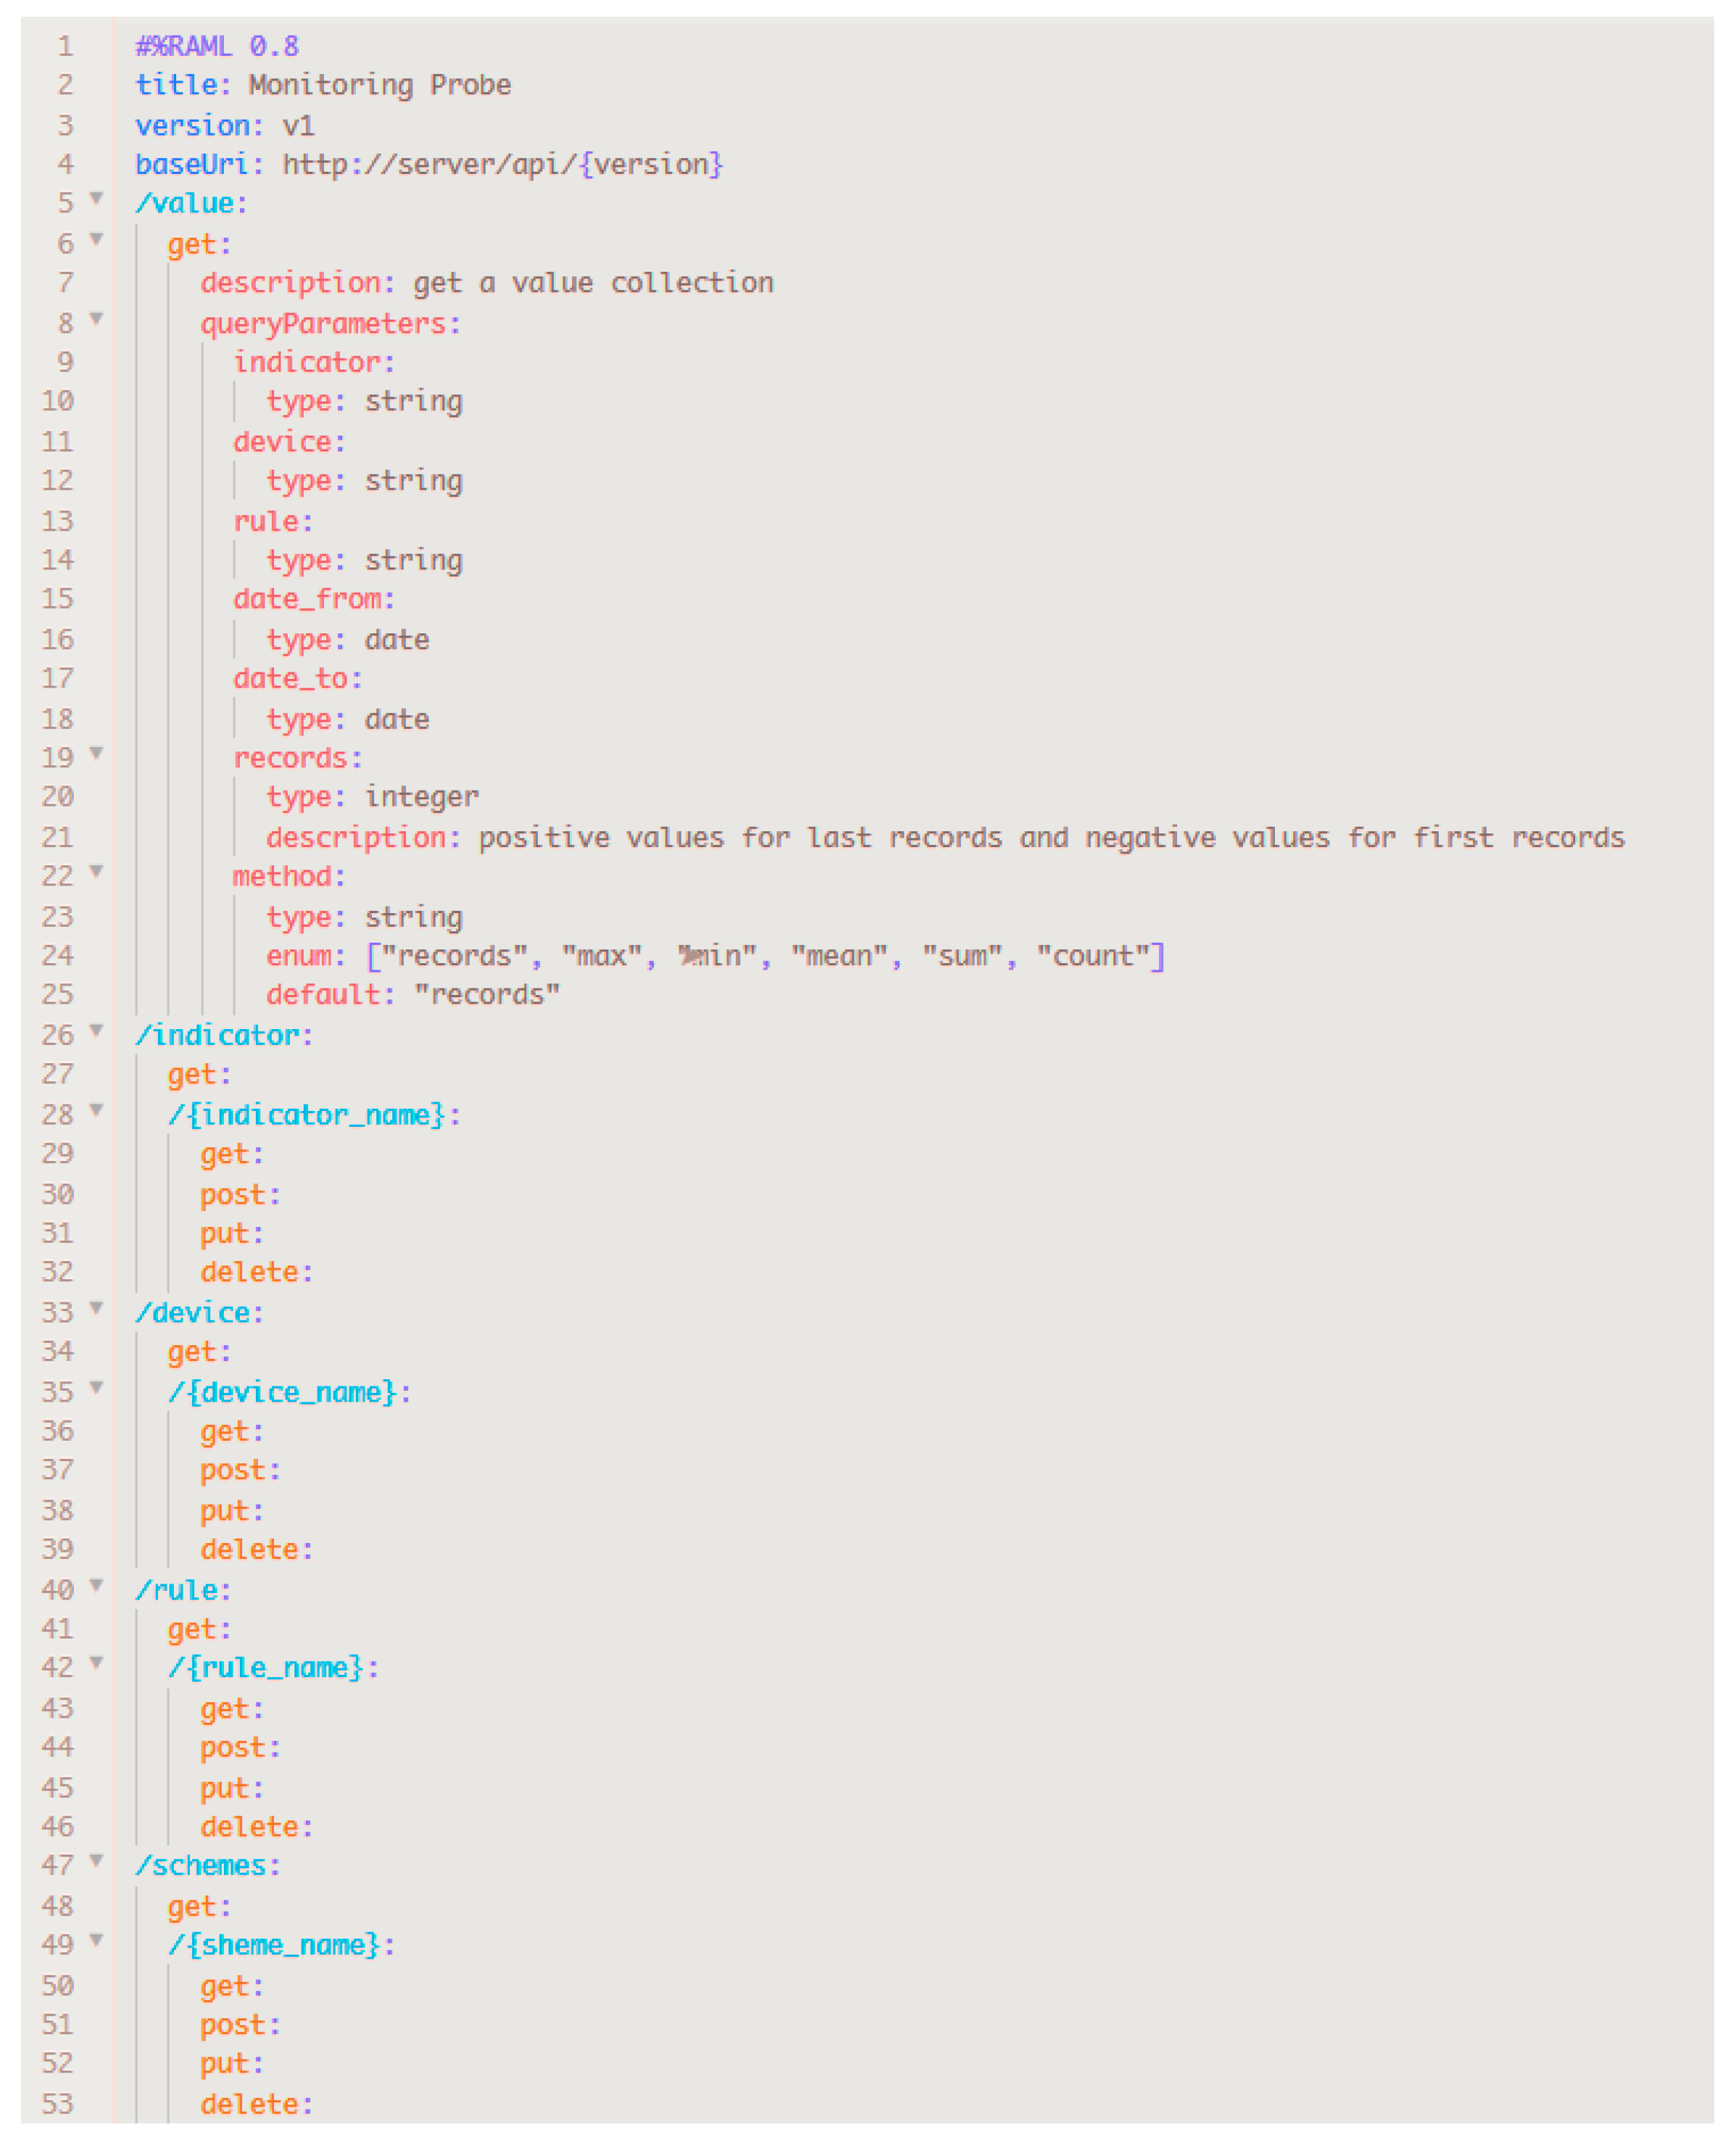
To increase the interoperability, the monitoring service exposes its functionalities through a well-defined contract based on the RESTful API modeling language (RAML) language, as shown in
Figure 4. This both enables and ensures that information published about the proposed service and its functionality is readily discoverable and interpretable. This is achieved because our proposal model is aligned with the SOA discovery principle.
The second approach, B2C, is sustained on the service capacities of the previous model. However, it is geared toward providing an interface for human–machine interaction that allows a user to directly interact with the MS, for example, through a light client such as a Web browser. The access interface of this approach defines the access to the different indicators, their creation and classification, the subscription to alarms for specific indicators and the parametrization of the system or the definition of flows, among other things.
Lastly, the proposals analyzed to this point were focused on controlled and very specific scenarios. However, the proposal presented here can address complex, general-purpose and uncontrolled scenarios. Both information acquisition and its subsequent processing could represent an excessive load for the system’s capacity, leading to a possible loss of information in the process of acquiring it or to the generation of unreliable values due to their slow processing. The design with the various modules and flows defined in the previous sub-process, along with the distribution and communication capacities conferred by the SOA approach, provide the monitoring probe with a high capacity for scaling, another of the objectives of the formulated problem. This design enables the distribution of acquisition and processing flows to dedicated probes to avoid bottlenecks and ensures that the results can be used as input information for an external energy management system or for another monitoring probe.
3.4. Definition of Deployment Model
This process has the objective of establishing the physical architecture to support the implementation and deployment of the elements and functionalities identified in the previous processes, which constitute the monitoring model.
There are three main options for this design. First, one can choose to locate the various elements of the model in the servers of the data center themselves; this would affect the performance of the servers, their services and their tolerance to errors because an error in the MS could provoke server breakdown. Second, one can implement the model in dedicated monitoring servers. However, this option presents the disadvantages of increasing energy consumption, which is intended to be reduced, and increasing cost.
Considering the disadvantages of the first two options, our proposal is based on using a distributed architecture of autonomous embedded devices. This design presents the following advantages:
Autonomy. As a result of the devices being independent, they manage monitoring autonomously, without affecting the performance of the data center servers.
Scalability. The distributed architecture of the system facilitates scalability by simply adding more embedded devices as the resources of the data center increase.
Robustness. It is a dedicated platform used exclusively for the service.
Low cost. The cost of embedded devices is considerably lower than that of dedicated servers.
Low energy consumption. As with the previous point, energy consumption of embedded devices is much lower than that of dedicated servers.
Therefore, the MS will be deployed in an embedded device to attempt to reduce the energy consumption contributed by the monitoring model itself as much as possible. This is feasible because the system does not require high hardware performance.
Physically, the system has been designed as an intelligent sensor with three main elements: a sensor, a microprocessor and memory. The sensor, strictly speaking, will monitor energy consumption information obtained directly from the data center infrastructure: fundamentally, a network adapter on the local area network (LAN) whose traffic is to be monitored, which will provide the device with connectivity to the systems to which it offers its service. This element provides the sensory capacity: a microprocessor. It will have embedded additional functionality as an intelligent probe, obtaining calculated variables, applying defined filters, etc. In addition to processing capacity, the sensor has been given a non-volatile internal memory to store the information obtained and calculated by the intelligent probe relative to the data model, giving the probe the capacity of persistence.
The embedded device has sensory, processing, memory and communication capacities, which make it an intelligent sensor or probe.
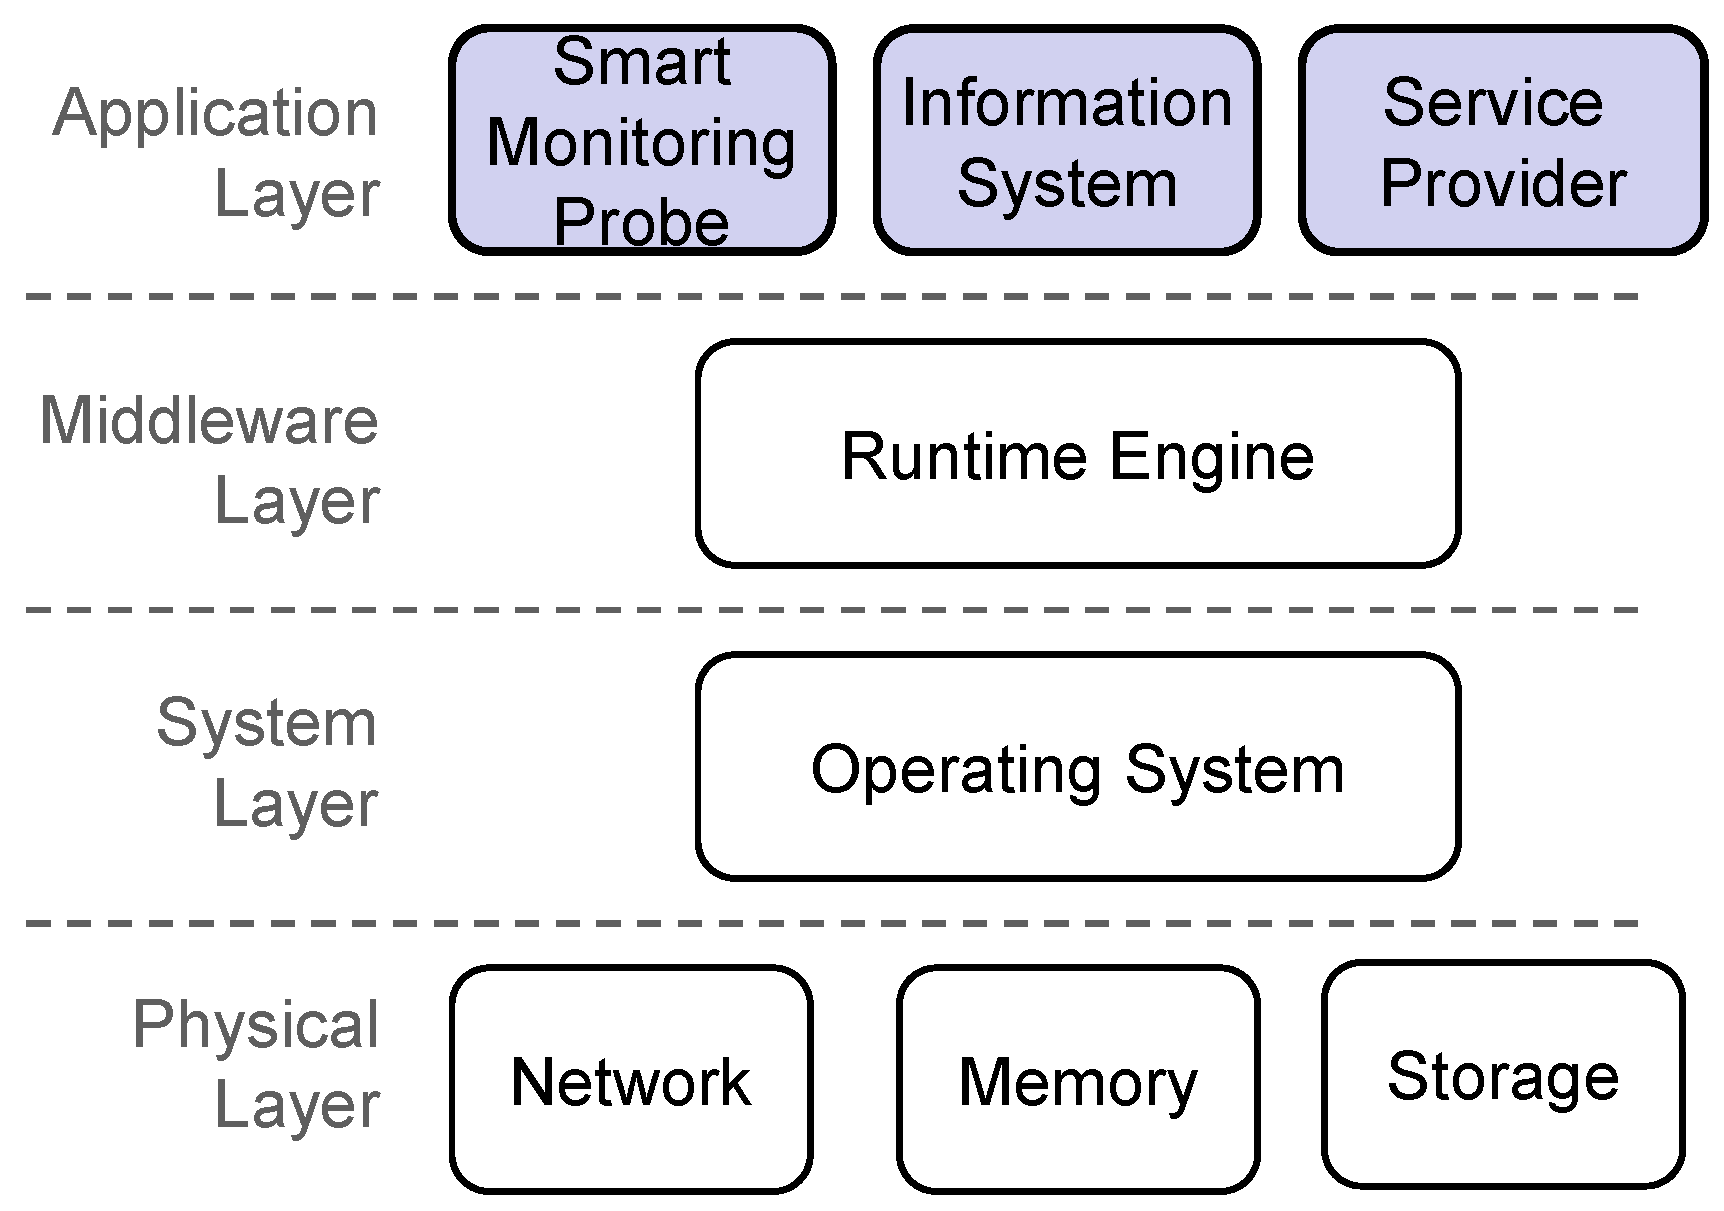
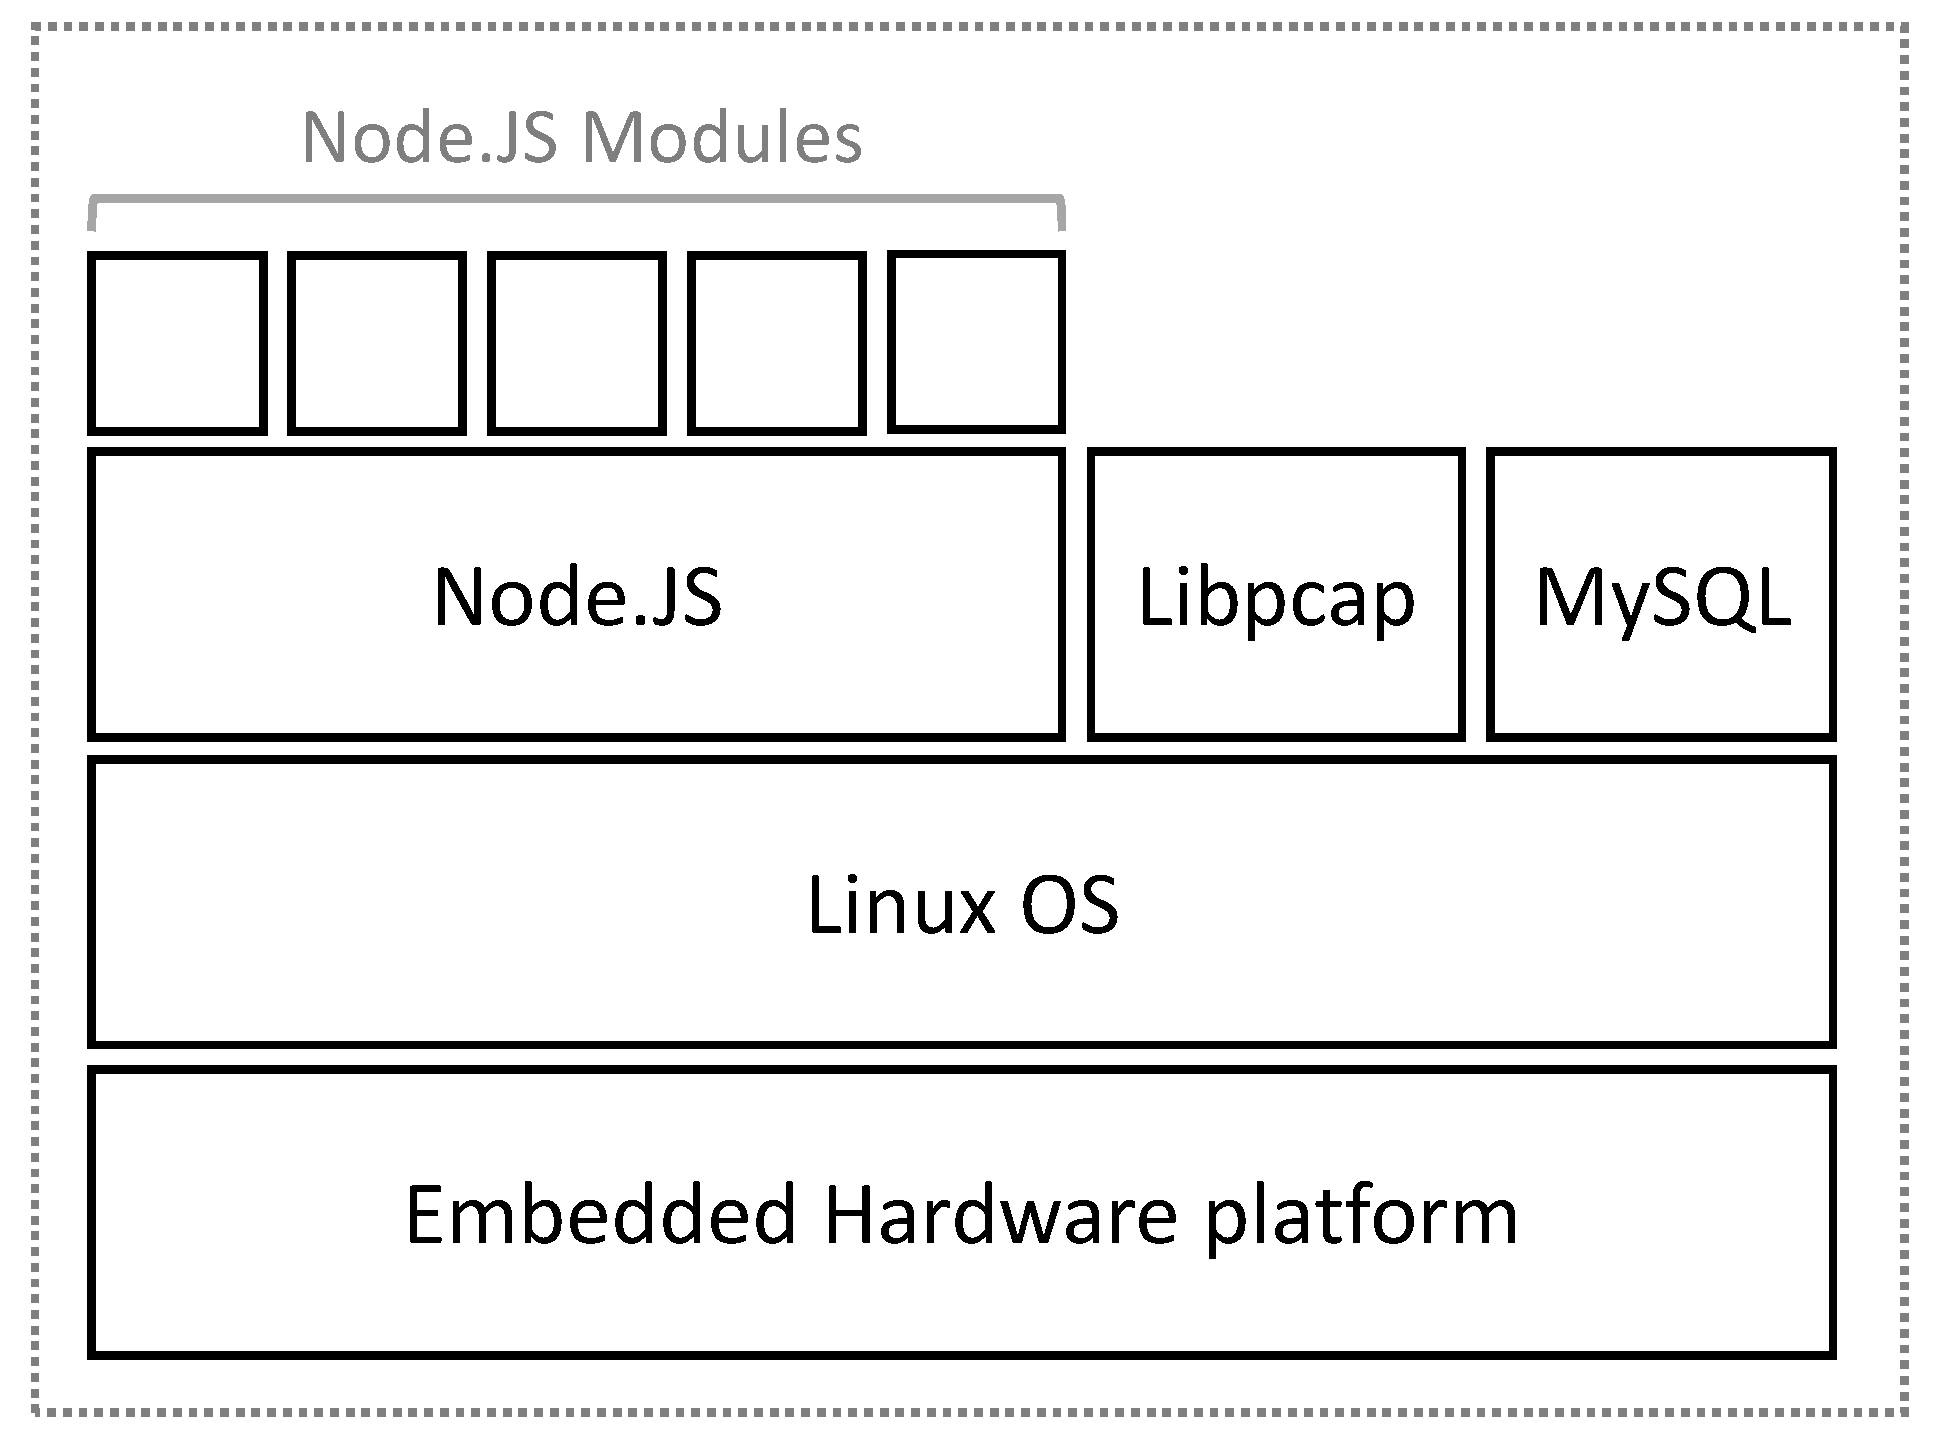
If the MS can be considered physically an intelligent sensor, functionally the system can be considered a monitoring «service», whose software architecture is organized into layers as follows (
Figure 5).
A. Physical layer
Functionally, this layer encompasses the physical resources of the device or the medium to which it is connected: specifically, the data center network interface, from which information is obtained, the principal memory of the device and the secondary storage memory in which the raw or processed information will be stored persistently.
B. Operating system layer
This layer contains the modules that provide access to the basic resources of the physical layer (network adapters, memories), encapsulating them and providing a uniform vision to the upper layer, free from physical details. The principal modules needed by the operating system are the network and disk E/S management modules in addition to a simple file system to facilitate non-volatile memory management and the implementation of the TCP/IP stack, which is fundamental for all the application layer processes.
C. Runtime engine layer
Given that flexibility is a primary objective and that both information processing and creating complex variables through calculations with other variables are needed, a base platform was selected based on an interpreted language that allows quick editing of formulas and algorithms without needing a re-compile with each modification. Although platforms based on interpreted languages have lower performance than those based on compiled languages, they contribute valuable characteristics such as independence from the platform, reflection, dynamic data types, flexibility and agility [
29]. In addition, by using in-flight compilation techniques, performance differences are increasingly less significant.
D. Application layer
Functionally, this is the most important layer; it includes the main functional components of the device. Depending on the probe design as previously described, the global functionality of the system has three main components: the intelligent monitoring probe, the information service and the service providing module. The functionality of each of the modules in the application layer has been described in previous paragraphs.


 ,
, 


