Article

Optimal Planning of Sustainable Buildings: Integration of Life Cycle Assessment and Optimization in a Decision Support System (DSS)

1
Department of Civil, Chemical and Environmental Engineering (DICCA), University of Genoa, Via Opera Pia 15, Genova 16145, Italy
2
D’Appolonia S.p.A., Environment and Sustainability Business Unit, Via Liri 8A, Genova 16145, Italy
3
Department of Informatics, Bioengineering, Robotics and Systems Engineering (DIBRIS), University of Genoa, Via Opera Pia 13, Genova 16145, Italy
*
Author to whom correspondence should be addressed.
Energies 2016, 9(7), 490; https://doi.org/10.3390/en9070490
Submission received: 14 March 2016 / Revised: 20 May 2016 / Accepted: 20 June 2016 / Published: 24 June 2016
(This article belongs to the Special Issue Life-Cycle Assessment of Energy Systems in Current and Evolving Grids)

Abstract

:
Energy efficiency measures in buildings can provide for a significant reduction of greenhouse gas (GHG) emissions. A sustainable design and planning of technologies for energy production should be based on economic and environmental criteria. Life Cycle Assessment (LCA) is used to quantify the environmental impacts over the whole cycle of life of production plants. Optimization models can support decisions that minimize costs and negative impacts. In this work, a multi-objective decision problem is formalized that takes into account LCA calculations and that minimizes costs and GHG emissions for general buildings. A decision support system (DSS) is applied to a real case study in the Northern Italy, highlighting the advantage provided by the installation of renewable energy. Moreover, a comparison among different optimal and non optimal solution was carried out to demonstrate the effectiveness of the proposed DSS.

Graphical Abstract

1. Introduction

The overall increment in wellbeing and the increasing use of technology are leading western countries to an expansion in terms of energy demand and production [1]. Nowadays, 40% of the energy production in Europe is used for buildings [2]. Hence, in order to comply with the Kyoto Protocol and the United Nations Framework Convention on Climate Change (UNFCCC), it is necessary to create new policies in order to better regulate the energy performance of the building sector, to guarantee the efficient use of resources, sustainable energy production, and the wide difusion of renewables [3]. The primary objective of Directive 2010/31/EU is to transform all the European buildings into “Nearly Zero Energy Buildings” (NZEBs) requiring all member states to set minimum energy performance requirements for new and existing buildings, and to ensure energy certification and disciplinary controls on the plants [2]. In fact, the reduction and limitation of energy use in buildings is necessary because more that 70% of residential buildings in the 15 European Union (EU) Member States are reported to be built before 1972, when the thermal standards were poorer than those imposed by the actual European regulation [3].
NZEB regulations are then gaining the interest of the global market, leading to a massive European refurbishment of almost 150 million dwellings, and a commitment to climate change mitigation actions [4]. Since the majority of European countries have still not adopted the NZEB regulation [5], European countries have to encourage the refurbishment of buildings, the use of renewable energy in buildings, and the achievement of energy-saving targets exploiting the great unrealized potential for energy savings [6].
In this framework, it is necessary to create new interdisciplinary research groups able to integrate competence in the environmental and energy field on the basis of sustainable development, green economy and life cycle concepts, trying to assess the environmental burdens of buildings [7,8]. Though LCA has mainly been applied to products, in the last decade it was applied in identifying more sustainable options in process selection and design. The quantification of environmental impacts is very important to support decisions. However, other issues (costs, technical requirements, etc.) should also be considered when technologies are defined for buildings. With this aim, there is a huge literature on optimization of energy systems, with specific reference to building efficiency [9].
In fact, the energy system design process and the analysis of a building’s energy consumption and cost is a critical step in determining the performance of a building. Nonetheless, business constraints fail to investigate different design combinations, leaving decision makers to decide based on their own knowledge. This generally leads to undersizing or oversizing of the building’s technologies, generating a significant negative effect on the energy and environmental performance and initial investment cost of the building [10].
The aim of this work was to define and implement a DSS that integrates LCA methodology and optimization algorithms for the optimal choice and sizing of technologies for energy generation in a building. The choice of the different technologies is based on indicators (costs, environmental impacts) that are formalized in the objective problem as objective functions and/or constraints.
Approaches can be found in the recent literature that consider LCA tools or optimization algorithms [11,12,13,14,15,16,17,18,19,20,21,22]. Instead, in this work, both LCA and multi-objective tools are integrated in a unique DSS. The creation of tools that include LCA and optimization algorithms offers potential for technological innovation in structure through the selection, over the whole life cycle, of the best alternatives [23]. Up until now a NZEB-compliant methodology solving all the problems of the complex interplay of energy production and consumption in buildings was not available [24,25]. Moreover, the proposed DSS can be applied to general buildings and use cases: residential and industrial areas, agricultural systems, buildings including offices, manufacturing systems, university campuses, etc. [26,27,28].
In the following, Section 2 describes how the LCA methodology is used and included in the proposed DSS. Then, the optimization problem is formalized in Section 3, while the application to a case study and conclusion are reported in Section 4 and Section 5, respectively.

2. Life Cycle Assessment

Life cycle assessment (LCA) is a science-based methodology mainly used to calculate the environmental burden of products [29]. It can be used to improve products over their life cycle, providing quantitative results of their environmental impacts. LCA results are used to inform stakeholders and thus contribute to rational decision-making [30]. However, due to the relative complexity of LCA studies, which usually present up to hundreds of different results, simplified LCA methodologies are largely used, focusing on just one or some of the life cycle phases or a reduced number of indicators. A simplified LCA methodology can generally be sufficiently accurate to help the decision making for building management [31], while a comparative LCA approach is recognized as an effective tool for evaluating resource efficiency in cleaner production alternatives [32]. The first stage of this work was to select suitable technologies for the generation of electricity, adaptable to the energy production of a civil building. In this work, the selected technologies are:
-
photovoltaic (PV) panels, (multi-Si and single-Si);
-
small wind turbines (1 kW, 6 kW);
-
natural gas micro-turbines (for cogeneration 100 kWe);
-
supply from the grid (Italian mix).
A single issue LCA analysis of these technologies has been conducted, in order to evaluate their global warming potential emissions. For every technology, the whole life cycle has been considered comprehensively, including the installation, operation and maintenance stages. It must be specified that the decommissioning phase, i.e. the end-of-life of the respective technologies, is excluded from the system boundaries. Effectively, the end of life of small plants and electricity generation technologies, such as the ones discussed in this research, represents a negligible part of the total life cycle impacts, both in terms of resource use or environmental impacts [31]. For the impact assessment phase, a carbon footprint is accounted in kg CO2 equivalents (CO2eq) by using the characterization factors according to the fifth Intergovernmental Panel on Climate Change (IPCC) report [33] considering a 100 year time frame, and by using OpenLCA 1.4 software [34].

2.1. Photovoltaic Panels

Solar photovoltaic (PV) is a commercially available and reliable technology with a significant potential for long-term growth in many countries [35]. The International Energy Agency (IEA) estimates that, by 2050, PV will provide around 11% of the global electricity production avoiding 2.3 gigatonnes (Gt) of CO2 emissions per year [36]. Models are necessary to define the size of a photovoltaic plant, on the basis of the observation of the Sun at all stages of the annual shading, and of many other factors related to the study site and the specific technology [37]. In the proposed DSS, different PV technologies are considered: two different kind of materials (monocrystalline and polycrystalline), and three different kind of installation (flat roof, slanted roof and facade). Multi-Si panels have a nominal peak power of 180 W and a surface of 1.175 m2; while single-Si panels have a nominal peak power of 240 W and a surface of 1.264 m2. LCA methodology is implemented for the six possible configurations. Background and foreground data come from Ecoinvent 2.2 database [38], but an update was performed and needed due to current improvements in technology efficiency. The update takes into consideration the increase of efficiency and the different surfaces of the considered panels. The impacts resulting from the calculation expressed in kg CO2 eq/panel are reported in Table 1.

2.2. Small Wind Turbines

Large and medium scale wind turbine systems represent a good alternative to conventional energy supply systems to produce renewable energy [22]. In particular, small wind turbines, represent a largely unexploited possible way to produce renewable energy in an urban context, reducing cities’ GHG emissions [39]. The assessment of the annual energy output of a wind turbine can be achieved by knowing the frequency distribution of wind speed, the average height of the rotor, and the power curve of the machine. For each speed class it is possible to achieve different power production values for the corresponding number of hours/year persistence of the wind speed [40]. The sum of the energy production for all classes of the wind speed is equal to the total annual energy production [41]. In the proposed DSS two different size of wind microturbine are considered: 6 kWh and 1 kWh. Background data retrieved from Ecoinvent 2.2 database have been used. Since life cycle inventory data for micro wind turbines are not found in the literature, foreground data are scaled starting from the 150 kW turbine listed in the database. The cost scaling law, reported in Equation (1) [42] is used to scale the considered process for the considered turbine life cycle. This method has already been used by other studies [43] to scale the inventory data from a bigger turbine to a desired size:
C 2 = C 1 × ( X 2 X 1 ) b
where C2 is the data needed for the unknown turbine, C1 is the data available for the known turbine, X2 is the nominal power of the unknown turbine, X1 is the nominal power of the known turbine and b is the scaling factor. Commonly, scaling factors between 0.5 and 1 are applied. However, a scaling factor of 0.6 is recommended when no data are available [43]. Table 1 reports the assessment results in kg CO2 eq/turbine.

2.3. Natural Gas Micro Turbine

Cogeneration is the process of simultaneous production of electrical and thermal power. Micro-turbines for cogeneration and distributed generation are reaching a remarkable market penetration. Part of their success is due to dvancements in the field of electronics, which allow operation and connection to the grid even in the absence of an operator [44]. The micro-turbine systems have many advantages over traditional energy production engines, such as high power density and efficiency, low pollutant emissions, and few maintenance operations thanks to the low number of moving parts [45]. Micro-turbines can use most commercial fuels, such as natural gas, propane, diesel and kerosene. They can also be fed with biogas and vegetable oils [46]. In the proposed DSS a 100 kW turbine is considered as a suitable technology. A LCA is implemented to assess the greenhouse gas emissions for the production, installation and maintenance phases for the micro-turbine. Background and foreground data from the Ecoinvent 2.2 database are used in this assessment. Table 1 reports the assessment results in kg CO2 eq/turbine.

2.4. Electric Grid

In this work, grid-connected buildings are considered [25], and thus the national electric grid system is considered as one of the possible solutions to answer the energy needs. A LCA had been implemented using as 1 kWh functional unit purchased by the Italian national electric grid. Background and foreground data come from Ecoinvent 2.2 database [38], even if an update of the energy mix has been applied, taking into account data from Terna, for 2013 (Terna is the company that manages the Italian electric network [47]).

2.5. Life Cycle Costing for the Different Technologies

Each of the previously discussed technologies has been analyzed from a life cycle costing (LCC) perspective, in order to assess the financial burden during the life cycle of each one of them. Accordingly with the LCA system boundaries, the end of life and dismantling of the technologies are not taken into account in this research. The data to perform the LCC analysis have been collected by an investigation of producers’ price list and survey among the technologies producers. A 20 year life span is considered. For what concerns the natural gas and electricity costs, the data come from the Italian Energy Authority, and refers to the year 2015 [48]; with the hypothesis that this costs will be stable in the time horizon considered in the tool. Table 2 shows the economic data inputs used in the tool.

3. The Optimization Problem

The main aim of the developed decision tool is to integrate LCA [15] and optimization techniques [49,50]. The decision variables are mainly represented by the number and the kind of photovoltaic units, wind turbines and micro-turbines to be installed for a grid-connected building. Moreover, there is the decision variable related to how much energy to buy from the grid. An objective function has been formalized that includes both costs and CO2 emissions. LCA is done for each kind of technology and provides input parameters for the optimization problem. In the following, the decision variables, the objectives and the constraints are described in detail for each technology.

3.1. Power from Photovoltaic

The power from the PV is a function of parameters (a-priori known) and decision variables (that are the results of the optimization model). A fixed PV small power station, installed with an optimal orientation is considered for the optimization problem. Specifically, the parameters in this case are:
  • p = 1 ,   ,   P : Set of the different PV technologies;
  • S p : Surface of a single module for the p-th technology [m2];
  • C p : Cost of a single PV module for the p-th technology (including shipping, installation and maintenance) [€];
  • C O 2 p : Amount of pollutants released in the atmosphere calculated with the LCA methodology, for the p-th technology [kg CO2 equivalent/PVmodule];
  • S a v v , p : Building surface available for the p-th technology [m2];
  • E p * : Energy that can be produced by the module of surface Sp for the p-th PV module [ k W h /   y e a r ], given by:
    E p * = η p   × S p × H × L    p   = 1 , , P
with:
η p : Efficiency of the panel for the p-th technology;
H : Annual solar irradiation incident on the surface of the modules [ k W h /   m 2   y e a r ] .
L : Percentage of losses on the total energy produced, due to factors such as: reduction of efficiency due to the aging of panels; resistive losses; non optimal temperature gap.
Instead, decision variables are here represented by:
  • N p : Number of modules of the technology p-th to be purchased;
  • E p T O T : Energy produced by the PV modules [kWh], given by:
    E p T O T = p E p × T
where:
E p : Energy that can be produced by a PV module of the p-th technology [ k W h / m 2   y e a r ], given by E p = E p *   · N p , p = 1,…P;
T : Timeframe considered, equal to 20 years.

3.2. Power from Wind

Parameters and decision variables for the calculation of power from wind turbines are here described. It is important to notice that to compile the wind power generation a Weibull distribution analysis, or another methodology to understand the producible energy is needed.
Specifically, parameters are given by:
  • w = 1,..,W: set of different wind turbine technologies;
  • S w : Peak power for a single wind turbine w, w = 1,…,W [ k W ];
  • E w * : Energy producible by a single wind turbine in a year [ k W h / y e a r ], given by a Weibull distribution;
  • C w : Cost of a single wind turbine (including shipping, mounting and maintenance) expressed in [€];
  • C O 2 w : Amount of pollutants released in the atmosphere calculated with the LCA methodology for each kind of wind turbine [kg CO2 equivalent/turbine].
Instead, decision variables are given by:
  • N w : Number of wind turbines to be purchased for the w-th technology;
  • E w T O T : Energy produced by the wind turbines in the time horizon period under study, [ k W h ] given by:
    E w T O T = w E w * × T
with:
  • T : Horizon time considered, in this study is equal to 20 years, and represents the average life time of the technologies under discussion.

3.3. Power from Microturbine

Parameters are here given by:
  • y = 1,…,Y: the set of the different micro-turbines technologies;
  • C g a s : Cost of the natural gas used as fuel in the micro-turbine [€/m3];
  • C y : Cost of the y-th technology [€];
  • η e l , y : Electrical efficiency of the turbine for the y-th technology;
  • η t o t , y : Total technology efficiency, for the y-th technology, given by equation.
    η t o t , y = η t h , y η e l , y 1
where:
η t h , y : Thermal efficiency of the turbine for the y-th technology;
L H V y : Lower heating value of the combustible [kWh/m3];
C O 2 t u r b i n e , y : Amount of pollutants released in the atmosphere due to the production of a micro turbine through LCA methodology [kg CO2 equivalent/microturbine];
C O 2 m e t h a n e : Amount of pollutants released in the atmosphere with due to the extraction and burning of methane with LCA methodology [kg CO2 equivalent/m3 burned].
The decision variables are here represented by:
  • δ y : a binary variable that corresponds to 0 if the y-th technology is not selected, and 1 otherwise;
  • Q y : Fuel required by the y-th microturbine [m3/h];
  • E y T O T : Electrical energy produced by the micro-turbine [kWh], given by:
    E y T O T = y Q y × L H V y × η e l , y × h y × T
with h y being the working hours in one year. h y = 3000   h for a micro-turbine; retrieved from an investigation among producers.

3.4. Power Taken from the Grid

Power from the grid is characterized by a cost due to the purchase and by CO2 emissions that are calculated from the LCA tool and that are representative of the mix of power plants used to produce power for the external grid. In this case, the parameters are given by:
C g r i d : Average cost of energy purchased from the grid [ / k W h ];
C O 2 g r i d : Amount of pollutants released in the atmosphere calculated with the LCA methodology [kg CO2 equivalent/kWh produced].
Instead, the decision variable is here E g r i d , the electricity purchased from the grid [kWh].

3.5. The Objective Function and the Optimization Problem

The objective function is the weighted sum of two main terms: economic costs and CO2 emissions. The overall costs, that takes into account the life cycle cost analysis of the electricity production technologies under study are given by the sum C T O T of:
  • C p T O T : Total cost for the installation and maintenance of the PV plant;
  • C w T O T : Total cost for the installation and maintenance of wind turbines;
  • C y T O T : Total cost for the installation and maintenance of the gas turbine;
  • C g r i d T O T : Total cost for the purchasing of electric energy from the national grid.
Thus:
C T O T =   C p T O T +   C w T O T + C y T O T + C g r i d T O T
C p T O T =   p c p × N p , t
C w T O T =   w c w × N w
C y T O T = y [ Q y × h y × C g a s × T + C y × δ y ]
C g r i d T O T = E g r i d × C g r i d
The total CO2 emissions to be minimized ( C O 2 T O T ) is given by the sum of emissions calculated with the LCA methodology. That is:
C O 2 T O T = C O 2 p T O T + C O 2 w T O T + C O 2 y T O T + C O 2 g r i d T O T
with:
C O 2 p T O T = p = 1 P C O 2 p × N p
C O 2 w T O T = w = 1 W C O 2 w × N w
C O 2 y T O T = C O 2 m e t h a n e × Q y × h y   × T + C O 2 t u r b i n e , y ×   δ y
C y T O T = y [ Q y × h y × C g a s × T + C y × δ y ]
C O 2 g r i d T O T = t = 1 T C O 2 g r i d × E g r i d , t
where:
  • C O 2 g r i d : Amount of pollutants released in the atmosphere calculated with the LCA methodology per kWh of electricity purchased [kg CO2 equivalent/kWh produced];
  • C O 2 g r i d T O T : Amount of equivalent CO2 produced by the inlet from the electric grid calculated with the LCA methodology [kg CO2 equivalent];
  • C O 2 p T O T : Amount of equivalent CO2 produced by the PV installed during the time horizon period under study calculated with the LCA methodology [kg CO2 equivalent];
  • C O 2 w T O T : Amount of CO2 equivalent produced by the wind turbines installed during the time horizon period under study, calculated with the LCA methodology [kg CO2 equivalent];
  • C O 2 y T O T : Amount of equivalent CO2 produced by the micro-turbine, installed during the time horizon period under study calculated with the LCA methodology [kg CO2 equivalent].
Thus, two objective function. The first one to search the optimal solution in accordance with the economic savings, Equation (18). The second one to search the optimal solution in accordance with the minimization of the GHG emission through all the life cycle analysis, Equation (19):
M I N =   C T O T
M I N =   C O 2 T O T
Finally, the optimization problem is characterized by different constraints related to the building and technologies characteristics. The different classes of constraints are reported in the following.

3.5.1. Photovoltaic Plant

A constraint is necessary to state that the available building surface is limited, and that different possible surfaces can host a specific PV technology. This is imposed by:
S p T O T S p , A v a i l a b l e   p   =   1 , , P
with:
S p T O T = p N p × S p   p   =   1 , , P
where:
  • S p T O T is the total amount of surface covered by the p-th PV technology [m2];
  • S p , A v a i l a b l e is the amount of available surface on the roof for the p-th technology [m2].

3.5.2. Wind

The available space for the installation of the wind turbines is constrained for two main reasons: the building’s surface is limited, and it is necessary to avoid possible interferences among neighboring turbines [51]. The resulting equation is:
N w N f i x , w   w   =   1 , , W
where:
  • N f i x , w : Max number of turbines that can be installed;
  • Nw: Number of wind turbines to be installed.
There are a great number of methodologies to assess the optimal displacement of wind turbines. These methodologies are not discussed and presented in this research because the suggestion of the best displacement methods are not in the scope of the here presented optimization algorithm.

3.5.3. Micro-Turbine

For the micro-turbines, it is necessary to state that only one production plant can be installed in the building. This means that the sum of the binary variables associated to the technologies must be at maximum 1. That is:
y = 1 Y δ y 1
Then, the electric energy produced hourly by the micro-turbine cannot exceed the nominal electric power. Thus, it is necessary to add the following constraints:
Q y × L H V y × η e l , y × h y E e l , y N   y = 1 , .. , Y
where:
  • E e l , y N Nominal electric power of y-th technology [kW];
  • E t h , y N : Nominal thermal power of y-th technology [kW];
  • Q y · L H V y · η e l , y · h y , t : Electric energy produced by the y-th technology [kW].
Finally, it is necessary to relate the consumption of fuel Q y to the binary variable because, if the technology is not present, then the consumed gas should be equal to zero. This means that the following constraint must be added:
δ y { 0   i f   Q y = 0 1   i f   Q y > 0   y = 1 , , Y

3.5.4. Energy Balance

Constraints are necessary to guarantee the balance between production and demand. That is:
D e l =   E p T O T +   E w T O T + E y T O T + E g r i d
where:
  • Del: Electrical energy consumption of the building, calculated in the month of peak consumption [kWh/year];
  • E g r i d : Electricity purchased from the national grid [kWh/year];
  • E w T O T : Electricity produced by the wind system in the time horizon period under study [kWh];
  • E p T O T : Electricity produced by the PV system in the time horizon period under study [kWh];
  • E y T O T : Electricity produced by the micro-turbine in the time horizon period under study [kWh].

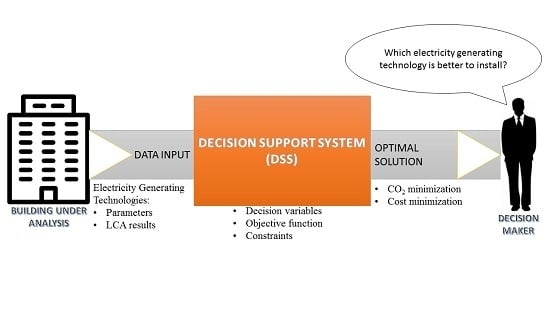
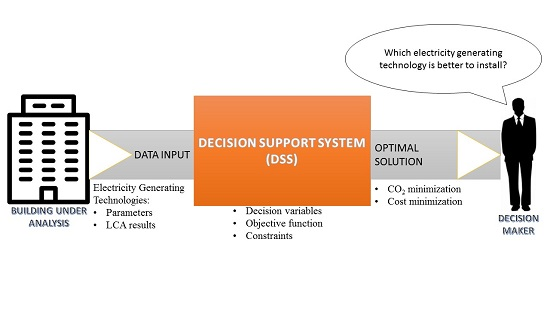
4. Application of the DSS to a Real Building & Results

The proposed DSS has been applied to test its reliability using a real building. The building under study is a condominium situated in Tortona, an Italian small city not far from Genoa, situated 122 m above the sea level in northwest Italy. The condominium is four stories high, composed by thirty-two apartments and four areas on the ground floor employed for different types of commercial activities. The gross floor area of the building is almost 3600 m2. The building is only powered by the national electric grid. The annual electric energy demand of the building was chosen as the highest yearly consumption of the dwelling during the last five years. Moreover this amount is increased by 5% to ensure a range of security and to guarantee the respect of the electricity demand in borderline cases. In conclusion, we assumed 250,000 kWh/y as the annual electric energy demand of the building. The building presents 800 m2 of slanted roof, 200 m2 of flat roof and 150 m2 of façade suitable for hosting photovoltaic panels. The solar radiation has been calculated thanks to the web tool created by the Joint Research Center (JRC) of the European Union [52]. The optimal inclination angle to place the PV on the slanted roof is found to be 35°; while the average global irradiation per square meter received by the modules of the given system is found to be 1680 kWh/m2. For what concerns the micro wind turbines, a maximum of ten turbines of 1 kW size can be installed on a suitable area of the roof, while up to three turbines of 6 kW size can be installed on top of metal poles in the surroundings of the building area; this was calculated taking into account the possible interference among wind turbines. The Weibull distribution methodology was used to calculate the yearly producible energy for each wind turbine. The average wind speed is 4 m/s and was calculated thanks to one year of samples taken with an anemometer situated 16 m above the street level. The power output profile for the wind turbines was retrieved from the manufacturers. In Table 3, the yearly producible electric energy for each kind of PV cell and turbine, calculated with the geomorphologic data of the case study, are reported.

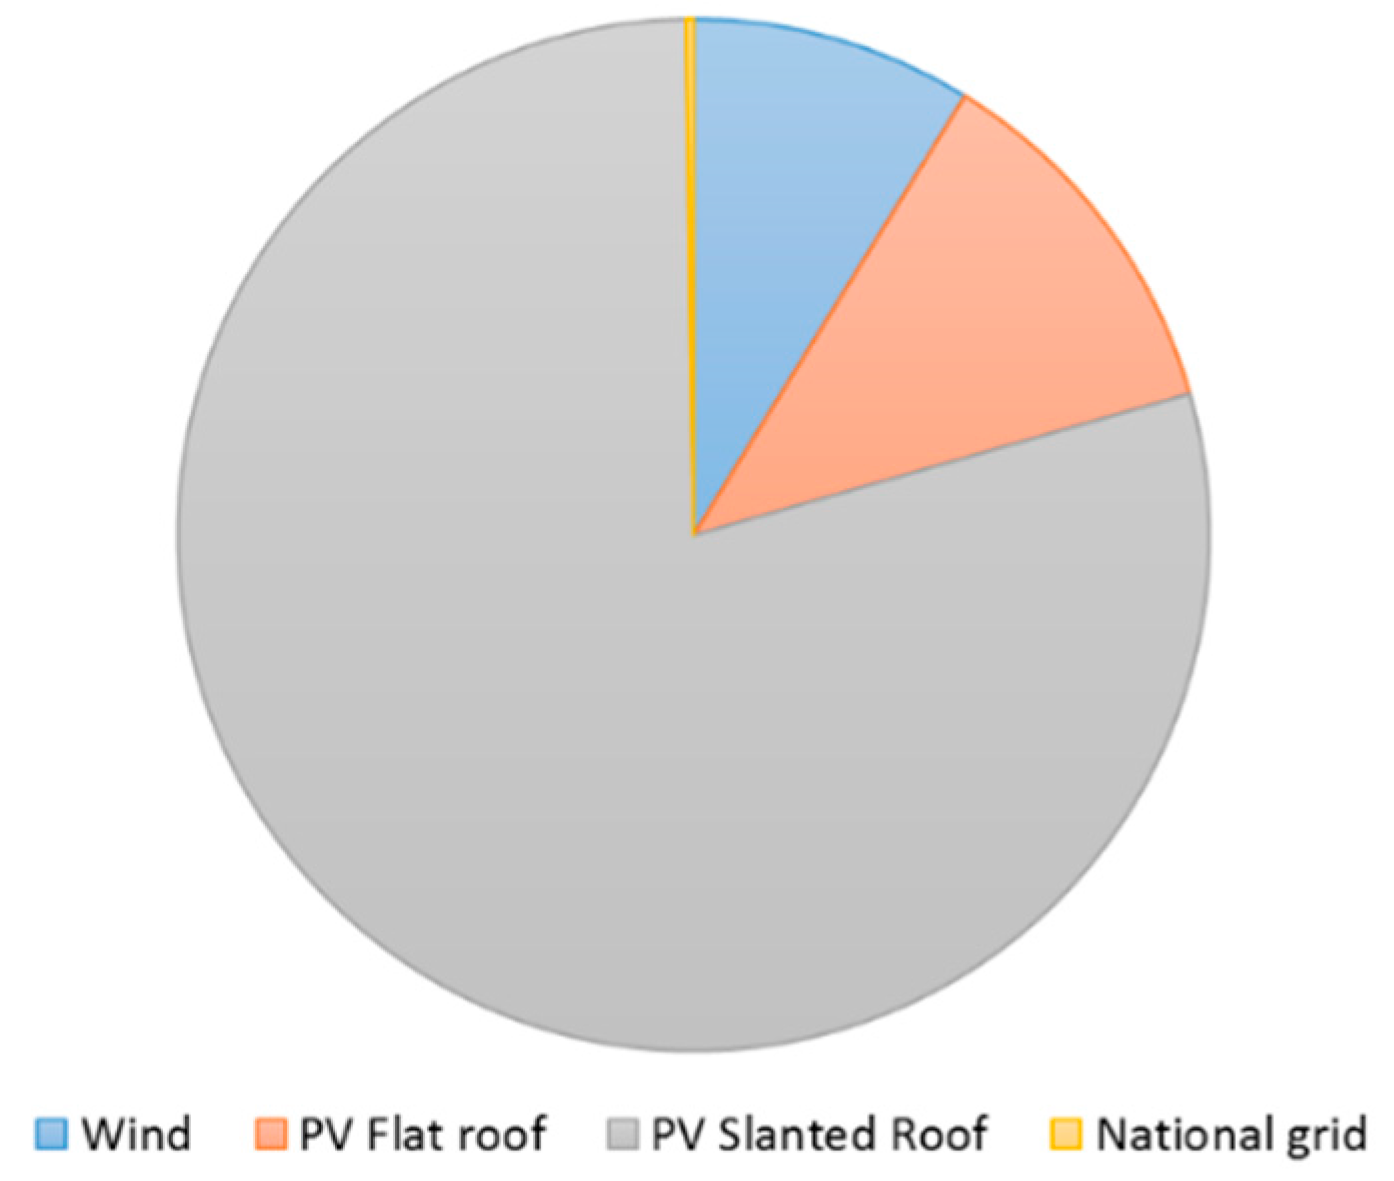
4.1. Costs Minimization

First, the CO2 emissions have not been considered. A total cost of 327,188.80 € has been found by the DSS as the optimal value of the objective function. To reach such a result, the following technologies have to be installed:
  • Three wind turbines of 6 kW size;
  • 123 Multi-silicon PV panels mounted on a flat roof, i.e., 144.40 m2;
  • 680 Muli-silicon PV panels mounted on the slanted roof, i.e., 798.32 m2;
  • 600 kWh/y purchased from the national grid.
The energy production share is presented in Figure 1. The PV is responsible for the major part of the electricity production, while the wind turbines installed in this scenario produces only a minor amount of the total energy required by the building. The electricity purchased from the national grid in the 20 year time frame can be considered almost negligible.

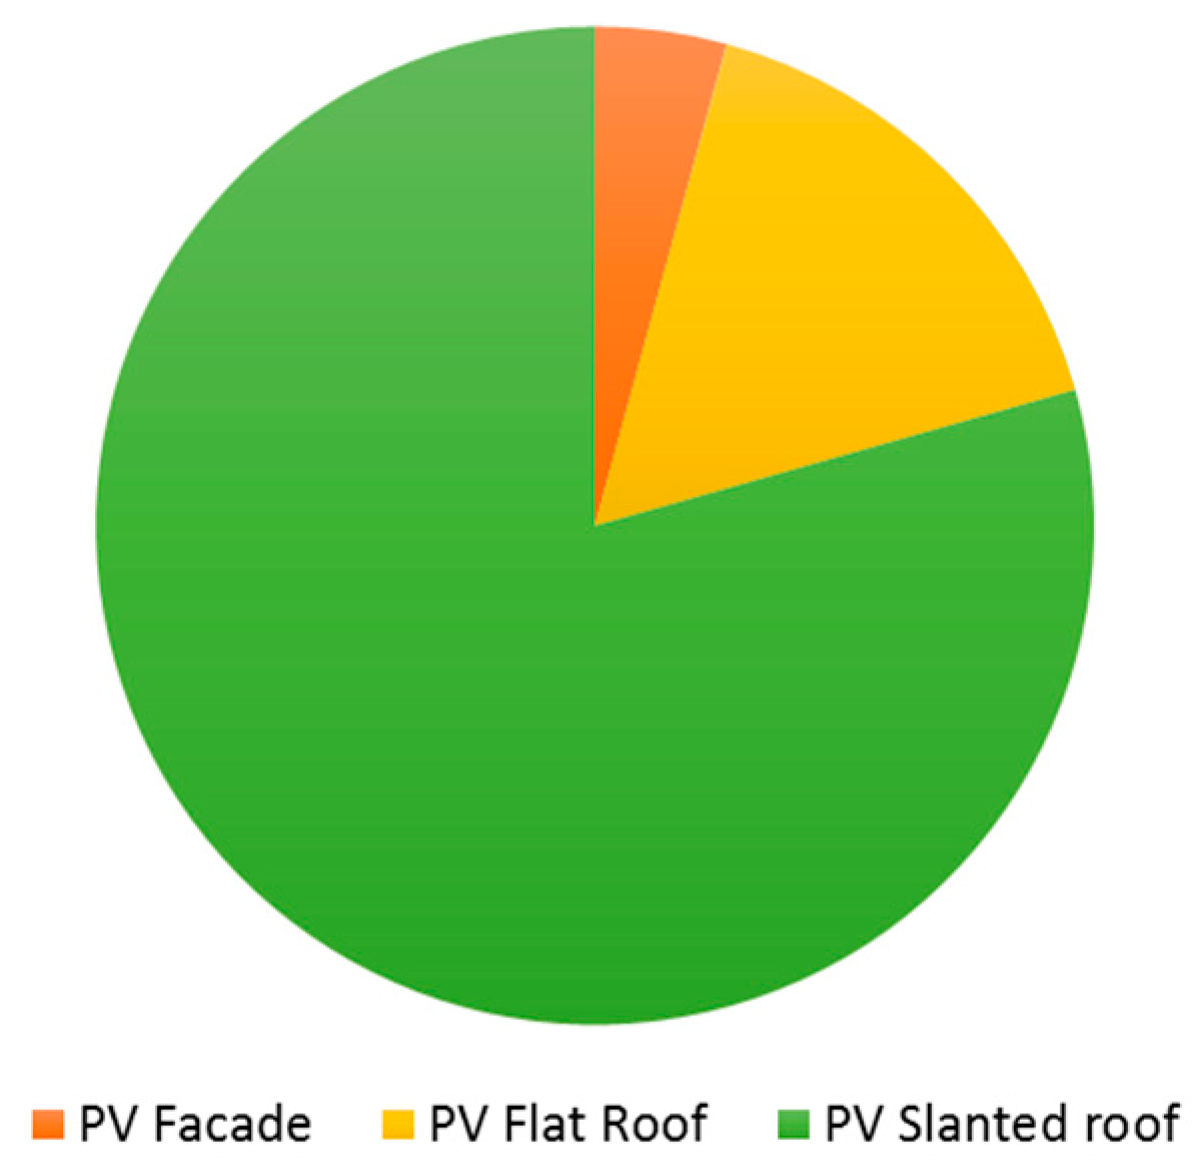
4.2. Emission Minimization

The DSS has been run considering only CO2 emissions in the objective function. An emission minimization objective function is set to find the optimal solution that, during the life cycle of the technologies and the considered time frame of 20 years from the installation, guarantees the lowest equivalent mass of GHG emissions. The results of this minimization show that there is a total emission to the atmosphere of 251,312.5 kg of CO2 equivalent. The installed technologies in the optimal solution are:
  • 60 Multi-silicon PV panels mounted on the facade, i.e., 70.44 m2;
  • 166 Multi-silicon PV panels mounted on a flat roof, i.e., 194.88 m2;
  • Four Single-silicon PV panels mounted on a flat roof, i.e., 5.5 m2
  • 676 Multi-silicon PV panels mounted on the slanted roof, i.e., 793.62 m2;
  • Five Single-silicon PV panels mounted on the slanted roof, i.e., 6.32 m2.
The energy share production is presented in Figure 2. As seen in the cost minimization scenario, the energy needed is autonomously produced by the installed technologies and it comes from renewable sources. In this case the optimal solution is represented by the installation of only PV technologies of different kinds and positioned in all the three different possible locations.

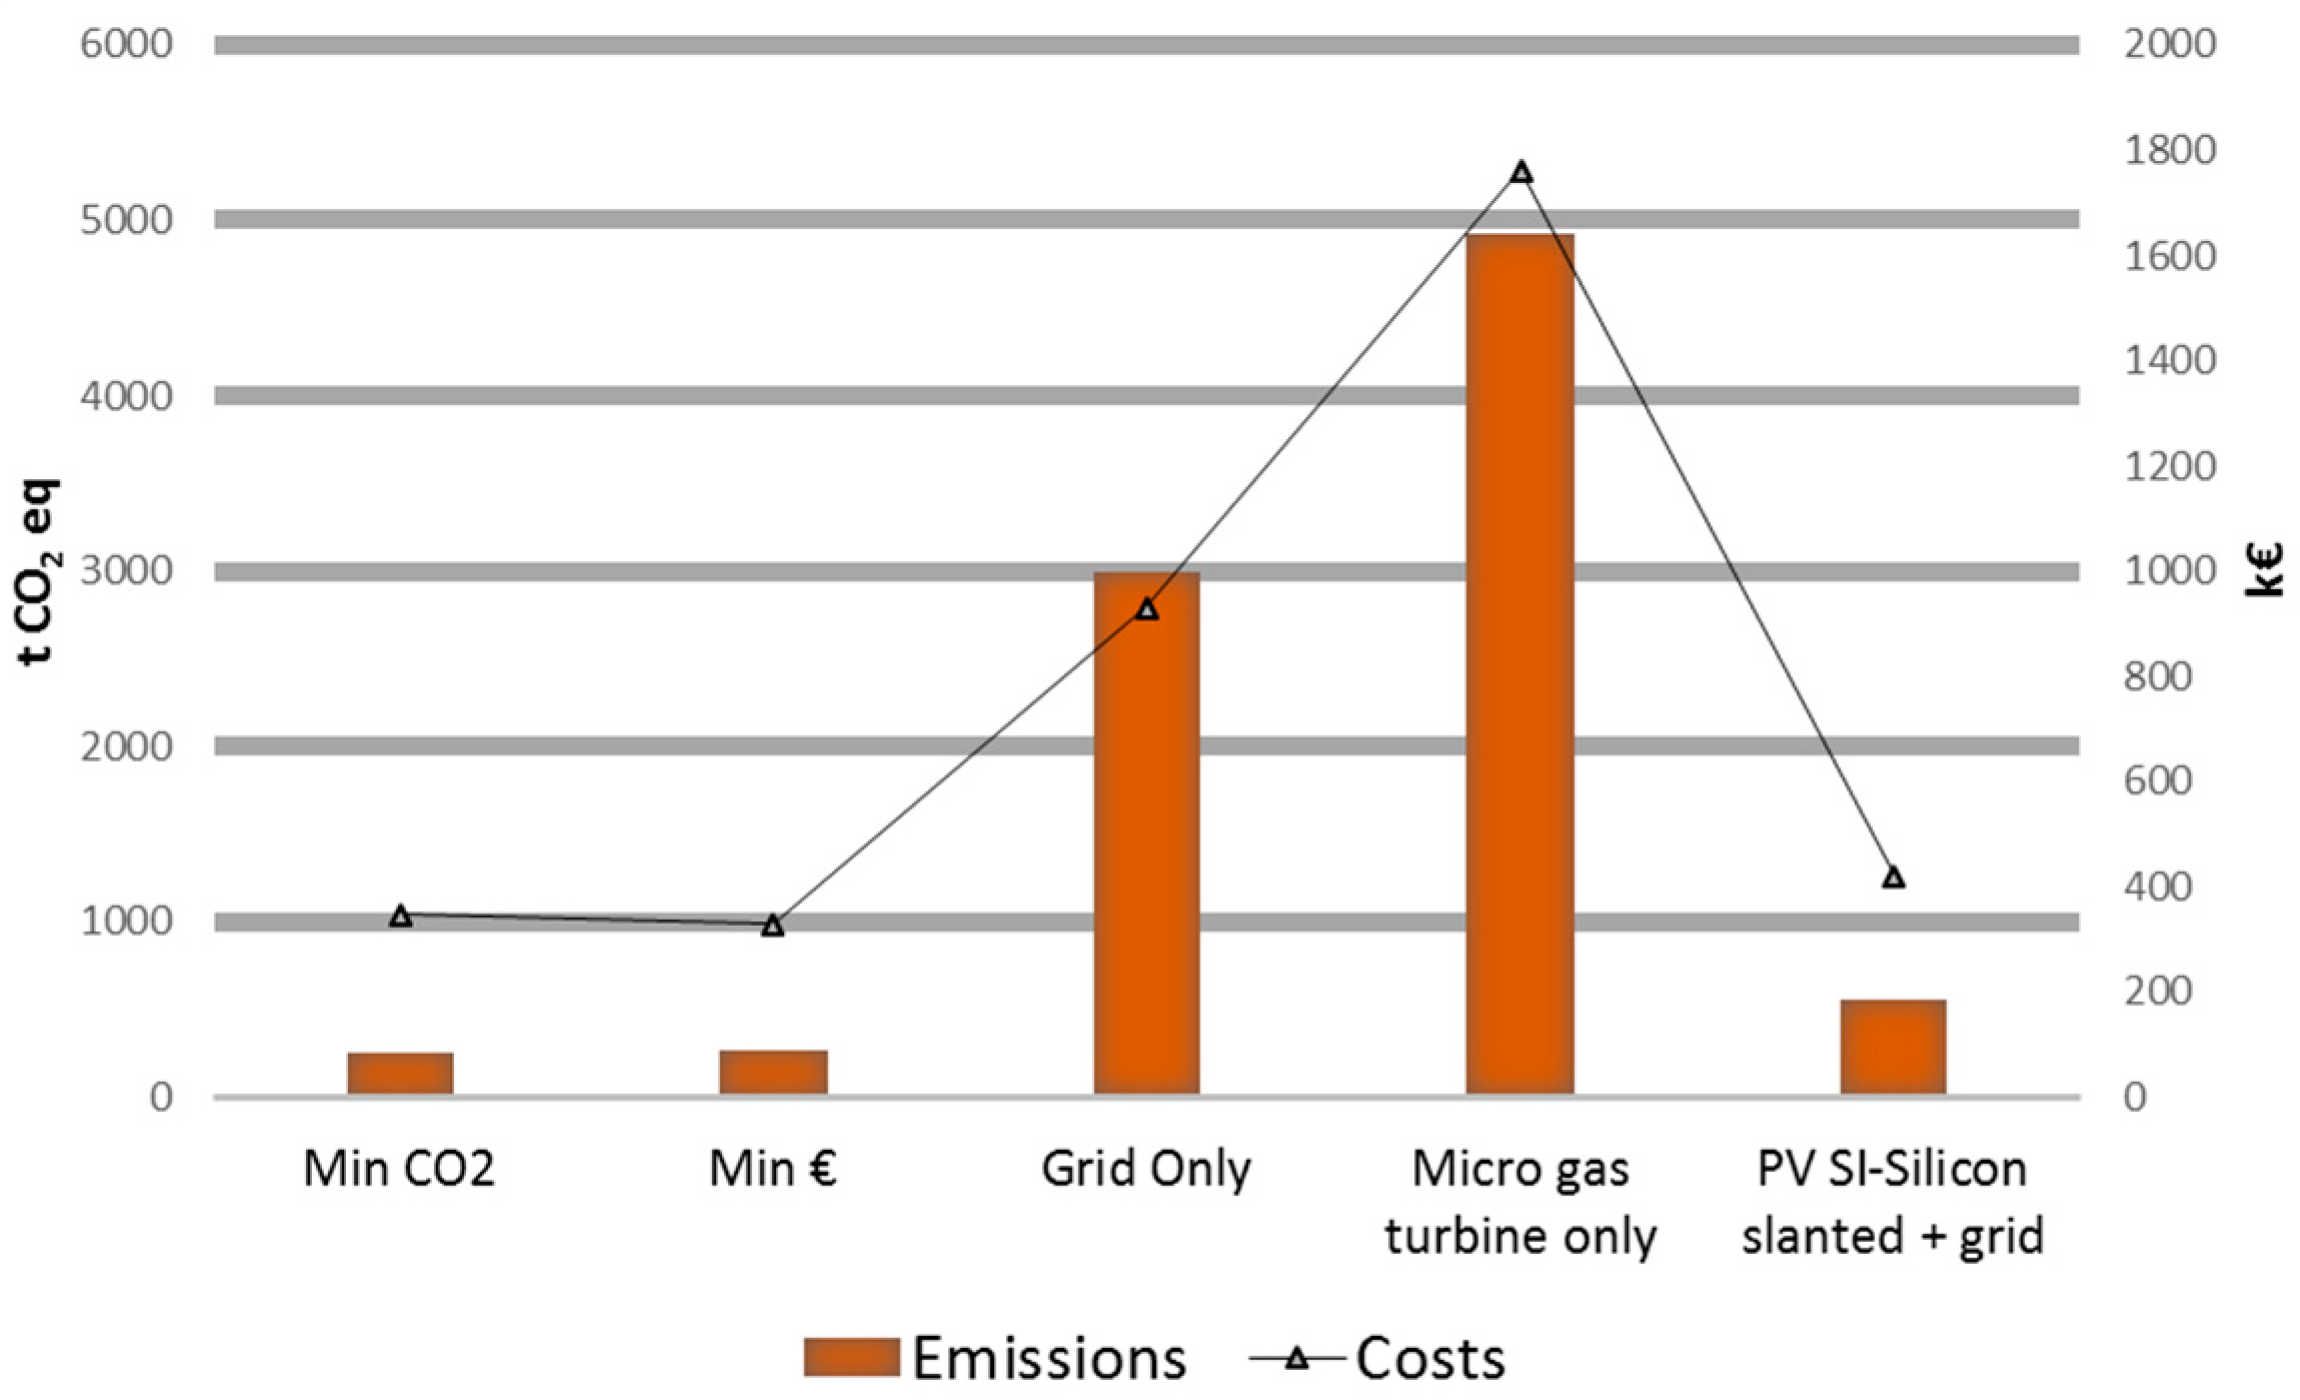
4.3. Optimal Results vs. Non-Optimal Choices

The results highlighted by the two different optimization runs suggest similar choices of technologies that use renewable resources. The micro gas turbine is not chosen by the DSS as a suitable technology in either case. This is due to the high installation costs of this technology and the emissions originated by the combustion of natural gas.
To better understand the potentiality of the here presented DSS a comparison among the optimized results and a non-optimized scenario are presented in Figure 3. The non-optimized results are intended as three different setups that attempt to represent the usual choices of the decision maker. These setups answer the electricity need of a dwelling as:
  • All the electricity is purchased from the national electric grid (Grid only);
  • All the electricity is produced by a micro gas turbine (Micro gas turbine only);
  • Part of the electricity needed is produced by Single-silicon PV installed on the slanted roof; while the remaining part is purchased from the national electric grid (PV-SI-Silicon slanted + grid).
From Figure 3 it is possible to see the slight difference between the two optimal solutions, both in terms of costs, (represented by the black line) and emissions (represented by histograms). This fact suggests that the optimal point for the economic savings is not far from the optimal environmental point in term of GHG emissions. The comparison of the optimal solutions and the non-optimal setups, highlighted by Figure 3, shows clearly how effective the DSS can be in terms of emissions and costs savings. The best solution among the non-optimal ones turns out to be the mix of PV and electricity purchased from the grid. Of particular interest is the cost comparison between the electricity purchased from the grid non-optimal solution and the optimal solutions, that highlight the fact that with an initial investment it’s possible to save a remarkable amount of money. Effectively most case studies do not consider the auto-production of electricity, due to the high initial costs; while, from a long term prospective it can generate great and effective savings. The worst solution turns out to be the auto generation of energy with a micro gas turbine, in both the environmental and cost cases. This can be explained by the fact that the heat generated by the micro gas turbine is not considered in this study, affecting the results of this technology and opening new possible research prospectives.

5. Conclusions

In this paper, an innovative decision support system (DSS) that integrates a LCA tool and an optimization tool has been presented. The DSS can be used for the design/planning of energy production technologies for general buildings and is able to minimize costs and GHG emissions. The considered plants are micro-turbines, and different kinds of PV plants and wind turbines. Moreover, costs and emissions coming from the use of power obtained from the grid have been considered too.
The DSS has been applied to a real case study of a dwelling situated in Northwest Italy. An optimization analysis was performed for the minimization of cost and the minimization of the GHG emissions, highlighting the bonus provided by the installation of technologies that use renewable energy. The results of two different optimization scenarios, (cost minimization and GHG emission minimization), have shown similar patterns in choosing the best alternatives for the electricity production. Moreover a comparison among different optimal and non-optimal solutions was carried out to demonstrate the effectiveness of the DSS here presented, highlighting the importance of the findings proposed by this research. It is important to underline the fact that in the presented DSS, no storage of energy is considered. Therefore the energy produced by the technologies that use renewable sources, is considered as sold to the grid and then purchased as needed, at the same price. Future developments regard the inclusion of further technologies in the DSS and the definition of other performance indicators resulting from the LCA assessment like water use and waste production. Nevertheless, the cogeneration of heat was not considered in this research, and this underestimates the full potential and benefits of a micro gas turbine. Thus in the future developments of this research, an analysis and implementation of the DSS with different heating production systems will be presented to deal with this problem. Moreover, in order to better evaluate the different cogeneration technologies, a future development is represented by the inclusion of the heat production and consumption. Finally, the DSS can be upgraded for wider systems such as micro-grids, districts, and smart cities.

Acknowledgments

The Authors wish to thank the I salici Condominium for providing the data for the study presented in this paper.

Author Contributions

Fabio Magrassi conceived the Decision support system, performed the experiments and contributed to writing the paper; Adriana Del Borghi planned the methodological LCA approach; Michela Gallo analyzed and interpreted the data; Carlo Strazza checked the consistency of the results and contributed to the paper revision; Michela Robba checked the consistency of the optimization tool and contributed to writing the paper.

Conflicts of Interest

The authors declare no conflict of interest. The founding sponsors had no role in the design of the study; in the collection, analyses, or interpretation of data; in the writing of the manuscript, and in the decision to publish the results.

References

  1. Pérez-Lombard, L.; Ortiz, J.; Pout, C. A review on buildings energy consumption information. Energy Build. 2008, 40, 394–398. [Google Scholar] [CrossRef]
  2. European Parliament and Council Directive 2010/31/EU of the European Parliament and of the Council of 19 May 2010 on the Energy Performance of Buildings 2010. Available online: http://eur-lex.europa.eu/LexUriServ/LexUriServ.do?uri=OJ:L:2010:153:0013:0035:EN:PDF (accessed on 12 March 2016).
  3. Kharseh, M.; Altorkmany, L. How global warming and building envelope will change buildings energy use in central Europe. Appl. Energy 2012, 97, 999–1004. [Google Scholar] [CrossRef]
  4. Shin, U.C.; Lee, J.B.; Park, J.W.; Yoon, J.H.; Baek, N.C.; Kim, D.K. An empirical study of performance characteristics of BIPV (Building Integrated Photovoltaic) system for the realization of zero energy building. Energy 2014, 66, 25–34. [Google Scholar]
  5. European Parliament and Council Regulation (EU) No 1310/2013 of the European Parliament and of the Council 2013. Available online: http://eur-lex.europa.eu/legal-content/en/TXT/?uri=CELEX%3A32013R1310 (accessed on 10 March 2016).
  6. Rizzi, F.; Annunziata, E.; Frey, M. Towards nearly zero-energy buildings: The state-of-art of national regulations in Europe. Energy 2013, 57, 125–133. [Google Scholar]
  7. Haapio, A.; Viitaniemi, P. A critical review of building environmental assessment tools. Environ. Impact Assess. Rev. 2008, 28, 469–482. [Google Scholar] [CrossRef]
  8. Desideri, U.; Arcioni, L.; Leonardi, D.; Cesaretti, L.; Perugini, P.; Agabitini, E.; Evangelisti, N. Design of a multipurpose “zero energy consumption” building according to European Directive 2010/31/EU: Life cycle assessment. Energy Build. 2014, 80, 585–597. [Google Scholar] [CrossRef]
  9. Wang, S.; Lu, Y.; Sun, Y.; Yan, C. Optimal scheduling of buildings with energy generation and thermal energy storage under dynamic electricity pricing using mixed-integer nonlinear programming. Appl. Energy 2015, 147, 49–58. [Google Scholar]
  10. Huh, J.-H.; Kong, D.-S.; Jang, Y.-S. Method and Case Study of Multiobjective Optimization-Based Energy System Design to Minimize the Primary Energy Use and Initial Investment Cost. Energies 2015, 8, 6114–6134. [Google Scholar]
  11. Pérez-Navarro, Á.; Hurtado, E.; Peñalvo-López, E.; Vargas, C.; Alfonso, D. Optimization of a hybrid renewable system for high feasibility application in non-connected zones. Appl. Energy 2015, 155, 308–314. [Google Scholar]
  12. Pfenninger, S.; Keirstead, J. Renewables, nuclear, or fossil fuels? Scenarios for Great Britain’s power system considering costs, emissions and energy security. Appl. Energy 2015, 152, 83–93. [Google Scholar] [CrossRef]
  13. Thangavelu, S.R.; Khambadkone, A.M.; Karimi, I.A. Long-Term optimal energy mix planning towards high energy security and low GHG emission. Appl. Energy 2015, 154, 959–969. [Google Scholar] [CrossRef]
  14. Wu, Q.H.; Zheng, J.H.; Chen, J.J.; Jing, Z.X. Multi-Objective optimization and decision making for power dispatch of a large-scale integrated energy system with distributed DHCs embedded. Appl. Energy 2015, 154, 369–379. [Google Scholar]
  15. Mussati, M.C.; Pieragostini, C.; Aguirre, P. On process optimization considering LCA methodology. J. Environ. Manag. 2012, 96, 43–54. [Google Scholar]
  16. Liu, P.; Gerogiorgis, D.I.; Pistikopoulos, E.N. Modelling and Optimization of Polygeneration Energy Systems. Catal. Today 2007, 127, 347–359. [Google Scholar] [CrossRef]
  17. Safaei, A.; Freire, F.; Henggeler Antunes, C. A life cycle multi-objective economic and environmental assessment of distributed generation in buildings. Energy Convers. Manag. 2015, 97, 420–427. [Google Scholar] [CrossRef]
  18. Sun, J.; Wang, Q.; Su, B.; Zhou, P.; Zhou, D. Measurement and decomposition of energy-saving and emissions reduction performance in Chinese cities. Appl. Energy 2015, 151, 85–92. [Google Scholar]
  19. Rubio Rodríguez, M.A.; Ruyck, J.D.; Díaz, P.R.; Verma, V.K.; Bram, S. An LCA based indicator for evaluation of alternative energy routes. Appl. Energy 2011, 88, 630–635. [Google Scholar] [CrossRef]
  20. Hong, T.; Kim, C.-J.; Kim, J.; Koo, C.; Jeong, K.; Park, H.S. A program-level management system for the life cycle environmental and economic assessment of complex building projects. Environ. Impact Assess. Rev. 2015, 54, 9–21. [Google Scholar]
  21. Sato, T.; Takahashi, T. Inclusive environmental impact assessment indices with consideration of public acceptance: Application to power generation technologies in Japan. Appl. Energy 2015, 144, 64–72. [Google Scholar]
  22. Sedláková, A.; Vilčeková, S.; Krídlová Burdová, E. Analysis of material solutions for design of construction details of foundation, wall and floor for energy and environmental impacts. Clean Technol. Environ. Policy 2015, 17, 1323–1332. [Google Scholar] [CrossRef]
  23. Azapagic, A. Life cycle assessment and its application to process selection, design and optimisation. Chem. Eng. J. 1999, 73, 1–21. [Google Scholar] [CrossRef]
  24. Zabalza, I.; Scarpellini, S.; Aranda, A.; Llera, E.; Jáñez, A. Use of LCA as a Tool for Building Ecodesign. A Case Study of a Low Energy Building in Spain. Energies 2013, 6, 3901–3921. [Google Scholar] [CrossRef]
  25. Wang, S.; Lu, Y.; Shan, K. Design optimization and optimal control of grid-connected and standalone nearly/net zero energy buildings. Appl. Energy 2015, 155, 463–477. [Google Scholar]
  26. Xie, K.; Li, F.; Yang, J. Optimization and Analysis of a Hybrid Energy Storage System in a Small-Scale Standalone Microgrid for Remote Area Power Supply (RAPS). Energies 2015, 8, 4802–4826. [Google Scholar]
  27. Bracco, S.; Delfino, F.; Pampararo, F.; Robba, M.; Rossi, M. A dynamic optimization-based architecture for polygeneration microgrids with tri-generation, renewables, storage systems and electrical vehicles. Energy Convers. Manag. 2015, 96, 511–520. [Google Scholar] [CrossRef]
  28. Bilec, M.M.; Thiel, C.L.; Campion, N.; Landis, A.E.; Jones, A.K.; Schaefer, L.A. A Materials Life Cycle Assessment of a Net-Zero Energy Building. Energies 2013, 6, 1125–1141. [Google Scholar]
  29. ISO14040 International Organization for Standardization (ISO), Environmental Management—Life Cycle Assessment—Principles and Framework. Available online: https://www.iso.org/obp/ui/#iso:std:37456:en (accessed on 20 January 2016).
  30. Udo de Haes, H.A.; Heijungs, R. Life-Cycle assessment for energy analysis and management. Appl. Energy 2007, 84, 817–827. [Google Scholar] [CrossRef]
  31. Oregi, X.; Hernandez, P.; Gazulla, C.; Isasa, M. Integrating Simplified and Full Life Cycle Approaches in Decision Making for Building Energy Refurbishment: Benefits and Barriers. Buildings 2015, 5, 354–380. [Google Scholar] [CrossRef]
  32. Strazza, C.; Del Borghi, A.; Magrassi, F.; Gallo, M. Using environmental product declaration as source of data for life cycle assessment: A case study. J. Clean. Prod. 2016, 112, 333–342. [Google Scholar] [CrossRef]
  33. Climate Change 2013: The Physical Science Basis: Working Group I Contribution to the Fifth Assessment Report of the Intergovernmental Panel on Climate Change; Stocker, T.; Dahe, Q.; Gian-Kasper, P.; Tignor, M.; Allen, S.K.; Boschung, J.; Nauels, A.; Xia, Y.; Bex, V.; Midgley, P. (Eds.) Cambridge University Press: New York, NY, USA, 2014.
  34. Ciroth, A. ICT for environment in life cycle applications openLCA—A new open source software for life cycle assessment. Int. J. Life Cycle Assess. 2007, 12, 209–210. [Google Scholar] [CrossRef]
  35. Asdrubali, F.; Buratti, C.; Cotana, F.; Baldinelli, G.; Goretti, M.; Moretti, E.; Baldassarri, C.; Belloni, E.; Bianchi, F.; Rotili, A.; et al. Evaluation of Green Buildings’ Overall Performance through in Situ Monitoring and Simulations. Energies 2013, 6, 6525–6547. [Google Scholar] [CrossRef]
  36. International Education Association (IEA). Key World Statistics 2015; International Education Association (IEA): Paris, France, 2015. [Google Scholar]
  37. Gerbinet, S.; Belboom, S.; Léonard, A. Life Cycle Analysis (LCA) of photovoltaic panels: A review. Renew. Sustain. Energy Rev. 2014, 38, 747–753. [Google Scholar] [CrossRef]
  38. Frischknecht, R.; jungbluth, N.; Althaus, H.-J.; Doka, G.; Dones, R.; Heck, T.; Hellweg, S.; Hischier, R.; Nemecek, T.; Rebitzer, G.; et al. ECOINVENT_Overview and Methodology 2007. Available online: http://www.ecoinvent.org/files/200712_frischknecht_jungbluth_overview_methodology_ecoinvent2.pdf (accessed on 5 February 2016).
  39. Hsieh, C.-M.; Fu, C.-K. Evaluation of Locations for Small Wind Turbines in Costal Urban Areas Based on a Wind Energy Potential Map. Environ. Model. Assess. 2013, 18, 593–604. [Google Scholar] [CrossRef]
  40. Capellaro, M. Prediction of site specific wind energy value factors. Renew. Energy 2016, 87 Pt 1, 430–436. [Google Scholar] [CrossRef]
  41. Gagliano, A.; Patania, F.; Capizzi, A.; Nocera, F.; Galesi, A. A Proposed Methodology for Estimating the Performance of Small Wind Turbines in Urban Areas. In Sustainability in Energy and Buildings; Smart Innovation, Systems and Technologies; M’Sirdi, N., Namaane, A., Howlett, R.J., Jain, L.C., Eds.; Springer: Berlin/Heidelberg, Germany, 2012; pp. 539–548. [Google Scholar]
  42. Moore, F.T. Economies od Scale: Some Statistical Evidence. Q. J. Econ. 1959, 73, 232–245. [Google Scholar] [CrossRef]
  43. Caduff, M.; Huijbregts, M.A.J.; Althaus, H.-J.; Koehler, A.; Hellweg, S. Wind Power Electricity: The Bigger the Turbine, The Greener the Electricity? Environ. Sci. Technol. 2012, 46, 4725–4733. [Google Scholar] [CrossRef] [PubMed]
  44. Gaonkar, D.N.; Nayak, S. Modeling and performance analysis of microturbine based Distributed Generation system, “a review”. In 2011 IEEE Energytech; IEEE: Piscataway, NJ, USA, 2011; pp. 1–6. [Google Scholar] [CrossRef]
  45. Strazza, C.; Del Borghi, A.; Costamagna, P.; Gallo, M.; Brignole, E.; Girdinio, P. Life Cycle Assessment and Life Cycle Costing of a SOFC system for distributed power generation. Energy Convers. Manag. 2015, 100, 64–77. [Google Scholar] [CrossRef]
  46. Chiaramonti, D.; Prussi, M.; Riccio, G.; Martelli, F.; Pari, L. Straight vegetable oil use in Micro-Gas Turbines: System adaptation and testing. Appl. Energy 2012, 89, 287–295. [Google Scholar]
  47. TERNA Dati Nazionali Energia Elettrica—ITALIA 2013. Available online: http://download.terna.it/terna/0000/0113/51.pdf (accessed on 22 January 2016).
  48. Autorità Energia Relazione Annuale Sullo Stato Dei Servizi e Sull’Attività Svolta—2015. Available online: http://www.autorita.energia.it/allegati/relaz_ann/15/RAVolumeI_2015.pdf (accessed on 22 January 2016).
  49. Ouammi, A.; Ghigliotti, V.; Robba, M.; Mimet, A.; Sacile, R. A decis ion support system for the optimal exploitation of wind energy on regional scale. Renew. Energy 2012, 37, 299–309. [Google Scholar] [CrossRef]
  50. Dagdougui, H.; Ouammi, A.; Robba, M.; Sacile, R. Thermal analysis and performance optimization of a solar water heater flat plate collector: Application to Tétouan (Morocco). Renew. Sustain. Energy Rev. 2011, 15, 630–638. [Google Scholar] [CrossRef]
  51. Meyers, J.; Meneveau, C. Optimal turbine spacing in fully developed wind farm boundary layers. Wind Energy 2012, 15, 305–317. [Google Scholar] [CrossRef]
  52. PV Potential Estimation Utility. Available online: http://re.jrc.ec.europa.eu/pvgis/apps4/pvest.php# (accessed on 20 April 2016).
Figure 1. Energy production share for the cost minimization optimal solution.
Energies 09 00490 g001
Figure 2. Energy production share for the emission minimization optimal solution.
Energies 09 00490 g002
Figure 3. Comparison of different optimal and non-optimal results.
Energies 09 00490 g003
Table 1. Greenhouse Gas emission (GHG) of the technologies object of study. IPCC, Intergovernmental Panel on Climate Change.
TechnologyGreenhouse Gas Emissions (IPCC 2013–100 years) [33]
Micro turbine2.01 × 104 [kg CO2 eq/turbine]
Natural gas burned2.7581 [kg CO2 eq/m3]
Italian electricity mix 20130.59827 [kg CO2 eq/kWh]
Multi-si flat roof281.306 [kg CO2 eq/panel]
Multi-si facade258.7854 [kg CO2 eq/panel]
Multi-si slanted roof274.9521 [kg CO2 eq/panel]
Single-si flat roof353.2357 [kg CO2 eq/panel]
Single-si facade361.6043 [kg CO2 eq/panel]
Single-si slanted roof356.204 [kg CO2 eq/panel]
Micro wind turbine 1kW1.58 × 104 [kg CO2 eq/turbine]
Micro wind turbine 6kW1.59 × 104 [kg CO2 eq/turbine]
Table 2. Purchasing, maintenance and installation cost of the technologies object of study and user costs for electricity and natural gas.
TechnologyCosts of Purchase, Maintenance and Operation
Sigle-silicon photovoltaic panel504 €/panel
Multi-silicon photovoltaic panel378 €/panel
Micro wind turbine 1 kW6,000 €/turbine
Micro wind turbine 6 kW7,352 €/turbine
Micro gas turbine 100 kW250,000 €/turbine
Natural gas0.85 €/m3
Electricity purchased from the national grid0.186 €/kWh
Table 3. Yearly producible energy for the technologies object of study.
TechnologyYearly Producible Energy [kWh/year]
Multi-Silicon Photovoltaic Panel on Facade177.01
Single-Silicon Photovoltaic Panel on Facade214.25
Multi-Silicon Photovoltaic Panel on Flat roof239.29
Single-Silicon Photovoltaic Panel on Flat roof289.59
Multi-Silicon Photovoltaic Panel on Slanted roof291.03
Single-Silicon Photovoltaic Panel on Slanted roof352.20
Micro wind Turbine 1 kW1500
Micro wind Turbine 6 kW7340

