
Study of the Injection Control Strategies of a Compression Ignition Free Piston Engine Linear Generator in a One-Stroke Starting Process


Abstract
:1. Introduction
- Using the piston position signal (“triggering position”) to trigger the injection system, study the characteristics of the one-stroke starting process.
- Using the piston velocity signal (“triggering velocity”) to trigger the injection system, test if the velocity signal trigger is better.
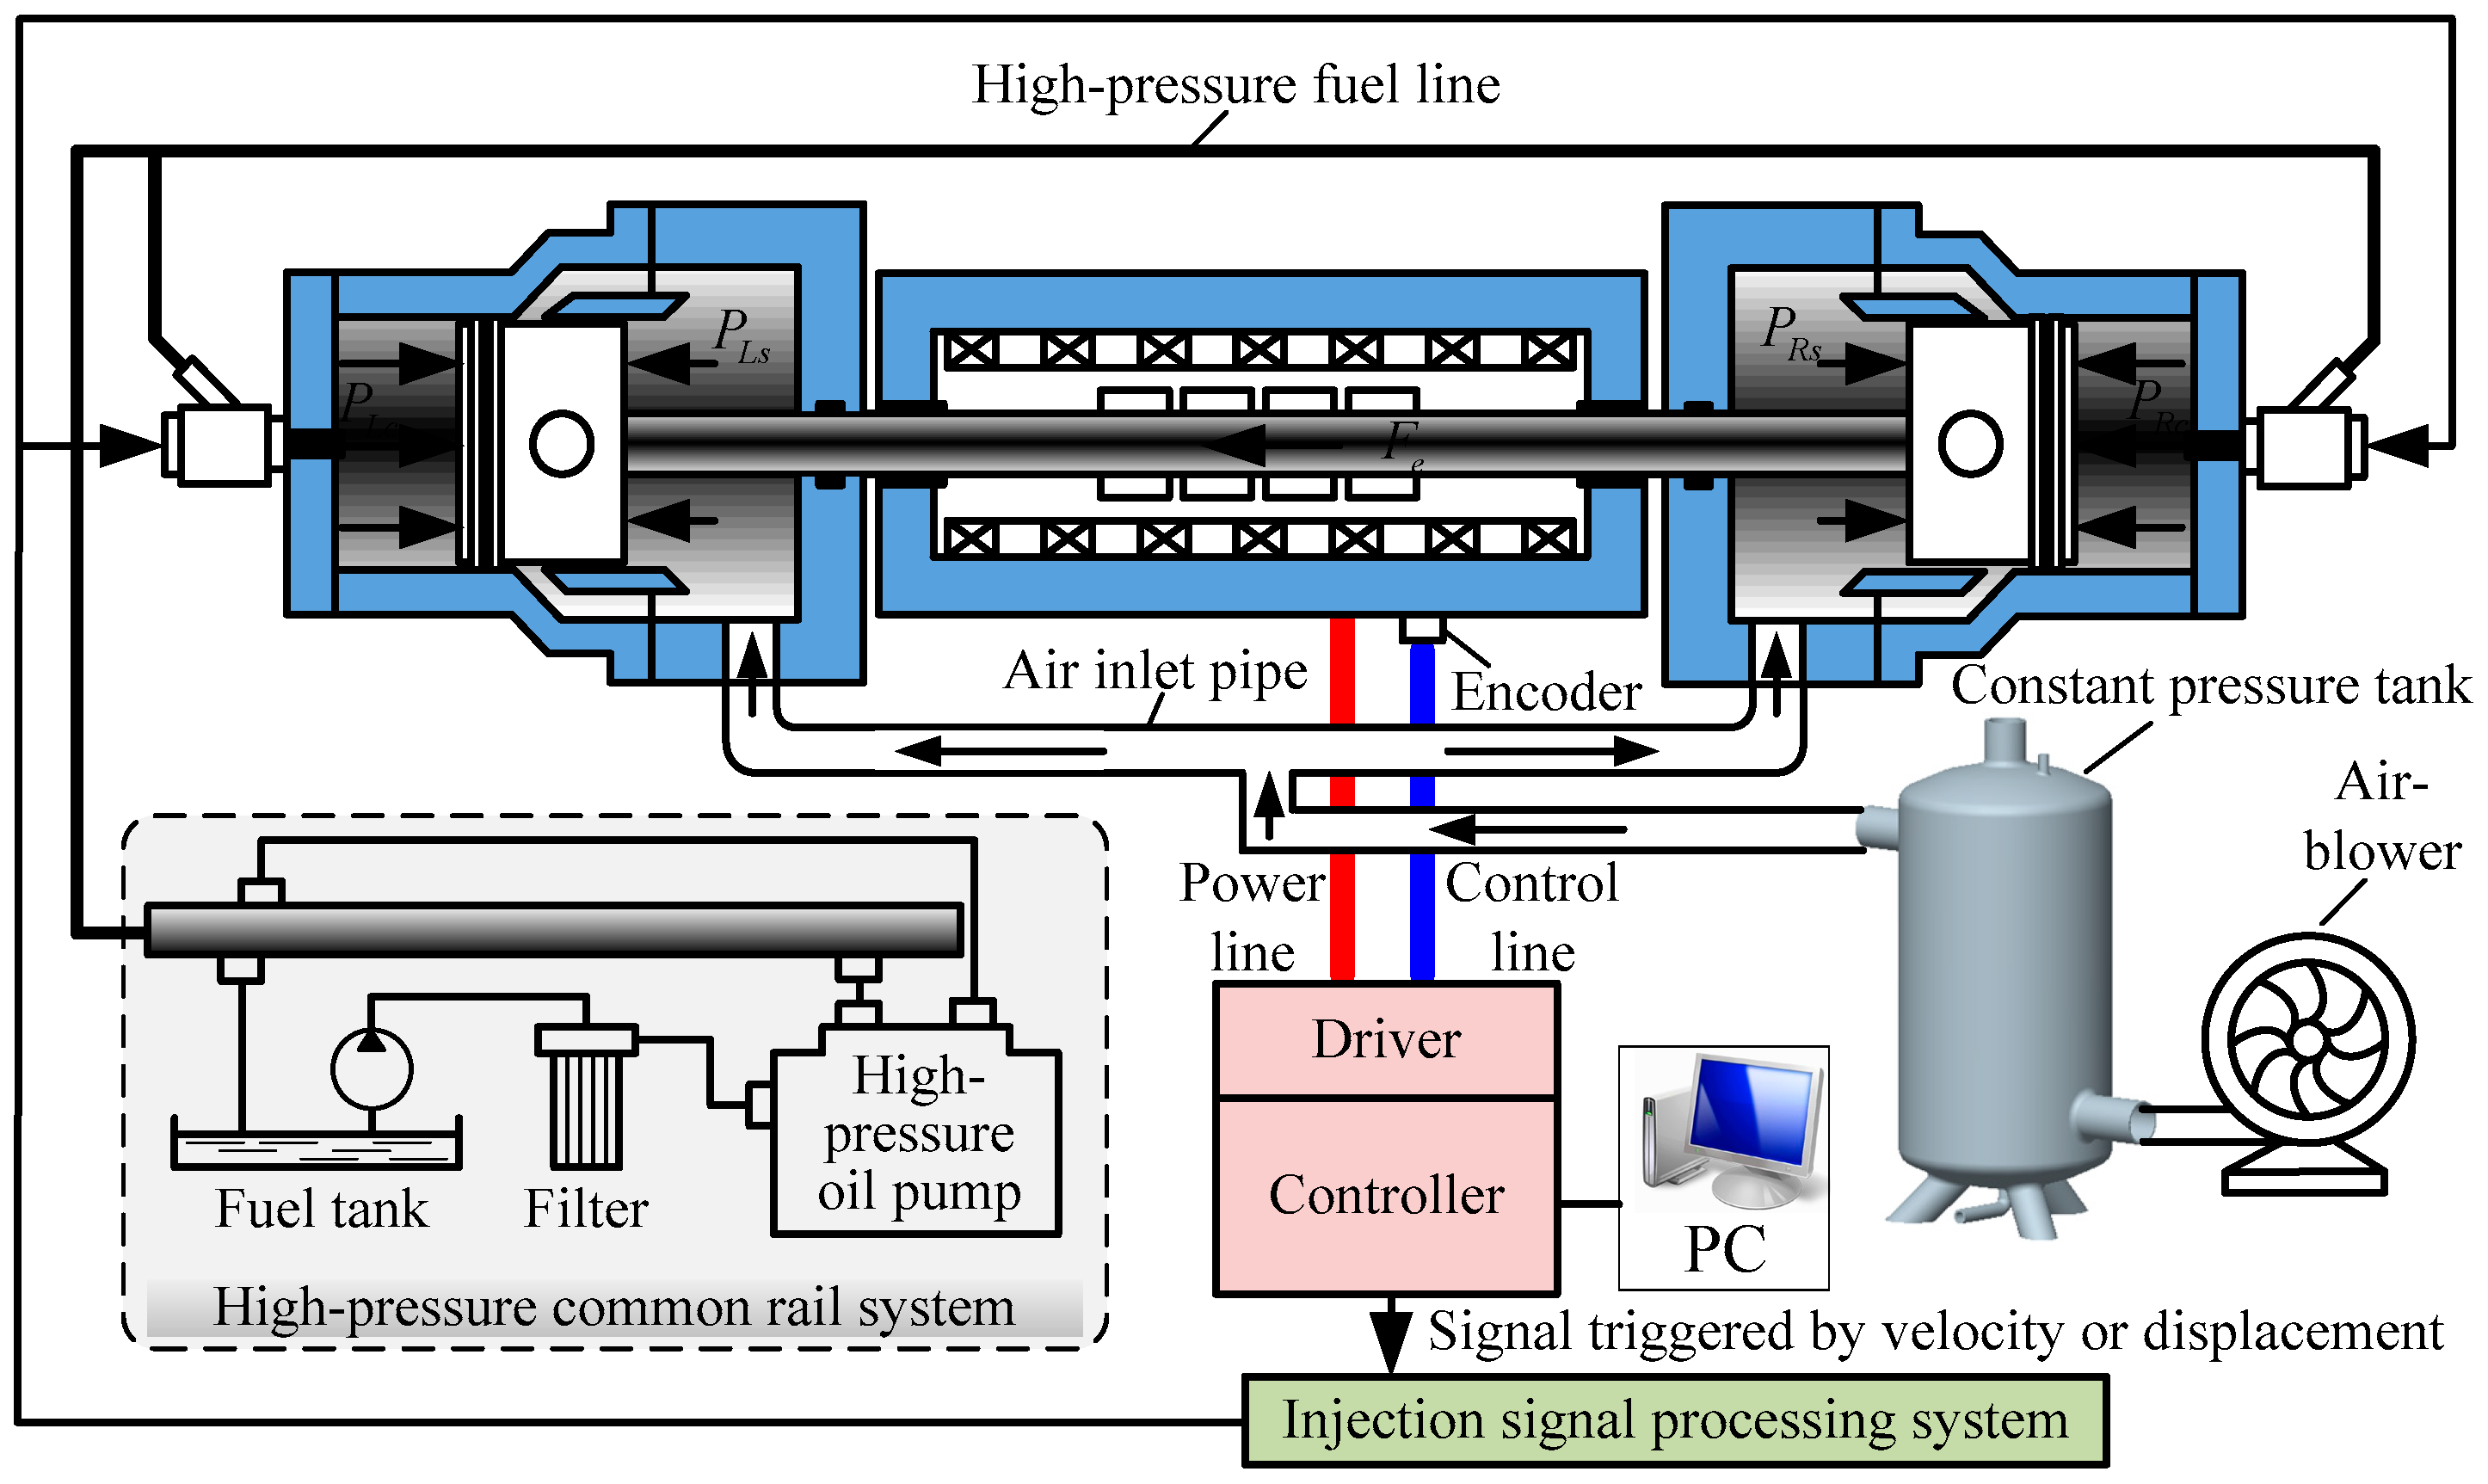
2. Prototype Test Bench
2.1. Test
2.2. Motor Control
2.3. Scavenge
2.4. Injection
3. Mathematical Models and Model Validation
3.1. Mathematical Models
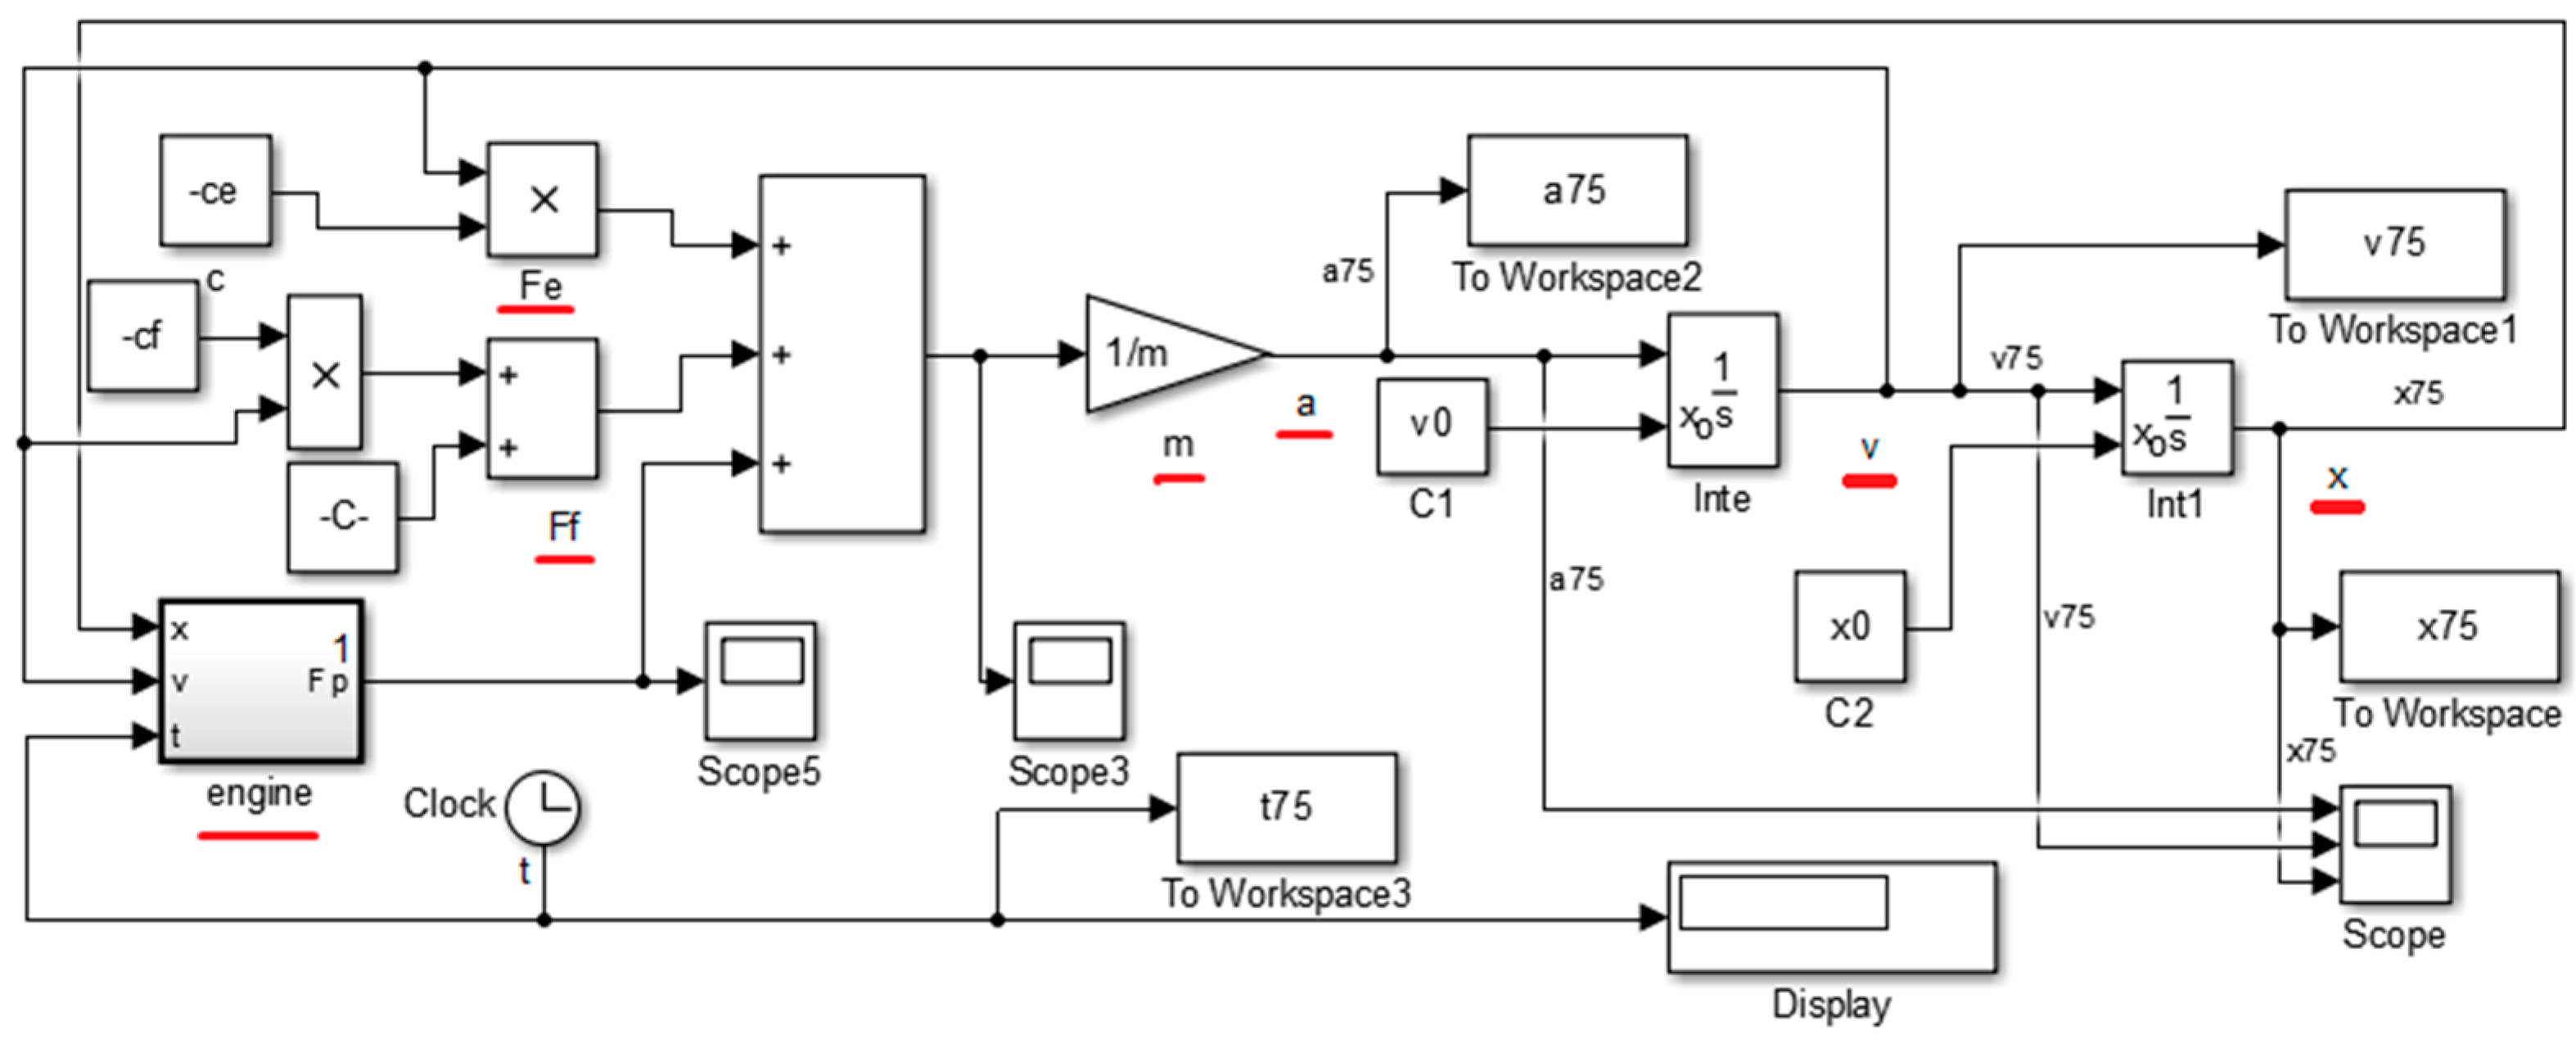
3.1.1. Dynamic Model
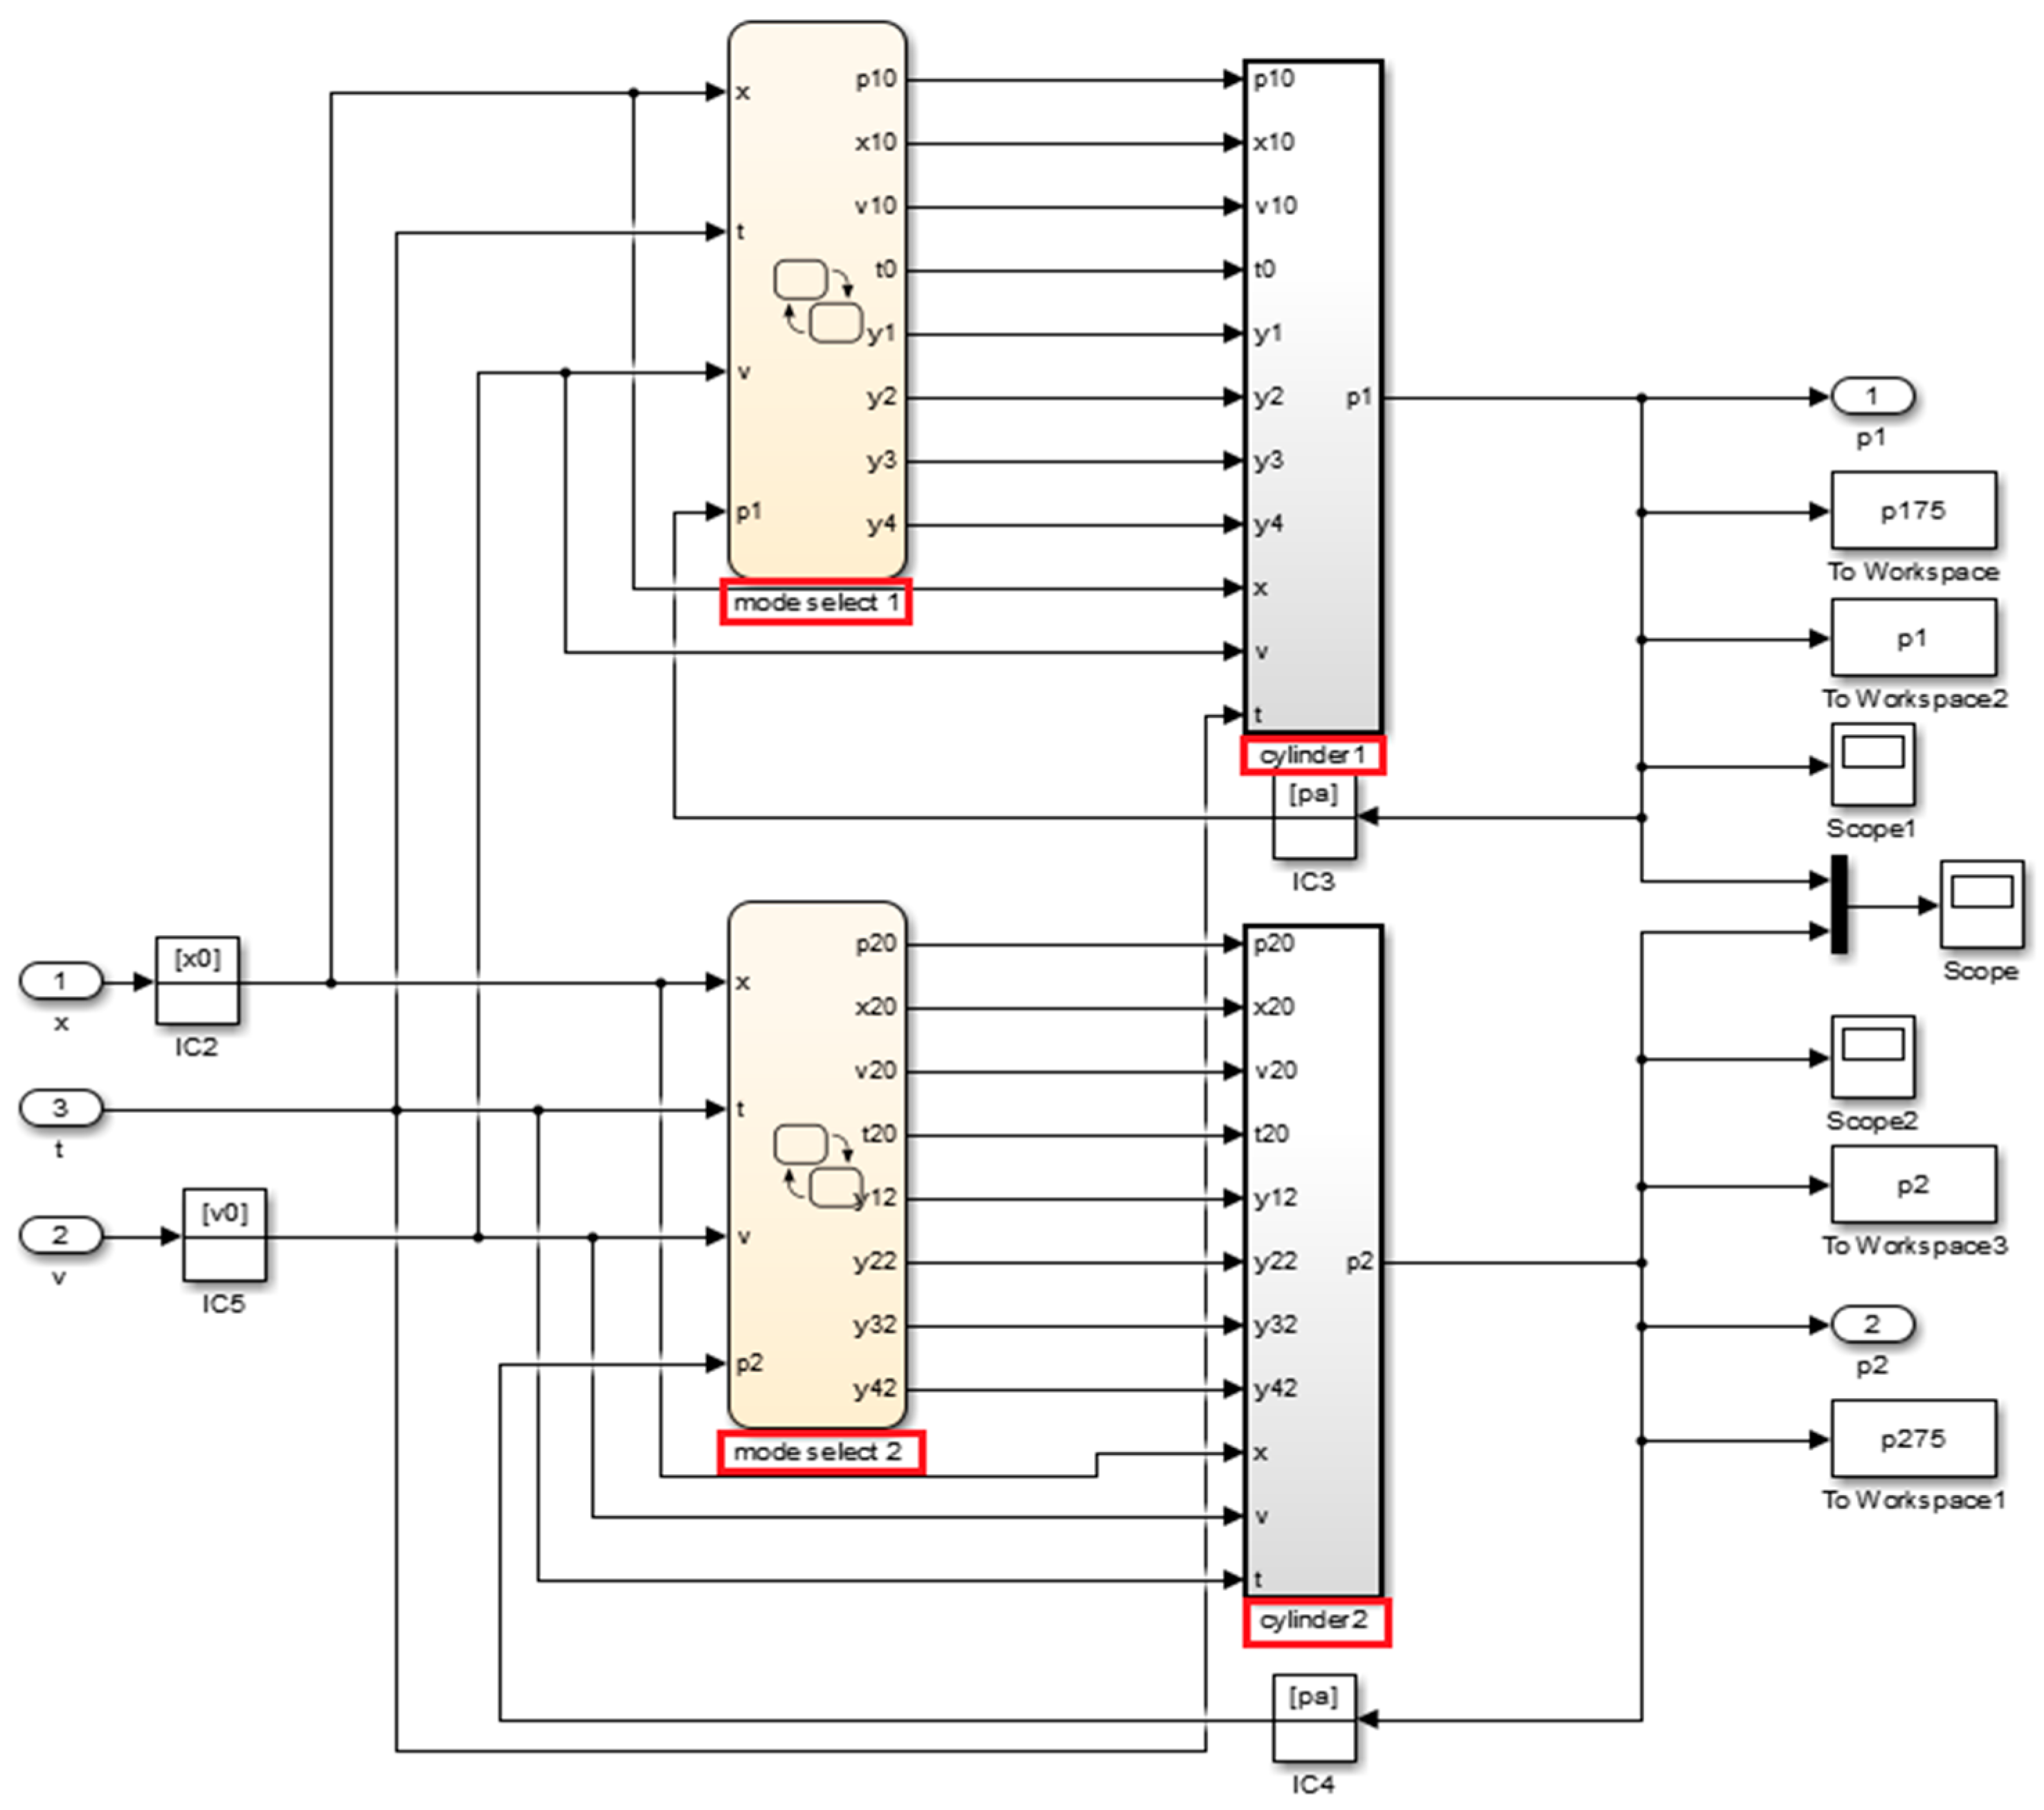
3.1.2. Thermodynamic Model
3.1.3. Friction Force Model and Electromagnetic Force Model
3.1.4. Ignition Delay Model
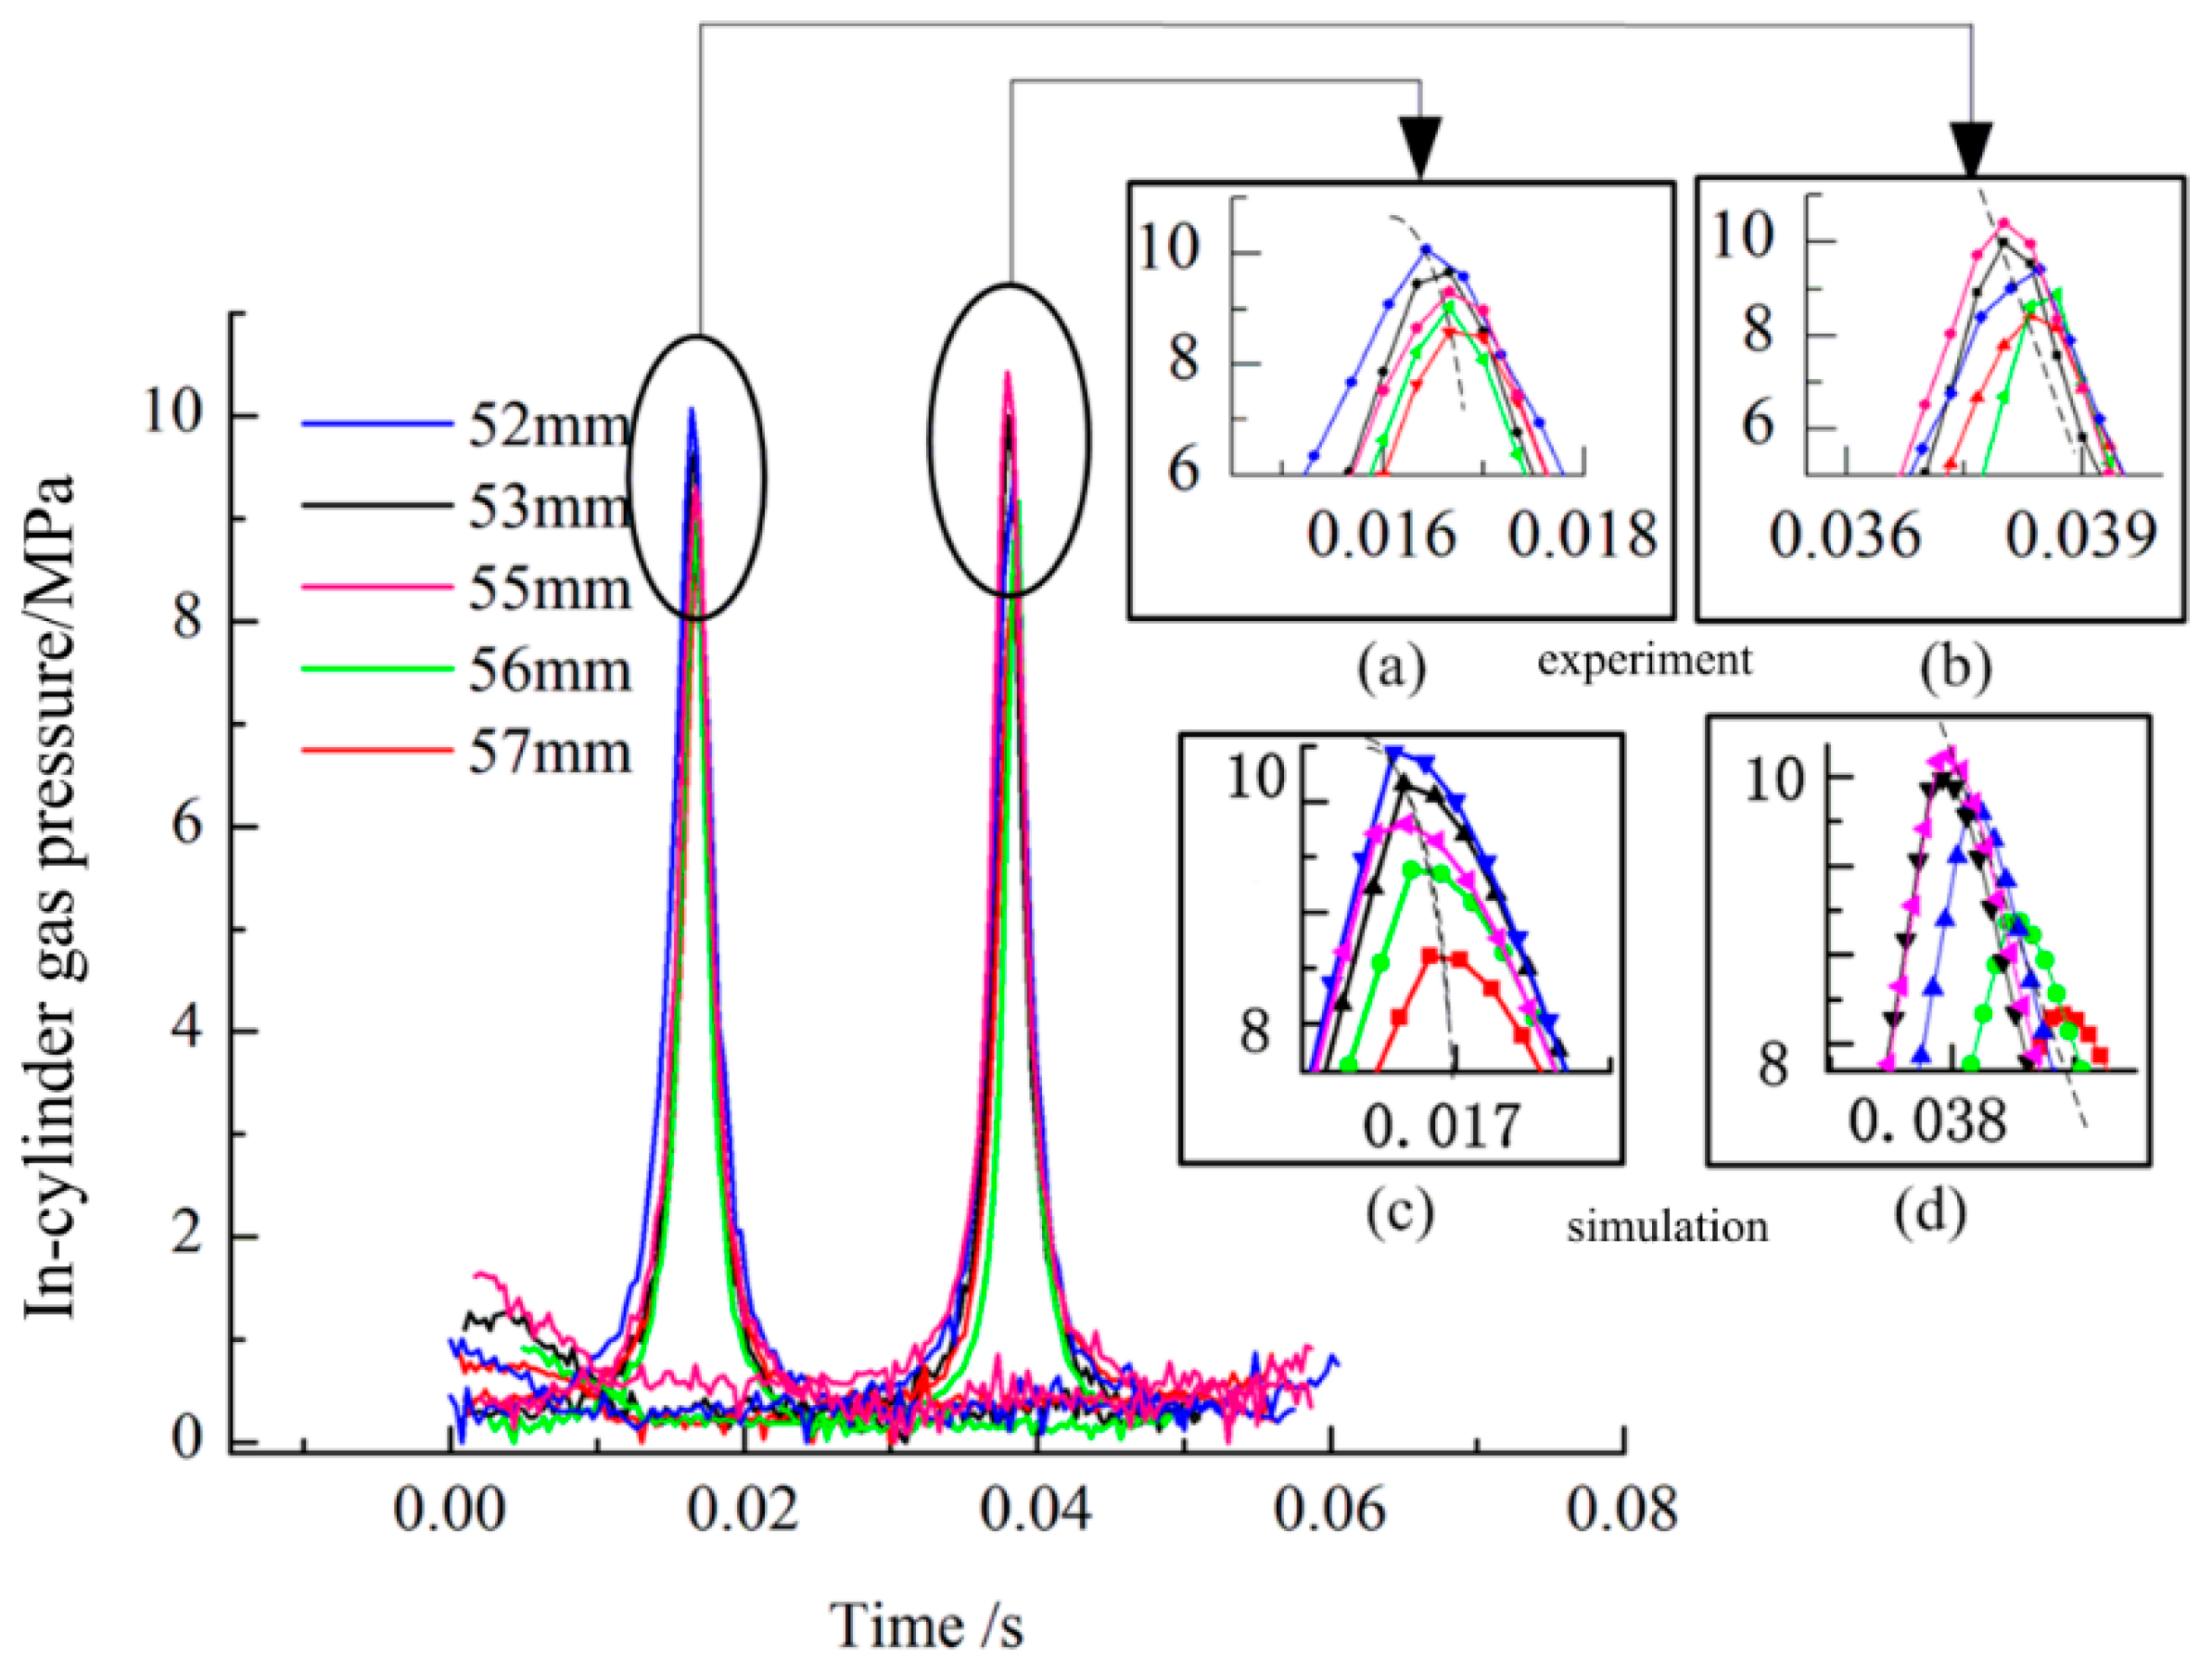
3.2. Model Validation
4. Results and Discussion
4.1. Position Feedback Injection Strategy
4.1.1. Comparison of Test and Simulation Results
4.1.2. Engine Performance Analysis
4.2. Velocity Feedback Injection Strategy
4.2.1. Injecting at the Same “Triggering Velocity”
4.2.2. Injecting at Different “Triggering Velocity” Values
5. Conclusions
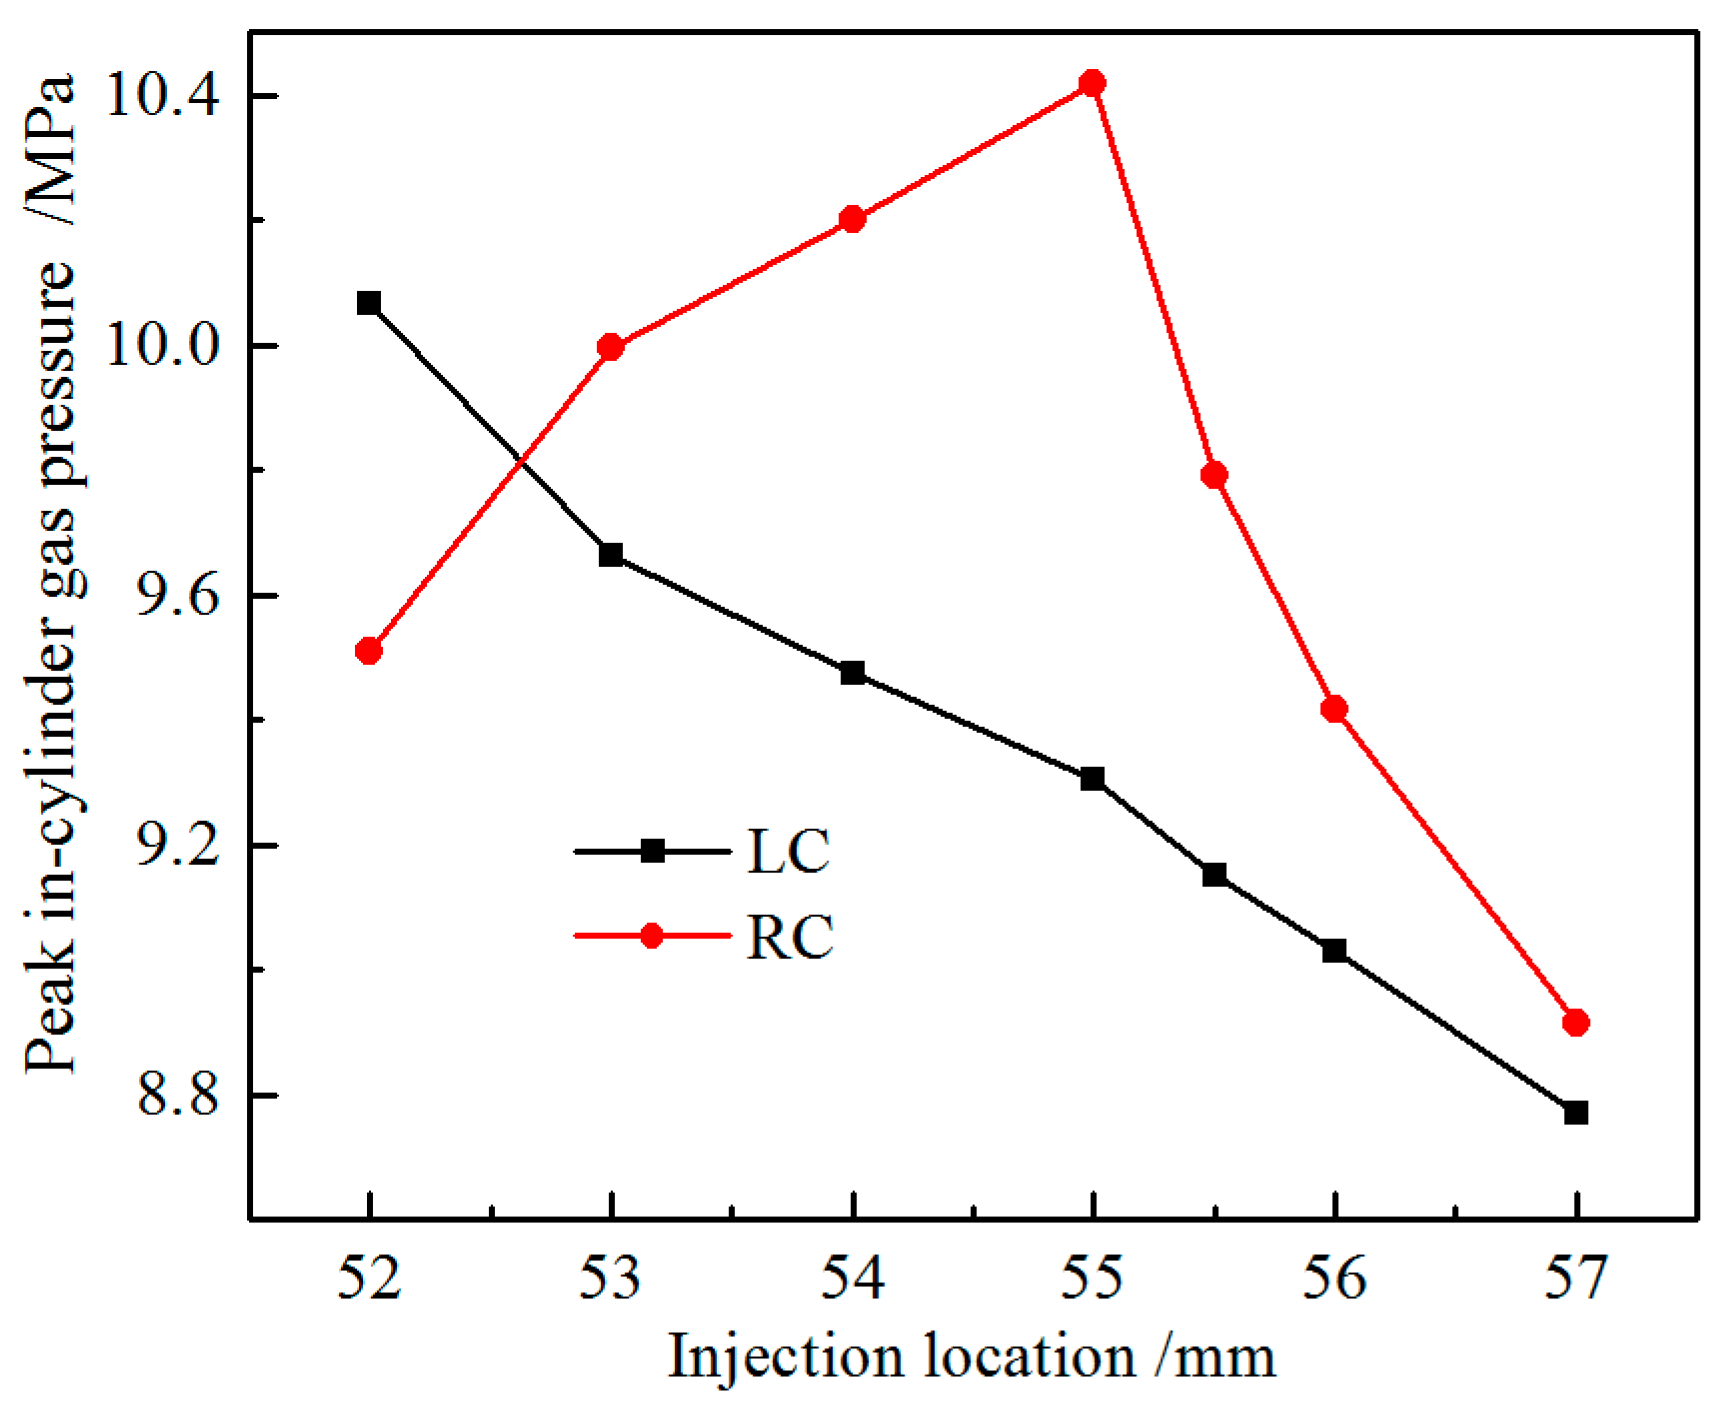
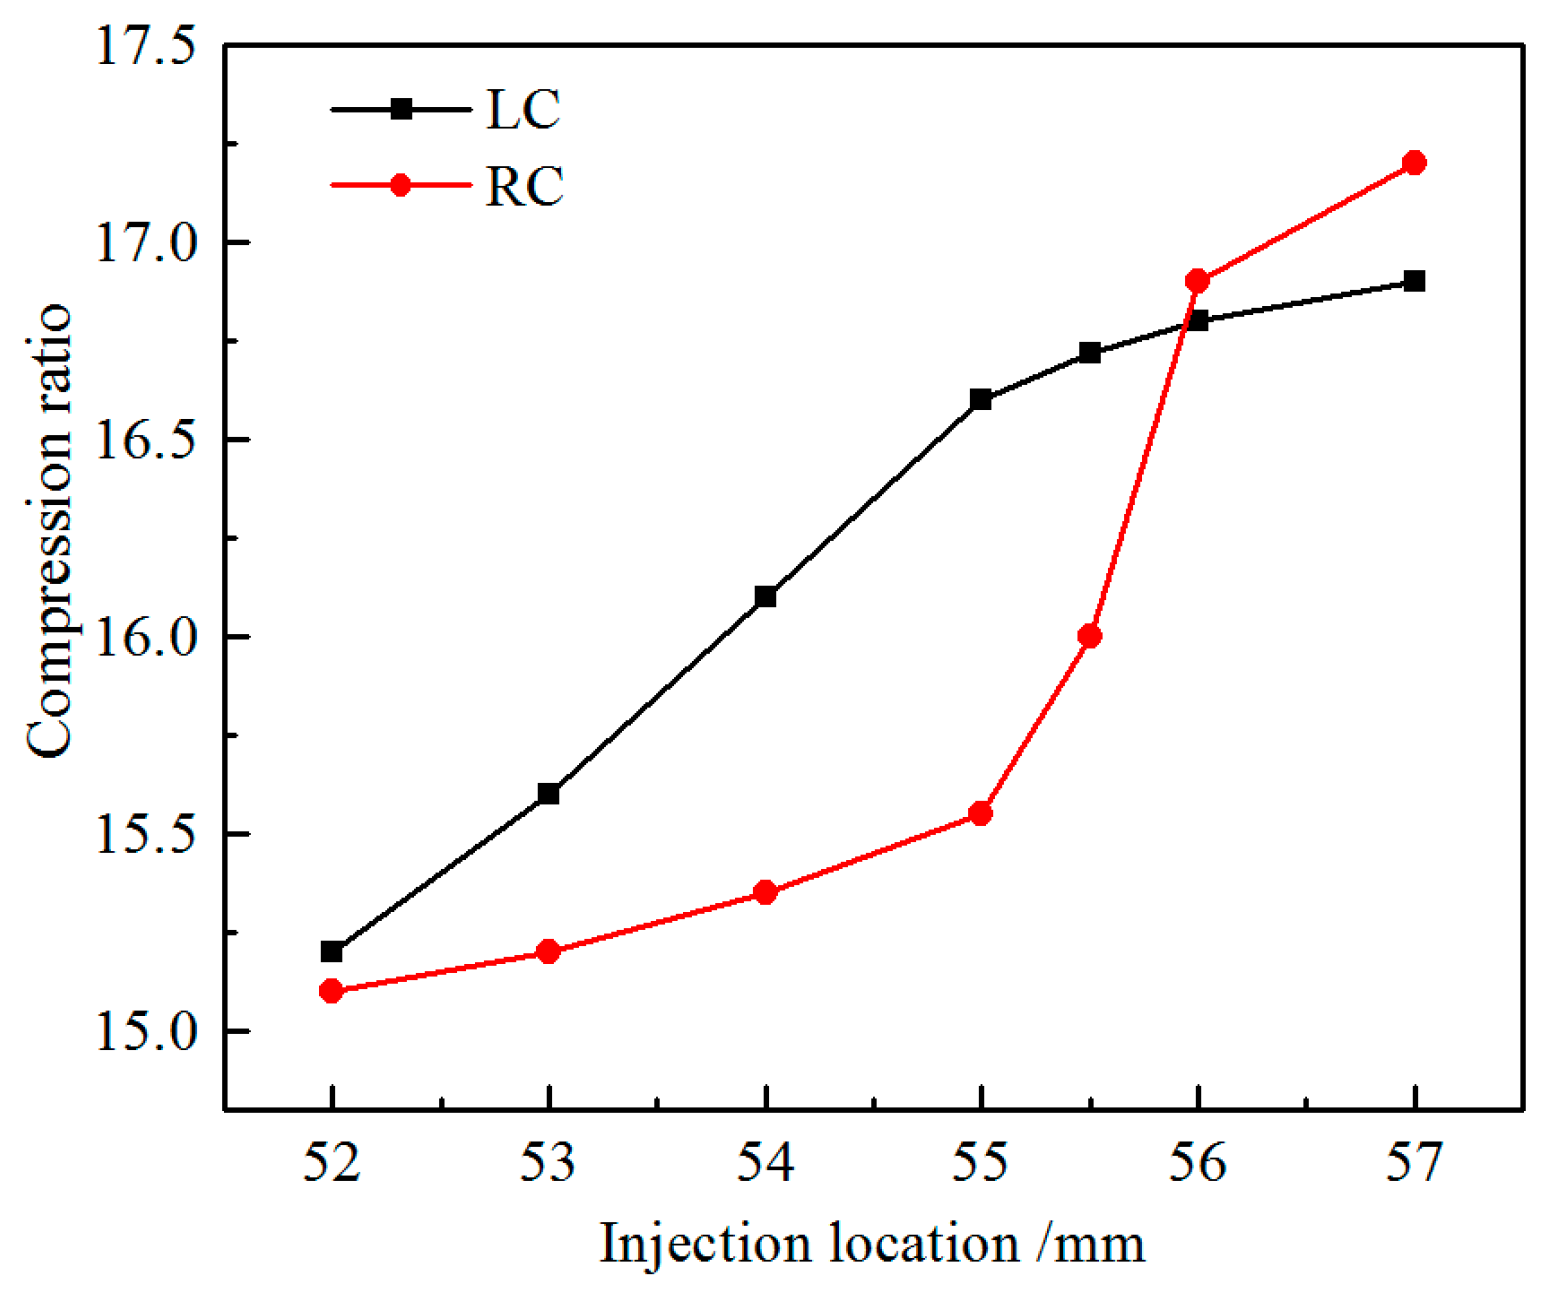
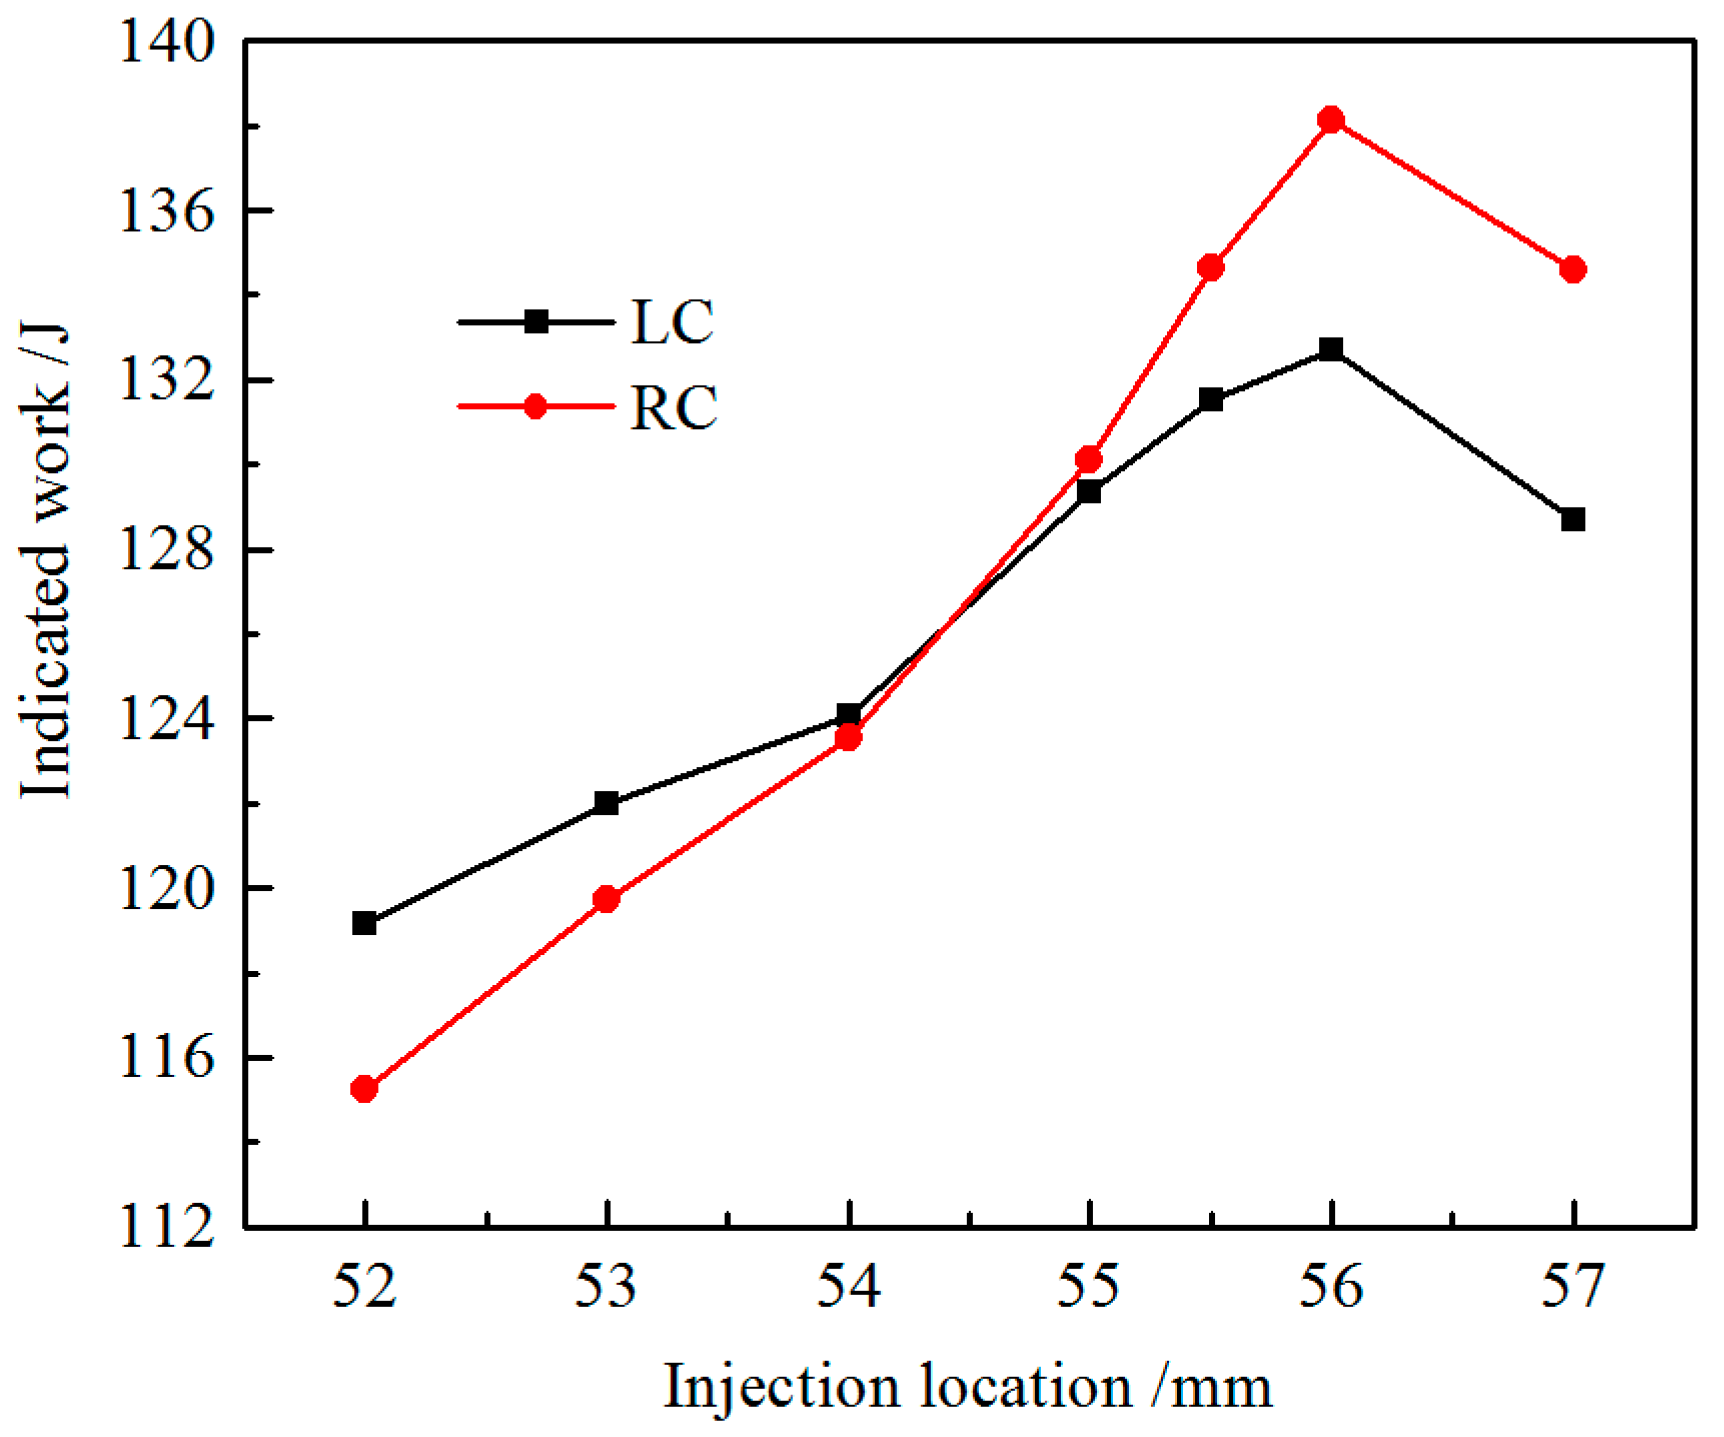
- As the “launch cylinder”, the LC’s condition is mainly determined by the motor force and the ignition timing. The compression ratio and the peak in-cylinder gas pressure variation trends are similar to those of the CE. Under the injection strategy of position feedback, when the “triggering position” value increases, the compression ratio of the LC increases and the peak in-cylinder gas pressure declines. The maximum IW value of this prototype occurs when the injection value is 56 mm.
- The compression energy of the RC is influenced by the IW of the LC, subtracting the part absorbed by the linear motor. Under the injection strategy of position feedback, the trend of the peak in-cylinder gas pressure of the RC has the form of a parabola, and the maximum value of this prototype’s peak in-cylinder gas pressure occurs when “triggering position” value is 55 mm. Increasing the “triggering position” from 55 mm up to 56 mm, the compression ratio increases largely, and the IW of the RC reaches the maximum value. The IW of the LC and the RC reach the maximum values of 132.7 J and 138.1 J, respectively.
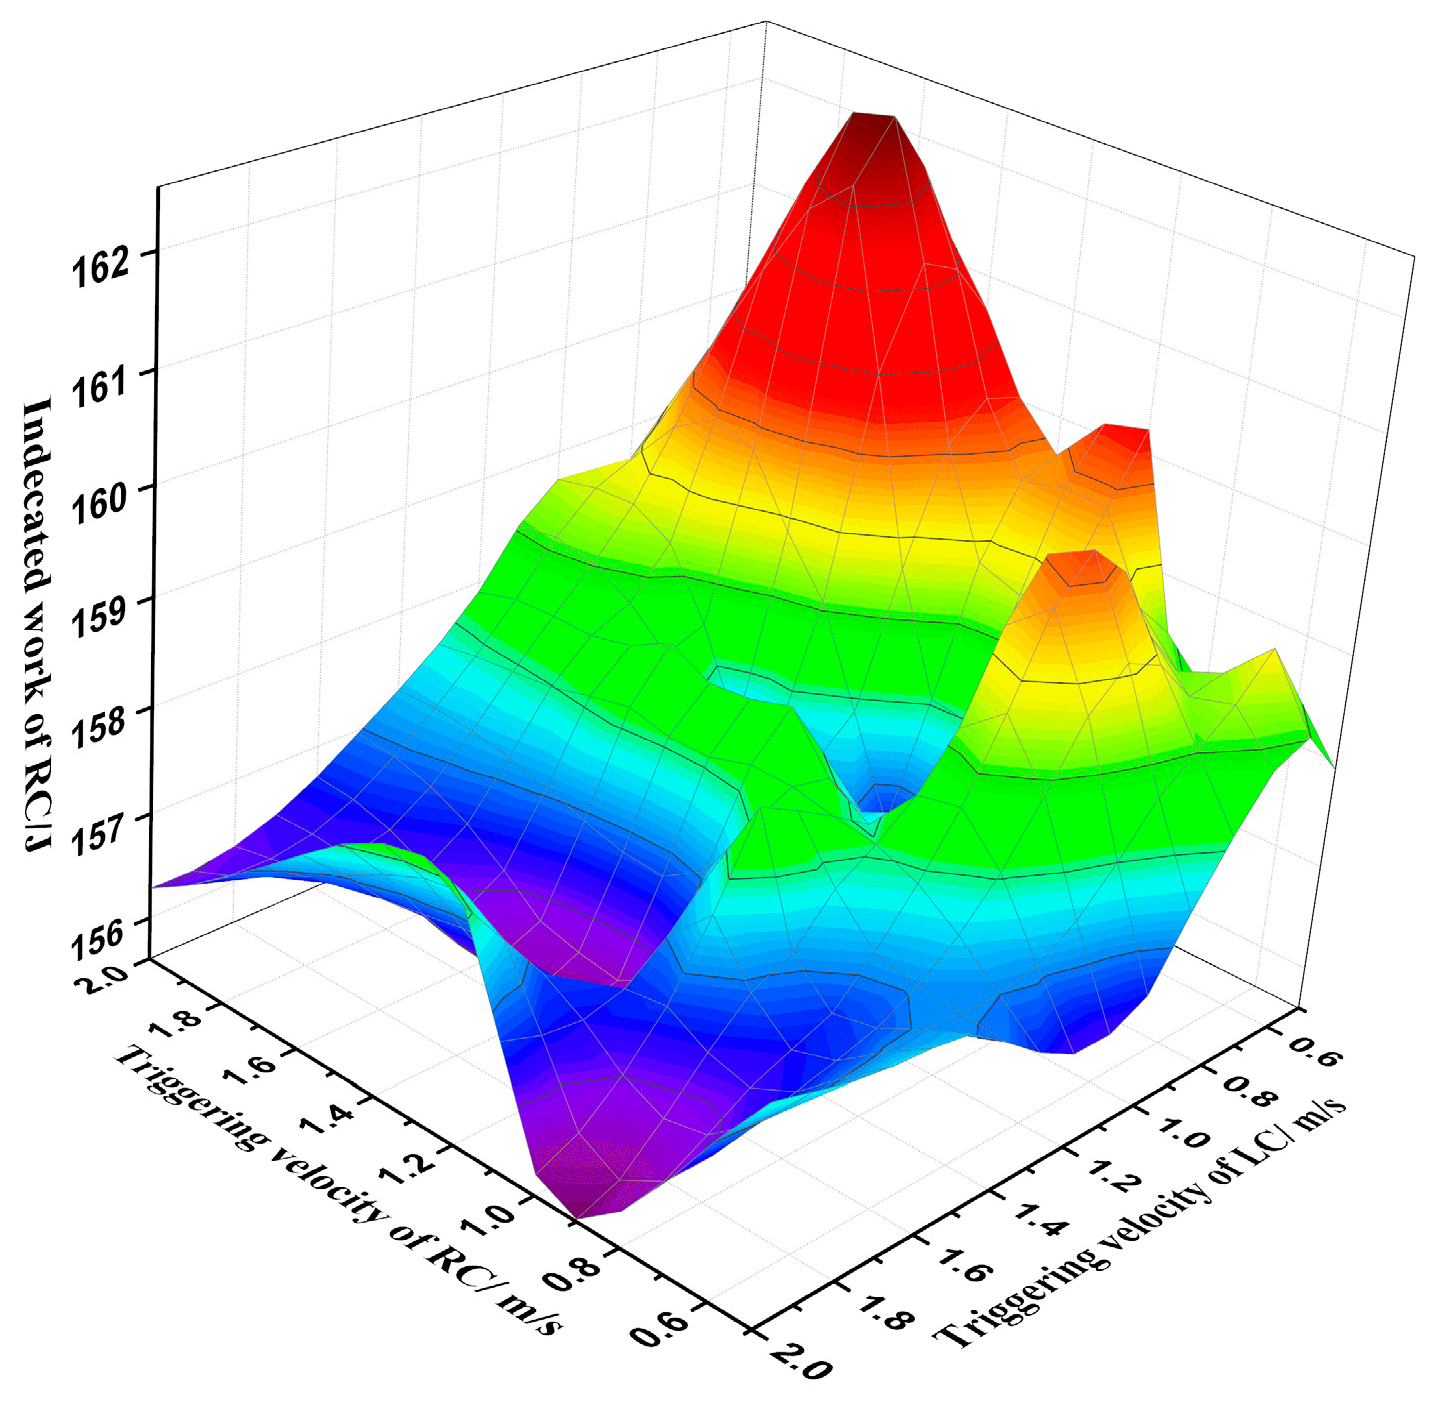
- Under the injection strategy of velocity feedback, if the “triggering velocity” values of two cylinders are the same, then there exists a substantial difference of peak gas pressures when the “triggering velocity” is relatively high. Different setting values of the triggering velocity in the LC and the RC can address the problem. In this manner, the IW of the LC ranges from 141.4 J to 149.0 J, and the IW map shape of the RC has two peaks, with the maximum value of 162.3 J. Thus, this strategy can contribute to a higher IW compared to the other strategy.
- Because of the lack of mechanical restraint and a flywheel-like device, the combustion condition largely affects the mover’s motion characteristics, and the coupled relationship between the motion and combustion makes the next combustion vary largely again. This high variation causes the operation conditions to differ largely at the same position; however, the velocity signal could better indicate the operation condition of the prototype. The test result demonstrates that the strategy of using the velocity signal can achieve a relatively better operating condition. Using the velocity signal to optimise the injection timing should improve the operation performance markedly.
Acknowledgments
Author Contributions
Conflicts of Interest
Abbreviations
| FPE | Free Piston Engine |
| CE | Conventional engine |
| FPLG | Free piston engine linear generator |
| CI | Compression ignition |
| IW | Indicated work |
| LDC | Left dead center |
| RDC | Right dead center |
| TDC | Top dead center |
| BDC | Bottom dead center |
| LC | Left cylinder |
| RC | Right cylinder |
| Symbols | |
| x | Position of piston assembly [m] |
| t | Time [s] |
| m | Mass of piston assembly [kg] |
| Ac | Cross sectional area of left cylinder [m2] |
| As | Effective action area of scavenge backpressure [m2] |
| Fmotor | Motor force [N] |
| Ff | Friction force [N] |
| PLc | Pressure in left cylinder [Pa] |
| PLs | Pressure in left scavenge chamber [Pa] |
| PRc | Pressure in right cylinder [Pa] |
| PRs | Pressure in right scavenge chamber [Pa] |
| VL | Volume of left cylinder [m3] |
| VR | Volume of right cylinder [m3] |
| γ | Specific heat ratio |
| QLhc | Heat transfer in left cylinder [J] |
| QRhc | Heat transfer in right cylinder [J] |
| QL | Combustion heat release of left cylinder [J] |
| QR | Combustion heat release of right cylinder [J] |
| T | Gas temperature [K] |
| Tw | Wall temperature [K] |
| Aall | Heat transfer area in cylinder [m2] |
| λ | Heat transfer coefficient [J/(m2K)] |
| ῡ | Mean speed of piston assembly [kg] |
References
- Casba, T.N. Linear Engine Development for series Hybrid Electric Vehicles. Ph.D. Thesis, West Virginia University, Morgantown, WV, USA, 2004. [Google Scholar]
- Mikalsen, R.; Roskilly, A. A review of free-piston engine history and applications. Appl. Therm. Eng. 2007, 27, 2339–2352. [Google Scholar] [CrossRef]
- Mikalsen, R.; Roskilly, A. Performance simulation of a spark ignited free-piston engine generator. Appl. Thermal Eng. 2008, 28, 1726–1733. [Google Scholar] [CrossRef]
- Mikalsen, R.; Jones, E.; Roskilly, A.P.A.P. Predictive piston motion control in a free-piston internal combustion engine. Appl. Energy 2010, 87, 1722–1728. [Google Scholar] [CrossRef]
- Mikalsen, R.; Roskilly, A.P. The control of a free-piston engine generator. Part 1: Fundamental analyses. Appl. Energy 2010, 87, 1273–1280. [Google Scholar] [CrossRef]
- Mikalsen, R.; Roskilly, A.P. The control of a free-piston engine generator. Part 2: Engine dynamics and piston motion control. Appl. Energy 2009, 87, 1281–1287. [Google Scholar] [CrossRef]
- Atkinson, C.M.; Petreanu, S.; Clark, N.N. Numerical Simulation of a Two-Stroke Linear Engine. SAE Pap. 1999. [Google Scholar] [CrossRef]
- Li, Q.; Xiao, J.; Huang, Z. Simulation of a two-stroke free-piston engine for electrical power generation. Energy Fuels 2008, 22, 3443–3449. [Google Scholar] [CrossRef]
- Blarigan, P.V.; Paradiso, N.; Goldsborough, S. Homogeneous charge compression ignition with a free piston: A new approach to ideal otto cycle performance. SAE Pap. 1998. [Google Scholar] [CrossRef]
- Goldsborough, S.S.; Blarigan, P.V. Numerical study of a free piston IC engine operating on homogeneous charge compression ignition combustion. SAE Pap. 1999. [Google Scholar] [CrossRef]
- Aichlmayr, H.T.; Kittelson, D.B.; Zachariah, M.R. Miniature free-piston homogeneous charge compression ignition engine-compressor concept-Part I: Performance estimation and design. Chem. Eng. Sci. 2002, 57, 4161–4171. [Google Scholar] [CrossRef]
- Aichlmayr, H.T.; Kittelson, D.B.; Zachariah, M.R. Miniature free-piston homogeneous charge compression ignition engine-compressor concept-Part II: Modeling HCCI combustion in small scales with detailed homogeneous gas phase chemical kinetics considerations unique to small dimensions. Chem. Eng. Sci. 2002, 57, 4173–4186. [Google Scholar] [CrossRef]
- Shoukry, E.; Taylor, S.; Clark, N. Numerical simulation for parametric study of a two-stroke direct injection linear engine. SAE Pap. 2002. [Google Scholar] [CrossRef]
- Nemecek, P.; Vysoky, O. Control of two-stroke free-piston generator. In Proceedings of the 6th Asian Control Conference, Bali, Indonesia, 18–21 July 2006.
- Jaeheun, K.; Choongsik, B.; Gangchul, K. Simulation on the effect of the combustion parameters on the piston dynamics and engine performance using the Wiebe function in a free piston engine. Appl. Energy 2013, 107, 446–455. [Google Scholar]
- Hung, N.B.; Lim, O.T. A study of a two-stroke free piston linear engine using numerical analysis. J. Mech. Sci. Technol. 2014, 28, 1525–1557. [Google Scholar] [CrossRef]
- Achten, P.A.J. A review of free piston engine concepts. SAE Pap. 1994. [Google Scholar] [CrossRef]
- Razali Hanipah, M.; Mikalsen, R.; Roskilly, A.P. Recent commercial free-piston engine developments for automotive applications. Appl. Therm. Eng. 2015, 75, 493–503. [Google Scholar] [CrossRef]
- Zhao, Z.; Wu, D.; Zhang, Z.; Zhang, F.; Zhao, C. Experimental investigation of the cycle-to-cycle variations in combustion process of a hydraulic free-piston engine. Energy 2014, 78, 257–265. [Google Scholar] [CrossRef]
- Hidemasa, K.; Tomoyuki, A.; Kazunari, M. Development of free piston engine linear generator System Part 1: Investigation of fundamental characteristics. SAE Pap. 2014. [Google Scholar] [CrossRef]
- Shigeaki, G.; Kaznunari, M.; Hidemasa, K. Development of free piston engine linear generator system Part 2: Investigation of control system for generator. SAE Pap. 2014. [Google Scholar] [CrossRef]
- Mao, J.; Zuo, Z.; Li, W.; Feng, H. Multi-dimensional scavenging analysis of a free-piston linear alternator based on numerical simulation. Appl. Energy 2011, 88, 1140–1152. [Google Scholar] [CrossRef]
- Feng, H.; Song, Y.; Zuo, Z.; Shang, J.; Wang, Y.; Roskilly, A.P. Stable Operation and Electricity Generating Characteristics of a Single-Cylinder Free Piston Engine Linear Generator: Simulation and Experiments. Energies 2015, 8, 765–785. [Google Scholar] [CrossRef]
- Xu., Z.; Chang, S. Prototype testing and analysis of a novel internal combustion linear generator integrated power system. Appl. Energy 2010, 87, 1342–1348. [Google Scholar] [CrossRef]
- Jia, B.; Tian, G.; Feng, H.; Zuo, Z.; Roskilly, A.P. An experimental investigation into the starting process of free-piston engine generator. Appl. Energy 2015, 157, 798–804. [Google Scholar] [CrossRef]
- Famouri, P.; Cawthorne, W.R.; Clark, N.; Nandkumar, S.; Atkinson, C.; Atkinson, R. Design and testing of a novel linear alternator and engine system for remote electrical power generation. In Proceedings of the IEEE power engineering society winter meeting, New York, NY, USA, 31 January–4 February 1999.
- Blarigan, P.V. Advanced internal combustion electrical generator. In Proceedings of the 2002 US DOE Hydrogen Program Review, Golden, CO, USA, 6–10 May 2002.
- Zulkifli, S.A.; Karsiti, M.N.; Aziz, A. Investigation of linear generator starting modes by mechanical resonance and rectangular current commutation. In Proceedings of the IEEE International Electric Machines and Drives Conference, Miami, FL, USA, 3–6 May 2009.


| Parameter | Value |
|---|---|
| Bore | 60 mm |
| Maximum stroke length | 94 mm |
| Distance from exhaust port to cylinder head | 61.5 mm |
| Distance from scavenge port to cylinder head | 73.5 mm |
| Mass of the mover | 5.4 kg |
| Rated compression ratio | 16.5 |
| Excess air coefficient | 1.7 |
| Injector serial number (Bosch) | 0445110321 |
| Test Device | Type |
|---|---|
| In-cylinder gas pressure sensor | Kistler 6052C |
| Charge amplifier | Kistler 5018A1000 |
| Piston position sensor | Motor built-in encoder |
| DAQ controller | NI PXIe-8135 |
| DAQ Card | NI PXIe-6358 |
| Property | Value |
|---|---|
| Cetane number | 45–55 |
| Molar mass | 180 g/mol |
| Liquid density | 0.82–0.83 kg/L |
| Boiling point | 160–360 °C |
| Low calorific value | 42,500 kJ/kg |
| Dynamic viscosity | 0.37 Pa·s |
| Kinematic viscosity | (2.5–8.5) × 10−4 m2/s |
| Excess air coefficient | 0.48–1.85 |
| Parameter | Value |
|---|---|
| Injection pulse-width | 0.7 ms |
| Cycle fuel injection mass | 6.9 mg |
| Number of nozzle holes | 3 |
| Nozzle diameter | 0.13 mm |
| Spray angle | 140° CA |
| Rail pressure | 105 MPa |
| Parameter | Value |
|---|---|
| Static friction force | 100 N |
| Electromagnetic force coefficient | 290 N/(m/s) |
| Intake air temperature | 300 K |
| Cylinder wall temperature | 550 K |
| Intake air pressure | 1.4 bar |
| Heat ratio γ | 1.35 |
© 2016 by the authors; licensee MDPI, Basel, Switzerland. This article is an open access article distributed under the terms and conditions of the Creative Commons Attribution (CC-BY) license (http://creativecommons.org/licenses/by/4.0/).
Share and Cite
Feng, H.; Guo, Y.; Song, Y.; Guo, C.; Zuo, Z. Study of the Injection Control Strategies of a Compression Ignition Free Piston Engine Linear Generator in a One-Stroke Starting Process. Energies 2016, 9, 453. https://doi.org/10.3390/en9060453
Feng H, Guo Y, Song Y, Guo C, Zuo Z. Study of the Injection Control Strategies of a Compression Ignition Free Piston Engine Linear Generator in a One-Stroke Starting Process. Energies. 2016; 9(6):453. https://doi.org/10.3390/en9060453
Chicago/Turabian StyleFeng, Huihua, Yuyao Guo, Yu Song, Chendong Guo, and Zhengxing Zuo. 2016. "Study of the Injection Control Strategies of a Compression Ignition Free Piston Engine Linear Generator in a One-Stroke Starting Process" Energies 9, no. 6: 453. https://doi.org/10.3390/en9060453
APA StyleFeng, H., Guo, Y., Song, Y., Guo, C., & Zuo, Z. (2016). Study of the Injection Control Strategies of a Compression Ignition Free Piston Engine Linear Generator in a One-Stroke Starting Process. Energies, 9(6), 453. https://doi.org/10.3390/en9060453