
Empirical Operational Energy Analysis of Downtown High-Rise vs. Suburban Low-Rise Lifestyles: A Chicago Case Study


Abstract
:
1. Introduction
2. Case Studies and Methodology
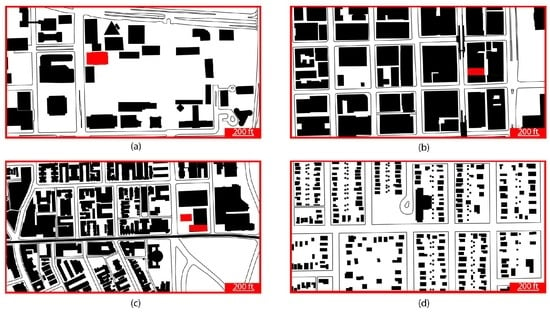
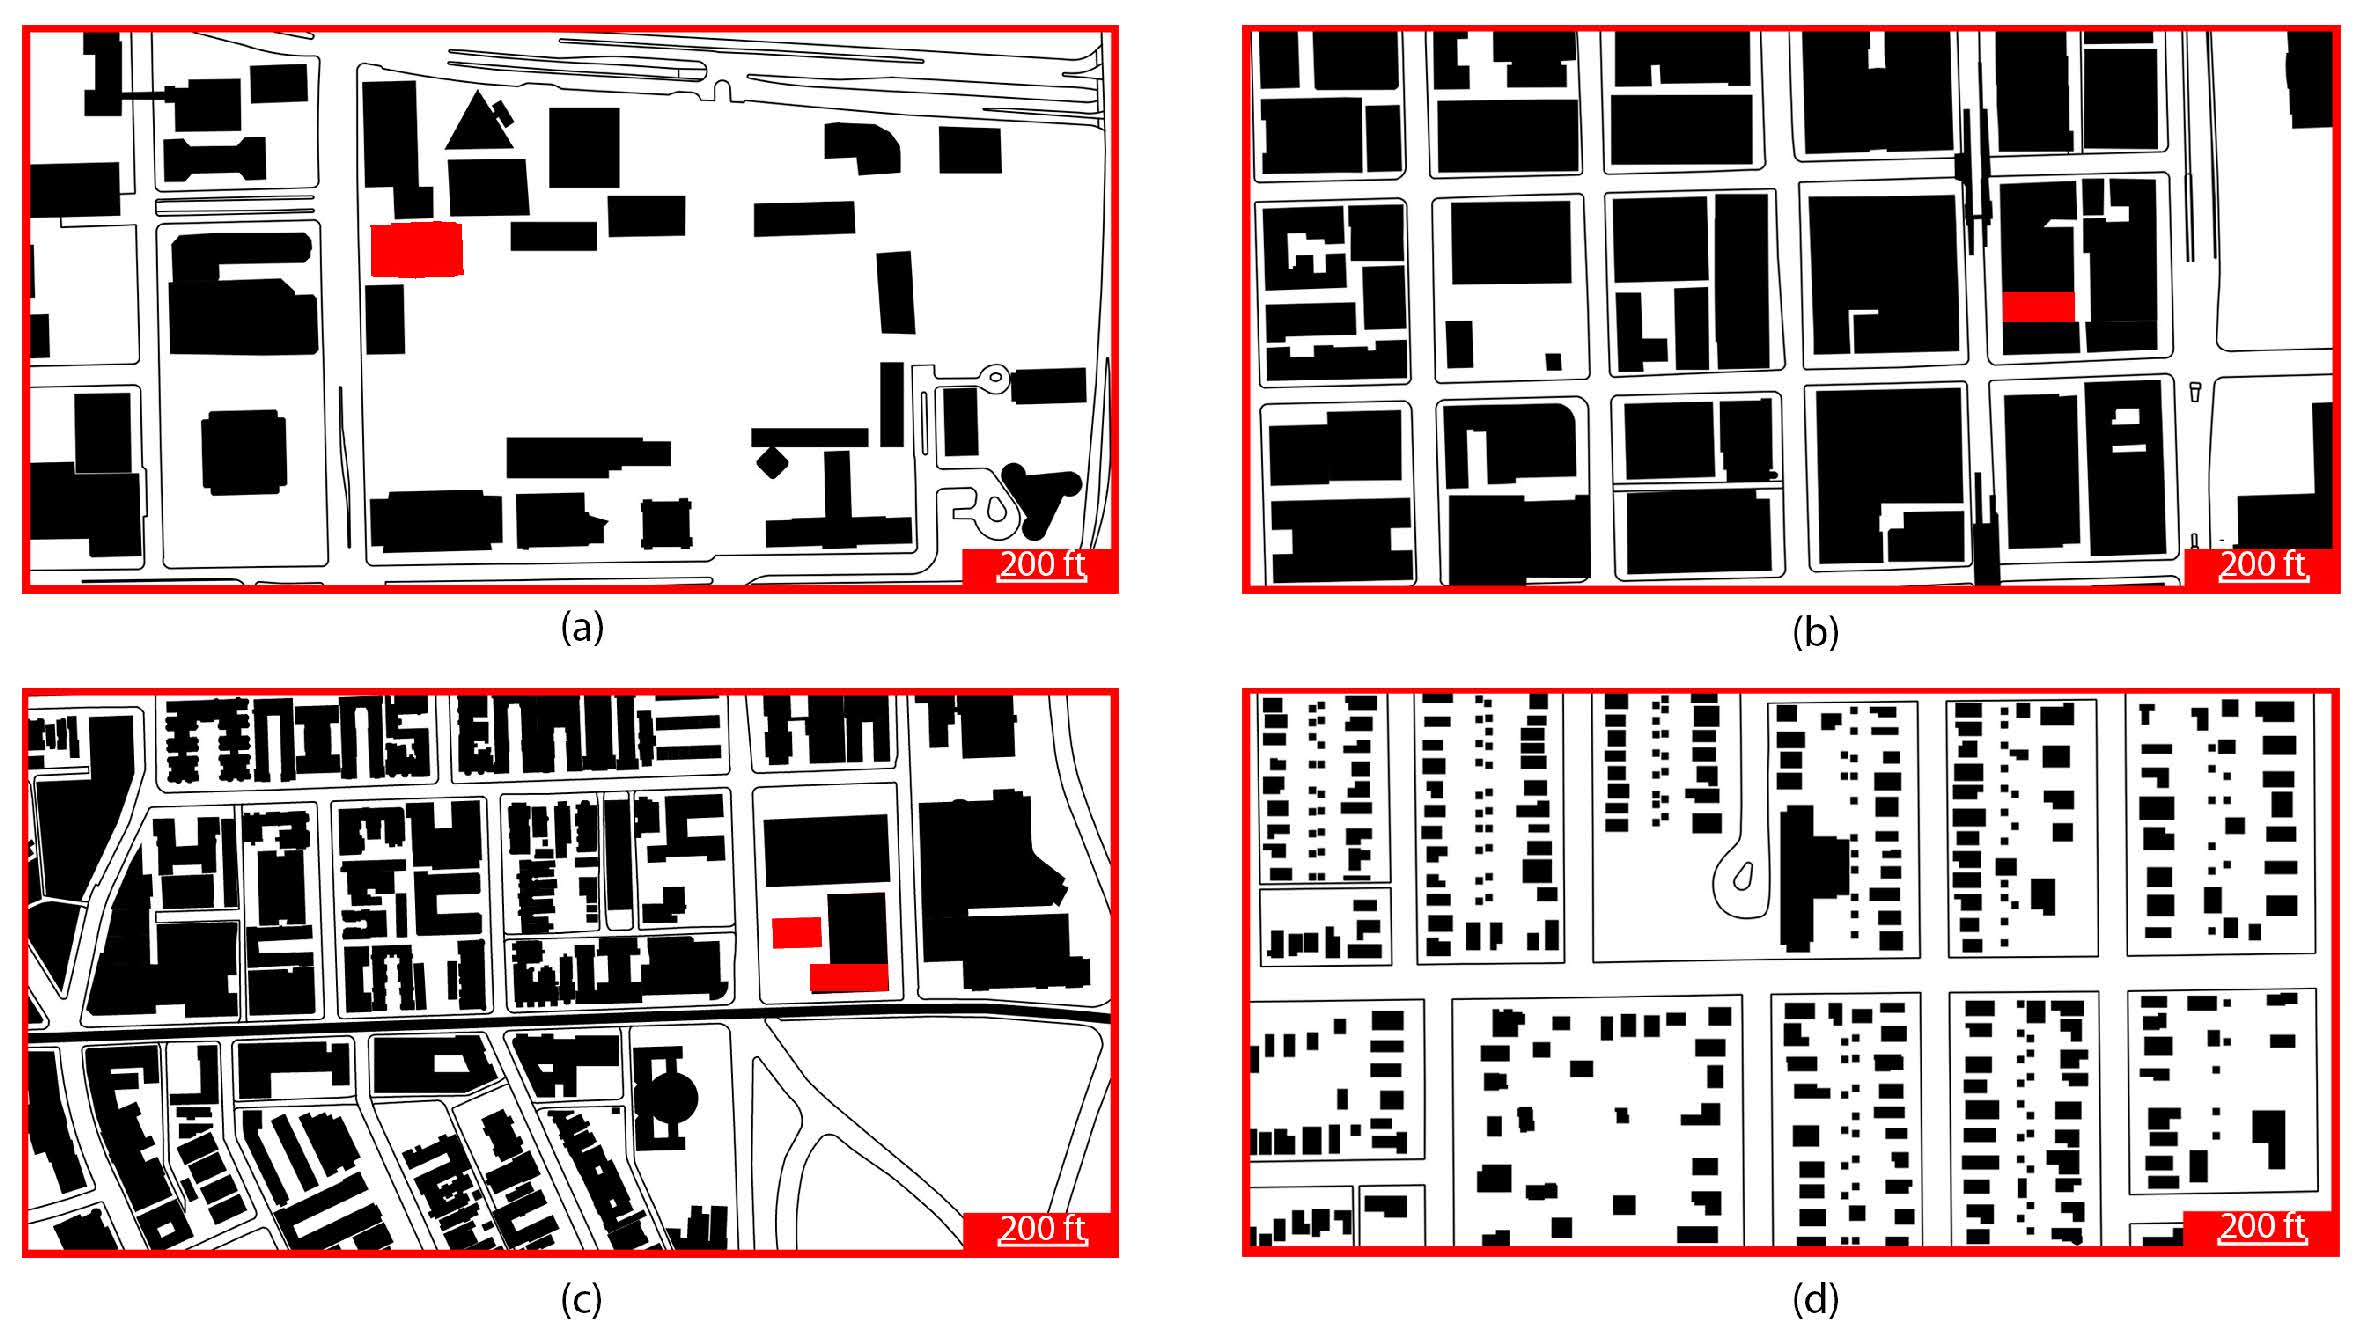
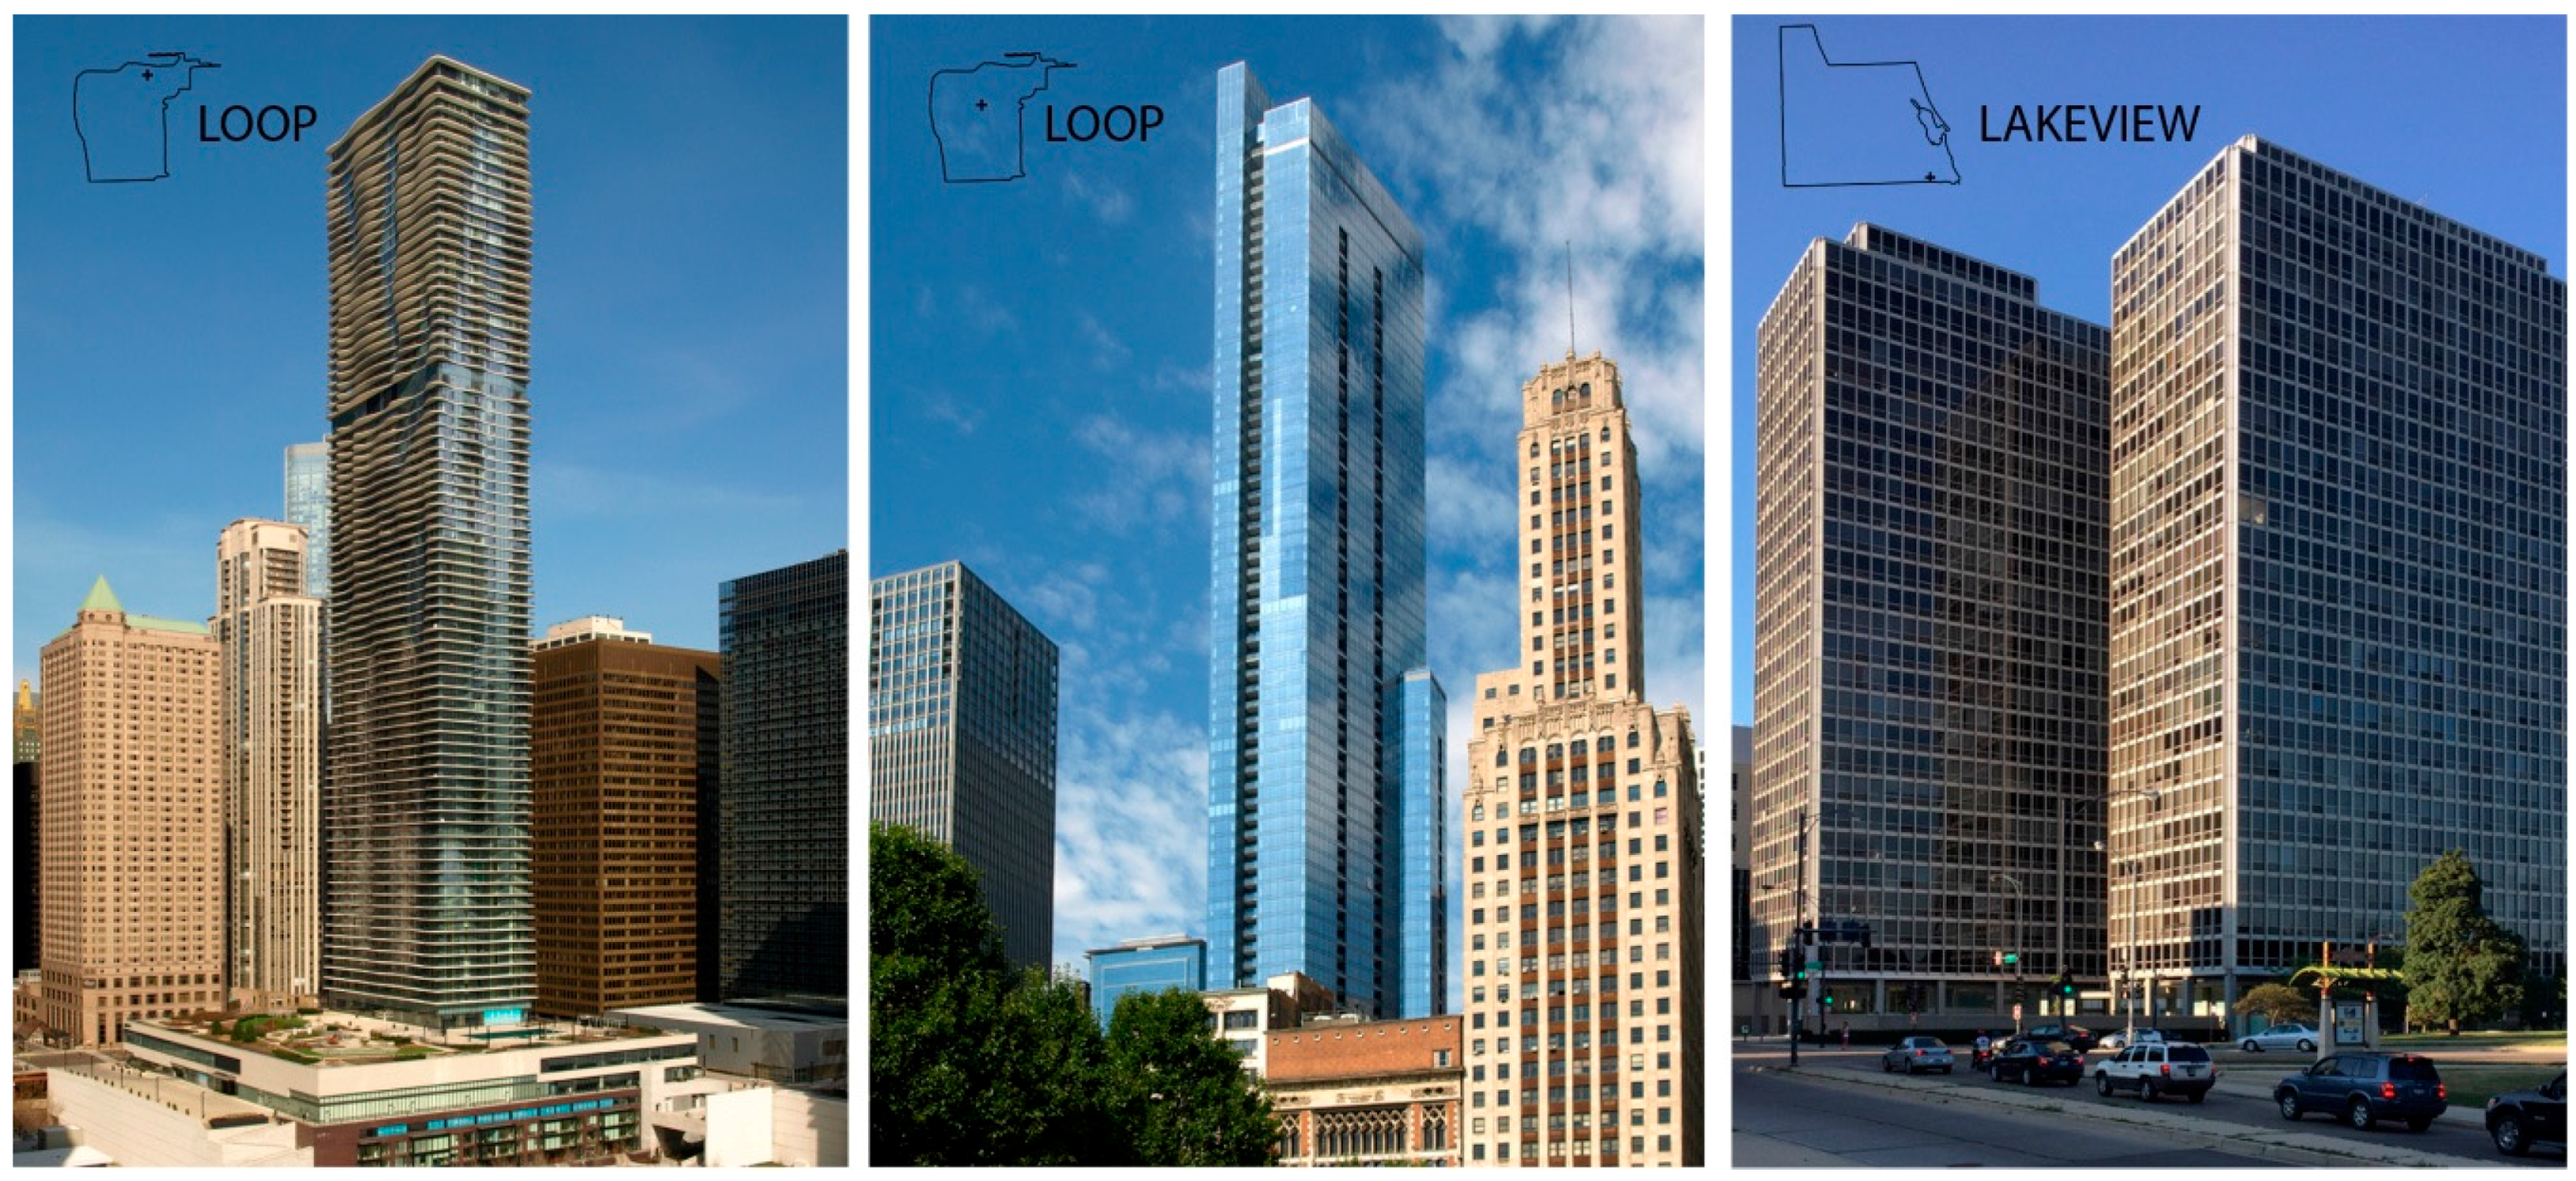
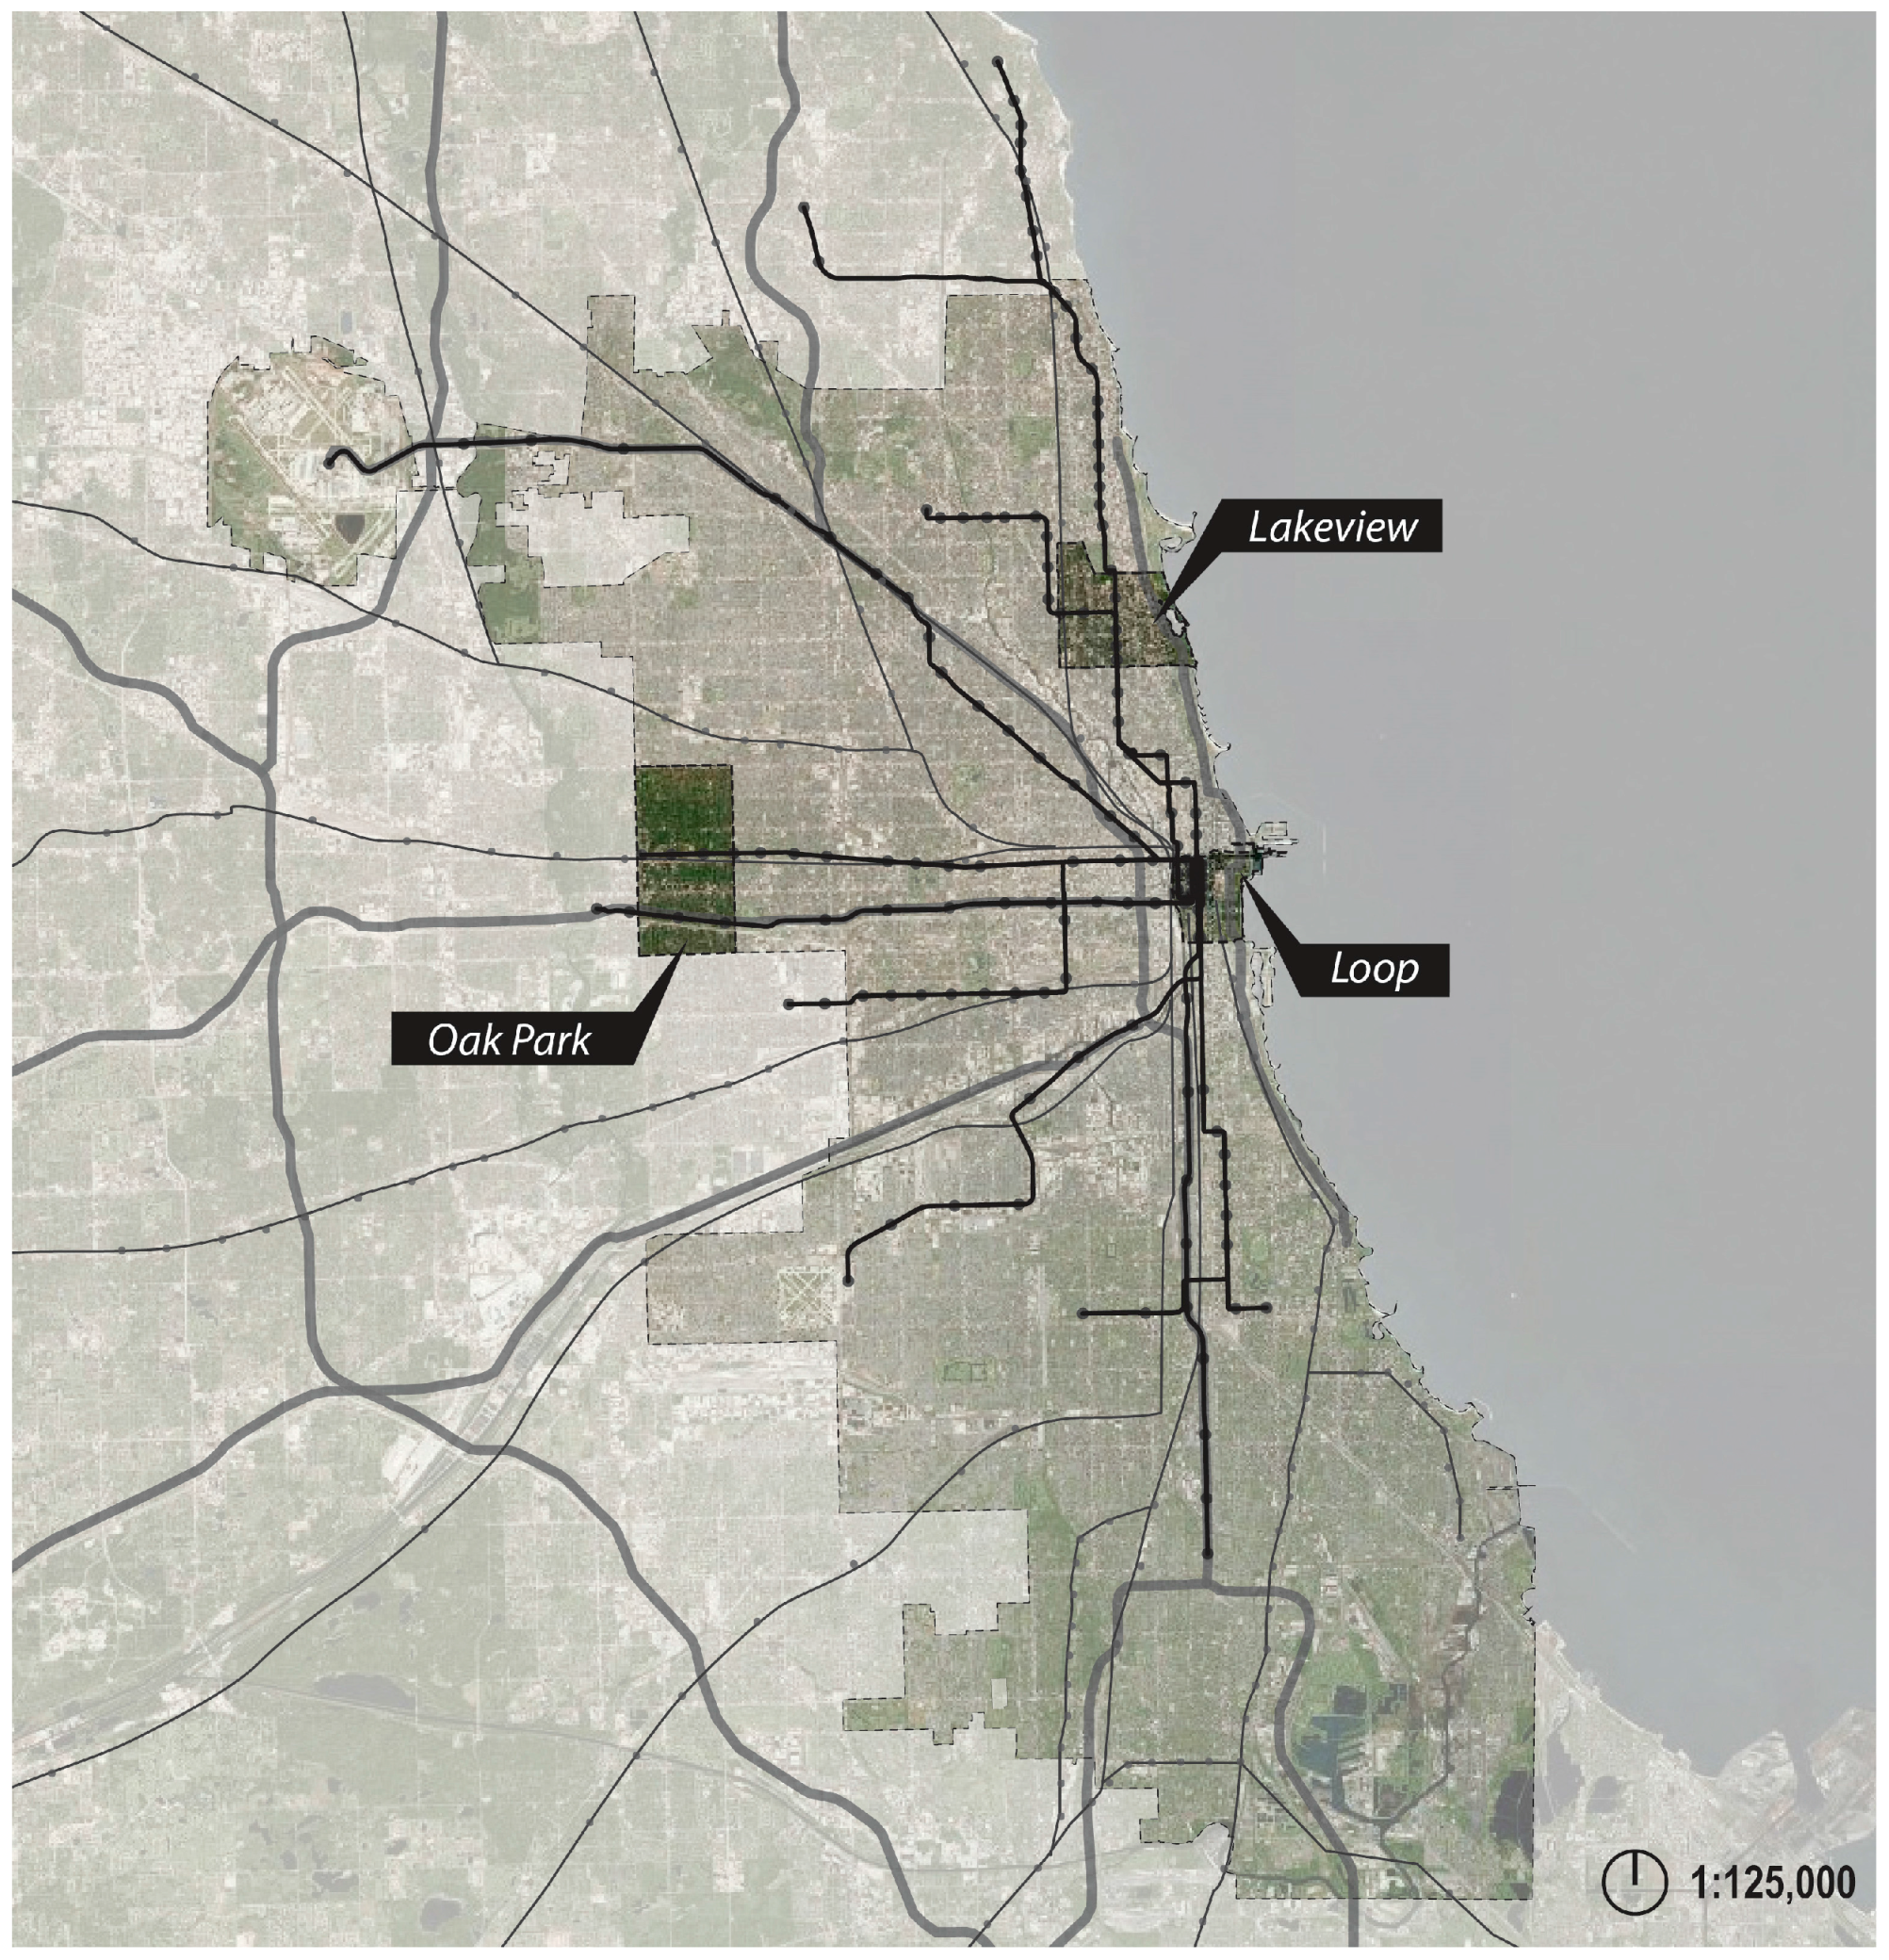
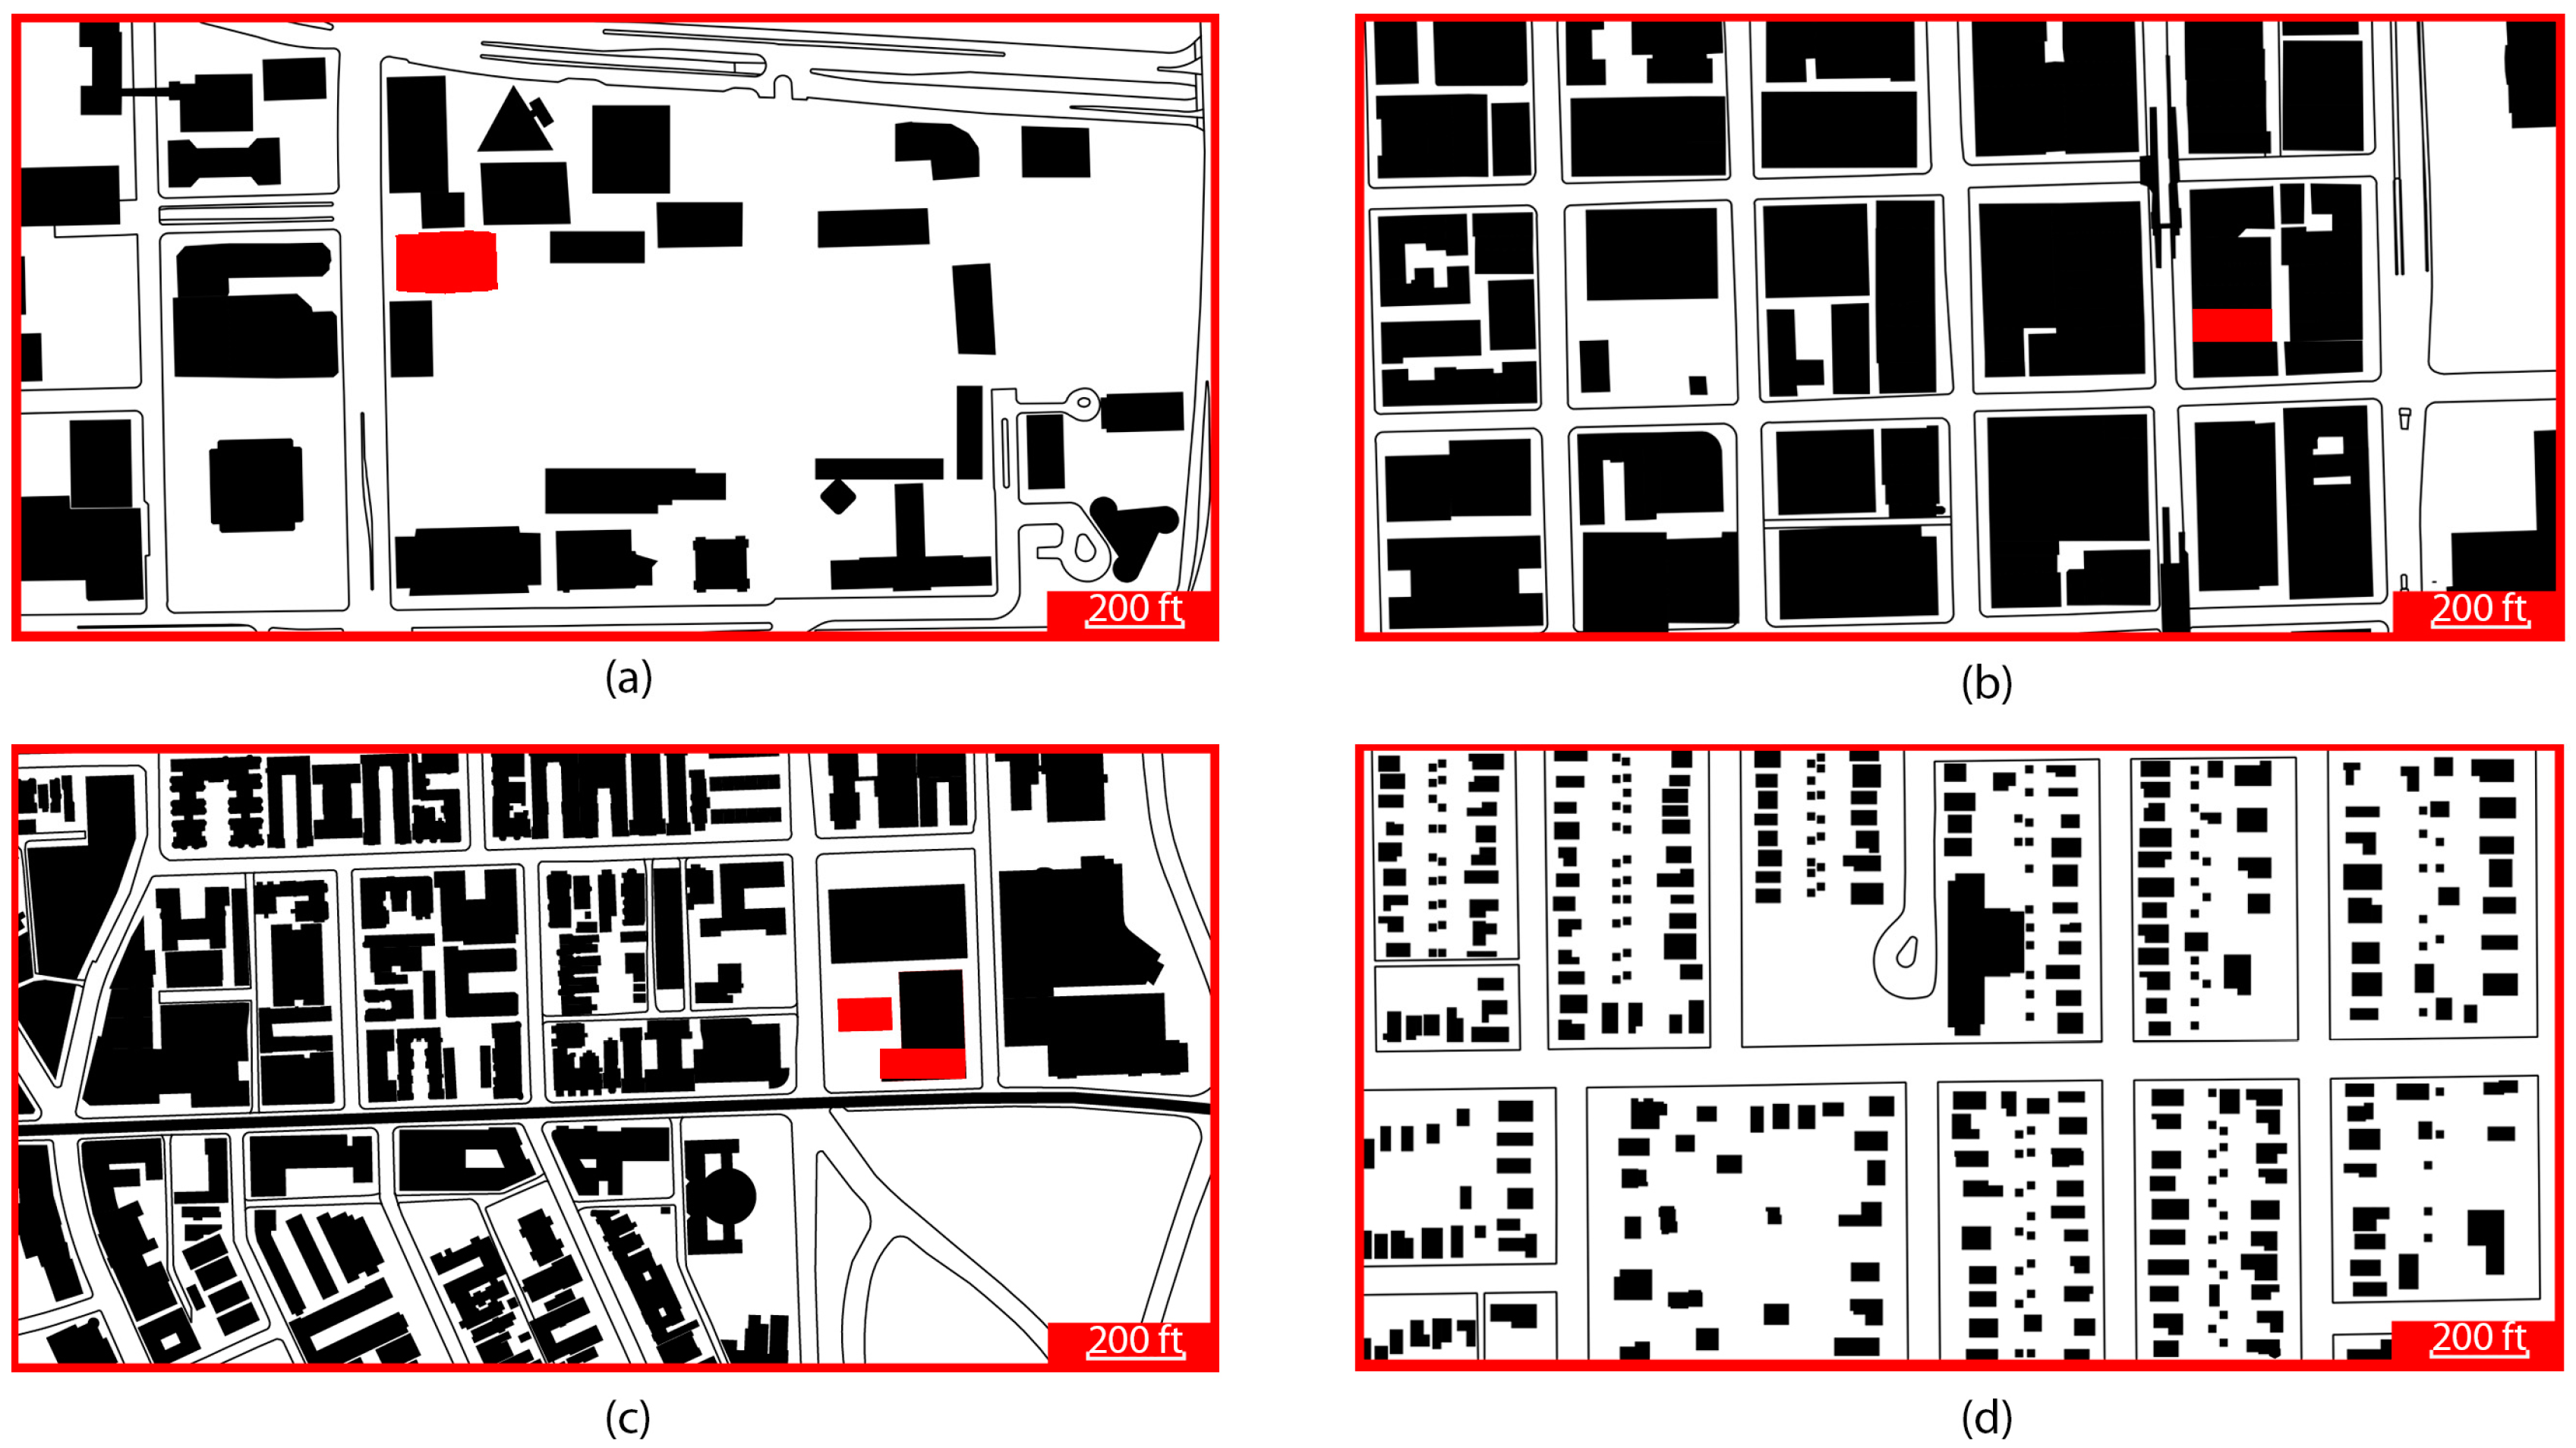
2.1. Case Study Set 1: Downtown High-Rise Residential Towers in Chicago, IL, USA
2.2. Case Study Set 2: Suburban Low-Rise Residences in Oak Park, IL, USA
2.3. Data Collection
- Demographics: each household member’s age, gender, race, employment status, etc.
- Household information: annual income, ownership status, time of residence, age of residential buildings, etc.
- Residential building and unit information, including:
- ➢
- Downtown residential towers: unit type, room #, ground floor area (GFA), floor #, etc.
- ➢
- Oak Park: building type, completion (year), structural and exterior wall material, floor #, GFA, heating & cooling system, outdoor feature, parking facility, etc.
- Owned vehicle/bicycle information: type, year, and distances traveled for various uses
- Travel behavior during a typical week: under each type of destination location (i.e., work, school, shopping, restaurant/entertainment, family/friends)
- ➢
- The collected data included frequency, travel time, modes of travel (i.e., walking, bicycling, automobile, bus, local CTA train, and regional Metra train), and distances traveled via each mode of travel
- Monthly utility usage: electric, gas, and water usage data for a 12-month period (participants could choose to upload their actual utility bills or fill out the actual usage for energy consumption from those bills)
2.4. Data Analysis
2.4.1. Building Operational Energy (BOE)
2.4.2. Transportation Operational Energy (TOE)
3. Results
3.1. Building Operational Energy (BOE)
3.1.1. Building Operational Energy (BOE) Analysis of Suburban Low-Rise Residential Buildings
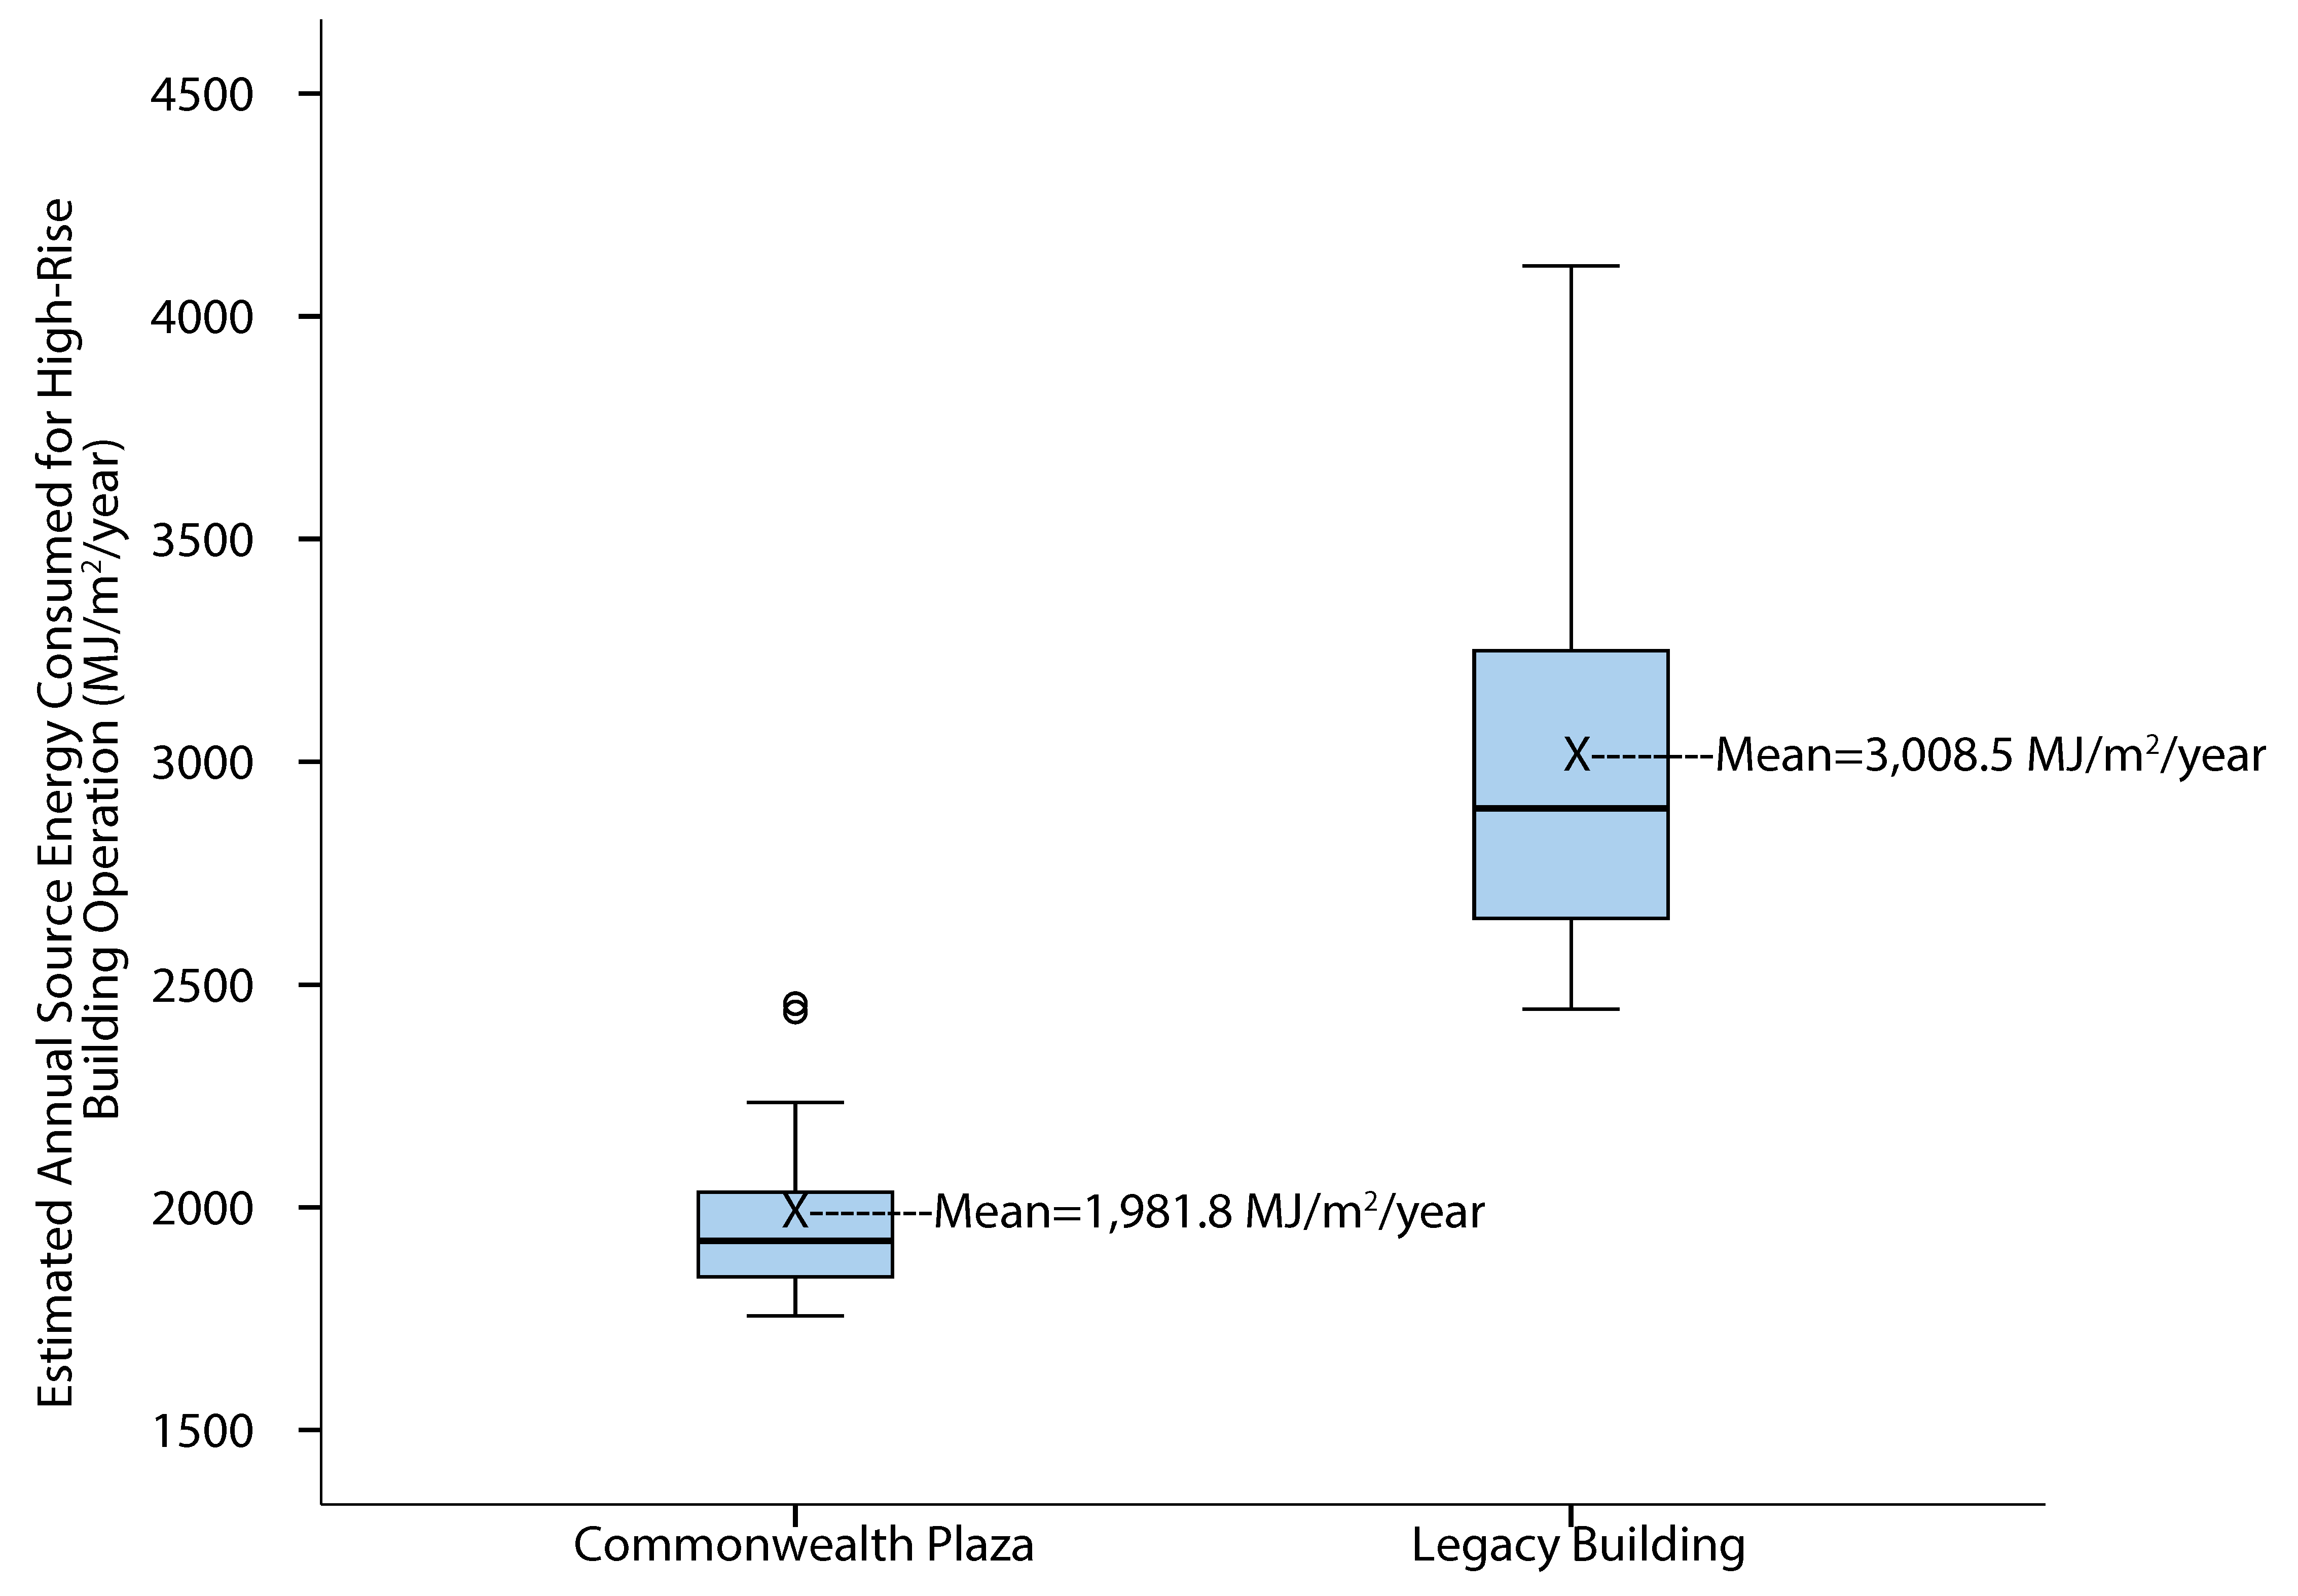
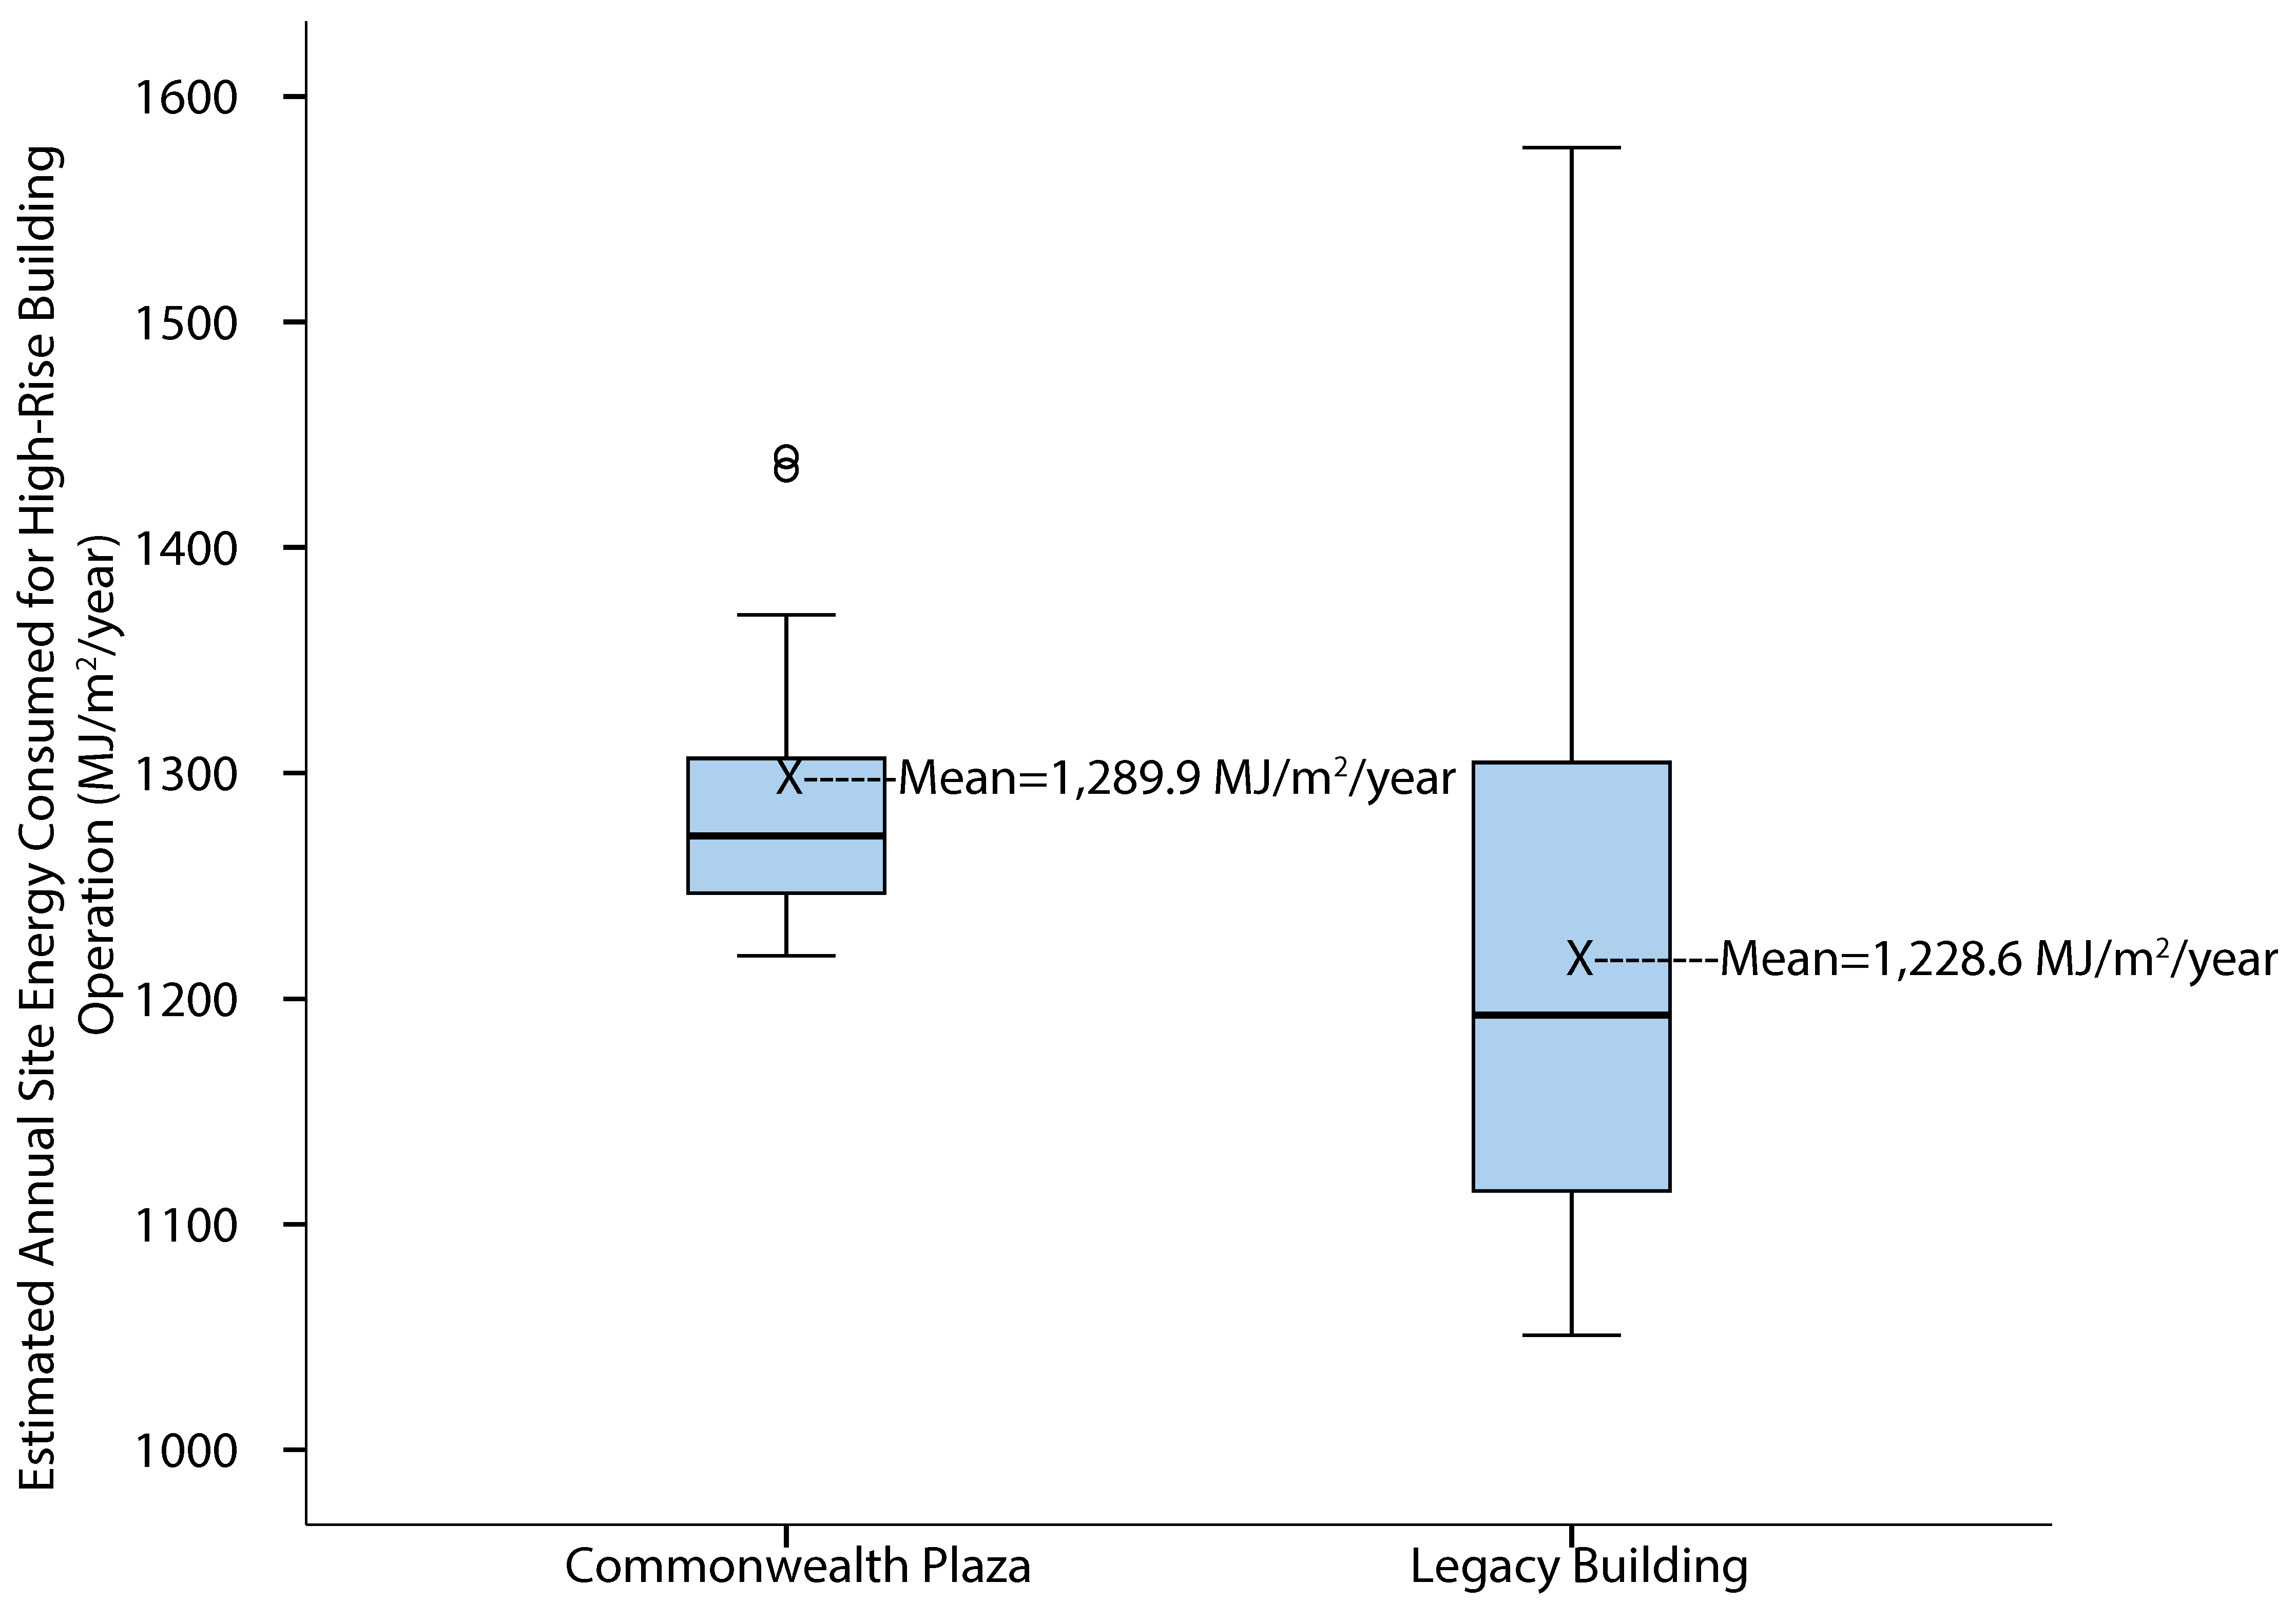
3.1.2. Building Operational Energy (BOE) Analysis of Downtown High-Rise Residential Buildings
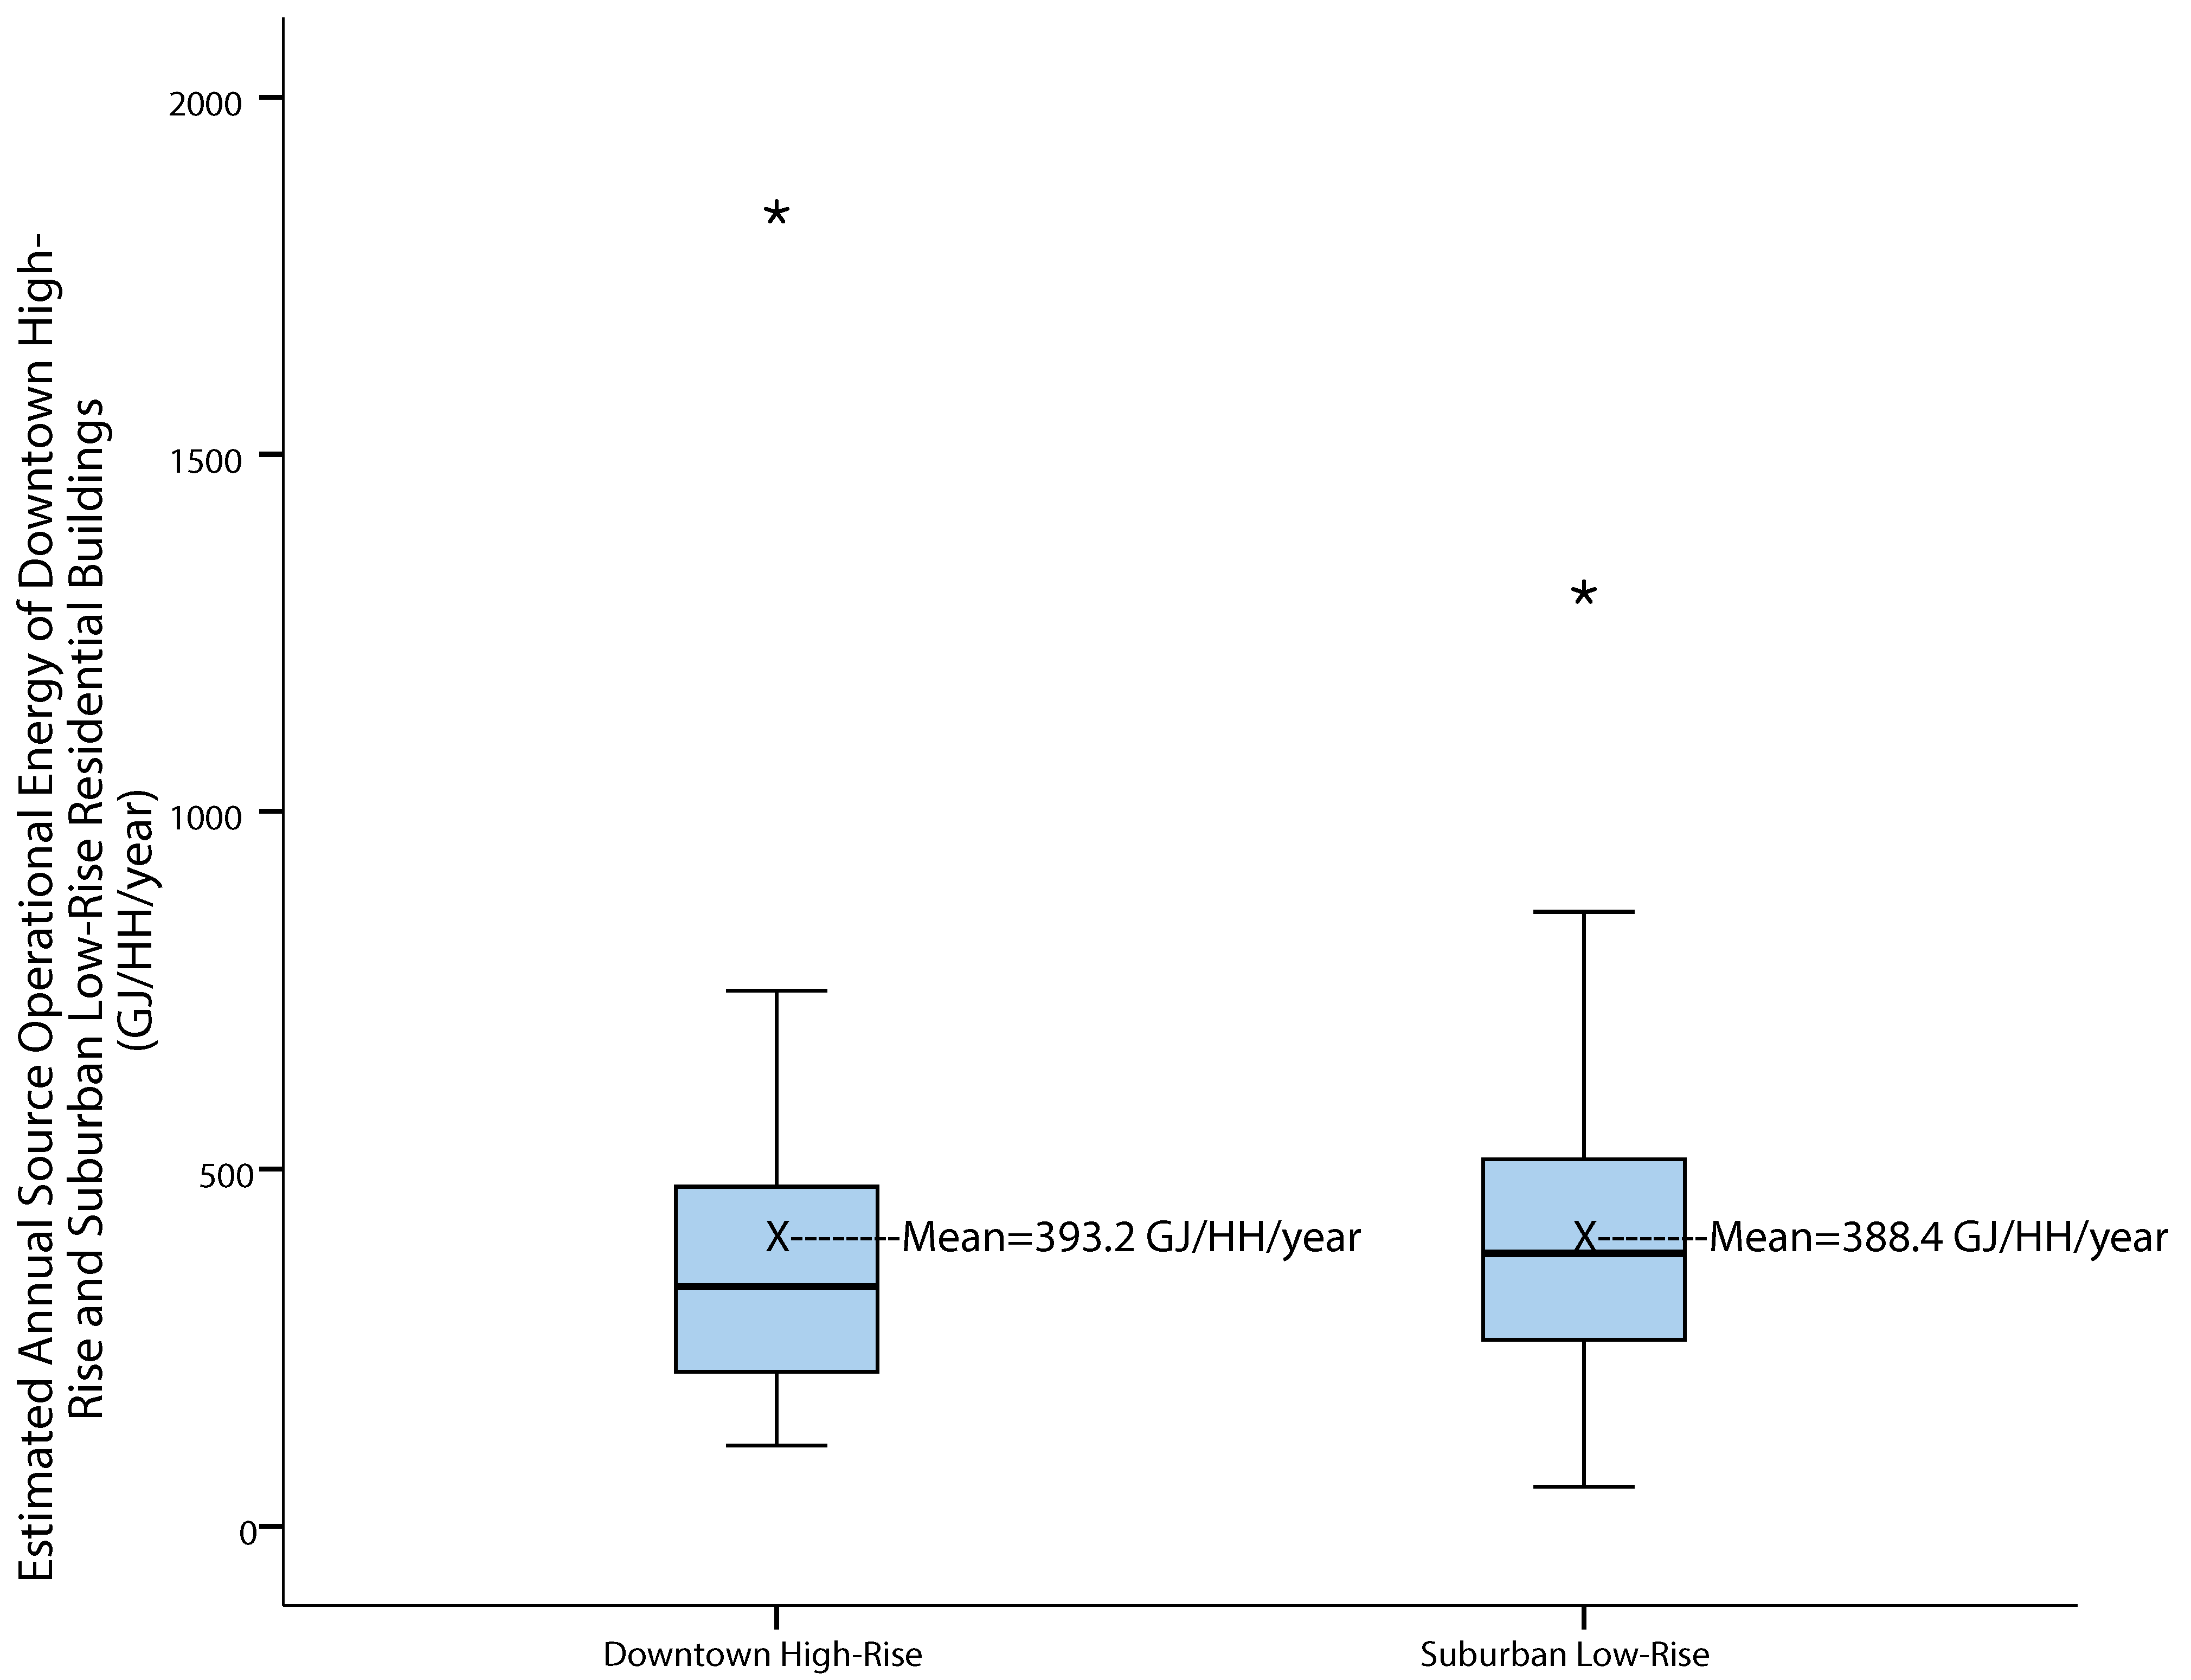
3.1.3. Building Operational Energy (BOE) Comparison of High-Rise vs. Low-Rise Residential Buildings
3.1.4. Building Operational Energy (BOE) Correlation Analysis
3.2. Transportation Operational Energy (TOE)
3.2.1. Travel Behavior Analysis
3.2.2. Transportation Operational Energy (TOE)
3.3. Comparison of Total Operational Energy for Buildings and Transportation
4. Discussion
4.1. Comparison to Previous Studies
4.2. Research Limitations
5. Conclusions
Acknowledgments
Author Contributions
Conflicts of Interest
Abbreviations
| BOE | building operational energy |
| BOEb | building operational energy paid by the building management |
| BOEc | building operational energy via chilled water |
| BOEe | building operational energy via electric |
| BOEg | building operational energy via gas |
| BOEi | building operational energy paid by the individual units |
| CDD | cooling degree days |
| CMAP | Chicago Metropolitan Agency for Planning |
| COP | coefficient of performance |
| CTA | Chicago Transit Authority |
| D | duplex |
| DOE | Department of Energy |
| EE | embodied energy |
| GFA | gross floor area |
| GHG | greenhouse gas |
| GJ | gigajoule |
| HDD | heating degree days |
| HH | household |
| LR | low-rise |
| LCA | life-cycle assessment |
| MJ | megajoule |
| MPG | miles per gallon |
| OE | operational energy |
| PMT | passenger miles traveled |
| SD | standard deviation |
| SF | single family |
| TH | townhouse |
| TOE | transportation operational energy |
| VMT | vehicle miles traveled |
| # of Pred. Mo. | the number of months predicted |
Appendix A. Vehicle Type Investigation of the Chicago Downtown and Oak Park Households

| Vehicle Type | Downtown High-Rise | Suburban Low-Rise | ||||||||
|---|---|---|---|---|---|---|---|---|---|---|
| Aqua | Commonwealth | Legacy | 4 Towers (Avg.) | Oak Park | ||||||
| CT | % | CT | % | CT | % | CT | % | CT | % | |
| Sedan | 23 | 29.5% | 22 | 46.8% | 25 | 29.1% | 70 | 33.2% | 84 | 25.0% |
| SUV | 25 | 32.1% | 8 | 17.1% | 28 | 32.6% | 61 | 28.9% | 79 | 23.5% |
| Van/minivan | 2 | 2.6% | 0 | 0.0% | 5 | 5.8% | 7 | 3.3% | 43 | 12.8% |
| Hatchback | 7 | 1.3% | 4 | 8.5% | 3 | 3.5% | 8 | 3.8% | 22 | 6.5% |
| Wagon | 0 | 0.0% | 1 | 2.1% | 3 | 3.5% | 4 | 1.9% | 20 | 5.9% |
| Pickup truck | 0 | 0.0% | 0 | 0.0% | 0 | 0.0% | 0 | 0.0% | 17 | 5.0% |
| Crossover | 0 | 0.0% | 1 | 2.1% | 4 | 4.7% | 5 | 2.4% | 16 | 4.8% |
| Convertible | 8 | 10.3% | 3 | 6.4% | 3 | 3.5% | 14 | 6.6% | 15 | 4.5% |
| Hybrid | 4 | 5.1% | 7 | 14.9% | 5 | 5.8% | 16 | 7.6% | 13 | 3.9% |
| Coupe | 7 | 9.0% | 0 | 0.0% | 1 | 1.2% | 8 | 3.8% | 12 | 3.6% |
| Luxury | 4 | 5.1% | 0 | 0.0% | 8 | 9.3% | 12 | 5.7% | 5 | 1.5% |
| Electric | 1 | 1.3% | 1 | 2.1% | 1 | 1.2% | 3 | 1.4% | 2 | 0.6% |
| Motorcycle | 2 | 2.6% | 0 | 0.0% | 0 | 0.0% | 2 | 0.9% | 2 | 0.6% |
| Other | 1 | 1.3% | 0 | 0.0% | 0 | 0.0% | 1 | 0.5% | 6 | 1.8% |
| Total | 78 | 100% | 47 | 100% | 86 | 100% | 221 | 100% | 336 | 100% |
Appendix B. Estimated Annual Operational Energy Consumption of the Oak Park Low-Rise Residential Buildings (N = 64)
| H# | Bldg Type | GFA (m2) | HH Size | BOEe (MJ/m2/year) | # of Pred. Mo. (BOEe) | R2 (BOEe) | BOEg (MJ/m2/year) | # of Pred. Mo. (BOEe) | R2 (BOEg) | Total BOE (MJ/m2/year) | Total BOE (GJ/HH/year) | Total BOE (GJ/person/year) |
|---|---|---|---|---|---|---|---|---|---|---|---|---|
| 1 | SF | 164.4 | 3 | 239.8 | 2 | 0.259 | 929.1 | 2 | 0.985 | 1168.9 | 192.2 | 64.1 |
| 2 | SF | 111.5 | 3 | 874.4 | 1 | 0.528 | 1818.3 | 0 | N/A | 2692.7 | 300.2 | 100.1 |
| 3 | SF | 92.9 | 3 | 322.6 | 2 | 0.029 | 699.7 | 2 | 0.967 | 1022.2 | 95.0 | 31.7 |
| 4 | SF | 139.4 | 3 | 929.7 | 2 | 0.284 | 938 | 2 | 0.995 | 1867.7 | 260.3 | 86.8 |
| 5 | D | 457 | 1 | 88.8 | 1 | 0.05 | 1180.1 | 3 | 0.979 | 1268.9 | 579.9 | 579.9 |
| 6 | SF | 130.1 | 3 | 310 | 0 | N/A | 1319.6 | 1 | 0.931 | 1629.6 | 211.9 | 70.6 |
| 7 | SF | 148.6 | 4 | 1137 | 1 | 0.001 | 2186.4 | 5 | 0.944 | 3323.4 | 494.0 | 123.5 |
| 8 | SF | 111.5 | 1 | 461.1 | 0 | N/A | 445.8 | 2 | 0.489 | 906.9 | 101.1 | 101.1 |
| 9 | SF | 140.2 | 5 | 1368.6 | 0 | N/A | 733.2 | 1 | 0.972 | 2101.9 | 294.7 | 58.9 |
| 10 | SF | 418.1 | 5 | 487.1 | 2 | 0.108 | 1171.4 | 2 | 0.7 | 1658.5 | 693.3 | 138.7 |
| 11 | SF | 418.1 | 5 | 618.6 | 1 | 0.573 | 708.6 | 3 | 0.963 | 1327.2 | 554.8 | 111 |
| 12 | SF | 334.4 | 4 | 416.5 | 2 | 0.533 | 924.3 | 2 | 0.756 | 1340.8 | 448.4 | 112.1 |
| 13 | SF | 223 | 6 | 799.7 | 1 | 0.08 | 1255.5 | 1 | 0.729 | 2055.3 | 458.2 | 76.4 |
| 14 | SF | 223 | 4 | 532.5 | 1 | 0.117 | 1206.7 | 1 | 0.958 | 1739.2 | 387.8 | 96.9 |
| 15 | TH | 172.8 | 3 | 470.8 | 1 | 0.251 | 477.4 | 2 | 0.958 | 948.2 | 163.8 | 54.6 |
| 16 | TH | 195.1 | 5 | 1505.5 | 1 | 0.72 | 0 | 0 | N/A | 1505.5 | 293.7 | 58.7 |
| 17 | SF | 325.2 | 3 | 360.8 | 2 | 0.082 | 796.7 | 2 | 0.768 | 1157.5 | 376.4 | 125.5 |
| 18 | TH | 232.3 | 1 | 188 | 2 | 0.038 | 951.3 | 1 | 0.698 | 1139.3 | 264.6 | 264.6 |
| 19 | SF | 325.2 | 4 | 1760.2 | 1 | 0.319 | 2257.3 | 2 | 0.141 | 4017.5 | 1306.3 | 326.6 |
| 20 | SF | 234.9 | 3 | 506.1 | 1 | 0.057 | 1234.1 | 2 | 0.898 | 1740.2 | 408.7 | 136.2 |
| 21 | LR | 116.1 | 2 | 657.4 | 1 | 0.611 | 996.2 | 1 | 0.968 | 1653.6 | 192.0 | 96 |
| 22 | SF | 148.6 | 3 | 478.1 | 1 | 0.005 | 1309 | 1 | 0.98 | 1787.2 | 265.6 | 88.5 |
| 23 | SF | 557.4 | 5 | 624 | 1 | 0.231 | 918.1 | 2 | 0.712 | 1542.1 | 859.5 | 171.9 |
| 24 | SF | 260.1 | 5 | 1316.4 | 0 | N/A | 1272.9 | 1 | 0.969 | 2589.2 | 673.5 | 134.7 |
| 25 | SF | 176.5 | 3 | 958.6 | 1 | 0.191 | 1944.5 | 2 | 0.985 | 2903.2 | 512.4 | 170.8 |
| 26 | TH | 185.8 | 2 | 761.3 | 1 | 0.128 | 942.6 | 2 | 0.799 | 1703.8 | 316.6 | 158.3 |
| 27 | SF | 353 | 6 | 680.3 | 1 | 0.018 | 1320.2 | 1 | 0.75 | 2000.6 | 706.2 | 117.7 |
| 28 | SF | 130.1 | 4 | 875.4 | 1 | 0.03 | 1130.2 | 2 | 0.908 | 2005.7 | 260.9 | 65.2 |
| 29 | SF | 325.2 | 5 | 471.3 | 0 | N/A | 750 | 1 | 0.978 | 1221.3 | 397.1 | 79.4 |
| 30 | SF | 325.2 | 3 | 691.9 | 0 | N/A | 1839.1 | 1 | 0.994 | 2531 | 822.9 | 274.3 |
| 31 | SF | 269.4 | 4 | 297.7 | 1 | 0.116 | 897.7 | 1 | 0.977 | 1195.4 | 322.1 | 80.5 |
| 32 | TH | 223 | 3 | 307.4 | 1 | 0.415 | 546.7 | 1 | 0.962 | 854.1 | 190.4 | 63.5 |
| 33 | SF | 232.3 | 5 | 703.5 | 0 | N/A | 1010 | 2 | 0.965 | 1713.6 | 398.0 | 79.6 |
| 34 | SF | 278.7 | 4 | 614.8 | 1 | 0.004 | 1415.8 | 1 | 0.966 | 2030.6 | 565.9 | 141.5 |
| 35 | SF | 390.2 | 4 | 444 | 1 | 0.065 | 726.7 | 1 | 0.796 | 1170.6 | 456.8 | 114.2 |
| 36 | LR | 88.3 | 2 | 626 | 0 | N/A | 0 | 0 | N/A | 626 | 55.2 | 27.6 |
| 37 | SF | 260.1 | 4 | 654.7 | 1 | 0.226 | 917.2 | 1 | 0.74 | 1571.9 | 408.9 | 102.2 |
| 38 | SF | 157.9 | 2 | 636 | 0 | N/A | 849.8 | 0 | N/A | 1485.8 | 234.7 | 117.3 |
| 39 | SF | 167.2 | 2 | 1553.6 | 1 | 0.025 | 1517.4 | 1 | 0.98 | 3071 | 513.5 | 256.8 |
| 40 | SF | 195.1 | 5 | 667.8 | 1 | 0.132 | 1017 | 3 | 0.618 | 1684.8 | 328.7 | 65.7 |
| 41 | SF | 185.8 | 2 | 409.2 | 0 | N/A | 1274.4 | 1 | 0.989 | 1683.6 | 312.8 | 156.4 |
| 42 | SF | 250.8 | 6 | 1567 | 0 | N/A | 941 | 2 | 0.976 | 2507.9 | 629.1 | 104.8 |
| 43 | SF | 176.5 | 4 | 939.9 | 1 | 0.034 | 1232.6 | 1 | 0.968 | 2172.5 | 383.5 | 95.9 |
| 44 | SF | 278.7 | 5 | 908.9 | 0 | N/A | 1005.1 | 2 | 0.986 | 1914 | 533.4 | 106.7 |
| 45 | SF | 157.3 | 4 | 305.5 | 3 | 0.528 | 947.8 | 3 | 0.874 | 1253.3 | 197.1 | 49.3 |
| 46 | SF | 171.9 | 4 | 430.8 | 0 | N/A | 1061.8 | 0 | N/A | 1492.6 | 256.5 | 64.1 |
| 47 | SF | 167.2 | 6 | 973.3 | 1 | 0.123 | 825.3 | 1 | 0.93 | 1798.6 | 300.8 | 50.1 |
| 48 | SF | 241.5 | 4 | 659.7 | 0 | N/A | 1532.9 | 1 | 0.968 | 2192.6 | 529.6 | 132.4 |
| 49 | SF | 371.6 | 2 | 407.3 | 0 | N/A | 1104.6 | 1 | 0.948 | 1511.9 | 561.8 | 280.9 |
| 50 | SF | 275.6 | 2 | 76.9 | 0 | N/A | 809.8 | 1 | 0.688 | 886.7 | 244.4 | 122.2 |
| 51 | SF | 82.7 | 3 | 653.9 | 1 | 0.211 | 1810.5 | 1 | 0.81 | 2464.4 | 203.8 | 67.9 |
| 52 | SF | 260.1 | 4 | 418 | 0 | N/A | 1105.6 | 0 | N/A | 1523.6 | 396.3 | 99.1 |
| 53 | SF | 334.4 | 4 | 381.1 | 1 | 0.011 | 1320.7 | 0 | N/A | 1701.8 | 569.1 | 142.3 |
| 54 | SF | 255.5 | 4 | 352.7 | 0 | N/A | 828 | 1 | 0.926 | 1180.7 | 301.7 | 75.4 |
| 55 | TH | 102.2 | 4 | 500.7 | 4 | 0.842 | 891.1 | 4 | 0.359 | 1391.7 | 142.2 | 35.6 |
| 56 | SF | 152.4 | 2 | 578.3 | 1 | 0.162 | 1377.1 | 3 | 0.991 | 1955.4 | 297.9 | 149 |
| 57 | SF | 511 | 4 | 535.4 | 4 | 0.346 | 1028.5 | 4 | 0.824 | 1564 | 799.1 | 199.8 |
| 58 | SF | 241.5 | 5 | 721.4 | 1 | 0.277 | 1076.2 | 2 | 0.842 | 1797.5 | 434.2 | 86.8 |
| 59 | SF | 195.1 | 4 | 815.2 | 0 | N/A | 892 | 0 | N/A | 1707.2 | 333.1 | 83.3 |
| 60 | SF | 311.8 | 4 | 354.1 | 3 | 0.166 | 938.4 | 4 | 0.728 | 1292.4 | 402.9 | 100.7 |
| 61 | SF | 195.1 | 3 | 402.7 | 1 | 0.003 | 986.5 | 0 | N/A | 1389.3 | 271.0 | 90.3 |
| 62 | SF | 148.6 | 2 | 591.3 | 0 | N/A | 1354.8 | 0 | N/A | 1946.1 | 289.3 | 144.6 |
| 63 | SF | 92.9 | 2 | 1406.9 | 0 | N/A | 1213.1 | 1 | 0.697 | 2620 | 243.4 | 121.7 |
| 64 | SF | 125.8 | 4 | 513.1 | 2 | 0.289 | 813.5 | 1 | 0.917 | 1326.6 | 166.9 | 41.7 |
Appendix C. Estimated Annual Operational Energy Consumption Paid by the bUilding Management for the Chicago Downtown Residential Towers
| Measure | Commonwealth | Legacy |
|---|---|---|
| GFA(m2) | 54396 | 70153 |
| Site BOEe (MJ/m2/year) | 149.9 | 585.5 |
| Source BOEe (MJ/m2/year) | 474.6 | 1854.2 |
| # of Pred. Mo. (BOEe) | 1 | 0 |
| R2 (BOEe) | 0.440 | N/A |
| Site BOEg (MJ/m2/year) | 1009.8 | 114.6 |
| Source BOEg (MJ/m2/year) | 1094.6 | 124.2 |
| # of Pred. Mo. (BOEg) | 1 | 1 |
| R2 (BOEg) | 0.986 | 0.950 |
| Site BOEc (MJ/m2/year) | 0 | 243.1 |
| Source BOEc (MJ/m2/year) | 0 | 126.2 |
| # of Pred. Mo. (BOEc) | 0 | 0 |
| R2 (BOEc) | N/A | N/A |
| Total Site BOEb (MJ/m2/year) | 1159.7 | 943.2 |
| Total Source BOEb (MJ/m2/year) | 1569.2 | 2104.6 |
Appendix D. Estimated Annual Total Operational Energy Consumption in the Chicago Downtown Residential Towers (N = 42)
| H # | GFA (m2) | HH Size | Site BOEi (MJ/m2/year) | Source BOEi (MJ/m2/year) | # of Pred. Mo. (BOEi) | R2 (BOEi) | Total Site BOE (MJ/m2/year) | Total Source BOE (MJ/m2/year) | Total Site BOE (GJ/HH/year) | Total Source BOE (GJ/HH/year) | Total Site BOE (GJ/person/year) | Total Source BOE (GJ/person/year) |
|---|---|---|---|---|---|---|---|---|---|---|---|---|
| C1 | 111.48 | 1 | 148.1 | 469.2 | 1 | 0.280 | 1307.8 | 2038.4 | 145.8 | 227.2 | 145.8 | 227.2 |
| C2 | 157.93 | 4 | 87.6 | 277.5 | 1 | 0.630 | 1247.3 | 1846.7 | 197.0 | 291.7 | 49.2 | 72.9 |
| C3 | 102.19 | 2 | 280.5 | 888.3 | 0 | N/A | 1440.2 | 2457.6 | 147.2 | 251.1 | 73.6 | 125.6 |
| C4 | 134.705 | 2 | 106.9 | 338.4 | 1 | 0.328 | 1266.5 | 1907.6 | 170.6 | 257.0 | 85.3 | 128.5 |
| C5 | 104.6983 | 2 | 163.0 | 516.2 | 0 | N/A | 1322.6 | 2085.4 | 138.5 | 218.3 | 69.2 | 109.2 |
| C6 | 111.48 | 1 | 80.1 | 253.7 | 4 | 0.476 | 1239.8 | 1822.9 | 138.2 | 203.2 | 138.2 | 203.2 |
| C7 | 69.675 | 1 | 122.2 | 387.1 | 1 | 0.189 | 1281.9 | 1956.3 | 89.3 | 136.3 | 89.3 | 136.3 |
| C8 | 78.965 | 1 | 89.7 | 284.0 | 1 | 0.060 | 1249.3 | 1853.2 | 98.7 | 146.3 | 98.7 | 146.3 |
| C9 | 107.4853 | 2 | 81.9 | 259.4 | 4 | 0.342 | 1241.6 | 1828.6 | 133.5 | 196.6 | 66.7 | 98.3 |
| C10 | 106.835 | 1 | 98.1 | 310.8 | 2 | 0.189 | 1257.8 | 1880.0 | 134.4 | 200.8 | 134.4 | 200.8 |
| C11 | 92.9 | 3 | 59.1 | 187.3 | 4 | 0.404 | 1218.8 | 1756.5 | 113.2 | 163.2 | 37.7 | 54.4 |
| C12 | 102.19 | 2 | 145.4 | 460.4 | 2 | 0.393 | 1305.0 | 2029.6 | 133.4 | 207.4 | 66.7 | 103.7 |
| C13 | 260.12 | 4 | 210.5 | 666.5 | 0 | N/A | 1370.1 | 2235.8 | 356.4 | 581.6 | 89.1 | 145.4 |
| C14 | 167.22 | 1 | 107.2 | 339.6 | 2 | 0.378 | 1266.9 | 1908.9 | 211.9 | 319.2 | 211.9 | 319.2 |
| C15 | 65.03 | 1 | 140.4 | 444.6 | 2 | 0.009 | 1300.0 | 2013.8 | 84.5 | 131.0 | 84.5 | 131.0 |
| C16 | 111.48 | 1 | 117.6 | 372.4 | 3 | 0.013 | 1277.2 | 1941.6 | 142.4 | 216.5 | 142.4 | 216.5 |
| C17 | 111.48 | 5 | 127.6 | 404.0 | 1 | 0.096 | 1287.2 | 1973.2 | 143.5 | 220.0 | 28.7 | 44.0 |
| C18 | 46.45 | 2 | 274.6 | 869.6 | 3 | 0.027 | 1434.3 | 2438.9 | 66.6 | 113.3 | 33.3 | 56.6 |
| C19 | 260.12 | 2 | 78.7 | 249.2 | 3 | 0.164 | 1238.3 | 1818.4 | 322.1 | 473.0 | 161.1 | 236.5 |
| C20 | 116.125 | 1 | 86.1 | 272.8 | 0 | N/A | 1245.8 | 1842.0 | 144.7 | 213.9 | 144.7 | 213.9 |
| L21 | 185.8 | 2 | 157.1 | 497.5 | 0 | N/A | 1100.3 | 2602.2 | 204.4 | 483.5 | 102.2 | 241.7 |
| L22 | 90.6 | 2 | 226.9 | 718.7 | 4 | 0.936 | 1170.1 | 2823.3 | 106.0 | 255.7 | 53.0 | 127.9 |
| L23 | 185.4 | 2 | 499.0 | 1580.4 | 0 | N/A | 1442.2 | 3685.0 | 267.4 | 683.3 | 133.7 | 341.7 |
| L24 | 139.4 | 2 | 224.5 | 711.1 | 0 | N/A | 1167.7 | 2815.8 | 162.7 | 392.4 | 81.4 | 196.2 |
| L25 | 102.2 | 2 | 382.5 | 1211.3 | 0 | N/A | 1325.7 | 3315.9 | 135.5 | 338.9 | 67.7 | 169.4 |
| L26 | 226.3 | 2 | 340.3 | 1077.8 | 0 | N/A | 1283.5 | 3182.5 | 290.5 | 720.2 | 145.2 | 360.1 |
| L27 | 745.2 | 2 | 114.5 | 362.7 | 0 | N/A | 1057.7 | 2467.3 | 788.2 | 1838.7 | 394.1 | 919.4 |
| L28 | 185.8 | 3 | 419.7 | 1329.3 | 5 | 0.870 | 1362.9 | 3433.9 | 253.2 | 638.0 | 84.4 | 212.7 |
| L29 | 167.2 | 1 | 147.2 | 466.3 | 1 | 0.723 | 1090.4 | 2571.0 | 182.3 | 429.9 | 182.3 | 429.9 |
| L30 | 139.4 | 2 | 107.5 | 340.4 | 1 | 0.555 | 1050.7 | 2445.0 | 146.4 | 340.7 | 73.2 | 170.4 |
| L31 | 185.8 | 1 | 143.5 | 454.4 | 2 | 0.607 | 1086.7 | 2559.1 | 201.9 | 475.5 | 201.9 | 475.5 |
| L32 | 131.9 | 2 | 634.1 | 2008.1 | 1 | 0.843 | 1577.3 | 4112.8 | 208.1 | 542.5 | 104.0 | 271.3 |
| L33 | 274.1 | 2 | 198.7 | 629.2 | 1 | 0.377 | 1141.8 | 2733.8 | 312.9 | 749.2 | 156.5 | 374.6 |
| L34 | 185.8 | 2 | 186.2 | 589.6 | 0 | N/A | 1129.4 | 2694.3 | 209.8 | 500.6 | 104.9 | 250.3 |
| L35 | 139.4 | 2 | 274.5 | 869.3 | 0 | N/A | 1217.7 | 2973.9 | 169.7 | 414.4 | 84.8 | 207.2 |
| L36 | 92.9 | 2 | 228.2 | 722.7 | 2 | 0.640 | 1171.4 | 2827.3 | 108.8 | 262.7 | 54.4 | 131.3 |
| L37 | 115.4 | 1 | 270.9 | 858.0 | 5 | 0.838 | 1214.1 | 2962.6 | 140.1 | 341.8 | 140.1 | 341.8 |
| L38 | 139.4 | 2 | 290.0 | 918.3 | 1 | 0.737 | 1233.1 | 3022.9 | 171.8 | 421.2 | 85.9 | 210.6 |
| L39 | 139.4 | 2 | 428.3 | 1356.4 | 2 | 0.758 | 1371.5 | 3461.1 | 191.1 | 482.3 | 95.6 | 241.1 |
| L40 | 110.2 | 2 | 286.3 | 906.6 | 0 | N/A | 1229.4 | 3011.2 | 135.5 | 331.8 | 67.7 | 165.9 |
| L41 | 139.4 | 1 | 342.6 | 1085.1 | 2 | 0.879 | 1285.8 | 3189.8 | 179.2 | 444.5 | 179.2 | 444.5 |
| L42 | 139.4 | 2 | 376.3 | 1191.8 | 2 | 0.907 | 1319.5 | 3296.4 | 183.9 | 459.4 | 91.9 | 229.7 |
References and Notes
- United Nations. World Population Prospects: The 2006 Revision; ST/ESA/SER.A/261/ES; United Nations: New York, NY, USA, 2007. [Google Scholar]
- Newman, P.W.G.; Kenworthy, J.R. Gasoline consumption and cities. J. Am. Plan. Assoc. 1989, 55, 24–37. [Google Scholar] [CrossRef]
- Norman, J.; MacLean, H.L.; Kennedy, C.A. Comparing high and low residential density: Life-cycle analysis of energy use and greenhouse gas emissions. J. Urban Plan. Dev. 2006, 132, 10–21. [Google Scholar] [CrossRef]
- Ewing, R.; Rong, F. The impact of urban form on U.S. residential energy use. House Policy Debate 2008, 19, 1–30. [Google Scholar] [CrossRef]
- Nichols, B.G.; Kockelman, K. Urban form and life-cycle energy consumption: Case studies at the city scale. J. Transp. Land Use 2015, 8, 115–129. [Google Scholar] [CrossRef]
- Erickson, P.; Tempest, K. Keeping Cities Green: Avoiding Carbon Lock-in Due to Urban Development; Stockholm Environment Institute: Seattle, WA, USA, 2015. [Google Scholar]
- Perkins, A.; Hamnett, S.; Pullen, S.; Zito, R.; Trebilcock, D. Transport, housing and urban form: The life cycle energy consumption and emissions of city centre apartments compared with suburban dwellings. Urban Policy Res. 2009, 27, 377–396. [Google Scholar] [CrossRef]
- Bastos, J.; Batterman, S.A.; Freire, F. Significance of mobility in the life-cycle assessment of buildings. Build. Res. Inf. 2016, 44, 376–393. [Google Scholar] [CrossRef]
- Gudipudi, R.; Fluschnik, T.; Ros, A.G.C.; Walther, C.; Kropp, J.P. City density and CO2 efficiency. Energy Policy 2016, 91, 352–361. [Google Scholar] [CrossRef]
- Stephan, A.; Crawford, R.H.; de Myttenaere, K. A comprehensive assessment of the life cycle energy demand of passive houses. Appl. Energy 2013, 112, 23–34. [Google Scholar] [CrossRef]
- Fuller, R.J.; Crawford, R.H. Impact of past and future residential housing development patterns on energy demand and related emissions. J. House Built Environ. 2011, 26, 65–183. [Google Scholar] [CrossRef]
- Du, P.; Wood, A.; Stephens, B.; Song, X. Life-cycle energy implications of downtown high-rise vs. suburban low-rise living: An overview and quantitative case study for Chicago. Buildings 2015, 5, 1003–1024. [Google Scholar] [CrossRef]
- Heinonen, J.; Junnila, S. A carbon consumption comparison of rural and urban lifestyles. Sustainability 2011, 3, 1234–1249. [Google Scholar] [CrossRef]
- Heinonen, J.; Junnila, S. Implications of urban structure on carbon consumption in metropolitan areas. Environ. Res. Lett. 2011, 6, 014018. [Google Scholar] [CrossRef]
- Heinonen, J.; Kyrö, R.; Junnila, S. Dense downtown living more carbon intense due to higher consumption: a case study of Helsinki. Environ. Res. Lett. 2011, 6, 034034. [Google Scholar] [CrossRef]
- Heinonen, J.; Jalas, M.; Juntunen, J.K.; Ala-Mantila, S.; Junnila, S. Situated lifestyles: II. The impacts of urban density, housing type and motorization on the greenhouse gas emissions of the middle-income consumers in Finland. Environ. Res. Lett. 2013, 8, 35050. [Google Scholar] [CrossRef]
- Wilson, J.; Spinney, J.; Millward, H.; Scott, D.; Hayden, A.; Tyedmers, P. Blame the exurbs, not the suburbs: Exploring the distribution of greenhouse gas emissions within a city region. Energy Policy 2013, 62, 1329–1335. [Google Scholar] [CrossRef]
- Optis, M.; Wild, P. Inadequate documentation in published life cycle energy reports on buildings. Int. J. Life Cycle Assess. 2010, 15, 644–651. [Google Scholar] [CrossRef]
- CTBUH. The Skyscraper Center. Available online: http://www.skyscrapercenter.com/ (accessed on 28 March 2016).
- US Census Bureau. Census.gov. Available online: http://www.census.gov/ (accessed on 28 March 2016).
- The chilled water in the Aqua Tower and Legacy Building is provided by the city’s district chilled water system, Thermal Chicago, which serves over 100 buildings within the city. It is one of the most advanced, reliable, and efficient cooling systems in the world. The system includes five chilled water generation plants serving the Loop, West Loop, South Loop and River North areas [22,23]. Commonwealth Plaza has its own chillers, so does not have chilled water bills from Thermal Chicago.
- Thermal Chicago Corporation. Available online: http://www.esdglobal.com/news/article/673-thermal-chicago-corporation (accessed on 27 September 2015).
- Climate Control Middle East. Chilled out in Chicago. 31 October 2011. Available online: http://climatecontrolme.com/2011/10/chilled-out-in-chicago/ (accessed on 28 March 2016).
- U.S. Energy Information Administration. Annual Energy Outlook 2014; DOE/EIA-0383(2014); U.S. Energy Information Administration: Washington, DC, USA, 2014. [Google Scholar]
- Deru, M.; Torcellini, P. Source Energy and Emission Factors for Energy Use in Buildings; NREL/TP-550–38617; National Renewable Energy Laboratory: Golden, CO, USA, 2007. [Google Scholar]
- American Society of Heating, Refrigerating and Air-Conditioning Engineers. 2013 ASHRAE Handbook: Fundamentals; American Society of Heating, Refrigeration and Air-Conditioning Engineers: Atlanta, GA, USA, 2013. [Google Scholar]
- U.S. Department of Energy. 90.1 Prototype Building Models High-rise Apartment. Available online: https://www.energycodes.gov/901-prototype-building-models-high-rise-apartment (accessed on 5 July 2015).
- Stanford, H.W., III. HVAC Water Chillers and Cooling Towers: Fundamentals, Application, and Operation; CRC Press: Boca Raton, FL, USA, 2003. [Google Scholar]
- American Society of Heating, Refrigerating and Air-Conditioning Engineers. ANSI/ASHRAE/IES Standard 90.1-2007—Energy Standard for Buildings Except Low-Rise Residential Buildings; American Society of Heating, Refrigeration and Air-Conditioning Engineers: Atlanta, GA, USA, 2007. [Google Scholar]
- Fuel Economy. FuelEconomy.gov. Available online: http://www.fueleconomy.gov/ (accessed on 15 August 2015).
- tLCAdb. Transportation LCA|Passenger Database. Available online: http://transportationlca.org/tlcadb-passenger.php (accessed on 9 August 2015).
- Chester, M.V. Life-cycle Environmental Inventory of Passenger Transportation in the United States. Ph.D. Thesis, University of California, Berkeley, CA, USA, 2008. [Google Scholar]
- Chester, M.V.; Horvath, A.; Madanat, S. Comparison of life-cycle energy and emissions footprints of passenger transportation in metropolitan regions. Atmos. Environ. 2010, 44, 1071–1079. [Google Scholar] [CrossRef]
- Combined MPG for each specific automobile vehicle reported in the survey is used, which can be found from FuelEconomy.gov [30].
- Vesilind, P.A.; Morgan, S.M.; Heine, L.G. Introduction to Environmental Engineering; Cengage Learning: Belmont, CA, USA, 2009. [Google Scholar]
- Bunkley, N. Toyota Ends 2013 down while Lexus Rises, 3 January 2014. Automotive News. Available online: http://www.autonews.com/article/20140103/RETAIL01/140109960/toyota-ends-2013-down-while-lexus-rises (accessed on 17 August 2015).
- Cain, T. Top 10 Best-Selling SUVs in America—2005 Year End, 30 April 2014. Good Car Bad Car. Available online: http://www.goodcarbadcar.net/2014/04/usa-10-best-selling-suv-crossover-2005-year-end.html (accessed on 17 August 2015).
- The Combined MPG of the 2008, 2006, and 2010 Toyota Camry is 25, 25, and 26, respectively, and the Combined MPG of the 2005 Chevrolet TrailBlazer is 16. Source: FuelEconomy.gov [30].
- In order to quantify the energy use on a per passenger basis, the average occupancy of a CTA bus, CTA train, and Metra train in Chicago was assumed to be 12, 92, and 245, respectively, by the tLCAdb researchers [32] (p. 293).
- CMAP. Community Data Snapshots. Available online: http://www.cmap.illinois.gov/data/metropulse/community-snapshots (accessed on 5 May 2016).
- The individual homes across all the four downtown residential towers only received electric bills.
- The Legacy is fully clad with a thermally efficient unitized curtain wall featuring “low-E” and Argon-filled insulating glass units. Also, connection to the city’s district chilled water system is estimated to eliminate the need for three 600-ton water chillers and associated cooling towers on the building roof [43].
- Noone, P.; Klompmaker, G.; Sumanik, C. The high life: residential towers in central business districts. CTBUH J. 2011, 36–41. [Google Scholar]
- Walking, bicycle and “Other” mode of transport are excluded in the OE analysis.
- Crawford, R. An as-occupied life cycle energy assessment of a residential building. In Proceedings of the 46th Annual Conference of the Architectural Science Association, Gold Coast, Australia, 14–16 November 2012.
- Anderson, J.E.; Wulfhorst, G.; Lang, W. Expanding the use of life-cycle assessment to capture induced impacts in the built environment. Build. Environ. 2015, 94, 403–416. [Google Scholar] [CrossRef]


| OE Components | Automobile | Bus | CTA Train/Metra |
|---|---|---|---|
| Vehicle | Overall operation | Propulsion Idling | Propulsion Idling |
| Infrastructure | Roadway Lighting | Roadway Lighting | Station Lighting; Station Parking Lighting; Station Escalators operation; Station Train Control |
| Response Summary | Aqua | Commonwealth | Legacy | Downtown High-Rise | Suburban Low-Rise |
|---|---|---|---|---|---|
| Towers | Oak Park | ||||
| No. of completed responses 1 | 40 | 31 | 41 | 112 | 123 |
| No. of partially completed responses | 29 | 32 | 76 | 137 | 150 |
| No. of responses | 69 | 63 | 117 | 249 | 273 |
| No. of households contacted directly | 264 2 | 375 | 357 | 996 | 565 3 |
| Response rate | 26.1% | 16.8% | 32.8% | 25% | 48.3% |
| Characteristics | Downtown High-Rise | Total Towers | Suburban Low-Rise | ||
|---|---|---|---|---|---|
| Aqua Tower | Legacy | Commonwealth Plaza | Oak Park | ||
| Household 1 | |||||
| Avg. Resident Age (y) | 48.5 | 54.6 | 47.8 | 51.1 | 31.8 |
| Avg. HH Size | 1.8 | 1.9 | 2.0 | 1.9 | 3.3 |
| Avg. GFA/HH (m2) | 132.0 | 181.1 | 128.2 | 147.1 | 226.4 |
| Avg. GFA/person (m2) | 73.3 | 95.3 | 64.1 | 77.4 | 68.6 |
| Car Ownership/HH | 1.4 | 1.2 | 1 | 1.2 | 1.8 |
| Car Ownership/person | 0.8 | 0.6 | 0.5 | 0.6 | 0.5 |
| Building 2 | |||||
| Completion Year | 2010 | 2009 | 1956 | N/A | 71.9% built before 1950 |
| 24.7% built 1950–1999 | |||||
| 3.4% built after 2000 | |||||
| Height | 250 m | 262 m | 77 m | N/A | Typically 10 m or lower |
| # of Floors | 86 | 73 | 27 | Typically 1–3 | |
| # of Units | 738 | 357 | 375 | N/A | Typically 1 per abode |
| Structural Material | Concrete | Concrete | Steel/Concrete | N/A | Wood Frame or Stone or Brick |
| # of Available Parking Spaces | 1271 | 449 | 293 | N/A | N/A |
| # of Available Parking Spaces/Unit | 1.7 | 1.3 | 0.8 | 1.4 | N/A |
| Neighborhood 3 | Loop | Lakeview | N/A | Oak Park | |
| Neighborhood Population | 22,655 | 64,631 | N/A | 51,781 | |
| Neighborhood Density | 7200/km2 | 12,000/km2 | N/A | 4262/km2 | |
| Distance to Chicago Loop | Walkable | 6 km (average) | N/A | 11–16 km (average) | |
| Public Transport System in Reasonable Walking Distance | All CTA Lines, All Metra Lines & Multiple Bus Lines | CTA Red, Purple and Brown Lines, Metra UP-N Line & Multiple Bus Lines | N/A | Green & Blue CTA lines, Metra UP-West Line & Pace Buses | |
| Summary Statistic | BOEe MJ/m2/y | BOEg MJ/m2/y | Total BOE MJ/m2/y | Total BOE GJ/HH/y | Total BOE GJ/person/y |
|---|---|---|---|---|---|
| Minimum | 76.9 | 0.0 | 626.0 | 55.2 | 27.6 |
| Maximum | 1760.2 | 2257.3 | 4017.5 | 1306.3 | 579.9 |
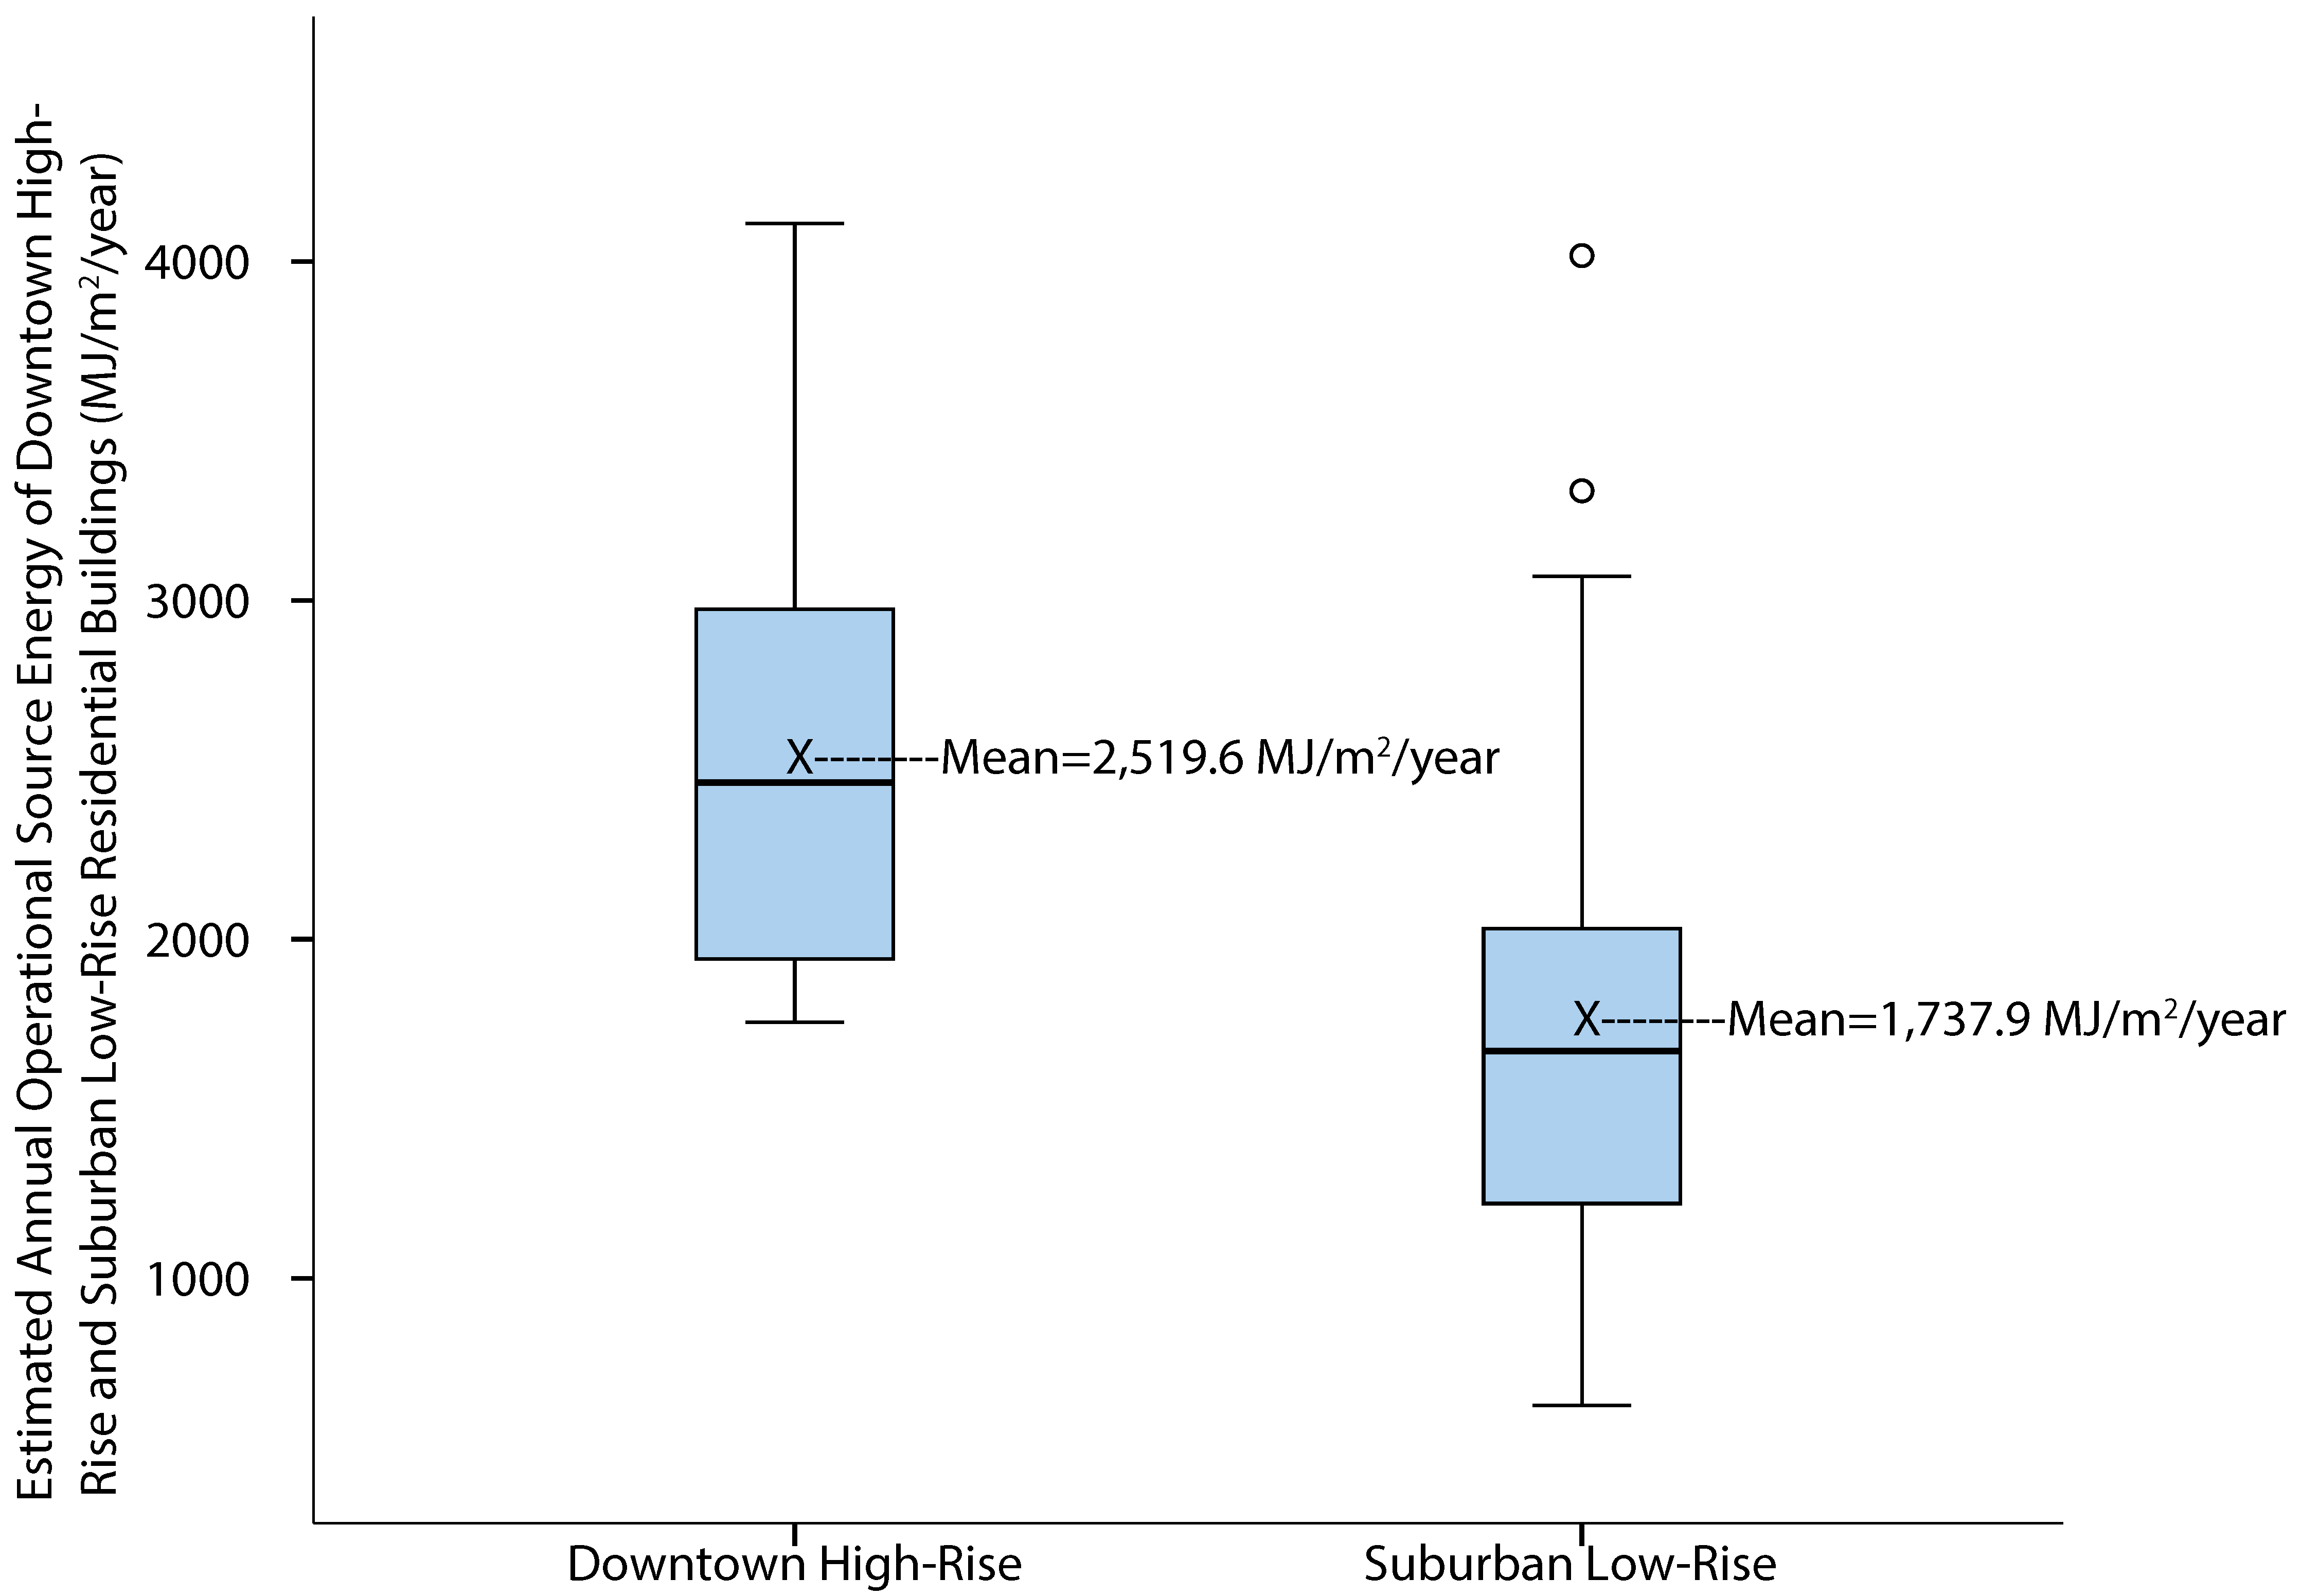
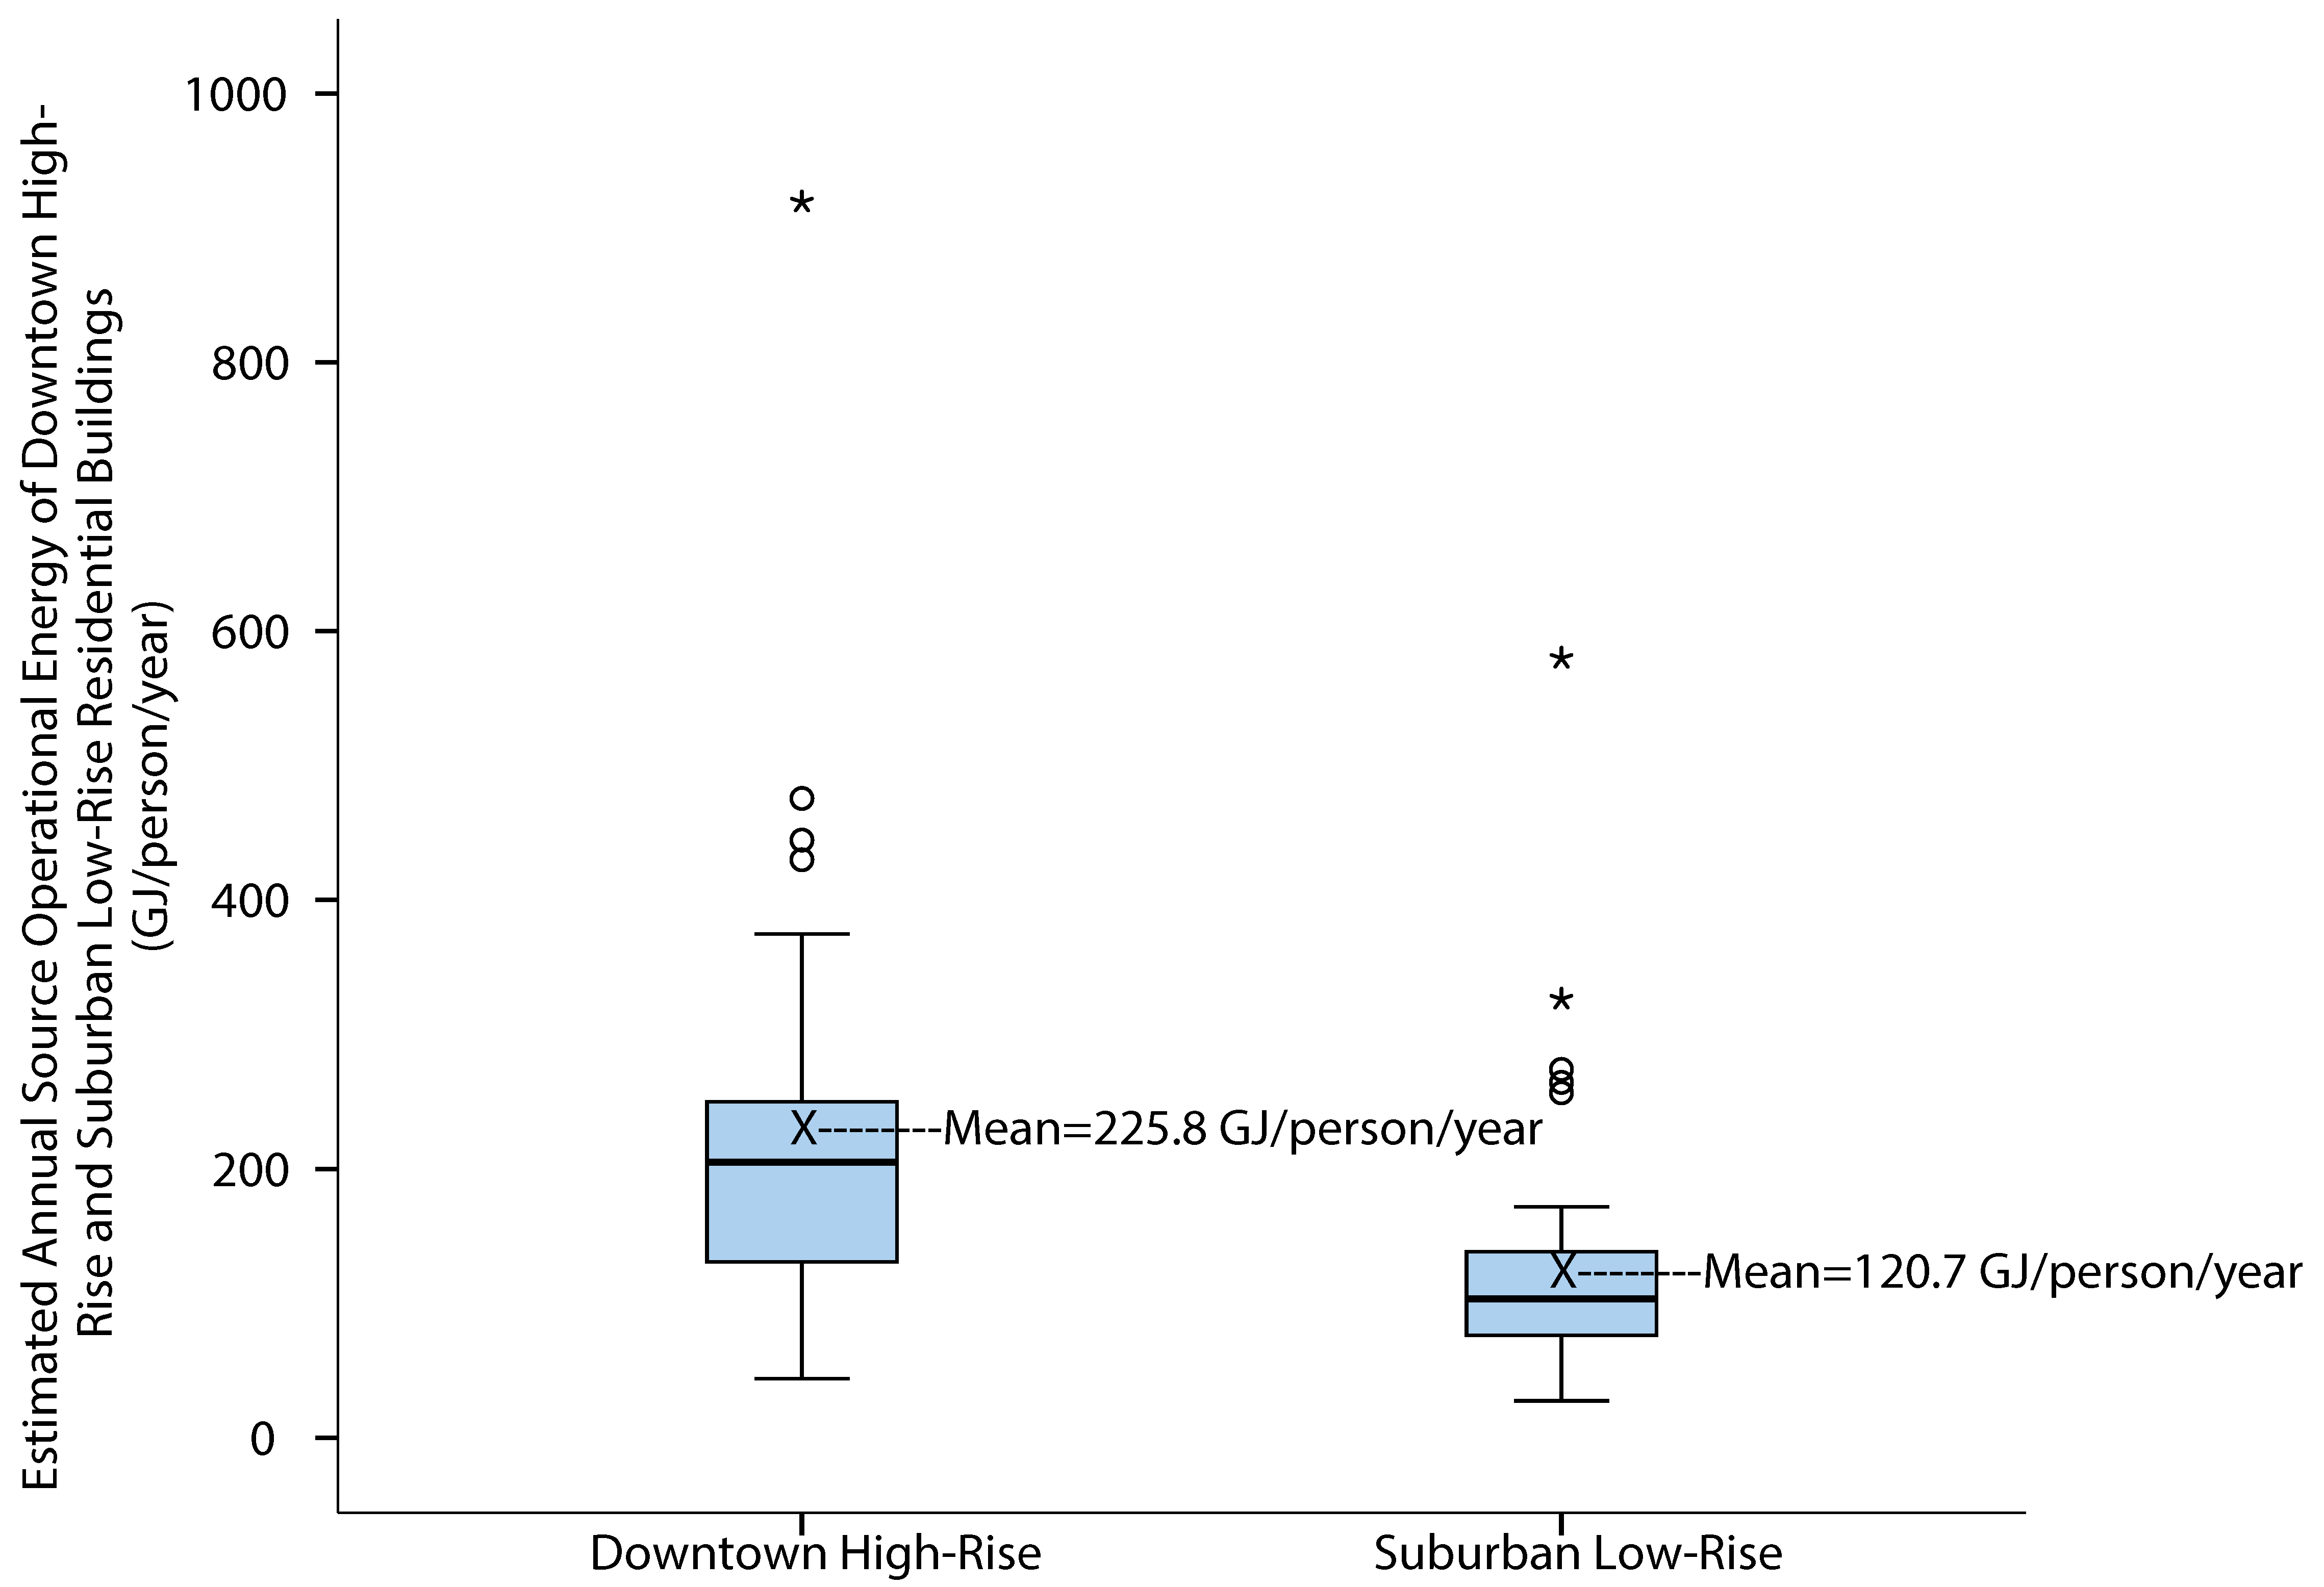
| Mean | 661.0 | 1077.0 | 1737.9 | 393.2 | 120.7 |
| Std Dev | 368.6 | 415.8 | 624.8 | 214.9 | 84.7 |
| Summary Statistic | Site BOE MJ/m2/y | Source BOE MJ/m2/y | Site BOE GJ/HH/y | Source BOE GJ/HH/y | Site BOE GJ/person/y | Source BOE GJ/person/y |
|---|---|---|---|---|---|---|
| Commonwealth Plaza (N = 20) | ||||||
| Minimum | 1218.8 | 1756.5 | 66.6 | 113.3 | 28.7 | 44.0 |
| Maximum | 1440.2 | 2457.6 | 356.4 | 581.6 | 211.9 | 319.2 |
| Mean | 1289.9 | 1981.8 | 155.6 | 238.4 | 97.5 | 148.5 |
| Std Dev | 61.5 | 194.8 | 71.9 | 112.8 | 48.8 | 72.2 |
| Legacy Building (N = 22) | ||||||
| Minimum | 1050.7 | 2445.0 | 106.0 | 255.7 | 53.0 | 127.9 |
| Maximum | 1577.3 | 4112.8 | 788.2 | 1,838.7 | 394.1 | 919.4 |
| Mean | 1228.6 | 3008.5 | 215.9 | 524.9 | 122.0 | 296.1 |
| Std Dev | 133.5 | 422.8 | 138.9 | 323.7 | 74.2 | 172.5 |
| Downtown Tower Average (N = 42) | ||||||
| Minimum | 1050.7 | 1756.5 | 66.6 | 113.3 | 28.7 | 44.0 |
| Maximum | 1577.3 | 4112.8 | 788.2 | 1838.7 | 394.1 | 919.4 |
| Mean | 1257.8 | 2519.6 | 187.2 | 388.4 | 110.3 | 225.8 |
| Std Dev | 108.8 | 615.2 | 114.9 | 283.8 | 63.8 | 152.4 |
| Test Statistics | Source BOE MJ/m2/y | Source BOE GJ/HH/y | Source BOE GJ/person/y |
|---|---|---|---|
| Mann–Whitney U | 432 | 1252 | 576 |
| Wilcoxon W | 2512 | 2155 | 2656 |
| Z | −5.891 | −0.594 | −4.961 |
| Asymp. Sig. (2-tailed) | 0.000 | 0.552 | 0.000 |
| Mode of Transport | Downtown High-Rise | Suburban Low-Rise | ||||
|---|---|---|---|---|---|---|
| km/HH/y | km/person/y | Percent of Total | km/HH/y | km/person/y | Percent of Total | |
| Walking | 2293 | 1206 | 15.5% | 1914 | 579 | 5.3% |
| Bicycle | 416 | 219 | 2.8% | 253 | 77 | 0.7% |
| Automobile | 9595 | 2050 | 64.7% | 20,645 | 6256 | 57.1% |
| Bus | 1010 | 531 | 6.8% | 486 | 147 | 1.3% |
| CTA train | 1059 | 557 | 7.1% | 2786 | 843 | 7.7% |
| Metra train | 307 | 162 | 2.1% | 10,070 | 3051 | 27.8% |
| Other | 149 | 78 | 1.0% | 43 | 13 | 0.1% |
| Total | 14,829 | 7803 | 100% | 36,197 | 10,966 | 100% |
| Mode of Transport | Downtown High-Rise | Suburban Low-Rise | ||||
|---|---|---|---|---|---|---|
| GJ/HH/y | GJ/person/y | Percent | GJ/HH/y | GJ/person/y | Percent | |
| Auto | 34.9 | 18.4 | 92.3% | 94.3 | 28.6 | 91.1% |
| Bus | 2.0 | 1.0 | 5.4% | 1.0 | 0.3 | 0.9% |
| CTA Train (local) | 0.7 | 0.4 | 1.8% | 1.8 | 0.6 | 1.8% |
| Metra Train (regional) | 0.2 | 0.1 | 0.5% | 6.4 | 2.0 | 6.2% |
| Total | 37.9 | 19.9 | 100.0% | 103.5 | 31.4 | 100.0% |
| Mode of Transport | Downtown High-Rise | Suburban Low-Rise | ||||
|---|---|---|---|---|---|---|
| GJ/HH/y | GJ/person/y | Percent | GJ/HH/y | GJ/person/y | Percent | |
| Auto | 0.24 | 0.13 | 72.7% | 0.52 | 0.16 | 24.0% |
| Bus | 0.00 | 0.00 | 0.0% | 0.00 | 0.00 | 0.0% |
| CTA Train | 0.04 | 0.02 | 12.1% | 0.10 | 0.03 | 4.6% |
| Metra Train | 0.05 | 0.02 | 15.2% | 1.55 | 0.47 | 71.4% |
| Total | 0.33 | 0.17 | 100% | 2.17 | 0.66 | 100% |
| OE Categories | Downtown High-Rise | Suburban Low-Rise | ||||
|---|---|---|---|---|---|---|
| GJ/HH/y | GJ/person/y | Percent | GJ/HH/y | GJ/person/y | Percent | |
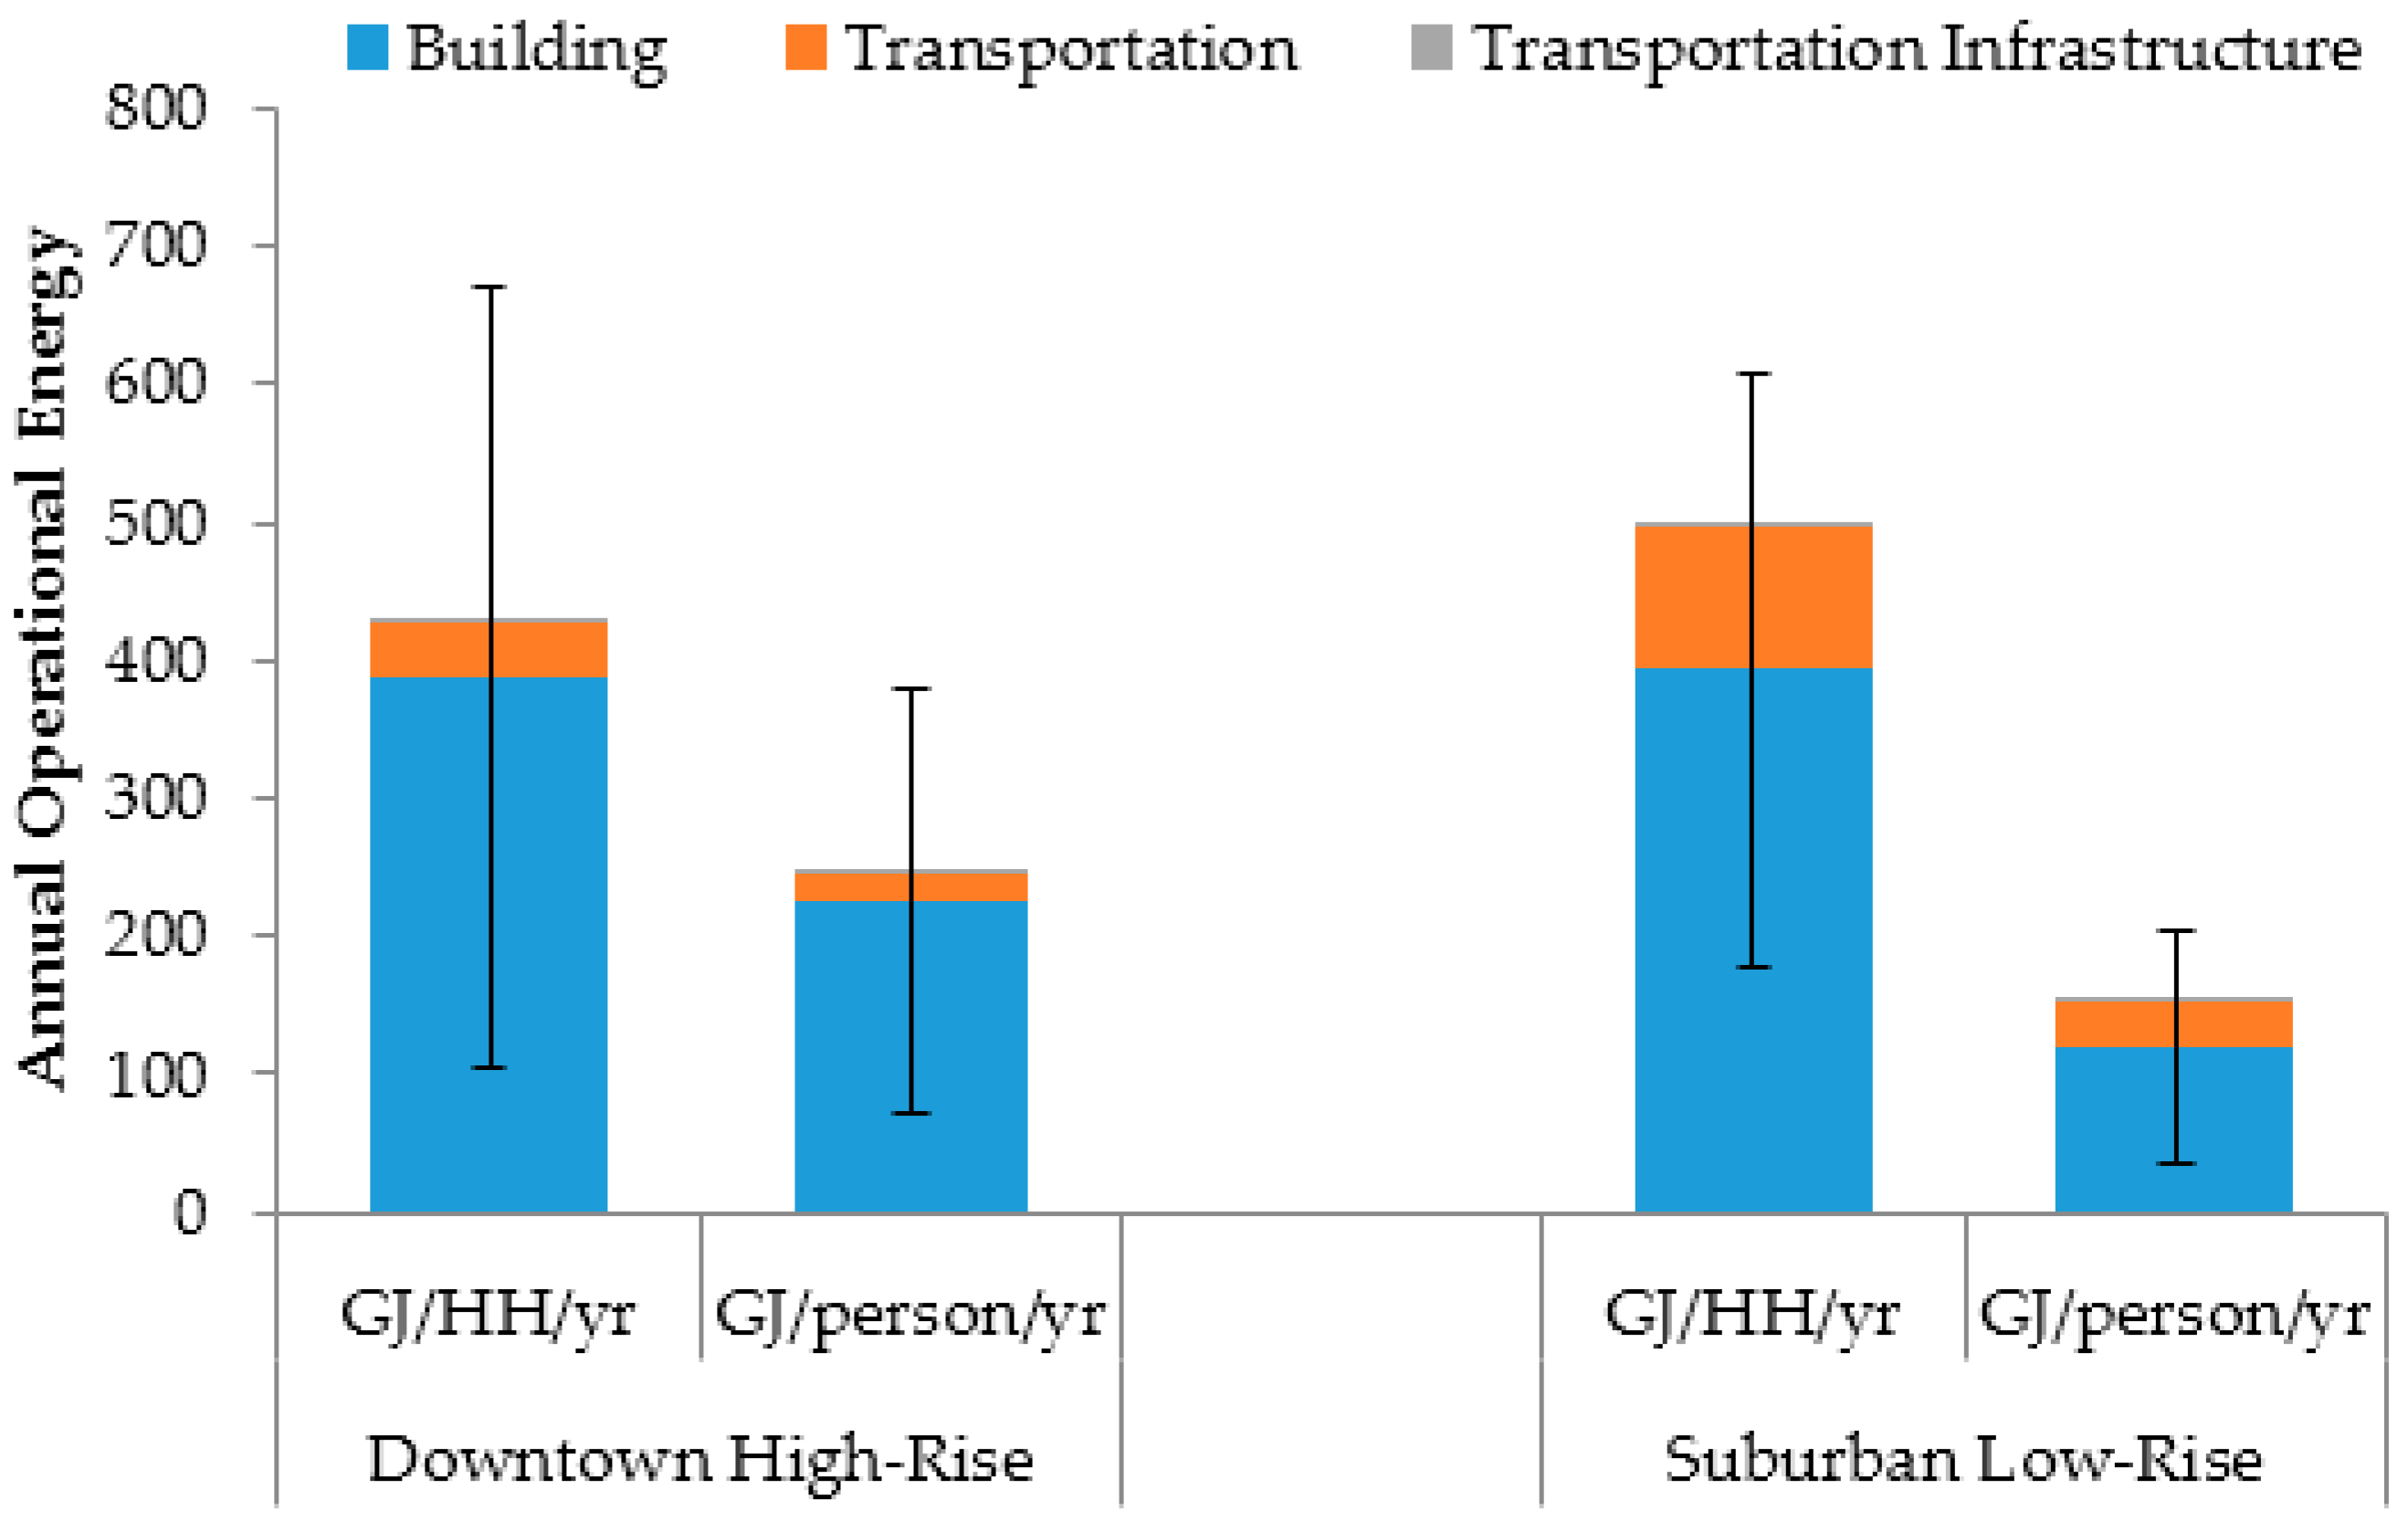
| Building | 388.4 | 225.8 | 91.0% | 393.2 | 120.7 | 78.8% |
| Transportation | 37.9 | 19.9 | 8.9% | 103.5 | 31.4 | 20.8% |
| Transportation Infrastructure | 0.3 | 0.2 | 0.1% | 2.2 | 0.7 | 0.4% |
| Total | 426.6 | 245.9 | 100% | 498.9 | 152.8 | 100% |
| Previous Studies | Location | Urban Pattern | Building Type | HH Size | Energy Input | GFA/Person (m2) | BOE | TOE | Total OE | |||
|---|---|---|---|---|---|---|---|---|---|---|---|---|
| GJ/HH | GJ/person | GJ/HH | GJ/person | GJ/HH | GJ/person | |||||||
| Urban high-density scenarios | ||||||||||||
| Norman et al. (2006) [3] | Toronto, Canada | City center | 15-story high-rise | 1.8 | Unknown | 42.8 | 49.5 | 27.5 | 14.2 | 7.9 | 63.7 | 35.4 |
| Perkins et al. (2009) [7] | Adelaide Australia | City center | 6–8-story mid-rise | 1.6 | Site | 17.5 | 32 | 20 | 13 | 8 | 45 | 28 |
| Fuller et al. (2011) [11] 1 | Melbourne, Australia | City center | 20-story high-rise | 2.1 | Source | 47.6 | 37.8 | 18 | 4.2 | 2 | 42 | 20 |
| Stephan et al. (2013) [10] 2 | Brussels, Belgium | City center | 10-story high-rise | 2 | Source | 40 | 50 | 25 | 28.8 | 14.4 | 78.8 | 39.4 |
| Du et al. (2015) [12] | Chicago, USA | City center | 10-story high-rise | 1.6 | Source | 66 | 180.6 | 112.9 | 24.8 | 15.5 | 205.4 | 128.4 |
| This study | Chicago, USA | City center | 27–86-story high-rise | 1.9 | Source | 77.4 | 388.4 | 225.8 | 38.2 | 20.1 | 426.6 | 245.9 |
| Suburban low-density scenarios | ||||||||||||
| Norman et al. (2006) [3] | Toronto, Canada | Outer suburb | Single-family | 3 | Unknown | 80.5 | 149.4 | 49.8 | 86.4 | 28.8 | 235.8 | 78.6 |
| Perkins et al. (2009) [7] | Adelaide Australia | Inner suburb | 2-story terrace | 2 | Site | 113.5 | 27 | 14 | 46 | 23 | 73 | 37 |
| Perkins et al. (2009) [7] | Adelaide Australia | Outer suburb | Single-family | 2.5 | Site | 204 | 36 | 13 | 132 | 48 | 168 | 61 |
| Fuller et al. (2011) [11] 1 | Melbourne, Australia | Inner suburb | Mid-rise | 1.6 | Source | 40 | 14.4 | 9 | 9.6 | 6 | 24 | 15 |
| Fuller et al. (2011) [11] 1 | Melbourne, Australia | Outer suburb | Single-family | 2.5 | Source | 95.2 | 46.25 | 18.5 | 102.5 | 41 | 148.8 | 59.5 |
| Stephan et al. (2013) [10] 2 | Brussels, Belgium | Outer suburb | Single-family | 4 | Source | 82.5 | 118.1 | 29.5 | 98 | 24.5 | 216.1 | 54 |
| Du et al. (2015) [12] | Chicago, USA | Outer suburb | Single-family | 3.2 | Source | 66 | 242.9 | 75.9 | 64.6 | 20.2 | 307.5 | 96.1 |
| This study | Chicago, USA | Inner suburb | Single-family | 3.3 | Source | 68.6 | 393.2 | 120.7 | 105.7 | 32.1 | 498.9 | 152.8 |
© 2016 by the authors; licensee MDPI, Basel, Switzerland. This article is an open access article distributed under the terms and conditions of the Creative Commons Attribution (CC-BY) license (http://creativecommons.org/licenses/by/4.0/).
Share and Cite
Du, P.; Wood, A.; Stephens, B. Empirical Operational Energy Analysis of Downtown High-Rise vs. Suburban Low-Rise Lifestyles: A Chicago Case Study. Energies 2016, 9, 445. https://doi.org/10.3390/en9060445
Du P, Wood A, Stephens B. Empirical Operational Energy Analysis of Downtown High-Rise vs. Suburban Low-Rise Lifestyles: A Chicago Case Study. Energies. 2016; 9(6):445. https://doi.org/10.3390/en9060445
Chicago/Turabian StyleDu, Peng, Antony Wood, and Brent Stephens. 2016. "Empirical Operational Energy Analysis of Downtown High-Rise vs. Suburban Low-Rise Lifestyles: A Chicago Case Study" Energies 9, no. 6: 445. https://doi.org/10.3390/en9060445