Article

Quantification and Mitigation of Unfairness in Active Power Curtailment of Rooftop Photovoltaic Systems Using Sensitivity Based Coordinated Control

1
Energy Department, Austrian Institute of Technology, Vienna 1210, Austria
2
Institute of Energy Systems and Electrical Drives, Vienna University of Technology, Vienna 1040, Austria
3
Department of Electrical Sustainable Energy, Delft University of Technology, Delft 2628 CD, The Netherlands
*
Author to whom correspondence should be addressed.
Energies 2016, 9(6), 436; https://doi.org/10.3390/en9060436
Submission received: 7 April 2016 / Revised: 28 May 2016 / Accepted: 31 May 2016 / Published: 4 June 2016
(This article belongs to the Special Issue Distributed Renewable Generation)

Abstract

:
With increasing photovoltaic (PV) penetration in low voltage networks (LVNs), voltage regulation is a challenge. Active power curtailment (APC) is one possible solution for mitigating over voltages resulting from active power injection in LVNs. There is an inherent unfairness in the APC scheme. When generation is high and consumption is low, the voltages at the end of the feeder tend to be the highest. This results in high curtailment of active power output of the inverters located at the end of the feeder and low or even no curtailment for the inverts located closer to the transformer. A secondary voltage controller has been implemented to mitigate this unfairness in APC based voltage support schemes. The focus of this work is to quantify this unfairness and develop methods that enable residential PV owners serviced by the same feeder to participate equally in voltage regulation in the LVN.

1. Introduction

Crystalline silicon photovoltaic (PV) systems currently dominate the PV market. Even though crystalline silicon PVs have high efficiency compared to other technologies, high production costs have motivated researchers to find a more cost effective alternative. One such solution is the thin film technology, which requires lesser material to produce and is cheaper as a result. They currently however have much lower efficiencies when compared with crystalline silicon technologies [1]. Advances in technology, ever increasing demand for green energy and favorable government policies have resulted in rapid increase of PV systems in a number of energy markets around the world [2]. A considerable percentage of the PV systems have been installed in low voltage network (LVN). High PV penetration results in a number of engineering challenges like harmonic distortion, light flicker due to voltage fluctuation, reverse power flow, and over voltage [3,4,5]. These challenges are a major limiting factor in increasing PV penetration in distribution networks.
Distribution systems have been designed to deliver power from the high voltage side of the electrical grid to end customers connected in the LVN. Current distribution systems at the time of conception were designed to cater for the voltage drop caused by consumer load and inherent impedance of the distribution lines. Injection of power at the LVN results in over voltage which the networks were not designed to cater for. Traditionally, network voltage has been regulated by the on-load tap changer (OLTC) of the medium voltage/high voltage (HV/MV) transformers [6]. Distributed generation at medium and LVNs reduces the voltage regulation capability of such a scheme [7]. At times when there is high generation from PVs and low load consumption, power is injected into the grid and line impedance causes the voltage at the point of common coupling (PCC) to rise [8]. This may lead to violation of voltage bands prescribed by standards such as EN 50160 in Europe and ANSI C84.1 in the US [9,10]. Distribution system operators (DSO) therefore require additional control over voltage regulation.
Over voltage in distribution networks is associated with a number of problems in power systems. It increases the stress on insulation of the electrical appliances connected to the grid by consumers. This can significantly reduce the life of a product. In worst case scenarios, insulation failure can occur resulting in faults. A number of electrical appliances have built-in over voltage protection that shuts down the appliance in case of a severe over voltage [11,12]. Over voltage can potentially trigger protection relays resulting in unintentional islanding of a feeder from the main grid [13].
In literature, a number of schemes have been suggested to improve voltage regulation in the distribution network and thereby making it possible to increase the PV penetration. Turitsyn et al. [14] proposed reactive power compensation (RPC) by PV owners. Injection of reactive power however results in higher switching losses in an inverter. In several countries—e.g., Canada, India, and Bangladesh—RPC is not legal by rooftop PV owners and inverters are only allowed to operate at unity power factor [15,16,17]. In these countries, active power curtailment (APC) is the only way of regulating voltage at the PCC. It is possible for feeders in LVNs to have R/X > 1 in such a scenario, voltage is more sensitive to active power injection rather than RPC [8]. On the other hand, APC means loss of revenue for PV owners. Based on their work in [18] Long and Ochoa have concluded that installing an OLTC on distribution transformer can improve voltage regulation and increase PV hosting capacity of a LVN up to 20% depending on network topology and PV distribution along the feeders. Aggarwal et al. [19] investigated the possibility of using a distribution static synchronous compensator (D-STATCOM) in LVNs with high PV penetration. Results showed that not only does use of D-STATCOM improves voltage regulation, it also suppresses harmonic distortion [19]. A coordinated control strategy for OLTC and D-STATCOM has been presented in [20]. The authors have concluded that proposed scheme is capable of mitigating both over voltages and voltage imbalances via active and reactive power control respectively. Use of storage for voltage rise mitigation has been the subject of investigation in a number of papers [21,22]. Coordinated control for APC and/or RPC of PVs is another solution to the voltage regulation problem proposed by a number of papers [23,24,25,26,27]. Implementation of these strategies would require communication infrastructure.
The Voltage at the PCC is a function of the active and reactive power being injected at that point and the grid impedance as seen by the inverter at PCC. As the electrical distance from a transformer increases, so does the voltage sensitivity. At times of high generation, inverters connected at PCC with higher voltage sensitivity may violate voltage limits. As a result, the inverters that are violating voltage limits have their output curtailed. Essentially, PV owners located at the end of the feeder are more susceptible to voltage violations and getting their power curtailed resulting in loss of revenue. DSOs commonly calculate a feeders’ hosting capacity using the worst case over voltage scenario which might further limit the size of PV that can be installed by the house owner connect near the end of the feeder. Worst case voltage is calculated using a scenario assuming no load and all single phase PV inverter units are connected on the same phase.
A number of different solutions have been presented in literature to mitigate this inherent unfairness in droop based APC schemes for voltage control. In Japan for example, as of 2012, if power from a PV inverter is curtailed for more than 30 days a year (8%), the owner has to be compensated by the DSO [28]. In [26], authors have suggested using batteries at times of low consumption and high distributed generator (DG) generation. An added advantage of using battery storage is that it minimizes fluctuations in DG output. Researchers have also suggested using demand side management and increasing self-consumption, thereby reducing power injection during the time power curtailment is an issue [29]. Tonkoski et al. [8] developed a coordinated algorithm to mitigate unfairness by experimenting with different droop curves for DG owners and achieved excellent results. Perera et al. [30] developed an iterative algorithm that improves fairness while keeping voltage within limits. Zhao et al. [31] have addressed unfair APC by formulating it as part of the objective function in an optimization problem. The proposed algorithm uses load and solar irradiance forecast profiles to calculate active power dispatch values for PVs while minimizing both unfairness in curtailment and total curtailment and satisfying voltage constraints. References [8,32] have exploited the voltage sensitivity matrix to calculate potential voltage rise and reduction in active power injection required to ensure that voltage remains within limits.
The scope of this work is to quantify the unfairness in local APC schemes and investigate the possibility of increasing fairness using coordinated control. Quantification of unfairness is important as it facilitates in evaluating the effectiveness of the proposed solution and comparing different solutions proposed in literature. This work further investigates the consequences of improving fairness e.g., increasing curtailment. The proposed algorithm also aims to reduce excessive curtailment by using an S function. Structure of the paper is as follows: Section 2 explains the principle of APC and presents problem formulation; Section 3 the formulation of the key performance indices (KPIs) used for comparison has been presented; Section 4 details the proposed algorithm; Section 5 details network model and simulation setup; simulation results are presented and discussed in detail in Section 6; finally, in Section 7, conclusions have been drawn on the basis of this work.

2. Problem Formulation

Power flow through a line can be calculated using the Equations (1) and (2). Where, R + jX is the impedance of the line, u1 and u2 are source and line end voltage, respectively, and Φ is the phase angle between the two voltages.
P = u 1 R 2 + X 2 [ R ( u 1 u 2 cos Φ ) + X   u 1 sin Φ ]
Q = u 1 R 2 + X 2 [ R u 2 sin Φ + X   ( u 1 u 2 cos Φ ) ]
In LVNs R/X ratio is typically high. High R/X ratio results in limited impact of reactive power on voltage regulation making APC a more effective option for voltage control. The phase angle Φ is generally small and sinΦ ≈ Φ and cosΦ ≈ 1 are reasonable approximations. Using these approximations, the change in voltage at the PCC can be formulated as Equation (3) [24]. For PV inverter units operating at unity power factor Q = 0 this expression can be reduced to Equation (4).
Δ u P R + Q X u
Δ u P R u
A local droop based voltage controller has been implemented in PowerFactory (DIgSILENT, Gomaringen, Germany) [33]. Below a critical voltage ucri inverter output follows maximum power point tracking (mppt). The active power is curtailed linearly once the voltage at the bus exceeds the critical voltage. If the voltage at PCC exceeds the upper voltage limit uthr the active power output of the inverter is reduced to the minimum permissible value Pmin.
{ P cal = P mppt                      u < u cri P cal = P mppt m   ( u thr u )       u cri u u thr P cal = P min                          u thr u

Voltage Sensitivity Estimation

In this paper, additional logic has been implemented to estimate the voltage sensitivity of the PCC to active power (du/dp). When the Calc signal is set high, a pulse generator generates pulses for a predefined time interval. If Pcal is greater than a critical value Pcri, the inverter set point is switched to zero temporarily. The change in voltage is then recorded and du/dp is estimated using finite difference. The process is repeated to and the results are filtered to minimize estimation errors. For this work, Pcri has been set to 70% of the rated power. Pcri is intentionally set high so that a significant change in the voltage can be recorded and the impact of other inverters and the load present in the system can be neglected. The main thought process behind estimation of voltage sensitivity is to provide a truly plug-and-play solution for voltage control. Figure 1 presents a graphical overview of the PV inverter.

3. Formulation of Key Performance Indices

To measure the performance of the coordinated control scheme and for the purpose of comparison with currently existing schemes, two KPIs have been formulated, namely, total energy curtailed (TEC) and curtailment unfairness index (CUI).

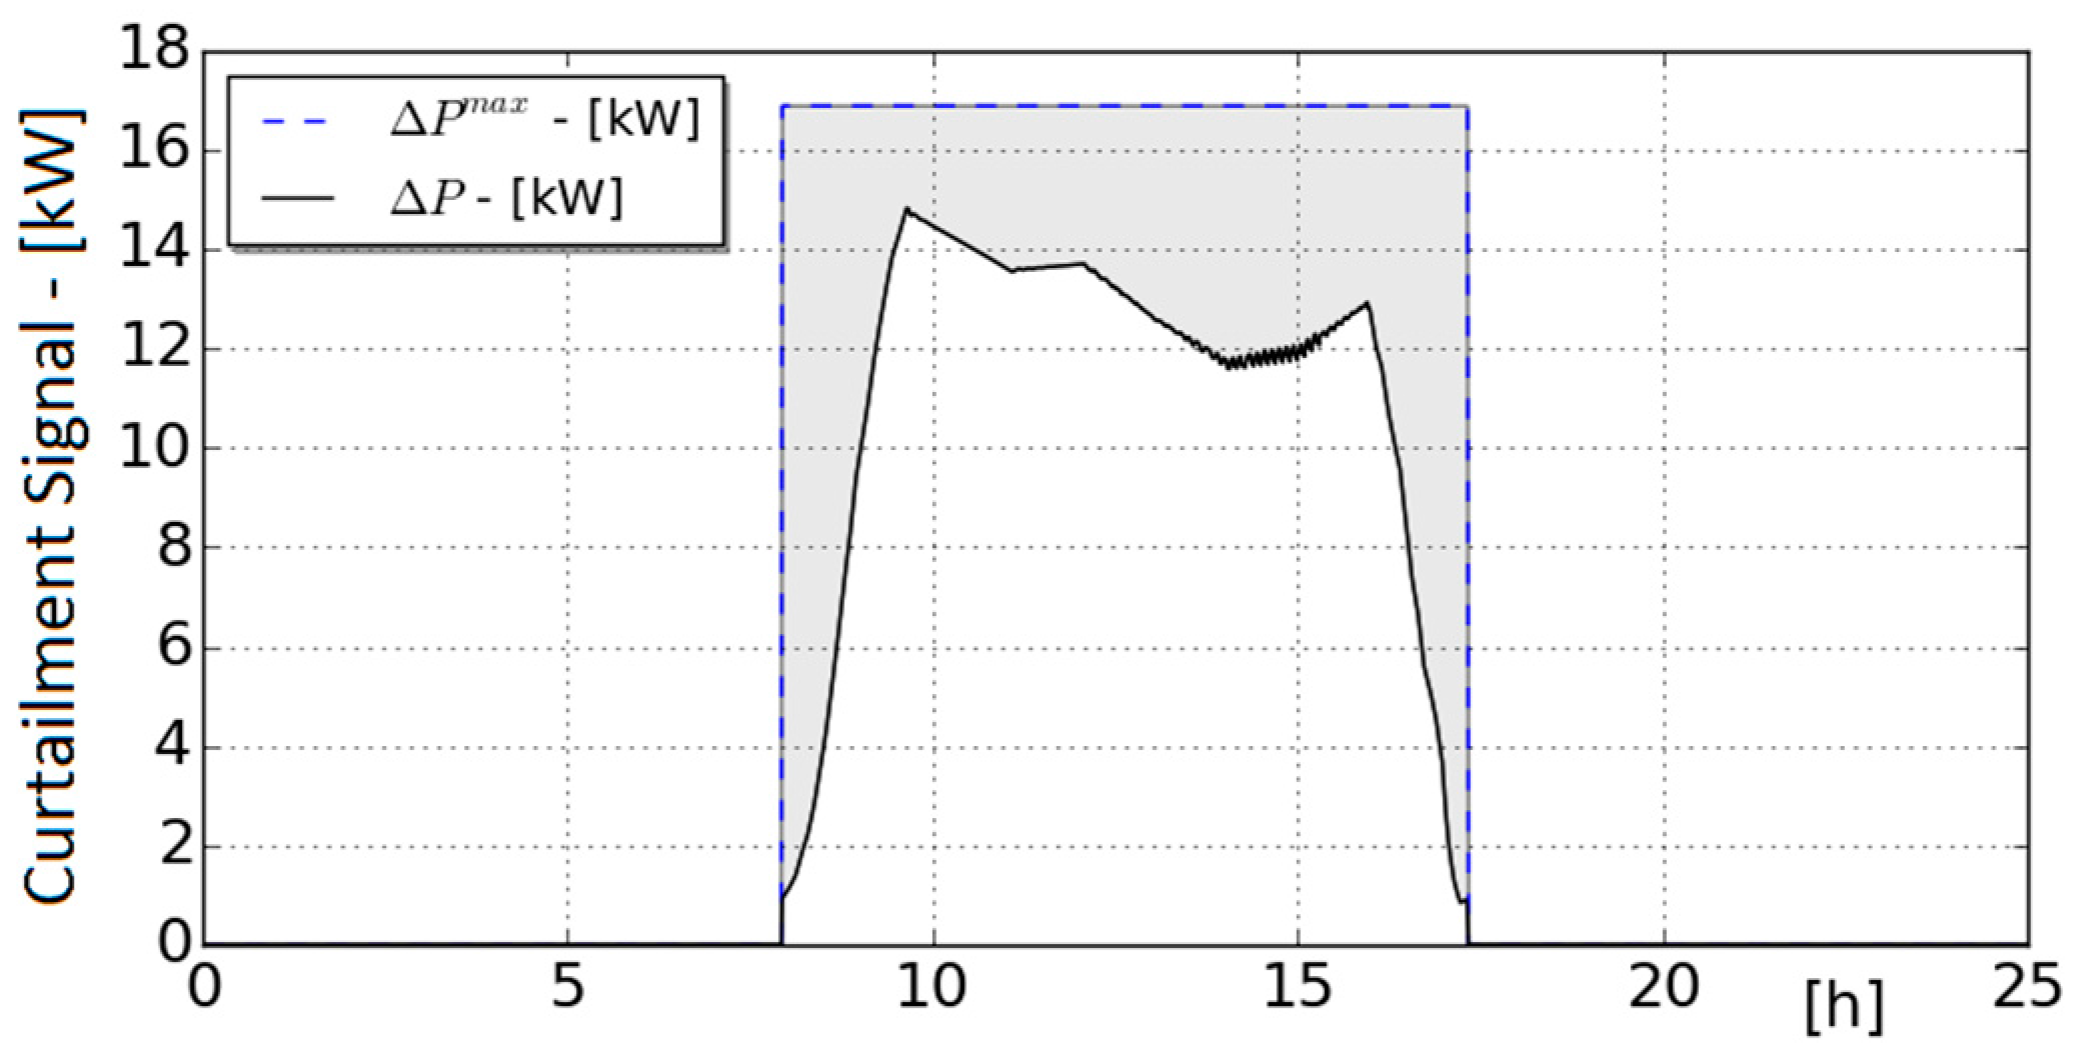
3.1. Total Curtailed Energy

TEC is an important KPI for comparison as any proposed coordination based control scheme should not significantly increase loss of green energy as it results in loss of revenue for the PV system owner and loss of green energy for the DSO.
P i cur = P i inv P i mppt
E i cur = P i cur   d t
TEC = 1 N E i cur   for   i = 1 ,   .. ,   N
where N is the number of PV systems installed on a particular feeder. P i mppt , P i inv , E i cur are the maximum active power output, actual active power output, and the curtailed energy of the ith inverter. TEC is therefore TEC from all inverters present in the feeder performing APC.

3.2. Unfairness in Active Power Curtailment

Fairness in APC can be examined from two perspectives. The first perspective being the loss of revenue for all PV system owners should be equal irrespective of the nominal rating of the PV system. CUI1 index formulated in Equation (9) has been used in this work to quantify the fairness from this perspective and compare different control strategies.
CUI 1 = ( E i cur E cur ¯ ) 2 N 1
where E cur ¯ is the average energy curtailed during a 24-h period from all PV systems connected to a feeder. The calculated index CUI1 is the standard deviation of curtailed energies, hence, a measure of spread of TEC during the day from the installed PV systems. If equal energy is curtailed from each PV system, CUI1 will be zero implying fair curtailment. If however the installed PV systems differ in rating a PV system with a smaller rating would incur higher percentage reduction in revenue. Another way to accommodate the unfairness is to ensure that percentage reduction in revenue for every PV system owner is the same. Curtailed power can be normalized by dividing instantaneous curtailed power P i cur by the rated output of the inverter P i rated . Integrating normalized curtailed power gives normalized curtailed energy and as P i rated is a constant it can be calculated using Equation (10).
e i cur = E i cur / P i rated
CUI 2 = ( e i cur e cur ¯ ) 2 N 1
where P i rated is the rated power for the ith inverter and e cur ¯ is average of the normalized curtailed energies of all PV systems present in a feeder. The second index formulated in this work ( CUI 2 ) is a measure of spread of percentage of the energy curtailed from each PV rather than TEC from the PVs. Low values of CUI1 and CUI2 indicate small spread hence higher fairness and vice versa.

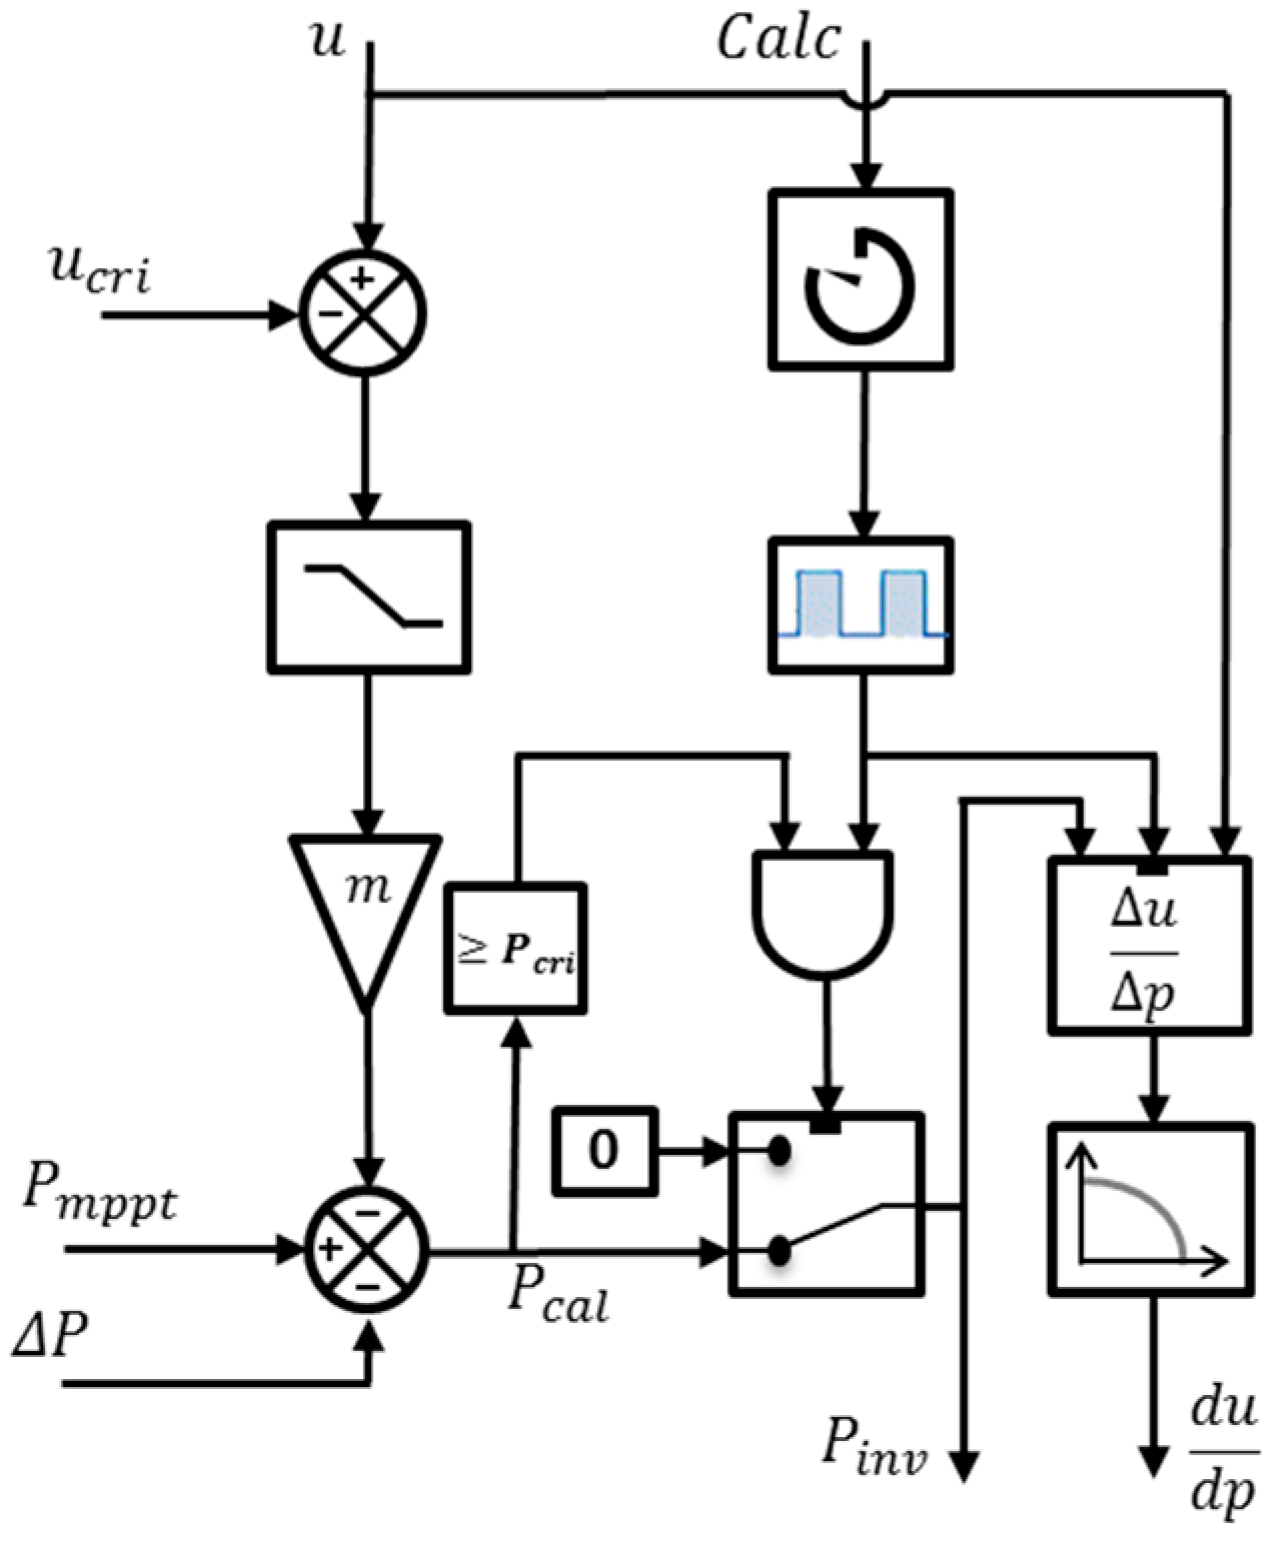
4. Proposed Algorithm

In this paper, a coordinated control scheme has been proposed in which a feeder in a low voltage susceptible to over voltages has a coordinating controller for voltage regulation. This controller ensures that every PV system owner participates equally in voltage regulation of a feeder. This work assumes a bidirectional ideal communication channel between the coordinating controller and smart inverters. The controller has two modes of operation. In normal operation, when maximum voltage at every point in feeder is less than ulb, no energy is curtailed. In distressed mode, the controller generates set points for every inverter. This section details the working of the proposed controller.

4.1. Calculation of Sensitivity Matrix

The impact of variation of active power injected by the inverters can be measured quantitatively using the sensitivity matrix [34]. In this work, inverters have been modeled to operate at unity power factor, consequently the impact of reactive power on voltage can be neglected.
[ Δ P 1 Δ P N ] = [ P 1 V 1 P 1 V N P N V 1 P N V N ] [ Δ V 1 Δ V N ]
Voltage sensitivity of a node to active power injection at any node in a radial distribution network can be calculated using Equation (13) [34,35].
P i V j = R i j V nom
with i, j = 1, 2, …, N.
The expressions suggest that longer the feeder length more susceptible it is to over voltages. The resistance matrix can be expanded and rewritten as a function of line length and resistance per kilometer.
R i j = r i j × L i j
For i = j, Lij is the minimum electrical distance from the transformer to the ith node. In case ij, Lij is the maximum overlap of the paths formed from the transformer to the ith and jth node. rij is the average resistance per kilometer of the branches belonging to Lij. For i > j or j > i, if overlapping path length is much greater than non-overlapping path lengths the off-diagonal elements of the sensitivity matrix can be approximated as the diagonal elements of the matrix.
S i j = [ P 1 V 1 P 1 V 1 P 1 V 1 P 2 V 2 P 1 V 1 P 2 V 2 P 1 V 1 P 2 V 2 P N V N ]
As each inverter is capable of calculating the voltage sensitivity of the connected node to active power (diagonal elements of the matrix), rest of the matrix can be populated.

4.2. Active Power Reduction Calculation

At initial run, the coordinating controller requests and receives rated powers, estimated sensitivities and node ID from every inverter connected to the feeder. Rated output power of the PV systems are stored in the matrix R P k × l , where k is the number of unique nodes in a feeder with a PV connection and l is the maximum number of PVs connected to a single node. The sensitivities arranged in an ascending order form the diagonal part of the sensitivity matrix S k × k . Non-diagonal elements of the sensitivity matrix are populated using Equation (15). Voltage at the secondary side of the MV/LV (low voltage) transformer u trlv is calculated using the current tap position TP, percentage voltage change per tap u tap , and nominal voltage u nom .
u trlv = u nom u tap × T P
Maximum voltage rise at all nodes connected to PV systems is calculated using the sensitivity matrix Sij and the rated powers P i rated .
Δ u i max = j = 1 k m = 1 l R P j m × S i j
with i = 1, 2, …, k.
The voltages measured at PCC of each inverter are sent to the coordinating controller and continuously monitored. Critical voltage for each inverter is set using Equations (18) and (19), where u max is the maximum of the measured voltages.
u max = max ( u 1 , 2 , , k )
u i cri = { u i   | u max = u lb u max u lb u ub otherwise
If i is the index of the node with the maximum measured voltage, reduction in voltage required ( Δ u ) to ensure no over voltage occurs is calculated using Equation (20).
Δ u = u trlv + Δ u I max u ub
Reduction required in active power injection for each inverter is calculated using either Equation (21) or (22), Equation (23) depending on which fairness perspective is currently under investigation.

4.2.1. Equal Loss of Revenue for Each Photovoltaic Owner

Δ P max = Δ u i = 1 k m i × S i I
where m i is number of non-zero elements in the ith row of RP matrix (number of PV connected to a node). It should be noted that Δ P max is a single value hence the same for every inverter irrespective of its power rating.

4.2.2. Equal Percentage Reduction in Revenue

z = Δ u j = 1 k m = 1 l R P i m × S i I
Δ P max = z × R P
where z is the percentage reduction in active power for each inverter. In this case, ∆Pmax is k × l matrix. In the final step, S function is used to reduce excessive curtailment.
Δ P i j = Δ P i j max 1 + e B u max A
where:
B = u ub u lb 2
where A is a constant that controls the rate at which Δ P i j increases from zero to Δ P i j max . This ensures that maximum possible curtailment occurs only when necessary. Figure 2 presents graphic overview of the proposed scheme.

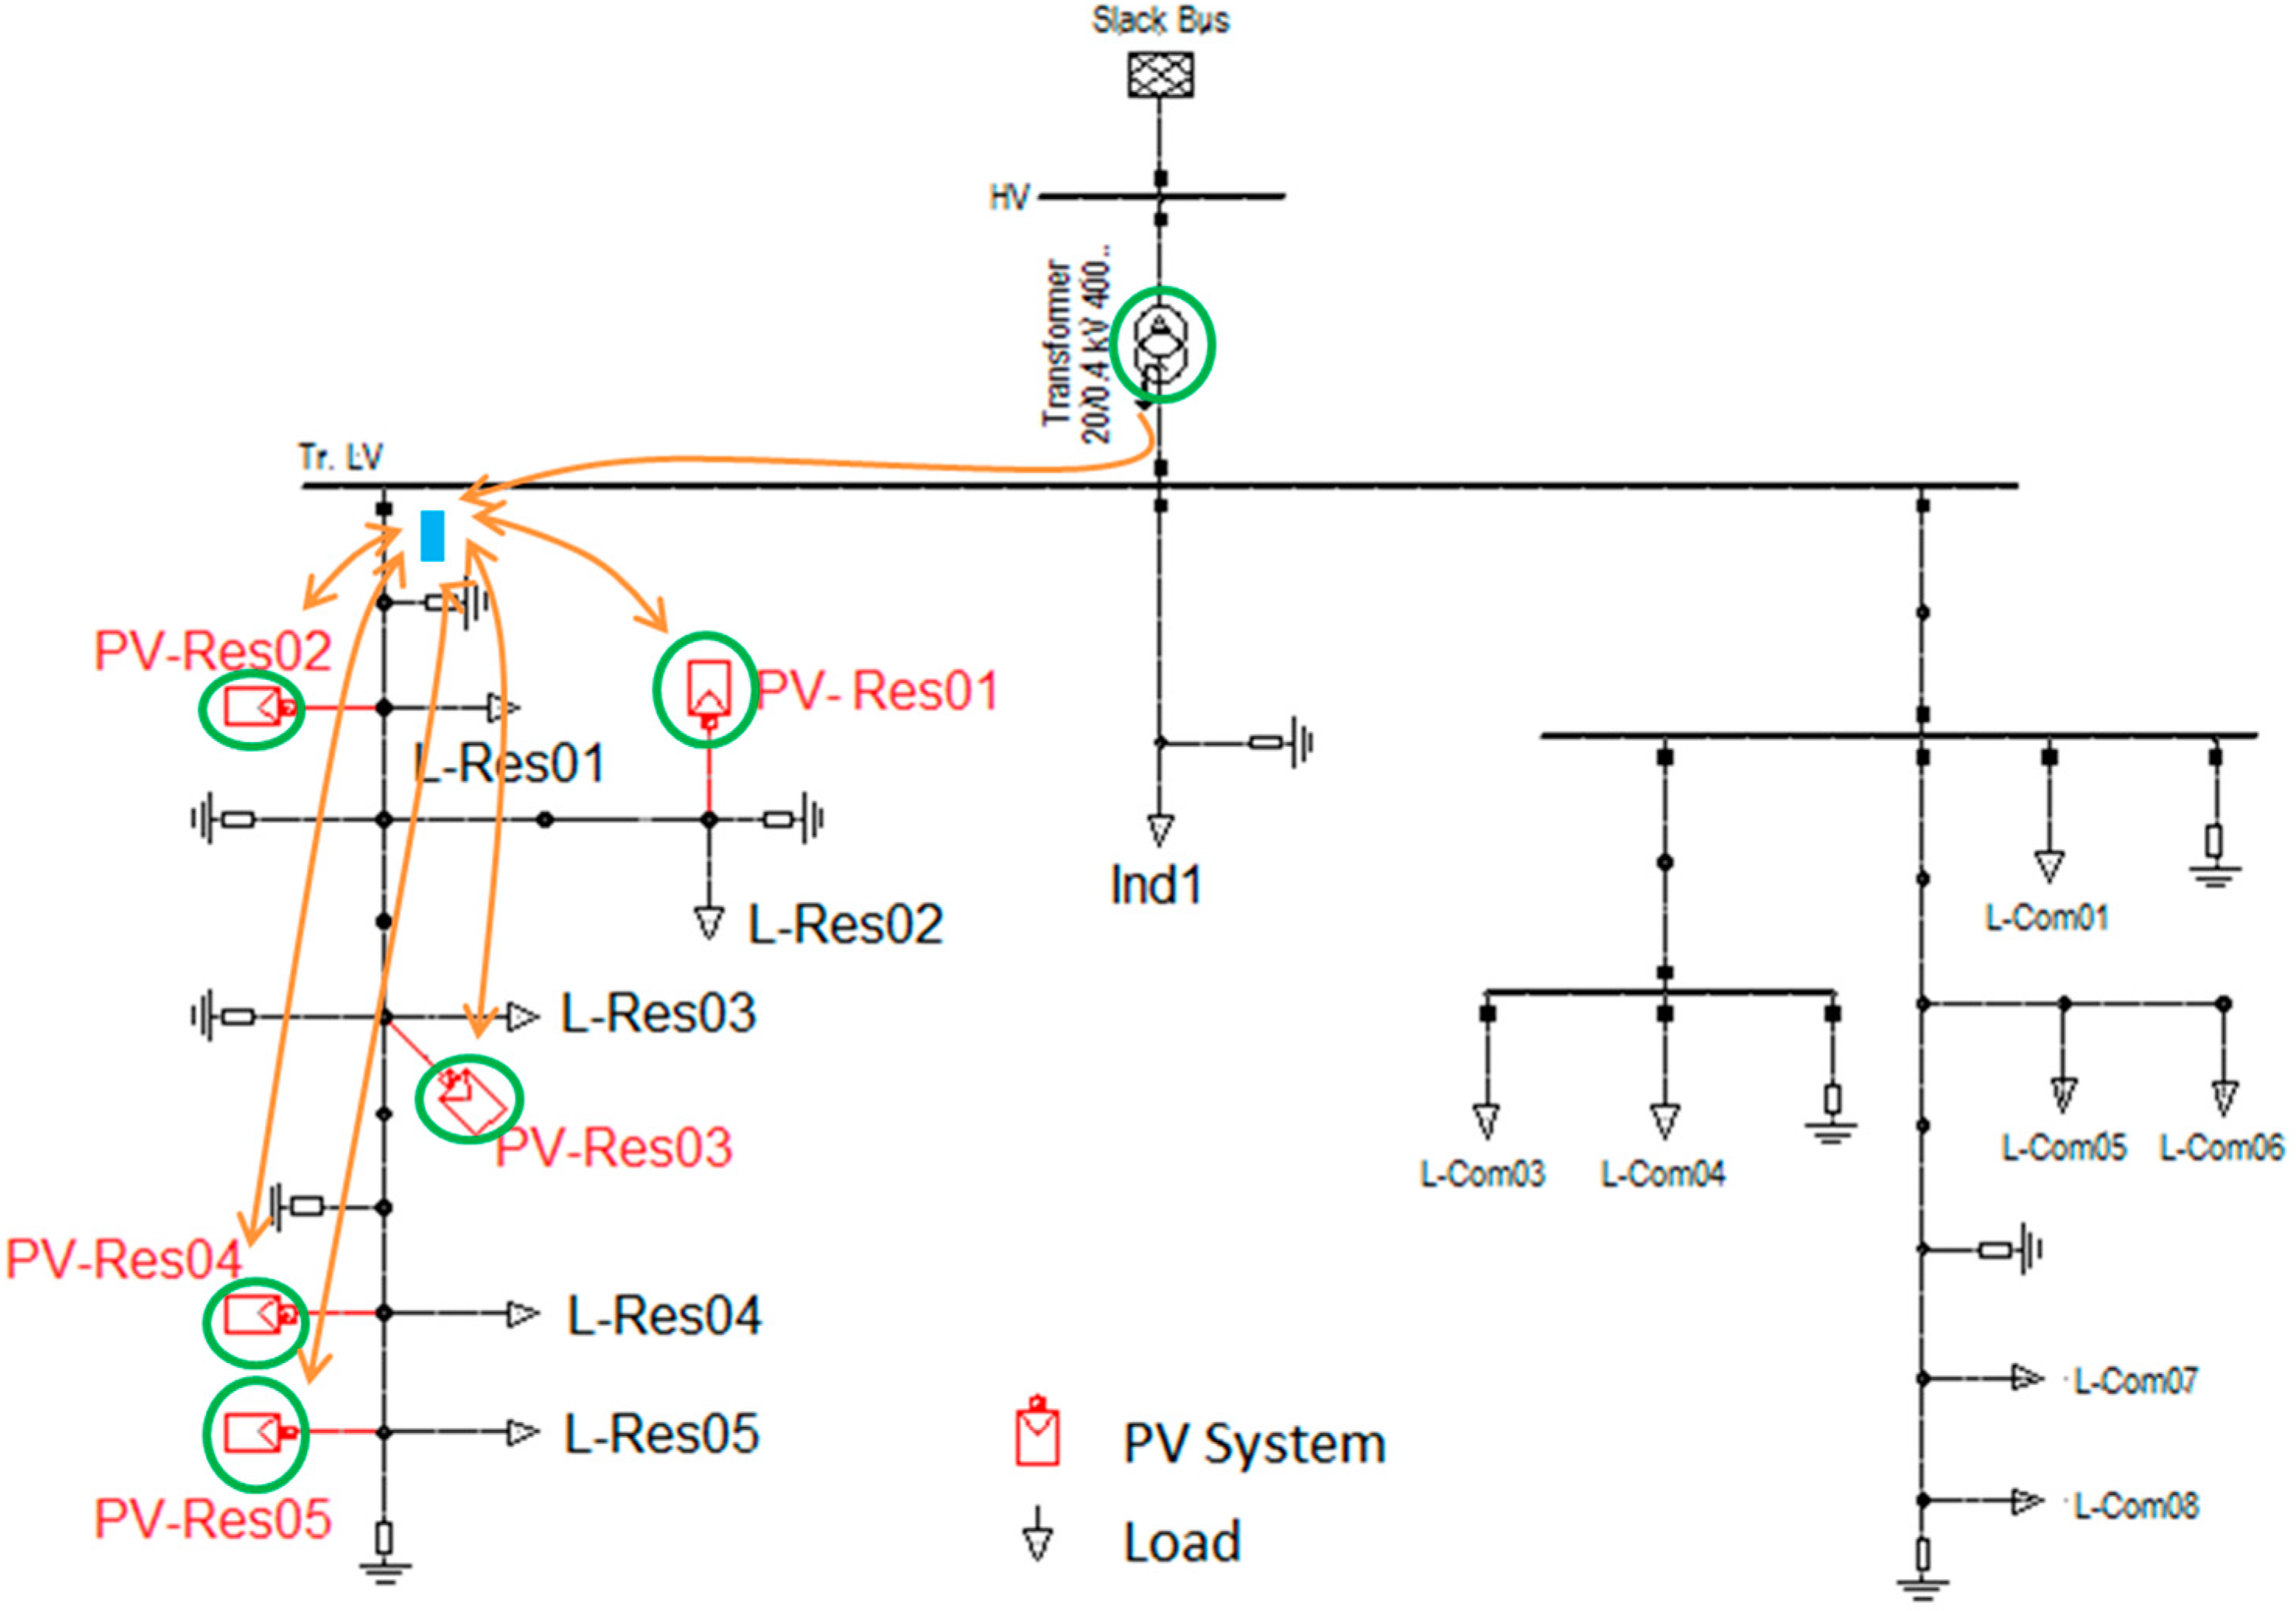
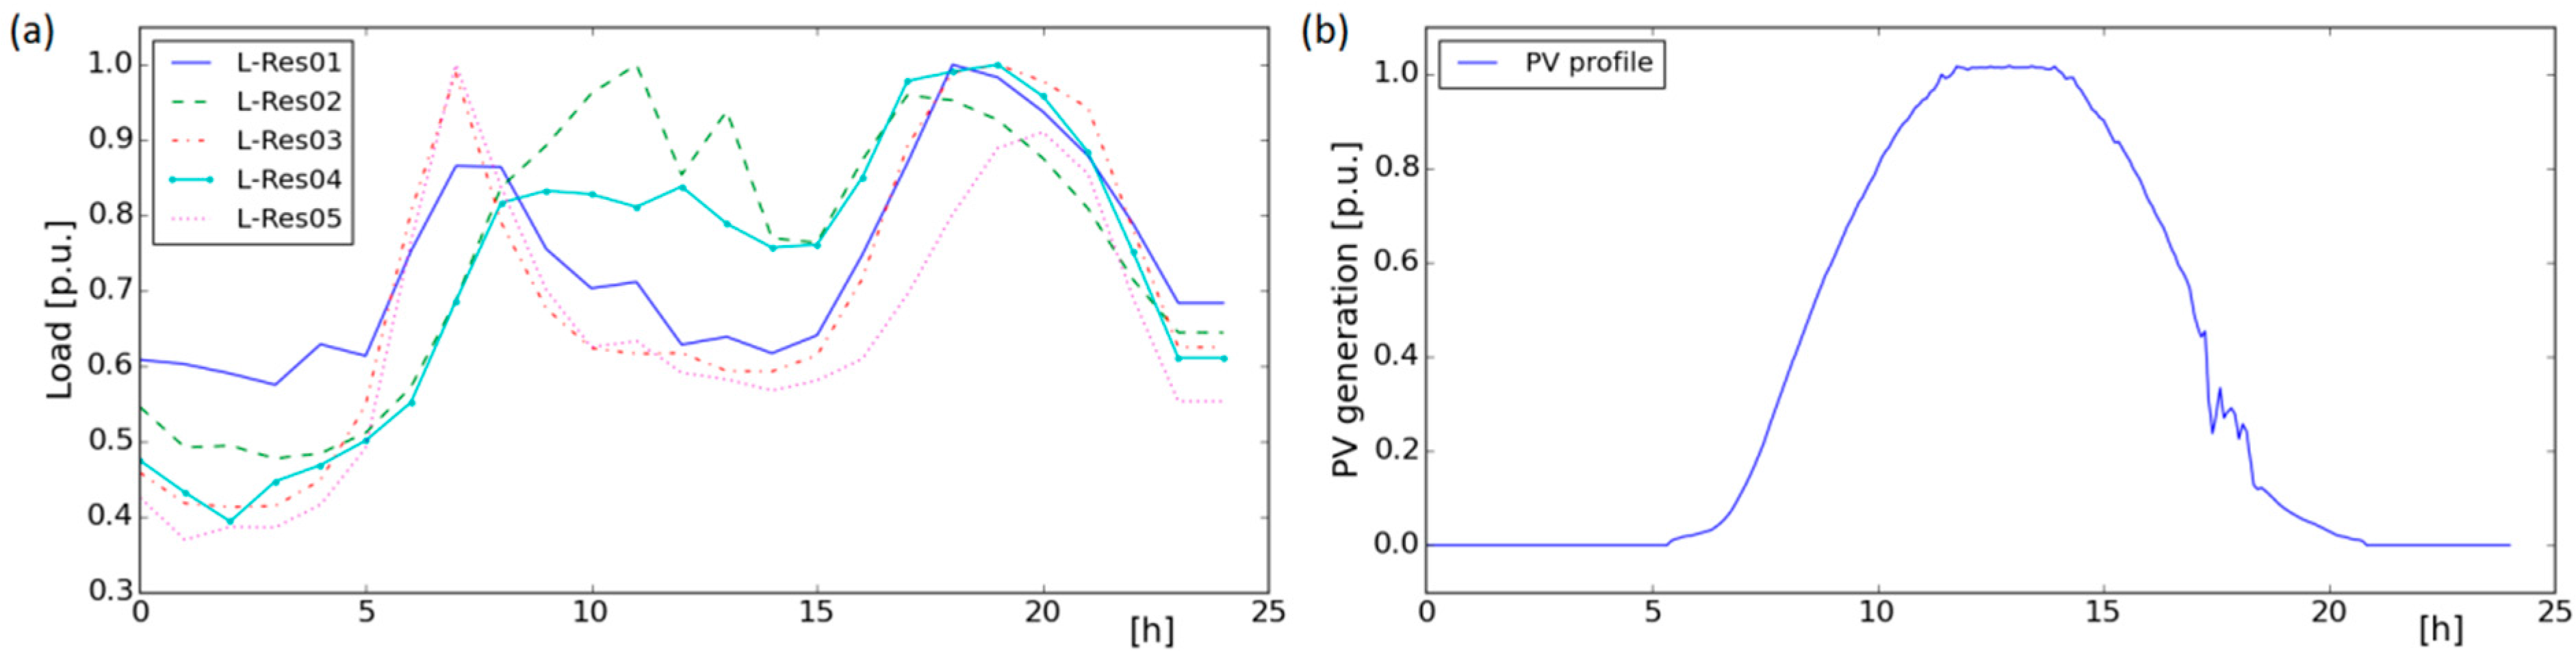
5. Test Case and Simulation Setup

5.1. Network Model

Unlike industrial or commercial feeders, active power demand in residential feeders typically peaks at night which does not coincide with peak generation, which is usually mid-day. This is why residential feeders are more prone to over voltages.
The test case chosen for this work is the Cigre low voltage distribution network [36]. It consists of a three feeders network connected to medium voltage network through a 400 KVA transformer. The cumulative residential load connected to a node is represented by a lumped load connected to the feeder shown in Figure 2. In this study, each of the five lumped loads connected to the residential feeder have a PV system installed. The PV systems have been randomly sized between 25 kVA and 50 kVA. PV inverters provide voltage support using APC. Table 1 lists the rated power of the inverters.
For the purpose of simulation, one hour average profiles have been used for the loads and one minute average profiles have been used for the PV systems. Normalized load and PV profiles used for the study are shown in Figure 3.

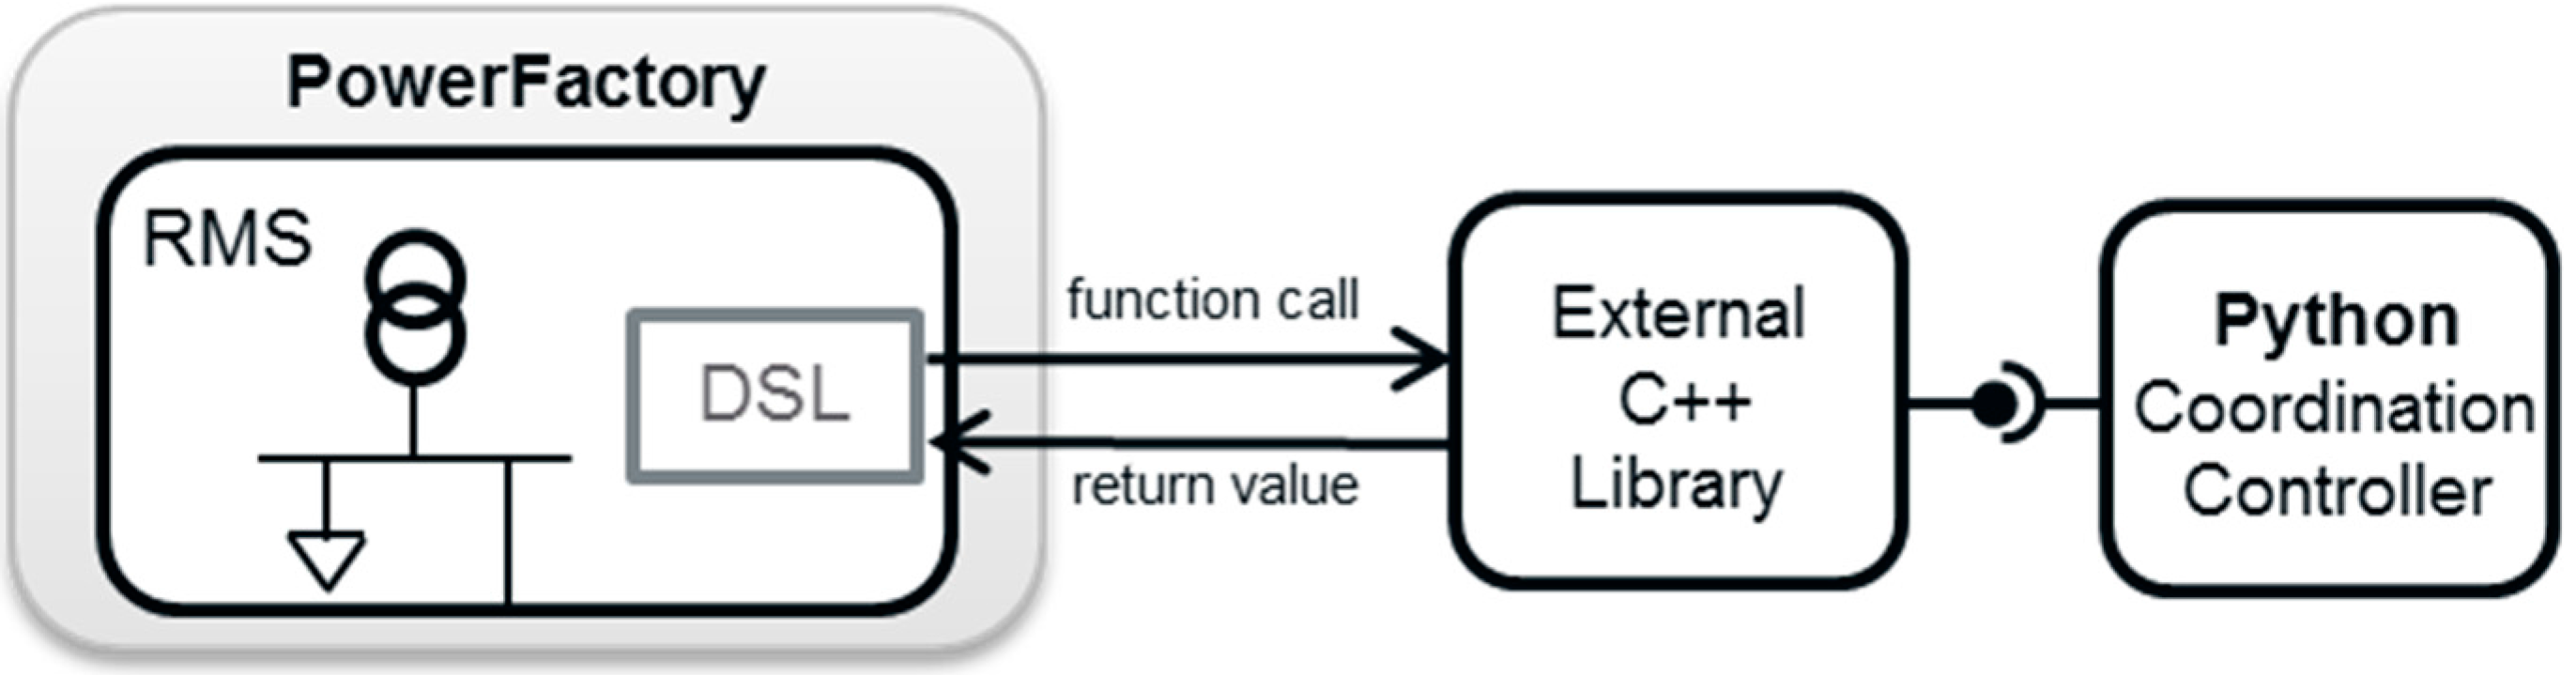
5.2. PowerFactory Python Interfacing

The distribution network and the local voltage controller detailed in Section 2.1 have been implemented in PowerFactory [33], a popular power network simulation tool. The secondary voltage controller, detailed in Section 4, has been implemented in Python [37] because of PowerFactory’s limitations while dealing with matrices. During RMS simulation it is possible for controllers modelled in DSL (DigSilent programming language) blocks to call functions from an external C++ library. A C++ library has been used to implement sockets to communicate with Python. In this work, socket based communication approach has been preferred as it can easily be extended to incorporate a network simulator such as OMNET++ to study the impact of communication on voltage control for future work. Figure 4 is a graphical illustration of coupling scheme used.

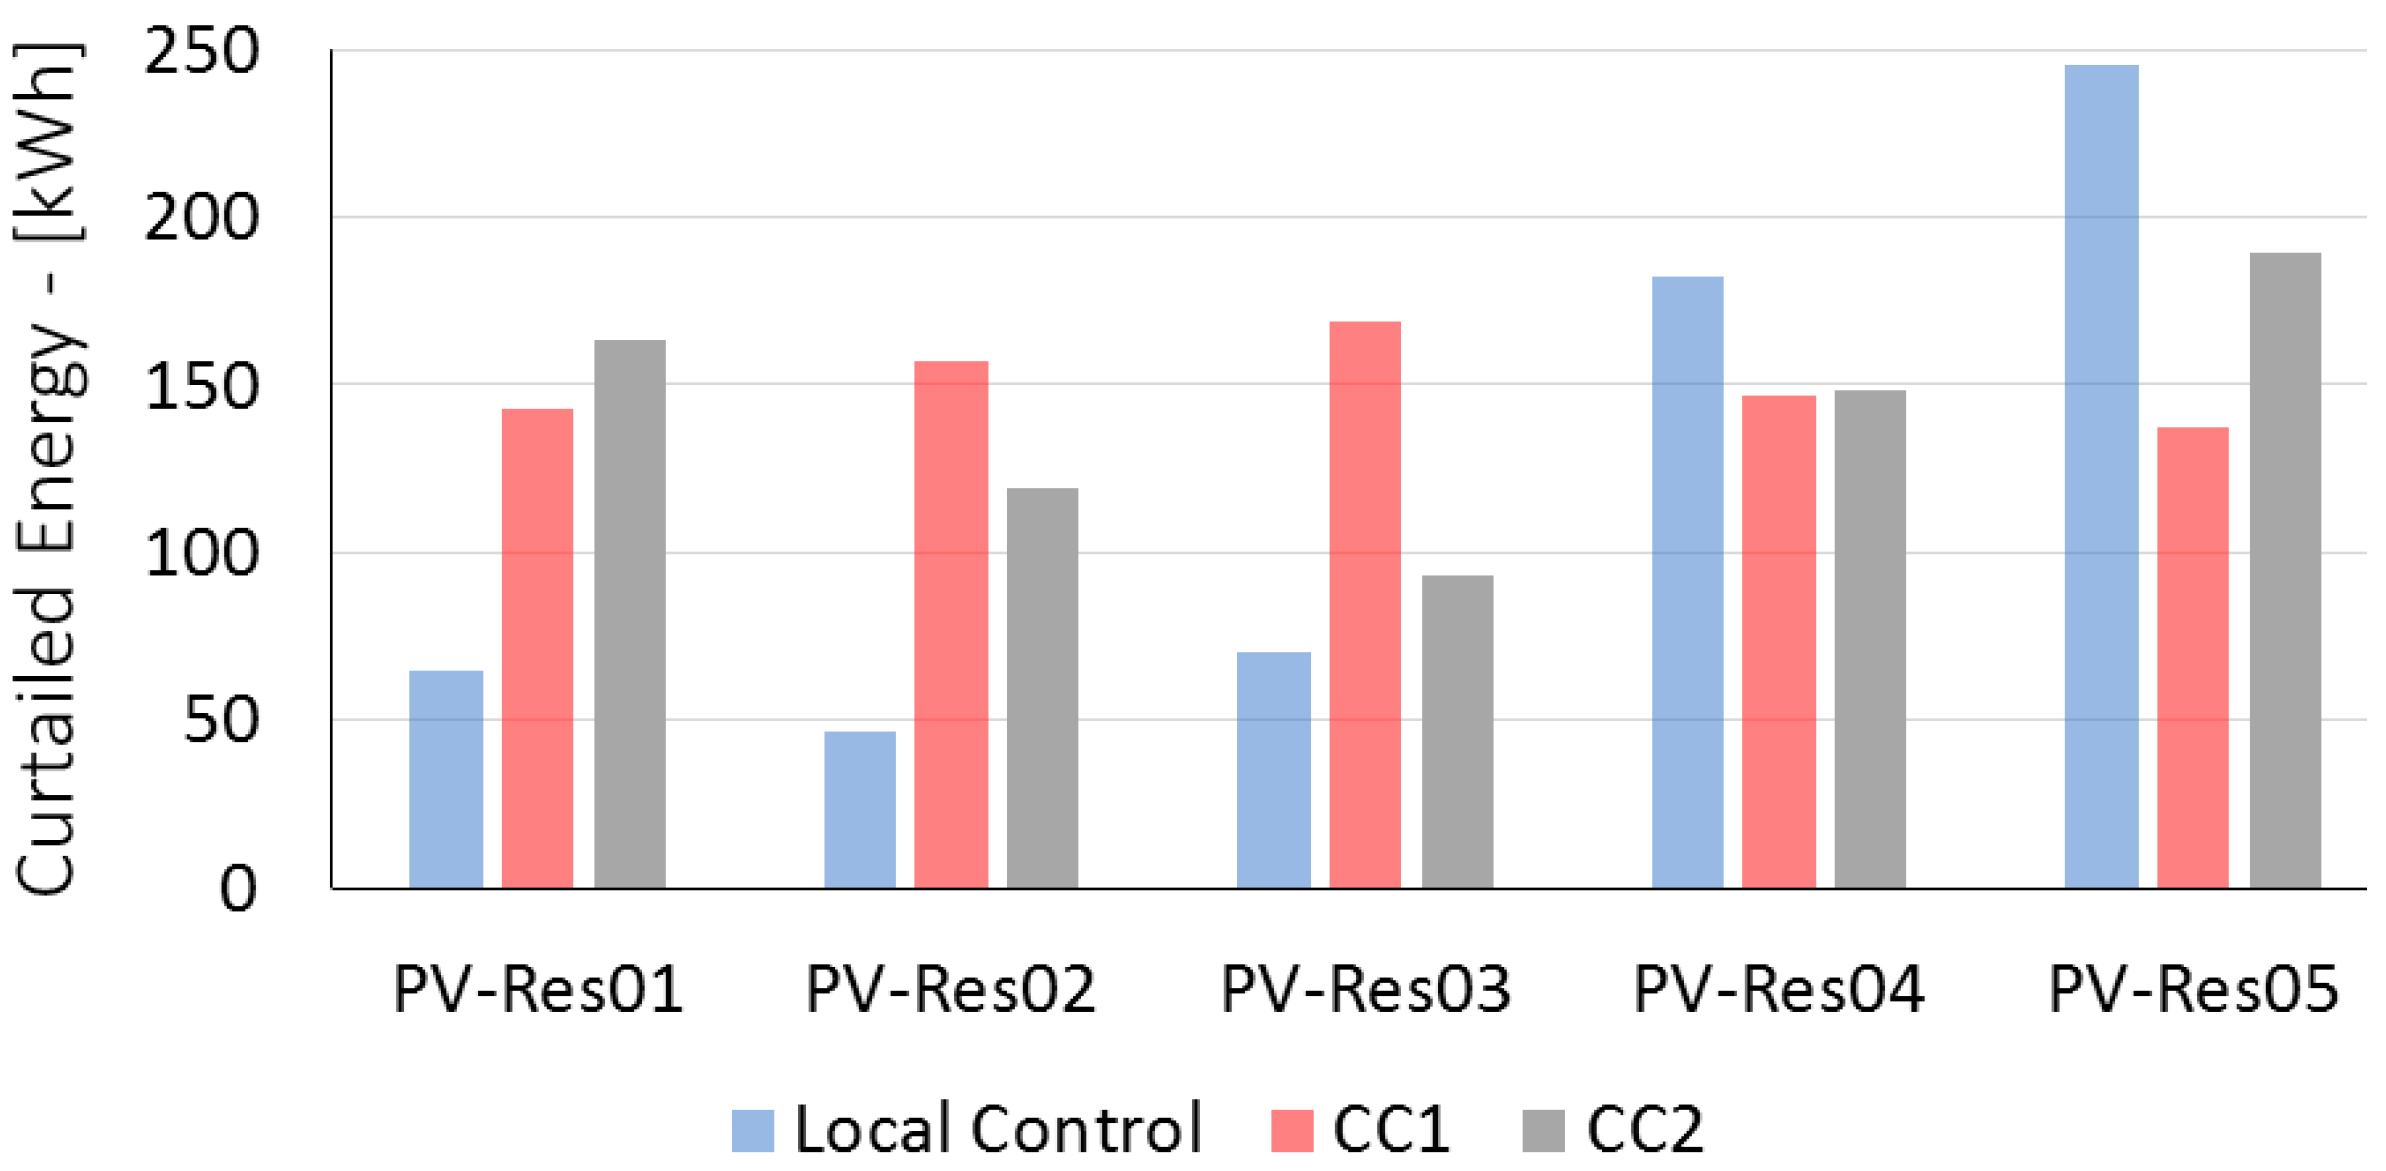
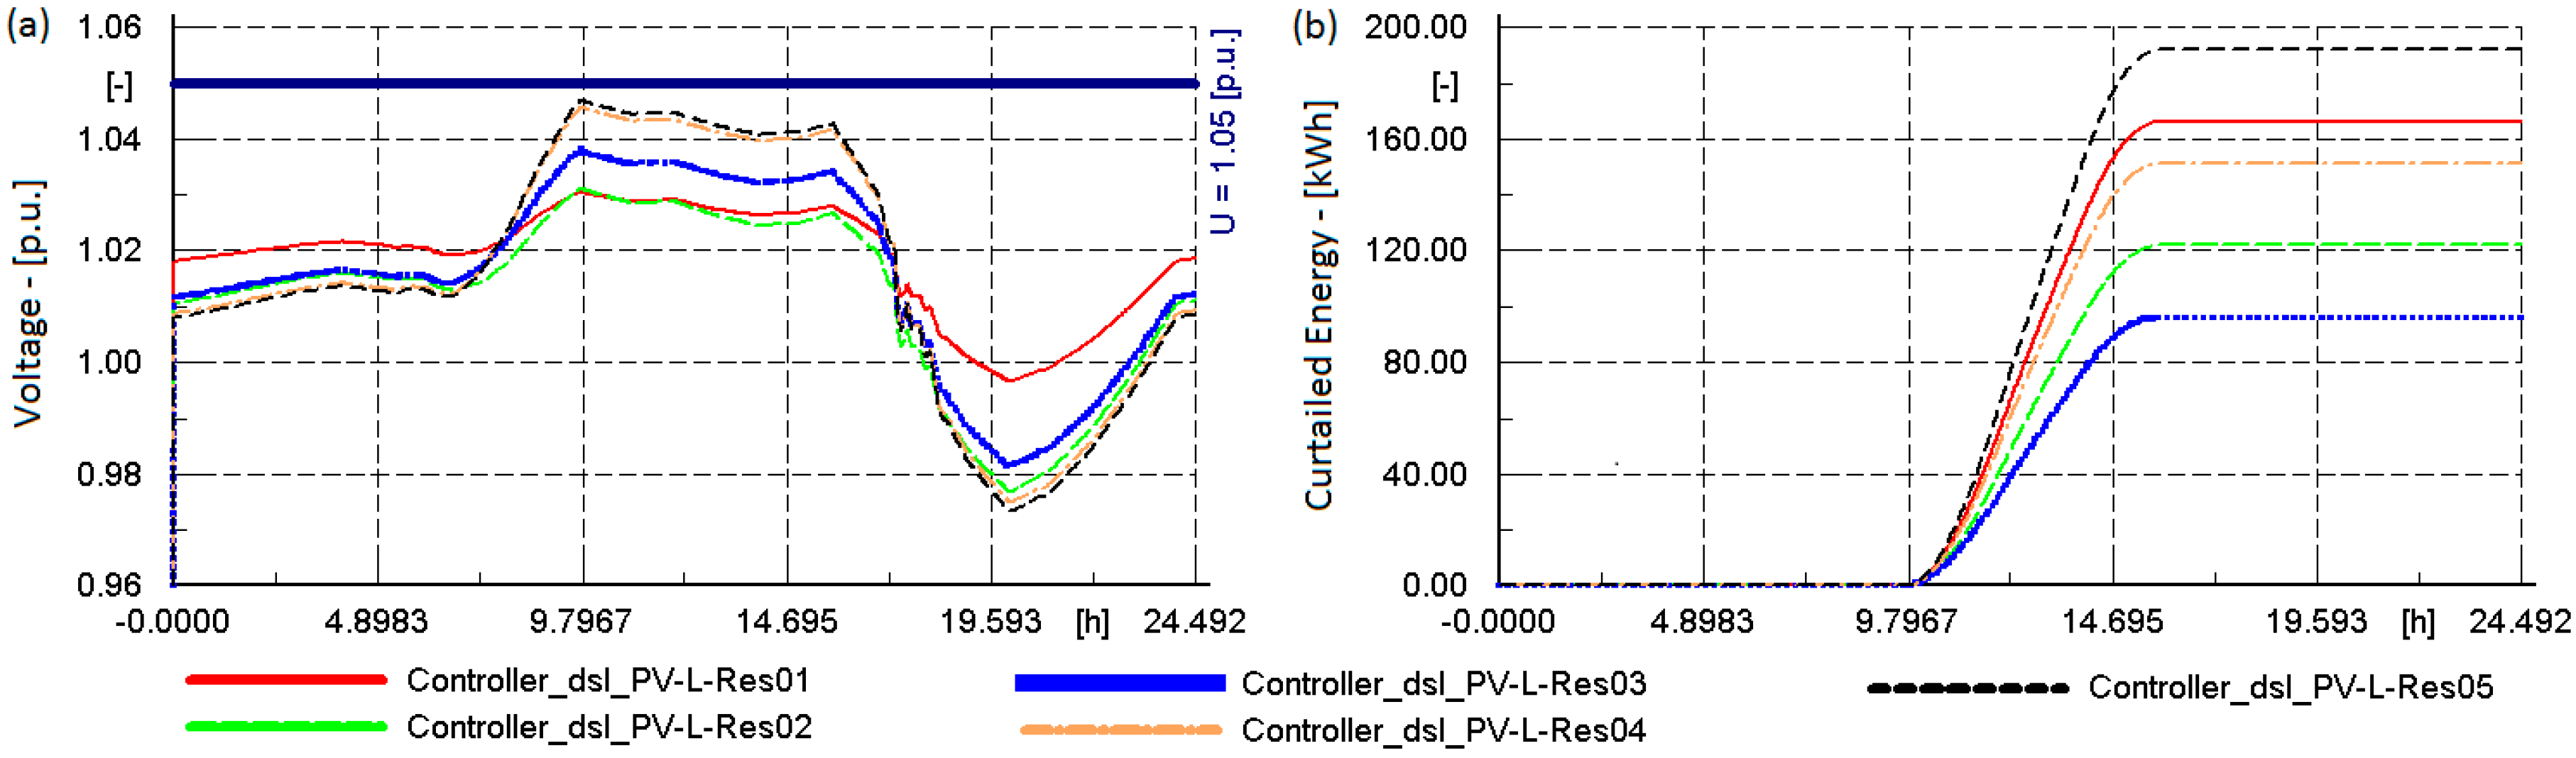
6. Results and Discussion

In the first step, local voltage sensitivities (diagonal values of the sensitivity matrix S i j ) to active power are calculated by the PV inverter using the logic presented in Figure 1. Once Calc signal is set high, inverter momentarily disconnects every 20 min 25 times. Change in output power and the voltage at the PCC is used to estimate the local sensitivity. The coordinating controller ensures no two inverters calculate the sensitivity at the same time. Figure 5 shows inverter output, voltage, and du/dp estimation results for inverter PV-Res03.
Figure 6 presents a comparison of the du/dp calculated at PV connected nodes by PowerFactory and estimated by PV inverters. The average error between the actual and the estimated value of voltage sensitivity to active power is 8.47%.
The base case results presented in Figure 7 are for PV systems without local and coordinating voltage controller. For a scenario with high PV generation and low consumption, the voltages measured at the residential feeder exceed the permissible voltage band and hence require voltage controllers for better regulation.
In this paper, two design approaches have been implemented for voltage regulation. Each approach is discussed in detail in the subsequent subsections.

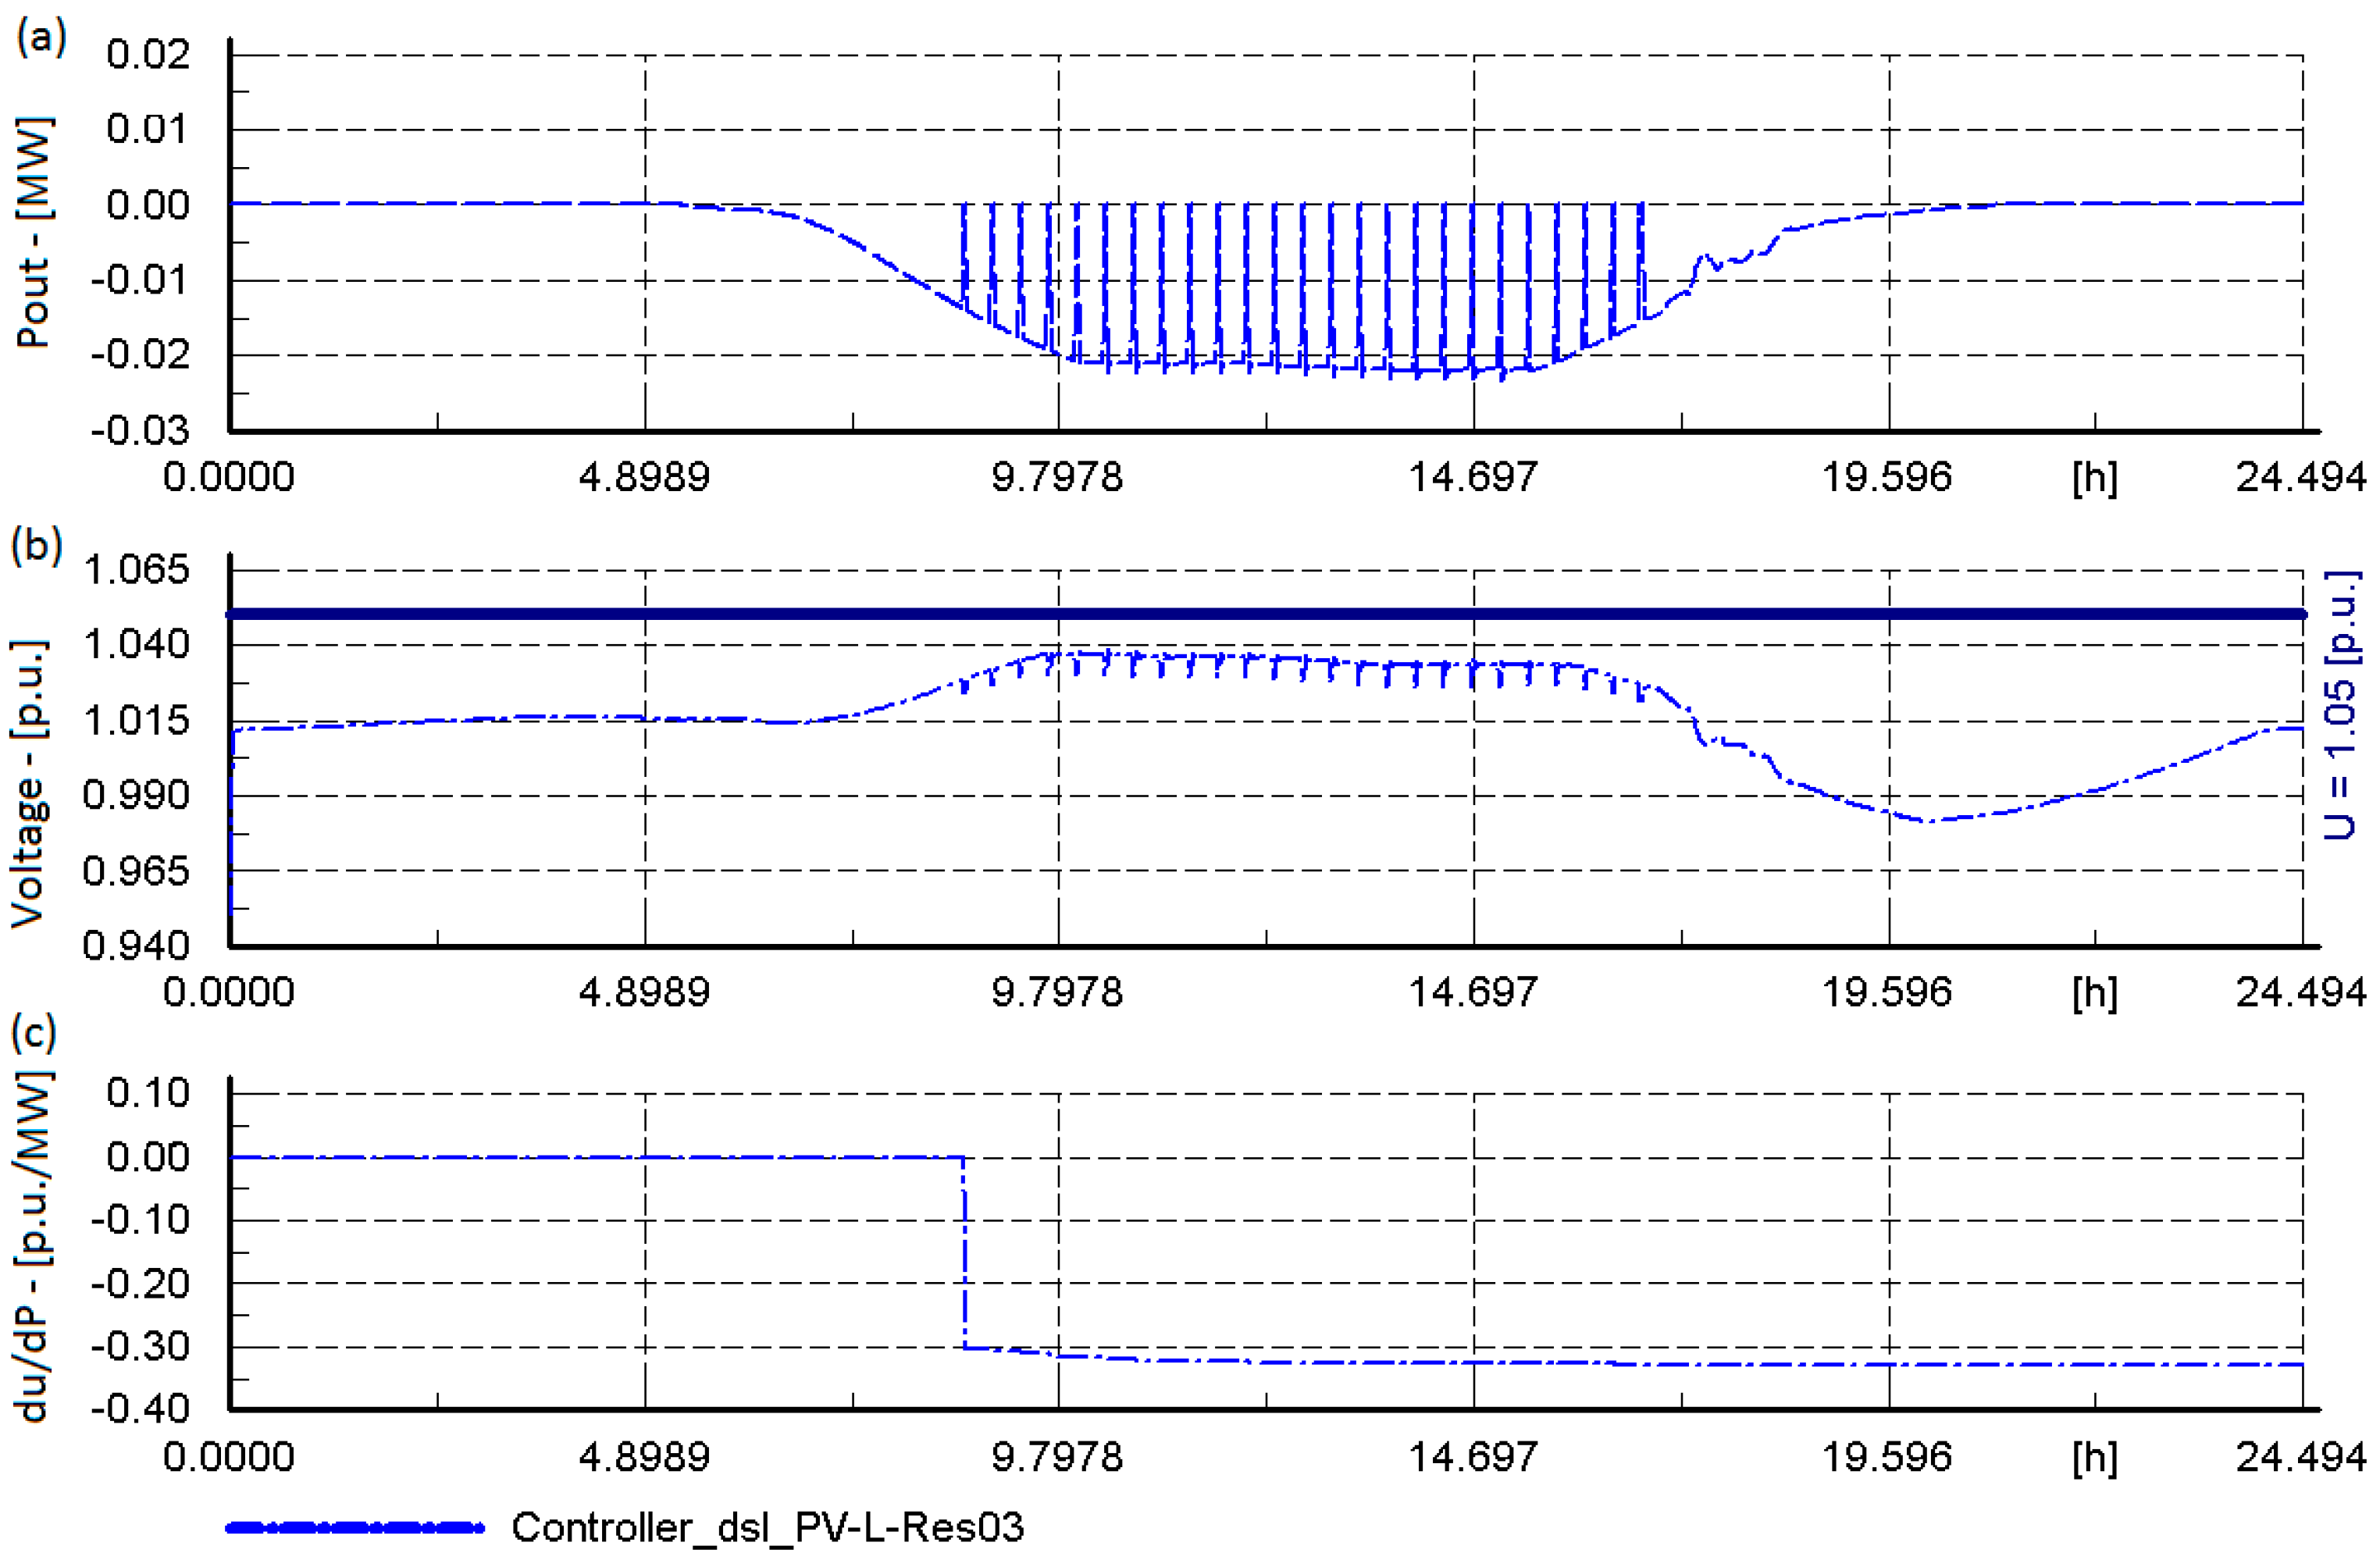
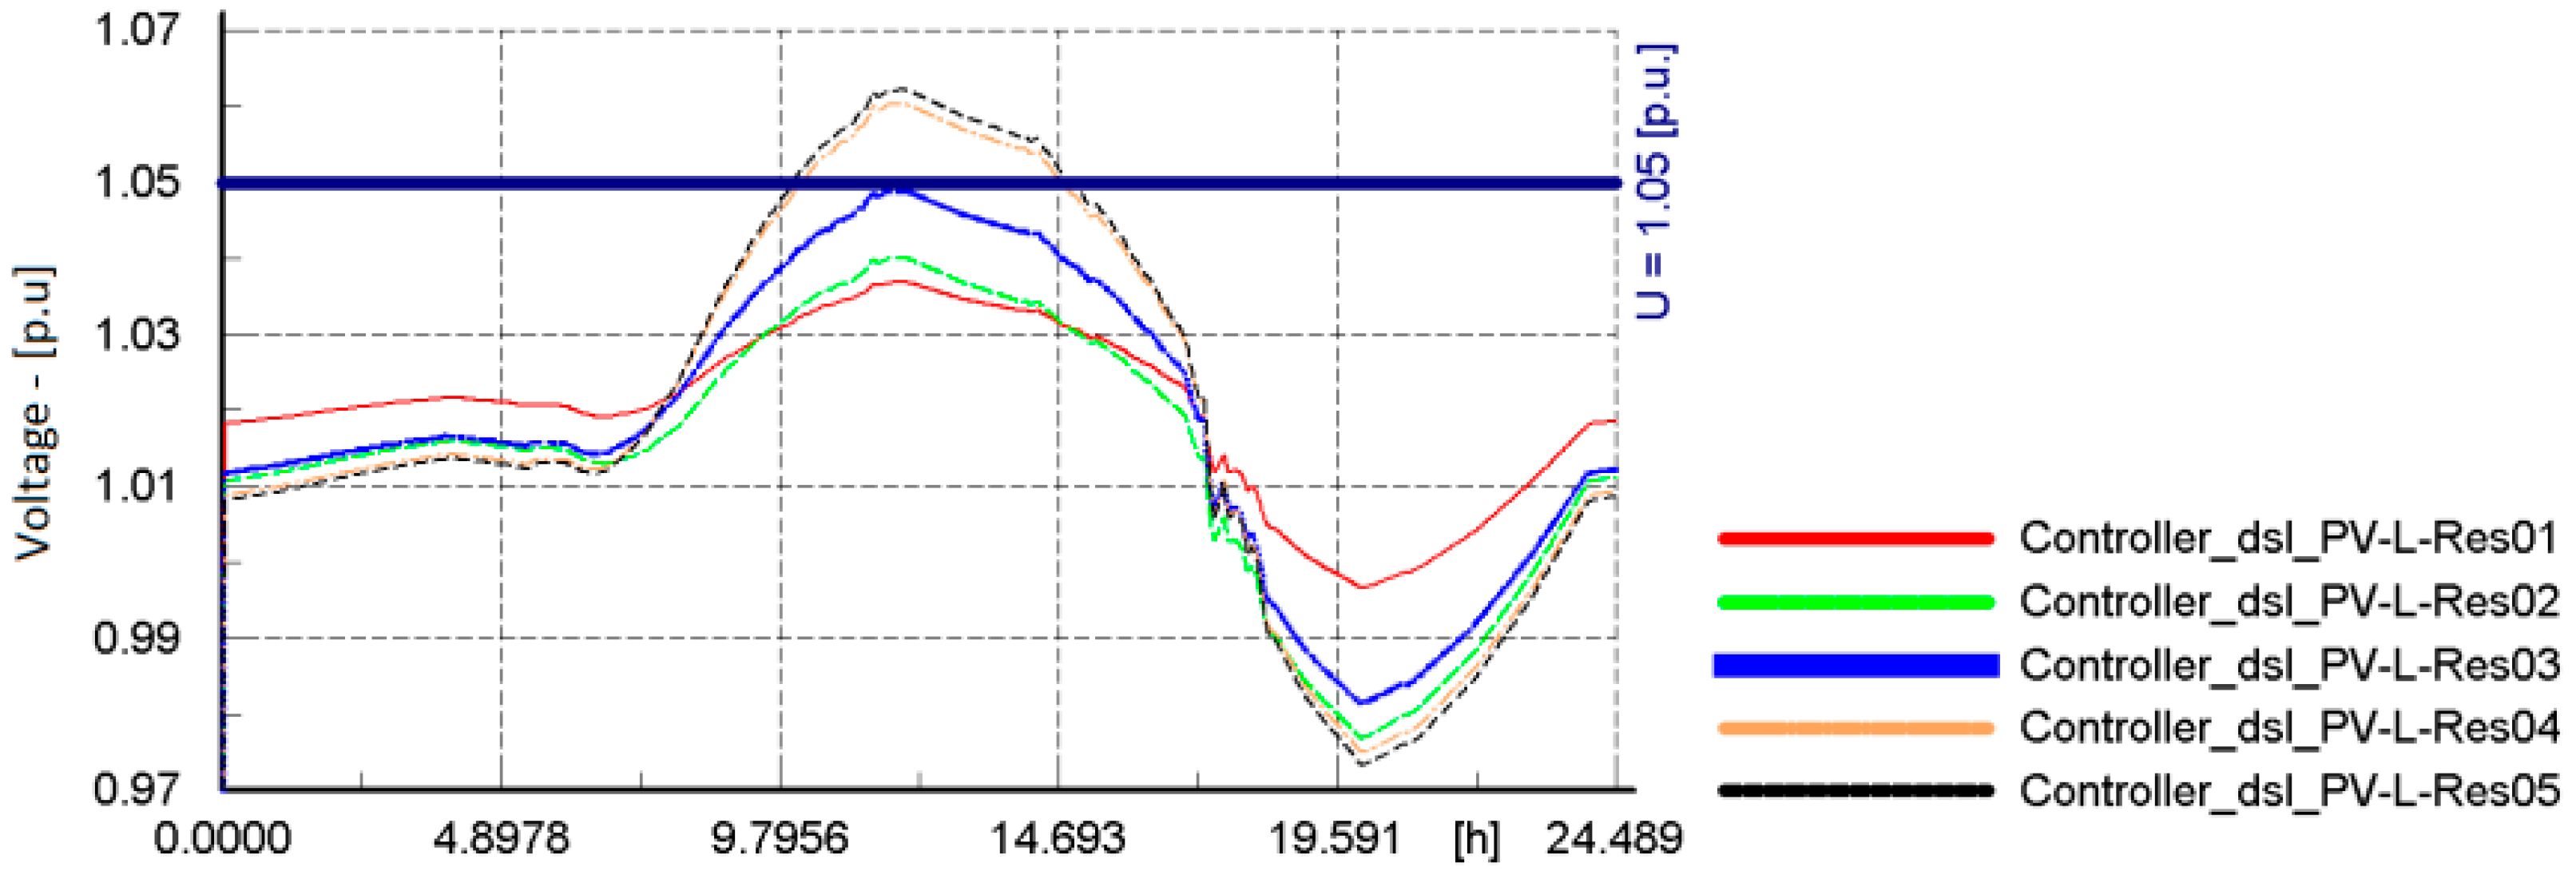
6.1. Local Voltage Regulation

In this approach, each inverter is capable of voltage regulation using APC. This approach requires only local information hence no communication is required. For the experiment, it has been assumed that maximum permissible reduction in active power output of the inverter (Pmin) is 50% of the rated power. The critical (ucri) and threshold voltages (uthr) have been set at 1.02 p.u. and 1.05 p.u. respectively for every inverter on the residential feeder. Voltage profiles for the inverters are presented in Figure 8a.
Figure 8b shows the TEC from each PV inverter. The figure shows the inherent unfairness in local APC schemes. PV inverters connected close to the transformer get significantly less energy curtailed in comparison to the ones located near the end of the feeder.

6.2. Coordinated Voltage Regulation

In this work two coordinating controller models have been implemented to minimize the two perspectives of unfairness presented in Section 3.2. Coordinating control schemes implemented in this paper require information from every PV inverter installed on the feeder, which requires a communication network. In this paper, an ideal communication channel has been assumed. For simulation purposes, the upper uub and lower ulb limits of the voltage regulation band for the coordinating controller have been set at 1.02 and 1.05, respectively.

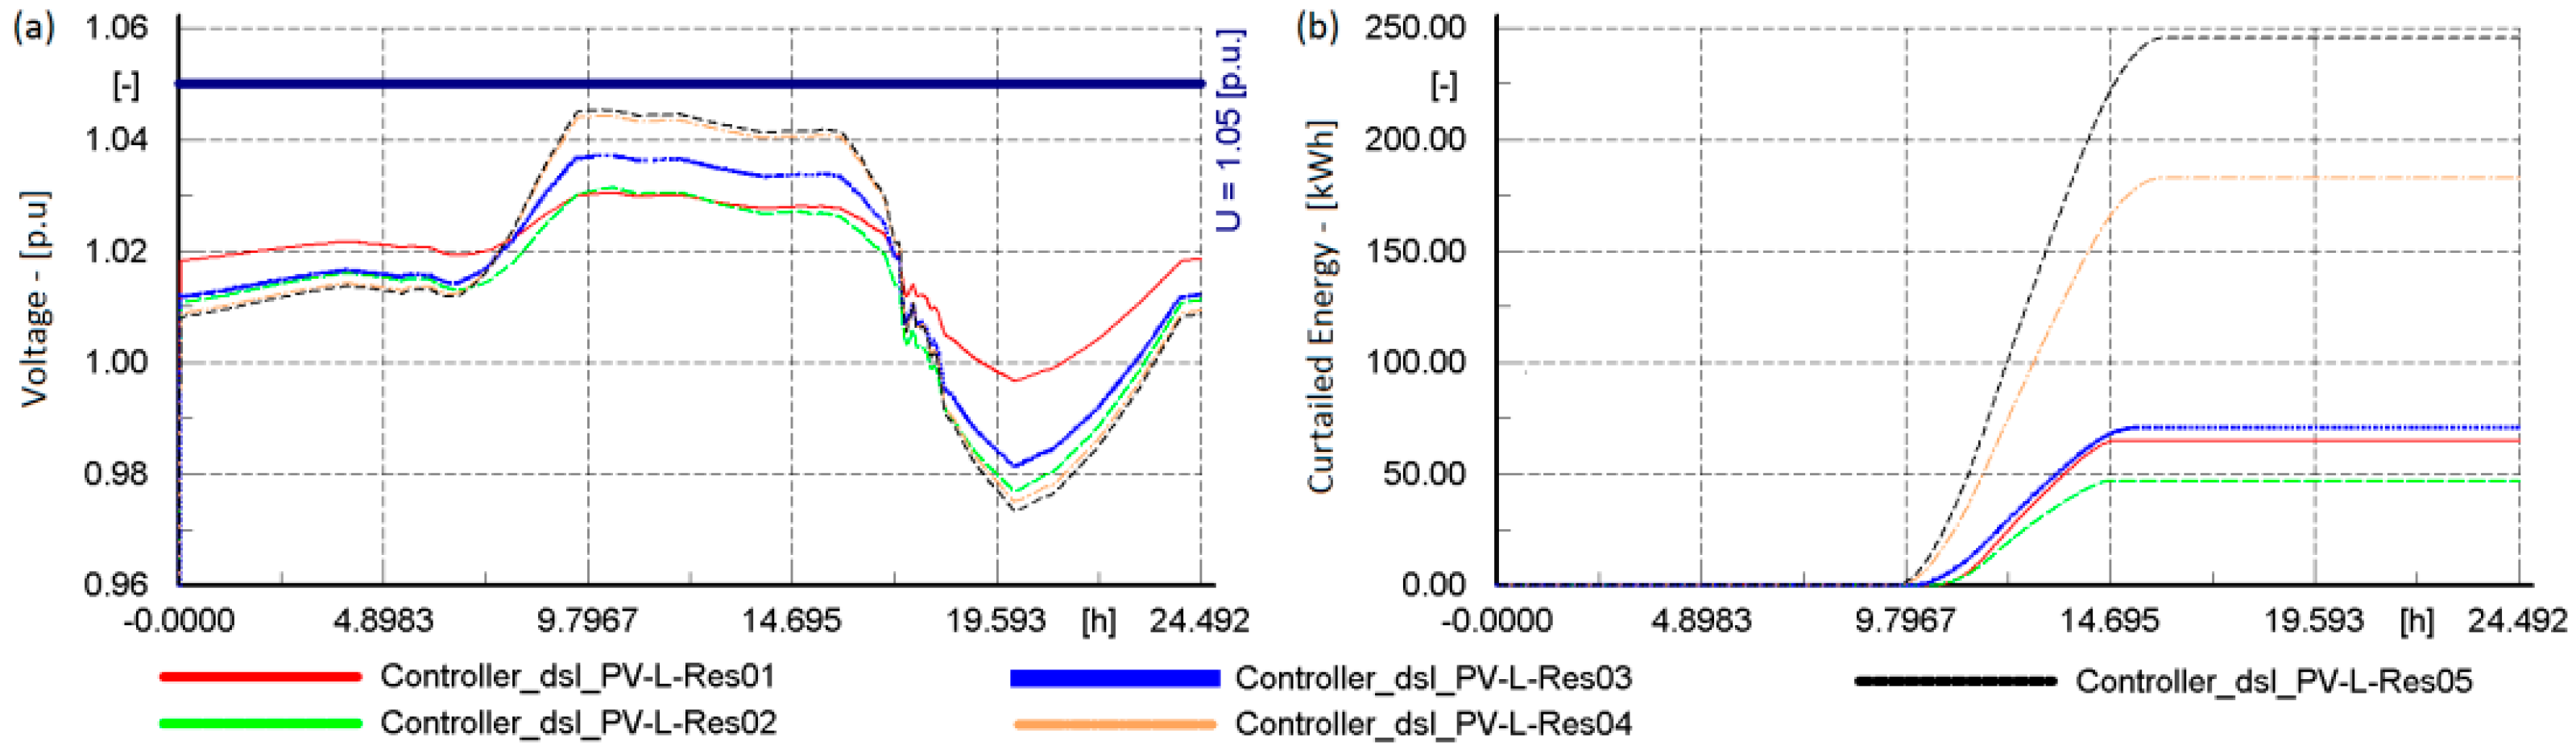
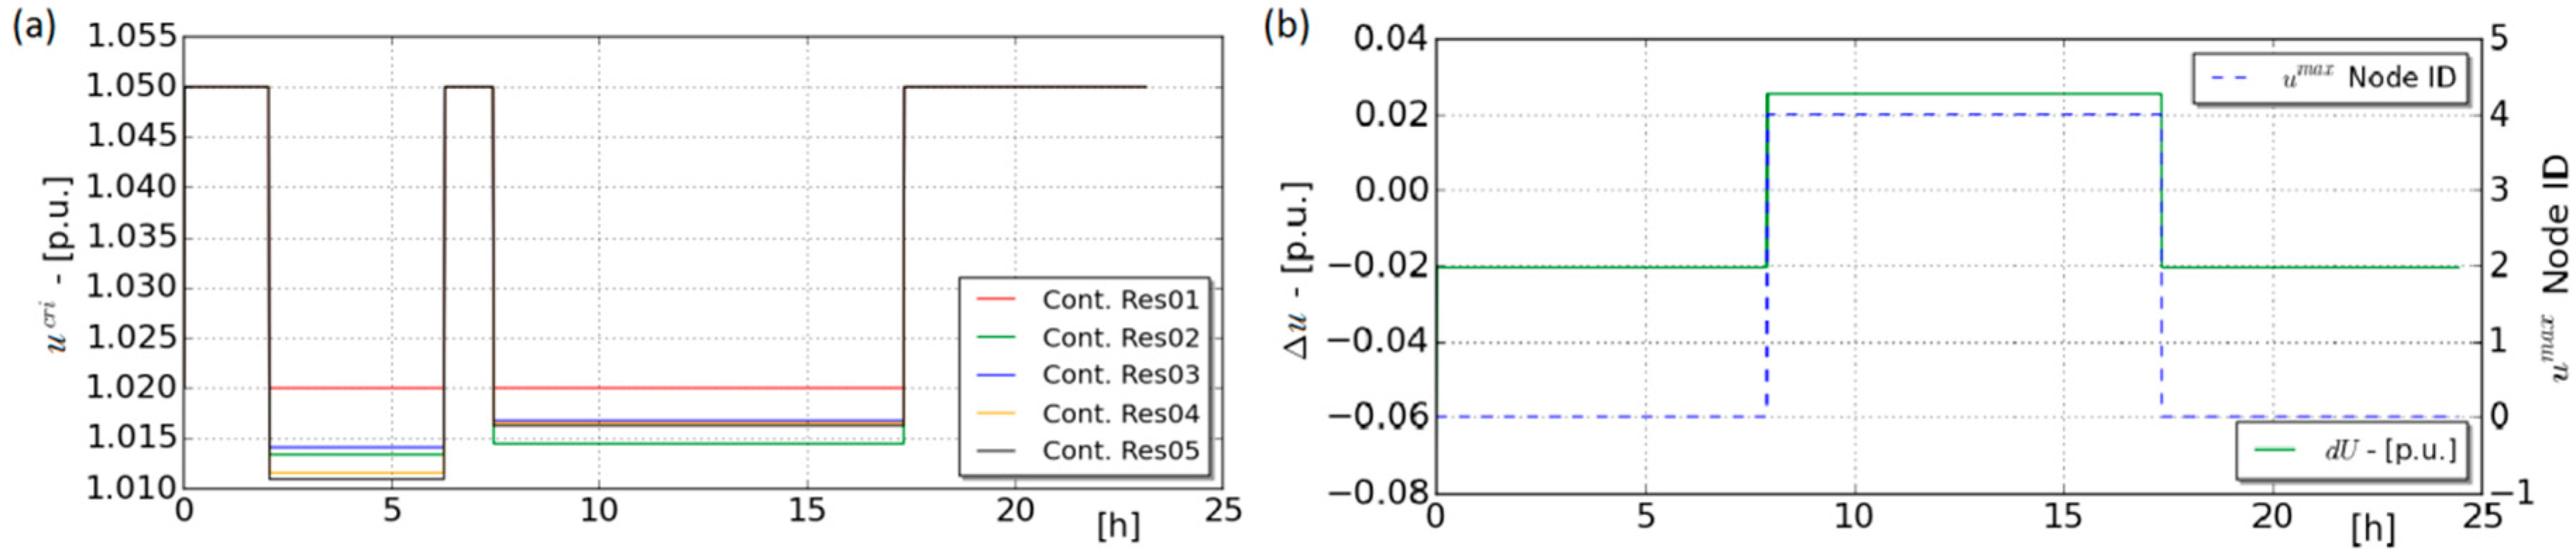
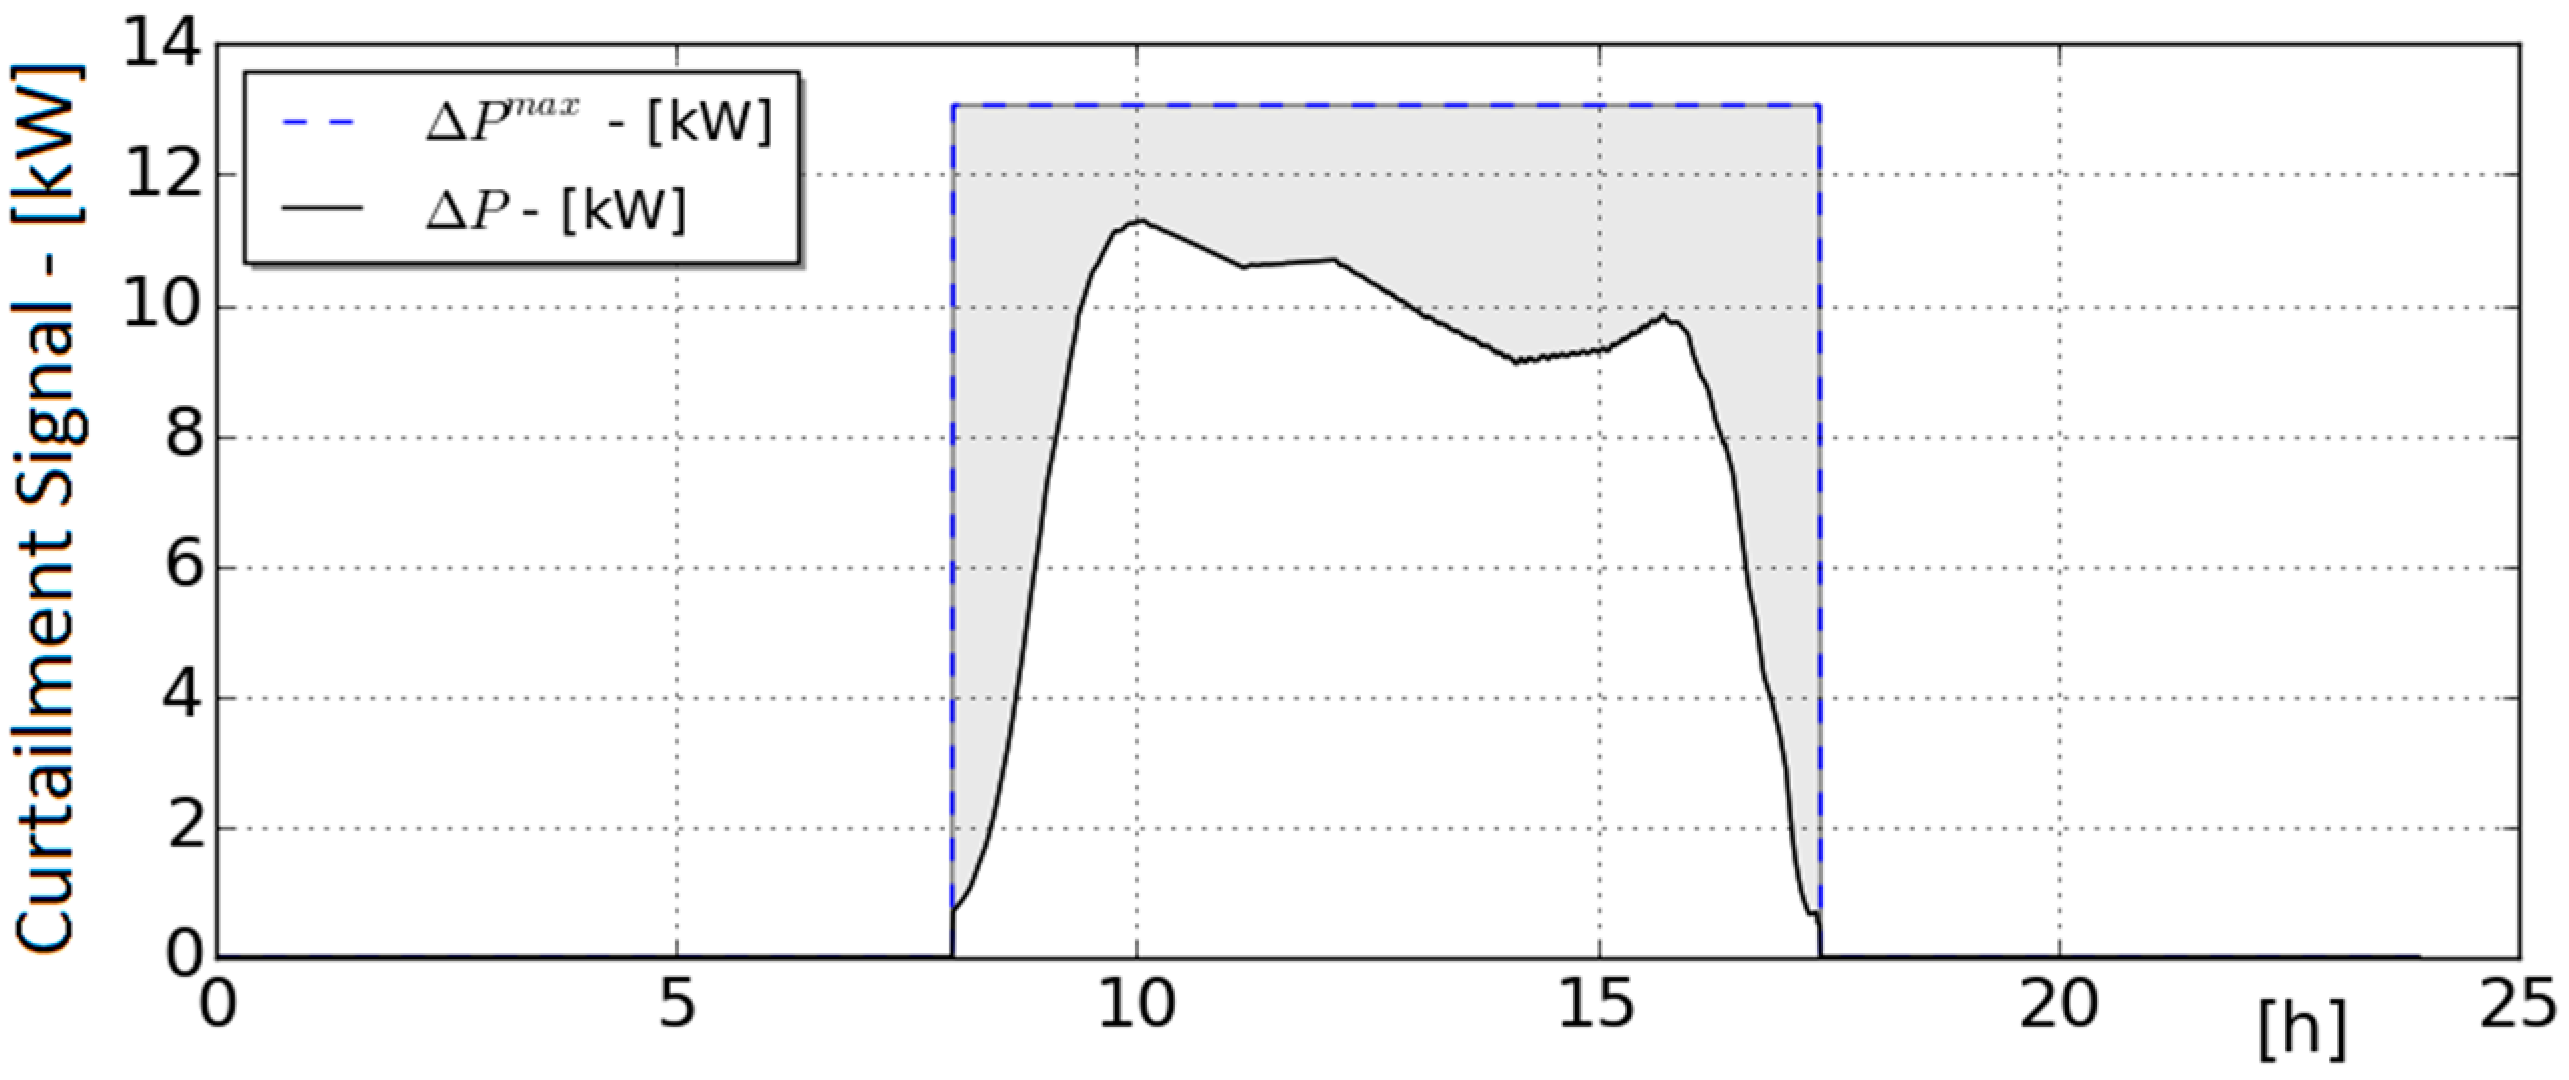
6.2.1. Equal Loss of Revenue for Each Photovoltaic Owner

The first controller (CC1) generates set points for critical voltage critical ucri in p.u. and the reduction in active power ΔP in kW. Figure 9a shows the plot of the critical voltages calculated for each PV inverter. ucri is calculated only when umax is greater than ulb, otherwise, ucri is set to 1.05 which means no APC. Figure 9b is the plot for maximum expected over voltage (∆u). It is import to note that even though umax is greater than ulb between the time 2 a.m. and 7 a.m., maximum expected voltage rise is ∆u which is less than zero for the duration, hence no power is curtailed during the above mentioned period.
The power curtailment signal (∆P) for each PV inverter is the function of the maximum permissible curtailment (∆Pmax), maximum voltage in the network (umax) and the upper and lower voltage limits. Figure 10 shows the impact of the S function used in Equations (24) and (25) on APC. As umax approaches uub, ∆P approaches ∆Pmax. This improves efficiency by minimizing unnecessary APC. It is important to note that variable A in Equation (25) can be used to adjust the slope of the S function. In this study, the value of A is 5 for all the experiments. The value of ∆P calculated by CC1 is the same for all PV inverters which ensures equal curtailment for every PV system. The use of S function reduces curtailment set point for PV installed at Res01 and reduces Ecur from 221 kWh (theoretical maximum) to 148 kWh a reduction of 32.6% (the grey shaded region in Figure 10).
Figure 11a presents the voltage profiles at PCC and curtailed energy from each PV inverter during the day. The improvement in fairness in APC is evident from Figure 11b. Every PV inverter participates equally in voltage regulation irrespective of their individual ratings.

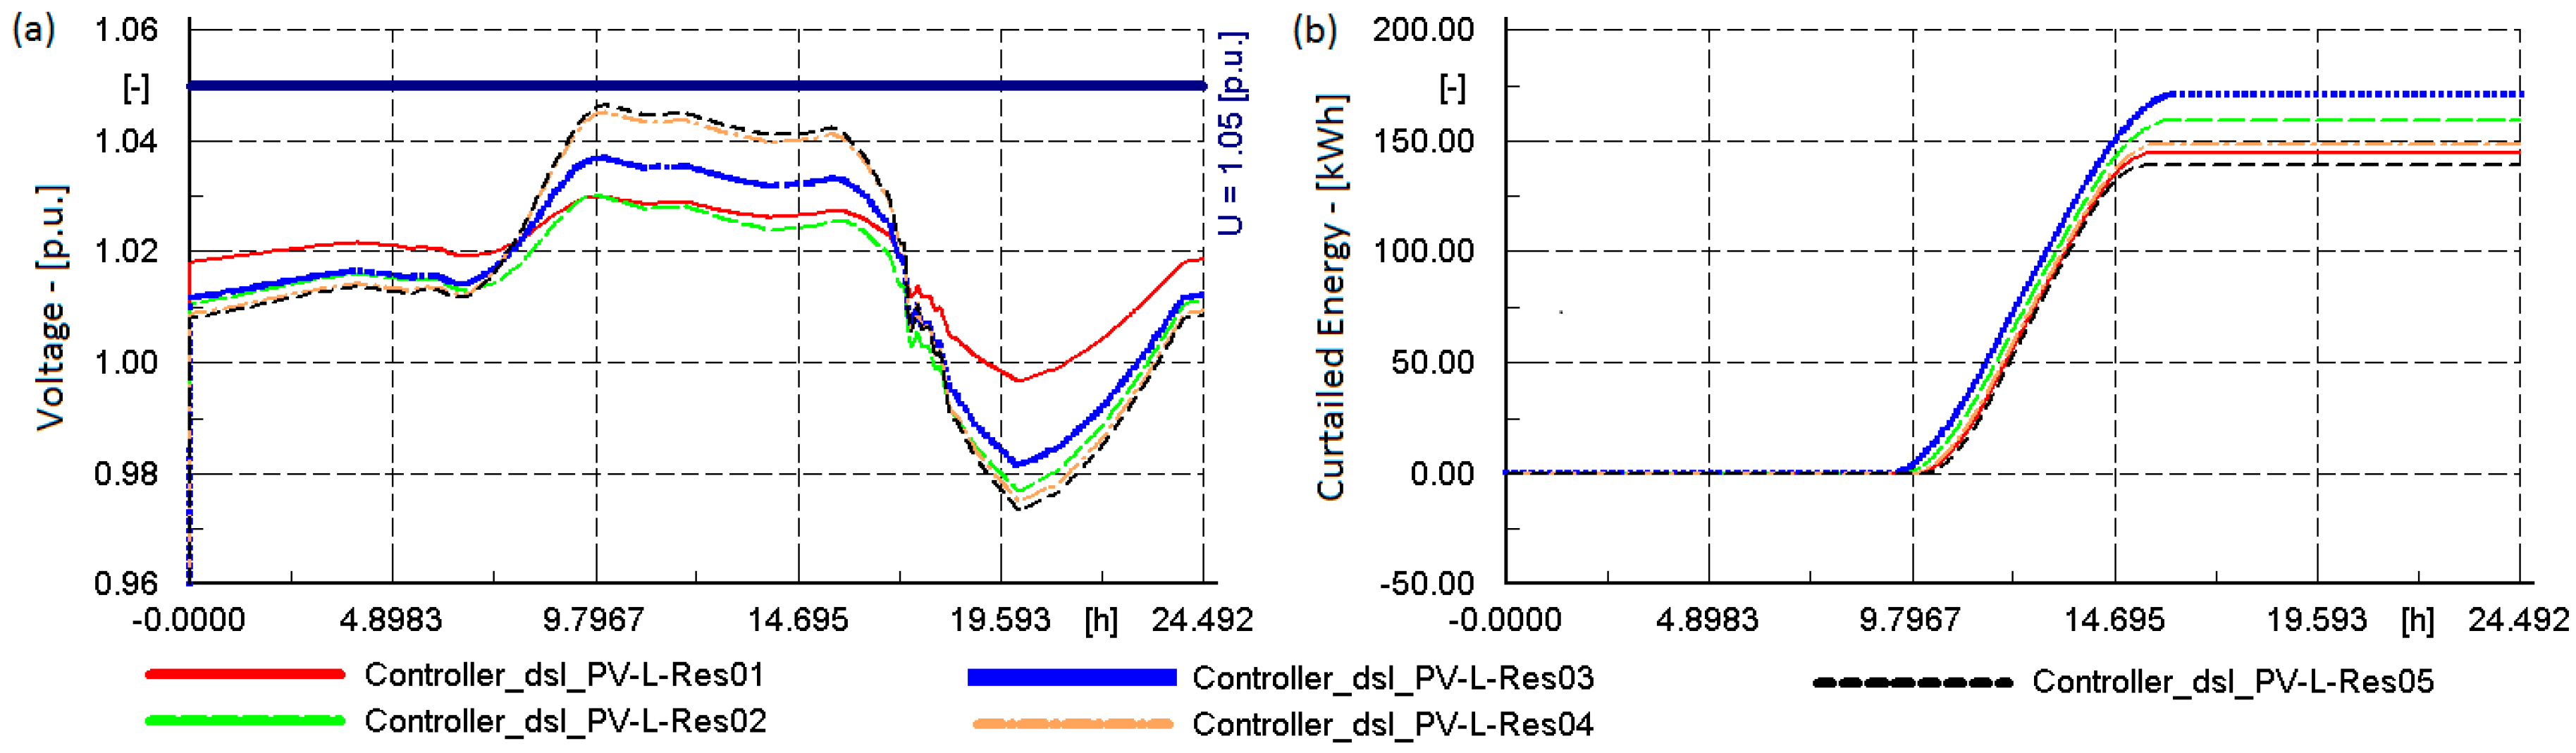
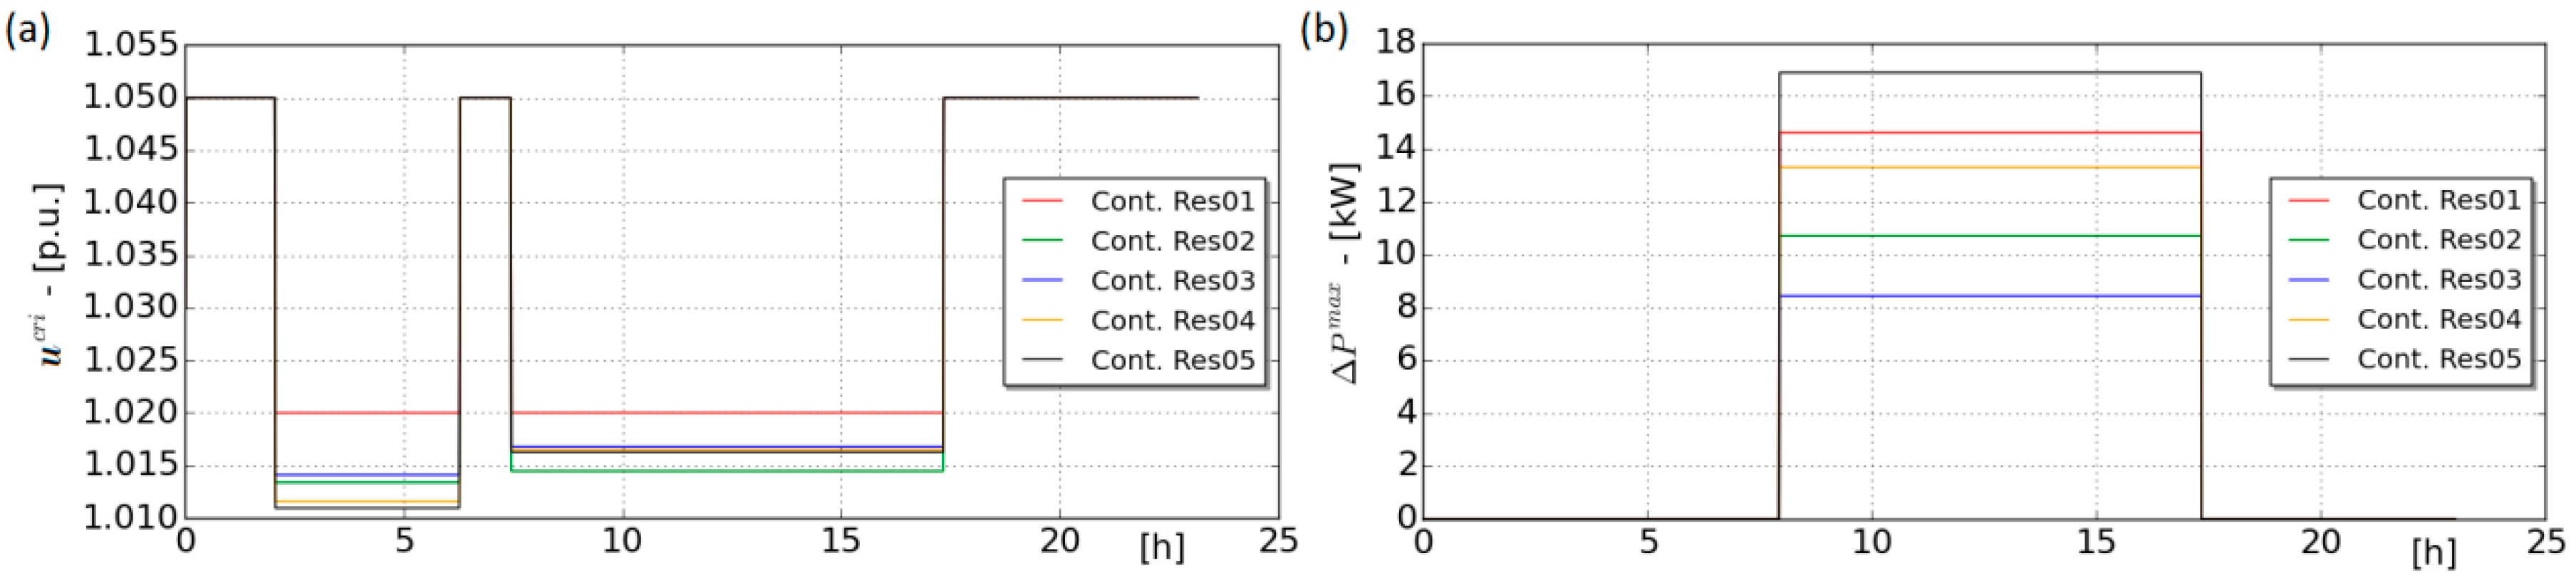
6.2.2. Equal Percentage Reduction in Revenue

The second controller (CC2) like the controller implemented for equal revenue loss also generates set points for critical voltage critical ucri in p.u. and the reduction in active power Δ P in kW. In this case however, ∆P is matrix and the set point for each inverter is a function of its rated power. Figure 12a shows critical voltages calculated for each PV inverter. Figure 12b shows maximum reduction in active power calculated for each inverter to ensure voltage remains within bounds.
For PV system installed at Res05 the TEC during the day is 193.10 kWh, 34.2% less than maximum possible curtailment. Figure 13 shows reduction in curtailment signal using S function. Figure 14 shows feeder voltage profiles and power curtailed from each PV inverter. Comparing Figure 8b, Figure 11b, and Figure 14b, impact of different control schemes on curtailed power is visible.
Figure 15 shows the energy curtailed from each PV owner for the three control schemes simulated for this work. Voltage regulation schemes using local APC are unfair to PV system owner connected near the end of the feeder. The energy curtailed from PV at Res01 is only 10.64% of the TEC from all inverters. PV at Res05 on the other hand gets 245.7 kWh curtailed which is over 40% of the total curtailed energy. It, therefore, contributes over four times more that PV at Res01 in the voltage regulation process.
In the second scenario (CC1), energy curtailed from each PV ranges between 18.2% and 22.4%. In this scenario, every PV owner contributes approximately equally in the voltage regulation process. One drawback of this scheme however, is that those PV owners with smaller ratings incur a bigger percentage decrease in revenue generated by the PV. At times of peak curtailment PV-Res05 rated at 50 kW gets 20% of the output curtailed, but PV-Res03 rated at 27 kW loses 38% of the revenue generated by the PV at peak output.
In the final scenario (CC2), energy curtailed from each PV is also a function of the rating of the PV system. Energy curtailed from each PV ranges between 13.1% and 26.5% of total curtailed energy. In this study case, All PV system owners do not participate equally in voltage regulation. However, every PV owner on the feeder loses the same percentage of revenue.
To evaluate the performance of control schemes implemented in this paper, KPI formulated in Section 3 have been calculated and listed in Table 2. Loss of green energy increases for control schemes CC1 and CC2 by 18.2% and 14.3%, respectively. CUI1 reduces by 85% for CC1 and by 57% for CC2. CC1 has negligible impact on the second unfairness index while CC2 reduces CUI2 to almost zero meaning APC for every PV owner is the same.

7. Conclusions

With increasing PV penetration in LVNs, voltage regulation is a challenge. APC is one possible solution for over voltages. PV inverters installed at feeder end are most susceptible to over voltages and are most likely to get their output power curtailed. Local APC schemes are therefore inherently unfair. In this paper, a truly plug-and-play coordinated control scheme has been implemented with two variations. Two perspectives of unfairness have been presented in the paper and two indices have been formulated to quantify the unfairness in APC schemes. The effectiveness of the control schemes has been tested by implementing network in PowerFactory and the controllers in Python. Both variants of the coordinating controllers were able to increase fairness in APC schemes significantly. As proof of concept, the proposed algorithms have been implemented on the Cigre low voltage distribution network. Results show that it is possible to improve fairness in APC but this comes at the cost of increased curtailment for PV owners. In certain scenarios, a significant increase in curtailment may make the proposed methods economically infeasible. Future work will be the implementation of the proposed algorithms on a number of LV networks to better understand the effectiveness and the limitations of the proposed schemes.

Author Contributions

Aadil Latif and Wolfgang Gawlik conceived the idea; Aadil Latif designed the experiments and performed the experiments; Wolfgang Gawlik and Peter Palensky analyzed the data and provided valuable feedback; Aadil Latif wrote the paper. Wolfgang Gawlik and Peter Palensky provided critical review.

Conflicts of Interest

The authors declare no conflict of interest.

Abbreviations

MV/HV/LVMedium voltage/high voltage/low voltage
PVPhotovoltaic
DGDistributed generator
PCCPoint of common coupling
OLTCOn-load tap changer
D-STATCOMDistribution static synchronous compensator
RPCReactive power compensation
APCActive power curtailment
LVNLow voltage network
DSODistribution system operator
KPIKey performance indices
DSLDigSILENT simulation language
CCxCoordinating controller x

References

  1. Akinyele, D.O.; Rayudu, R.K.; Nair, N.K.C. Global progress in photo voltaic technologies and the scenario of development of solar panel plant and module performance estimation—Application in Nigeria. Renew. Sustain. Energy Rev. 2015, 48, 112–139. [Google Scholar] [CrossRef]
  2. Masson, G.; Latour, M.; Rekinger, M.; Theologitis, I.T.; Papoutsi, M. Global market Outlook for Photovoltaics 2013–2017; European Photovoltaic Industry Association: Brussels, Belgium, 2013; pp. 12–32. [Google Scholar]
  3. Ali, S.; Pearsall, N.; Putrus, G. Impact of High Penetration Level of Grid-Connected Photovoltaic Systems on the UK Low Voltage Distribution Network. In Proceedings of the International Conference on Renewable Energies and Power Quality, Santiago de Compostela, Spain, 28–30 March 2012.
  4. Isle, D.; Vaziri, M.; Zarghami, M.; Vadhva, S. Review of Concepts to Increase Distributed Generation into the Distribution Network. In Proceedings of the 2014 Sixth Annual IEEE Green Technologies Conference (GreenTech), Corpus Christi, TX, USA, 3–4 April 2014.
  5. Guisado, J.; Carvalho, P.; Ferreira, L.; Santana, J.J.; Marques, G. Voltage Control Challenges and Potential Solutions for Large-Scale Integration of PV Resources in LV Networks. In Proceedings of the CIRED 2012 Workshop, Integration of Renewables into the Distribution Grid, Lisbon, Portugal, 29–30 May 2012.
  6. Gonen, T. Electric Power Distribution Engineering; CRC Press: Bota Rancon, FL, USA, 2014. [Google Scholar]
  7. Stetz, T. Autonomous Voltage Control Strategies in Distribution Grids with Photovoltaic Systems: Technical and Economic Assessment; Kassel University Press GmbH: Kassel, Germany, 2014; Volume 1. [Google Scholar]
  8. Tonkoski, R.; Lopes, L.A.; El-Fouly, T.H. Coordinated active power curtailment of grid connected PV inverters for overvoltage prevention. IEEE Trans. Sustain. Energy 2011, 2, 139–147. [Google Scholar] [CrossRef]
  9. Standard, E. Voltage Characteristics of Public Distribution Systems; EN 50160; European Committee for Electrotechnical Standardization: Brussels, Belgium, 2010. [Google Scholar]
  10. Standerd, A. For Electric Power Systems and Equipment-Voltage Ratings (60 Hz); ANSI C84. 1-2006; National Electrical Manufacturers Association: Rosslyn, VA, USA, 2006. [Google Scholar]
  11. Descheemaeker, J.; Van Lumig, M.; Desmet, J. Influence of the Supply Voltage on the Performance of Household Appliances. In Proceedings of the 23rd International Conference on Electricity Distribution, Lyon, France, 15–18 June 2015.
  12. Hashim, T.T.; Mohamed, A.; Shareef, H. A review on voltage control methods for active distribution networks. Prz. Elektrotech. 2012, 88, 304–312. [Google Scholar]
  13. Kennedy, J.; Ciufo, P.; Agalgaonkar, A. Over-Voltage Mitigation within Distribution Networks with a High Renewable Distributed Generation Penetration. In Proceedings of the 2014 IEEE International Energy Conference (ENERGYCON), Cavtat, Croatia, 13–16 May 2014.
  14. Turitsyn, K.; Sulc, P.; Backhaus, S.; Chertkov, M. Options for control of reactive power by distributed photovoltaic generators. Proc. IEEE 2011, 99, 1063–1073. [Google Scholar] [CrossRef]
  15. Olivier, F.; Aristidou, P.; Ernst, D.; van Cutsem, T. Active management of low-voltage networks for mitigating overvoltages due to photovoltaic units. IEEE Trans. Smart Grid 2015, 7, 926–936. [Google Scholar]
  16. Mojumdar, M.R.R.; Bhuiyan, A.M.W.; Kadir, H.; Shakil, M.N.H. Design & analysis of an optimized Grid-Tied PV system: Perspective Bangladesh. Int. J. Eng. Technol. 2011, 3, 435. [Google Scholar]
  17. Deshmukh, R. Grid Integration of Distributed Solar Photovoltaics (PV) in India: A Review of Technical Aspects, Best Practices and the Way forward; Prayas (Energy Group): Pune, India, 2014. [Google Scholar]
  18. Long, C.; Ochoa, L.F. Voltage control of PV-rich LV networks: OLTC-fitted transformer and capacitor banks. IEEE Trans. Power Syst. 2015, PP, 1–10. [Google Scholar] [CrossRef]
  19. Aggarwal, M.; Gupta, S.K.; Madhusudan; Kasal, G. D-STATCOM Control in Low Voltage Distribution System with Distributed Generation. In Proceedings of the 2010 3rd International Conference on Emerging Trends in Engineering and Technology (ICETET), Goa, India, 19–21 November 2010.
  20. Efkarpidis, N.; Wijnhoven, T.; Gonzalez, C.; De Rybel, T.; Driesen, J. Coordinated Voltage Control Scheme for Flemish LV Distribution Grids Utilizing OLTC Transformers and D-STATCOM’s. In Proceedings of the 12th IET International Conference on Developments in Power System Protection (DPSP 2014), Copenhagen, Denmark, 31 March–3 April 2014.
  21. Alam, M.; Muttaqi, K.; Sutanto, D. Distributed Energy Storage for Mitigation of Voltage-Rise Impact Caused by Rooftop Solar PV. In Proceedings of the 2012 IEEE Power and Energy Society General Meeting, San Diego, CA, USA, 22–26 July 2012.
  22. Alam, M.; Muttaqi, K.M.; Sutanto, D. Mitigation of rooftop solar PV impacts and evening peak support by managing available capacity of distributed energy storage systems. IEEE Trans. Power Syst. 2013, 28, 3874–3884. [Google Scholar] [CrossRef]
  23. Safitri, N.; Shahnia, F.; Masoum, M. Coordination of Single-Phase Rooftop PVs to Regulate Voltage Profiles of Unbalanced Residential Feeders. In Proceedings of the 2014 Australasian Universities, Power Engineering Conference (AUPEC), Perth, Australia, 28 September–1 October 2014.
  24. Vovos, P.N.; Kiprakis, A.E.; Wallace, A.R.; Harrison, G.P. Centralized and distributed voltage control: Impact on distributed generation penetration. IEEE Trans. Power Syst. 2007, 22, 476–483. [Google Scholar] [CrossRef]
  25. Vandoorn, T.; De Kooning, J.; Meersman, B.; Vandevelde, L. Soft Curtailment for Voltage Limiting in Low-Voltage Networks through Reactive or Active Power Droops. In Proceedings of the 2012 IEEE International Energy Conference and Exhibition (ENERGYCON), Florence, Italy, 9–12 September 2012.
  26. Mansoor, V.M.; Nguyen, P.H.; Kling, W. An Integrated Control for Overvoltage Mitigation in the Distribution Network. In Proceedings of the 2014 IEEE PES Innovative Smart Grid Technologies Conference Europe (ISGT-Europe), Istanbul, Turkey, 12–15 October 2014.
  27. Reeves, D.; Nourbakhsh, G.; Mokhtari, G.; Ghosh, A. A Distributed Control Based Coordination Scheme of Household PV Systems for Overvoltage Prevention. In Proceedings of the 2013 IEEE Power and Energy Society General Meeting (PES), Vancouver, BC, Canada, 21–25 July 2013.
  28. Lew, D.; Bird, L.; Milligan, M.; Speer, B.; Wang, X.; Carlini, E.M.; Estanqueiro, A.; Flynn, D.; Gomez-Lazaro, E.; Menemenlis, N.; et al. Wind and Solar Curtailment. In Proceedings of the International Workshop on Large-Scale Integration of Wind Power into Power Systems, Denver, CO, USA, March 2013.
  29. Castillo-Cagigal, M.; Gutierrez, A.; Monasterio-Huelin, F.; Caamano-Martin, E.; Masa, D.; Jimenez-Leube, J. A semi-distributed electric demand-side management system with PV generation for self-consumption enhancement. Energy Convers. Manag. 2011, 52, 2659–2666. [Google Scholar] [CrossRef] [Green Version]
  30. Perera, B.K.; Ciufo, P.; Perera, S. Power Sharing among Multiple Solar Photovoltaic (PV) Systems in a Radial Distribution Feeder. In Proceedings of the 2013 Australasian Universities, Power Engineering Conference (AUPEC), Hobart, Australia, 29 September–3 October 2013.
  31. Zhao, J.; Golbazi, A.; Wang, C.; Wang, Y.; Xu, L.; Lu, A.J. Optimal and Fair Real Power Capping Method for Voltage Regulation in Distribution Networks with High PV Penetration. In Proceedings of the 2015 IEEE PES General Meeting, Denver, CO, USA, 26–30 July 2015.
  32. Viyathukattuva Mohamed Ali, M.M.; Nguyen, P.H.; Kling, W.L.; Chrysochos, A.I.; Papadopoulos, T.A.; Papagianni, G.K. Fair Power Curtailment of Distributed Renewable Energy Sources to Mitigate Overvoltages in Low-Voltage Networks. In Proceedings of the IEEE Eidhoven PowerTech, Eindhoven, The Netherlands, 29 June–2 July 2015.
  33. PowerFactory, D. User’s Manual Version 15; DIgSILENT GmbH: Gomaringen, Germany, 2013. [Google Scholar]
  34. Conti, S.; Greco, A.; Raiti, S. Voltage Sensitivity Analysis in MV Distribution Networks. In Proceedings of the 6th WSEAS/IASME International Conference on Electric Power Systems, High Voltages, Electric Machines, Tenerife, Spain, 16–18 December 2006.
  35. Brenna, M.; de Berardinis, E.; Carpini, L.D.; Foiadelli, F.; Paulon, P.; Petroni, P.; Sapienza, G.; Scrosati, G.; Zaninelli, D. Automatic distributed voltage control algorithm in smart grids applications. IEEE Trans. Smart Grid 2013, 4, 877–885. [Google Scholar] [CrossRef]
  36. Papathanassiou, S.; Hatziargyriou, N.; Strunz, K. A Benchmark Low Voltage Microgrid Network. In Proceedings of the CIGRE Symposium: Power Systems with Dispersed Generation, Athens, Greece, 13–16 April 2005.
  37. Sanner, M.F. Python: A programming language for software integration and development. J. Mol. Graph. Model. 1999, 17, 57–61. [Google Scholar] [PubMed]
Figure 1. Droop based active power curtailment (APC) controller with du/dp estimation logic.
Energies 09 00436 g001
Figure 2. Modified Cigre low voltage distribution network.
Energies 09 00436 g002
Figure 3. (a) Normalized load profiles; and (b) normalized profile for PVs.
Energies 09 00436 g003
Figure 4. PowerFactory and Python coupling via sockets using external dynamic link library.
Energies 09 00436 g004
Figure 5. (a) PV-Res03 inverter output; (b) voltage at point of common coupling (PCC); and (c) du/dp estimation results.
Energies 09 00436 g005
Figure 6. (a) A comparison of actual and estimated du/dp values; and (b) estimation error.
Energies 09 00436 g006
Figure 7. Voltage profiles at PCC of each inverter with no voltage control function.
Energies 09 00436 g007
Figure 8. (a) Voltage profiles at PCC of each inverter with local voltage controller; and (b) curtailed power from each inverter.
Energies 09 00436 g008
Figure 9. (a) Critical voltages calculated for each PV; and (b) maximum expected over voltage.
Energies 09 00436 g009
Figure 10. Impact of using S function on the curtailment signal.
Energies 09 00436 g010
Figure 11. (a) Voltage profiles at PCC of each inverter with CC1; and (b) curtailed energy from each inverter.
Energies 09 00436 g011
Figure 12. (a) Critical voltages calculated for each PV and (b) maximum curtailment for each inverter.
Energies 09 00436 g012
Figure 13. Impact of S function the on curtailment sent to the Inverter at Res05.
Energies 09 00436 g013
Figure 14. (a) Voltage profiles at PCC of each inverter with CC2 and (b) curtailed energy from each inverter.
Energies 09 00436 g014
Figure 15. Energy curtailed from each inverter for the control schemes implemented in the paper.
Energies 09 00436 g015
Table 1. Photovoltaic (PV) system installed capacity.
TypeInverter IDRating-KVA
PVPV-Res0145
PVPV-Res0233
PVPV-Res0327
PVPV-Res0441
PVPV-Res0550
Table 2. Calculated key performance indices (KPI) for the implemented control schemes. CUI: curtailment unfairness index.
KPILocalCC1CC2
TEC-kWh610.15752.42712.88
CUI1-kWh77.9911.2433.58
CUI2-h1.491.270.001

