Article

Modeling of Production and Quality of Bioethanol Obtained from Sugarcane Fermentation Using Direct Dissolved Sugars Measurements

by
Borja Velazquez-Marti
1,*,
Sergio Pérez-Pacheco
2,
Juan Gaibor-Chávez
2 and
Paola Wilcaso
2
1
Departamento de Ingeniería Rural y Agroalimentaria, Universitat Politècnica de Valencia, Camino de Vera s/n, Valencia 46022, Spain
2
Centro de Estudios de Biomasa, Departamento de Investigación, Universidad Estatal de Bolívar, Av. Ernesto Che Guevara, Sector Alpachaca, Guaranda 092, Ecuador
*
Author to whom correspondence should be addressed.
Energies 2016, 9(5), 319; https://doi.org/10.3390/en9050319
Submission received: 30 March 2016 / Revised: 12 April 2016 / Accepted: 19 April 2016 / Published: 26 April 2016
(This article belongs to the Special Issue Urban Generation of Renewable Energy and Sustainable Cities)

Abstract

:
Bioethanol production from sugarcane represents an opportunity for urban-agricultural development in small communities of Ecuador. Despite the fact that the industry for bioethanol production from sugarcane in Brazil is fully developed, it is still considered expensive as a small rural business. In order to be able to reduce the costs of monitoring the production process, and avoid the application of expensive sensors, the aim of this research was modeling the kinetics of production of bioethanol based on direct measurements of Brix grades, instead of the concentration of alcohol, during the process of cane juice bio-fermentation with Saccharomyces cerevisiae. This avoids the application of expensive sensors that increase the investment costs. Fermentation experiments with three concentrations of yeast and two temperatures were carried out in a laboratory reactor. In each case Brix grades, amount of ethanol and alcoholic degree were measured. A mathematical model to predict the quality and production of bioethanol was developed from Brix grade measurements, obtaining an adjusted coefficient of determination of 0.97. The model was validated in a pilot plant.

1. Introduction

In 2014, United States and Brazil provided 88% of the ethanol used as fuel in the world. The Brazilian ethanol industry mainly uses sugarcane as input [1]. Using modern equipment, Brazil has developed its own technology for processing sugar cane wastes to produce ethanol, which is obtained at a very competitive price [2,3]. Although the production of ethanol from corn or cellulosic waste is less efficient than production from sugarcane, almost all U.S. ethanol is produced from those raw materials [4,5]. Although the industry for producing ethanol from sugarcane is fully developed, this can be still an opportunity for local progress in developing countries.
Work on this research was developed in Ecuador. This country has an area of 69,156 ha cultivated with sugarcane and the ethanol production industry is underdeveloped. 89% of the crop is concentrated in the Cuenca Baja del Rio Guayas (provinces of Guayas, Cañar and Los Rios), where the mills with the highest production are located: San Carlos and Valdez. At present, the Ministry Coordinator of Production, Employment and Competitiveness (MCPEC) is attempting to favor economic development by implementing a biofuel industry in Ecuador as a way to improve local economies. For the development of this process, the MCPEC has implemented artisanal rural mills for the production of fuel from anhydrous ethanol [6].
In Ecuador, as in other developing countries, rural communities use artisanal processing systems; ethanol production must be carried out at very low cost to maintain the profitability of this activity. To avoid exhaustive monitoring of all critical variables, the use of simple and cheap technology is required [7,8], but consequently, the yields decrease. For this situation it is necessary to carry out studies focused on determining appropriate operating conditions, and develop mathematical models to predict the process behavior. This would allow controlling the production of bioethanol, without direct measurements of all variables with expensive sensors, therefore the profitability of artisanal production could be significantly improved [9,10]. For this reason, many researchers have begun to study affordable monitoring systems for bioprocesses, such as the use of computer sensors (soft sensors) for online measurement both for the substrate, intermediate and final products [11]. Most of them are based on molecular vibration techniques, such as near infrared (NIR) spectroscopy, Raman or fluorescence spectroscopy, or even less sophisticated measurements, such as those based on the ratio of produced gases, dissolved oxygen, pH, etc. [12,13]. Although already developed, these alternatives for monitoring and controlling fermentation processes are still not widely accessible to the Ecuadorian artisanal ethanol industry [14,15,16,17,18,19].
The influence of yeast on the performance of bioethanol production via fermentation was already studied. For example, Peña and Arango [20] evaluated the ethanol production, cell growth and substrate consumption of several Saccharomyces cerevisiae strains. Two sucrose concentrations (170 and 250 g/L) and two substrates (industrial with sugar cane molasses and synthetic with sucrose) were evaluated. Other studies have aimed to characterize the effect of some operational parameters such as pH, temperature on the fermentation efficiency of Saccharomyces cerevisiae [21,22]. Based on these studies, this paper proposes a mathematical model for the evaluation of the dissolved sugars content (measured as °Brix) to estimate the amount of alcohol produced (volume of distilled alcohol) and its quality (alcoholic strength). This was supported by experimental data from fermentation of cane juice from the Facundo Vela sector, Ecuador, under different conditions of temperature and concentration of Saccharomyces cerevisiae.

2. Material and Methods

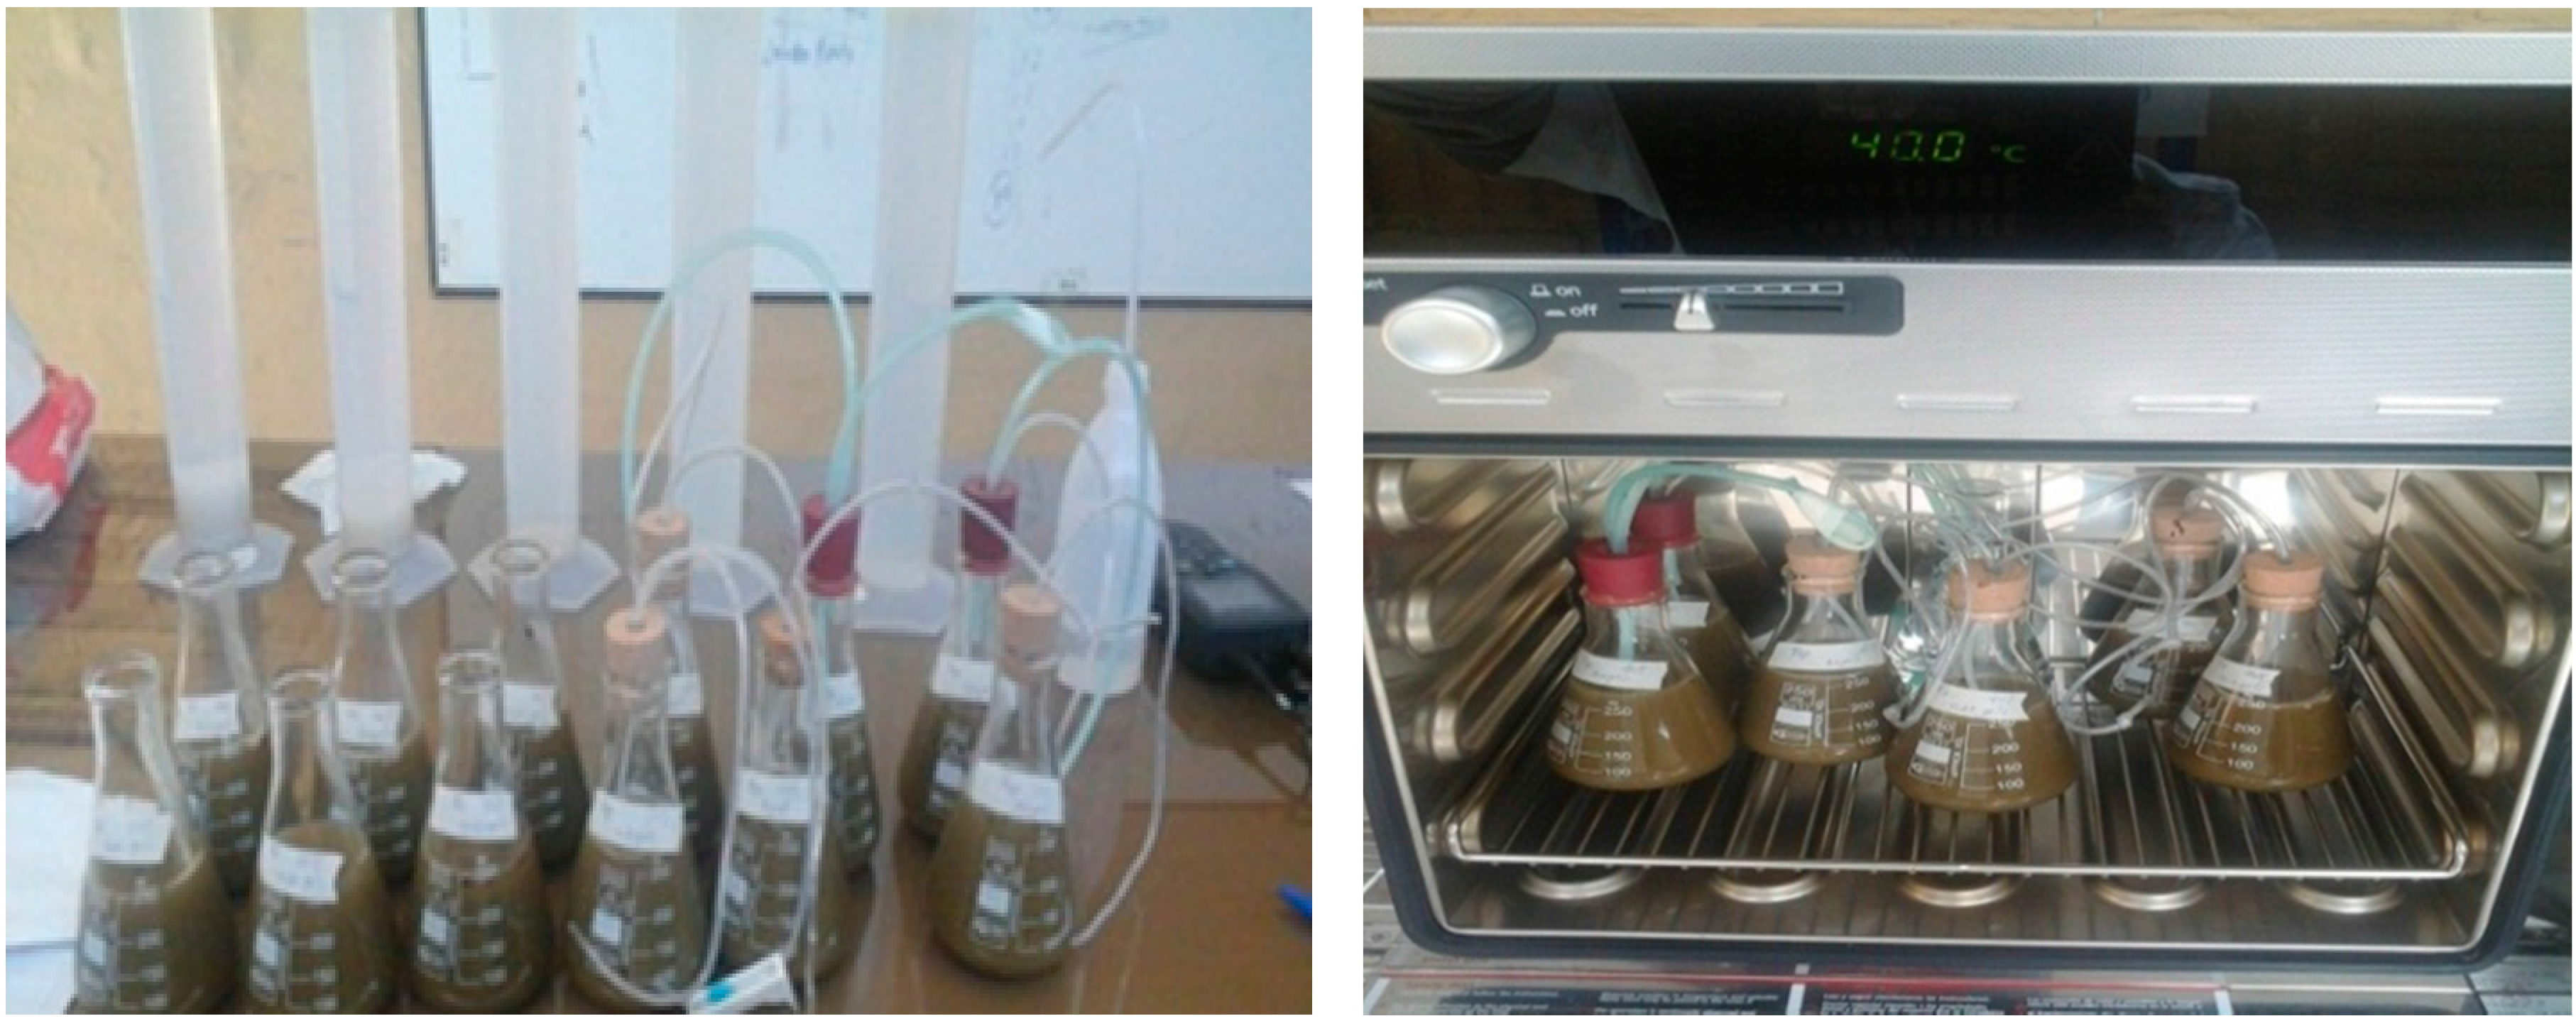
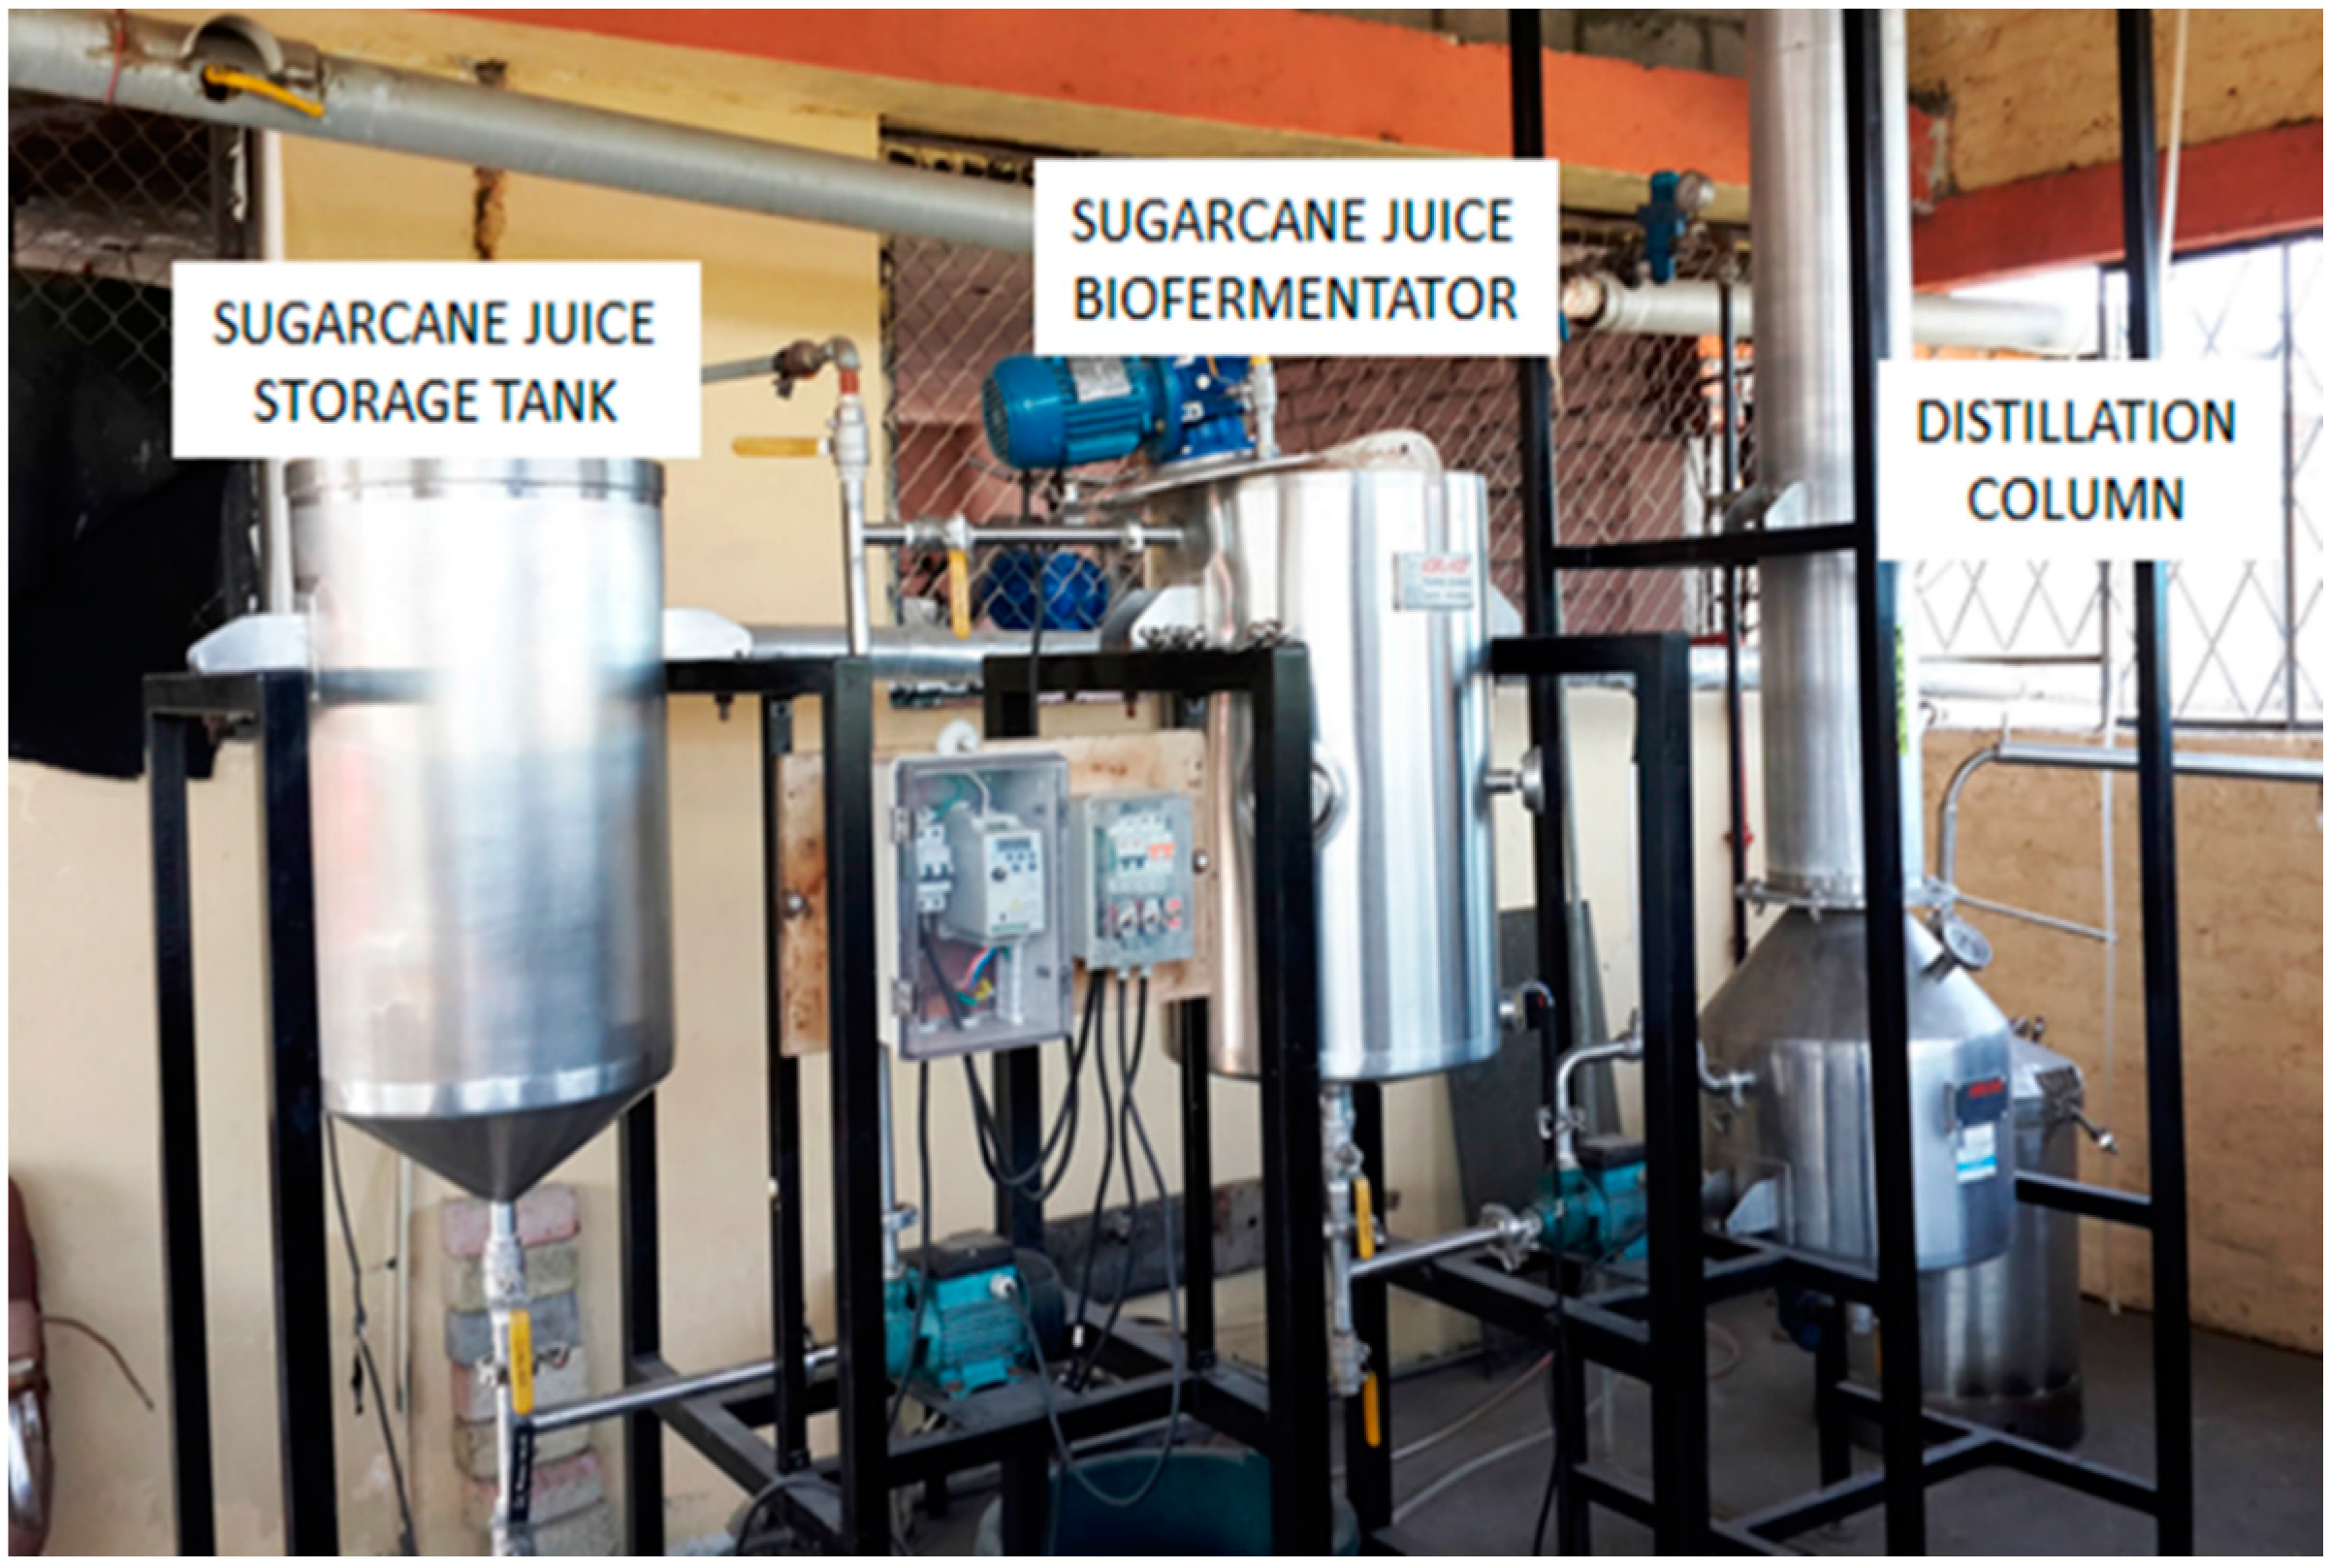
2.1. Sample Preparation

Table 1 shows the details of 45 samples that were collected from several fields at Facundo Vela (Ecuador). This region is located in the Andes. Its rainfall ranges between 1500 and 2500 mm per year. The temperature is usually between 14 °C and 23 °C. It is an area with a poor economy, mainly focused on agricultural activities, such as growing sugarcane, bananas, yuca, oranges, potatoes, or corn.
The samples were processed to extract the juice through a press, and then they were filtered. Initially juice concentration was about 17–18 °Brix. Firstly the anaerobic fermentation process was evaluated in a laboratory scale digester with 250 mL of substrate (cane juice), where the temperature and initial concentration of yeast Saccharomyces cerevisiae were analyzed. Temperature, regulated through an oven, was evaluated at two levels, 30 and 40 °C; the initial concentration of yeast was evaluated at four levels: 0.15, 0.25. 2.0 and 2.5 g·L−1; for each combination, two tests were performed. Therefore, the experimental design is defined as 2 × 4 with two repetitions. From the results, a mathematical model to predict performance and quality of the obtained product was developed.
In order to validate the accuracy of the proposed predictive model, in a second stage, additional experiments were conducted in a 25 L pilot fermenter. The same experiments were repeated at two temperatures, 30 and 40 °C, and two initial concentrations of yeast, 0.2 and 1.5 g·L−1. Figure 1 and Figure 2 show the experimental setups used in the laboratory and pilot plant trials.
During the fermentation process, °Brix measurements were performed by means of a refractometer with a range from 0° to 32 °Brix according to standard NTE INEN 2337:2008 [23]. This is indicative of the percentage of soluble sugars in cane juice. pH measurements were also performed using a potentiometer, according to standard NTE INEN 2337:2008 [23].
The measurements were recorded every four hours, until °Brix values were stabilized. Once the fermentation process was completed, the distillation of the must was carried out at a temperature between 75 and 80 °C. Then, the volume of alcohol and alcoholic strength of the obtained distillate were determined. The alcoholic strength was measured using an alcoholmeter according to the INEN 340 standard [24].

2.2. Mathematical Modeling to Predict Performance and Product Quality

To develop a predictive mathematical model of the production of bioethanol from direct measurements of °Brix, a first order kinetics according to Equation (1) was considered:
d ° B ( t ) d t = k ° B ( t )
where k is the rate constant (h1), °B(t) are the Brix degrees measured at an instant t, and t is the reaction time (h). Through the integration of Equation (1), the value of Brix degrees is obtained in the reactor for any time from its initial value (°Bo) (Equation (2)):
° B ( t ) = ° B o e k t
The volumetric fraction of alcohol ( φ ) is defined as the ratio of alcohol volume (Va) and the total volume in the reactor (V); ( φ = V a / V ). Assuming that the variation of alcohol volumetric fraction during the fermentation process is proportional to the degradation of sugars, Equation (3) is obtained:
d ( V a / V ) d t = d φ d t = β d ° B ( t ) d t
where Va is the volume of alcohol obtained after the distillation process and V the volume of cane juice used. From Equations (1)–(3) the variation of alcohol volumetric fraction is obtained (Equation (4)):
d φ d t = β k ° B o e k t
by integration of Equation (4) the expression for calculating the volume of alcohol produced during fermentation of sugarcane juice is obtained (Va). For the purposes of the model, it is initially considered that the volume of alcohol present in the juice is negligible. Therefore, Equation (5) is obtained:
V a = V β ° B o ( 1 e k t )

3. Results and Discussion

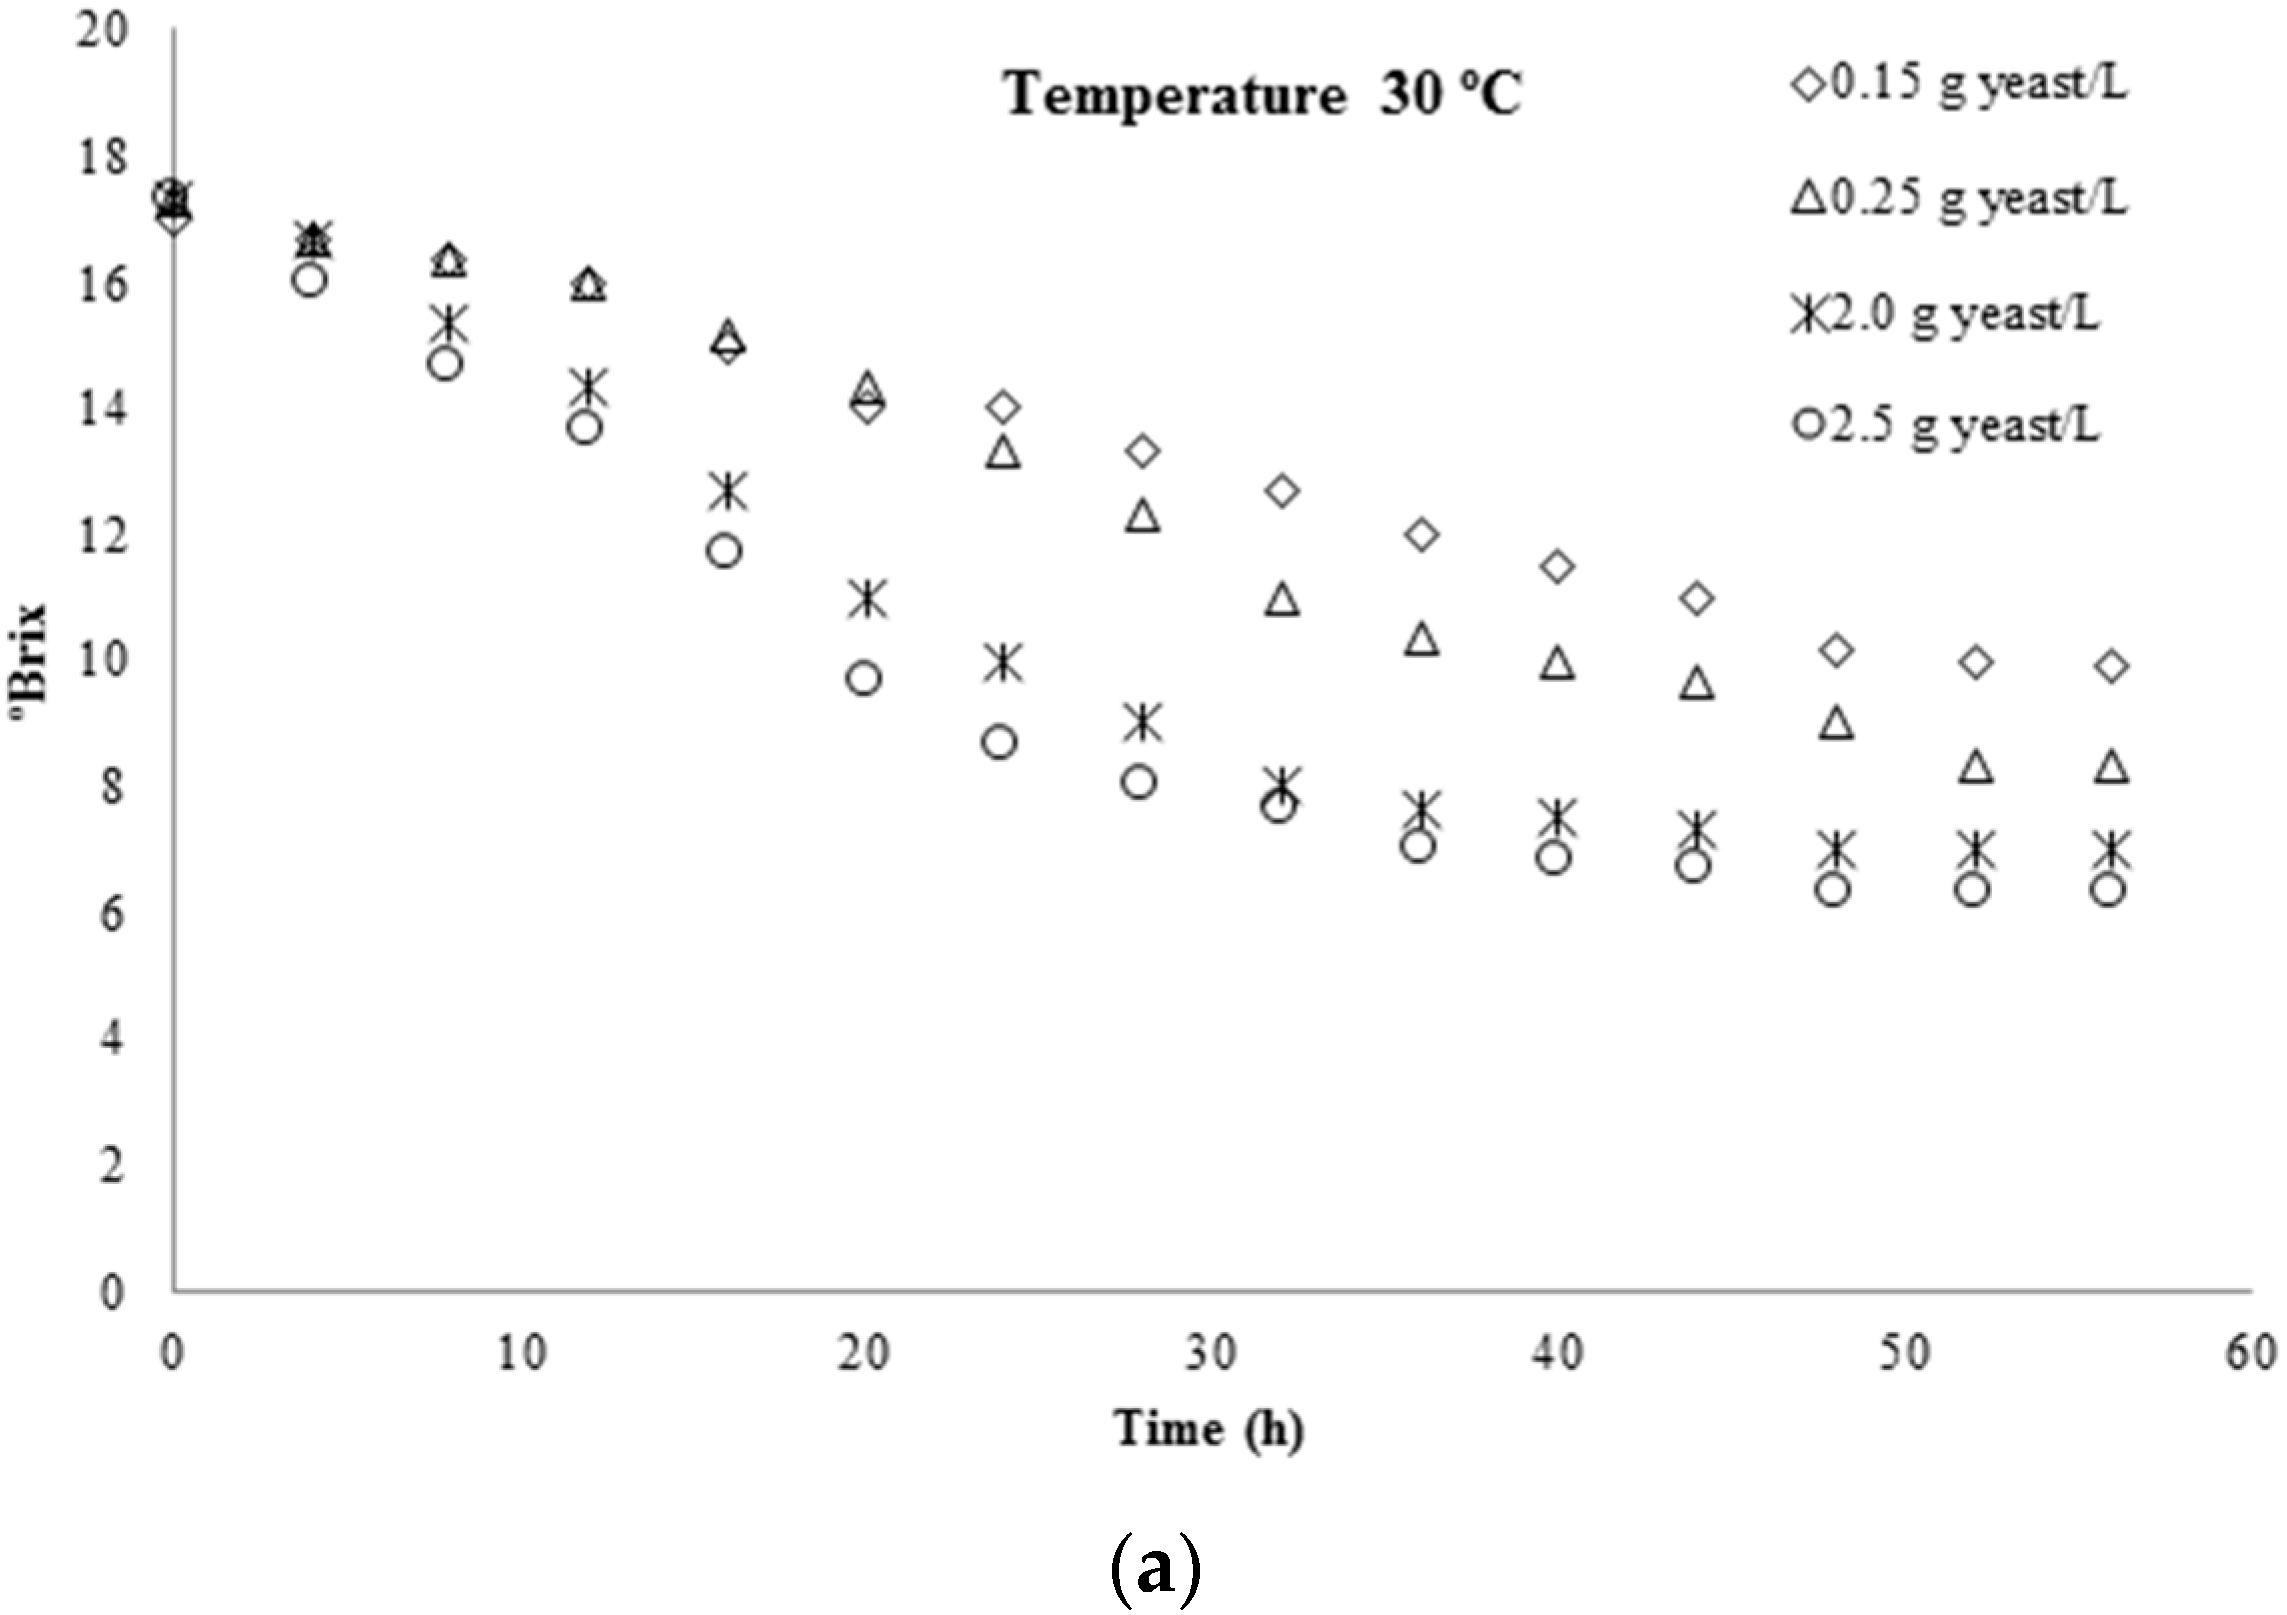
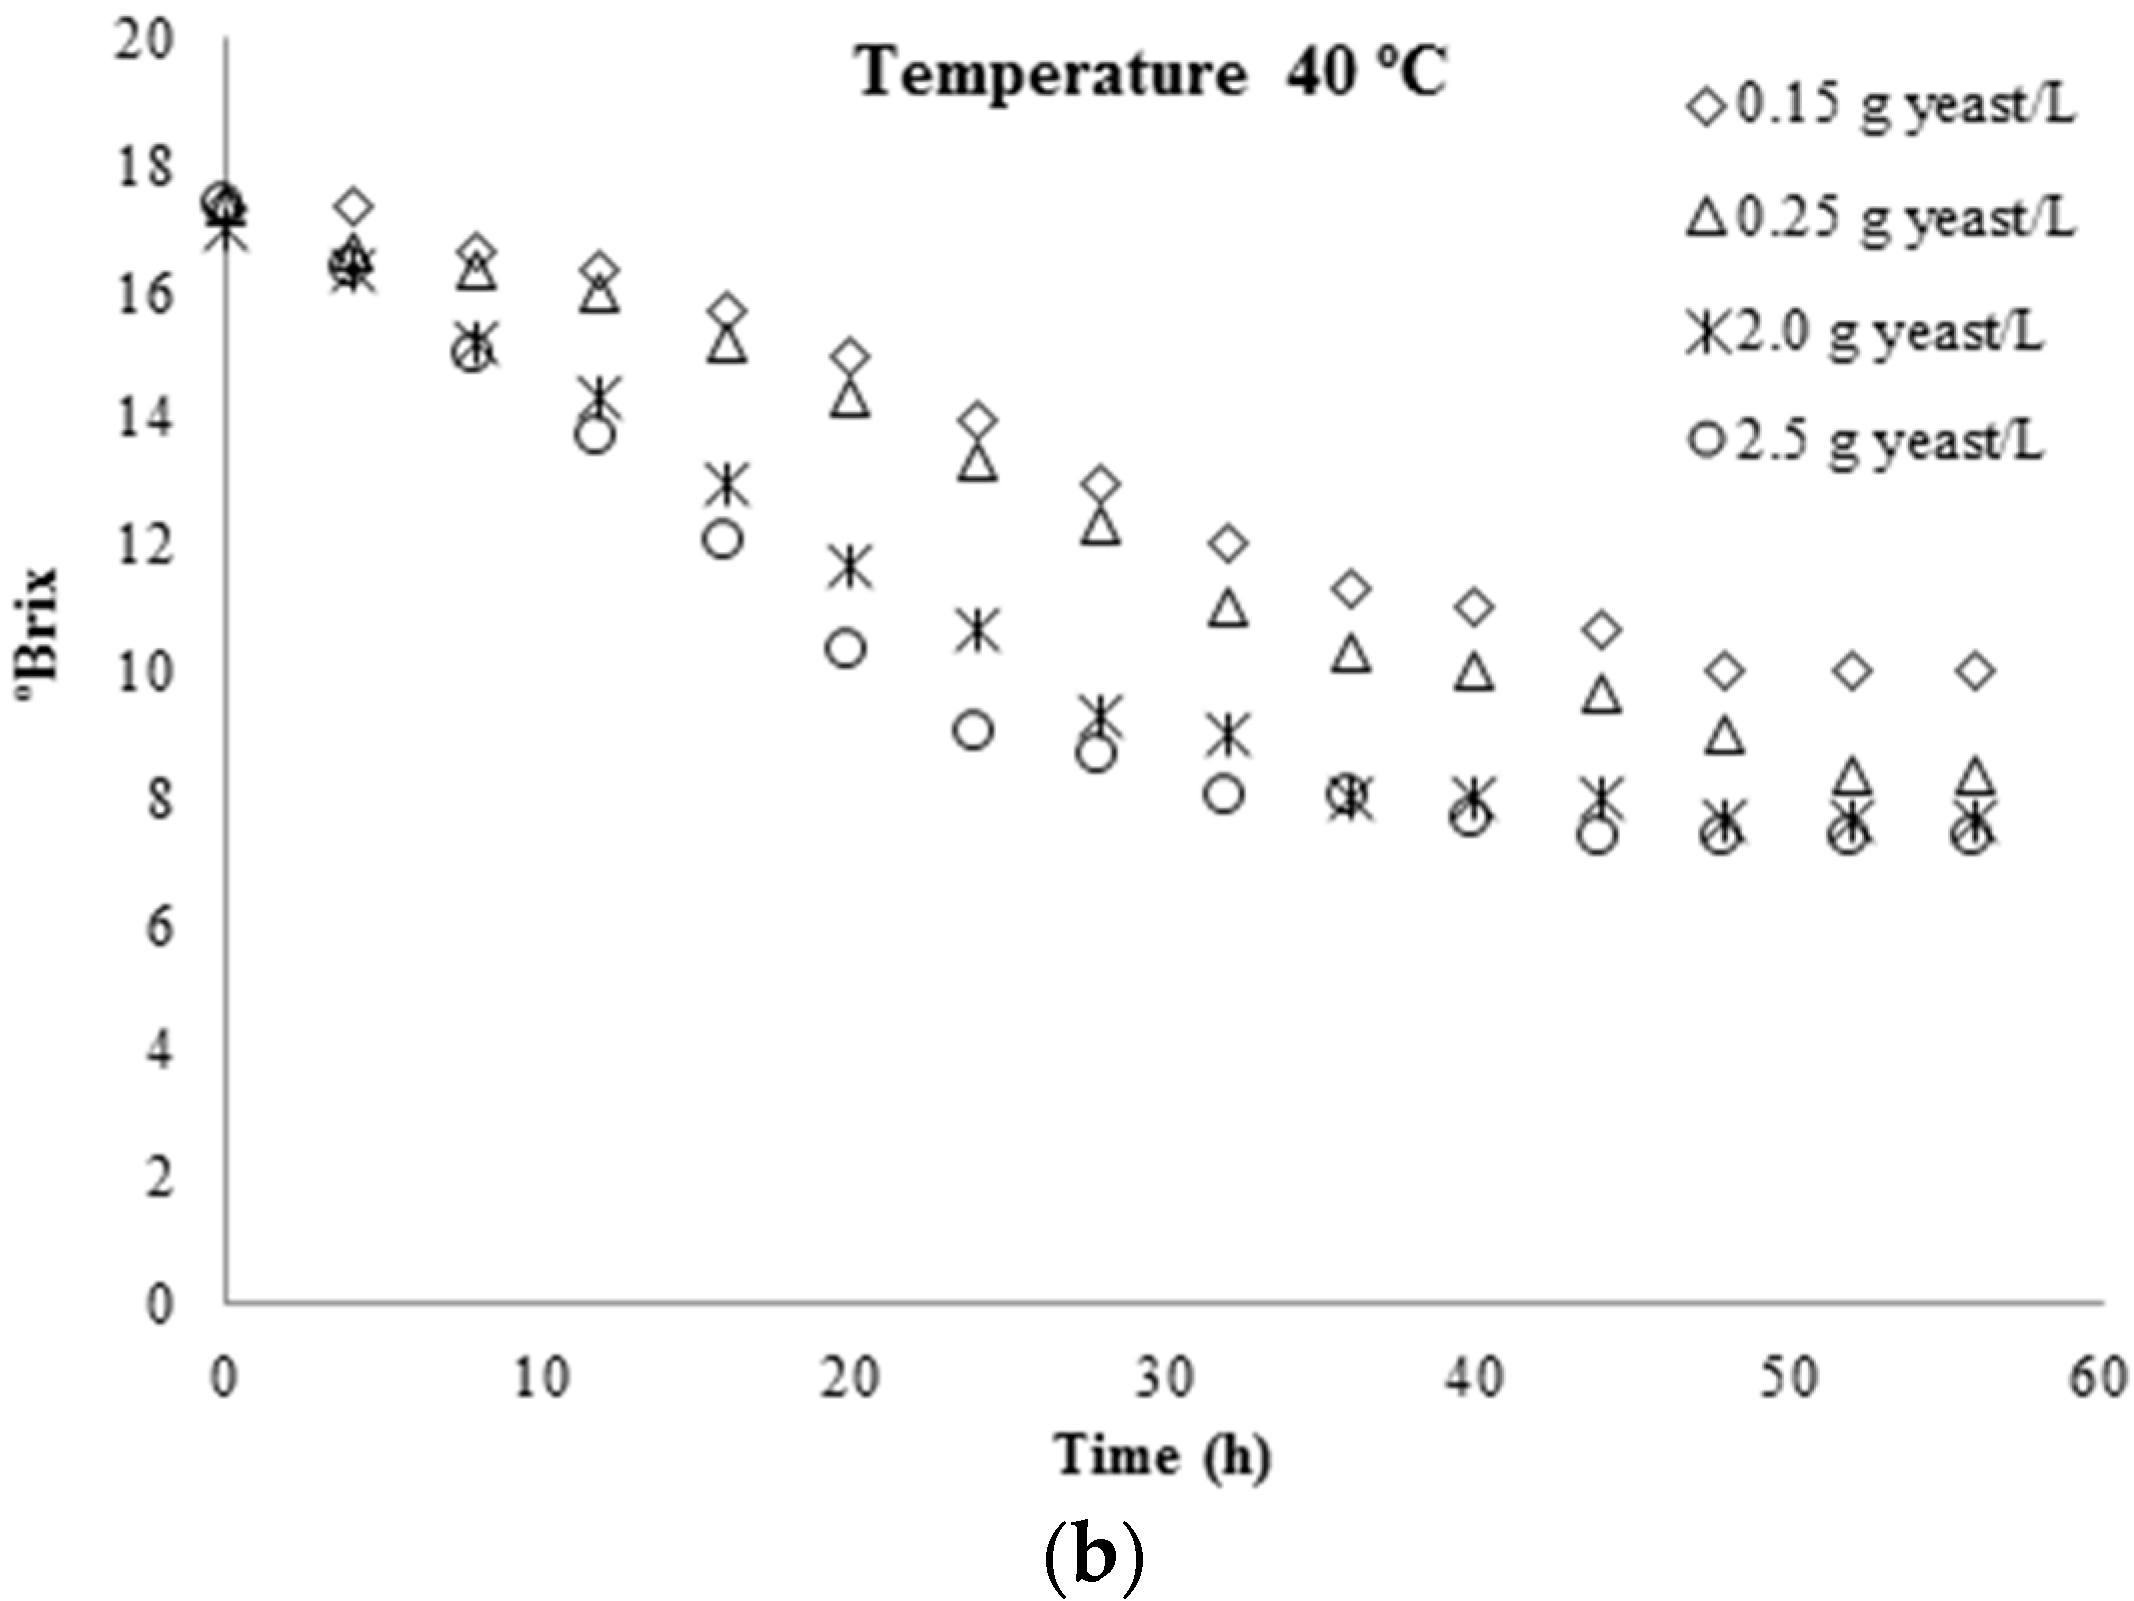
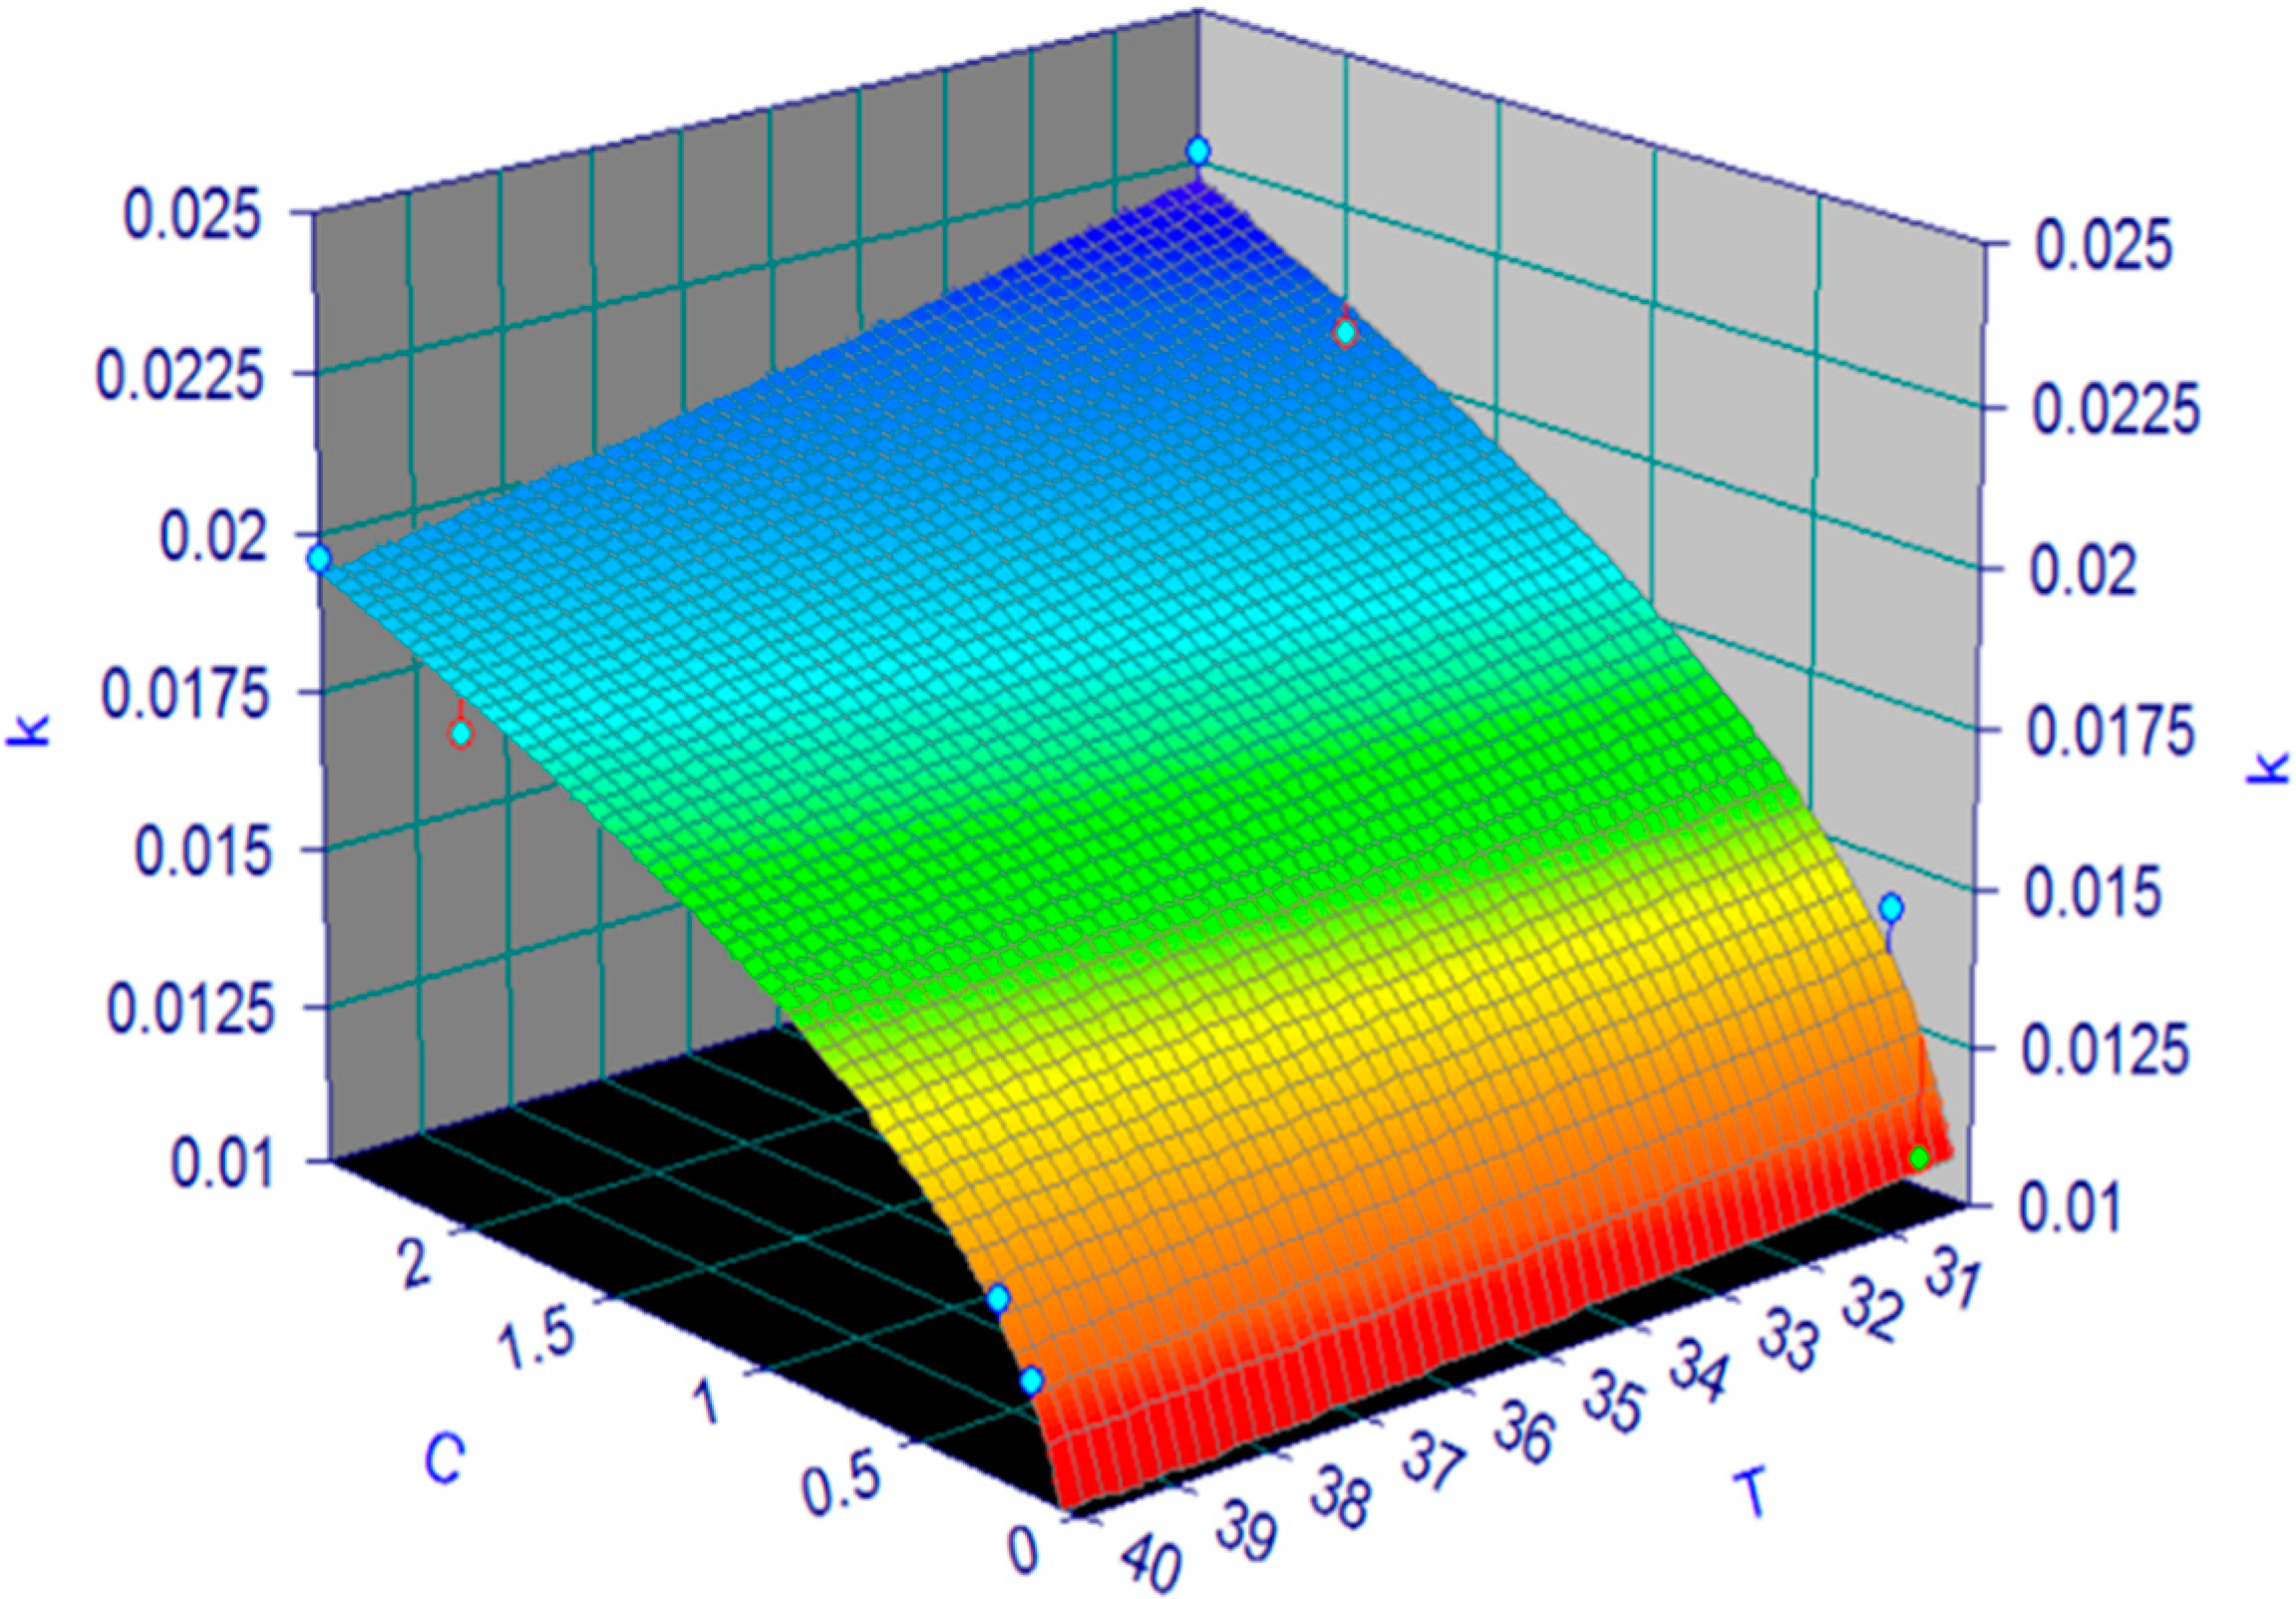
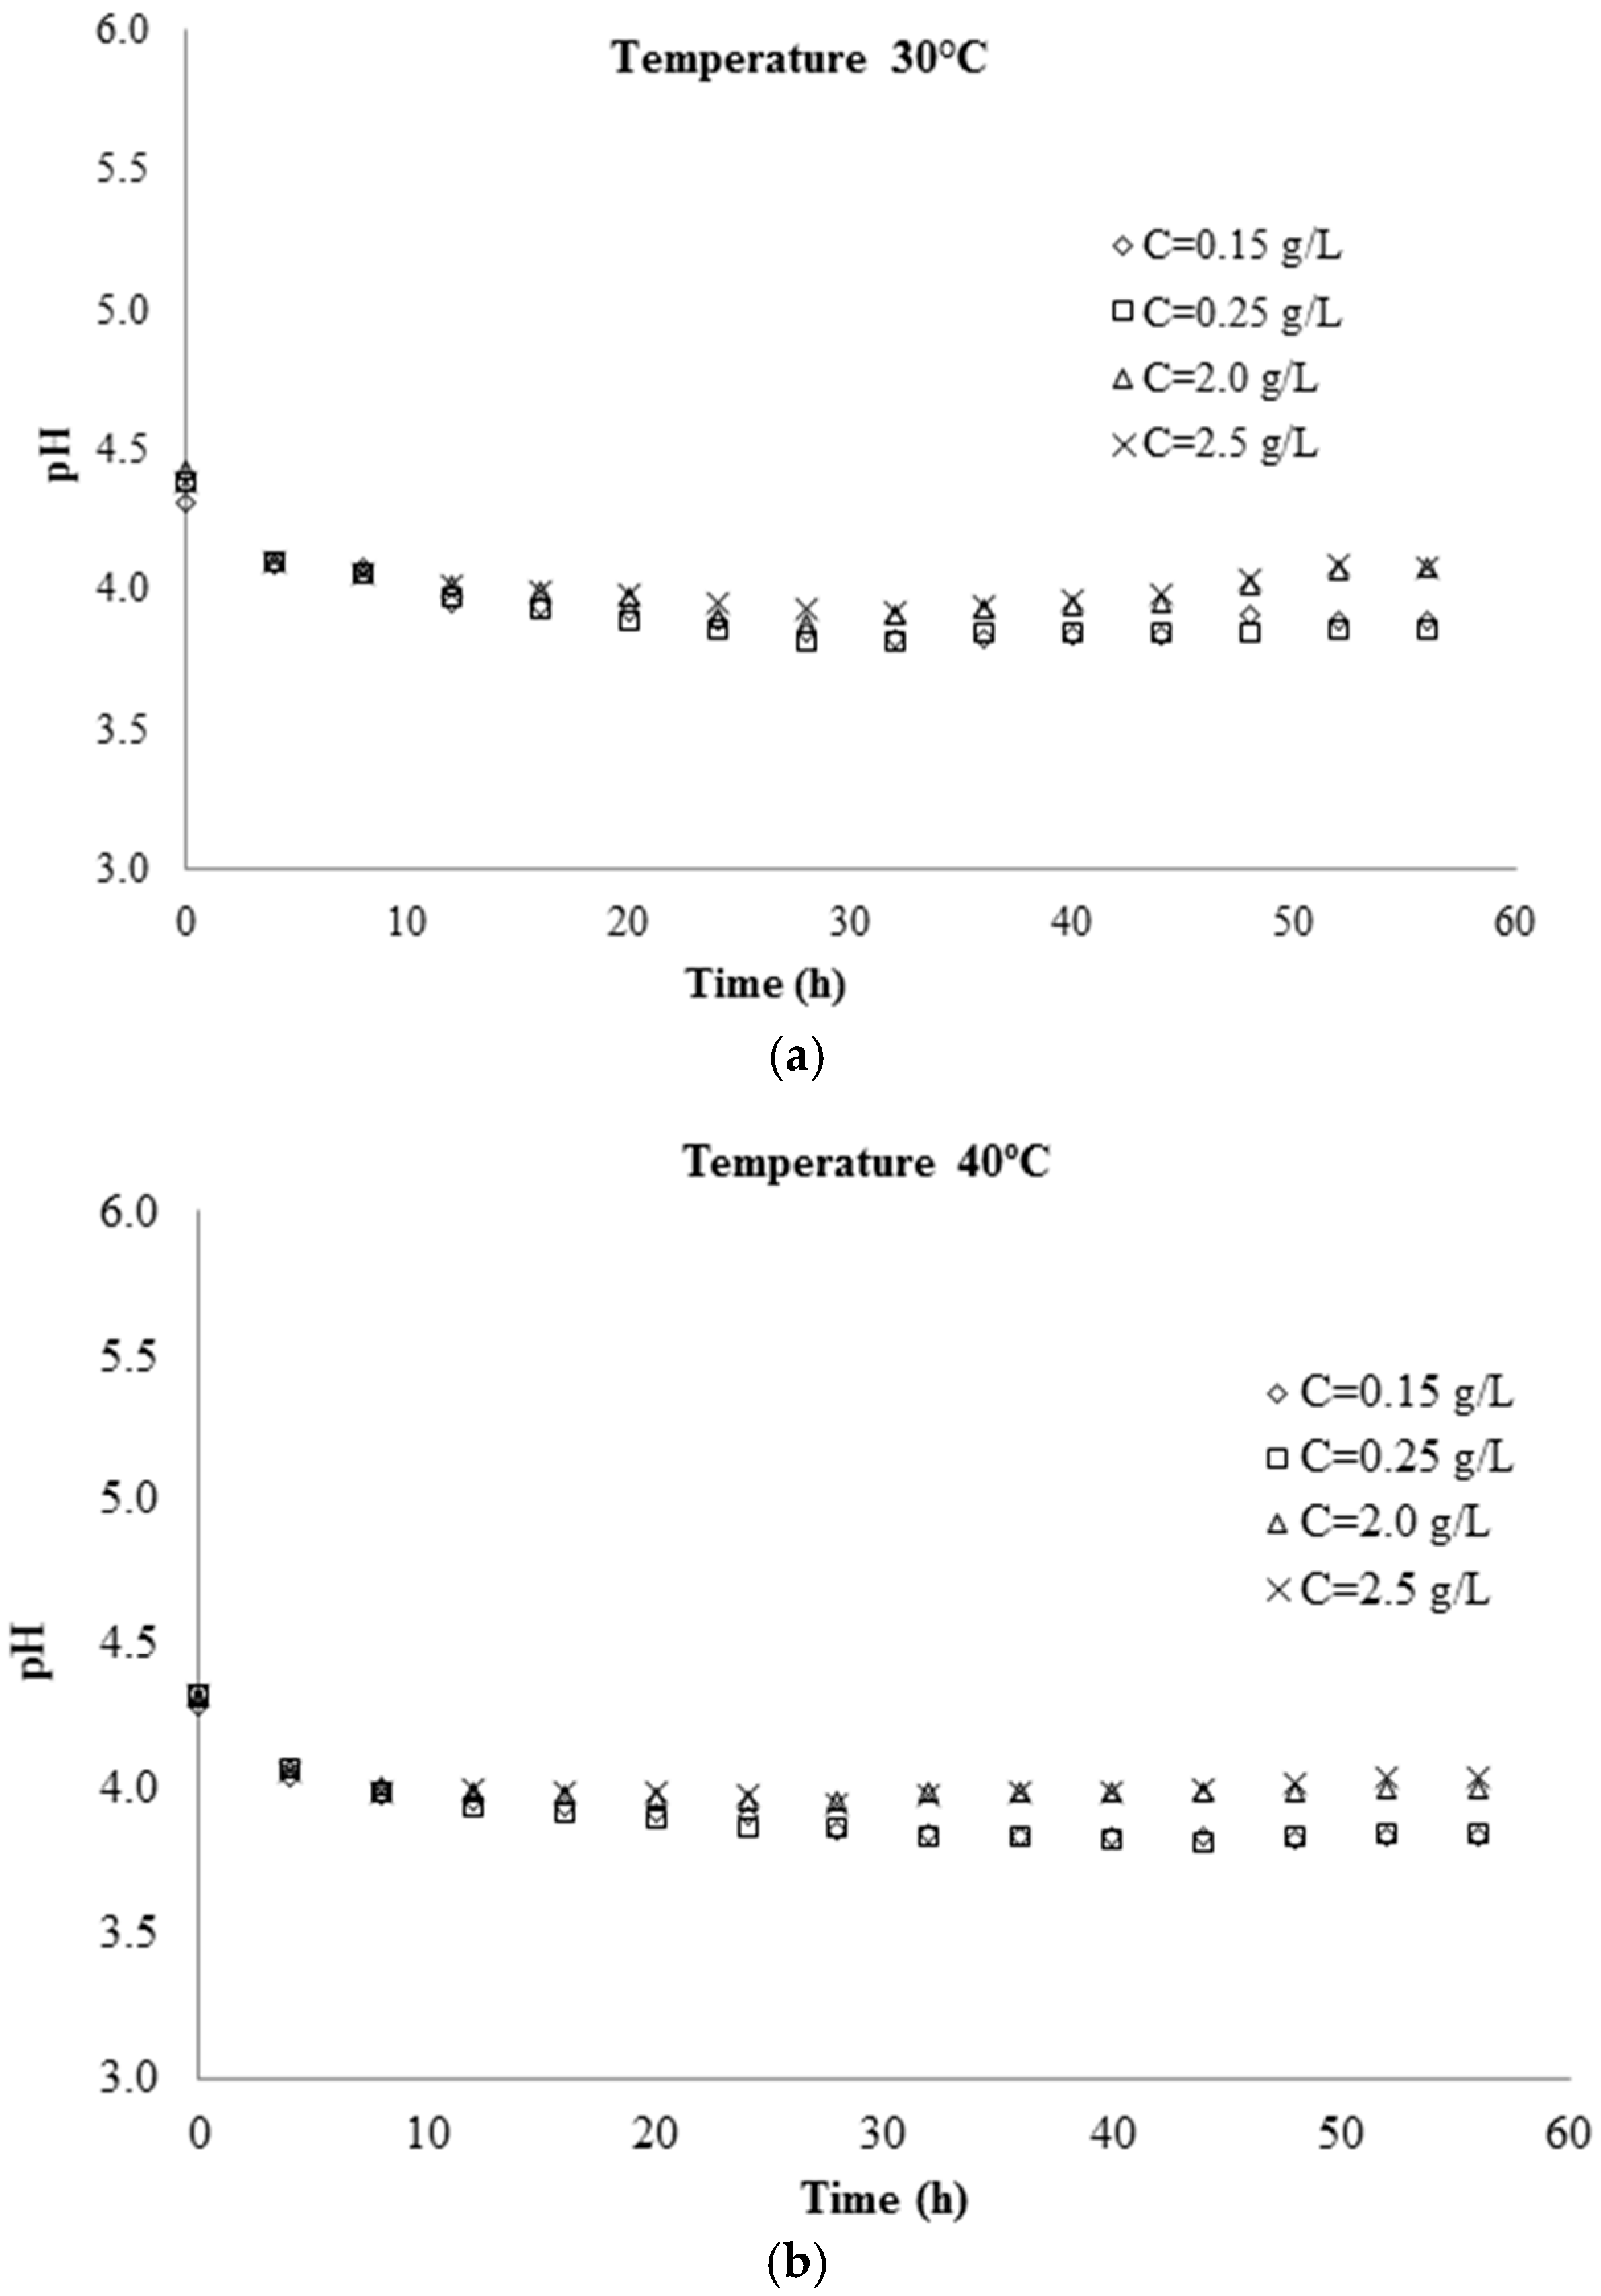
3.1. Kinetic Parameters Determination

Figure 3a,b shows the Brix degrees variation with time in the tests carried during the first phase in the 250 mL reactor. These data were used to develop the model, considering first order kinetics. Table 2 shows the kinetic parameters obtained by least squares in each trial.
It is demonstrated that the rate constant k is related with the temperature (T) and initial concentration of yeast (C). This is in accordance with [17,22]. By means of the TableCurve 3D software, Equation (6) was obtained, with a coefficient of determination 0.962.
k = 1 36.56 12.6 ln C + 0.67 T
Figure 4 shows the interaction between the initial yeast concentration C and temperature in the kinetic constant values estimated by the model of Equation (6). The red area indicates low interaction, while the blue area show higher interaction. It can be observed when the yeast concentration is high the rate constant decreases if the temperature varies from 30 to 40 °C, therefore the reaction in slower. When C is low the temperature influence over k is negligible.
Figure 5 shows the pH conditions found during the different laboratory trials. It can be observed that the pH initially decreases, according to an exponential function, until a constant value is reached at 30 h. Higher initial yeast concentration produces a higher pH in the stationary phase.

3.2. Prediction of Alcohol Volume

Productivity of the process is measured as the volume of alcohol produced from the cane juice from an initial graduation °Brix (°Bo). The results show that its value also depends on the temperature and concentration of yeast used (T and C), in concordance with [17,22].
According to Equations (3) and (6), Table 3 shows the proportionality constant β for each volume of alcohol obtained (Va). It can be seen that there is little variation of the β value. Therefore, it is considered as a representative constant of the fermentation 0.0148 (σ = 0.0013) for the defined conditions of temperature and concentration of yeast.
In Table 4 and Table 5, the results obtained with equivalent conditions in the 250 mL and 25 L reactors are presented. The values calculated with the model for predicting the quantity of alcohol produced from the initial concentration of yeast and fermentation temperature had an average deviation of 3.13% in the experiments carried out in the 250 mL reactor, and 4.14% for the tests carried out in a 25 L fermenter. These deviations show the acceptable accuracy in the proposed model, and ensure an acceptable estimation in the prediction of the volume of alcohol produced.

3.3. Prediction of Alcoholic Degree (AD)

The quality of the product obtained from the fermentation is determined at the end by alcoholic degree measurements. Table 6 shows the alcoholic degrees obtained in every trial. A new predictive model was developed to predict alcoholic degree from the evaluated values: initial concentration of yeast used (C), temperature (T) and the volume of alcohol (Va).
Equation (7) shows the relationship obtained between alcoholic degree and initial concentration of yeast (C), temperature (T) and the volume of alcohol (Va). This equation has been derived with the Table Curve 3D program. This model has an adjusted coefficient of determination of 0.9701.
A G = 58.15 + 129.05 C V a + 7.75 ln T

4. Conclusions

Two predictive models were obtained for the fermentation of cane juice using Saccharomyces cerevisiae as active agent. First, the amount of alcohol and its quality has been obtained from the variation of oBrix, initial concentration of yeast between 0.15 and 2.5 g·L−1 and a temperature range between 30 and 40 °C. It has been demonstrated that the reaction follows a first order kinetic model, with an average adjusted coefficient of determination of 0.98. Second, another model to estimate the alcohol quality from alcoholic degree measurements was established after the distillation of the must. This model had an adjusted coefficient of determination of 0.97. Deviations of experimental values were less than 4%. The results indicate that the predictive models have enough accuracy. They were validated experimentally. The proposed system is quite cheaper than other methods to control the process, such as sensor-based online methods, NIR, fluorescence, etc. Therefore, this approach is suitable for use in rural communities with limited resources and allows the promotion of sustainable development projects in economically depressed areas.

Acknowledgments

This research work has been carried out inside the cooperation framework funded by the ADSIDEO program of the Centro de Cooperación al Desarrollo (CCD) of Universidad Politécnica de Valencia (Spain), in collaboration with the Centro de Estudios de la Biomasa (CEB), Universidad Estatal de Bolívar, Guaranda, Ecuador. The participation of Dr. Sergio Pérez in this work was possible thanks to funding from the Ecuadorian Government by means of the PROMETEO program, led by the Secretaría Nacional de Educación Superior, Ciencia y Tecnología (SENESCYT).

Author Contributions

All authors participated equally and corporately in conducting the research.

Conflicts of Interest

The authors declare no conflict of interest.

Acronyms and Symbols

°BoInitial Brix degree
°B(t)
CConcentration of yeast
β (°Brix−1) Proportionality constant
φ Volumetric fraction of alcohol
INEN Instituto Ecuatoriano de Normalización
k (h−1)Kinetic rate constant
MCPECMinisterio Coordinator de Produccion, Empleo y Competividad
NIRNear infrared
σ Standard deviation
t (s) Time
T (°C)Temperature
Va (mL)Alcohol volume
Vo (mL) Initial sugar juice volume
UTMUniversal Transverse Mercator

References

  1. Xavier, M.R. The Brazilian sugarcane ethanol experience. Issue Anal. 2007. Available online: https://cei.org/search/node/ethanol?f[0]=created%3A2007&f[1]=field_experts%3A48291 (accessed on 2 February 2014).
  2. Balat, M. Production of bioethanol from lignocellulosic materials via the biochemicalpathway: A review. Energy Convers. Manag. 2011, 52, 858–875. [Google Scholar] [CrossRef]
  3. Balat, M.; Balat, H.; Öz, C. Progress in bioethanol processing. Prog. Energy Combust. Sci. 2008, 34, 551–573. [Google Scholar] [CrossRef]
  4. Kim, S.; Dale, E.B. Global potential bioethanol production from wasted crops and crop residues. Biomass Bioenergy 2004, 26, 361–375. [Google Scholar] [CrossRef]
  5. Sarkar, N.; Ghosh, S.K.; Bannerjee, S.; Aikat, K. Bioethanol production from agricultural wastes: An overview. Renew. Energy 2012, 37, 19–27. [Google Scholar] [CrossRef]
  6. James, S.A.; Carvajal Barriga, E.J.; Barahona, P.P.; Nueno-Palop, C.; Cross, K.; Bond, C.J.; Roberts, I.N. Kazachstania yasuniensis sp. nov., an ascomycetous yeast species found in mainland Ecuador and on the Galápagos. Int. J. Syst. Evol. Microbiol. 2015, 65, 1304–1309. [Google Scholar] [CrossRef] [PubMed]
  7. Klopfenstein, T. Chemical treatments of crop residues. J. Anim. Sci. 1978, 46, 841–848. [Google Scholar]
  8. Cardona, C.A.; Quintero, J.A.; Paz, I.C. Production of bioethanol from sugarcane bagasse: Status and perspectives. Bioresour. Technol. 2009, 101, 4754–4766. [Google Scholar] [CrossRef] [PubMed]
  9. Pandey, A.; Soccol, C.R.; Nigam, P.; Soccol, V.T. Biotechnological potential of agroindustrial residues. I: Sugarcane baggase. Bioresour. Technol. 2000, 74, 69–80. [Google Scholar] [CrossRef]
  10. Pandey, A. Handbook of Plant-Based Biofuels; CRC Press: New York, NY, USA, 2009. [Google Scholar]
  11. Luttmann, R.; Bracewell, D.G.; Cornelissen, G.; Gernaey, K.V.; Glassey, J.; Hass, V.C.; Kaiser, C.; Lidnstöm, I.M.; Preusee, C.; Striedner, G.; et al. Soft sensors in bioprocessing: A status report and recommendation. Biotechnol. J. 2012, 7, 1040–1048. [Google Scholar] [CrossRef] [PubMed]
  12. Faassen, S.M.; Hitzmann, B. Fluorescence Spectroscopy and Chemometric Modeling for Bioprocess Monitoring. Sensors 2015, 15, 10271–10291. [Google Scholar] [CrossRef] [PubMed]
  13. Alatraktchi, F.A.; Bakmand, T.; Dimaki, M.; Svendsen, W.E. Novel Membrane-Based Electrochemical Sensor for Real-Time Bio-Applications. Sensors 2014, 14, 22128–22139. [Google Scholar] [CrossRef] [PubMed] [Green Version]
  14. Da Silva, A.S.A.; Inoue, H.; Endo, T.; Yano, S.; Bon, E.P.S. Milling pretreatment of sugarcane bagasse and straw for enzymatic hydrolysis and ethanol fermentation. Bioresour. Technol. 2010, 101, 7402–7409. [Google Scholar] [CrossRef] [PubMed]
  15. Martín, C.; Klinke, H.B.; Thomsen, A.B. Wet oxidation as a pretreatment method for enhancing the enzymatic convertibility of sugarcane bagasse. Enzyme Microb. Technol. 2007, 40, 426–432. [Google Scholar] [CrossRef]
  16. Singh, P.; Suman, A.; Tiwari, P.; Arya, N.; Gaur, A.; Shrivastava, A.K. Biological pretreatment of sugarcane trash for its conversion to fermentable sugars. World J. Microbiol. Biotechnol. 2008, 2, 4667–4673. [Google Scholar] [CrossRef]
  17. Rao, R.S.; Jyothi, C.P.; Prakasham, R.S.; Sarma, P.N.; Rao, L.V. Xylitol production from corn fiber and sugarcane bagasse hydrolysates by Candida tropicalis. Bioresour. Technol. 2006, 97, 1974–1978. [Google Scholar] [CrossRef] [PubMed]
  18. Sendelius, J. Steam Pretreatment Optimisation for Sugarcane Bagasse in Bioethanol Production. Master’s Thesis, Lund University, Lund, Sweden, 2005. [Google Scholar]
  19. Arroyo-Lopez, F.N.; Querol, A.; Barrio, E. Application of a substrate inhibition model to estimate the effect of fructose concentration on the growth of diverse Saccharomyces cerevisiae strains. J. Ind. Microbiol. Biotechnol. 2009, 36, 663–669. [Google Scholar] [CrossRef] [PubMed]
  20. Peña, C.; Arango, R. Evaluación de la producción de etanol utilizando cepas recombinantes de Saccharomyces cerevisiae a partir de melaza de caña de azúcar. Dyna 2009, 76, 153–161. [Google Scholar]
  21. Amores, M.J.; Mele, F.D.; Jiménez, L.; Castells, F. Life cycle assessment of fuel ethanol from sugarcane in Argentina. Int. J. Life Cycle Assess. 2013, 18, 1344–1357. [Google Scholar] [CrossRef]
  22. Balakumar, S.; Arasaratnam, V. Enhanced production of ethanol by high gravity glucose fermentation at temperatures above 40 °C by Saccharomyces cerevisiae S1 using a soya flour supplemented medium. J. Natl. Sci. Sri Lanka 2014, 42, 111–117. [Google Scholar] [CrossRef]
  23. Fruit Juice, Purees, Concentrates, Nectar and Beverage, 1st ed.; NTE INEN 2337:2008; Instituto Ecuatoriano de Normalización, Norma Técnica Ecuatoriana: Quito, Ecuador, 2008.
  24. Bebidas Alcohólicas. Determinación del Grado Alcohólico; NTE INEN 0340:1994; Instituto Ecuatoriano de Normalización, Norma Técnica Ecuatoriana: Quito, Ecuador, 1994.
Figure 1. Laboratory setup for the evaluation of cane juice fermentation.
Energies 09 00319 g001
Figure 2. Fermentation of cane juice for bioethanol production in the pilot plant.
Energies 09 00319 g002
Figure 3. Measurements °Brix variation versus time in laboratory trials with a reactor volume of 250 mL at 30 °C (a) and 40 °C (b).
Energies 09 00319 g003aEnergies 09 00319 g003b
Figure 4. Influence of yeast concentration C and temperature T on the kinetic constant.
Energies 09 00319 g004
Figure 5. pH during laboratory tests for the yeast concentration and temperature conditions studied: (a) 30 °C and (b) 40 °C.
Energies 09 00319 g005
Table 1. Sampling points.
SectorUTM
XYZ
Allaga Paredes Zoila Rosa71411798698561664
Caiza Yanchaliquín Luis Ernesto71383298677471870
Falcón Mera Dolores Narcisa7056249871465631
Flores Ruiz Felix71542898669751718
Guerrero Meneses Angel Froilan7100819870847976
Jaramillo Pacha Bertha Lucía7088979871408813
Merino Ayme Rosa Adela71535898667971658
Ruiz Guerrero Wilsón Rodrigo7095569872138814
Zapata Guerrero Arcadio Heremitis70967798701841075
Table 2. Kinetic parameters obtained by adjustment with least squares in trials using a 250 mL reactor.
Temperature (°C)3040
Yeast Concentration (g·L1)0.150.252.02.50.150.252.02.5
°Bo (Brix)17.54418.14517.49317.04218.17117.84417.07416.878
k (h−1)0.01040.01420.02040.02270.01170.01270.01780.0196
R20.9870.9770.9620.9540.9730.9770.9610.932
Table 3. Parameter β calculated from tests in a 250 mL reactor at different temperatures.
Temperature (°C)3040
Yeast Concentration (g·L−1)0.150.202.02.50.150.202.02.5
°Bo (Brix)17.5418.1417.4917.0418.1717.8417.0716.88
k (h−1) 0.01040.01420.02040.02270.01170.01270.01780.0196
Va (mL)33.6734.6747.6740.3333.3333.3336.3340.00
Vo (mL)250250250250250250250250
t (h)5656565656565656
φ (adim.)0.130.140.190.160.130.130.150.13
β (Brix−1)0.017 0.014 0.016 0.013 0.015 0.015 0.014 0.014
Table 4. Parameters and volume of alcohol (Va) obtained experimentally and calculated in 250 mL reactor at different temperatures.
Temperature (°C)3040
Yeast Concentration (g·L−1)0.21.50.21.5
°Bo (Brix)17.3317.0017.3317.00
Sugar juice volume V0 (mL)250250250250
k (h−1) Equation (6)0.01300.01800.01150.0165
t (h)56565656
β average (Brix−1)0.01480.01480.01480.0148
Va (mL): experiment32.3340.3332.3339.00
Va (mL): predicted Equation (5)32.9839.8130.3137.84
Error (%)2.011.296.242.97
Table 5. Parameters and volume of alcohol (Va) obtained experimentally and calculated in the 25 L pilot plant reactor.
TemperatureT = 30 °CT = 40 °C
Yeast Concentration (g·L−1)0.150.200.150.150.200.15
oBo (Brix): Exp.17.0017.33117.3317.0017.3317.33
Vo (mL): Exp.150001500015000150001500015000
k (h−1): Equation (6)0.01280.01300.01310.01130.01150.0117
t (h): Exp.565656565656
β average (Brix−1)0.01480.01480.01480.01480.01480.0148
Va (mL): Exp.237524752490229025201375
Va (mL): model Equation (5)2342.12412.82437.22149.32217.82244.4
Error (%)1.392.512.126.147.205.50
Table 6. Experimental values obtained and used to develop the prediction model of alcoholic degree from yeast concentration, temperature and volume of alcohol.
AD (Experimental)Yeast Concentration
C (g·L−1)
Alcohol Volume
Va (mL)
Yeast Concentration/Alcohol Volume (C/Va)
32.50.1533.670.0045
32.60.232.330.0062
310.2533.330.0075
33.71.539.000.0385
36.2236.330.0550
40.12.540.330.0620
38.52.540.000.0625

