Article

A Systematic Study of Separators in Air-Breathing Flat-Plate Microbial Fuel Cells—Part 1: Structure, Properties, and Performance Correlations

1
Department of Chemical and Biological Engineering, The University of British Columbia, Vancouver, BC V6T 1Z3, Canada
2
National Research Council Canada, Vancouver, BC V6T 1W5, Canada
*
Author to whom correspondence should be addressed.
Energies 2016, 9(2), 78; https://doi.org/10.3390/en9020078
Submission received: 11 November 2015 / Revised: 11 January 2016 / Accepted: 15 January 2016 / Published: 27 January 2016

Abstract

:
Passive air-breathing microbial fuel cells (MFCs) are a promising technology for energy recovery from wastewater and their performance is highly dependent on characteristics of the separator that isolates the anaerobic anode from the air-breathing cathode. The goal of the present work is to systematically study the separator characteristics and its effect on the performance of passive air-breathing flat-plate MFCs (FPMFCs). This was performed through characterization of structure, properties, and performance correlations of eight separators in Part 1 of this work. Eight commercial separators were characterized, in non-inoculated and inoculated setups, and were examined in passive air-breathing FPMFCs with different electrode spacing. The results showed a decrease in the peak power density as the oxygen and ethanol mass transfer coefficients in the separators increased, due to the increase of mixed potentials especially at smaller electrode spacing. Increasing the electrode spacing was therefore desirable for the application of diaphragms. The highest peak power density was measured using Nafion®117 with minimal electrode spacing, whereas using Nafion®117 or Celgard® with larger electrode spacing resulted in similar peak powers. Part 2 of this work focuses on numerical modelling of the FPMFCs based on mixed potential theory, implementing the experimental data from Part 1.

1. Introduction

There is a substantial amount of organic matter in wastewater, which is typically removed by industry and municipalities utilizing a considerable amount of energy. This ulterior energy can potentially be recovered through replacing the traditional biological wastewater treatment process with microbial fuel cells (MFCs), devices in which electrical energy can be produced through a series of electrochemical reactions that involve biochemical pathways.
For MFCs to be commercialized, research must overcome major challenges such as the high capital cost as well as the low power output. One approach to address the high capital cost and the low power output is to combine reduced electrode spacing with a passive air-breathing cathode which has the potential to reduce both the reactor size and Ohmic overpotential losses. Relatively low power densities have been reported for the combination of the flat-plate design and active air or oxygen flow cathodes, which was attributed to the excessive oxygen crossover (oxygen crossing over the separator towards the anaerobic anode) [1,2]. Likein direct methanol fuel cells (DMFCs) [3,4,5], oxygen crossover to the anode is to be avoided in FPMFCs. It can cause anodic mixed potentials and anode depolarization and therefore, reduce the efficiency. On the other hand, fuel crossover to the cathode can result in cathodic mixed potentials and cathode depolarization, which is also detrimental to MFC performance.
A separator is usually a necessary cell component to decrease the oxygen and fuel crossover [6]. However, a stable and performing separator is usually an expensive component in many electrochemical cells and is expected to be still the case should MFCssuccessfully reach the commercialization stage. In practical terms, the use of a separator increases the cell’s internal resistance and hence the Ohmic overpotential. The other issue with the separator in a MFC is that it can result in anode acidification and cathode alkalization (pH splitting), which could increase the resistivity of the system towards transferring protons [7]. Furthermore, most separators are subject to (bio)fouling and degradation in the long-term [8,9,10]. While the presence of a separator has been reported to be optional for the short-term operation of the configurations with a large electrode spacing [8,11,12,13], its presence plays a key role when it comes to the configurations with small electrode spacing (e.g., flat-plate designs). This may explain the trend in the MFC research community to favor adoption of the separator-free configurations with large electrode spacing (e.g., cubic or cylindrical designs). In configurations with smaller electrode spacing, on the other hand, the separator characteristics such as the mass transfer coefficients of fuel and oxidant, the proton transport number, and the ionic resistivity play crucial roles in the cell performance.
Among many factors, MFC performance is significantly affected by the characteristics of the applied separator as well as the MFC configuration (e.g., the electrode spacing). So far, there have been no reports on possible mutual effects or correlations between the characteristics of the separator and the electrode spacing regarding the MFC performance. Different separators have been tested to investigate the effect on the MFC performance [7,8,12,14,15,16], with very few of them evaluating the separators independently in non-inoculated aqueous setups [7,8,16]. The final objective of those independently studied separators, however, has usually been a passive air-breathing MFC configuration, where the separator might behave differently compared to an aqueous-cathode setup.
In this work, a systematic approach was adopted to study the separator structure, properties, and performance correlations in passive air-breathing FPMFCs. For this purpose, a combination of experimental and modeling approaches were applied, reported in two parts. In Part 1, eight commercial separators (ion-exchange membranes and diaphragms) were selected and their ionic resistivity, proton transport number (indicating protons permeability), and oxygen crossover were studied in a non-inoculated air-breathing setup, and the fuel (ethanol and acetate) crossover was studied in a non-inoculated aqueous setup. The selected separators were then examined in three passive air-breathing FPMFCs with anode chamber depth of 2, 4 and 8 mm to investigate the interplay between the electrode spacing and the separator characteristics. In Part 2, a numerical model was developed based on the mixed potential theory implementing the experimental data collected in Part 1.

2. Results and Discussion

2.1. Separator Characteristics

The characteristics of the separators were related to their material, structure, thickness, and pore size. Table 1 provides available information on the selected separators.
Table 1. Information on the material and structure of the selected separators (provided by the suppliers).
SeparatorInformationThickness (µm)Pore Size (µm)
Nafion®117Sulfonate groups attached to a hydrophobic fluorocarbon backbone178-
Aquivion®Sulfonate groups attached to a short-side-chain perfluoropolymer30-
Celgard®Micro-porous polypropylene2000.04
Zirfon®Micro-porous polymer mesh coated with a mixture of ZrO2 and polysulfone5000.15
SciMat®UV-treated micro-porous polypropylene14430
Nylon meshWoven Nylon strands5520
Glass fiber filterWeb of glass fibers3800.7
J-clothWoven cellulose fibers300500

2.1.1. Mass Transfer

• Oxygen Crossover

Table 2 provides the characteristics of the separators measured in the non-inoculated air breathing and aqueous setups. Nafion®117 was in general less susceptible to oxygen and ethanol diffusion compared to the other separators. The mass transfer coefficient of oxygen, kO, in Nafion®117 was ca. 0.3 × 10⁻⁶ m·s−1, lower than the previously reported values (ca. 1.5 × 10⁻⁶ m·s−1 [16,17]). This was attributed to the passive air-breathing setup used, which decreased convective oxygen flux through the separator, as opposed to the active aeration used in an aqueous setup. The mass transfer coefficient of oxygen measured for Zirfon® (1.5 × 10⁻⁶ m·s−1) was also lower than that reported by Pant et al. [18] (ca. 19 × 10−6 m·s−1) who used an aqueous non-inoculated MFC that was actively aerated at the cathode. Application of an inoculated MFC setup by Pant et al. to investigate the mass transfer coefficient of oxygen in Zirfon® also suggested that the actual coefficient could be larger due to potential consumption of oxygen by the biological processes [18]. Characterization of the separators in a non-inoculated setup in this work eliminated the possibility of oxygen consumption by the biological processes, and hence, provided data that represented the actual mass transfer coefficient of oxygen in the separator.
Table 2. Characteristics of the separators measured in the non-inoculated air breathing and aqueous setups.
SeparatorThickness (×10−6 m)kO (×10−6 m·s−1)kE (×10−6 m·s−1)kA (×10−6 m·s−1)RS (×10−4 Ω·m2)nH+
Nafion®1171780.29 ± 0.020.49 ± 0.010.34 ± 0.015.4 ± 0.10.59 ± 0.01
Aquivion®300.77 ± 0.050.98 ± 0.010.88 ± 0.010.8 ± 0.10.72 ± 0.01
Celgard®2001.2 ± 0.10.84 ± 0.010.98 ± 0.014.4 ± 0.20.92 ± 0.01
Zirfon®5001.5 ± 0.10.58 ± 0.010.50 ± 0.0114 ± 0.40.92 ± 0.01
Nylon mesh552.2 ± 0.12.2 ± 0.22.2 ± 0.11.4 ± 0.10.89 ± 0.03
Glass fiber filter3800.87 ± 0.061.02 ± 0.050.94 ± 0.047.8 ± 0.20.62 ± 0.02
SciMat®1442.6 ± 0.11.9 ± 0.11.8 ± 0.13.1 ± 0.10.66 ± 0.03
J-cloth3009.5 ± 0.633 ± 330 ± 36.2 ± 0.20.78 ± 0.02
Aquivion® and glass fiber filter showed relatively low oxygen crossover, after Nafion®117. The larger mass transfer coefficient of Aquivion® compared to Nafion®117 was attributed to its thin structure, whereas the porous structure of glass fiber was responsible for large crossover of oxygen compared to Nafion®117. Glass fiber filter has been reported to surpass the performance of cation exchange membranes (CEMs) in a passive air-breathing MFCs with electrode spacing of 2 cm [12,15]. This was mainly attributed to its relatively lower oxygen crossover and improved ionic conductivity.
J-cloth showed the highest crossover of oxygen (9.5 × 10⁻⁶ m·s−1), which was lower than that reported previously by Zhang et al. [8] (29 × 10−6 m·s−1). The high flux of oxygen through J-cloth was attributed to its significantly large pores (ca. 500 µm). The lower mass transfer coefficients of oxygen measured in this work compared to those reported previously were attributed to the diffusive crossover of oxygen through not-fully hydrated separators in the air-cathode setup used here.

• Ethanol and acetate crossover

Ethanol and acetate crossovers followed a similar trend as the oxygen crossover, and increased as separators with larger pores were tested. As shown in Table 2, Nafion®117 provided the lowest mass transfer coefficients for ethanol, kE, and acetate, kA, (0.49 × 10⁻⁶ and 0.34 × 10⁻⁶ m·s−1, respectively) while J-cloth provided the highest (33 × 10−6 and 30 × 10−6 m·s−1, respectively). The low crossover of ethanol and acetate in Nafion®117 was likely due to its negatively charged functional groups which resulted in dominant cation transfer as opposed to anions and large molecules. In diaphragms such as J-cloth, on the other hand, the porous structure promoted convectional crossover of ethanol and acetate with the bulk solution.
In general, the mass transfer coefficients of ethanol and acetate measured in the separators were larger than the mass transfer coefficients of oxygen. This was very likely due to the aqueous configuration used which resulted in full hydration of the separator. The concentration gradient of ethanol and acetate across the separator played an important role in their crossover through the separators, as the rate of diffusion decreased over time. The wide range of the mass transfer coefficients of fuel and oxygen indicated that degradation of ethanol to CO2 and acetate in the FPMFC would be a result of a mixture of anodic anaerobic and aerobic, and cathodic aerobic oxidation, causing a complex effect on the performance.

2.1.2. Ionic Conductivity

The separators’ ionic resistivity, Rs, varied from ca. 0.8 Ω·m2 in Aquivion® up to ca. 14 Ω·m2 in Zirfon® (Table 2). In general, the thickness of the separator played a key role in its ionic resistivity. The trend shows that the resistivity increases with the thickness. Also, for separators with similar thickness, the resistivity decreased with increasing the pore size of the separator. Among the separators evaluated, the 500 µm thick Zirfon® demonstrated the highest resistivity. This is despite the fact that the permanently hydrophilic and fully wet structure of Zirfon® was expected to results in relatively low ionic resistivity compared to polymeric membranes [19]. Nonetheless, the thick structure of Zirfon® seemed to limit the ion transfer.
The glass fiber filter, on the other hand, showed a much lower resistivity. This was primarily due to its larger pores and the super-hydrophilic structure, even though it was only slightly thinner than Zirfon®. Aquivion® and Nylon mesh showed the smallest resistivity towards cations, as a result of their thin structure. Also, the negatively charged functional groups of Aquivion® may have facilitated the ion transfer.

2.1.3. Proton Transport Number

The proton permeability of the separators is of great importance in FPMFC power output as it could prevent anode acidification and cathode alkalization. During the pH splitting tests, gas accumulation was observed between the separator and the counter electrode and was more significant at high current densities. Replacing the carbon paper counter electrode with a perforated carbon paper electrode helped to periodically release the accumulated gas. Since the pH splitting results indicated no significant variation in the proton transport number, nH+, within the applied range of current density, the mean value of the proton transport number was reported.
The proton transport results indicated that despite using different mechanisms of transfer, the CEMs and diaphragms were, to a similar extent, permeable to protons. As it can be seen from Table 1 and Table 2, the variation in the proton transport number of the separator did not follow a specific trend with neither the thickness nor the pore size of the separators. The pH of the anode varied from 2.9 using Nafion®117 (pH of 11 at the cathode) to 3.3 using Celgard® and Zirfon® (pH of 10.2 at the cathode), which corresponded to proton transport numbers of 0.59 in Nafion®117 and 0.92 in Celgard® and Zirfon®. This indicated that even a high proton transport number of 0.92 was insufficient to balance the pH. Despite the excellent properties of Nafion®117, it provided the lowest proton transport number, which could be attributed to the competitive transfer of abundant ions such as K+ versus the protons [20].
The cathode potential has been shown to suffer the most from the low proton transport number of the separator. Zhang et al. [12,15], reported lower cathode potentials (0.1–0.2 V) using nylon mesh and glass fiber filters compared to a separator-free passive air-breathing MFC, with an electrode spacing of 2 cm. This indicates that the elevated cathode pH due to the pH splitting can negatively affect the cathode performance. The authors reported the highest cathode potential when the separator was removed [12].
The increase in the proton transport number from 0.59 to 0.92 can result in an increase in the equilibrium potential of oxygen reduction reaction (ORR) of ca. 0.04 V (at PO2 = 0.21 bar and T = 303 K). On the other hand, removing the separator (hypothetically) can result in a further increase of ca. 0.14 V in the equilibrium potential of ORR (at the FPMFC inlet pH of ca. 8.5). The permeability of the diaphragms to the phosphate buffer solution (PBS) in the MFC environment may result in higher proton transport numbers. Nonetheless, the pH splitting may still be an issue at high current densities [21].

2.2. Separator Evaluation in the FPMFCs

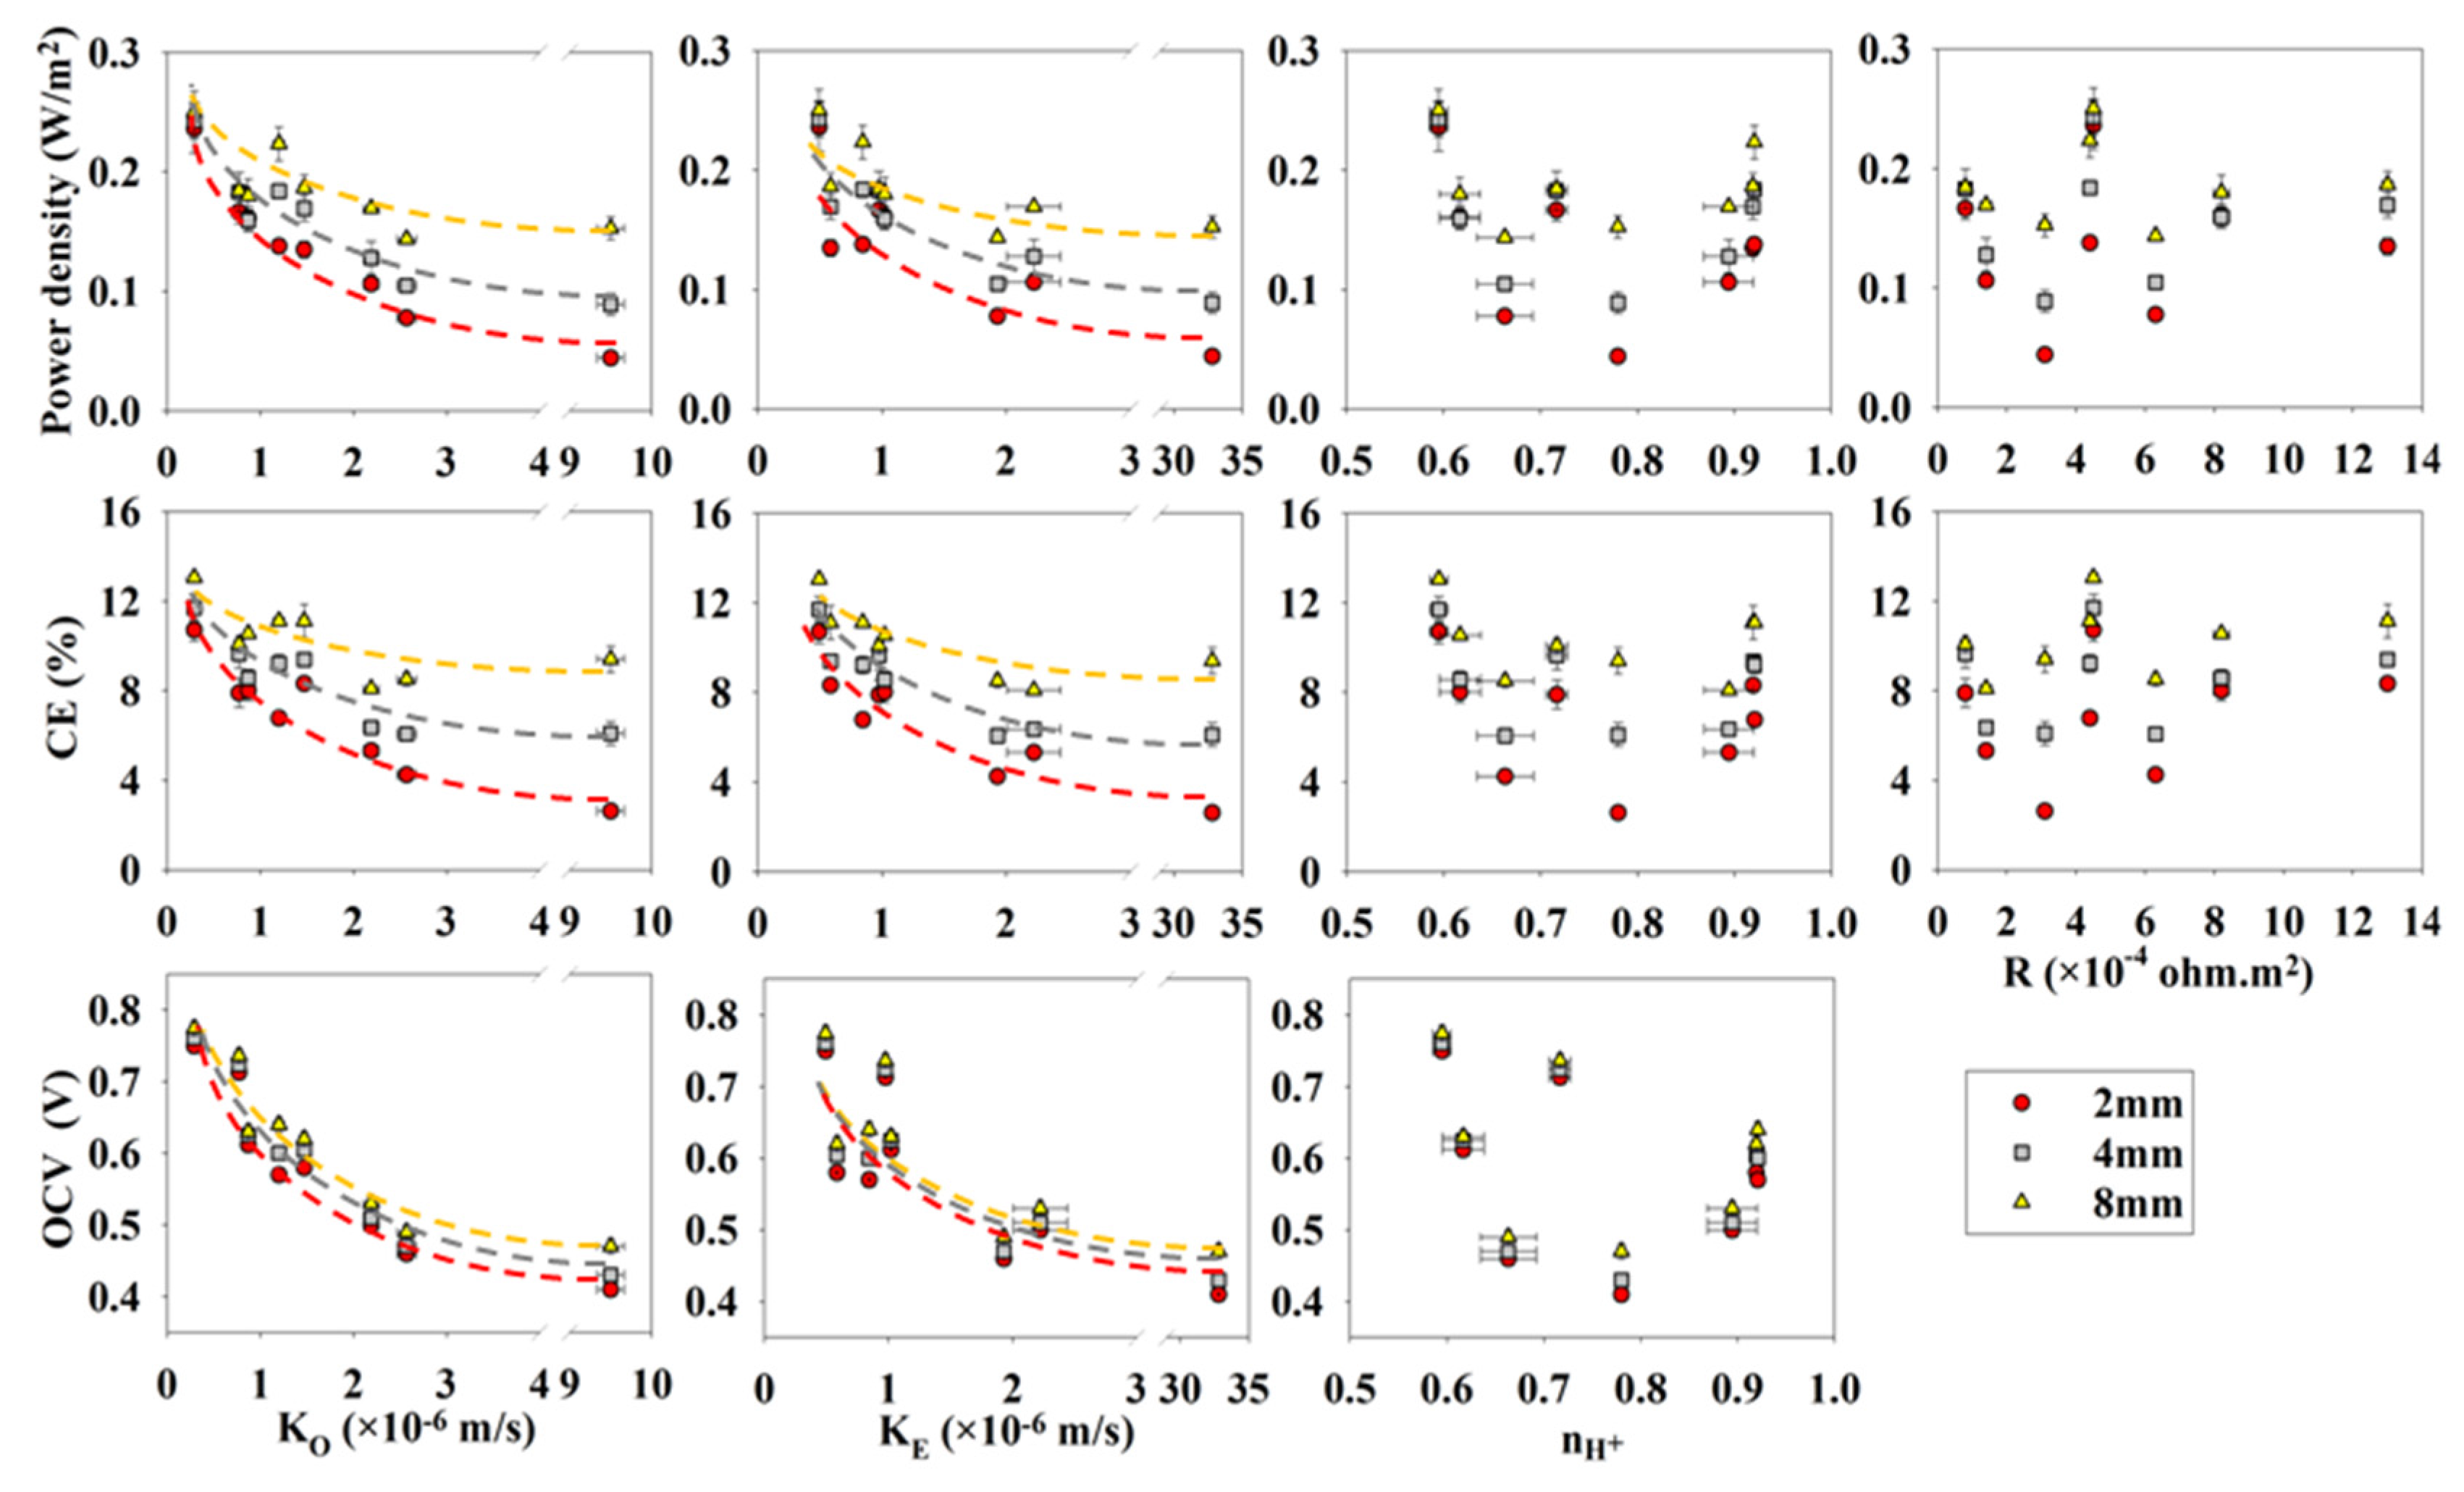
The performance of the passive air-breathing FPMFCs was greatly affected by the characteristics of the separators placed next to the air-cathode. Power density decreased from ca. 0.25 W·m−2 to ca. 0.05 W·m−2 as the mass transfer coefficient of oxygen increased from ca. 0.3 × 10⁻⁶ m·s−1 to over 9 × 10⁻⁶ m·s−1 (Figure 1). The mass transfer coefficient of oxygen through the air-cathode could be one order of magnitude higher than that in the separators [22,23]. That is why the separator played a crucial role in blocking the oxygen diffusion through the air-breathing cathode. The peak power density and coulombic efficiency (CE), therefore, increased significantly as the electrode spacing increased when separators with high oxygen crossover were used. The rate of decrease for superficial peak power density was 0.2 W·m−2 per mm of the electrode spacing in the 2 mm FPMFC and it decreased to 0.02 W·m−2 per mm of the electrode spacing in the 8 mm FPMFC. This indicated the high sensitivity of the peak power density and CE to the crossover in the 2 mm FPMFC. This sensitivity decreased as the electrode spacing increased.
Figure 1. Performance of the 2, 4 and 8 mm FPMFCs versus the separator characteristics.
Energies 09 00078 g001
The open circuit voltage was sensitive to the crossover in all three FPMFCs. It decreased from ca. 0.76 V to ca. 0.4 V as the mass transfer coefficients of oxygen and ethanol increased from 0.3 × 10⁻⁶ m·s−1 and 0.49 × 10⁻⁶ m·s−1 in Nafion®117 to 9.5 × 10⁻⁶ m·s−1 and 33 × 10−6 m·s−1 in J-cloth, respectively. The high sensitivity of the open circuit voltage (OCV) to crossover in the 8 mm FPMFC, as opposed to the relatively lower sensitivity of power density, indicated that although the presence of oxygen at the anode altered the anode potential, it did not inhibit the microbial culture significantly.
Power generation using the biofilm is dependent on the population of the microbial cells contributing to the current generation as well as the rate of the fuel uptake and the electron transfer to the anode [24]. All MFC analysis tests were replicated at least three times and a maximum standard error of ca. 0.02 W·m−2 was recorded. The fairly reproducible performance data leads to the conclusion that the morphology of the microbial communities (and their characteristics) in the FPMFCs likely did not change significantly within the period of operation. Therefore, the presence of oxygen in the anode chamber likely reduced the number of the cells contributing to the current generation. As the electrode spacing increased, the concentration of oxygen decreased within the biofilm resulting in a less significant effect of oxygen crossover in the 4 and 8 mm FPMFCs, and in more cells contributing to the current generation. This explains why a larger variation in the peak power density and CE was observed as the electrode spacing decreased.
Table 3 presents the OCV, the superficial and volumetric peak power densities, and the CE of the 2, 4 and 8 mm FPMFCs operated with the selected separators. The highest peak power density in the 2 mm FPMFC was produced using Nafion®117 (0.24 ± 0.02 W·m−2). This was due to the low mass transfer coefficient of oxygen, ethanol, and acetate, which provided better condition for the anaerobic bacteria and also decreased the mixed potentials at the electrodes. Aquivion® and glass fiber filter produced similar peak power densities after Nafion®117, likely due to the similar crossover of oxygen and fuel, and proton transport number. Also, using glass fiber filter and Aquivion® similar start-up times were observed, most likely resulting from their similar anode performance [17]. The generated peak power density further decreased when Nylon mesh, SciMat®, and Celgard® were utilized. This was followed by a large decrease with the use of J-cloth which has much higher oxygen and fuel crossover. As the variation in the proton transport number of the separators indicated a maximum potential variation of ca. 40 mV, the cathode performance was assumed to be similar using different separators in short-term. The anode performance, on the other hand, was significantly affected by the crossover of oxygen and therefore, the anode performance was likely responsible for the performance variation using different separators.
The contribution of oxygen crossover to the performance decreased when the electrode spacing increased. That is why diaphragms performed better in the 4 mm FPMFC compared to the 2 mm FPMFC. While the peak power density did not vary significantly using Nafion®117, Aquivion®, and glass fiber filter, it increased using diaphragms with higher permeability to oxygen. Zirfon® and Celgard® showed a greater extent of increase in the peak power density by increasing the electrode spacing, while the increase was less significant using Nylon mesh, SciMat®, and J-cloth. Although further increase of the electrode spacing resulted in an increased Ohmic overpotential, the 8 mm FPMFC showed an improved performance compared to the 4 and the 2 mm FPMFCs. This indicated that oxygen crossover was the main factor affecting the performance of the FPMFCs and Ohmic overpotential played a less significant role. Celgard® produced a peak power density of ca. 0.22 W·m−2 in the 8 mm FPMFC, close to that produced using Nafion®117, as a result of the decreased oxygen concentration at the anode, and a slightly improved cathode performance due to improved transfer of protons.
Table 3. Performance characteristics of the 2 mm, 4 mm, and 8 mm FPMFCs with the selected separators.
SeparatorOCV(V) ± 0.01Superficial Peak Power Density (W·m−2)Volumetric Peak Power Density (W·m−3)Coulombic Efficiency (%)
2 mm4 mm8 mm2 mm4 mm8 mm2 mm4 mm8 mm2 mm4 mm8 mm
Nafion®1170.750.760.770.24 ± 0.020.24 ± 0.020.25 ± 0.02110 ± 858 ± 430 ± 210.7 ± 0.511.7 ± 0.613.1 ± 0.2
Aquivion®E79-030.710.720.730.17 ± 0.010.18 ± 0.020.18 ± 0.0179 ± 543 ± 422 ± 17.9 ± 0.69.6 ± 0.610.1 ± 0.3
Celgard®55110.570.600.640.14 ± 0.010.18 ± 0.010.22 ± 0.0165 ± 344 ± 127 ± 16.8 ± 0.39.2 ± 0.411.1 ± 0.2
Zirfon®Perl0.580.600.620.14 ± 0.010.17 ± 0.010.19 ± 0.0164 ± 340 ± 222 ± 18.3 ± 0.29.4 ± 0.311.1 ± 0.8
Nylon mesh0.500.510.530.11 ± 0.010.13 ± 0.010.17 ± 0.0150 ± 230 ± 320 ± 15.3 ± 0.26.4 ± 0.18.1 ± 0.2
Glass fiber filter0.610.620.630.16 ± 0.010.16 ± 0.010.18 ± 0.0177 ± 438 ± 221 ± 28.0 ± 0.58.6 ± 0.410.5 ± 0.1
SciMat®700/200.460.470.490.08 ± 0.010.10 ± 0.010.14 ± 0.0137 ± 125 ± 117 ± 14.3 ± 0.16.1 ± 0.18.5 ± 0.3
J-cloth0.410.430.470.04 ± 0.00.09 ± 0.010.15 ± 0.0118 ± 221 ± 218 ± 12.6 ± 0.16.1 ± 0.59.4 ± 0.6
Wastewater treatment efficiency decreased slightly as the electrode spacing increased (data not shown). This was due to a greater portion of the wastewater bypassing the 3D anode with larger electrode spacing. Also, the treatment efficiency increased as separators with larger pores were used, due to the high crossover of oxygen which contributed to the degradation of ethanol by the communities using oxygen as the final electron acceptor. The higher crossover of ethanol, on the other hand, resulted in direct ethanol oxidation at the cathode, and hence improved the overall treatment efficiency.
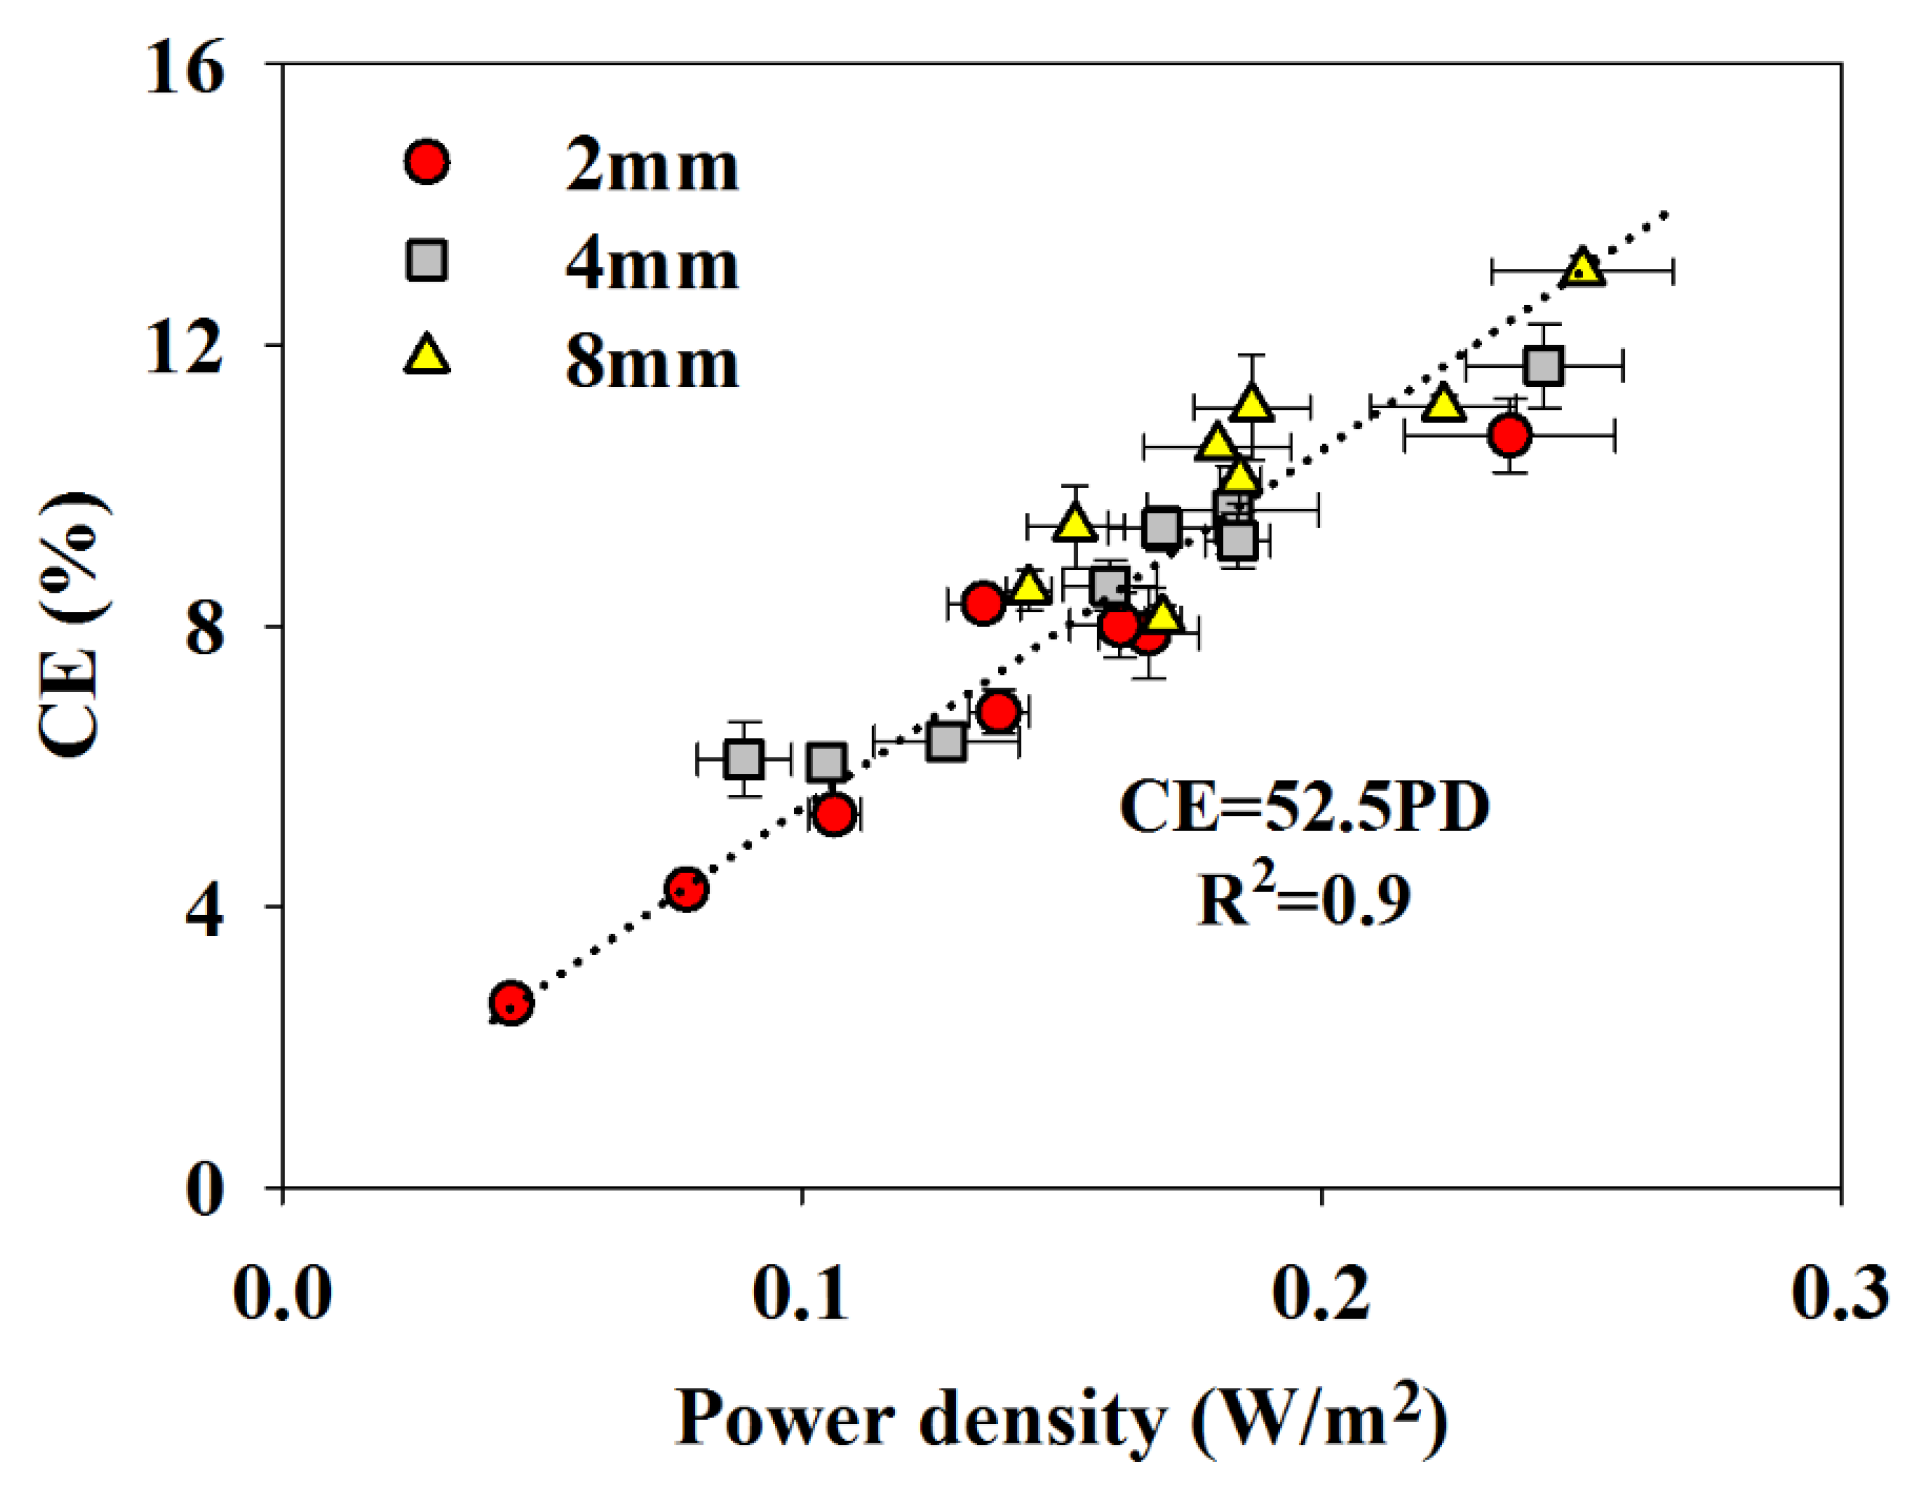
When the separators were examined in terms of the peak power density and CE, it was observed that those two parameters were linearly correlated (Figure 2), showing that the power output was mainly affected by oxygen and fuel crossover. This was in contrast with the trend reported by Zhang et al. [12], who observed a decrease in the CE (from 70% to 40%) as the power density increased (from 1 W·m−2 to 0.5 W·m−2) in a passive air-breathing MFC with the cathode placed 2 cm apart from the anode. The authors indicated that the power output increased as separators with larger pores were used, which was due to the decreased Ohmic overpotential and the improved cathode performance. The CE, on the other hand, decreased as separators with larger pores were used due to the increased crossover.
Figure 2. Coulombic efficiency versus peak power density (PD) with different separators in the 2 mm, 4 mm, and 8 mm FPMFC.
Energies 09 00078 g002
It was observed that the peak power density of the FPMFCs decreased as separators with larger pores were used, indicating that the effect of proton transport number was less significant than the oxygen crossover. Variation of the proton transport number using the selected separators could result in only 0.04 V difference in the cathode potential, which could not significantly affect the performance. Presence of the phosphate buffer is suspected to play a role in balancing the pH of the anode.
The much smaller electrode spacing applied here increased the concentration of oxygen at the anode, resulting in a significant decrease in the peak power density and the CE. The extent of the fuel crossover likely did not vary significantly with electrode spacing in the FPMFCs while the CE and the peak power density increased as the electrode spacing increased. Therefore, it could be concluded that the oxygen crossover was playing a more important role in the FPMFC performance than the fuel crossover and the proton transport number of the separator.
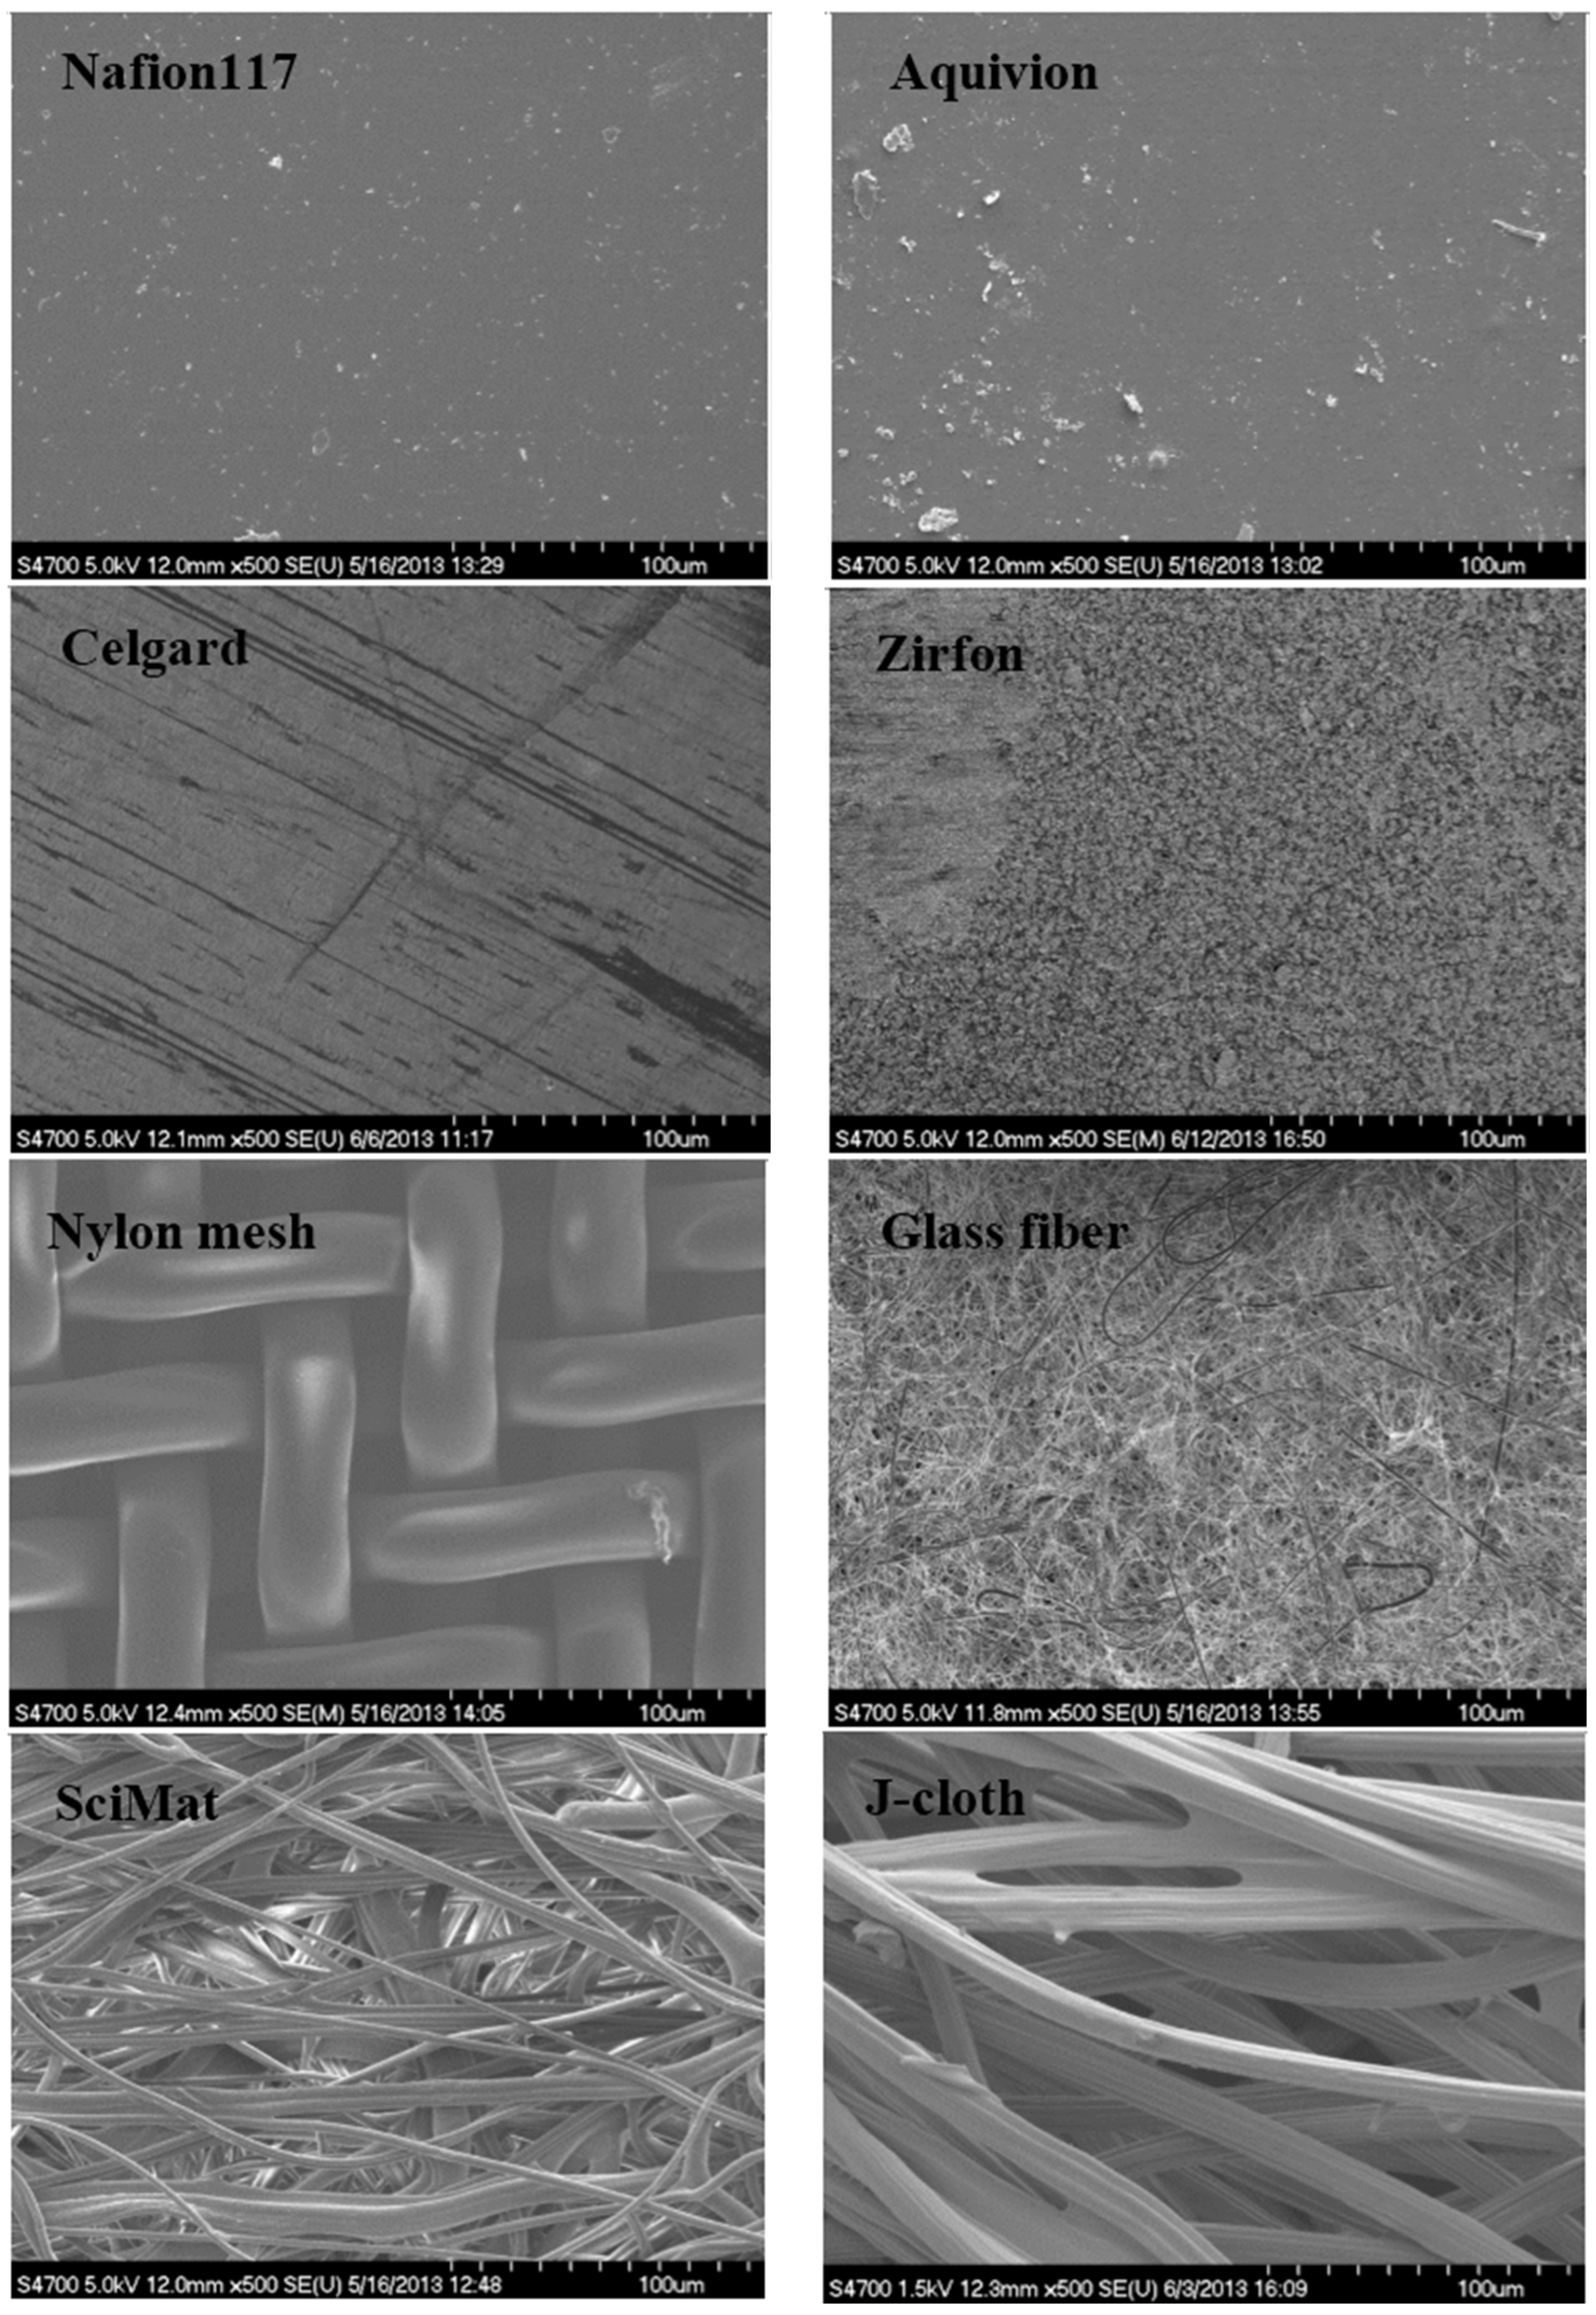
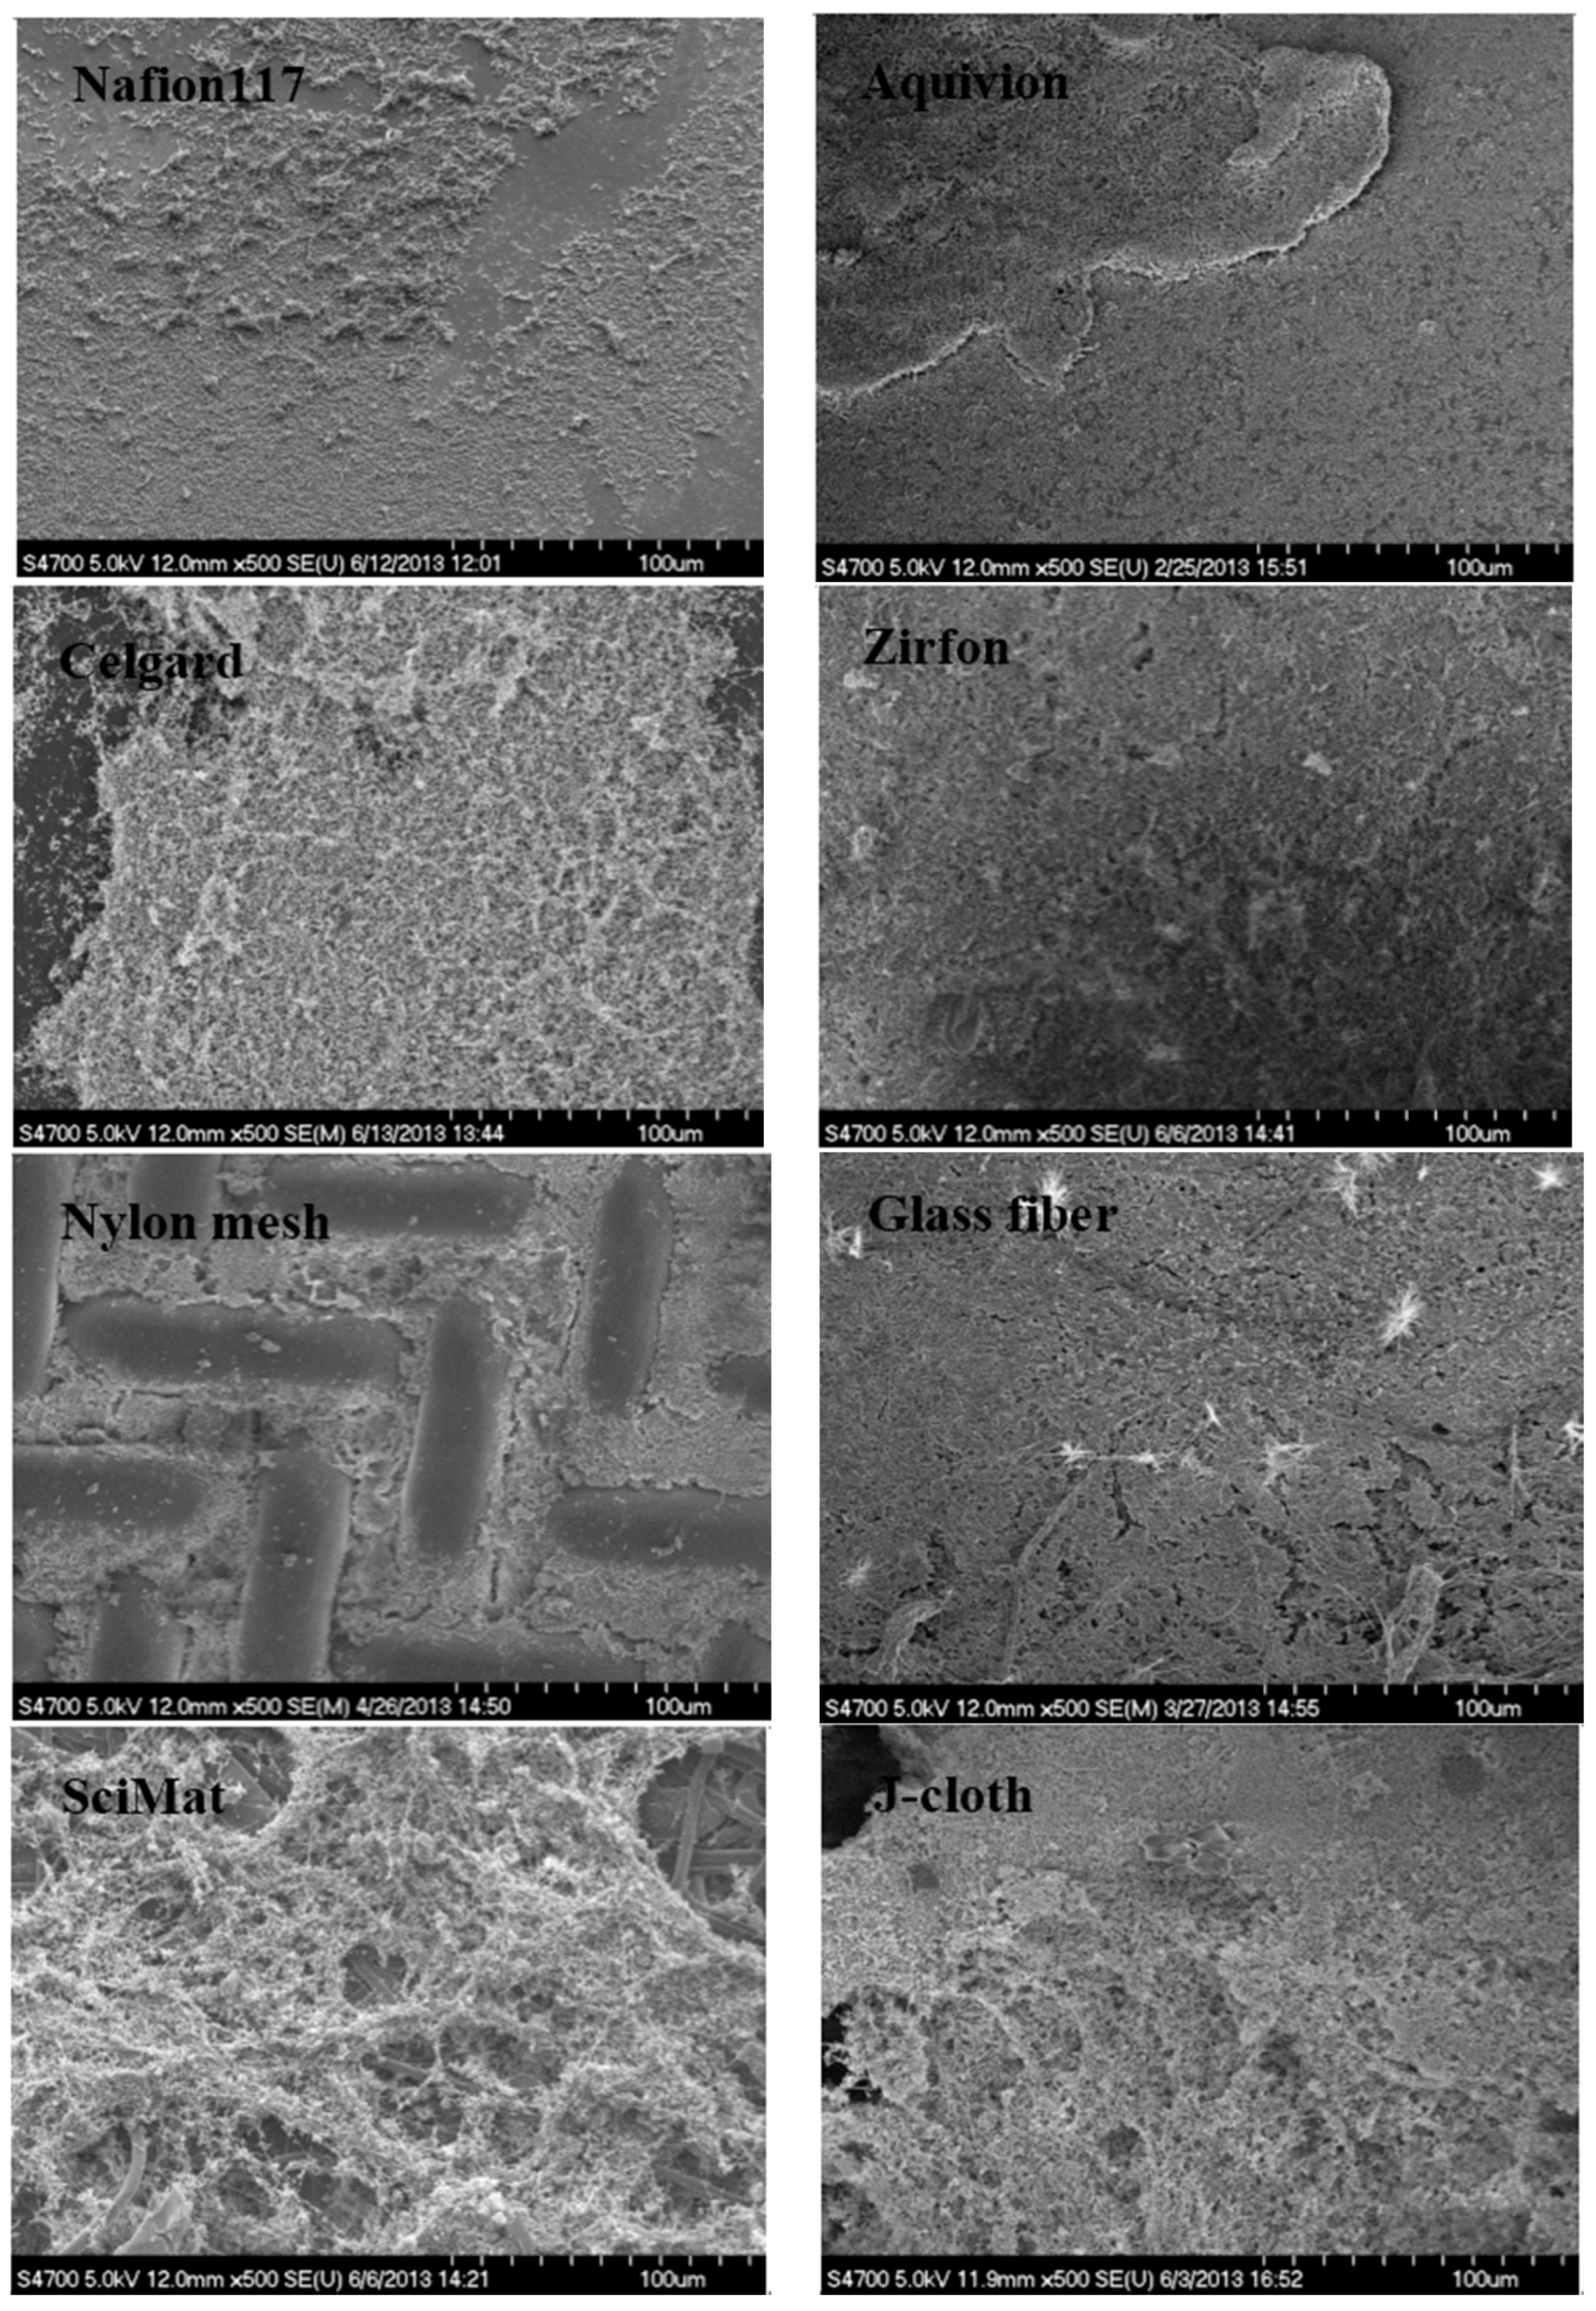
Scanning electron microscopy images from the anode-facing side of the separators from all three FPMFCs indicated significant biofilm growth on the surface of the separators, after 4 weeks of operation, except for the Nylon mesh filter (Figure 3 and Figure 4, comparison between virgin and (bio)fouled samples). In the diaphragms with pore sizes smaller than 1 µm, the pores seemed to be clogged, while in the coarse-pore diaphragms, more open areas were observed. Biofilm growth was also observed on the cathode surface with naked eye, when using diaphragms. Nylon mesh showed significant biofilm growth on the cathode, developing through the pores of Nylon.
The FPMFCs performance was characterized 2 weeks after starting to use each separator, with no significant variation in the power output with replications. This indicated that the fouling or biofilm formed on the separators did not hinder cations transfer or oxygen/ethanol crossover significantly in that period. Long-term operation of the FPMFCs using different separators and characterization of fouling or biofilm on the cathode and the separators was beyond the scope of this work and hence, not presented. Overall, the biofilm growth on the separator matrix could likely be in favor of the performance of the passive air-breathing FPMFC, especially when using micro-porous hydrophilic diaphragms. The biofilm development on the separator matrix will most likely cover the open areas shortly after the operation starts, and block the oxygen diffusing through the air cathode. The separator material should therefore be non-biodegradable or cheap to be replaced more frequently.
Figure 3. SEM images from the surface of the virgin (unused) separators.
Energies 09 00078 g003
Figure 4. SEM images from the surface of the (bio)fouled (used) separators.
Energies 09 00078 g004

2.3. Economic Considerations

To be able to implement the MFCs into the current wastewater systems, it is critical to reduce the capital cost while increasing the power output so that this technology can be considered a viable alternative. Currently, the PEMs and the Pt-based cathodes contribute to up to 90% of the capital cost of the MFCs in lab-scale setups (resulting in a capital cost of ca. $15 kg−1 COD [25]). At this stage, the capital cost of the MFCs can hardly compete with the activated sludge (ca. $0.2 kg−1 COD) and the anaerobic digestion (ca. $0.02 kg−1 COD) processes [26,27]. A major step in commercializing MFCs, therefore, seems to be the replacement of the currently used expensive PEMs as well as the Pt-based cathodes with less expensive alternatives.
A simple cost analysis was performed to evaluate the separators based on the cost they impose to the construction of the FPMFC. For this purpose, the cost of the separators as well as the cost of the other MFC components such as the Pt-based cathode, graphite felt anode, end plates, and current collectors were estimated based on the material used in the laboratory scale setup used in this research as well as some literature data. The costs of the separators were collected in some cases from the suppliers and in some other cases, from the literature, hence are rough estimates.
A lifetime of 5 years was assumed for the MFC components such as the separator (except for J-cloth with a lifetime of 1 year due to its biodegradability [19]), anode, cathode, and current collectors, with no significant performance degradation, whereas a longer lifetime (25 years) was considered for the MFC end plates. The annual costs of the MFC components were calculated based on the lifetime of the different components and an annual interest rate of 6% in a 25-year period.
The configuration of the MFC clearly determines the output power, and thus, the cost of the separator per unit power (Table 4). Because of the decreased oxygen concentration at the anode, increasing the anode chamber depth (from 2 mm to 8 mm) increases the power output and consequently decreases the separator cost per unit power. The removal efficiency, on the other hand, decreases as the anode chamber depth increases, since the portion of wastewater bypassing the anode increases.
Table 4. Annual cost of the separator per watt of power output (estimated based on a lifetime of 1 year for J-cloth and 5 years for the other separators with an interest rate of 6% in a 25-year period).
SeparatorCost ($·m−2)Annual Cost ($·m−2)Annual Cost ($·W−1)
2 mm4 mm8 mm
Nafion®117500430180018001700
Aquivion®E79-03500430250024002400
Celgard®5511202012010080
Zirfon®Perl20017012001000900
Nylon mesh55403020
Glass fiber filter55303020
SciMat®700/202020210170120
J-cloth520540240140
The cost imposed by the separator per kWh of the energy produced and the energy density per unit area of the separator within 5 years of continuous FPMFC operation is presented in Table 5.
Table 5. Cost of the separator and energy density over 5 years (estimated based on: interest rate of 6% in a 25-year period, $200 m−2 of graphite felt, $500 m−2 of Pt-based cathode, $50 m−2 of current collector, $7,000 m−3 of end plates, and $2,000 m−3 of other costs).
SeparatorCost ($·m−2)Energy Density (kWh·m−2)Separator Cost ($·kWh−1)
2 mm4 mm8 mm2 mm4 mm8 mm
Nafion®1172,200101011200200200
Aquivion®E79-032,200788290270270
Celgard®55111006810101010
Zirfon®Perl850678140110100
Nylon mesh30567555
Glass fiber filter30778555
SciMat®700/20100446202010
J-cloth30247603020
It was assumed that the costs of the other MFC components do not vary when different separators are used, so the costs of the separators were compared only. This may not be the case in an actual case where using diaphragms could lower the cathode lifetime. The analysis was also performed based on the assumption that the superficial power density would remain the same when scaling up the FPMFC, which in reality is not necessarily the case.
As can be seen in Table 5, energy densities in the 2 mm FPMFC varied significantly using different separators, with Nafion®117, Aquivion®, and glass fiber filter resulting in the highest. The sensitivity of energy density to separator type decreased as the electrode spacing increased, as a result of reduced oxygen flux towards the anaerobic anode. Overall, Nafion®117, Aquivion®, and Zirfon® (PEMs) impose the highest costs to the FPMFC construction per kWh of the energy produced. The significantly lower cost of porous diaphragms, on the other hand, indicates that there is a higher possibility for a positive offset using these separators, especially when the electrode spacing increases. Glass fiber filter and Nylon mesh provide the lowest cost per kWh, followed by Celgard® in all of the FPMFCs. While application of Nylon mesh results in significant bacterial growth on the cathode, application of Celgard® and glass fiber filter, which yield higher power output than the coarse-pore diaphragms, especially at large electrode spacings, is likely a necessary step for this technology to become practically viable.

3. Materials and Methods

3.1. Separator Characterization in Non-Inoculated Setups

3.1.1. Selected Separators and Characteristics

Several commercial separators (cation-exchange membranes and porous diaphragms) were selected for characterization to quantify their performance across a range of characteristics in addition to their relative cost. The selected separators are: Aquivion®FPSA E79-03S (Solvay Solexis, Bussi Sul Tirino, Italy), SciMat®700/20 (SciMat Ltd., Swindon, UK), Celgard®5511 (Celanese, Charlotte, NC, USA), Zirfon® (AGFA, Mortsel, Belgium), Glass fiber filter (Millipore, Billerica, MA, USA), Nylon mesh filter (Millipore), and J-cloth (Associated Brands Inc., Mississauga, ON, Canada). Nafion®117 (DuPont, Wilmington, DE, USA) was used as the baseline (control).
The selected separators were evaluated by studying the ionic resistivity and conductivity ( R S and κ S ), proton transport number ( n H + ), oxygen crossover, indicated as the mass transfer and diffusion coefficients of oxygen ( k O and D O ), ethanol crossover, indicated as the mass transfer and diffusion coefficients of ethanol ( k E and D E ), acetate crossover (as one of the products of ethanol degradation), indicated as the mass transfer and diffusion coefficients of acetate ( k A and D A ). Surface morphology of these separators was also investigated using scanning electron microscopy (SEM).

3.1.2. Characterization Techniques and Setups

The tests were performed in a glass cell, consisting of two compartments (80 mL volume of each) isolated by a separator holder (Figure 5).
Figure 5. (a): separator characterization setup; (b): electrode assembly holder used for the ionic resistivity tests, (1) O-ring; (2) holder top; (3) gasket; (4) cathode electrode; (5) separator; (6) anode electrode; (7) holder base; (8) current collectors [28].
Energies 09 00078 g005
The active surface area of the separator using this setup was 2 cm2. During the characterization, the separators were sandwiched between the two compartments using the holder. Two O-rings were used to ensure proper sealing. Neoprene stoppers were used to seal the compartments from the lab environment when required.

• Oxygen and Fuel Crossover

The concentration of dissolved oxygen (DO) in the anode chamber was used for the evaluation of the oxygen crossover. The DO measurement was carried out using a DO probe inserted into the anode chamber (aqueous) of the glass cell. The mass transfer coefficient of oxygen for each separator was measured using a 0.05 M phosphate buffer solution (PBS, ACS grade, Sigma Aldrich, Oakville, ON, Canada) in one chamber and air in the other.
In this test, both chambers were initially filled with the PBS. A bubbler was inserted into the anode chamber through the rubber stopper to assure an ambient pressure inside (no pressurization). The aqueous chamber was then sealed and purged with N2. The other chamber was then emptied using a syringe, to simulate the air-breathing configuration in a MFC. The DO concentration in the aqueous chamber was then monitored with time. The mass transfer ( k O , m·s−1) and diffusion ( D O , m2·s−1) coefficients were calculated using Equation (1) [16]:
k O = V At ln [ c 1 c 1 c 2 ] , D O = k O Y
where c 1 is the saturated oxygen concentration (M) on the air side of the separator, c 2 is the DO concentration (M) in the aqueous side at time t (s), V is the volume of water in the aqueous-chamber (m3), A is the surface area (m2), and Y is the thickness of separator (m).
Mass transfer coefficients in each separator were measured using the glass cell filled with DI water in both chambers and adding either ethanol or acetate to one chamber only (donor compartment). Ethanol or acetate was then injected into the donor compartment and allowed to diffuse over time. The contents of the fuel-free chamber were cycled through a refractive index (RI) detector (Waters 2414 refractive index detector, Waters, Milford, MA, USA) at a flow rate of 5 mL·min−1 by an HPLC pump (LC-10ATvp HPLC Pump, Shimadzu, Columbia, MD, USA), where the increasing concentration of fuel (ethanol or acetate) was monitored with time.
The mass transfer ( k E / A , m·s−1) and diffusion ( D E / A , m2·s−1) coefficients of ethanol or acetate were calculated using the mass balance [16]:
k E / A = V 2 At ln [ c 1 c 1 2 c 2 ] , D E / A = k E / A Y
where c 1 is ethanol or acetate concentration (M) in the anode (donor compartment) at t = 0 , c 2 is ethanol or acetate concentration (M) in the cathode at time t (s), V is the volume of the water in either one of the chambers (m3), A is the open surface area (m2), and Y is the thickness of the separator (m).

• Ionic Resistivity

Electrochemical impedance spectroscopy (EIS) technique was used to measure ionic resistivity, which consisted of superimposing, at open circuit, a sinusoidal signal with an amplitude of 0.01 V and a frequency varying from 100 KHz to 0.005 Hz (VERSASTATE 3, Princeton Applied Research, Oak Ridge, TN, USA). The aqueous chamber was filled with 0.05 M PBS. Pt-coated carbon paper electrodes (1 mg·cm−2) were used as the working and the counter electrodes. Two platinum current collectors were used to connect the electrodes to the potentiostat. The ionic resistivity was investigated by sandwiching the separator between Pt-coated carbon paper working and counter electrodes and the current collectors. Since EIS was carried out in an ex-situ apparatus (and not MFC) with identical working and counter electrodes (by varying the type of separator), only high frequency resistance (HFR) values (Ohmic loss through the membranes) were reported. The Ohmic resistance was, then, determined using the Nyquist plot at high frequencies and was normalized based on the surface area of the separator (2 cm2) to give the ionic resistivity. The ionic conductivity was calculated by normalizing the ionic resistivity based on the thickness of the separator:
κ S = Y / R S
where κ S is the ionic conductivity (S·m−1), R S is the ionic resistivity (Ω·m2), and Y is the thickness of the separator (m).

• Proton Transport Number

Chronoamperometry was used to investigate the pH splitting extent. A pH probe was used to monitor the pH. The extent of pH splitting was investigated by measuring the portion of the protons produced in the anode chamber, that were delivered to the cathode chamber through by the separator (referred to as the proton transport number [20]). This was measured by monitoring the pH change in the aqueous chamber in relation to the overall electric charge transferred during the chronoamperometry test. The working electrode was a platinized titanium mesh (placed in the aqueous chamber) and the counter electrode was a Pt-coated carbon paper connected to a platinum current collector. The aqueous chamber was filled with 0.05 M KNO3. A fixed electric charge of 10 C was transferred at different rates (1–50 A·m−2) and the pH change in the aqueous chamber was monitored. The proton transport number was then obtained by calculating the electrical current equivalent to the transferred protons [20]:
n H + = ( 1 VF Δ c H + anode q )
where V is the volume of the electrolyte solution (m3), F is the Faraday constant (C·mol−1), Δ C H + anode is the change in the protons concentration in the aqueous chamber (mol·m−3), and q is the electric charge (C).

3.2. Separator Evaluation in the FPMFCs

3.2.1. FPMFC Design and Components

The passive air breathing FPMFCs consisted of a graphite plate with a pocket (anode chamber cross-sectional dimensions: 5 cm × 10 cm) and a graphite frame (to sandwich the PEM and the air breathing cathode against the pocket (Figure 6).
Figure 6. Exploded view of the passive air-breathing FPMFC configuration used in this work.
Energies 09 00078 g006
The utilization of electrically conductive graphite, to fabricate the components of the FPMFC, guaranteed the electrical connection between each electrode and its designated compartment, and served as a current collector. This eliminated the complexity of inserting an external current collector. Two grooves were used alongside the inlet and the outlet to provide uniform electrolyte distribution within the anode compartment. Three FPMFCs were constructed with similar cross-sectional surface area with three different depths of the anode chamber (2 mm, 4 mm, and 8 mm). Neoprene gaskets (0.5 mm in thickness) were installed to provide insulation between the electro-conductive components of the FPMFCs.
Graphite felt was used as the 3D anode material (5 cm × 9.5 cm, 3 mm thick, GF-S6-03, Electrolytica, Amherst, NY, USA). Graphite felt anodes were treated by soaking in pure acetone, and then boiled in 1 M solution of HNO3 for 1 h. They were then stored in DI water. Expanded stainless steel sheets were used to support the electrical connection between the anode and the hosting compartment. This resulted in anode compression from 3 mm to 2 mm in thickness and a controlled electrode spacing. The experiments were performed using a single layer of graphite felt (GF) placed against the furthest (from the separator) side of the anode chamber. The electrode spacing was estimated based on the depth of the anode chamber and gasket, and the thickness of the anode electrode, and was ca. 0.5 mm, 2.5 mm, and 6.5 mm in the 2 mm, 4 mm, and 8 mm FPMFCs, respectively, and was confirmed by measuring the spacing for each assembly.
The air cathode consisted of a carbon cloth (projected surface area: 5 cm × 10 cm; 50 wt.% wet-proofing, E-TEK, Somerset, NJ, USA) coated with Pt catalyst layer (Pt loading of 1 mg·m−2) on the side facing the membrane and three layers of the 60 wt.% PTFE suspension on the other side [22]. All separators (except for the glass fiber filter) were stored in DI water for 24 h prior to use. The separator and carbon cloth cathode were sandwiched between the anode chamber and the perforated graphite plates, with the catalyst side of the cathode facing the separators and PTFE-coated side exposed to the air. A new cathode was used for each separator evaluation.

3.2.2. Operation and Performance Characterization

The FPMFCs were inoculated with primary treated wastewater (UBC wastewater treatment pilot plant, Vancouver, BC, Canada) prior to the characterization of the separators. The wastewater was enriched with ethanol (85 mM), minerals, and vitamins [29]. The temperature of the feed tank was controlled at 30 ± 1 °C and the feed container was maintained oxygen-free by continuous N2 purging. The nutrient-enriched wastewater was pumped continuously through the FPMFCs at 0.1 mL·min−1 for 2 months using a peristaltic pump. During the inoculation period, the FPMFCs were operated with the electrodes connected through a 500 Ω external resistor.
The FPMFCs were then allowed to operate for another 2 months, with each separator operating for 4 weeks. A methanogens inhibitor (2-bromoethanesulfonate at a concentration of 0.3 mM [30]) was added to both the primary treated and the synthetic wastewaters to prevent methanogenesis from ethanol [31].
The performance of the FPMFCs was characterized by investigating the apparent (superficial) power density and polarization curves, Ohmic resistance, and Coulombic and COD removal efficiencies, 2 weeks after starting the operation with each separator. The COD measurements were carried out according to Standard Method 5220 (Hach COD system, Hach Company, Mississuaga, ON, Canada) [24]. Chronoamperometry was used to obtain the polarization curves allowing minimum of 1 h for the stabilization of each step. The current and power were normalized based on the separator geometrical surface area (50 cm2) and the anode chamber volume (10 mL, 20 mL, and 40 mL).

4. Conclusions

The ionic resistivity, oxygen mass transfer and diffusion coefficients, and proton transport number were investigated in a non-inoculated passive air-breathing setup while the mass transfer and diffusion coefficients of ethanol and acetate were investigated in a non-inoculated aqueous setup. The separators were then evaluated in three inoculated passive air-breathing FPMFCs with different electrode spacing.
The pore size and thickness of the separators played key roles in the oxygen and fuel crossover, and the resistivity of the separators. The crossover increased as separators with larger pores were tested. The resistivity, on the other hand, increased as the thickness increased and/or the pore sized decreased, resulting in poor ionic conductivity. The proton transport number of the separators was in the range of 0.59–0.92, corresponding to a maximum cathodic pH elevation to ca. 11 in absence of a PBS. The oxygen and fuel crossover played critical roles on current generation in the FPMFCs with small electrode spacing. The peak power density and CE decreased when separators with higher crossover were used at the smallest electrode spacing applied. As the electrode spacing increased, the sensitivity of the peak power to the crossover decreased, and the peak power density and CE both increased. Nafion®117 produced the highest peak power density in all three FPMFCs. Celgard® produced a peak power density of ca. 0.22 W·m−2 in the 8 mm FPMFC, close to that produced using Nafion®117 (ca. 0.25 W·m−2). Celgard® offered the most economical alternative to Nafion®117, especially in the 8 mm FPMFC ($10 kWh−1 compared to $200 kWh−1).

Acknowledgments

This work was funded by the Natural Sciences and Engineering Research Council of Canada (NSERC) and the Agriculture Agri-Food Canada (AAFC), and supported by the National Research Council Canada (NRC) and the University of British Columbia (UBC).

Author Contributions

Experimental design, execution, data collection and analysis, manuscript preparation, and revision was performed by Sona Kazemi under supervision of Madjid Mohseni and Khalid Fatih.

Conflicts of Interest

The authors declare no conflict of interest. The founding sponsors had no role in the design of the study; in the collection, analyses, or interpretation of data; in the writing of the manuscript, and in the decision to publish the results.

Abbreviations

The following abbreviations and symbols have been used in this manuscript.
AbbreviationDefinition
ACSAmerican Chemical Society
CECoulombic Efficiency
CEMCation Exchange Membrane
CODChemical Oxygen Demand
DMFCDirect Methanol Fuel Cell
DIDe-Ionized
DODissolved Oxygen
EISElectrochemical Impedance Spectroscopy
FPMFCFlat-Plate Microbial Fuel Cell
GFGraphite Felt
HFRHigh Frequency Resistance
MFCMicrobial Fuel Cell
OCVOpen Circuit Voltage
PBSPhosphate Buffer Solution
RIRefractive Index
SHEStandard Hydrogen Electrode
UBCUniversity of British Columbia
3D3 Dimentional
SymbolDefinitionUnit
DElectrode Spacingm
YSeparator thicknessm
VVolume of the electrolyte solutionm3
FFaraday ConstantC·mol−1
TTimes
ASurface Area of the Separatorm2
QElectric ChargeC
nH+Proton Transport Number of the Separator-
RSIonic Resistivity of the SeparatorΩ·m2
KSIonic Conductivity of the SeparatorS·m−1
Δ C H + anode Change in the Protons Concentration in the Aqueous Chambermol·m−3
c1Concentration of the Desired Species at the Beginning of the Experimentmol·m−3
c2Concentration of the Desired Species at the End of the Experimentmol·m−3
DODiffusion Coefficient of Oxygen in the Separatorm2·s−1
DEDiffusion Coefficient of Ethanol in the Separatorm2·s−1
DADiffusion Coefficient of Acetate in the Separatorm2·s−1
kOMass Transfer Coefficient of Oxygen in the Separatorm2·s−1
kEMass Transfer Coefficient of Ethanol in the Separatorm2·s−1
kAMass Transfer Coefficient of Acetate in the Separatorm2·s−1

References

  1. Dekker, A.; Heijne, A.T.; Saakes, M.; Hamelers, H.V.M.; Buisman, C.J.N. Analysis and improvement of a scaled-up and stacked microbial fuel cell. Environ. Sci. Technol. 2009, 43, 9038–9042. [Google Scholar] [CrossRef]
  2. Min, B.; Logan, B.E. Continuous electricity generation from domestic wastewater and organic substrates in a flat plate microbial fuel cell. Environ. Sci. Technol. 2004, 38, 5809–5814. [Google Scholar] [CrossRef] [PubMed]
  3. Wang, J.T.; Wainright, J.S.; Savinell, R.F.; Litt, M. A direct methanol fuel cell using acid-doped polybenzimidazole as polymer electrolyte. J. Appl. Electrochem. 1996, 26, 751–756. [Google Scholar] [CrossRef]
  4. Jeon, M.K.; Won, J.Y.; Oh, K.S.; Lee, K.R.; Woo, S.I. Performance degradation study of a direct methanol fuel cell by electrochemical impedance spectroscopy. Electrochim. Acta 2007, 53, 447–452. [Google Scholar]
  5. Zhai, F.; Guo, X.; Fang, J.; Xu, H. Synthesis and properties of novel sulfonated polyimide membranes for direct methanol fuel cell application. J. Memb. Sci. 2007, 296, 102–109. [Google Scholar]
  6. Li, W.W.; Sheng, G.P.; Liu, X.W.; Yu, H.Q. Recent advances in the separators for microbial fuel cells. Bioresour. Technol. 2010, 102, 244–252. [Google Scholar]
  7. Harnisch, F.; Schröder, U.; Scholz, F. The suitability of monopolar and bipolar ion exchange membranes as separators for biological fuel cells. Environ. Sci. Technol. 2008, 42, 1740–1746. [Google Scholar] [PubMed]
  8. Zhang, X.; Cheng, S.; Wang, X.; Huang, X.; Logan, B.E. Separator characteristics for increasing performance of microbial fuel cells. Environ. Sci. Technol. 2009, 43, 8456–8461. [Google Scholar] [PubMed]
  9. Ghasemi, M.; Wan-Daud, W.R.; Ismail, M.; Rahimnejad, M.; Ismail, A.F.; Leong, J.X.; Miskan, M.; Ben-Liew, K. Effect of pre-treatment and biofouling of proton exchange membrane on microbial fuel cell performance. Int. J. Hydrog. Energy 2013, 38, 5480–5484. [Google Scholar]
  10. Winfield, J.; Ieropoulos, I.; Rossiter, J.; Greenman, J.; Patton, D. Biodegradation and proton exchange using natural rubber in microbial fuel cells. Biodegradation 2013, 24, 733–739. [Google Scholar] [CrossRef] [PubMed]
  11. Liu, H.; Logan, B.E. Electricity generation using an air-cathode single chamber microbial fuel cell in the presence and absence of a proton exchange membrane. Environ. Sci. Technol. 2004, 38, 4040–4046. [Google Scholar] [CrossRef]
  12. Zhang, X.; Cheng, S.; Huang, X.; Logan, B.E. The use of nylon and glass fiber filter separators with different pore sizes in air-cathode single-chamber microbial fuel cells. Energy Environ. Sci. 2010, 3, 659–664. [Google Scholar] [CrossRef]
  13. Fan, Y.; Hu, H.; Liu, H. Enhanced Coulombic efficiency and power density of air-cathode microbial fuel cells with an improved cell configuration. J. Power Sources 2007, 171, 348–354. [Google Scholar] [CrossRef]
  14. Biffinger, J.C.; Ray, R.; Little, B.; Ringeisen, B.R. Diversifying biological fuel cell designs by use of nanoporous filters. Environ. Sci. Technol. 2007, 41, 1444–1449. [Google Scholar] [CrossRef] [PubMed]
  15. Pandey, A.; Lee, D.J.; Logan, B.E.; Zhang, X.; Cheng, S.; Liang, P.; Huang, X. Scalable air cathode microbial fuel cells using glass fiber separators, plastic mesh supporters, and graphite fiber brush anodes. Bioresour. Technol. 2011, 102, 372–375. [Google Scholar]
  16. Jung, R.K.; Cheng, S.; Oh, S.E.; Logan, B.E. Power generation using different cation, anion, and ultrafiltration membranes in microbial fuel cells. Environ. Sci. Technol. 2007, 41, 1004–1009. [Google Scholar]
  17. Chae, K.J.; Choi, M.; Ajayi, F.F.; Park, W.; Chang, I.S.; Kim, I.S. Mass transport through a proton exchange membrane (Nafion) in microbial fuel cells. Energy Fuels 2008, 22, 169–176. [Google Scholar] [CrossRef]
  18. Kulesza, P.J.; Alonso-Vante, N.; Augustynski, J.; Pant, D.; van Bogaert, G.; de Smet, M.; Diels, L.; Vanbroekhoven, K. Use of novel permeable membrane and air cathodes in acetate microbial fuel cells. Electrochim. Acta 2010, 55, 7710–7716. [Google Scholar]
  19. Sevda, S.; Dominguez-Benetton, X.; Vanbroekhoven, K.; Sreekrishnan, T.R.; Pant, D. Characterization and comparison of the performance of two different separator types in air–cathode microbial fuel cell treating synthetic wastewater. Chem. Eng. J. 2013, 228, 1–11. [Google Scholar] [CrossRef]
  20. Rozendal, R.A.; Hamelers, H.V.M.; Buisman, C.J.N. Effects of membrane cation transport on pH and microbial fuel cell performance. Environ. Sci. Technol. 2006, 40, 5206–5211. [Google Scholar] [CrossRef]
  21. Heijne, A.T.; Hamelers, H.V.M.; Buisman, C.J.N. Microbial fuel cell operation with continuous biological ferrous iron oxidation of the catholyte. Environ. Sci. Technol. 2007, 41, 4130–4134. [Google Scholar] [CrossRef]
  22. Zhang, X.; Sun, H.; Liang, P.; Huang, X.; Chen, X.; Logan, B.E. Air-cathode structure optimization in separator-coupled microbial fuel cells. Biosens. Bioelectron. 2011, 30, 267–271. [Google Scholar] [PubMed]
  23. Logan, B.E. Scaling up microbial fuel cells and other bioelectrochemical systems. Appl. Microbiol. Biotechnol. 2010, 85, 1665–1671. [Google Scholar] [PubMed]
  24. Eaton, A.D.; Clesceri, L.S.; Greenberg, A.E.; Franson, M.A.H. Standard Methods for Examination of Water and Wastewater, 17th ed.; American Public Health Association (APHA): Washington, DC, USA, 1995. [Google Scholar]
  25. Rozendal, R.A.; Hamelers, H.V.M.; Rabaey, K.; Keller, J.; Buisman, C.J.N. Towards practical implementation of bioelectrochemical wastewater treatment. Trends Biotechnol. 2008, 26, 450–459. [Google Scholar] [PubMed]
  26. Aiyuk, S.; Forrez, I.; Lieven, D.K.; van Haandel, A.; Verstraete, W. Anaerobic and complementary treatment of domestic sewage in regions with hot climates—A review. Bioresour. Technol. 2006, 97, 2225–2241. [Google Scholar] [PubMed]
  27. Pham, T.H.; Rabaey, K.; Aelterman, P.; Clauwaert, P.; de Schamphelaire, L.; Boon, N.; Verstraete, W. Microbial fuel cells in relation to conventional anaerobic digestion technology. Eng. Life Sci. 2006, 6, 285–292. [Google Scholar]
  28. Lipkowski, J.; Roscoe, S.; Lam, A.; Wilkinson, D.P.; Zhang, J. Novel approach to membraneless direct methanol fuel cells using advanced 3D anodes. Electrochim. Acta 2008, 53, 6890–6898. [Google Scholar]
  29. SKazemi; Mohseni, M.; Fatih, K. Passive air breathing flat-plate microbial fuel cell operation. J. Chem. Technol. Biotechnol. 2015, 90, 468–475. [Google Scholar]
  30. Kim, J.R.; Min, B.; Logan, B.E. Evaluation of procedures to acclimate a microbial fuel cell for electricity production. Appl. Microbiol. Biotechnol. 2005, 68, 23–30. [Google Scholar]
  31. Tatton, M.J.; Archer, D.B.; Powell, G.E.; Parker, M.L. Methanogenesis from ethanol by defined mixed continuous cultures. Appl. Envir. Microbiol. 1989, 55, 440–445. [Google Scholar]

