Article

Production of Synthetic Natural Gas from Refuse-Derived Fuel Gasification for Use in a Polygeneration District Heating and Cooling System

1
IDMEC, Instituto Superior Técnico, Universidade de Lisboa, 1049-001 Lisboa, Portugal
2
Department of Energy Technology, KTH Royal Institute of Technology, S-100 44 Stockholm, Sweden
3
Department of Materials Science and Engineering, KTH Royal Institute of Technology, S-100 44 Stockholm, Sweden
*
Author to whom correspondence should be addressed.
Energies 2016, 9(12), 1080; https://doi.org/10.3390/en9121080
Submission received: 30 August 2016 / Revised: 24 November 2016 / Accepted: 12 December 2016 / Published: 17 December 2016
(This article belongs to the Special Issue Energy and Waste Management)

Abstract

:
Nowadays conventional district heating and cooling (DHC) systems face the challenge of reducing fossil fuel dependency while maintaining profitability. To address these issues, this study examines the possibility of retrofitting DHC systems with refuse-derived fuel (RDF) gasifiers and gas upgrading equipment. A novel system is proposed based on the modification of an existing DHC system. Thermodynamic and economic models were established to allow for a parametric analysis of key parameters. The study revealed that such an upgrade is both feasible and economically viable. In the basic scenario, the retrofitted DHC system can simultaneously produce 60.3 GWh/year of heat, 65.1 GWh/year of cold, 33.2 GWh/year of electricity and 789.5 tons/year of synthetic natural gas. A significant part of the heat load can be generated from the waste heat of the upgrading equipment. The investment in retrofitting the polygeneration DHC system presents a payback period of 3 years.

1. Introduction

District heating and cooling (DHC) systems consist of three main units: a combined heat and power (CHP) plant, chillers for cold production, and a thermal energy distribution network for customers. Nowadays traditional DHC systems have to address two principal challenges. Firstly, despite the relatively high share of renewable resources currently already integrated in CHP units, DHC systems still need to lessen their dependence on fossil fuels [1]. Secondly, the profitability of the operation of these systems needs to be enhanced. The latter depends significantly of the fluctuations in electricity prices and heating and cooling demand profiles.
An alternative solution for these problems altogether might be the upgrading of traditional DHC systems to polygeneration systems [2,3,4,5]. Polygeneration applied to DHC systems often involves diversification of fuel resources and products through the application of suitable technologies. A number of products can be produced in DHC systems: ethanol [3,6] and other biofuels [7,8,9,10,11], chemicals (i.e., ammonia and olefins) [7], fertilizers [11], biogas [10] and synthetic natural gas (SNG) [7,12,13,14]. SNG emerges as a suitable product to be associated to a polygeneration DHC system. In fact, as a direct substitute of natural gas (NG), it can be distributed directly through the existing NG distribution networks [15], and it has a stable demand regardless of system location.
The first commercial CHP plant producing simultaneously electricity, heat and SNG is located in Güssing, Austria [16]. The plant produces SNG from wood chips with the aid of a fast internal circulating fluid bed (FICFB) gasifier. The plant thermal and electrical outputs are 4.5 MW and 2 MW, respectively. A similar facility, GoBiGas, is currently operating in Gothenburg, Sweden [11].
Among the renewable resources, biomass, and in particular refuse-derived fuel (RDF) from municipal solid waste (MSW), is a highly interesting fuel to be used in polygeneration DHC systems. European Union legislation for waste management (Directives 2006/12/EC and 1999/31/EC of the European Parliament and of the Council) [17] addresses MSW utilization and its energy recovery potential. In this case, the RDF application to polygeneration DHC systems represents a promising and more sustainable solution to the waste recycling problem as compared to single-output supply of bio-methane [18,19], SNG [20], or biogas [21]. Despite this, the application of RDF as the main fuel resource in polygeneration DHC systems with SNG generation is not well-documented in the literature. Related investigations have essentially employed wood and wood-derived biomass resources [12,13,14,22,23] and organic residues [7]. Air-steam gasification has been identified as an appropriate technology for RDF upgrading. This technology converts the fuel into combustible gases (CO2, CO, H2, CH4 and others)—the so-called synthetic gas or syngas—along with solids (charcoal or char) and liquids (tar) [24]. Additionally, the technology features lower investment and operational costs as compared to oxygen or steam gasification, and the syngas has an acceptable quality [25]. Moreover, it is a relatively well established technology with several facilities in operation [11,26]. The produced syngas is often upgraded to SNG through the methanation process.
Given the potential of using wastes for SNG production [27,28], the objective of this work is to evaluate the possibility of retrofitting an existing DHC system by integration of RDF gasification for SNG production in order to reduce the fossil dependence and to increase the profitability from the DHC system operation. To this end, a novel system, based on a retrofitted existing DHC facility, is proposed. Thermodynamic and economic models were created and the technical feasibility and economic viability of SNG production using RDF as the main fuel was evaluated.

2. Materials and Methods

An existing natural gas-fired DHC system located in Lisboa, Portugal, was chosen as the case study: The Climaespaco facility has 60 km of pipelines for heat/cold distribution with supply and return temperatures of 100 °C/65 °C and 4 °C/12 °C [29]. Daily outputs of heat, cold and electricity were obtained from the plant for 2012.
The thermodynamic and economic models for the new system evaluation were developed in MATLAB®. Among other computer products currently available, this software was selected for its ability to handle a large number of variables in a flexible framework. The software allows for the design of virtually any system type and equipment and for the simulation of a wide range of parameters.

2.1. Thermodynamic Model

Figure 1 presents the schematic of the proposed polygeneration system. In the gasifier RDF is converted to syngas, char and ash at elevated pressure (300 kPa) under the following operating conditions (unless specified otherwise): gasification temperature, Tgas = 1173 K, equivalence ratio, ER = 0.03, and steam to carbon molar ratio, S/C = 2.2. Here S/C ratio stands for the molar quantity of steam in the gasifier per molar quantity of carbon (C) in the RDF. This parameter is controlled by the steam inflow, m s t e a m   g a s (kg/s of steam per kg/s of RDF, m RDF ), defined as [25]:
m s t e a m   g a s = 18 · C · m RDF · ( S / C ) 12
The char is separated from the syngas stream in the cyclone, while the ash is removed directly from the products in the gasifier. The pretreated syngas and the char are cooled down in the gasifier heat exchanger (HEX) to 313 K, which is a prerequisite for the Venturi scrubber operation, and, as a consequence, water condensates are thereby removed from the syngas. Moreover, the surplus or waste heat diverted from the syngas stream in this unit is exploited for the heat load production for the DHC customers. After the Venturi scrubber, the cold syngas flow is purified from the remaining char and separated into two streams. One stream is led to the compressor and gas turbine (GT) for electricity production, with subsequent heat recovery from the exhaust gases in the heat recovery steam generator (HRSG). The second stream enters the SNG production unit. The amount of syngas used for the production of SNG (here referred to as SNG production rate or ratio of SG processed to SNG to SG consumed in the GT) is calculated as a percentage of the amount of syngas consumed in the GT. Finally, the steam produced in the HRSG is divided into four streams: one to the gasifier, other to the SNG production unit, another to the water-steam heat exchanger (WSt HEX) for the heat load production (if needed), and a last one to the absorption chiller for the cold production. The cold thermal energy production through the absorption chiller depends upon steam availability. Additional cooling is supplied by the compression chiller.
To model the retrofitted system the following assumptions were considered:
  • Ideal gas behavior;
  • Steady state operation—all equipment parameters are constant and may be found in references [29,30,31];
  • GT operates always at full load;
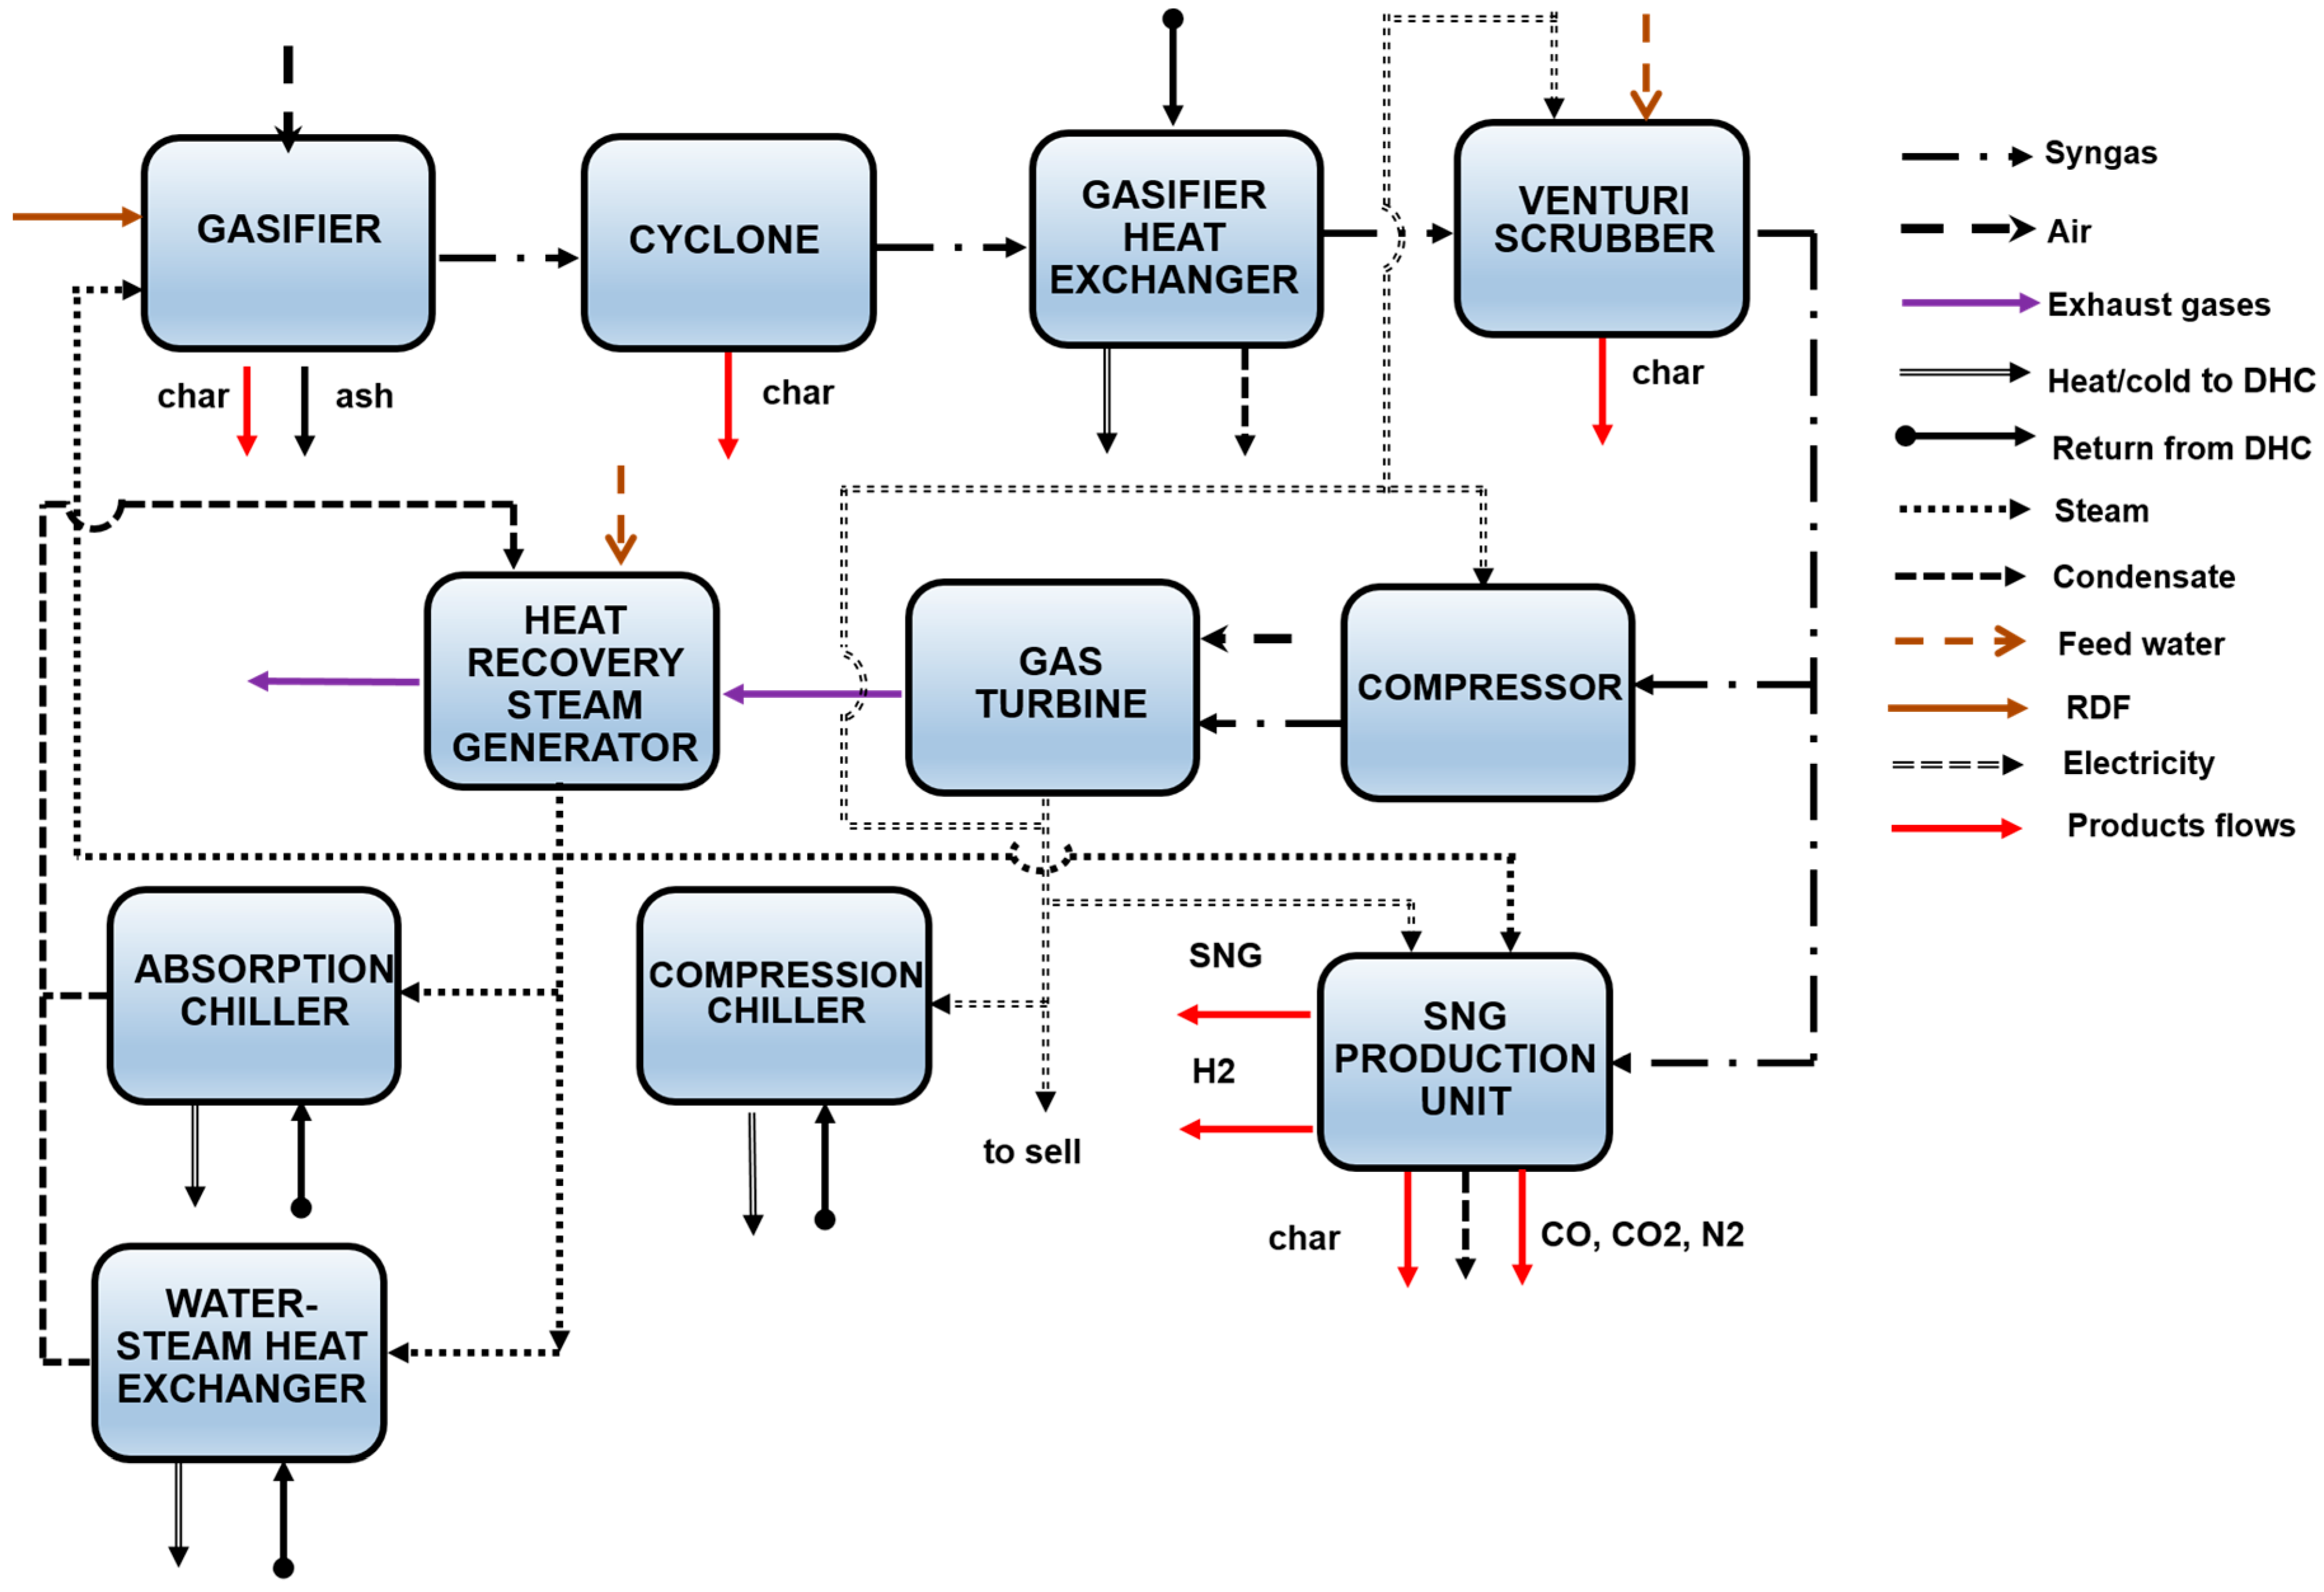
  • The gasifier and the SNG production units have priority in steam supply—excess steam (if available) is delivered to the absorption chiller and to the WSt HEX;
  • The main internal electricity consumers are compressors, Venturi scrubbers and the compression chiller;
  • The heat load for the DHC customers is supplied from two sources: (i) From the waste heat from the gasifier HEX and the SNG production units; and (ii) from the WSt HEX;
  • The cold load for the DHC customers is supplied from the absorption and compression chillers, with the priority given to the former;
  • The exhaust gas energy potential is exploited in the HRSG to meet the steam demand;
  • The condensate return comes only from the WSt HEX and the absorption chiller—condensate losses are compensated by the feed water influx.
Modeling of the steam-air gasifier was performed using the stoichiometric equilibrium model since it is able to predict the syngas component yield, regardless of the gasifier design, and it is appropriate for the process design under study [25]. Since the model establishment requires the selection of core substances present in the reactor (syngas components and gasification mechanism), the following assumptions were adopted:
  • CO2, CO, H2, CH4, H2O and char were selected as the primary products (more than 10−4 mol. %) within the gasification temperature range (600–1500 K), as discussed in [32,33]—tars are omitted from the model for simplicity;
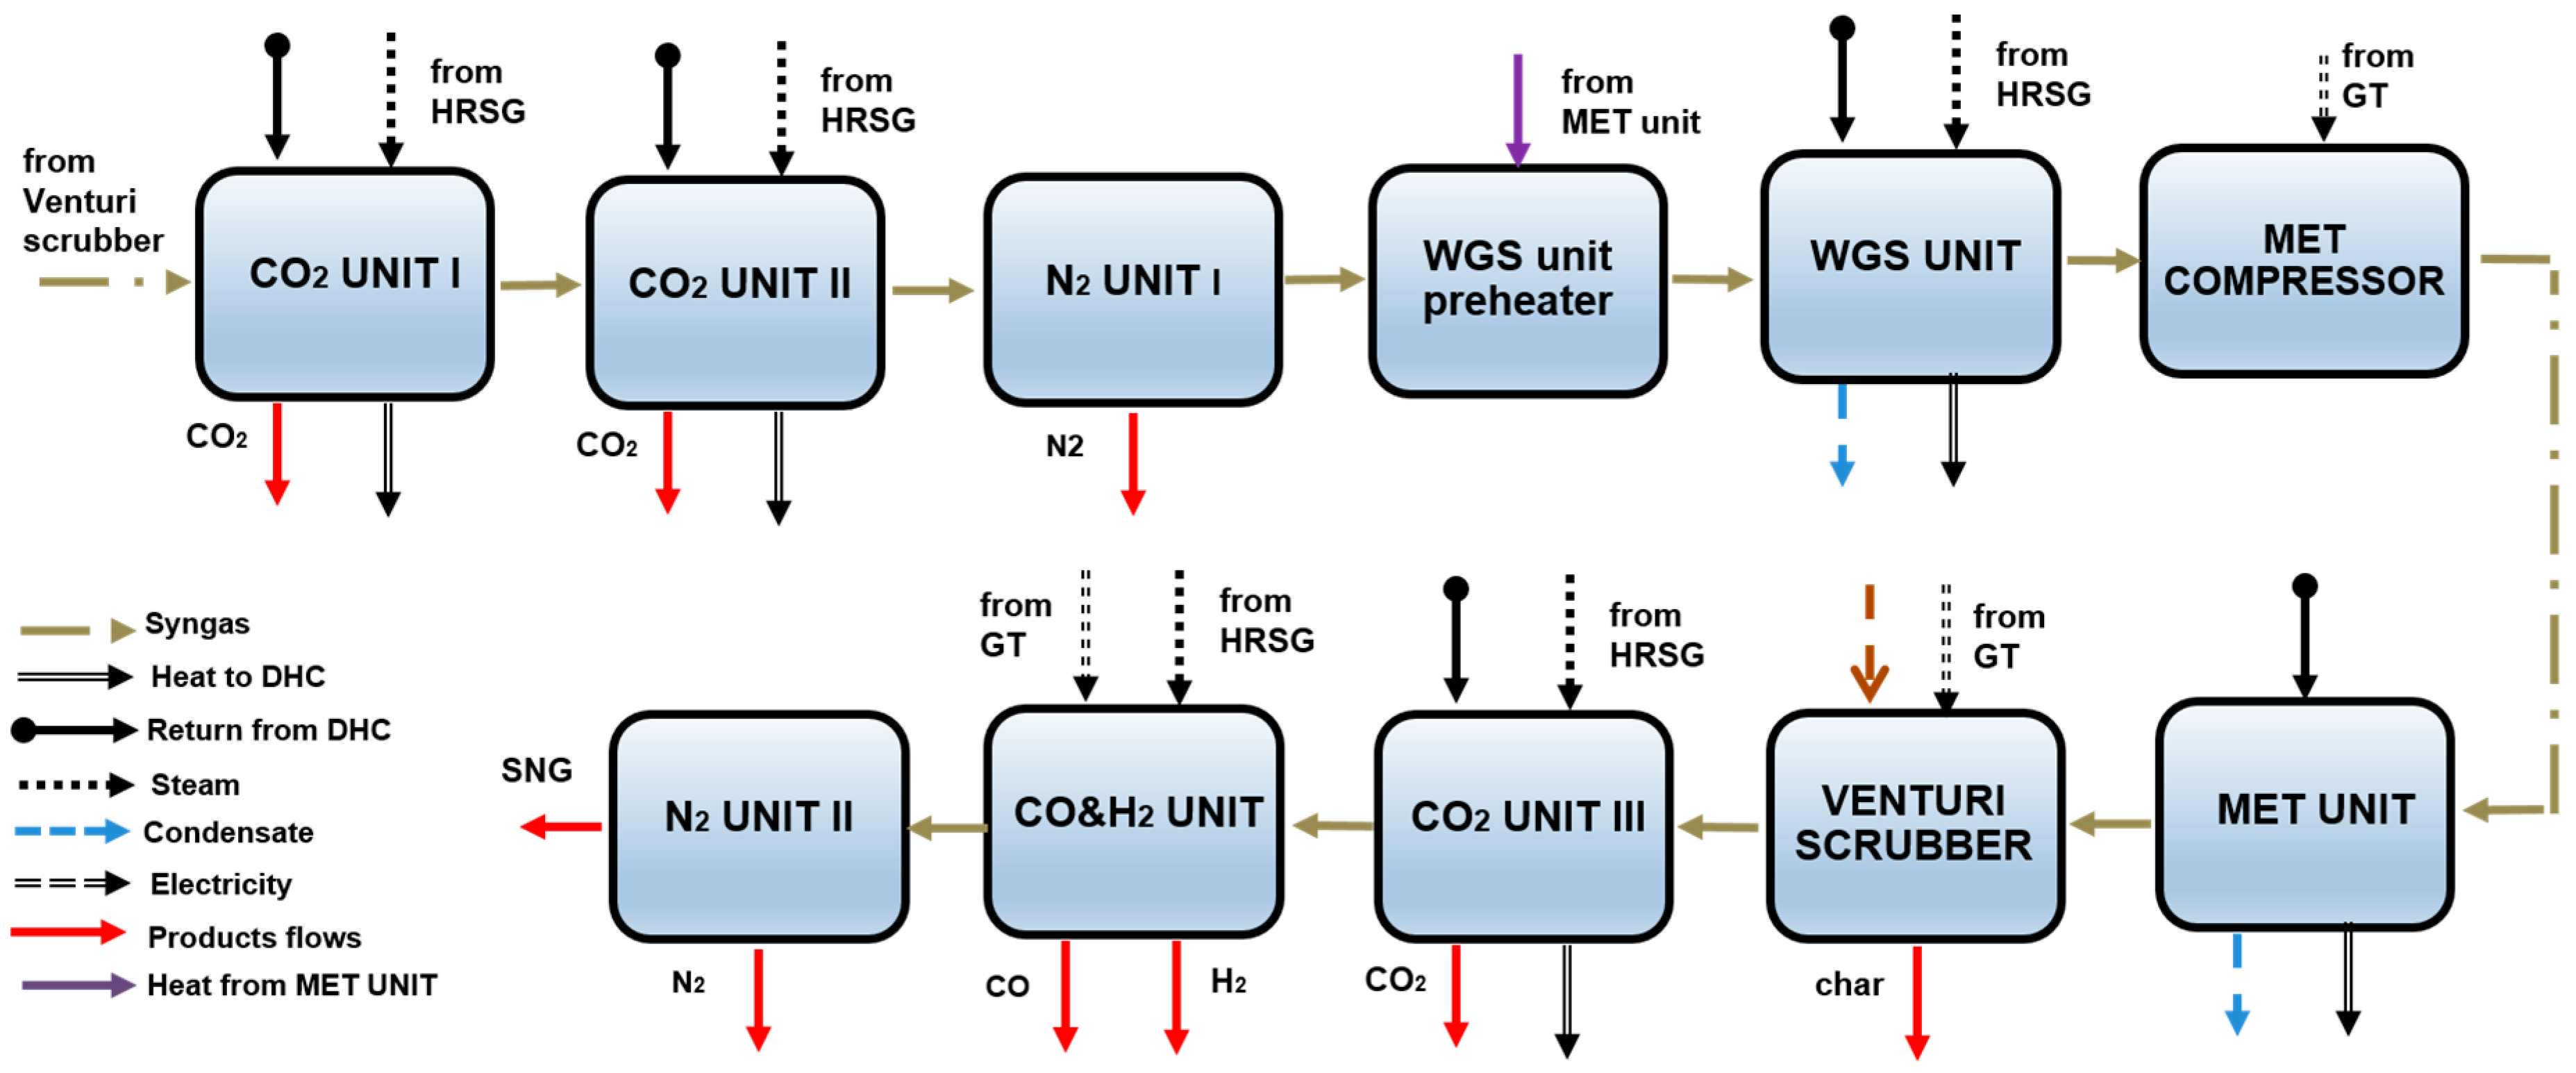
  • Gasification was assumed to occur through two main reactions: the water–gas shift (WGS) reaction:
    CO + H 2 O   CO 2 + H 2   Δ H R 0 = 41   kJ / mol  
    and the methanation (hydrogasification) reaction:
    C + 2   H 2   CH 4   Δ H R 0 = 75   kJ / mol  
    Reactions (2) and (3) are prevalent between 1073 K and 1173 K [34]. More detailed information on the reaction mechanisms may be found in [22]; the appropriate equilibrium constants were taken from references [35,36,37]. The model was validated with experimental data from reference [38], while the results of the validation may be found in reference [30].
    Figure 2 shows a schematic of the proposed SNG production unit. This unit can be divided into three components according to their functionality, namely:
  • A first component that is responsible for the syngas conditioning, where the syngas is purified from CO2 and N2 prior to the water–gas shift unit (WGS unit). It includes three units: CO2 units I and II for CO2 removal, and a N2 unit I for N2 removal. The CO2 removal process requires two units to ensure molar ratios smaller than 0.5 mol. % to favor the direct WGS reaction in the WGS unit;
  • A second component, where the pretreated syngas is transformed into SNG through methanation. In the preheater of the WGS unit, the syngas in heated up by the heat flow from the methanation unit (MET unit) to guarantee thermodynamic equilibrium in the WGS unit. Subsequently, in the WGS reactor, the H2 and CO contents are modified, while the methanation compressor adjusts the syngas pressure to 3000 kPa to ensure the occurrence of the direct methanation reaction. Finally, in the methanation unit (MET unit), the syngas is transformed into SNG;
  • A third component, where the SNG is upgraded and the impurities are removed (H2, CO2, CO, char and N2). In order to be transported through the NG distribution networks and the SNG composition, and, in particular, the impurities content has to be adjusted to the NG average contaminant level [15]. To this end, the average NG composition for the Magreb pipeline (Algeria—Portugal) [39] was taken as a reference for allowable H2, CO and CO2 contents. The H2 and CO contents were set up in accordance with the European Association for the Streamlining of Energy Exchange-gas (EASEE-gas) to prevent flashback in the GT. The maximum CO2 content was set equal to 2.5 mol. % [15]. The SNG upgrading component also includes a Venturi unit, where the char is removed from the gas flow; a CO2 unit III, where the SNG is cleaned from CO2; a CO&H2 unit, where H2 and CO are removed from the gas; and, finally, a N2 unit II, where the SNG is cleaned of N2.
The modeling of all equipment, with the exception of the WSG and MET units, was performed using existing equipment parameters, as shown in Table 1.
To design the methanation process (in particular, the WSG and MET units) the equilibrium approach was adopted, which is acceptable in case of ample catalyst amounts in reactors [46]; this approach revealed good performance against experimental data [47]. The process of syngas conversion was assumed to be separated in two major parts as in Li et al. [48], i.e., the WGS and the methanation reactors (or the WSG and MET units, respectively). The WGS unit adjusts the syngas composition to a H2/CO ratio ≥ 3 through the WGS reaction (2). The reaction occurs exothermically and rapidly over the surface of the iron oxide catalysts without side reactions. If the ratio H2/CO is already higher than the required level, the syngas enters directly into the compressor, bypassing the unit. In the methanation unit, the pretreated syngas is converted through methanation (4) and Boudouard (5) reactions over the nickel catalyst surface:
CO +   3 H 2 CH 4 + H 2 O   Δ H R 0 = 206   kJ / mol
2 CO CO 2 + C   Δ H R 0 = 172   kJ / mol
Similarly to the WGS reaction, the side reactions can be neglected if the H2/CO ratio ≥ 3. To find the equilibrium operational parameters in the units, equilibrium constant ( K a ) expressions for the reactions were derived in agreement with common practices, with the exception of the methanation reaction, for which the following equation was applied [49]:
ln ( K a ) = 29.3014 + 26248.4 T
where T is temperature in K.
All thermodynamic functions applied in the calculations were obtained from Lide [50]. To evaluate the polygeneration system overall performance, the following cogeneration, η c o g , and trigeneration, η t r i g , efficiency functions were used:
η c o g = W + Q h e a t m RDF · LHV
η t r i g = W + Q h e a t + Q c o l d m RDF · LHV
where W is the electricity output in kW, LHV is the lower heating value in kJ/kg, Qheat is the heat output in kW and Qcold is the cold output in kW.
The influence of the gasification parameters (Tgas, ER and S/C) and of the SNG production rate on the system capability was also examined.

2.2. Economic Model

The DHC polygeneration system economic evaluation was based in two criteria. The first criterion was the cumulative net cash flow (CCF) that allows estimating the payback of the project investment. The CCF was calculated for each year t from the beginning of the project:
CCF = CFt + CFt−1
where C F t is cash flow for year t in million USD. When CCF ceased to be negative, the capital investments in the polygeneration district heating system were returned or “paid back” [51]. The second criterion for the system economic assessment, which reveals the attractiveness of the project financing, was the discounted net cash flow (DNCF) [51]:
DNCF = t C F t ( 1 + i ) t
where i is discount rate.
In this study the project lifetime considered is 20 years, and the construction period is 2 years. Annual cash flows throughout the CHP operation lifetime are calculated in USD and represent the difference between the total system revenues (electricity, heat, cold, syngas, char, SNG and H2) and the operational expenditures (OpEx) (labor including overheads and administrative costs, maintenance, fuel, electricity and insurance). The operational expenses on utilities, operating supplies and rental were neglected.
The annual cash flows during the construction period consist solely of CapEx. The investment costs are comprised of four parts: the equipment procurement, the equipment installation, the civil engineering and the contingency costs. The equipment costs for the GT, HRSG, gasifier with the cleaning equipment (here referred to as the gasifier island), SNG production unit, chillers and WSt HEX were estimated following the method proposed in references [51,52,53,54]. The cost of the construction of the DHC distribution system is excluded from the model. The equipment costs were upgraded to 2013 prices through the chemical engineering plant cost index (CEPCI) [55,56]. The equipment installation and civil engineering costs were estimated according to reference [57] and the project engineering and contingency costs were estimated according to reference [54].
In addition to the influence of the technical parameters mentioned earlier, the influence of the discount rate and of the RDF price was also evaluated.

3. Results and Discussion

3.1. Thermodynamic Analysis

Table 2 presents the system parameters for the basic scenario considered in this study, with the exception of the parametric study.
Table 3 presents the molar composition of the syngas and SNG. The SNG at the exit of the unit is mostly composed of methane (96.6 mol. %), but the SNG mass yield in relation to the syngas amount at the input of the SNG unit is relatively low. It should be stressed that the parametric study revealed that the SNG mass yield varies marginally with the system parameters.
Table 4 presents the key system parameters for the different SNG production rates. Even for the basic scenario case (SNG production rate = 10%), the major amount of heat load for the DHC system can be generated through the waste heat exploitation—78.9% (Table 4). This value increases with an increase in the SNG production rate, firstly because, the heat generation in the gasifier HEX is enhanced [30], and secondly because, for higher ERs, the surplus heat amount diverted from the SNG unit increases due to the augment in the WGS and MET equilibrium temperatures and syngas mass flow rate through the unit. In a similar way, an increase in Tgas results in an intensified surplus heat generation linked to a higher syngas mass flow rate. At Tgas = 1153 K, however, there is a sudden drop in the waste heat from the SNG unit available for utilization. The WGS reactor, which requires syngas pre-heating, switches “on” as the H2/CO ratio is less than 3. The reactor thermal needs are covered by the heat supplied from the MET unit. In contrast, an increase in the S/C ratio causes a decline in the waste heat production owing to the reduction in the equilibrium temperatures of the units. Yet at S/C = 2.4 there is a rise in the available waste heat since the WGS unit is “off”, and no heat from the MET unit is required for the syngas pre-heating. Similarly to the effect of the gasification parameters, the SNG production rate increase results in a higher amount of heat load generated through the waste heat exploitation (Table 4).
As compared to the operation of the original system, a larger share of the annual heat load production is supplied through the surplus heat exploitation. The WSt HEX operation is limited—in the basic scenario it operates only 198 days during the year. If the SNG production rate increases, the number of days that the WSt HEX should be “off” is even higher. Nevertheless, despite the waste heat being used for the head load production, with the WSt HEX “off”, there are still high amounts of heat that must be dissipated in the environment.
Furthermore, the replacement of NG by syngas results in an increase in the absolute steam generation capacity due to the higher amount of exhaust gases flowing through the HRSG. In order to ensure the same electricity output at the generator terminals, a higher amount of syngas must be consumed in the GT as compared with the GT operation with NG that presents a significantly higher LHV. Therefore, in the basic scenario, assuming complete exhaust gas thermal potential recovery, the supplied amount of steam is sufficient to supply all equipment. Consequently, to meet the real steam demand a part of the exhaust gas mass flow should be diverted prior to the HRSG inlet.
The SNG rate increase results in a steam demand growth and in enhanced exhaust gas thermal potential recovery. The SNG production rate is limited by the absolute HRSG steam capacity. The latter declines at higher SNG production rates due to the increase in the feed water mass flow. Therefore, when the steam generation reaches the minimum, the maximum possible SNG production rate is achieved. This occurs for a SNG production rate of 104%. Table 4 provides the system parameters for this rate.
In comparison with the original system, the internal electricity needs for the basic scenario increase, but still without the need to import. The parametric study revealed that the electricity demand of the system declines slightly with reductions in S/C and increases in Tgas. However, an increase in the SNG production causes the internal electricity demand to rise. Consequently, the electricity exported to the grid lowers so that for SNG production rates higher than 69%, electricity must be imported into the system. Table 4 shows the system parameters for a production rate of 69%.
The SNG production in the system also has an impact on the cold generation. In the basic scenario, a major cold load share is generated through the absorption chiller (99.9%) (cf. Table 4). It was found that this share is independent of the gasification parameters. Yet with the increase of the SNG production, the share declines (cf. Table 4) since less steam is available for the absorption chiller operation.
Figure 3 shows the system cogeneration and trigeneration average efficiencies as a function of the S/C. It can be seen that the system performance improves as the S/C ratio increases, which implies a reduction in the RDF consumption. Additionally, it should be pointed out that the exhaust gas thermal potential recovery is enhanced owing to the higher steam consumption in the gasifier.
Figure 4 shows the system cogeneration and trigeneration average efficiencies as a function of the ER. It can be observed that a reduction in the ER is beneficial for the system capability. Both the cogeneration and trigeneration efficiencies increase as the value of ER decreases owing to a decrease in the waste heat dissipated into the environment and in the RDF consumption by the system. It should be stressed that an adequate ER value needs to be maintained in order to ensure the correct gasification temperature. For a given value of S/C, the higher the value of Tgas, the higher the value of ER.
In contrast with S/C and ER, the gasification temperature has a marginal impact on the system capability. The RDF consumption reduces as the gasification temperature increases. At the same time, the waste heat dissipated into the environment increases, while the exhaust gas thermal potential recovery worsens.
Figure 5 shows the system cogeneration and trigeneration average efficiencies as a function of the SNG production rate. It can be observed that the system performance reduces with the increase in the SNG production rate owing to the rapid growth of the surplus heat excess and the internal system electricity demand.

3.2. Economic Analysis

Table 5 presents the economic analysis results for different SNG production rates, considering the basic scenario presented in Table 2. The results reveal that the highest cost share (62.7%) is related with the cost of the gasifier island while the SNG unit cost has a minor contribution (0.1%). As the SNG production rate increases, both the equipment costs and the CapEx values increase, as can be seen in Table 5.
Table 5 also reveals that the labor costs represent the highest share (57.5%). An increase in SNG production rate causes the OpEx values to increase, as seen in Table 5. Insurance, fuel and maintenance costs grow, while the labor costs remain constant. Moreover, beyond an SNG production of 69%, the electricity costs start to increase. At the maximum SNG production, the electricity, fuel, maintenance and labor costs reach values of 4%, 13.9%, 28.9% and 46%, respectively. The sales of the traditional DHC system outputs (cold, heat and electricity) prevail (66.1%, 22.3% and 6.3%, respectively) over the share (5.4%) of value-added products (VAP)—SNG, H2 and char. Table 5 reveals that as the SNG production rate increases, the VAP revenues also go up; for the highest SNG production rate the values are 30.2% for SNG, 8.3% for H2 and 0.1% for char.
Figure 6 shows the discounted net cash flow (DNCF) as a function of the SNG production rate. This figure and Table 5 indicate that the DCNF increases with the increase in the SNG production rate, while the payback period remains constant and equal to 3 years. Such a short investment return period can be attributed to the very low RDF price considered in this study, the production of SNG without limitations, and the highly profitable cold energy market in Portugal.
Table 5 shows that for the highest SNG yields, the CapEx and OpEx values are also the highest, but the revenues from the SNG and H2 sales counterbalance such increments. Hence, the SNG production is more profitable at higher production rates.
The parametric study performed indicated that the gasification temperature does not considerably alter the economic analysis. The values of CapEx and OpEx decline slightly as the gasifier cost and the RDF consumption decrease. Overall, the revenues and the DNCF vary marginally, while the payback period remains constant.
Similarly to Tgas, an increase in S/C causes a slightly decree in the values of CapEx and OpEx owing to the enhanced performance of the gasifier island and of the SNG unit. Hence, the discounted NCF increases marginally with the increase in S/C from 149 million USD at S/C = 1 up to 152.8 million USD at S/C = 3, whereas the payback period is unaffected.
Contrary to the other parameters, an increase in the value of ER is adverse for the economics of the system. The values of CapEx and OpEx increase as the gasifier island cost augments, while the revenues decline due to the lower SNG yields. In brief, the discounted NCF reduces as well, but the payback remains unchanged.
Finally, the influence of the RDF price and the discount rate on the economic analysis outcomes was also evaluated. Despite the RDF price used in this study being relatively low (10 to 30 euro per ton [49]) and its cost share in the OpEx also being small, it causes the DNCF to decline from 151.7 down to 144.3 million USD. A similar effect was observed in the discount rate variation: from 7% down to 12%. The discounted NCF value declines significantly with the discount rate increase—94.7 million USD for i = 12%.

4. Conclusions

This manuscript examines the possibility of retrofitting a district heating and cooling (DHC) system with a refuse-derived fuel (RDF) air-steam gasifier and gas upgrading equipment to minimize its fossil fuel dependence and to secure its income. The main conclusions of this study are as follows.
In the basic scenario, the new polygeneration DHC system produces an annual 60.3 GWh of heat, 65.1 GWh of cold, 33.2 GWh of electricity and 789.5 tons of SNG. A high share of heat load is supplied from the waste heat exploitation available from the upgrading equipment. Moreover, even in the basic scenario, waste heat is in excess and must be partially dissipated in the environment. The electricity demand of the system rises considerably as the SNG production rate increases so that above a given value the system is not able to satisfy its own needs. As a consequence of these factors the system performance worsens and both the cogeneration and trigeneration efficiencies are reduced.
The investment in retrofitting the polygeneration DHC system presents a payback period of 3 years. The increase of the SNG production does not affect the CapEx payback. Both the capital and the operational expenses increase as the SNG production rate increases, but this increment is effectively compensated for by the revenues boost from the value-added product sales. Overall, the discounted net cash flows increase with the SNG production rate growth.

Acknowledgments

This research has been done through collaboration between Instituto Superior Técnico (IST) and KTH Royal Institute of Technology, funded by the Erasmus Mundus Joint Doctoral Program SELECT+, the support of which is gratefully acknowledged.

Author Contributions

All authors contributed to this paper. Natalia Kabalina designed the system model, simulated it, analyzed results and wrote the paper; Mário Costa, Weihong Yang and Andrew Martin conceived the research concept, guided the research and reviewed the entire manuscript before submission.

Conflicts of Interest

The authors declare no conflict of interest.

References

  1. International Energy Agency. Key World Energy Statistics. 2014. Available online: https://www.iea.org (accessed on 6 September 2016).
  2. Serra, L.M.; Lozano, M.-A.; Ramos, J.; Ensinas, A.V.; Nebra, S.A. Polygeneration and efficient use of natural resources. Energy 2009, 34, 575–586. [Google Scholar] [CrossRef]
  3. Ilic, D.D.; Dotzauer, E.; Trygg, L. District heating and ethanol production through polygeneration in Stockholm. Appl. Energy 2012, 91, 214–221. [Google Scholar] [CrossRef]
  4. Rudra, S.; Rosendahl, L.; Blarke, M.B. Process analysis of a biomass-based quad-generation plant for combined power, heat, cooling, and synthetic natural gas production. Energy Convers. Manag. 2015, 106, 1276–1285. [Google Scholar] [CrossRef]
  5. Gustavsson, C.; Hulteberg, C. Co-production of gasification based biofuels in existing combined heat and power plants—Analysis of production capacity and integration potential. Energy 2016, 111, 830–840. [Google Scholar] [CrossRef]
  6. Starfelt, F.; Daianova, L.; Yan, J.; Thorin, E.; Dotzauer, E. The impact of lignocellulosic ethanol yields in polygeneration with district heating—A case study. Appl. Energy 2012, 92, 791–799. [Google Scholar] [CrossRef]
  7. Gerssen-Gondelach, S.J.; Saygin, D.; Wicke, B.; Patel, M.K.; Faaij, A.P.C. Competing uses of biomass: Assessment and comparison of the performance of bio-based heat, power, fuels and materials. Renew. Sustain. Energy Rev. 2014, 40, 964–998. [Google Scholar] [CrossRef]
  8. Ilic, D.D.; Dotzauer, E.; Trygg, L.; Broman, G. Integration of biofuel production into district heating. Part I: An evaluation of biofuel production costs using four types of biofuel production plants as case studies. J. Clean. Prod. 2014, 69, 176–187. [Google Scholar] [CrossRef]
  9. Gustavsson, L.; Truong, N.L. Coproduction of district heat and electricity or biomotor fuels. Energy 2011, 36, 6263–6277. [Google Scholar] [CrossRef]
  10. Daianova, L.; Dotzauer, E.; Thorin, E.; Yan, J. Evaluation of a regional bioenergy system with local production of biofuel for transportation, integrated with a CHP plant. Appl. Energy 2012, 92, 739–749. [Google Scholar] [CrossRef]
  11. Ahrenfeldt, J.; Thomsen, T.P.; Henriksen, U.; Clausen, L.R. Biomass gasification cogeneration. A review of state of the art technology and near future perspectives. Appl. Therm. Eng. 2013, 50, 1407–1417. [Google Scholar] [CrossRef] [Green Version]
  12. Difs, K.; Wetterlund, E.; Trygg, L.; Söderström, M. Biomass gasification opportunities in a district heating system. Biomass Bioenergy 2010, 34, 637–651. [Google Scholar] [CrossRef]
  13. Heyne, S.; Thunman, H.; Harvey, S. Extending existing combined heat and power plants for synthetic natural gas production. Int. J. Energy Res. 2012, 36, 670–681. [Google Scholar] [CrossRef]
  14. Kohl, T.; Laukkanen, T.; Tuomaala, M.; Niskanen, T.; Siitonen, S.; Järvinen, M.P.; Ahtila, P. Comparison of energy efficiency assessment methods: Case bio-SNG process. Energy 2014, 74, 88–98. [Google Scholar] [CrossRef]
  15. European Association for the Streamlining of Energy Exchange-gas (EASEE-gas). CBP 2005–001/02. Common Business Practice. Harmonisation of Natural Gas Quality; EASEE-gas: Paris, France, 2005. [Google Scholar]
  16. Hermann, H.; Reinhard, R.; Klaus, B.; Reinhard, K.; Christian, A. Biomass CHP Plant Güssing: A Success Story. Available online: http://members.aon.at/biomasse/strassbourg.pdf (accessed on 14 December 2016).
  17. EU Waste Legislation. Available online: http://ec.europa.eu/environment/waste/legislation/a.htm (accessed on 12 November 2016).
  18. Molino, A.; Nanna, F.; Ding, Y.; Bikson, B.; Braccio, G. Biomethane production by anaerobic digestion of organic waste. Fuel 2013, 103, 1003–1009. [Google Scholar] [CrossRef]
  19. Molino, A.; Nanna, F.; Migliori, M.; Iovane, P.; Ding, Y.; Bikson, B. Experimental and simulation results for biomethane production using peek hollow fiber membrane. Fuel 2013, 112, 489–493. [Google Scholar] [CrossRef]
  20. Molino, A.; Braccio, G. Synthetic natural gas SNG production from biomass gasification—Thermodynamics and processing aspects. Fuel 2015, 139, 425–429. [Google Scholar] [CrossRef]
  21. Molino, A.; Migliori, M.; Ding, Y.; Bikson, B.; Giordano, G.; Braccio, G. Biogas upgrading via membrane process: Modelling of pilot plant scale and the end uses for the grid injection. Fuel 2013, 107, 585–592. [Google Scholar] [CrossRef]
  22. Fahlen, E.; Ahlgren, E.O. Assessment of integration of different biomass gasification alternatives in a district-heating system. Energy 2009, 34, 2184–2195. [Google Scholar] [CrossRef]
  23. Steubing, B.; Zah, R.; Ludwig, C. Life cycle assessment of SNG from wood for heating, electricity, and transportation. Biomass Bioenergy 2011, 35, 2950–2960. [Google Scholar] [CrossRef]
  24. De Souza-Santos, M.L. Solid Fuels Combustion and Gasification. Modeling, Simulation, and Equipment Operations, 2nd ed.; Chemical Rubber Company (CRC) Press: Boca Raton, FL, USA, 2010. [Google Scholar]
  25. Basu, P. Biomass Gasification, Pyrolysis and Torrefaction: Practical Design and Theory, 2nd ed.; Academic Press: Burlington, VT, USA, 2013. [Google Scholar]
  26. Klinghoffer, N.B.; Castaldi, M.J. Waste to Energy Conversion Technology; Woodhead: Cambridge, UK, 2013. [Google Scholar]
  27. Bidart, C.; Fröhling, M.; Schultmann, F. Municipal solid waste and production of substitute natural gas and electricity as energy alternatives. Appl. Therm. Eng. 2013, 51, 1107–1115. [Google Scholar] [CrossRef]
  28. Vitasari, C.R.; Jurascik, M.; Ptasinski, K.J. Exergy analysis of biomass-to-synthetic natural gas (SNG) process via indirect gasification of various biomass feedstock. Energy 2011, 36, 3825–3837. [Google Scholar] [CrossRef]
  29. Castanheira, J. The Lisbon DHC: A model for Southern Europe. In Proceedings of the 34th Congress of Euroheat & Power, Venice, Italy, 25–26 May 2009.
  30. Kabalina, N.; Costa, M.; Martin, V. Development of a polygeneration district heating and cooling system based on gasification of RDF. In Proceedings of the 14th International Symposium on District Heating and Cooling, Stockholm, Sweden, 7–9 September 2014; pp. 114–119.
  31. Kabalina, N.; Costa, M.; Yang, W.; Martin, A.; Santarelli, M. Exergy analysis of a polygeneration-enabled district heating and cooling system based on gasification of refuse derived fuel. J. Clean. Prod. 2017, 141, 760–773. [Google Scholar] [CrossRef]
  32. Desrosiers, R. Thermodynamics of gas-char reactions. In A Survey of Biomass Gasification; Reed, T.B., Ed.; Solar Energy Research Institute: Golden, CO, USA, 1979. [Google Scholar]
  33. Prins, M.J.; Ptasinski, K.J.; Janssen, F.J.J.G. Thermodynamics of gas-char reactions: First and second law analysis. Chem. Eng. Sci. 2003, 58, 1003–1011. [Google Scholar] [CrossRef]
  34. Prins, M.J.; Ptasinski, K.J.; Janssen, F.J.J. From coal to biomass gasification: Comparison of thermodynamic efficiency. Energy 2007, 32, 1248–1259. [Google Scholar] [CrossRef]
  35. Zainal, Z.A.; Ali, R.; Lean, C.H.; Seetharamu, K.N. Prediction of performance of a downdraft gasifier using equilibrium modeling for different biomass materials. Energy Convers. Manag. 2001, 42, 1499–1515. [Google Scholar] [CrossRef]
  36. Pedroso, D.T.; Aiello, R.C.; Conti, L.; Mascia, S. Biomass gasification on a new really tar free downdraft gasifier. Rev. Ciênc. Exatas 2005, 59–62. [Google Scholar]
  37. Barman, N.S.; Ghosh, S.; De, S. Gasification of biomass in a fixed bed downdraft gasifier: A realistic model including tar. Bioresour. Technol. 2012, 107, 505–511. [Google Scholar] [CrossRef] [PubMed]
  38. Galvagno, S.; Casciaro, G.; Casu, S.; Martino, M.; Mingazzini, C.; Russo, A.; Portofino, S. Steam gasification of tyre waste, poplar, and refuse-derived fuel: A comparative analysis. Waste Manag. 2009, 29, 678–689. [Google Scholar] [CrossRef] [PubMed]
  39. Gas Properties. Specification M-00000-SPC-MI-0002. 2008. Available online: http://www.mercado.ren.pt/PT/Gas/InfoMercado/Documentacao/BibOutros/GasProperties.pdf (accessed on 24 August 2016).
  40. Rubin, E.S.; Rao, A.B. A Technical Economic and Environmental Assessment of Amine-Based CO2 Capture Technology for Power Plant Greenhouse Gas Control; Annual Technical Progress Report; U.S. Department of Energy, National Energy Technology Laboratory: Morgantown, WV, USA, 2002.
  41. Yang, Y.; Zhai, R. MEA-Based CO2 Capture Technology and Its Application in Power Plants, Paths to Sustainable Energy; Artie, N., Ed.; InTech: Rijeka, Croatia, 2010. [Google Scholar]
  42. Kohl, A.; Nielsen, R. Gas Purification; Gulf Publishing Company: Houston, TX, USA, 1997. [Google Scholar]
  43. Francois, J.; Abdelouahed, L.; Mauviel, G.; Pattison, F.; Mirgaux, O.; Rogaume, C.; Rogaume, Y.; Feidt, M.; Dufour, A. Detailed process modeling of a wood gasification combined heat and power plant. Biomass Bioenergy 2013, 51, 68–82. [Google Scholar] [CrossRef]
  44. Outotec® Cascade Scrubber. Specification. Available online: http://www.outotec.com (accessed on 24 August 2016).
  45. Gallagher, J.E.; Euker, C.A. Catalytic coal gasification for SNG manufacture. Int. J. Energy Res. 1980, 4, 137–147. [Google Scholar] [CrossRef]
  46. Gassner, M.; Marechal, F. Thermo-economic process model for thermochemical production of synthetic natural gas (SNG) from lignocellulosic biomass. Biomass Bioenergy 2009, 33, 1587–1604. [Google Scholar] [CrossRef]
  47. Duret, A.; Friedli, C.; Marechal, F. Process design of synthetic natural gas (SNG) production using wood gasification. J. Clean. Prod. 2005, 13, 1434–1446. [Google Scholar] [CrossRef]
  48. Li, S.; Ji, X.; Zhang, X.; Gao, L.; Jin, H. Coal to SNG: Technical progress, modeling and system optimization through exergy analysis. Appl. Energy 2014, 136, 98–109. [Google Scholar] [CrossRef]
  49. Bader, A.; Bauersfeld, S.; Brunhuber, C.; Pardemann, R.; Meyer, B. Modelling of a chemical reactor for simulation of a methanisation plant. In Proceedings of the 8th Modelica Conference, Dresden, Germany, 20–22 March 2011.
  50. Lide, D.R. (Ed.) Handbook of Chemistry and Physics, 89th ed.; Taylor and Francis: Boca Raton, FL, USA, 2009.
  51. Crundwell, F.K. Finance for Engineers. Evaluation and Funding of Capital Projects; Springer: London, UK, 2008. [Google Scholar]
  52. Frangopoulos, C. Introduction into environomics: Design, analysis and improvement of energy systems. In Proceedings of the American Society of Mechanical Engineers (ASME) Advanced Energy Systems Division, Atlanta, GA, USA, 1–6 December 1991; Volume 25, pp. 49–54.
  53. Pelster, S. Environomic Modeling and Optimization of Advanced Combined Cycle Cogeneration Power plants including CO2 Separation Units. Ph.D. Thesis, L’Ecole Polytechnigue Federale de Lausanne, Lausanne, Switzerland, 1998. [Google Scholar]
  54. Spelling, J.D. Hybrid Solar Gas-Turbine Power Plants. A Thermoeconomical Analysis. Ph.D. Thesis, Kunliga Technicka hoglosklan, Stockholm, Sweden, 2013. [Google Scholar]
  55. Phillips, S.; Aden, A.; Jechura, J.; Dayton, D.; Eggeman, T. Thermochemical Ethanol via Indirect Gasification and Mixed Alcohol Synthesis of Lignocellulosic Biomass; Technical Report NREL/TP-510–41168; National Renewable Energy Laboratory: Golden, CO, USA, 2007.
  56. Chemical Engineering. Available online: http://www.chemengonline.com/pci-home (accessed on 24 August 2016).
  57. Peters, M.S.; Timmerhaus, K.D. Plant Design and Economics for Chemical Engineers, 4th ed.; McGraw-Hill: Boston, MA, USA, 1991. [Google Scholar]
  58. Thiel, S.; Thomé-Kozmiencky, K.J. Co-combustion of solid recovered fuels in coal-fired power plants. Waste Manag. Res. 2012, 30, 392–403. [Google Scholar] [CrossRef] [PubMed]
Figure 1. Schematic of the proposed polygeneration system.
Energies 09 01080 g001
Figure 2. Schematic of the proposed SNG production unit.
Energies 09 01080 g002
Figure 3. System cogeneration and trigeneration average efficiencies as a function of the S/C.
Energies 09 01080 g003
Figure 4. System cogeneration and trigeneration average efficiencies as a function of the ER.
Energies 09 01080 g004
Figure 5. System cogeneration and trigeneration average efficiencies as a function of the SNG production rate.
Energies 09 01080 g005
Figure 6. DNCF as a function of the SNG production rate.
Energies 09 01080 g006
Table 1. Characteristics of the equipment in the SNG production unit.
EquipmentTechnologyParameterValueRef.
CO2 unit I, II and IIIAbsorption on monoethanolamineRemoval efficiency0.9[40]
Energy demand3.8 GJ/ton[41]
Heat of CO2 absorption85 kJ/mole CO2[42]
N2 unit I and IIAbsorption on organic metal complexesRemoval efficiency0.99-
Venturi scrubberWet scrubbingRemoval efficiency1.0[43]
Energy demand7 kWh/m3-
Water demand5–40 m3/h[44]
CO&H2 unitCryogenic distillationCO removal efficiency0.97[45]
H2 removal efficiency0.97
Energy demand18751 kJ/kg
Table 2. System parameters for the basic scenario.
ParameterValue
Tgas (K)1173
ER0.03
S/C2.2
SNG production rate (%)10
RDF price (Euro/ton [58])10
Discount rate (%)7
Table 3. Molar composition of the syngas and SNG.
ComponentSyngasSNG at the Exit of the Unit
At the Exit of the GasifierAt the Input of the SNG Unit
CO (mol. %)10.716.6<0.001
CO2 (mol. %)8.914.01.5
CH4 (mol. %)0.91.396.6
H2 (mol. %)31.148.41.9
H2O (mol. %)35.80.000.0
N2 (mol. %)12.619.70.01
Molar mass (kg/kmol)17.717.516.1
LHV (kJ/kg)6351999747,979
SNG mass yield (%)--13.8
Table 4. Key system parameters for the different SNG production rates.
ParameterSNG Production Rate (%)
1069104
Annual Demand, (kton)
RDF37.557.669.6
Annual Supply, (kton)
SNG0.85.48.2
Hydrogen0.060.40.6
Char0.61.21.6
Daily Heat Supply (average), (MWh)
Surplus heat129.9164.3164.6
WSt HEX34.70.40
Daily Cold Supply (average), (MWh)
Adsorption chiller175.9112.21.9
Compression chiller1.965.6175.9
Daily Electricity Load (average), (MWh)
Export to the grid90.635.01.3
Import from the grid00.00313.1
Daily System Efficiency (average), (%)
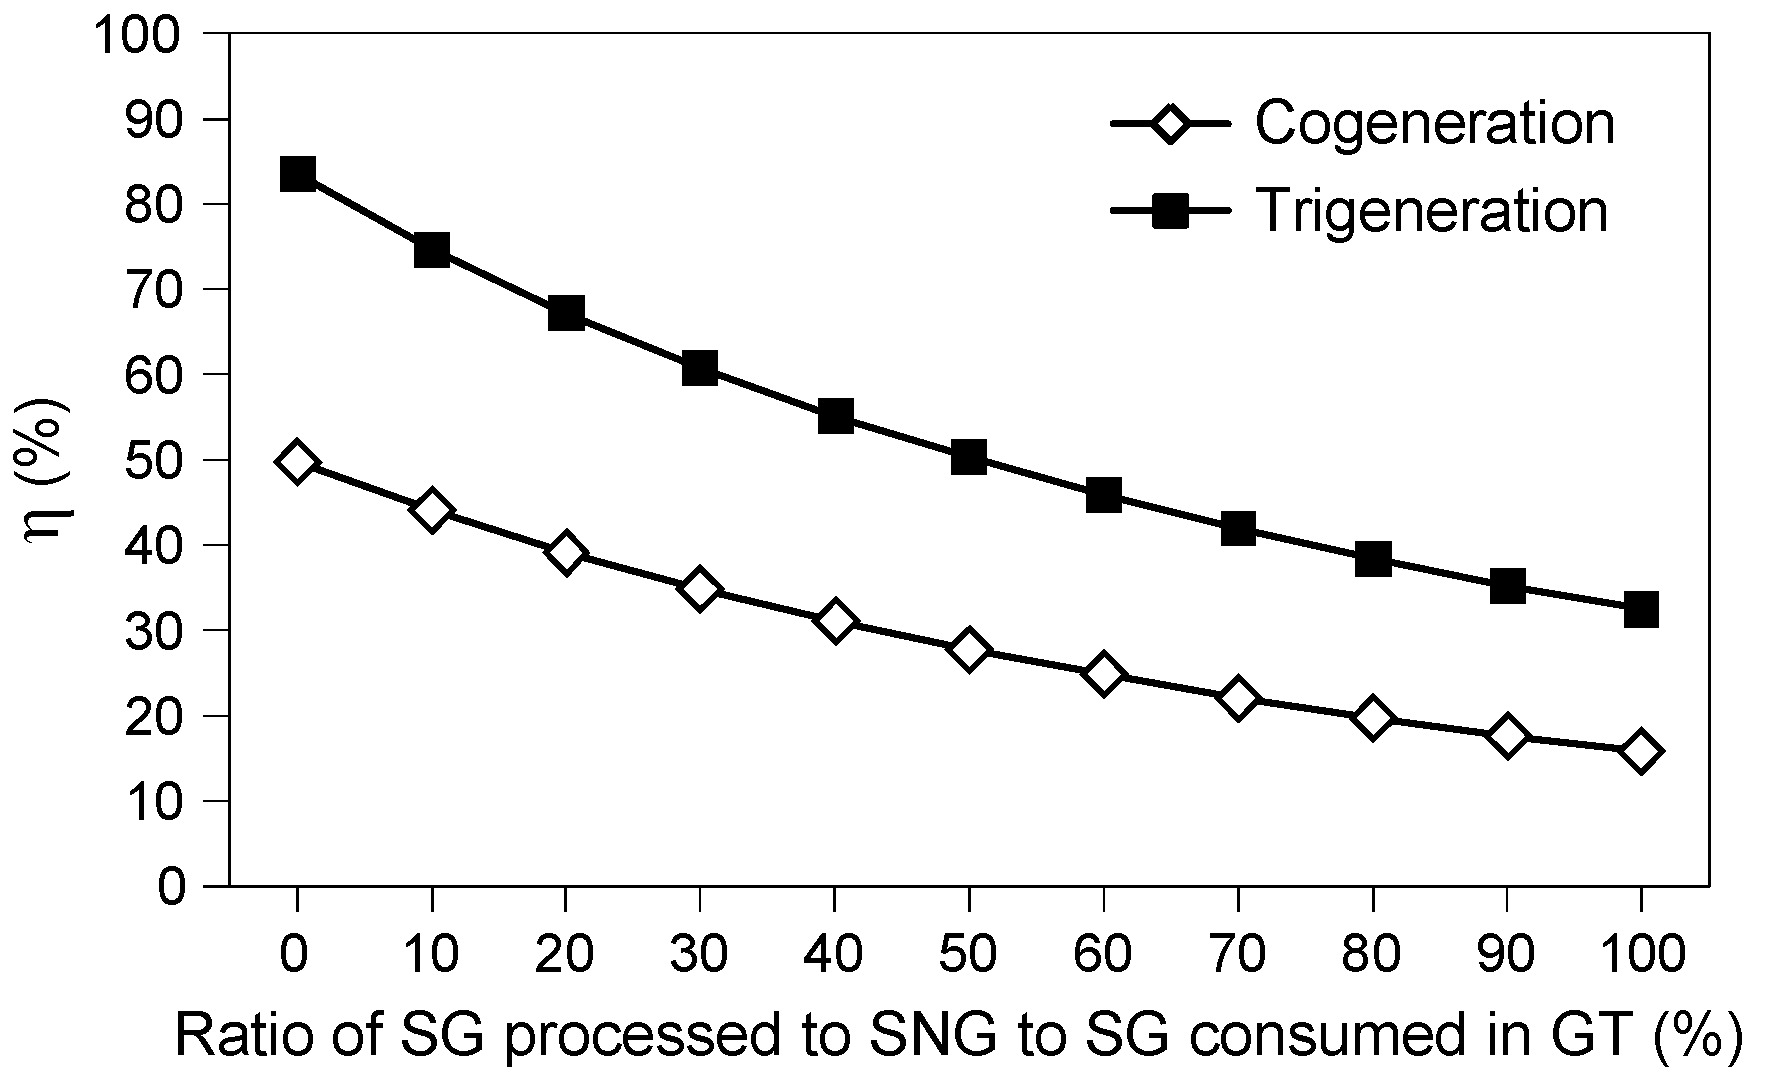
Cogeneration44.022.415.3
Trigeneration74.642.331.5
Table 5. Economic analysis results for different SNG production rates.
ParameterSNG Production Rate (%)
1069104
CapEx (million USD)26.432.736.1
OpEx (million USD)3.94.55.0
Revenues (million USD)21.927.931.4
incl. SNG0.96.39.5
incl. H20.31.72.6
incl. char0.010.010.01
Total DNCF (million USD)151.7200.2227.5

