Article

Failure Criteria of Gas-Infiltrated Sandy Shale Based on the Effective Stress Principle

1
State Key Laboratory of Coal Mine Disaster Dynamics and Control, Chongqing University, Chongqing 400030, China
2
College of Resource and Environmental Sciences, Chongqing University, Chongqing 400030, China
*
Author to whom correspondence should be addressed.
Energies 2016, 9(11), 972; https://doi.org/10.3390/en9110972
Submission received: 2 August 2016 / Revised: 9 November 2016 / Accepted: 17 November 2016 / Published: 22 November 2016

Abstract

:
Pore gas has a significant influence on rock strength. This study performed triaxial compression tests of gas-infiltrated sandy shale samples to investigate the strength characteristics under gas pressures of 0 and 2 MPa. The effective stress coefficient was evaluated while considering the gas and solid coupling effect, and was found to decrease with increasing confining pressure. The calculated and different assumed coefficient values (0 and 1) were applied to obtain the effective principal stress. The experimental results would serve as fundamental strength data for fitting analysis in failure criterion work. The Mohr-Coulomb, Hoek-Brown, Drucker-Prager, linear Mogi, and non-linear Mogi criteria were modified based on the effective stress principle of porous rock. In addition, the RMSE, cohesion, and internal friction angle were utilized for a quantitative criterion comparison. The results showed that the Mohr-Coulomb, Drucker-Prager, and linear Mogi failure criteria led to higher errors, whereas the Hoek-Brown criterion gave an apparent distortion as a result of the empirical strength parameters. Moreover, the non-linear Mogi criterion showed a good fit. The predicted strength was overestimated when α = 0 and underestimated when α = 1, with a more accurate strength estimated when the effective stress coefficient was calculated using the effective stress principle.

1. Introduction

Shale gas is an important source of clean energy and has already attracted much attention. The permeability, deformation, and strength are of great importance in the development and utilization of shale gas. Shale is a typical anisotropic rock which contains structural discontinuities such as natural fractures and bedding planes [1]. Shale gas production often encounters drilling problems, such as hole collapses, stuck pipes and fracturing [2]. During the drilling process, stresses are redistributed at and near the bore-hole walls, the initiation and propagation of fractures occurs and this further affects the strength and permeability evolution [3].
The shale strength is influenced by many factors, such as the physical properties (e.g., compaction, porosity, density, permeability, mineralogy, water content) and the stress environment (e.g., drilling-induced stress paths, drilling fluid, pore pressure) [2]. The compaction history plays an important role in the shale strength. During the compaction process, grain clays are compacted and this results in excessive pore pressures, pore water is expelled and pore connectivity through pore throats decreases, strength increases and also the porosity and permeability decrease [2]. The shale strength is positively correlated with density. Permeability has a certain influence on reservoir rock strength. With increasing osmotic pressure, the effective confining pressure on the shale framework decreases and as well as the shale strength [4]. Mineral composition is of great importance in the shale reservoir properties. The shale reservoir is mainly composed of quartz and clay minerals, and the shale strength is positively associated with quartz content, and it is negatively associated with clay mineral content [5]. Water content has a significant effect on the shale strength. The water along with the cracks infiltrates the shale grain and weakens the link between the grains so that it reduces the shale strength [6]. During the drilling process, stresses are redistributed, as the stress increases in the vertical direction and decreases in the horizontal direction, the effective confining pressure decreases and this causes the shale strength to decrease [2]. In addition, due to the low permeability of the shale-gas reservoirs, hydraulic fracturing is widely applied in the development of shale gas. In the fracture stimulation processes, the new fractures caused by hydraulic fracturing develop and evolve, combine with the original fractures, and a fracture network is formed. The fractures widen the flow throat and increase the permeability; the fractures weaken the link of the solid framework and decrease the shale strength [3,7].
In general, gas is stored in natural fractures and porosity of a shale reservoir, and the pore gas has a great influence on the mechanical behaviour of the rocks. Ulusay and Hudson [8] stated that “In the application of rock mechanics to rock engineering design, one of the most important issues is the failure of rock: we wish to fail the rock during the excavation process; and then avoid failure of the completed structure”. In addition to considering the effect of the excavation loading condition, the pore gas pressure is a significant key factor that should not be neglected. Considering the coupling effect of the gas and shale solid matrix, the strength of gas-infiltrated sandy shale would be different from shale with zero gas pressure. In addition, a loading condition, considering the effect of the gas pressure, is close to the stress condition for a shale reservoir. Therefore, it is necessary to investigate the strength of gas-infiltrated sandy shale for the purpose of guiding the development and utilization of shale gas reservoirs.
The strength behaviours and failure criteria of many different kinds of rocks have been extensively investigated in the past. Based on laboratory experimental research on eight kinds of rocks, including Duhan dolomite, Solenhofen limestone, Shirahama sandstone, Yubari shale, the German Continental Deep Drilling Program (KTB) amphibolite, Mizuho trachyte, dense marble and Westerly granite, Benz and Schwab [9] analyzed the strength data fit using six failure criteria: the Mohr-Coulomb criterion, modified Lade-Duncan criterion, modified Wiebols and Cook criterion, Mogi criterion, Hoek-Brown criterion, and Hoek-Brown-Matsuoka-Nakai criterion (HBMN). Their conclusions implied that the non-linear Hoek-Brown failure criterion showed a better fit than the linear Mohr-Coulomb failure criterion. Similarly, Zhao [10] and Ghazvinian et al. [11] found in parallel that the non-linear failure criterion appeared to be a better fit than the linear failure criterion based on a variety of laboratory data on rock strength. Jespersen et al. [12] investigated the strength, deformation behaviours, and failure modes of macroporous rock using integrated modelling and laboratory testing. Rafiai [13] used the triaxial and polyaxial criteria for the laboratory strength data of different rock types. Then, a new empirical polyaxial failure criterion was proposed and verified, with the results showing good agreement with the test data. Based on the Hoek-Brown failure criterion, a new empirical failure criterion was proposed by taking into account the relationship between parameter mi (the strength parameter related to the Hoek-Brown failure criterion) of intact rock and the confining pressure. The results showed that the new criterion gave better agreement with the triaxial laboratory data than the traditional Hoek-Brown criterion [14]. Associating the effect of the confining pressure with the traditional Mohr-Coulomb failure criterion, a modified non-linear failure criterion was proposed for a fitting analysis of the triaxial and polyaxial strength of intact rock and jointed rock [15,16,17]. With the goal of developing a three-dimensional version of the empirical two-dimensional Hoek-Brown failure criterion, Priest [18] used the generalised Zhang-Zhu (GZZ) criterion [19], generalised Pan-Hudson (GPH) criterion [20], generalised Priest (GP) criterion [21], and simplified Priest (SP) criterion [22] to compare the rock strength test data of KTB amphibolite and Westerly granite. The effect of the stress state on the rock strength was analyzed by You [23]. Then, a new triaxial strength with intermediate principal stress was proposed, and accurate strength data were predicted. Haimson and Chang [24] performed tests on the mechanical properties of rock under true triaxial stress conditions, and the strength criterion was investigated on the basis of laboratory data for Westerly granite and KTB amphibolite [25]. The results implied that the failure criterion showed a good fit when the octahedral shear stress was expressed as a monotonically increasing function of the mean effective normal stress. What’s more, due to the anisotropy, shale plays a significant role in crack mechanisms and failure behaviour [26,27,28,29]. Morgan and Einstein [30] conducted uniaxial compression tests on shale with flaw pairs and different bedding plane orientation, crack propagation and coalescence were observed, and the results showed that fractures initiating at the flaw tips tended to propagate more frequently along the bedding planes with increasing the bedding angle. A new parameter to account for the effect of strength anisotropy was proposed by Saroglou and Tsiambaos [31], and then the Hoek-Brown failure criterion was modified to predict the strength of anisotropic intact rock under different orientations. Singh et al. [32] presented a nonlinear strength criterion for transversely isotropic rocks, data based on more than 1140 triaxial tests were compiled and the results showed a reasonable estimation. However, the strength criterion of rock has not yet been obtained under gas-pressure conditions. Thus, an extensive investigation must be conducted on the effects of the gas pressure on the strength and failure mechanisms.
In this study, triaxial compression tests were conducted to understand the effect of the pore gas pressure on the strength property and failure behaviour of sandy shale specimens. Then, taking the coupling effect of the gas and solid into consideration, the effective stress coefficient was evaluated. In addition to the calculated and different assumed coefficient values (0 and 1) were applied to obtain the effective principal stress values. Finally, based on the effective stress principle of porous rock, the Mohr-Coulomb, Hoek-Brown, Drucker-Prager, linear Mogi, and non-linear Mogi criteria were modified, and then the criteria application with the strength data was compared and analyzed.

2. Laboratory Experiments on Triaxial Compression

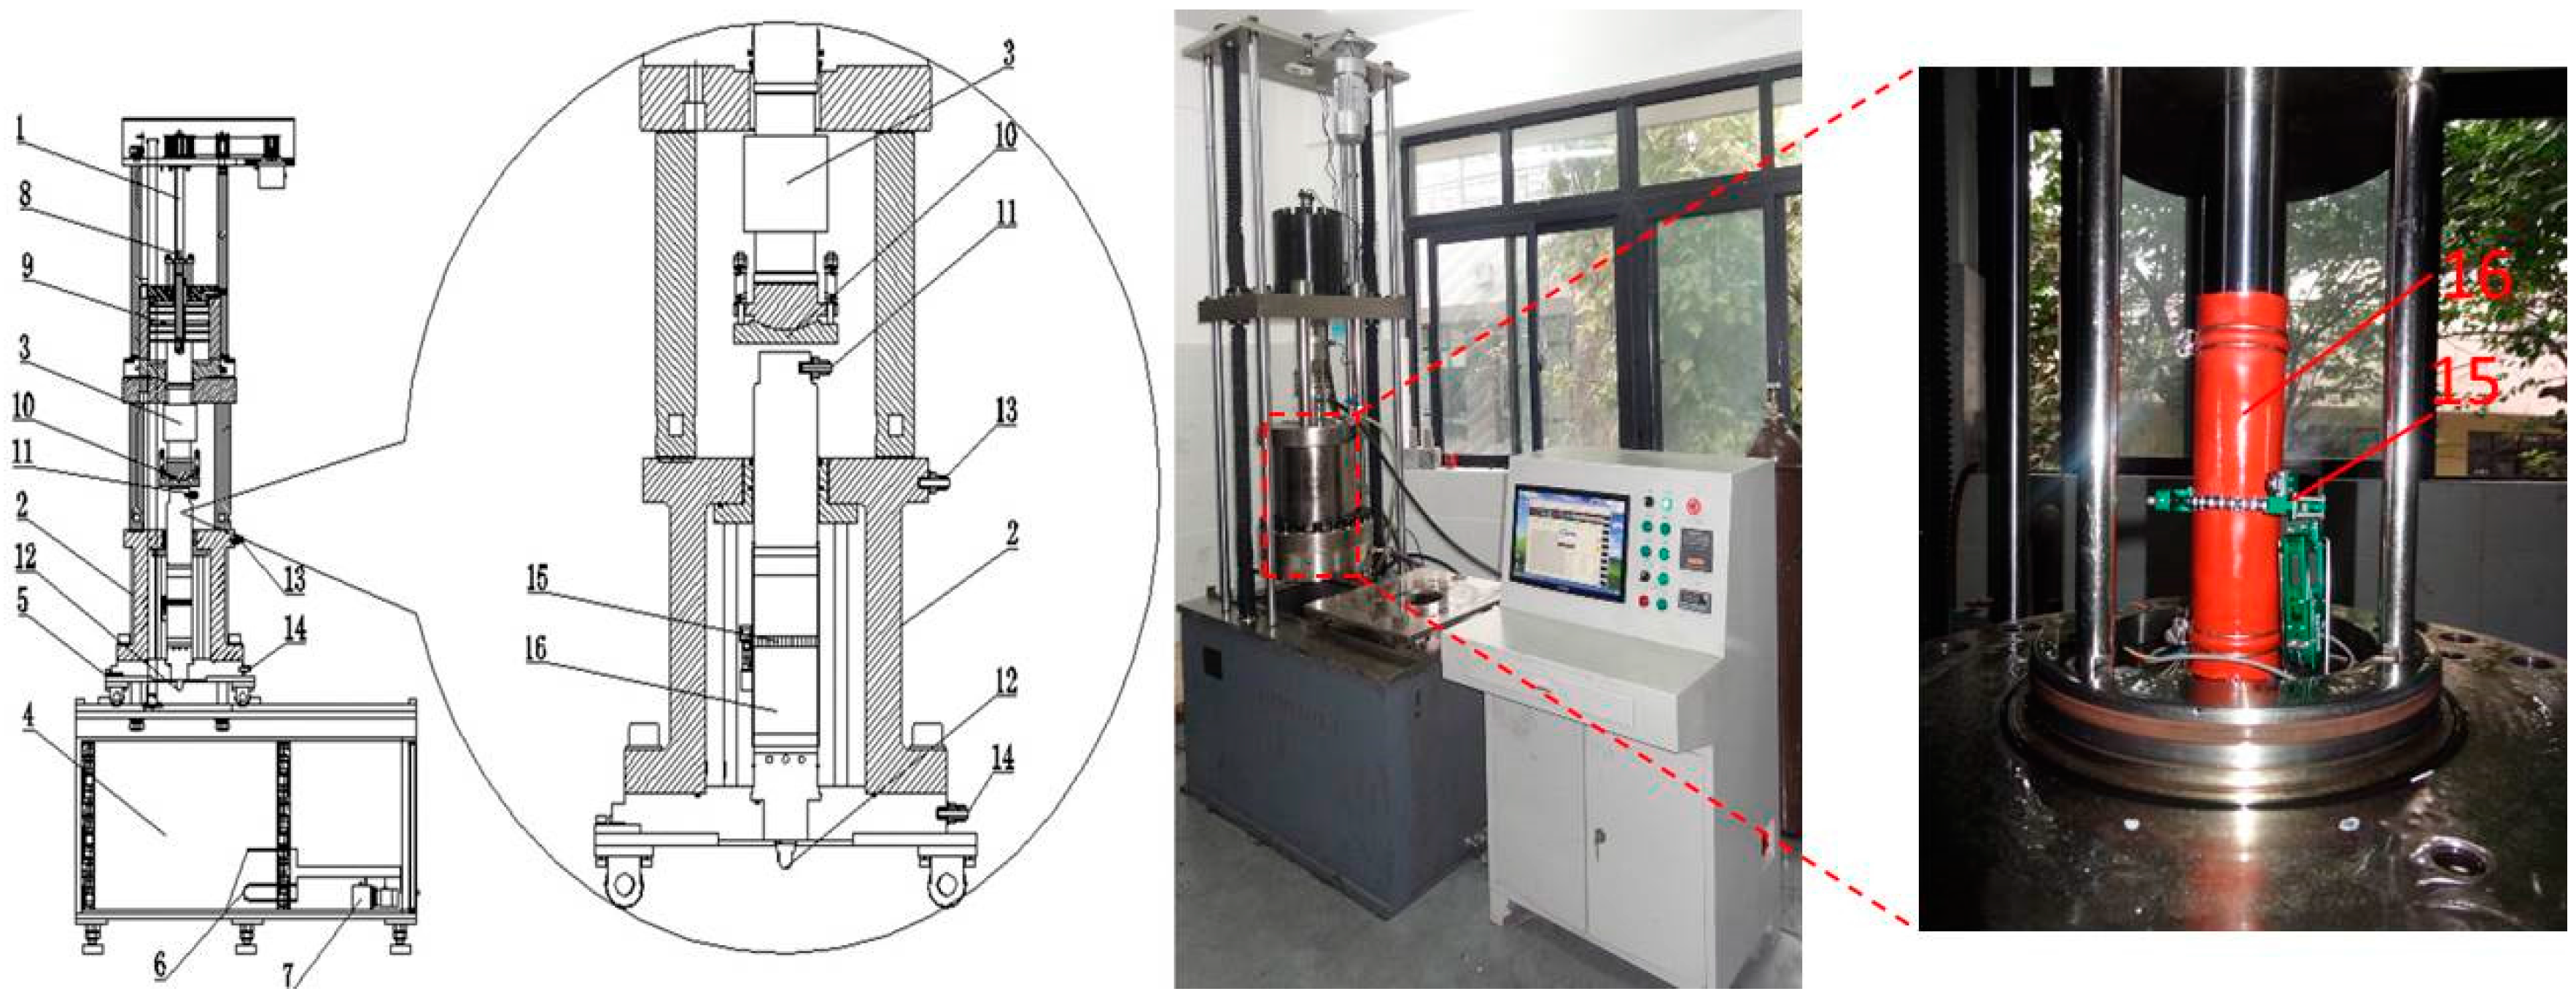
2.1. Experimental Apparatus

The experiments were carried out using the “thermo-hydro-mechanical (THM) coupled with triaxial servo-controlled seepage apparatus for gas-infiltrated coal and rock” [33,34], as shown in Figure 1. This experimental apparatus has the following system specifications: the servo-hydraulic pressure control system can provide a maximum stable confining pressure of 60 MPa. The servo axial loading system can supply a maximum axial force of 1000 kN. The pore gas pressure control system is designed to maintain a stable gas pressure, with a maximum pore gas pressure of 6 MPa. The temperature control system is used to adjust the experimental temperature using oil as a medium, with a maximum temperature of 110 °C. The displacement monitoring systems use a linear variable differential transformer for measurements, which consist of axial and radical displacement monitoring, with maximum axial and radical displacements of 60 mm and 12 mm, respectively. The accuracy of this experimental apparatus is ±1% for stress (range from 0.01 to 10 kN), ±1% for deformation (range from 0.001 to 0.06 mm). The gas flow rate is measured by the mass flow meter using a stationary method, and then recorded in the data storage system. The data acquisition and storage system can automatically capture the stress, displacement, and permeability data for the entire experimental process. This apparatus can be used for experimental research on the mechanical properties and permeability evolution rule of gas-infiltrated rocks under a variety of stress path conditions including the coupling process of temperature field, flow field and solid. Because of its high reliability and accuracy, it was suitable for the experimental tests.

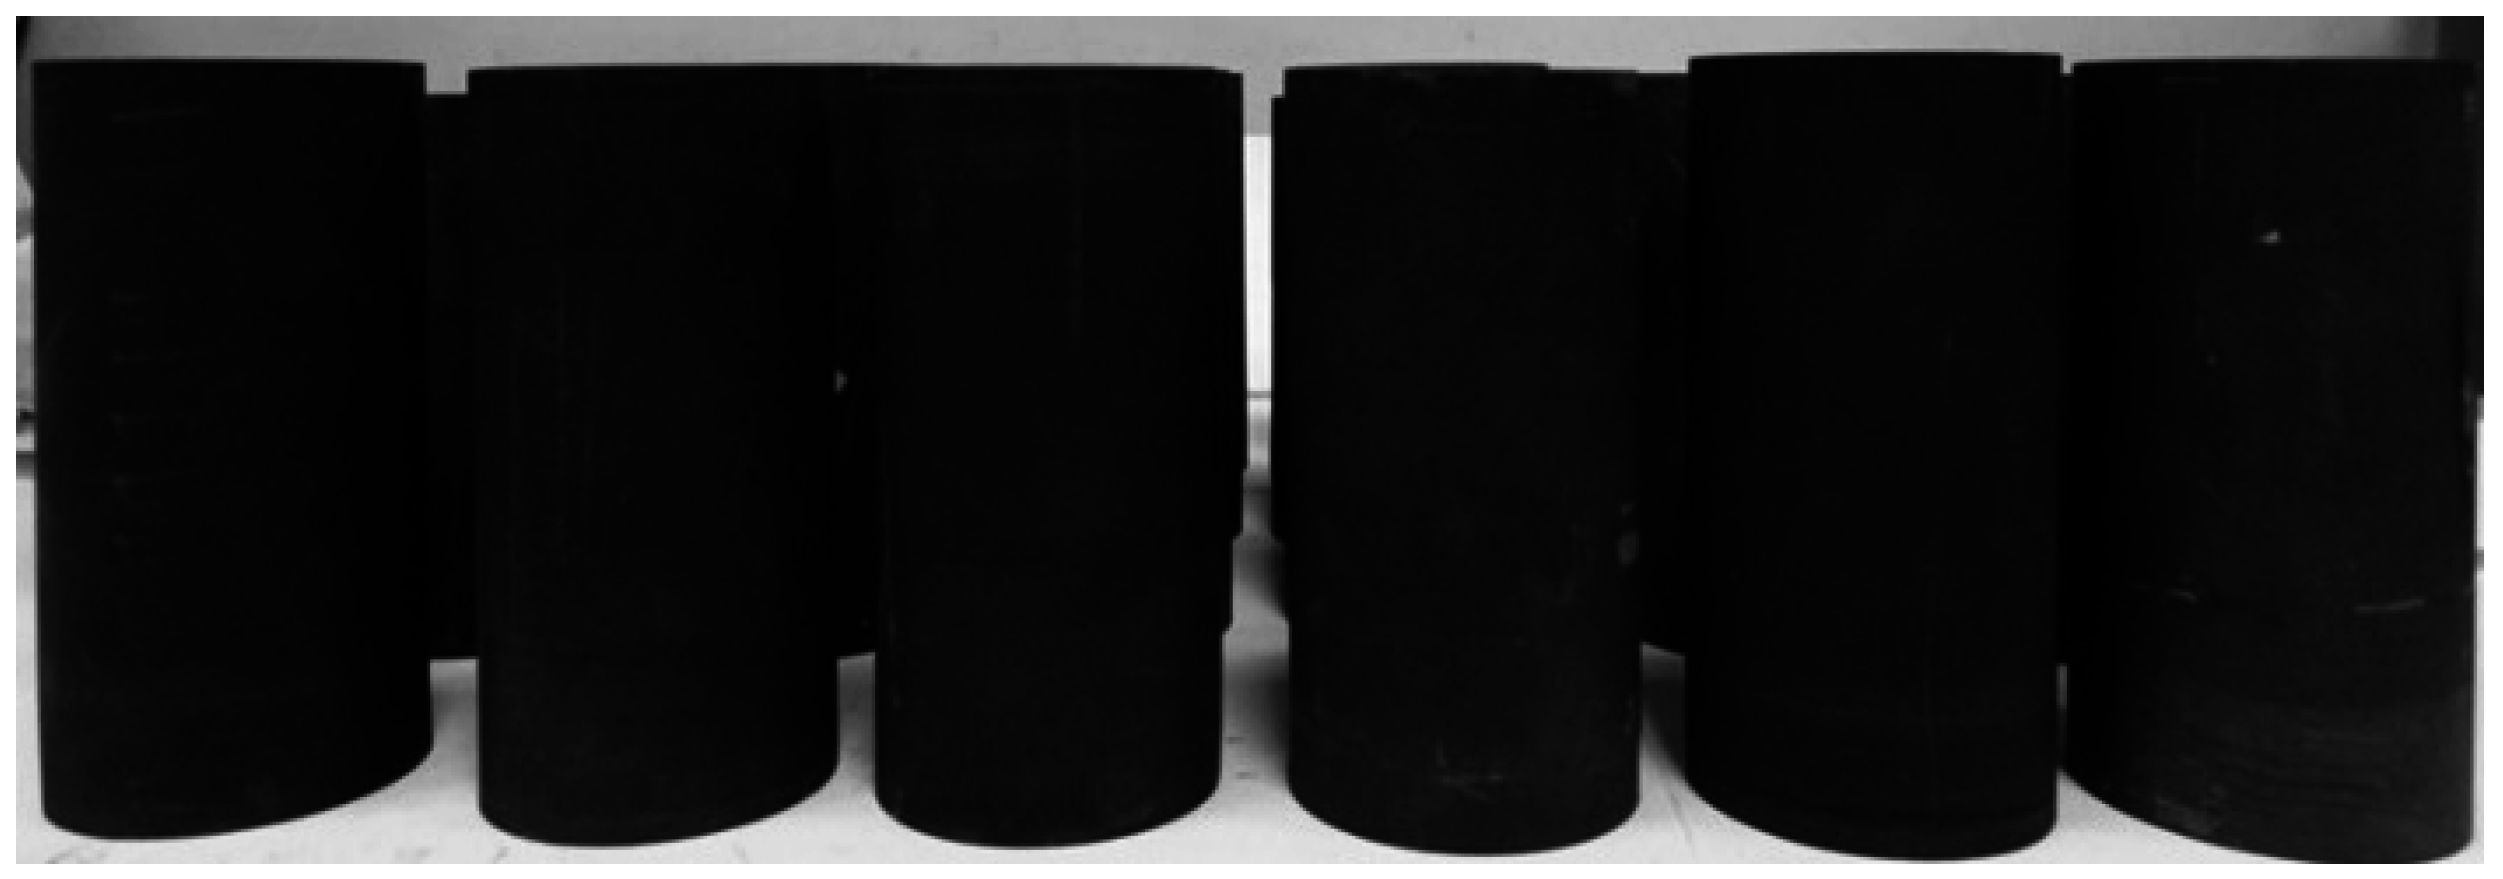
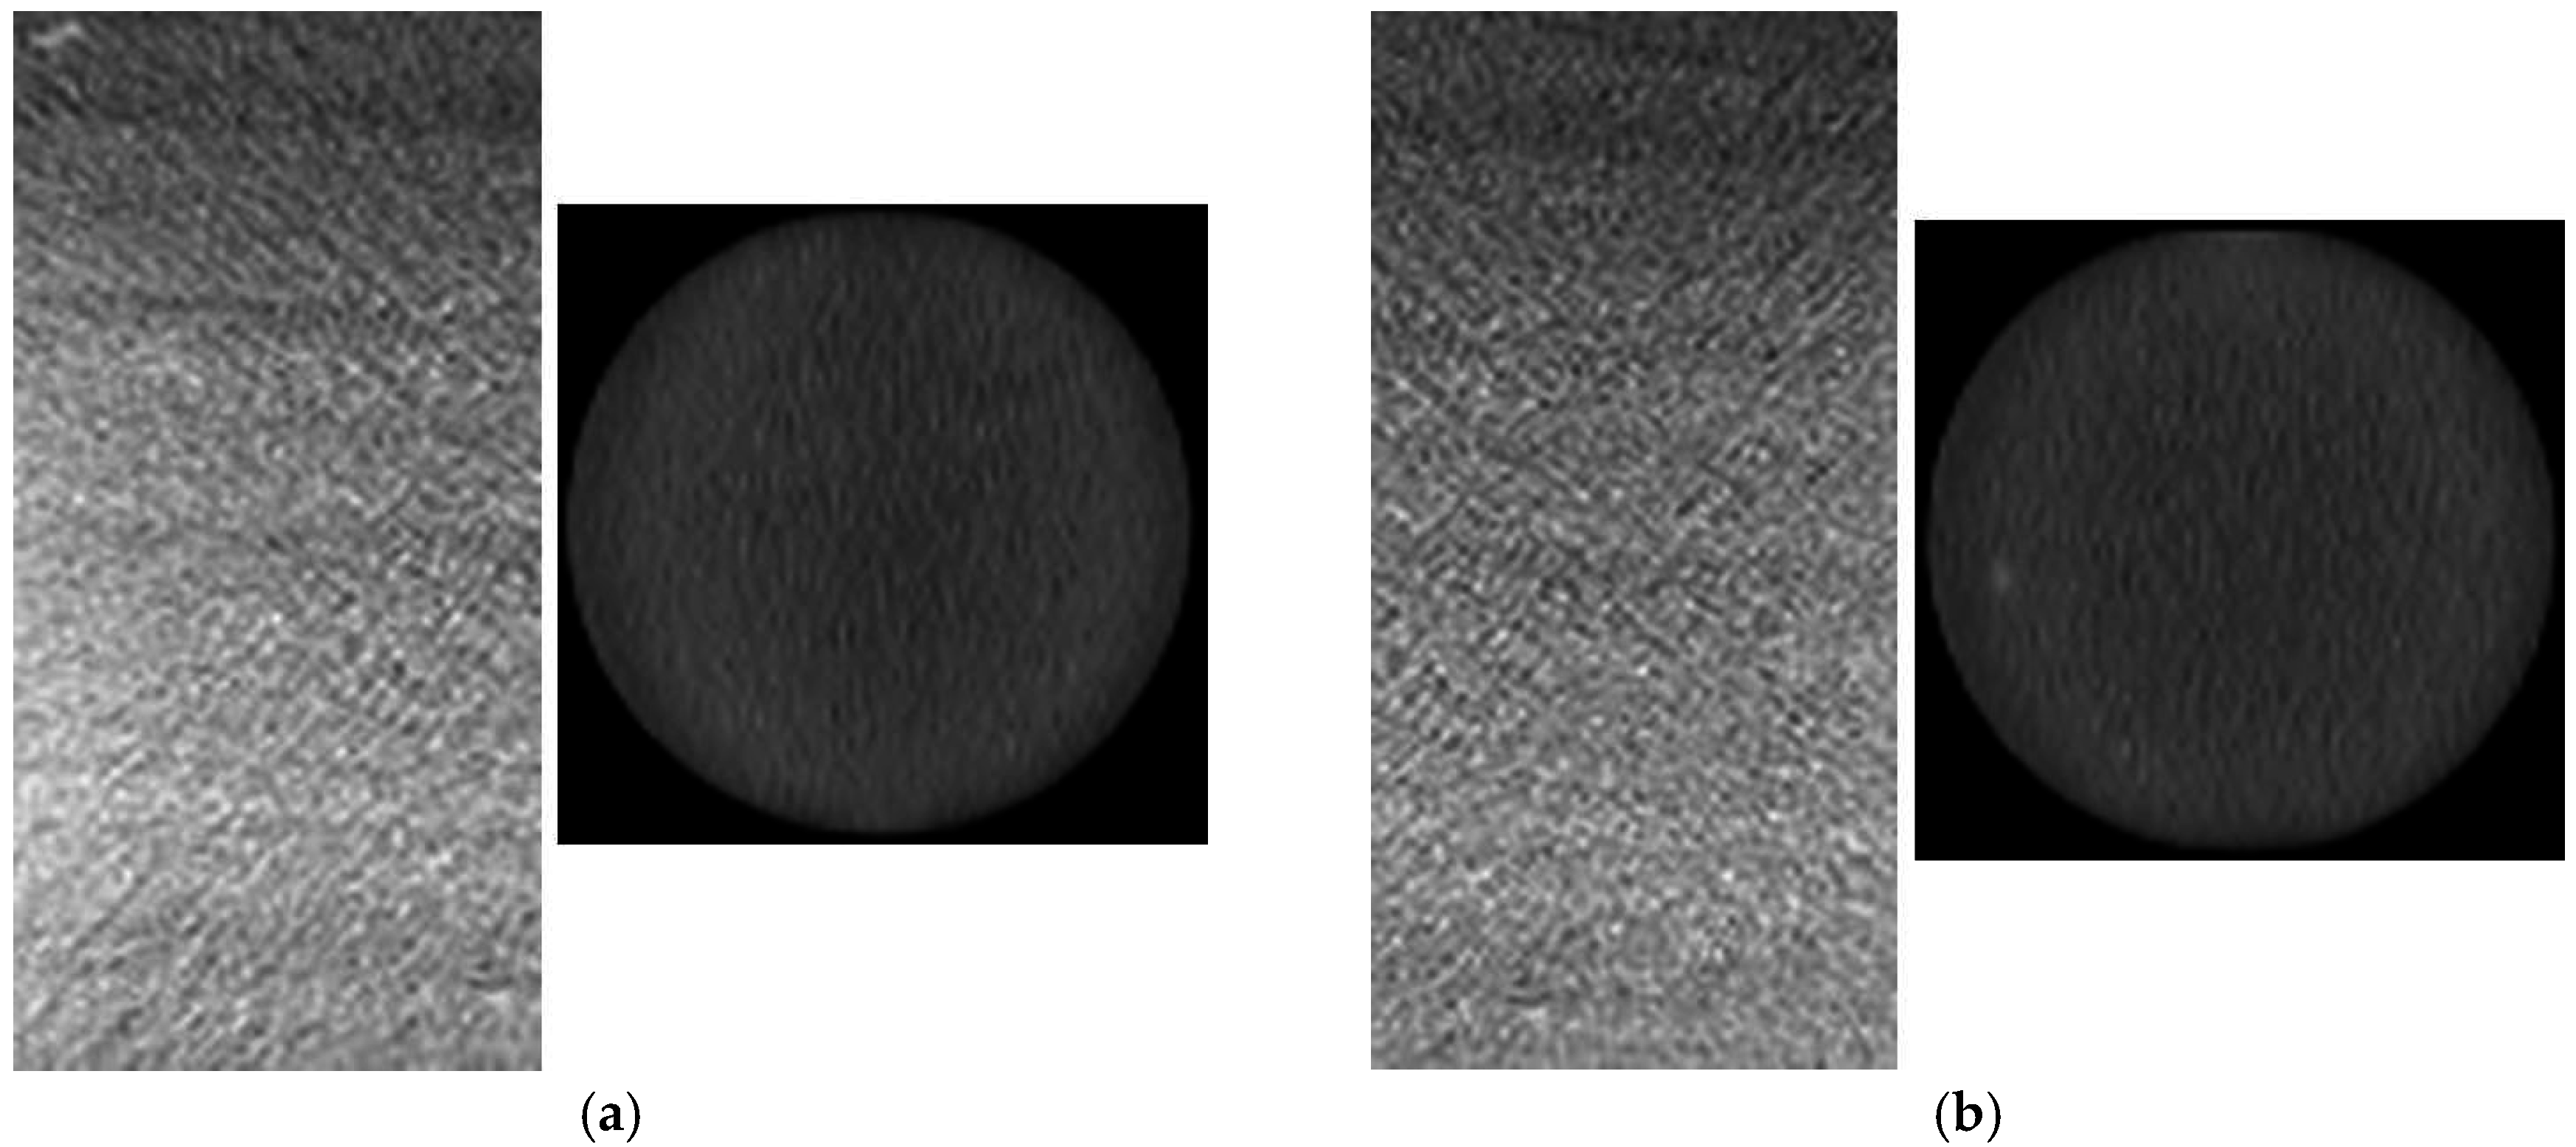
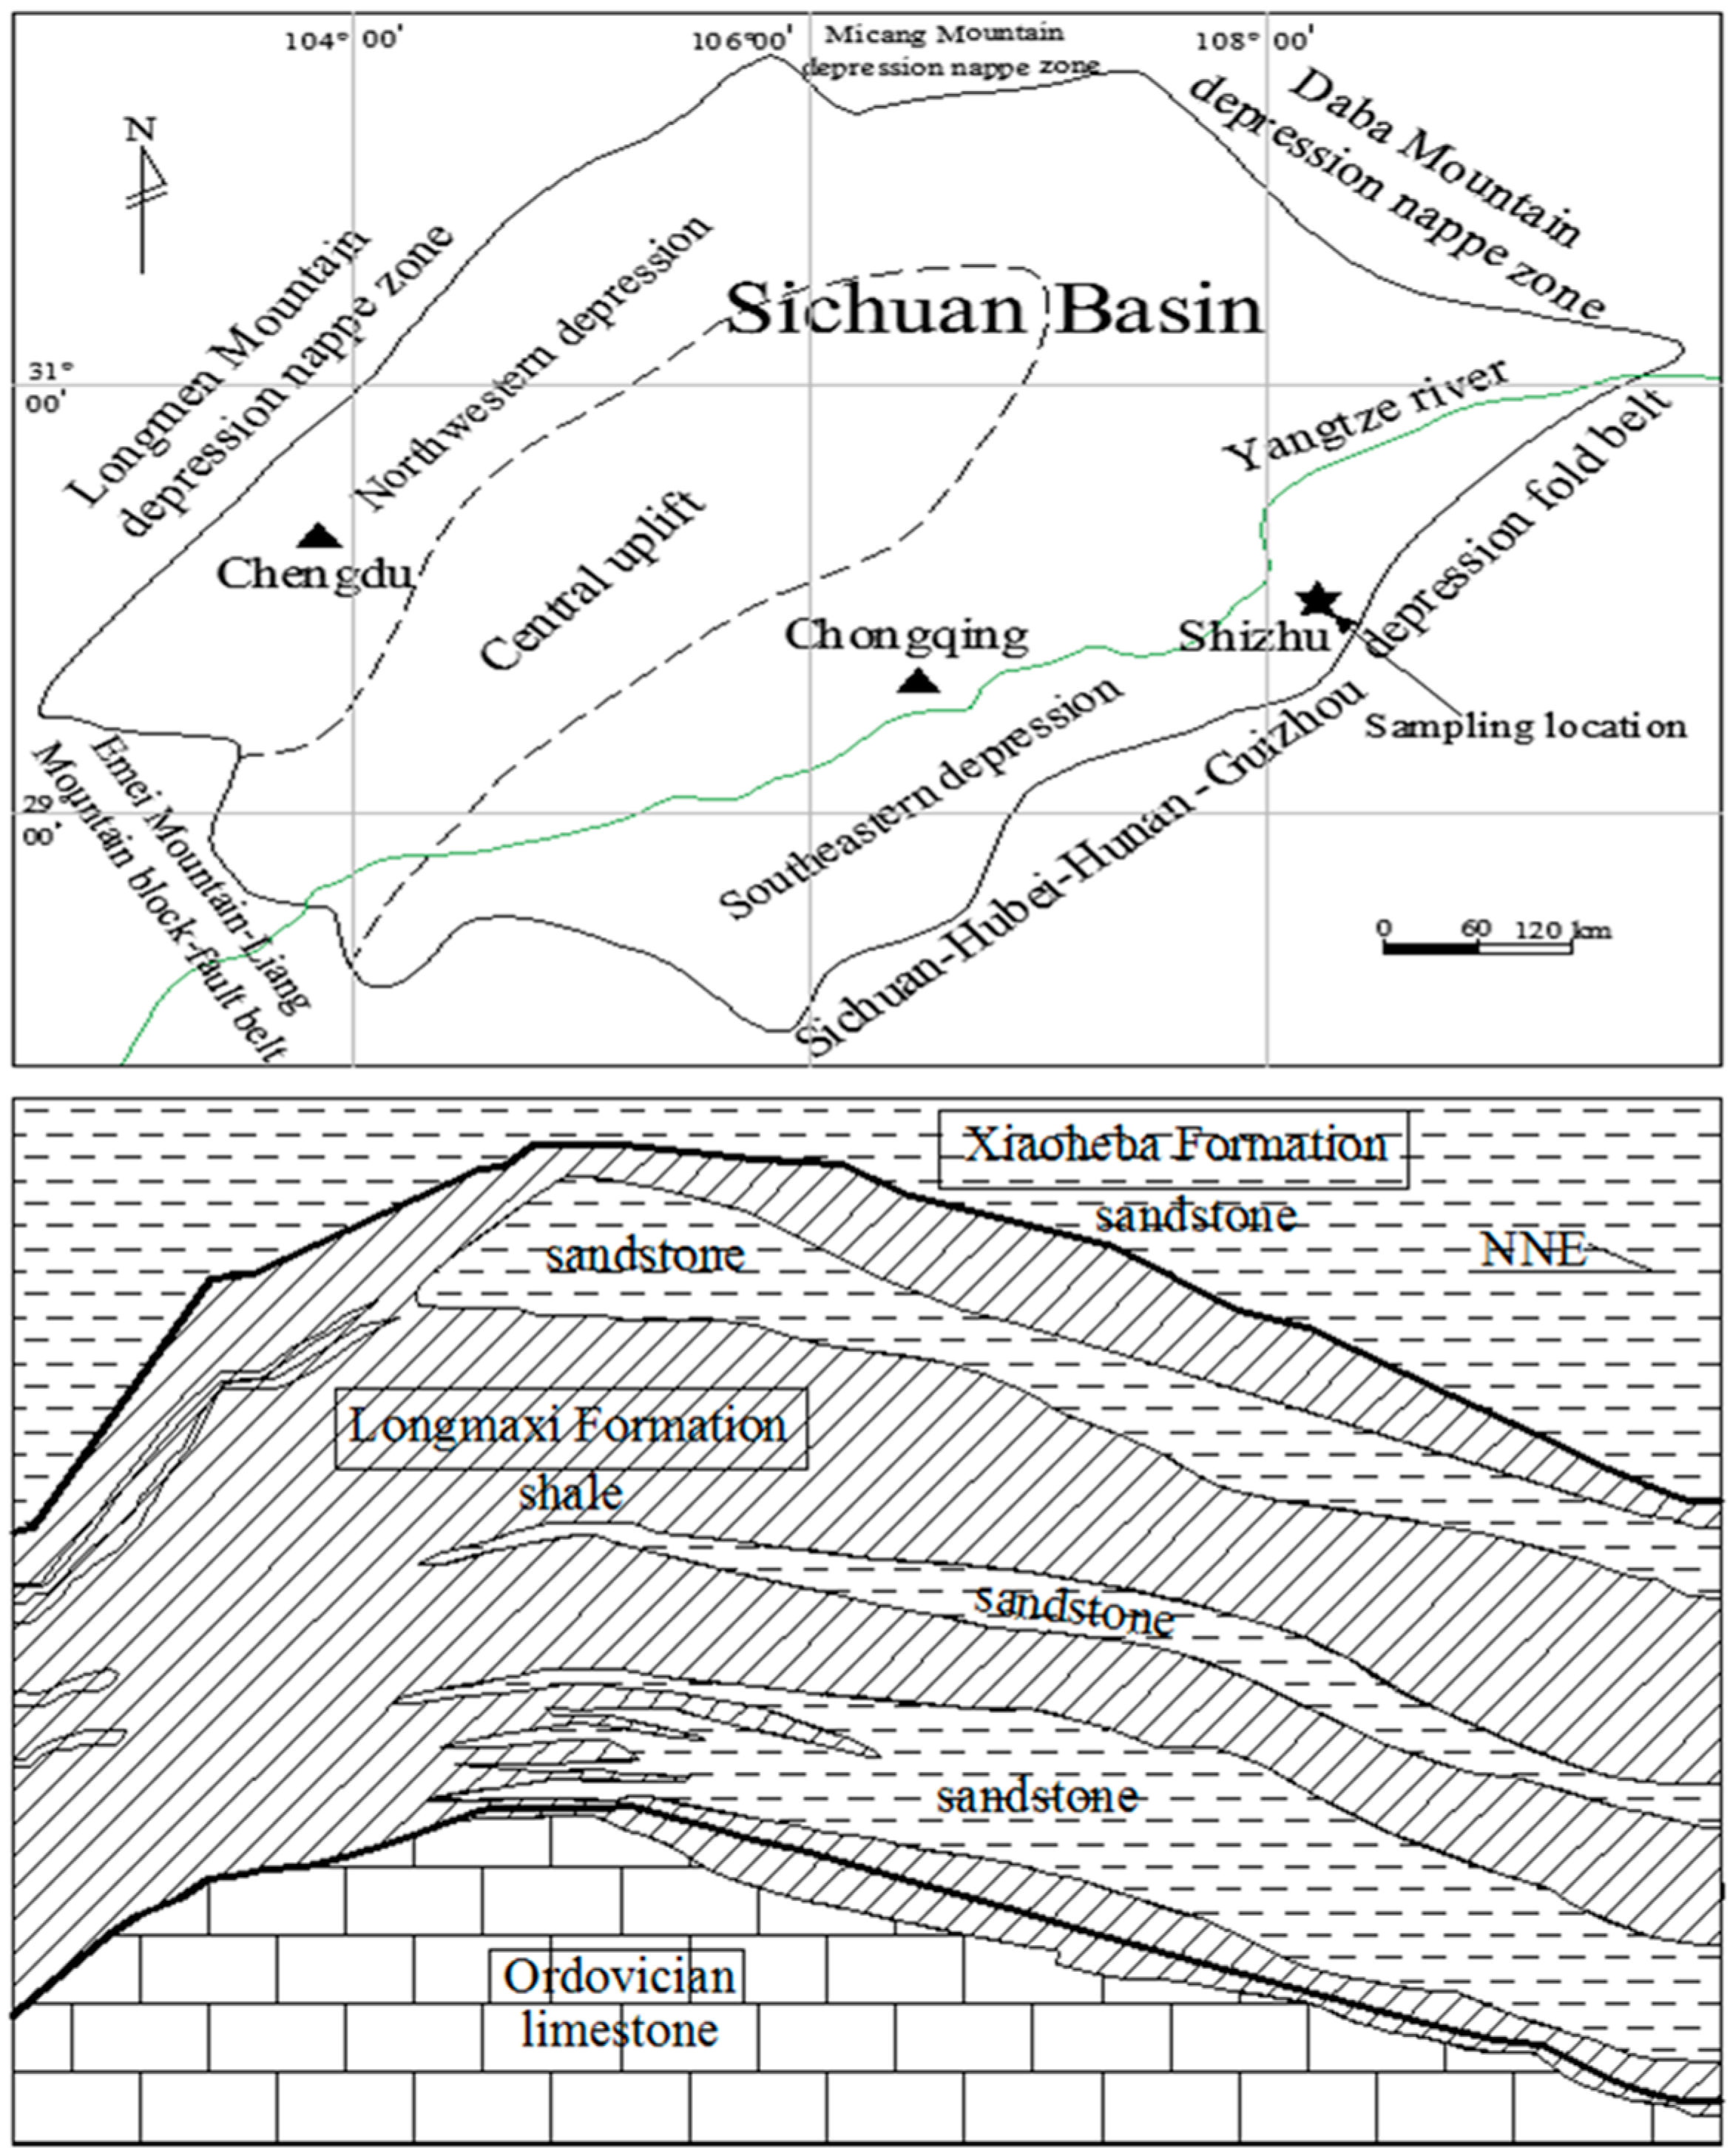
2.2. Sandy Shale Specimens and Sample Preparation

The experimental sandy shale samples were collected from the Sichuan Basin, Southwest China. The geological structure distribution of the Sichuan Basin is illustrated in Figure 2. It is surrounded by the Longmen Mountain depression nappe zone, Micang Mountain depression nappe zone, Daba Mountain depression nappe zone, Sichuan-Hubei-Hunan-Guizhou depression fold belt, and Emei Mountain-Liang Mountain block-fault belt. In addition, the basin can be divided into three areas: the northwest depression zone, central uplift zone, and southeast depression zone [35,36]. The shale samples were collected from the Longmaxi Formation of the Lower Silurian age, and came from a well drilled in the outcrops at Shizhu, Chongqing area, at the location (★) shown in Figure 2 [37]. The Lower Silurian age contacts with the Ordovician age and the Longmaxi Formation is integrated with the Upper Xiaohe Formation. The Longmaxi Formation is mainly composed of sandstone and shale, the sand content and thickness increase significantly from west to east [33]. The range of the depth of the shale reservoir is from 2338 to 2415 m. The shale cores were carefully cored by core taking machine from a bulk shale block perpendicular to bedding planes, during the dry coring process wind was kept blowing to remove scrap, and then processed to produce standard cylinder specimens with a diameter of 50 mm and height of 100 mm, according to the demands of the International Society for Rock Mechanics, and the faces were parallel to within less than 0.02 mm of difference. The shale samples used in the tests are shown in Figure 3. To avoid the effect of initial water content, the samples were dried for 24 h at 80 °C by a drier. The mass evolution was performed to check the drying condition of the shale sample. If the shale mass did not reduce over the next 2 h, the shale specimen was regarded to be fully dried. The internal characteristics of the shale specimens were obtained using the Computed Tomography (CT) and the CT images scanned from the middle of the specimens are shown in Figure 4. It can be seen that the shale sample has a group of nearly parallel bedding planes before and after the drying process. The distribution of different colour shades indicates the different mineral compositions in the cross section parallel to the bedding, and it clearly shows a significant heterogeneity. It shows white when the density of shale particles is higher, and it shows grey when the density of shale particles is lower. Comparing the CT images before and after the drying process, they are slightly different. As exemplified by the small white particles in the dry sample CT image, pyrolysis of mineral particles causes very little change in the internal structure. The CT images are roughly the same and it can be concluded that the drying process doesn’t induce damage along bedding planes. The permeability range of tested specimens is from 7.62 × 10⁻¹⁸ to 1.49 × 10⁻¹⁷ m2. Ten experiments were carried out for each test and the singularity data were removed and then the calculated average value was considered as the test data. The test results of the samples can represent the reservoir properties. The porosity and density are 2.90% and 2310 kg/m3, respectively. It has a BET surface area of 23.18 m2/g, Langmuir surface area of 31.01 m2/g. The mineral composition is made up of quartz and clay minerals and a small amount of feldspar, calcite, dolomite, and pyrite. It has an average quartz content of 46.7% (range from 33.4% to 58.6%) and average clay mineral content of 34.7% (range between 19.9% and 47%) [31,32]. Samples perpendicular to bedding planes show an uniaxial compression strength of 88.70 MPa, Young’s modulus of 10.88 GPa and Poisson’s ratio of 0.31, while samples parallel to bedding planes show an uniaxial compression strength of 91.05 MPa, Young’s modulus of 16.93 GPa and Poisson’s ratio of 0.287. The uniaxial compression strength of bedding angles 30° and 60° are 58.96 MPa and 79.32 MPa. The strength anisotropy can be determined by the ratio of the maximum and the minimum uniaxial compression strength of different bedding angles. The calculated strength anisotropy value is 1.544.

2.3. Testing Scheme

Shale gas is mainly composed of alkanes, with methane accounting for the vast majority, therefore, methane was chosen to perform the tests. In situ stress state is associated with the depth of the reservoir. According to the average rock density, the investigated confining pressure 30 MPa corresponds to a depth of approximately more than 1000 m. The in situ stress state including the pore pressure is greater than the investigated stress state. Combined with the consideration of the experimental apparatus, the investigated pore pressure was set to 2 MPa. The testing stress path is to simulate the state of in situ stress redistribution near the well-bore. The experimental tests took into account various test schemes, the details of which are presented below:

2.3.1. Scheme 1

Triaxial compression of shale samples with zero gas pressure: first, the axial pressure and confining pressure were gradually loaded to the hydrostatic pressure. Then, the confining pressure was kept constant, and an axial force was loaded at a speed of 0.1 mm/min using a displacement control. Finally, a continuous axial pressure was exerted until the shale sample reached the peak stress, and the residual strength almost remained stable. In the complete stress-strain procedure, the stress and strain data were continuously measured, collected, and stored. The hydrostatic pressure ranged from 10 to 30 MPa, with 5 MPa pressure steps, and the gas pressure was zero.

2.3.2. Scheme 2

Triaxial compression of gas-infiltrated sandy shale samples with 2 MPa gas pressure: the test procedure was the same as Scheme 1 other for the step to inject pore methane. When the loading hydrostatic pressure reached the target value, the methane was injected and maintained at a fixed gas pressure. Then, the hydrostatic pressure and gas pressure stress conditions were maintained for 12 h to ensure that the shale fully adsorbed the methane. If the gas pressure did not decrease over the next 2 h, the gas was considered to be fully adsorbed by the shale specimen. The hydrostatic pressure levels were similar, and the gas pressure was 2 MPa.

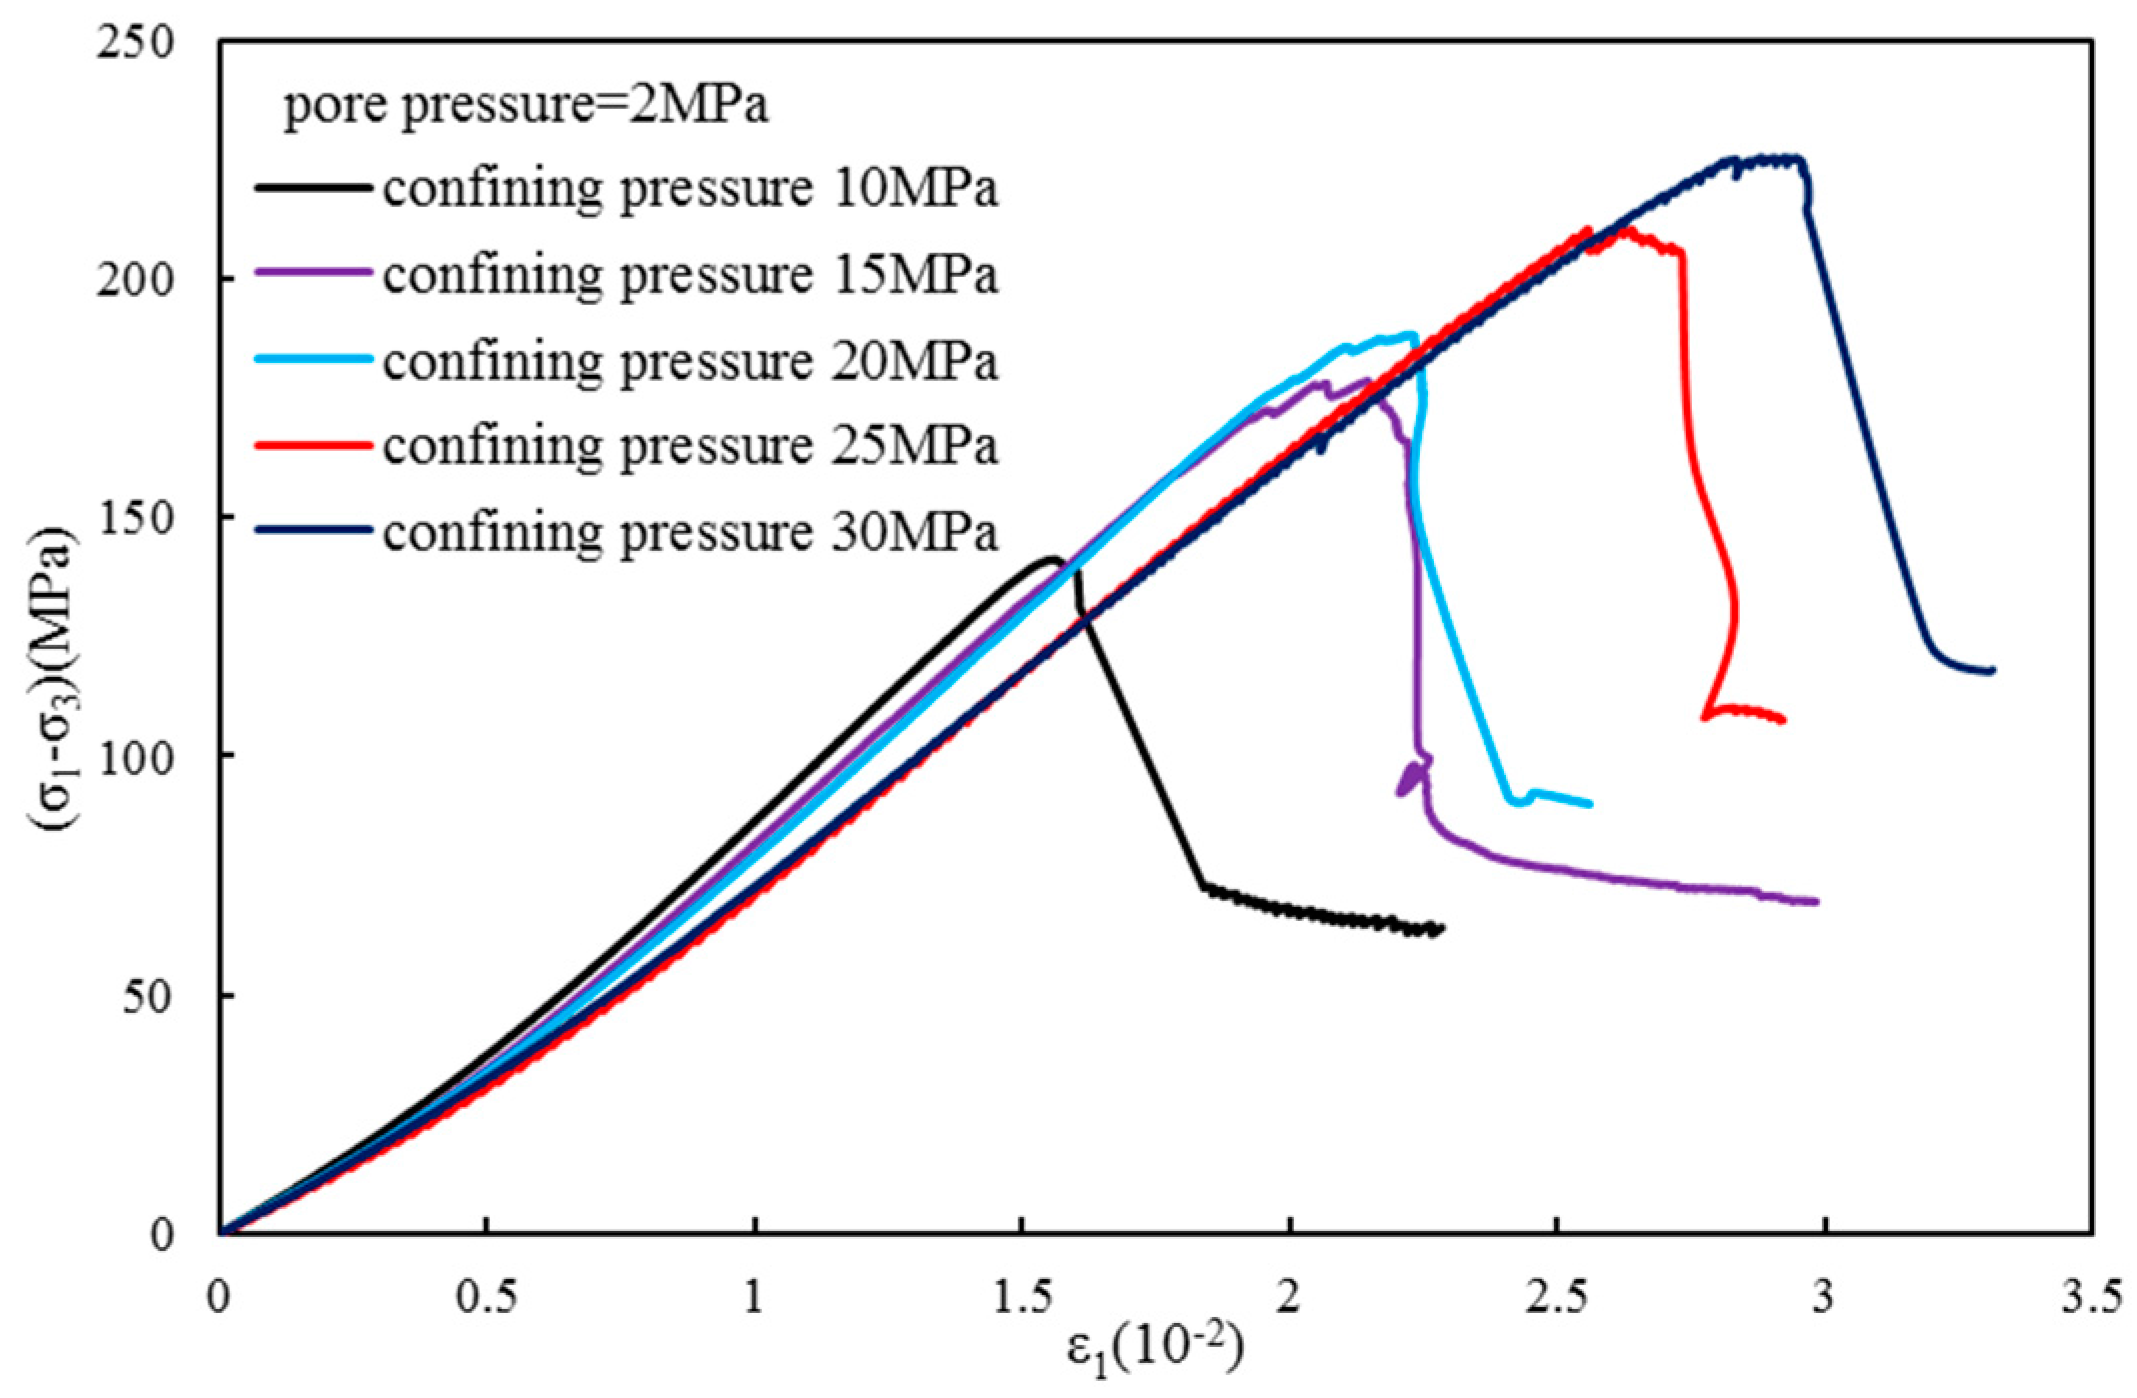
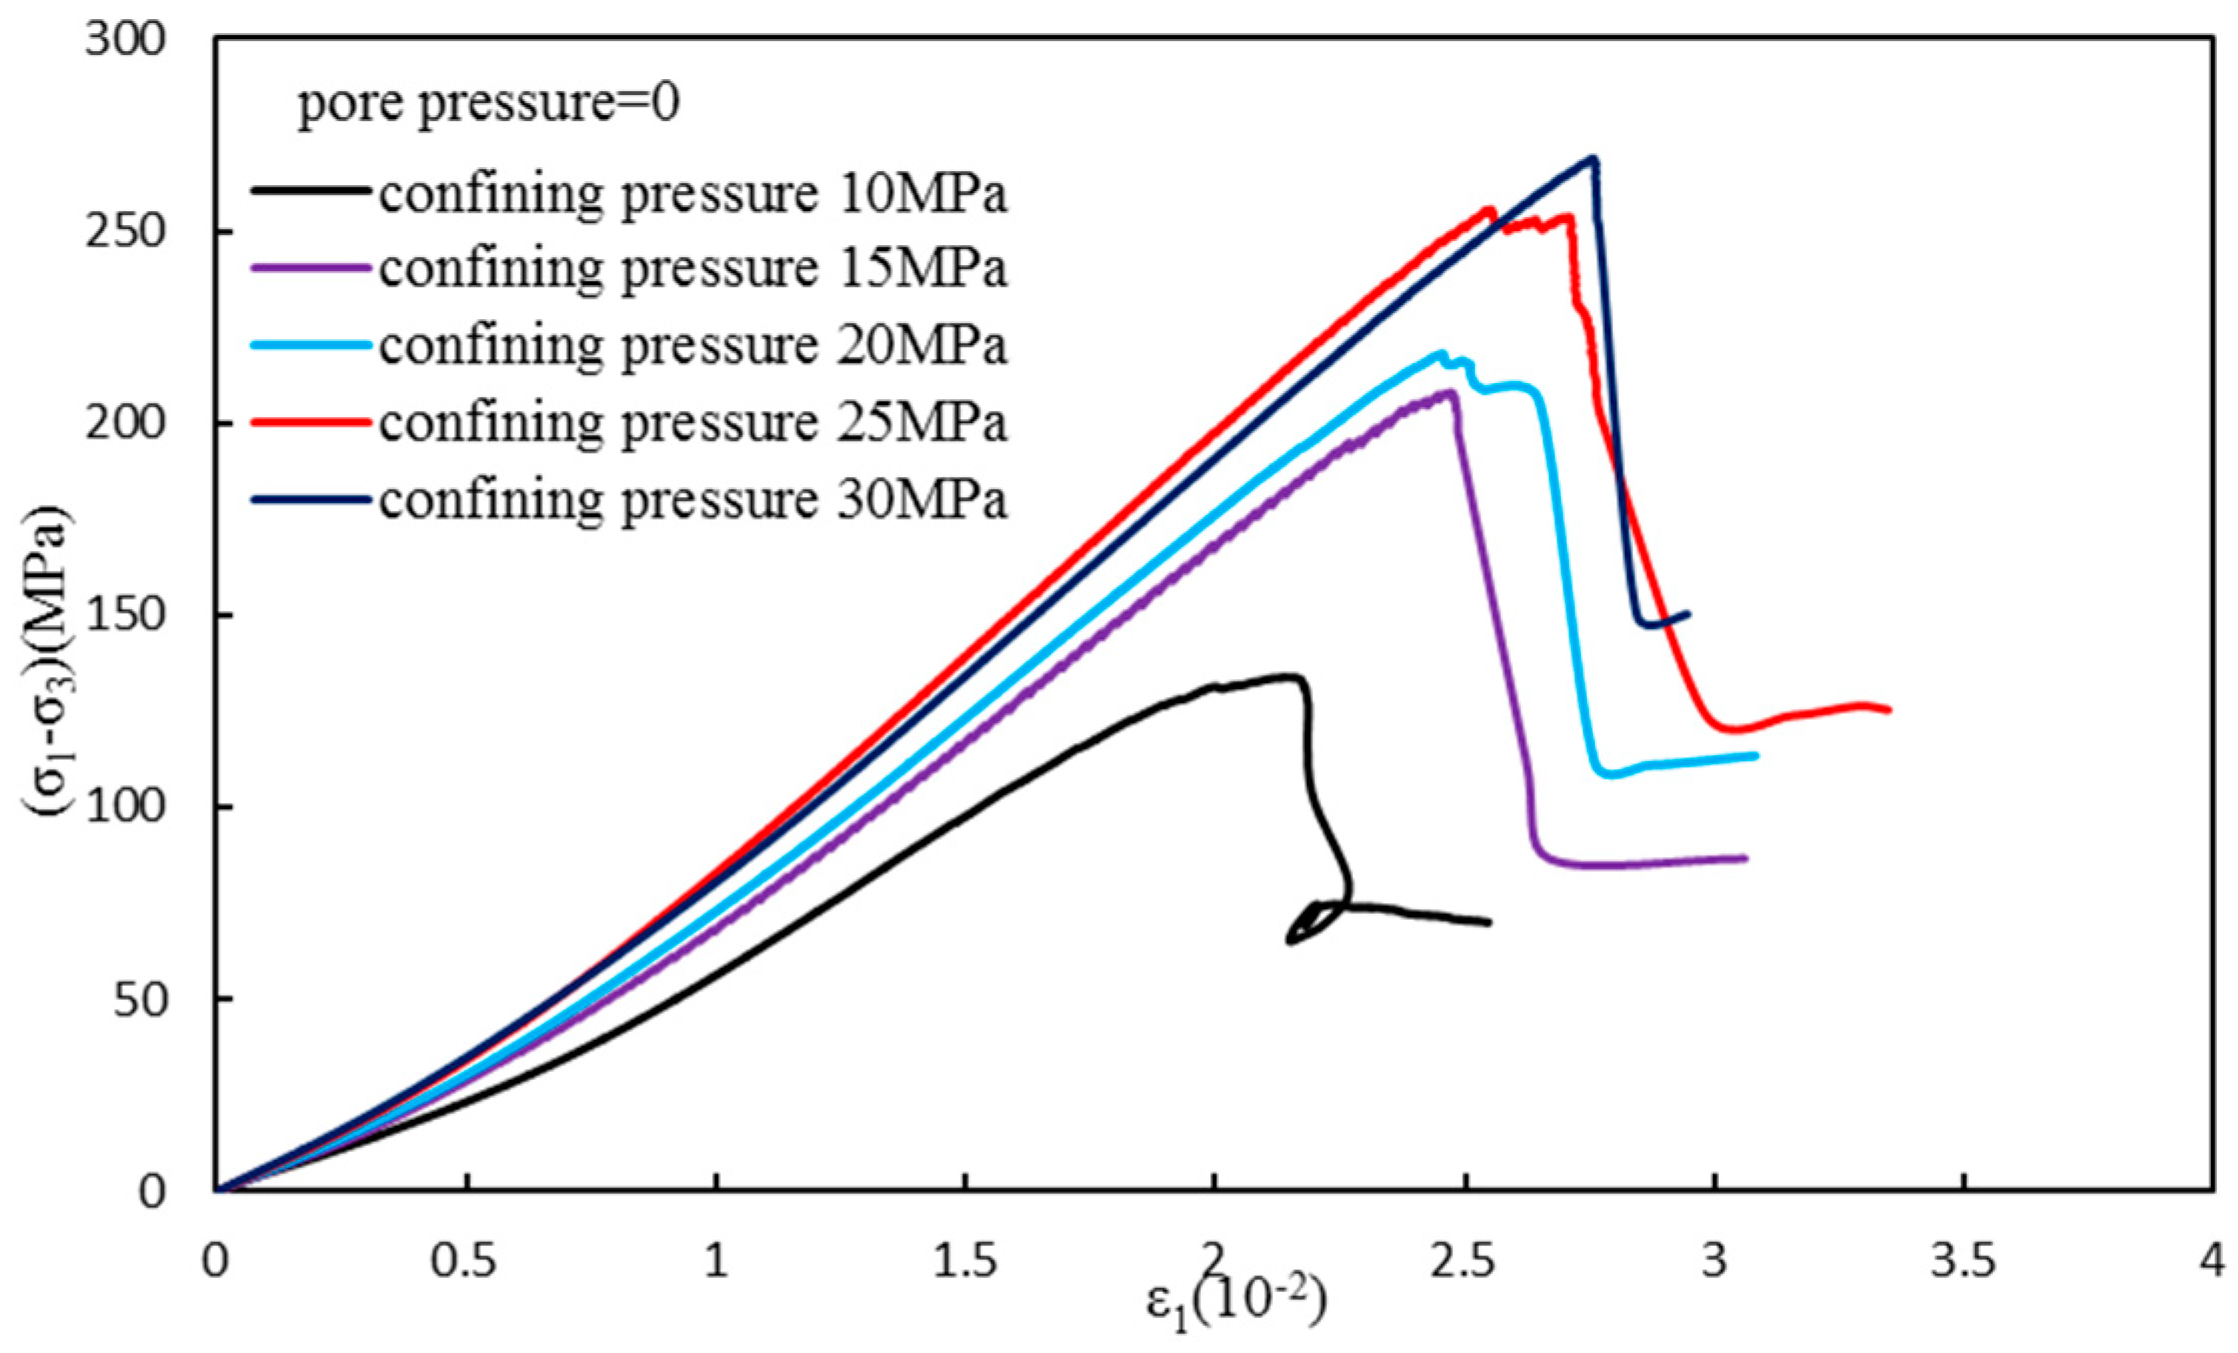
2.4. Testing Results

Figure 5 and Figure 6 show the stress-strain curves from the triaxial compression tests of gas-infiltrated sandy shale under 0 and 2 MPa gas pressure conditions, where the confining pressure was 10, 15, 20, 25, and 30 MPa. Table 1 presents the experimental strength parameters with the gas pressure of 0 and 2 MPa in the triaxial compression tests. It clearly shows that the strength of the shale increased with an increase in the confining pressure, despite the gas pressure. When the confining pressure was 10 MPa, the peak strength of the shale samples under gas pressure conditions of 0 and 2 MPa were 145.03 and 132.29 MPa, respectively, and the strength showed a reduction of 9.6%. Accordingly, there were reductions of 14.09%, 14.25%, 19.34%, and 17.04% corresponding to confining pressures of 15, 20, 25, and 30 MPa, respectively. The conclusions implied that pore methane has a decreasing effect on the rock strength.

3. Modified Failure Criteria Based on Effective Stress

Generally, failure criteria are expressed in the form of the major, intermediate, and minor principal stresses using expressions such as σ1 = f2, σ3) or f1, σ2, σ3) = 0. For the purpose of investigating the failure criterion of gas-infiltrated sandy shale, considering the effect of pore methane, these expressions were changed to σ1 = f2, σ3, p) or f1, σ2, σ3, p) = 0. Combining the effects of the pore gas pressure and principal stress, the failure criteria can be presented in terms of the effective stresses by σ′1 = f(σ′2, σ′3) or f(σ′1, σ′2, σ′3) = 0 [38,39].

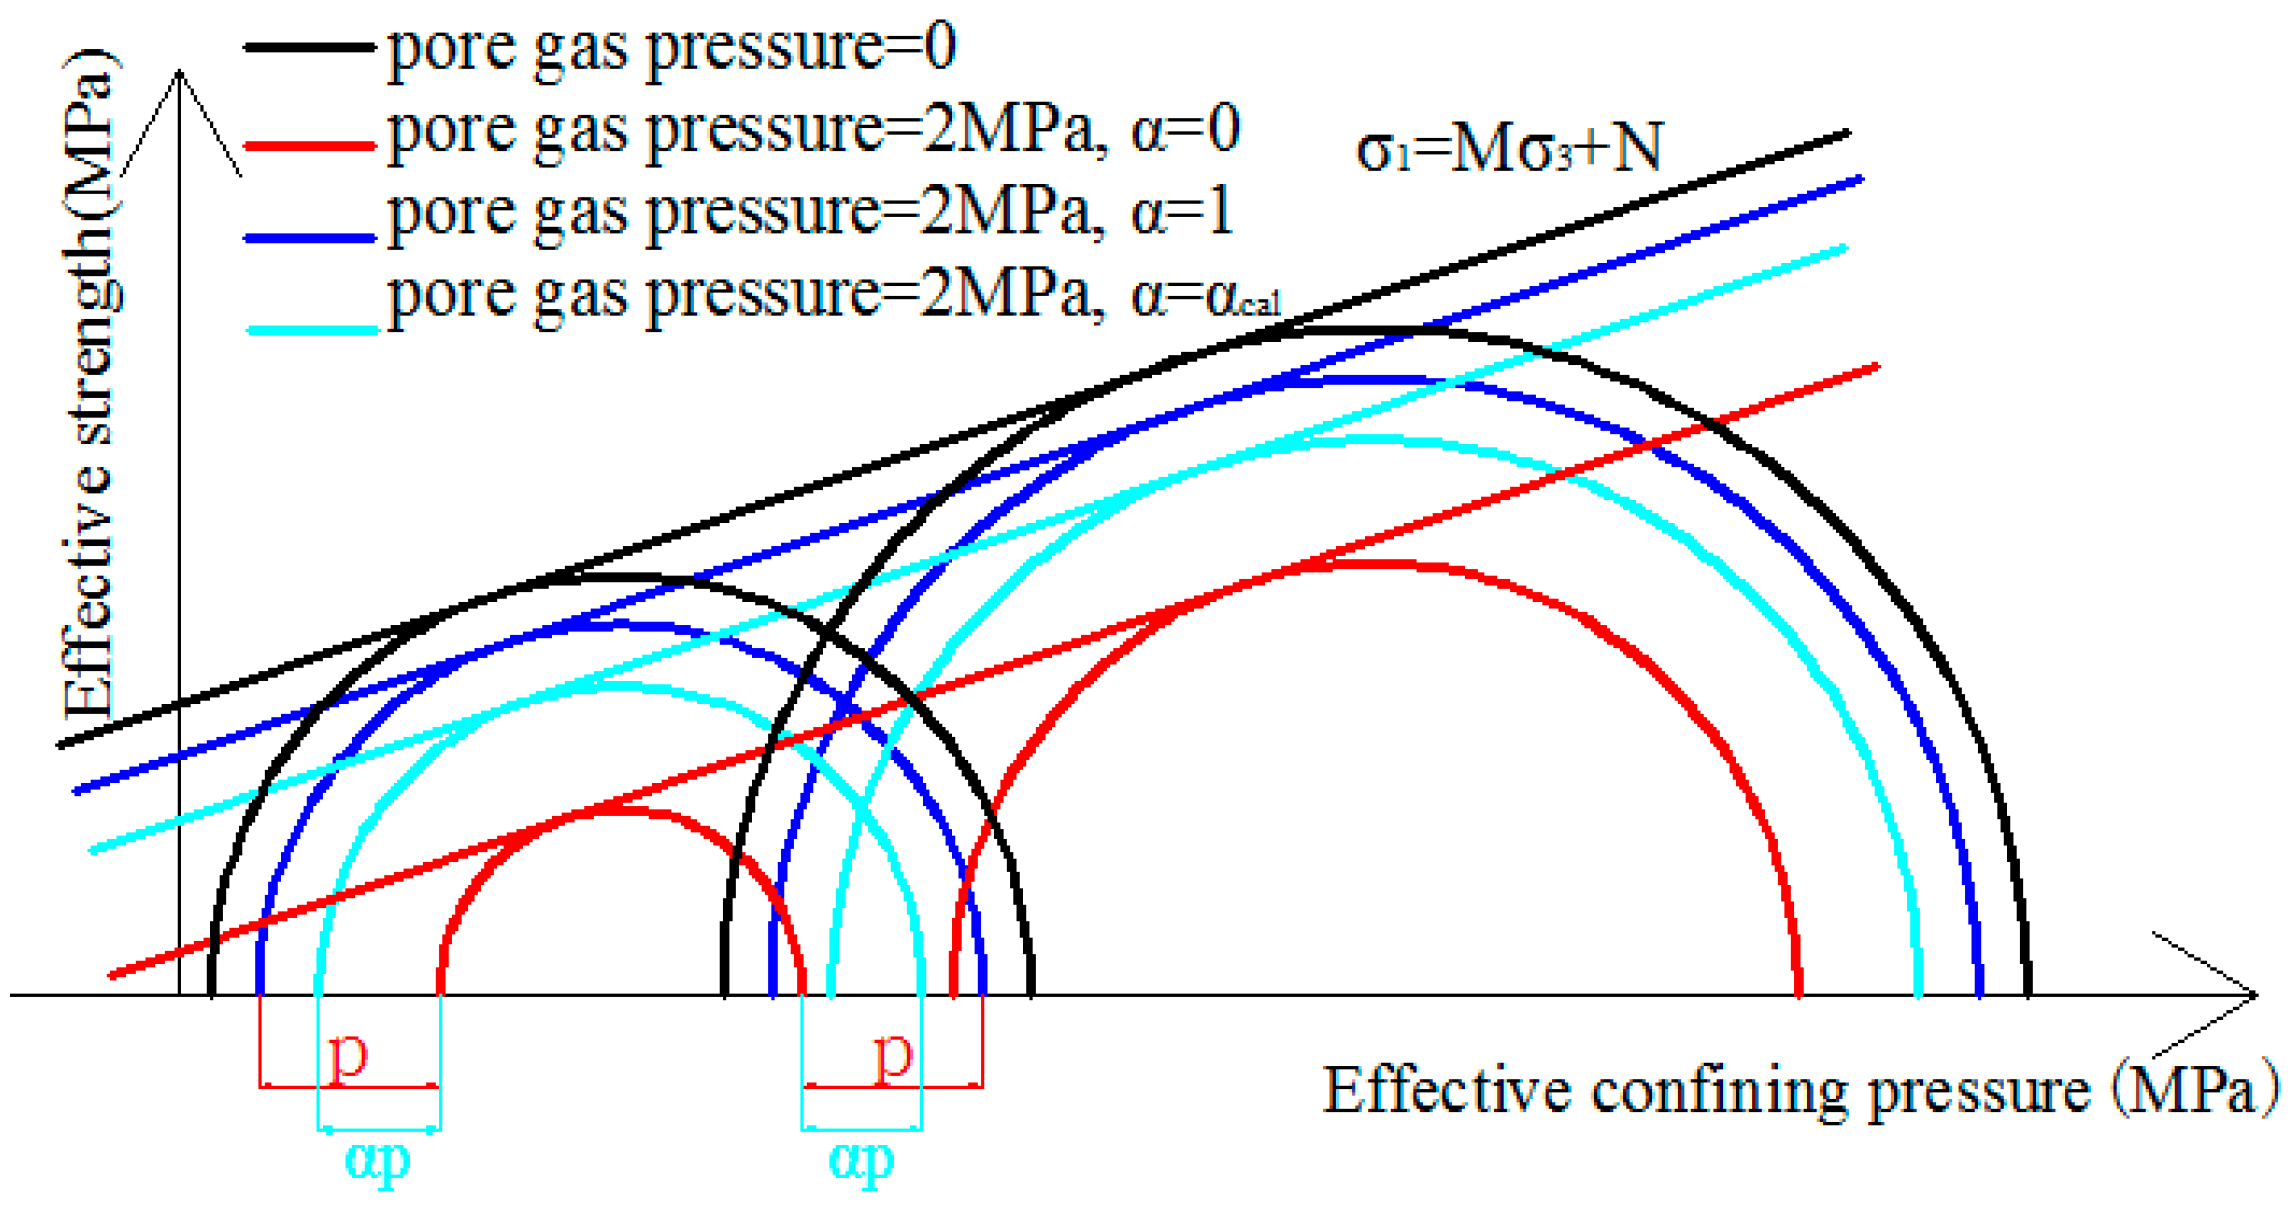
3.1. Effective Stress of Gas-infiltrated Sandy Shale

Shale is a typical porous rock to some extent and usually contains a large number of cracks and fractures of different scales, which are the storage locations of shale gas. Therefore, it is necessary to take the coupling effect of the gas and solid into account. Biot′s theory for coupling a fluid and solid is based on the effective stress principle. The principle has been first proposed by Terzaghi [40]. In general, the effective stress is defined as follows [41,42]:
σ i j = σ i j α p δ i j
where σ′ij is the effective stress (MPa), σij is the total stress (MPa), δij is the Kronecker delta, α is the effective stress coefficient, and p is the pore gas pressure (MPa).
The relationship between the effective stress coefficient and the bulk modulus was proposed on the basis of experiment research on porous rocks [43]. The effective stress coefficient can be determined by:
α = 1 K K s
where K and Ks represent the bulk moduli of shale and shale grains, respectively.
The bulk modulus of shale is given by:
K = E 3 ( 1 2 ν )
where E is the Young’s modulus of shale, and ν is the Poisson ratio of shale.
Many researchers have performed experimental investigations on the effective stress coefficients of a variety of rock types, and have found that the effective stress coefficients of porous rocks range from 0 to 1 [44]. For instance, Walsh [45] defined α = 0.9 for a rock mass containing joints with polished surfaces, and Kranzz et al. [46] proved that α = 0.56 for a rock mass containing tension fractures. Experimental studies on coal samples under loading–unloading cycles showed that α = 0.71 [47]. Based on an experimental investigation of Weber sandstone, Nur and Byerlee [48] obtained α = 0.64. Generally speaking, the effective stress coefficient is influenced by the stress conditions.
In this study, three different effective stress coefficient values (α = 0, α = 1, and the calculated coefficient) were used to calculate the effective principal stress in order to analysis the failure criterion of gas-infiltrated sandy shale. The bulk moduli of shale grains Ks can be measured using a drained hydrostatic compression test, which the hydrostatic stress and pore pressure were simultaneously incremented up to a certain value using the same increments [49,50]. The bulk moduli of shale K can be calculated by the Young’s modulus and Poisson ratio, the Young’s modulus can be measured by axial force difference divided by axial strain difference, the Poisson ratio can be measured by radial strain difference divided by axial strain difference. Particularly, the stress and strain are at the elastic stage of triaxial tests. The Young’s modulus and Poisson ratio can be also calculated by generalized Hooke’s law, the calculated expressions are E = (σ1 − 2μσ3)/ε1, μ = (Bσ1 − σ3)/[σ3(2B − 1) − σ1] and B = ε31. Combining the two determination methods, the Young’s modulus and Poisson ratio are determined. The effect of pore methane on the effective strength of gas-infiltrated sandy shale is clearly presented in Figure 7. In addition, the different effective stress coefficient values show different impacts on the effective strength. When α = 0, the effect of pore methane was neglected, and the effective strength was underestimated. Conversely, when α = 1, only the mechanical effect of the pore gas pressure was considered, and the effective strength was overestimated. When α = αcal, an accurate effective strength was predicted as a result of considering the combined pore methane influence. Moreover, the relationship between the calculated effective stress coefficient and confining pressure, as illustrated in Figure 8, implies that the calculated coefficient decreases with increasing confining pressure.

3.2. Mohr-Coulomb Failure Criterion

The Mohr-Coulomb criterion is one of the most well-known and widely used failure criteria in rock engineering [51]. It is assumed that rock fails in the form of shear failure, and the strength equals the sum of the cohesion of the shear friction resistance and the friction of normal bending in the shearing surface. In other words, rock fails when the shear stress on a plane reaches a certain limit value, τmax. This can be expressed as a function relation of the shear stress and effective normal stress:
τ = c + σ n tan φ
where τ is the shear strength, σn is the effective normal stress, c is the cohesion of the rock material, and φ is the internal friction angle of the rock material.
Equation (4) can be expressed in terms of the principal stresses by:
σ 1 = M σ 3 + N
where, M and N are the constants related to rock strength, they and can be obtained as follows:
M = tan 2 ( π 4 + φ 2 )
N = 2 c cos φ 1 sin φ
Based on the effective stress considering the effect of the pore gas, σ′i = σi − αp, and the modified Mohr-Coulomb criterion can be written as:
σ 1 = M σ 3 + ( 1 M ) α p + N

3.3. Hoek-Brown Failure Criterion

Hoek and Brown proposed the relation of the principal stresses by means of laboratory testing [52,53,54,55]. Its expression is as follows:
σ 1 = σ 3 + m b σ c σ 3 + s σ c 2
where σc is the uniaxial compression strength of rock, and mb and s are two independent strength parameters. In particular, the value of s ranges from 0 to 1. The s value of intact rock material is equal to one, whereas the s value of a fractured rock material is less than one. Moreover, the determination of the values of mb and s would have a great influence on the fit of the Hoek-Brown failure criterion.
Based on the geological strength index (GSI), Equation (9) can be rewritten as:
( σ 1 σ 3 σ c ) 2 = m b ( σ 3 σ c ) + s
Taking the effective stress principle into account, σ′i = σi − αp, the modified Hoek-Brown criterion can be written as:
( σ 1 σ 3 σ c ) 2 = m b ( σ 3 σ c ) + s m b ( α p σ c )

3.4. Drucker-Prager Failure Criterion

The Drucker-Prager failure criterion was established on the assumption that the yield of the rock is completely determined by the second invariant of the stress deviator tensor, and it took into consideration the effect of the intermediate principal stress on the rock strength [56]. It takes the form:
J 2 = λ I 1 + k
where:
J 2 = 1 6 [ ( σ 1 σ 2 ) 2 + ( σ 2 σ 3 ) 2 + ( σ 3 σ 1 ) 2 ]
and:
I 1 = σ 1 + σ 2 + σ 3
where J2 is the second invariant of the deviatoric stress tensor, I1 is the first invariant of the stress tensor, and λ and k are the material parameters, which can be determined as follows:
λ = 2 sin φ 3 ( 3 sin φ )
k = 6 c cos φ 3 ( 3 sin φ )
Specifically, in the traditional triaxial test for compressive strength, σ2 = σ3, (12) reduces to:
1 3 ( σ 1 σ 3 ) = λ ( σ 1 + 2 σ 3 ) + k
Taking the effective stress principle into consideration, σ′i = σi − αp, the modified Drucker-Prager criterion can be expressed by:
1 3 ( σ 1 σ 3 ) = λ ( σ 1 + 2 σ 3 ) + k 3 λ α p

3.5. Linear Mogi Failure Criterion

Mogi [57] showed that the failure criterion can be indicated by the relation of the octahedral shear stress and the mean normal stress:
τ o c t = f ( σ m , 2 )
where f is a monotonically increasing function, τoct is the octahedral shear stress, and σm,2 is the mean normal stress acting on the failure plane. These are defined as follows:
τ o c t = 1 3 ( σ 1 σ 2 ) 2 + ( σ 2 σ 3 ) 2 + ( σ 1 σ 3 ) 2
σ m , 2 = σ 1 + σ 3 2
Mogi [57] analyzed the strength parameters of triaxial testing data, and found that they were fitted by a linear function:
τ o c t = a + b σ m , 2
where a and b are the Mogi strength parameters related to Coulomb shear strength parameters c and φ, as follows:
a = 2 2 3 c cos φ   and   b = 2 2 3 sin φ
Sometimes, the linear Mogi failure criterion is called the Mogi-Coulomb failure criterion [58].
In the traditional triaxial test for compressive strength, σ2 = σ3, (22) simplifies to:
2 3 ( σ 1 σ 3 ) = a + b ( σ 1 + σ 3 ) 2
Considering the effect of pore gas, combined with the effective stress principle, σ′i = σi − αp, the modified linear Mogi criterion can be expressed by:
2 3 ( σ 1 σ 3 ) = a b α p + b ( σ 1 + σ 3 ) 2

3.6. Non-Linear Mogi Failure Criterion

The relation of the octahedral shear stress and the mean normal stress can be expressed by a power function as follows:
τ o c t = a σ m , 2 b
Specifically, in the traditional triaxial test for compressive strength, σ2 = σ3, (26) reduces to:
2 3 ( σ 1 σ 3 ) = a [ ( σ 1 + σ 3 ) 2 ] b
Taking the effective stress principle into consideration, σ′i = σi − αp, the modified non-linear Mogi criterion can be expressed by:
2 3 ( σ 1 σ 3 ) = a [ ( σ 1 + σ 3 ) 2 α p ] b

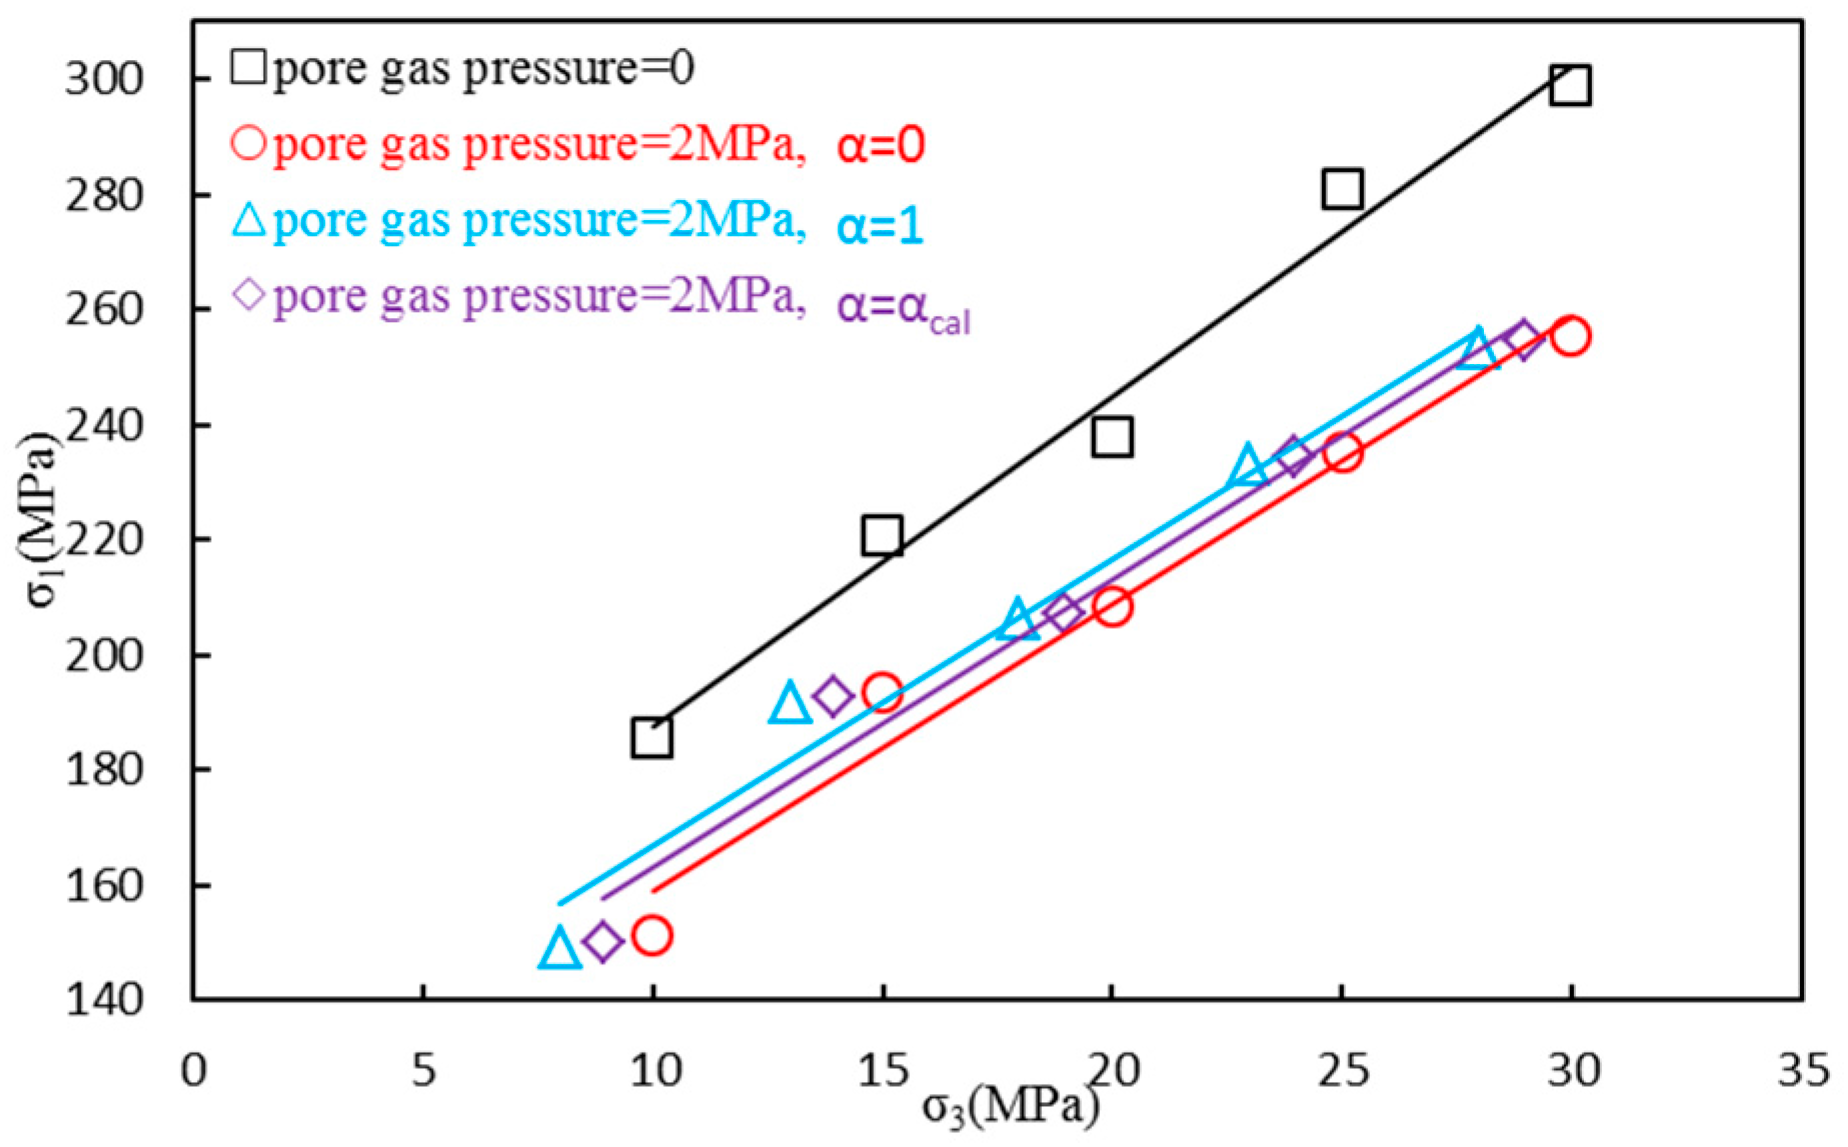
4. Experimental Failure Data Fitting

Under triaxial compression, rock failure will be a function of the three effective principal stresses. The effective principal stresses of gas-infiltrated sandy shale samples should be expressed by the effective stress coefficient. In this study, triaxial compression strength data of gas-infiltrated sandy shale were collected under 0 and 2 MPa gas pressure conditions, and the effective stress coefficient was analyzed using three values (α = 0, α = 1, and α = αcal). Figure 9, Figure 10, Figure 11, Figure 12 and Figure 13 show the measured strength data and curves fitted using all five of the previously introduced failure criteria. It showed that the values of fit coefficient R2 are higher than 0.97 for all the data. In addition, the R2 values for the gas-infiltrated sandy shale found using different effective stress coefficients were very close. Therefore, it was necessary to propose an error index to determine the difference between the measured strength values and strength values predicted by the failure criteria.
In this study, the root mean squared error (RMSE) was calculated as follows:
R M S E = 1 n j = 1 n ( σ 1 , j t e s t σ 1 , j c a l ) 2
where n is the number of strength data points per series, and j is the indices of the strength data points per series. σ 1 , j t e s t is the failure strength value from the laboratory test for data point j, and σ 1 , j c a l is the calculated value predicted by the failure criterion.
The cohesion (c) and internal friction angle (φ) were predicted by combining the fitted curves with the failure strength parameter. Combined with these parameters, the estimated data fits would be reliable. Accordingly, the values of RMSE, c, and φ were calculated as listed in Table 2.
Figure 9 shows the measured strength data and the curves fitted using the MC failure criterion. It can be seen that this criterion shows the highest error values. In the comparison of the gas pressures of 0 and 2 MPa, the c and φ values of the former are 27.2 and 44.65, and those of the latter are 25.33 and 41.77 (corresponding to α = αcal), respectively. Obviously, the strength parameters of the former are higher than those of the latter. Consequently, this evidently demonstrates that rocks would present a decreasing trend when taking the effect of pore gas into consideration. In addition, the c and φ values for α = 0 are 26.16 and 41.79, and those for α = 1 are 26.16 and 41.79, respectively. These results indicate that the c value increased with an increase in the effective stress coefficient, and the coefficient ranged from 0 to 1. However, the φ value shows almost no change.
The measured strength data and curves fitted by the HB failure criterion are depicted in Figure 10. It clearly shows that the predicted strength data appears to be a good fit. However, the s values for the zero gas pressure and gas infiltration (α = 1, αcal) are all greater than one. The s value is lower than one when α = 0. The results imply that the HB failure criterion shows the distortion. From the above discussion, the conclusion can be reached that precisely predicting a gas-infiltrated rock failure using the HB failure criterion would be associated with an effective stress coefficient.
Figure 11 gives the measured strength data and curves fitted using the DP failure criterion. The results indicate that the DP criterion appears to have the worst fitting solutions, except for the MC criterion, based on the RMSE values. In addition, the predicted strength data of the two criteria are very close. On the other hand, the c values for the zero gas pressure and gas infiltration (α = 0, 1, αcal) are 36.29, 34.42, 31.98, and 33.31, corresponding to φ values of 34.06, 31.47, 31.47, and 31.43, respectively. A comparison of the c and φ values of the MC criterion and DP criterion shows that the estimated c values with the MC criterion are lower than those with the DP criterion. In contrast, the φ values with MC are higher than those with DP. Based on the obtained results, it seems that neither the MC criterion nor DP criterion fits the data well.
The measured strength data and curves fitted by the linear Mogi failure criterion are illustrated in Figure 12. As listed in Table 2, the RMSE, c, and φ values for the linear Mogi criterion are similar to those for the MC criterion. In like manner, the linear Mogi criterion is not a good fit.
Figure 13 provides the measured strength data and curves fitted using the non-linear Mogi failure criterion. Generally, it leads to the most accurate strength for shale under two gas pressure conditions. Although the non-linear Mogi criterion shows RMSE values that are 0.1 higher than those of the HB criterion under a zero gas pressure condition, in the case of the 2 MPa gas pressure, the former gives errors that are 0.57 lower for α = 0, and maintains the same values for α = 1. In particular, it has errors that are 0.52 lower for α = αcal. Ultimately, it should be noted that the non-linear criterion can provide more accurate predictions than the linear criterion.

5. Summary and Conclusions

In this study, triaxial compression tests of gas-infiltrated sandy shale samples were carried out to investigate the strength behaviour under 0 and 2 MPa gas pressure conditions. The results showed that pore methane has a certain influence on the decrease of rock strength. Taking the gas and solid coupling effect into consideration, the effective stress coefficient was evaluated, and it was found that the values decreased with increasing confining pressure. Further, the calculated coefficient and different assumed coefficient values (α = 0 and α = 1) were applied to obtain the effective principal stress. The experimental research results would serve as fundamental strength data for fitting analysis in failure criterion work.
The Mohr-Coulomb, Hoek-Brown, Drucker-Prager, linear Mogi, and non-linear Mogi criteria were modified based on the effective stress principle of porous rock. Moreover, the RMSE, cohesion, and internal friction angle were utilized for the purpose of quantitatively comparing the criteria. The results showed that the Mohr-Coulomb, Drucker-Prager, and linear Mogi failure criteria led to higher error. The Hoek-Brown criterion gave a distortion as a result of the empirical strength parameters. The non-linear Mogi criterion showed a good fit. On the other hand, with regard to the different effective stress coefficients, the predicted strength was overestimated when α = 0 and underestimated when α = 1, but a more accurate strength could be obtained when the effective stress coefficient was calculated using the effective stress principle.
It should be noted that this research only investigated gas-infiltrated sandy shale samples under 0 and 2 MPa pore gas pressure conditions. Additional gas pressure conditions and different kinds of rock types should be taken into consideration in the future. It is important to point out that the strength of the gas-infiltrated rock was evaluated using a failure criterion based on the effective stress principle. Furthermore, this subject requires more thorough research in the future.

Acknowledgments

This study was financially supported by National Natural Science Foundation of China (51434003, 51374256), the Fundamental Research Funds for the Central Universities (106112015CDJRC241201), Research Foundation of State Key Laboratory of Coal Mine Disaster Dynamics and Control (No. 2011DA105287-MS201405) and Fundamental and Advanced Research Projects of Chongqing (cstc2015jcyjA90009).

Author Contributions

Wenpu Li and Dongming Zhang conceived and designed the experiments; Minghui Li performed the experiments; Wenpu Li and Minghui Li analyzed the data; and Wenpu Li wrote the paper.

Conflicts of Interest

The authors declare no conflict of interest.

References

  1. Boyer, C.; Kieschnick, J.; Suarez-Rivera, R.; Lewis, R.E.; Waters, G. Producing gas from its source. Oilfield Rev. 2006, 18, 36–49. [Google Scholar]
  2. Lal, M. Shale stability: Drilling fluid interaction and shale strength. In Proceedings of the SPE Asia Pacific Oil and Gas Conference and Exhibition, Jakarta, Indonesia, 20–22 April 1999.
  3. Curtis, J.B. Fractured shale-gas systems. AAPG Bull. 2002, 86, 1921–1938. [Google Scholar]
  4. Tutuncu, A.N.; Mese, A.I. Relationship between permeability, acoustic, mechanical and strength anisotropies in unconventional reservoirs and seal shales. In Proceedings of the 45th U.S. Rock Mechanics/Geomechanics Symposium, San Francisco, CA, USA, 26–29 June 2011.
  5. Sone, H.; Zoback, M.D. Strength, creep and frictional properties of gas shale reservoir rocks. In Proceedings of the 44th US Rock Mechanics Symposium and 5th U.S.-Canada Rock Mechanics Symposium, Salt Lake City, UT, USA, 27–30 June 2010.
  6. AL-Bazali, T. The impact of water content and ionic diffusion on the uniaxial compressive strength of shale. Egypt. J. Pet. 2013, 22, 249–260. [Google Scholar] [CrossRef]
  7. Gale, J.F.W.; Reed, R.M.; Holder, J. Natural fractures in the Barnett Shale and their importance for hydraulic fracture treatments. AAPG Bull. 2007, 91, 603–622. [Google Scholar] [CrossRef]
  8. Ulusay, R.; Hudson, J.A. Suggested methods for rock failure criteria: General introduction. Rock Mech. Rock Eng. 2012, 45, 971. [Google Scholar] [CrossRef]
  9. Benz, T.; Schwab, R. A quantitative comparison of six rock failure criteria. Int. J. Rock Mech. Min. Sci. 2008, 42, 1176–1186. [Google Scholar] [CrossRef]
  10. Zhao, J. Applicability of Mohr-Coulomb and Hoek-Brown strength criteria to the dynamic strength of brittle rock. Int. J. Rock Mech. Min. Sci. 2000, 37, 1115–1121. [Google Scholar] [CrossRef]
  11. Ghazvinian, A.H.; Fathi, A.; Moradian, Z.A. Failure behavior of marlstone under triaxial compression. Int. J. Rock Mech. Min. Sci. 2008, 45, 807–814. [Google Scholar] [CrossRef]
  12. Jespersen, C.; MacLaughlin, M.; Hudyma, N. Strength, Deformation modulus and failure modes of cubic analog specimens representing macroporous rock. Int. J. Rock Mech. Min. Sci. 2010, 47, 1349–1356. [Google Scholar] [CrossRef]
  13. Rafiai, H. New empirical polyaxial criterion for rock strength. Int. J. Rock Mech. Min. Sci. 2011, 48, 922–931. [Google Scholar] [CrossRef]
  14. Peng, J.; Rong, G.; Cai, M.; Wang, X.J.; Zhou, C.B. An empirical failure criterion for intact rocks. Rock Mech. Rock Eng. 2014, 47, 347–356. [Google Scholar] [CrossRef]
  15. Singh, M.; Raj, A.; Singh, B. Modified Mohr-Coulomb criterion for non-linear triaxial and polyaxial strength of intact rocks. Int. J. Rock Mech. Min. Sci. 2011, 48, 546–555. [Google Scholar] [CrossRef]
  16. Singh, M.; Singh, B. A strength criterion based on critical state mechanics for intact rocks. Rock Mech. Rock Eng. 2005, 38, 243–248. [Google Scholar] [CrossRef]
  17. Singh, M.; Singh, B. Modified Mohr-Coulomb criterion for non-linear triaxial and polyaxial strength of jointed rocks. Int. J. Rock Mech. Min. Sci. 2012, 51, 43–52. [Google Scholar] [CrossRef]
  18. Priest, S. Three-dimensional failure criteria based on the Hoek-Brown criterion. Rock Mech. Rock Eng. 2012, 45, 989–993. [Google Scholar] [CrossRef]
  19. Zhang, L.; Zhu, H. Three-dimensional Hoek-Brown strength criterion for rocks. J. Geotech. Geoenviron. Eng. ASCE 2007, 133, 1128–1135. [Google Scholar] [CrossRef]
  20. Pan, X.D.; Hudson, J.A. A simplified three-dimensional Hoek-Brown yield criterion. In Rock Mechanics and Power Plants; Romana, M., Ed.; Balkema: Rotterdam, The Netherlands, 1988; pp. 95–103. [Google Scholar]
  21. Priest, S.D. Comparisons between selected three-dimensional yield criteria applied to rock. Rock Mech. Rock Eng. 2009, 43, 379–389. [Google Scholar] [CrossRef]
  22. Priest, S.D. Determination of shear strength and three-dimensional yield strength for the Hoek-Brown criterion. Rock Mech. Rock Eng. 2005, 38, 299–327. [Google Scholar] [CrossRef]
  23. You, M.Q. True-triaxial strength criteria for rock. Int. J. Rock Mech. Min. Sci. 2009, 46, 115–127. [Google Scholar] [CrossRef]
  24. Haimson, B.; Chang, C. A new true triaxial cell for testing mechanical properties of rock, and its use to determine rock strength and deformability of Westerly granite. Int. J. Rock Mech. Min. Sci. 2000, 37, 285–296. [Google Scholar] [CrossRef]
  25. Chang, C.; Haimson, B. True triaxial strength and deformability of the German Continental Deep Drilling Program (KTB) deep hole amphibolite. J. Geophys. Res. 2000, 105, 18999–19013. [Google Scholar] [CrossRef]
  26. Arora, S.; Mishra, B. Investigation of the failure mode of shale rocks in biaxial and triaxial compression tests. Int. J. Rock Mech. Min. Sci. 2015, 79, 109–123. [Google Scholar] [CrossRef]
  27. Chen, Q.; Nezhad, M.M.; Fisher, Q.; Zhu, H.H. Multi-scale approach for modeling the transversely isotropic elastic properties of shale considering multi-inclusions and interfacial transition zone. Int. J. Rock Mech. Min. Sci. 2016, 84, 95–104. [Google Scholar] [CrossRef]
  28. Nezhad, M.M.; Zhu, H.H.; Woody, J.; Chen, Q. A simplified multiscale damage model for the transversely isotropic shale rocks under tensile loading. Int. J. Damage Mech. 2016, 25, 705–726. [Google Scholar] [CrossRef]
  29. Murphy, M.M. Shale failure mechanics and intervention measures in underground coal mines: Results from 50 years of ground control safety research. Rock Mech. Rock Eng. 2016, 49, 661–671. [Google Scholar] [CrossRef] [PubMed]
  30. Morgan, S.P.; Einstein, H.H. The effect of bedding plane orientation on crack propagation and coalescence in shale. In Proceedings of the 48th US Rock Mechanics/Geomechanics Symposium, Minneapolis, MN, USA, 1–4 June 2014.
  31. Saroglou, H.; Tsiambaos, G. A modified Hoek-Brown failure criterion for anisotropic intact rock. Int. J. Rock Mech. Min. Sci. 2008, 45, 223–234. [Google Scholar] [CrossRef]
  32. Singh, M.; Samadhiya, N.K.; Kumar, A.; Kumar, V.; Singh, B. A nonlinear criterion for triaxial strength of inherently anisotropic rocks. Rock Mech. Rock Eng. 2015, 48, 1387–1405. [Google Scholar] [CrossRef]
  33. Yin, G.Z.; Jiang, C.B.; Wang, J.G.; Xu, J. Combined effect of stress, pore pressure and temperature on methane permeability in anthracite coal: An experimental study. Transp. Porous Media 2013, 100, 1–16. [Google Scholar] [CrossRef]
  34. Yin, G.Z.; Li, M.H.; Wang, J.G.; Xu, J.; Li, W.P. Mechanical behavior and permeability evolution of gas infiltrated coals during protective layer mining. Int. J. Rock Mech. Min. Sci. 2015, 80, 292–301. [Google Scholar] [CrossRef]
  35. Liu, J.H.; Zhu, X.Y.; Wang, S.L.; Wei, J.S. Geologic-tectonic evolutional characteristics and prospecting potential for ISL-amenable sandstone type uranium deposits in Sichuan basin. Uranium Geol. 2005, 21, 321–330. [Google Scholar]
  36. Yang, F.; Ning, Z.F.; Zhang, R.; Zhao, H.W.; Krooss, B.M. Investigations on the methane sorption capacity of marine shales from Sichuan Basin, China. Int. J. Coal Geol. 2015, 146, 104–117. [Google Scholar] [CrossRef]
  37. Liu, S.G.; Ma, W.X.; Luba, J.; Huang, W.M.; Zeng, X.L.; Zhang, C.J. Characteristics of the shale gas reservoir rocks in the Lower Silurian Longmaxi Formation, East Sichuan basin, China. Acta Petrol. Sin. 2011, 27, 2239–2252. [Google Scholar] [CrossRef]
  38. Haimson, B.; Bobet, A. Introduction to suggested methods for failure criteria. Rock Mech. Rock Eng. 2012, 45, 973–974. [Google Scholar] [CrossRef]
  39. Ghabezloo, S.; Sulem, J.; Guédon, S.; Martineau, F. Effective stress law for the permeability of a limestone. Int. J. Rock Mech. Min. Sci. 2009, 46, 297–306. [Google Scholar] [CrossRef] [Green Version]
  40. Terzaghi, K. Erdbaumechanik auf Bodenphysikalischer Grundlage; Deuticke: Leipzig, Germany, 1925. [Google Scholar]
  41. Biot, M.A. General theory of three-dimensional consolidation. J. Appl. Phys. 1941, 12, 155–164. [Google Scholar] [CrossRef]
  42. Wang, J.G.; Liu, J.S.; Kabir, A. Combined effects of directional compaction, non-Darcy flow and anisotropic swelling on coal seam gas extraction. Int. J. Coal Geol. 2013, 109–110, 1–14. [Google Scholar] [CrossRef]
  43. Geertsma, J. The effect of fluid pressure decline on volumetric changes of porous rocks. Trans. AIME 1957, 210, 331–340. [Google Scholar]
  44. Zhang, K.; Zhou, H.; Hu, D.W.; Zhao, Y.; Feng, X.T. Theoretical model of effective stress coefficient for rock/soil-like porous materials. Acta Mech. Solida Sin. 2009, 22, 251–260. [Google Scholar] [CrossRef]
  45. Walsh, J.B. Effect of pore pressure and confining pressure on fracture permeability. Int. J. Rock Mech. Min. Sci. Geomech. Abstr. 1981, 18, 429–435. [Google Scholar] [CrossRef]
  46. Kranzz, R.L.; Frankel, A.D.; Engelder, T.; Scholz, C.H. The permeability of whole and jointed barre granite. Int. J. Rock Mech. Min. Sci. Geomech. Abstr. 1979, 16, 225–234. [Google Scholar] [CrossRef]
  47. George, J.D.S.; Barakat, M.A. The change in effective stress associated with shrinkage from gas desorption in coal. Int. J. Coal Geol. 2001, 45, 105–113. [Google Scholar] [CrossRef]
  48. Nur, A.; Byerlee, J.D. An exact effective stress law for elastic deformation of rock with fluids. J. Geophys. Res. 1971, 76, 6414–6419. [Google Scholar] [CrossRef]
  49. Hu, D.W.; Zhou, H.; Zhang, F.; Shao, J.F. Evolution of poroelastic properties and permeability in damaged sandstone. Int. J. Rock Mech. Min. Sci. 2010, 47, 962–973. [Google Scholar] [CrossRef]
  50. Dassanayake, A.B.N.; Fujii, Y.; Fukuda, D.; Kodama, J.I. A new approach to evaluate effective stress coefficient for strength in Kimachi sandstone. J. Petrol. Sci. Eng. 2015, 131, 70–79. [Google Scholar] [CrossRef]
  51. Labuz, J.F.; Zang, A. Mohr-Coulomb failure criterion. Rock Mech. Rock Eng. 2012, 45, 975–979. [Google Scholar] [CrossRef]
  52. Hoek, E.; Brown, E.T. Underground Excavations in Rock; The Institution of Mining and Metallurgy: London, UK, 1980. [Google Scholar]
  53. Hoek, E.; Brown, E.T. The Hoek–Brown failure criterion—A 1988 update. In Proceedings of the 15th Canadian Rock Mechanics Symposium, Montreal, QC, Canada, 19–21 June 1996; Curran, J., Ed.; University of Toronto: Toronto, ON, Canada, 1988; pp. 31–38. [Google Scholar]
  54. Hoek, E. Strength of jointed rock masses, twenty-third Rankine lecture. Geotechnique 1983, 33, 187–223. [Google Scholar] [CrossRef]
  55. Hoek, E.; Kaiser, P.K.; Bawden, W.F. Support of Underground Excavations in Hard Rock; A.A. Balkema: Rotterdam, The Netherlands, 1995. [Google Scholar]
  56. Drucker, D.C.; Prager, W. Soil mechanics and plastic analysis or limit design. Q. Appl. Math. 1952, 10, 157–165. [Google Scholar]
  57. Mogi, K. Fracture and flow of rocks under high triaxial compression. J. Geophys. Res. 1971, 76, 1255–1269. [Google Scholar] [CrossRef]
  58. Al-Ajmi, A.M.; Zimmerman, R.W. Relation between the Mogi and the Coulomb failure criteria. Int. J. Rock Mech. Min. Sci. 2005, 42, 431–439. [Google Scholar] [CrossRef]
Figure 1. The scheme of experimental system [33,34]. 1—Lifter, 2—Pressure vessel, 3—Sensor of axial stress, 4—Oil tank, 5—Movable work platform, 6—Heater tubes, 7—Oil inlet valve, 8—Sensor of axial displacement, 9—Hydraulic cylinder of axial stress, 10—Force plate, 11—Gas inlet valve, 12—Gas outlet valve, 13—Air drain valve, 14—Hydraulic oil inlet and drain valve, 15—Circumferential extensometers, 16—Specimens.
Energies 09 00972 g001
Figure 2. Geological structure distribution of the Sichuan Basin and sampling location (★) in this study [37].
Energies 09 00972 g002
Figure 3. Shale samples used in tests.
Energies 09 00972 g003
Figure 4. CT images of the shale sample before and after the drying process. (a) Before drying; (b) after drying.
Energies 09 00972 g004
Figure 5. Stress-strain curves from triaxial compression tests under zero gas pressure condition.
Energies 09 00972 g005
Figure 6. Stress-strain curves from triaxial compression tests under 2 MPa gas pressure condition.
Energies 09 00972 g006
Figure 7. Schematic diagram of effect of pore methane on effective strength of gas-infiltrated shale.
Energies 09 00972 g007
Figure 8. Relationship between calculated effective stress coefficient and confining pressure.
Energies 09 00972 g008
Figure 9. Measured strength data and curves fitted using the Mohr-Coulomb criterion.
Energies 09 00972 g009
Figure 10. Measured strength data and curves fitted using the Hoek-Brown criterion.
Energies 09 00972 g010
Figure 11. Measured strength data and curves fitted using the Drucker-Prager criterion.
Energies 09 00972 g011
Figure 12. Measured strength data and curves fitted using the linear Mogi criterion.
Energies 09 00972 g012
Figure 13. Measured strength data and curves fitted using the non-linear Mogi criterion.
Energies 09 00972 g013
Table 1. Experimental strength parameters under gas pressures of 0 and 2 MPa.
Samples No.σ3/MPaPore Gas Pressure/MPaσ1–σ3/MPa
1100135.03
2150205.96
3200218.02
4250255.71
5300268.94
6102122.29
7152178.68
8202188.34
9252210.22
10302225.42
Table 2. Calculated values of five failure criteria (p stands for pore gas pressure).
ParametersConditionMCHBDPLinear MogiNon-Linear Mogi
RMSE/MPap = 019.6918.4719.4019.3718.57
p = 2, α = 016.9616.7416.8716.8816.17
p = 2, α = 112.8911.1812.7013.2511.18
p = 2, α = αcal12.7611.8112.4811.9311.29
c/MPap = 027.20-36.2926.71-
p = 2, α = 026.16-34.4225.41-
p = 2, α = 124.37-31.9823.59-
p = 2, α = αcal25.33-33.3124.58-
φ/°p = 044.65-34.0644.99-
p = 2, α = 041.79-31.4742.27-
p = 2, α = 141.79-31.4742.27-
p = 2, α = αcal41.77-31.4342.24-

