1. Introduction
As global warming becomes worse, scholars have started to explore ways to achieve low carbon economic growth [
1,
2]. In recent years, the decoupling method has gained more scholarly attention in the sustainable economy literature [
3,
4,
5]. The term decoupling has its root in Physics. It refers to the diminishing of the relationship between two or more interdependent variables [
6]. The concept was introduced by the Organization for Economic Cooperation and Development (OECD) to public policy, economic, and environmental research at the end of the 20th century [
7]. In the sustainable economy literature, decoupling refers to the reduction of a region’s carbon emissions without causing negative impact on the region’s economic growths. The decoupling literature has three limitations. First, decoupling is usually studied at the national or regional level, and there is a lack of research conducted at the industrial level [
4]. Caneghem et al. analyzed the decoupling of environmental effects and economic growth in the Flemish industrial sector from 1995 to 2006 [
8,
9]. Several international organizations including the EU and OECD have joined Sweden and a handful of other nations to adopt consumption-based research perspectives [
10]. Their findings suggest average consumption-based emissions are 11% higher than production emissions in the EU 27 [
11] and 16% higher among OECD countries. This lack of scholarly attention to industrial level phenomena has added difficulties to the attribution of the causes for pollution as scholars have limited means to determine the contribution of each industry to carbon emissions when such high level data are used. For example, the carbon emission contribution of the service industry is definitely much lesser than that of heavy industry and thus it would make little sense aggregate the data from these two industries to the national level during analyses. Second, scholars have tended to use the decoupling index method or the Tapio model when they are analyzing the relationship between carbon emission and economic growth. Zhang [
12] introduced the decoupling indexes of energy sources and environmental pressure, and decoupling was also divided into absolute decoupling and relative decoupling according to its effect. This method was also used by Freitas and Kaneko [
13] to study the relationship between carbon emissions and economic growth in England in 2004–2009, and then they pointed out that the relationship between carbon emissions and economic growth in 2009 was one of absolute decoupling. Climent and Pardo [
4] used the Taipo decoupling indicator to investigate the causal relationship between energy use and Spanish economic growth. Chiou-Wei et al. [
14] examined the relationship between energy consumption and economic growth using both linear and nonlinear Granger causality tests for a sample of Asian newly industrialized countries along with the US. Salim et al. (2008) examined the short-run and the long-run causal relationship between energy consumption and output in six non-OECD Asian developing countries. The limitation of these methods is that the results produced by such analyses provide limited information on the cause of the observed carbon emission—economic growth relationship. That is why, while we can know whether a region’s economy is decoupled from carbon emissions, we do not know much about the factors that have led to this fact. Third, scholars studying decoupling have tended to over-focus on historical data [
15]. A. Nicholas et al. examined the relationship between coal consumption and economic growth for 25 OECD countries within a multivariate panel framework over the 1980–2005 period. The decoupling index was used to examine the decoupling effect between carbon emissions and economic growth in Jiangsu Province (China) during 1995–2009, and it was found that carbon emissions and economic growth demonstrated an absolute decoupling effect in 1997 and 2001, no decoupling effect during 2003–2005, and a relative decoupling effect in the remaining periods [
16]. There has been a stable cross-sectional relationship between energy use per capita and per capita income with an elasticity of energy use with respect to income of less than unity over the last 40 years [
17]. A result of this approach is that while we are able to know what has happened, we do not know much about what we should do in the future. This has limited the empirical implications of the findings presented in the literature.
In view of the limitations of the decoupling literature, we aimed to make three contributions in this study. First, we aimed to demonstrate the advantages of conducting decoupling research on the industrial level. We propose that when decoupling research is conducted on the industrial level, we would be able to discern the factors that contribute to a region’s carbon emissions better than when we use more macro-level data, thus enabling us to formulate future carbon reduction policies with greater accuracy. Second, we aimed to make improvements on the Tapio method to contribute an analytical strategy that researchers can use to better understand the factors that contribute to an industry’s carbon emission. We introduced the decomposition method of the logarithmic mean Divisia index (LMDI) to the Tapio model to segregate the carbon emission of an industry into its contributing factors, and we used the decoupling effort index to calculate the magnitude of impact that each factor has on the decoupling index of an industry. Third, we aimed to adopt a more proactive approach toward decoupling studies by giving decoupling projection more focus. We based our decoupling forecast on the grey system theory, and we used the grey forecasting model to predict the trends of carbon emission and economic growth that we used in our calculations.
Towards these ends, we conducted our current research on the China’s equipment manufacturing industry. China has experienced many years of double digit economic growths at the expense of its environment [
18]. In 2008 it surpassed the United States to become the world largest carbon dioxide emitting country, and its carbon dioxide emissions had reached 9.21 billion tons in 2012 (accounting for 26.7% of global emissions) [
19]. To curb this negative trend, the Chinese government had announced their intention to cut the country’s carbon emission by 60%–65% by the year 2030 (down from its 2005 carbon emission) [
20]. In China, the equipment manufacturing industry is one of its biggest carbon dioxide emitting industry sectors. Hence, we chose the Chinese equipment manufacturing industry as the focus of our research because it is one of the most polluting industries in the biggest carbon dioxide-creating country.
In the following pages, we first review the literature to provide a brief overview of our research focuses. Then, we discuss our analytical strategy by presenting the equations that we use for the series of analyses that follow, and also the sources of our data. After presenting the results of our research, we end our paper with our recommendations for future research and policies.
The literature on decoupling mainly focuses on two issues: the calculation of decoupling standards to divide regions into different categories, and methodological issues regarding the estimation of decoupling standard.
First, many scholars studying decoupling effects have mainly focused their research efforts on the labeling of different regions and countries as entities that have done relatively well or worse in terms of decoupling their economic growth from adverse environmental impacts [
21,
22,
23]. For example, many Chinese scholars have merely analyzed the relationship between economic growth and carbon emissions, and concluded that China is in a state of weak decoupling [
24,
25,
26].
Second, many scholars tended to use traditional decoupling measures in their research. For example, Freitas [
13] used a region’s data on economic activity and carbon emissions to calculate its decoupling evolution and decoupling status, and Mohamed Amine Boutabba [
27] studied the relationship between carbon emissions, economic growth and energy consumption using the Granger causality method. One common characteristic of such studies is that the authors tend to use economic growth and decoupling standard models to calculate the evolution of the relationship between the two factors [
28].
In recent years, some scholars have tried to innovate in their analytical strategy, however, they have mainly focused their efforts in refining the processes which they use to classify a region’s decoupling status, and they tend to not go beyond the decoupling classification standard that they propose. For example, Lu Wang and Yue [
29] used the IGT and IeGTX methods to analyze the relationship between SO
2 emission and decoupling index, and they proposed that regional decoupling effect can be classified into three categories: absolutely decoupled, relatively decouples, and non-decoupled.
The main problem of these approaches that scholars adopt is that they tend to over-focus on the “big picture”, neglecting the fact that these data were aggregated from industrial data, which in turn were aggregated from the specific factors of production. Although we can know from the results of such studies whether a region has an acceptable level of decoupling standard, we do not know much about the factors that contribute to the figures that we see. The use of such high level data has not only over-simplified the study of the contributing factors of a region’s decoupling effect, it has also limited the capacity of the researcher to zero-in to “culprits” that have caused a region to exhibit a poor decoupling index in order to design policies that could effectively improve the region’s decoupling index.
Evidences from recent studies indicate that the prevailing analytical strategy that is adopted by many researchers may be problematic. For example, Bithas and Kalimeris [
30] recently re-estimated the energy-economic growth decoupling effect of the world by including global data on the physiology and dimensionality of economic goods. They found that the results of their research were worse than those in the literature calculated based on the traditional approach that uses energy/GDP ratio. Csereklyei and Stern [
17] studied global energy consumption by using the evolution of energy use approach instead of the traditional pollution emission approach. In view of these limitations of the literature, we pose the following research question: What are the factors that influence a region’s decoupling standard?
4. Empirical Analysis of Decoupling Effect of Industries’ Carbon Emissions Measure
4.1. Decoupling of Carbon Emissions Measure
Utilizing Equations (2) and (3), we divided the annual statistics of China’s equipment manufacturing industry into different levels of decoupling (see
Table 3). We observe an annual decline in the decoupling elasticity for 2005–2008. The economy was growing, but at the same time, energy carbon emissions were also increasing at a rate lower than GDP growth. This improvement in the industry’s energy efficiency might be due to the implementation of public policies such as the “Opinions of the State Council on Accelerating the Development of the Equipment Manufacturing Industry”, which provided financial support to business owners in the industry.
On the other hand, expansionary negative decoupling was observed in the data for 2008–2009. A potential explanation for this observation is the adverse impact on the industry caused by the 2007 global financial crisis. To alleviate the situation, the Chinese government implemented market expanding policies to increase the demand for the industry’s products. The public intervention turned out to be effective, and the decoupling condition improved to become weak decoupling in 2009–2010, and it further improved to become strong decoupling in 2011–2014.
To have a clearer view on the contributing factors to the observations made above, we further divided our industrial data into its seven-component industries (see
Table 4). The terms
,
,
,
,
,
,
refer to the decoupling elasticity indexes of metal manufacturing, general equipment manufacturing, professional equipment manufacturing, transportation equipment manufacturing, electric machinery and equipment manufacturing, electronic and communication equipment manufacturing, and instrument and office appliance manufacturing, respectively.
Based on the decoupling elasticity indexes calculated, we divided the seven sub-industries into its respective decoupling state categories (see
Table 5). The decoupling states are divided based on
Table 1 (the eight different state of decoupling according to Tapio).
In general, the decoupling state of carbon emissions and GDP in the metal manufacturing industry was steady during 2000–2014. The decoupling effect was weak during 2000–2001, and it improved to become strong decoupling during 2002–2003, indicating effective attempts in cutting carbon emissions. However, the decoupling state deteriorated to weak decoupling during 2003–2009, indicating that the industry’s energy consumption growth has outpaced its GDP growth. The decoupling state then improved to become strong decoupling again from 2009–2011.
On the other hand, the decoupling state of the general equipment industry is not stable during 2000–2014. In 2000, the decoupling state of the industry was weak. It then becomes strong decoupling in 2003, weak decoupling in 2004, and then expansionary negative decoupling in 2005. In other words, the growth rate of the industry’s energy carbon emission was faster than its GDP growth rate, indicating that its energy utilization efficiency is becoming worse over the years. However, the industry’s decoupling state improved to strong decoupling during 2011–2014. A potential explanation to this finding is the government had implemented industrial adjustment policies and carbon emission reduction policies during this period of time, and the improvements observed might be a result of public policy compliance. Analysis of the data on the professional equipment manufacturing industry indicates that it had strong decoupling during 2000–2002. However, it deteriorated to weak decoupling during 2002–2003, which then improved to growing link in 2003–2004, indicating that the growing economic growth was achieved with large amount of energy consumption and pollution. The industry’s decoupling state then improved to strong decoupling until 2008. The global financial crisis had taken its toll on the market demand for the industry, and caused the decoupling state of the industry to reduce to weak decoupling. That is, the decoupling state of the professional equipment manufacturing industry had phased characteristics.
The decoupling state of the transportation equipment manufacturing industry was stable from 2000–2014. It improved from weak decoupling during 2000–2001 to become strong decoupling in 2010–2014. The improvement can be attributed to the benefits brought upon by technological advances experienced by the industry over the years, and also the structural changes caused by the government’s industrial policies.
The decoupling state of the electric machinery and equipment manufacturing industry was unstable. It alternated between weak decoupling and strong decoupling over the years, indicating that the industry’s energy carbon emission growth rate was higher than its GDP growth rate.
The decoupling state of the electronic and communication equipment manufacturing industry experienced significant fluctuations over the years. During 2000–2002, the industry’s development created strong pressures on its carbon emissions. However, as the Chinese government increased their financial support on the industry’s development over the years, the decoupling state of the industry had improved since 2004 as indicated by its lower level of carbon emission per unit GDP. Nevertheless, the decoupling state of the industry was not very stable, and it alternated between strong decoupling and weak decoupling.
The decoupling state of the instrument and office appliance manufacturing industry was relatively stable during 2000–2014, and its decoupling elastic index was decreasing annually. The industry had strong decoupling in 2003–2005 and 2010–2012, and it had weak decoupling for the other years. The industry had achieved rapid GDP growth with reduced total energy consumption. This indicates the industry was performing well in terms of carbon emission reduction.
4.2. Factor-Separating of Carbon Emission Decoupling
In 1997, Ang and Choi put forward a refined Divisia index method using logarithmic mean weight functions, which could settle well the residual and “zero value” problems and satisfy other conditions of “perfect decomposition approaches” simultaneously. This method as the early decomposition form of LMDI [
33]. Then Ang et al. extended the above approach which was based on decomposition of an aggregate index, and proposed another refined Divisa index method based on logarithmic mean weight functions and decomposition of a different quantity in 1998 [
34]. The appellations LMDI I and LMDI II first appeared in 2001, when Ang and Liu presented a new energy decomposition method, called the LogMean Divisia Index Method I (LMDI I) [
35]. The logarithmic mean Divisia index (LMDI) method has the desirable properties of perfect decomposition and is consistent in aggregation. The method is a widely accepted analytic tool to identify the relative impacts of different factors [
36,
37,
38]. There are the logarithmic terms in the LMDI formula, complications arise when the data set contains zero values. We used the method of Divisia index to analyze the carbon emission of the equipment manufacturing into energy efficiency, industry structure, the level of economic development and labor of equipment manufacturing industry. From the perspective of economy, the equation to calculate the energy consumption of carbon emissions should be:
where
i = 1, 2,…5, (
i represents energy, respectively the raw coal, coke, gasoline, diesel and natural gas);
Ci = carbon emissions;
E = energy consumption of equipment manufacturing;
P = the average number of labor of equipment manufacturing industry;
Ai =
Ci/
E represents energy consumption structure, that is, carbon intensity of energy structure;
I =
E/
GDP represents energy intensity of GDP;
M =
GDP/
P represents regional GDP per capita.
Equation (4) can be expressed as product of four factors (effect of energy structure, energy intensity effect, economic output effect and population scale effect), and the change of carbon emission of energy consumption depending on the four factors. Using the LMDI method, the model can be written as:
Where ΔCA = carbon intensity of energy structure; ΔCI = energy intensity of GDP; ΔCM = regional GDP per capita; ΔCP = population scale; ΔCϕ = decomposition allowance.
By decomposition and natural logging Equation (4), we obtained:
When both sides of Equation (6) are divided by
C, we obtain:
By definite integration of Equation (7), we obtain:
, (8) can be expressed in the following function:
Therefore, carbon emissions can be expressed as:
Substituting into the decoupling model of carbon emissions and economic growth, we obtain:
Based on Equation (12), we observe that the decoupling elasticity index of carbon emissions and economic growth of equipment manufacturing
can be decomposed into the energy structure decoupling elasticity, energy intensity decoupling elasticity, economic output decoupling elasticity and population of the region, indicated by
,
,
,
. According to the Equation (12), we obtained the results shown in
Table 6 using the data of 2000–2014.
Based on
Table 6, we see the variation of carbon emissions of equipment manufacturing industry is greatly influenced by the energy consumption intensity and economic output. This means the rigid demand of energy growth in the equipment manufacturing industry is great, and the economic growth of the equipment manufacturing is achieved at the expense of the environment. In general, economic output is the biggest cause of carbon emissions in the equipment manufacturing industry of China.
has negative and greatest impact on the carbon emissions of equipment manufacturing in 2014 [carbon emissions = 3782.27 (104 t)]. It means that energy efficiency will be improved, and this is beneficial to carbon emissions reduction. Compared with and , carbon emissions are less affected by factors of energy structure and population. Because the equipment manufacturing industry in China is greatly affected by the external economy, the consumption structure is simple, and the major consumption of energy is coal and oil.
Based on
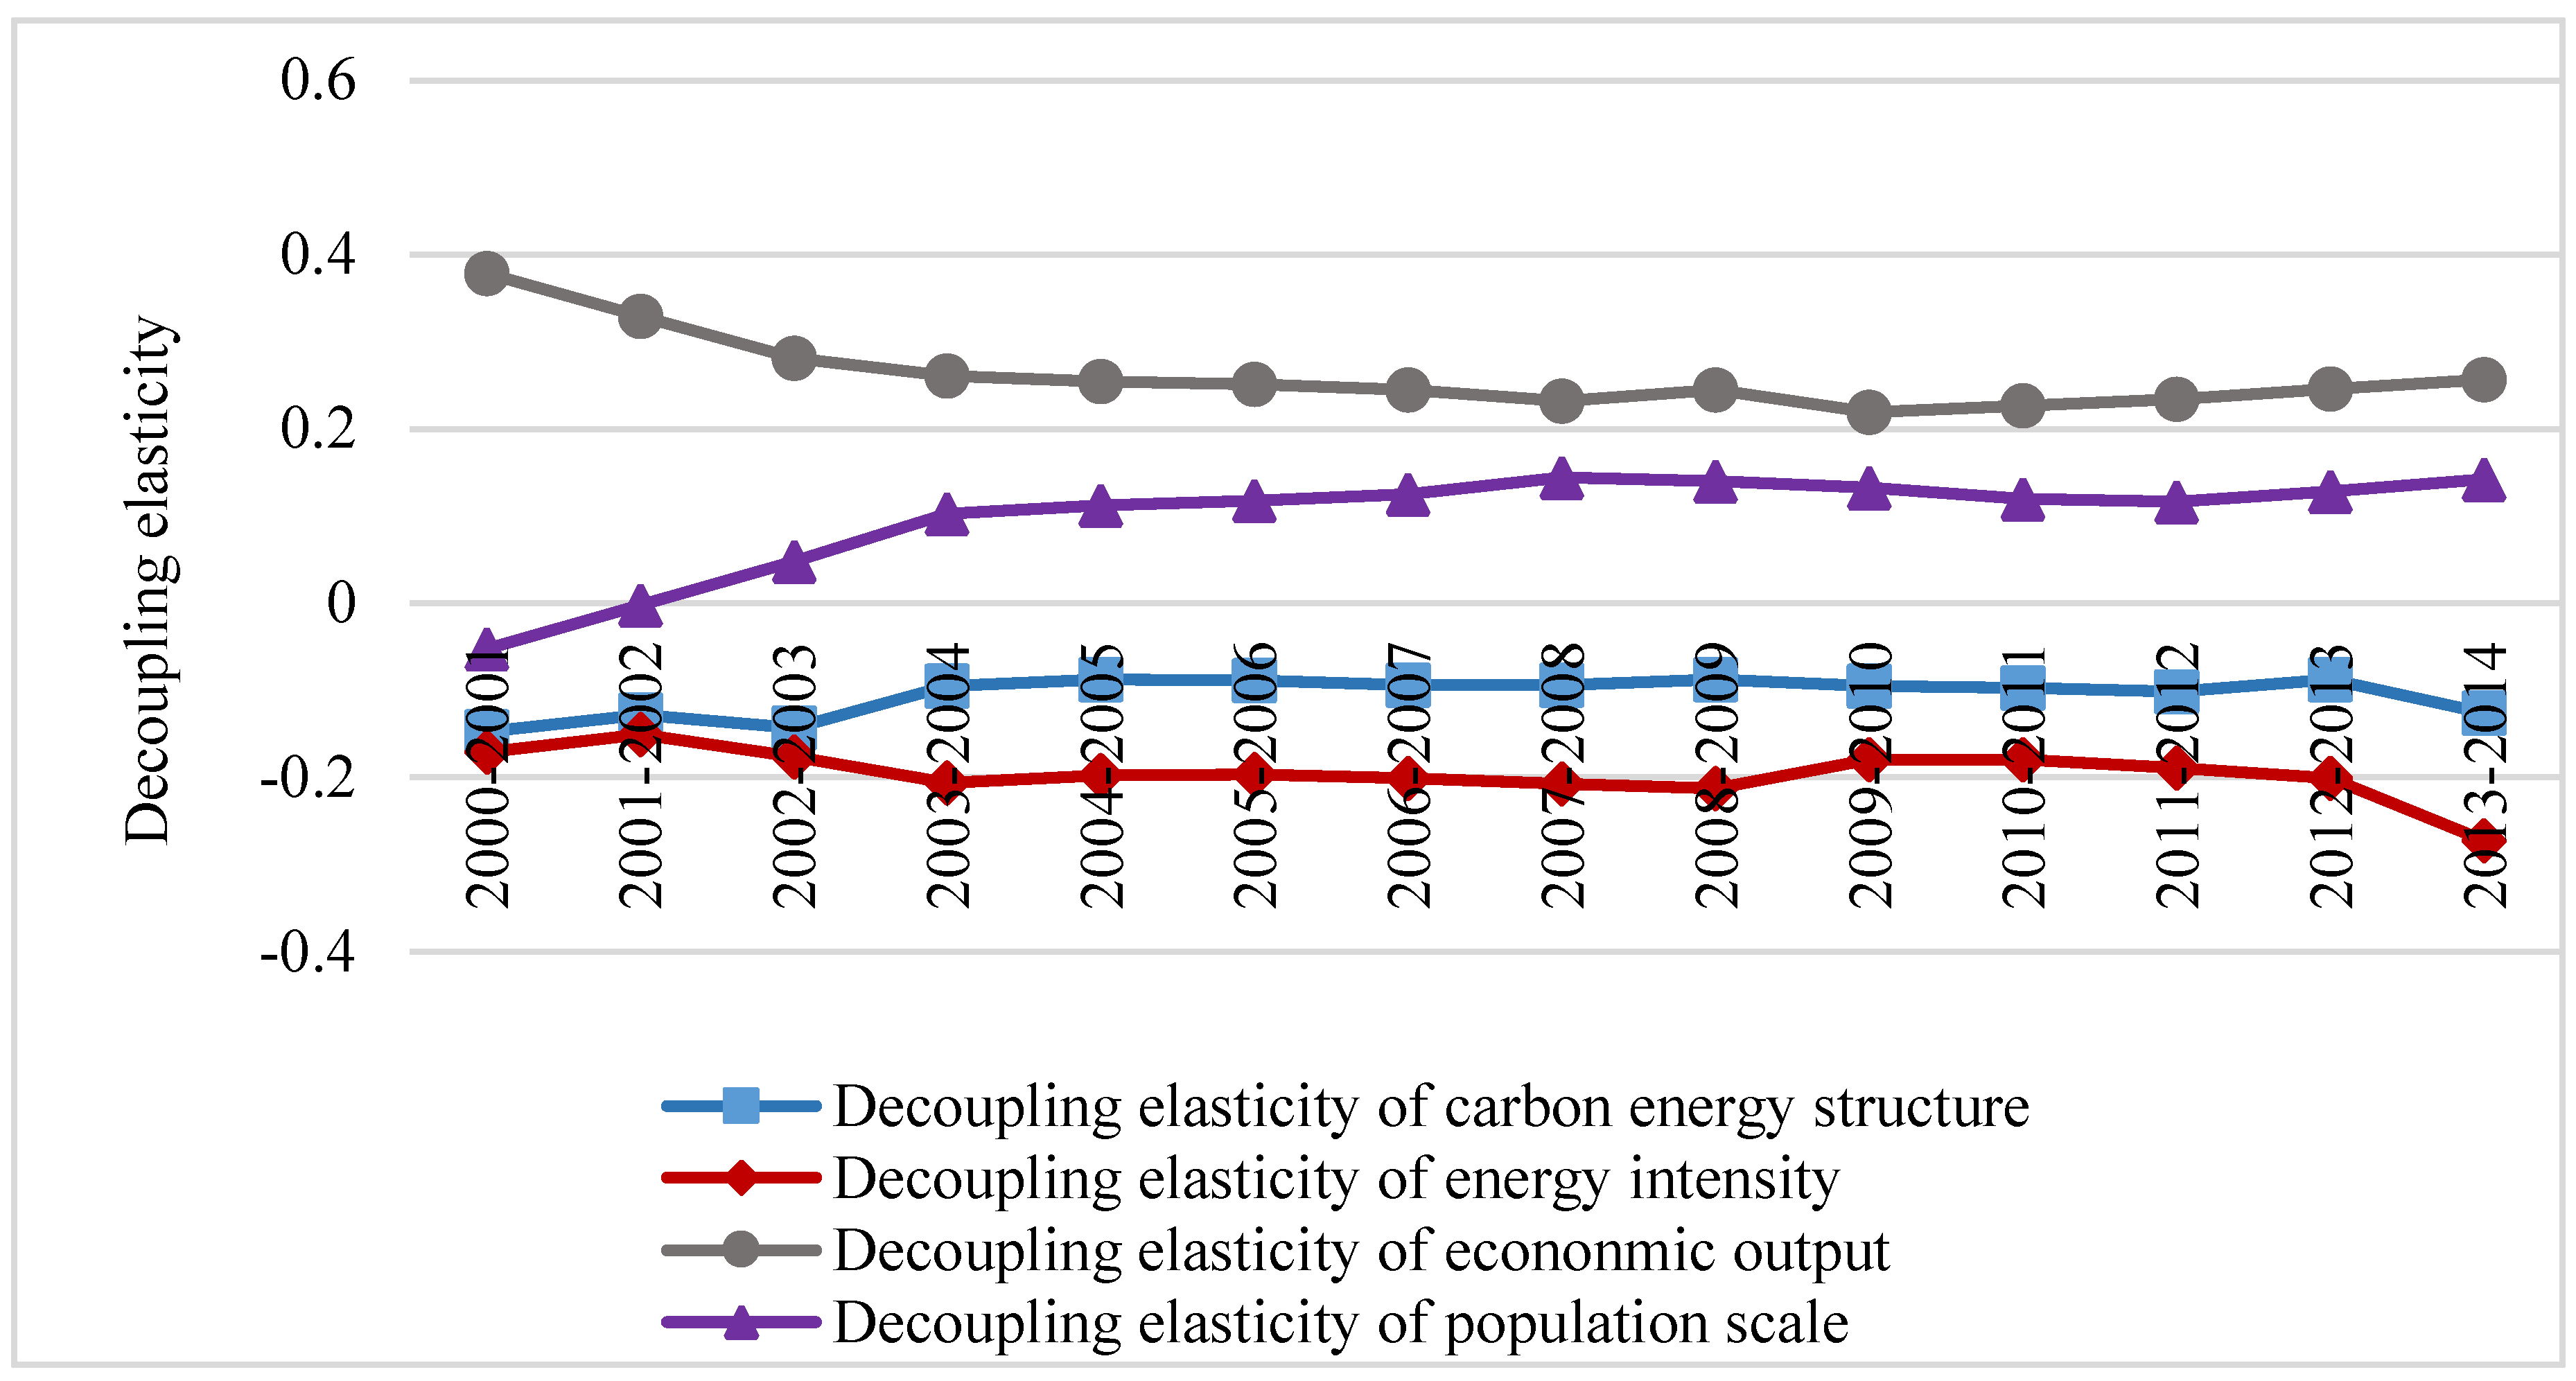
Figure 1, we derived the following conclusions:
- (1)
The decoupling elasticity coefficients of carbon energy structure were negative and have strong decoupling. Before 2006, the absolute values of carbon energy structure were reduced annually, and the absolute value was on the increasing trend after 2006. This is because of the economic policies implemented by the Chinese government to adjust the industry’s structure in order to stimulate economic growth rapidly. Therefore, the absolute values of elastic index of carbon energy structure were increased, but then declined until 2013.
- (2)
The decoupling elasticity coefficients of economic output were in weak decoupling state, and had positive an effect on the increase in total carbon emissions during 2000–2014. In general, other than 2008, the decoupling elasticity coefficients of economic output were decreasing. The reason is that it was affected by the financial crisis in 2008, the growth rate of GDP was falling, equipment manufacturing enterprises suffered badly and the energy consumption growth was reduced.
- (3)
Energy intensity was in the strong decoupling state. Energy consumption intensity was negative and the varied range of decoupling elasticity coefficients of energy intensity fluctuated between 0.15 and 0.21. It can be seen that the energy efficiency of equipment manufacturing was higher. Therefore, when carbon emissions of equipment manufacturing was reduced to a certain extent, the impact was not great for decoupling of carbon emission and GDP by reducing per capita of GDP. This can only be achieved by reducing energy intensity, and the decrease of energy intensity relied on the Chinese government implements policies such as developing low carbon energy and adjusting the industrial structure.
- (4)
The decoupling elasticity coefficients of population scale present strong decoupling during 2000–2002. They were in a weak decoupling state during the 2002–2003 period, and the decoupling indexes were increasing annually. The maximum decoupling index was 0.1438 in 2008. The reduced decoupling elasticity coefficients of population scale, were achieved only by improving the quality of equipment manufacturing employees and greatly enhancing the employees’ productivity, in order to reduce carbon emissions by increasing output per worker. In total, the sharp increase of population size plays a much smaller role in the carbon emissions.
4.3. Carbon Emissions Decoupling-Effort
The objective of decoupling-effort is to reduce carbon emissions by the government policies and measures to adjust the industrial structure, improving energy efficiency. We can break down the antecedents of carbon emissions (Δ
C) into the effect of energy structure (Δ
CA), energy intensity effect (Δ
CI), the effect of economic output (Δ
CM), and the effect of population scale (Δ
CP). We set value of decoupling-effort is
, the equation can be expressed in the following function:
If the set index of decoupling-effort is
λ, which represents the degree of decoupling-effort during 0–
t, we obtain:
As shown in
Table 6, when the economic output was more than 0, we obtain:
Inserting the data of equipment manufacturing period of 2000–2014 into Equation (15), we can get results shown in
Table 7.
Based on
Table 7, the values of decoupling-effort were negative in equipment manufacturing during 2000–2014, and the indexes of decoupling-effort were less than 1, indicating that it was in a state of weak decoupling. This indicates that the equipment manufacturing had high consumption and carbon emissions, and heavy industry is preferred in China. As the pressure of economic growth can cause more carbon emissions, the other three indicators were negative. The energy intensity effect had the highest value. The improvement of energy efficiency is the most critical factor that influences the difference effect in decoupling-effort of carbon emissions.
4.4. Forecast Model
The Grey systems theory, established initially by Julong Deng in 1982, focuses on the study of problems where the sample is small and the information poor [
39]. It deals with uncertain systems with partially known information which is generated, excavated and extracted from what is available. Grey models have been successfully used in several fields as energy or regional economics among others. The Grey system theory principles constitute the base of Grey forecasting models [
40]. The Grey forecasting model presents interesting advantages, especially for temporally limited information scenarios. It will be able to characterize an unknown system given relative little discrete data such as only four observations [
41].
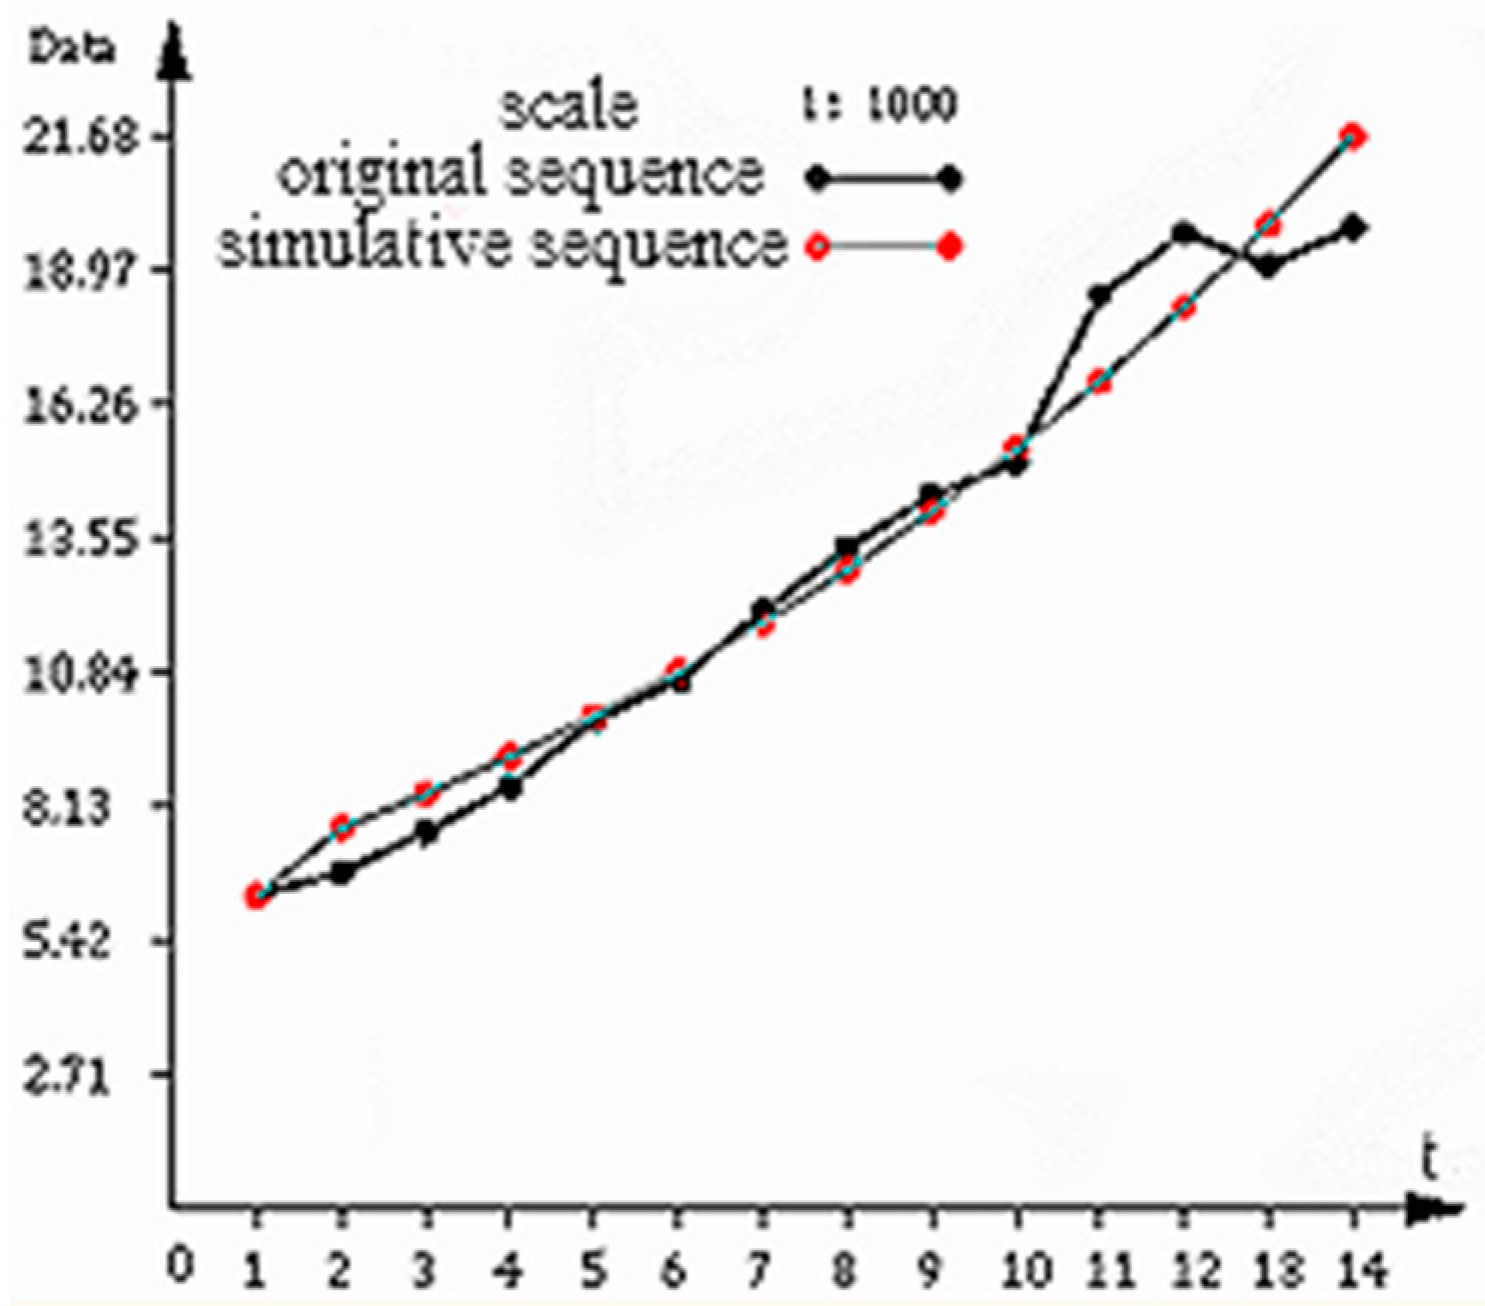
In addition, in Grey systems theory, the most common model is the Grey Model with First Order Differential Equation and one Variable model GM(1,1). The GM(1,1) requires only a few number of historical data and is used to predict exponential signals in real time. In this paper, we use GM(1,1) to predict carbon emissions and economic growth of equipment manufacturing during 2015–2024 to predict the trends of carbon emissions and economic growth in the equipment manufacturing sector for the next 10 years. Testing the original sequences during 2000–2014 for smoothness, we found that the original carbon emissions and economic growth sequences are smooth sequences, in which the accumulating generation sequence has an accurate index law (see
Figure 2 and
Figure 3).
Based on
Figure 2 and
Figure 3, we observed that the results are satisfactory and accurate. According to the calculation results of average GM (1,1) [
] and time response [
] by using the Tapio model, we obtained the decoupling condition of carbon emissions and GDP for 2014–2023 (
Table 8).
The forecast results indicate that equipment manufacturing had weak decoupling, and the decoupling indexes will increase annually after 2015. If the current industrial development trends continue, the decoupling state will deteriorate further. Growing links will appear in 2021. That is, economic growth and carbon emissions will be increasing at the same time. However, the growth rate of carbon emission will be greater than the growth rate of GDP, and the equipment manufacturing industry will be facing tremendous pressure to save energy. In order to develop a low-carbon economy, the Chinese government should implement active measures and corresponding policies to prevent the impact of economic growth to energy consumption.
5. Conclusions and Recommendations
5.1. Theoretical Implications
Based on our research, we found that the decoupling relationship between the carbon emission of the equipment manufacturing industry and economic growth was weakly decoupling, and the state was unstable. There was big differences between the decoupling indexes of the seven major groups of the equipment manufacturing industry, and the trend of strong decoupling industries was on the rise. Compared with the previous research, this paper changed the conventional approach that restricts the research object to the national, regional or industry level. This method cannot know the decoupling state of subsections of certain industries, so it can’t analyze the fractional industry impact on the whole country or kinds of industries accurately, and cannot grasp the development of an industry precisely.
We divided the industry into its constituting factors, and we fixed the equipment manufacturing industry as the research object. Based on the research, we found that the professional equipment manufacturing is most likely to be affected by the external environment. This is because it is a typical downstream demand-dull industry, and it was closely related to the state’s macro-policy, fixed-asset investment and development of the downstream industry. Compared to the growth rate of GDP in electric machinery and equipment manufacturing, the growth rate of carbon emissions was higher, indicating the energy efficiency was low. This is because the industry products need high levels of tech-intensiveness.
China is still at the development stage, and it needs to increase its technological investment to meet the needs of the industry’s development. Electronic and communication equipment manufacturing as a typical example of high-tech industries and equipment manufacturing industry, showed the most significant improvement of decoupling state. In recent years, the Chinese government has supported the development of the industry from the perspectives of talent cultivation and capital investment to rapidly boost the development of the industry. On the whole, the decoupling state of instrument and office appliance manufacturing was the most stable and in weak decoupling, with the decoupling index reducing gradually. This paper is good for analyzing the decoupling effect impact on manufacturing industries more clearly and specifically.
We have also adapted the LMDI decomposition method and decoupling-effort model to accurately analyze the factors of the decoupling state. We divided it into four categories which described the effect of economic output, followed by the energy intensity effect. We found that the increase in the economic output was the most important factor for the carbon emission growth. We can lay out the development direction of industry accurately by analyzing the factors affecting the mechanism of action of the decoupling effect, and thoroughly "decoupling" between energy consumption and economic growth.
Previous studies were based on the analysis of existing data and they did not attempt to forecast. Immediately after serious environmental pollution problems appeared, the government or enterprises took action to cure these environmental problems. That is, a treatment after pollution pattern. The innovation of the article lies in introducing the Gray forecasting model and forecast data effectively. Using econometric models it is difficult to forecast rationally because of the incomplete China Statistical Yearbook data. However, the Grey forecasting model can forecast in the short-term effectively with less data. According to the forecast, the rigid demand of China’s equipment manufacturing industry will be large in the coming decade, and the industry development relies on energy-intensive activities and high pollutant generation so the industrial structure needs to be optimized. Therefore, this paper proposes some corresponding counter-development measures according to the development of the industry.
5.2. Implications of Research
Due to the limitations of technology and resource endowment, the Chinese equipment manufacturing industries are faced with problems such as unreasonable industrial structure, low excess capacity, lack of high capacity, and the fact the heavy industry accounts for a large proportion in the national economy. These will limit the industry development. Therefore, the main way to reduce the carbon emissions of equipment manufacturing is only by upgrading the industry structure and improving energy efficiency. Besides, the energy consumption of the equipment manufacturing industry had relied heavily on coal, oil and other fossil fuels, and their consumption compared to new energy consumption is larger, which is not conducive to low-carbon development. Therefore, tax incentives, financial subsidies and other fiscal policies should be implemented for the development of the new energy industry in order to optimize the energy structure and hold back rapid growth of carbon emissions from the source. Finally, the government should give full play to the functions of guidance, supervision, incentive, encourage enterprise to study the emissions reduction experience of foreign enterprises and strictly implement low-carbon emission standards. At the same time, the government should work out and improve the related laws and regulations, injecting new vigor into the development of the low-carbon economy.


