
Thermochemical Characterizations of Novel Vermiculite-LiCl Composite Sorbents for Low-Temperature Heat Storage

Abstract
:1. Introduction
2. Experimental
2.1. Development and Preliminary Selection of Materials
2.2. Characterization Methods
3. Results and Discussion
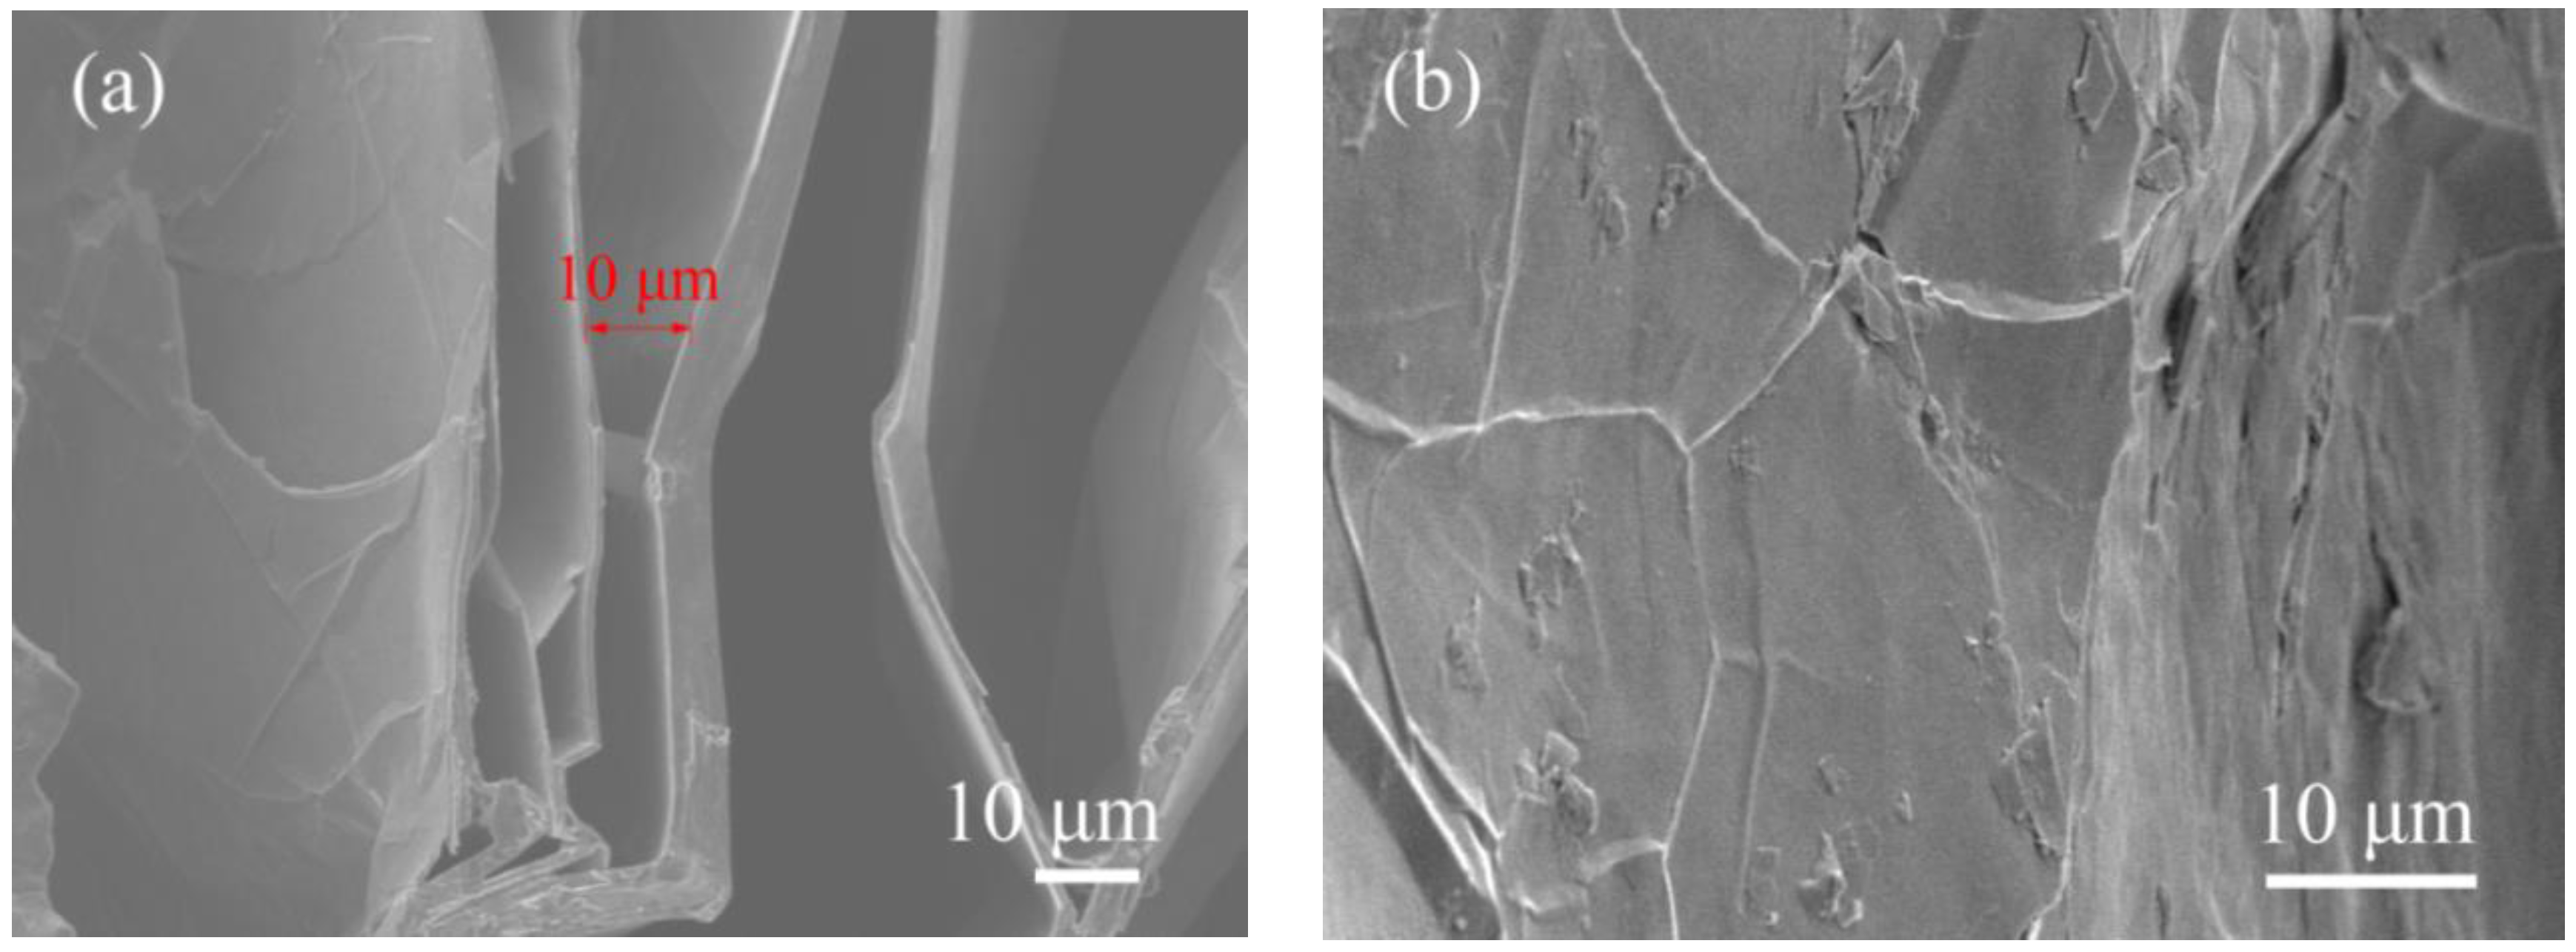
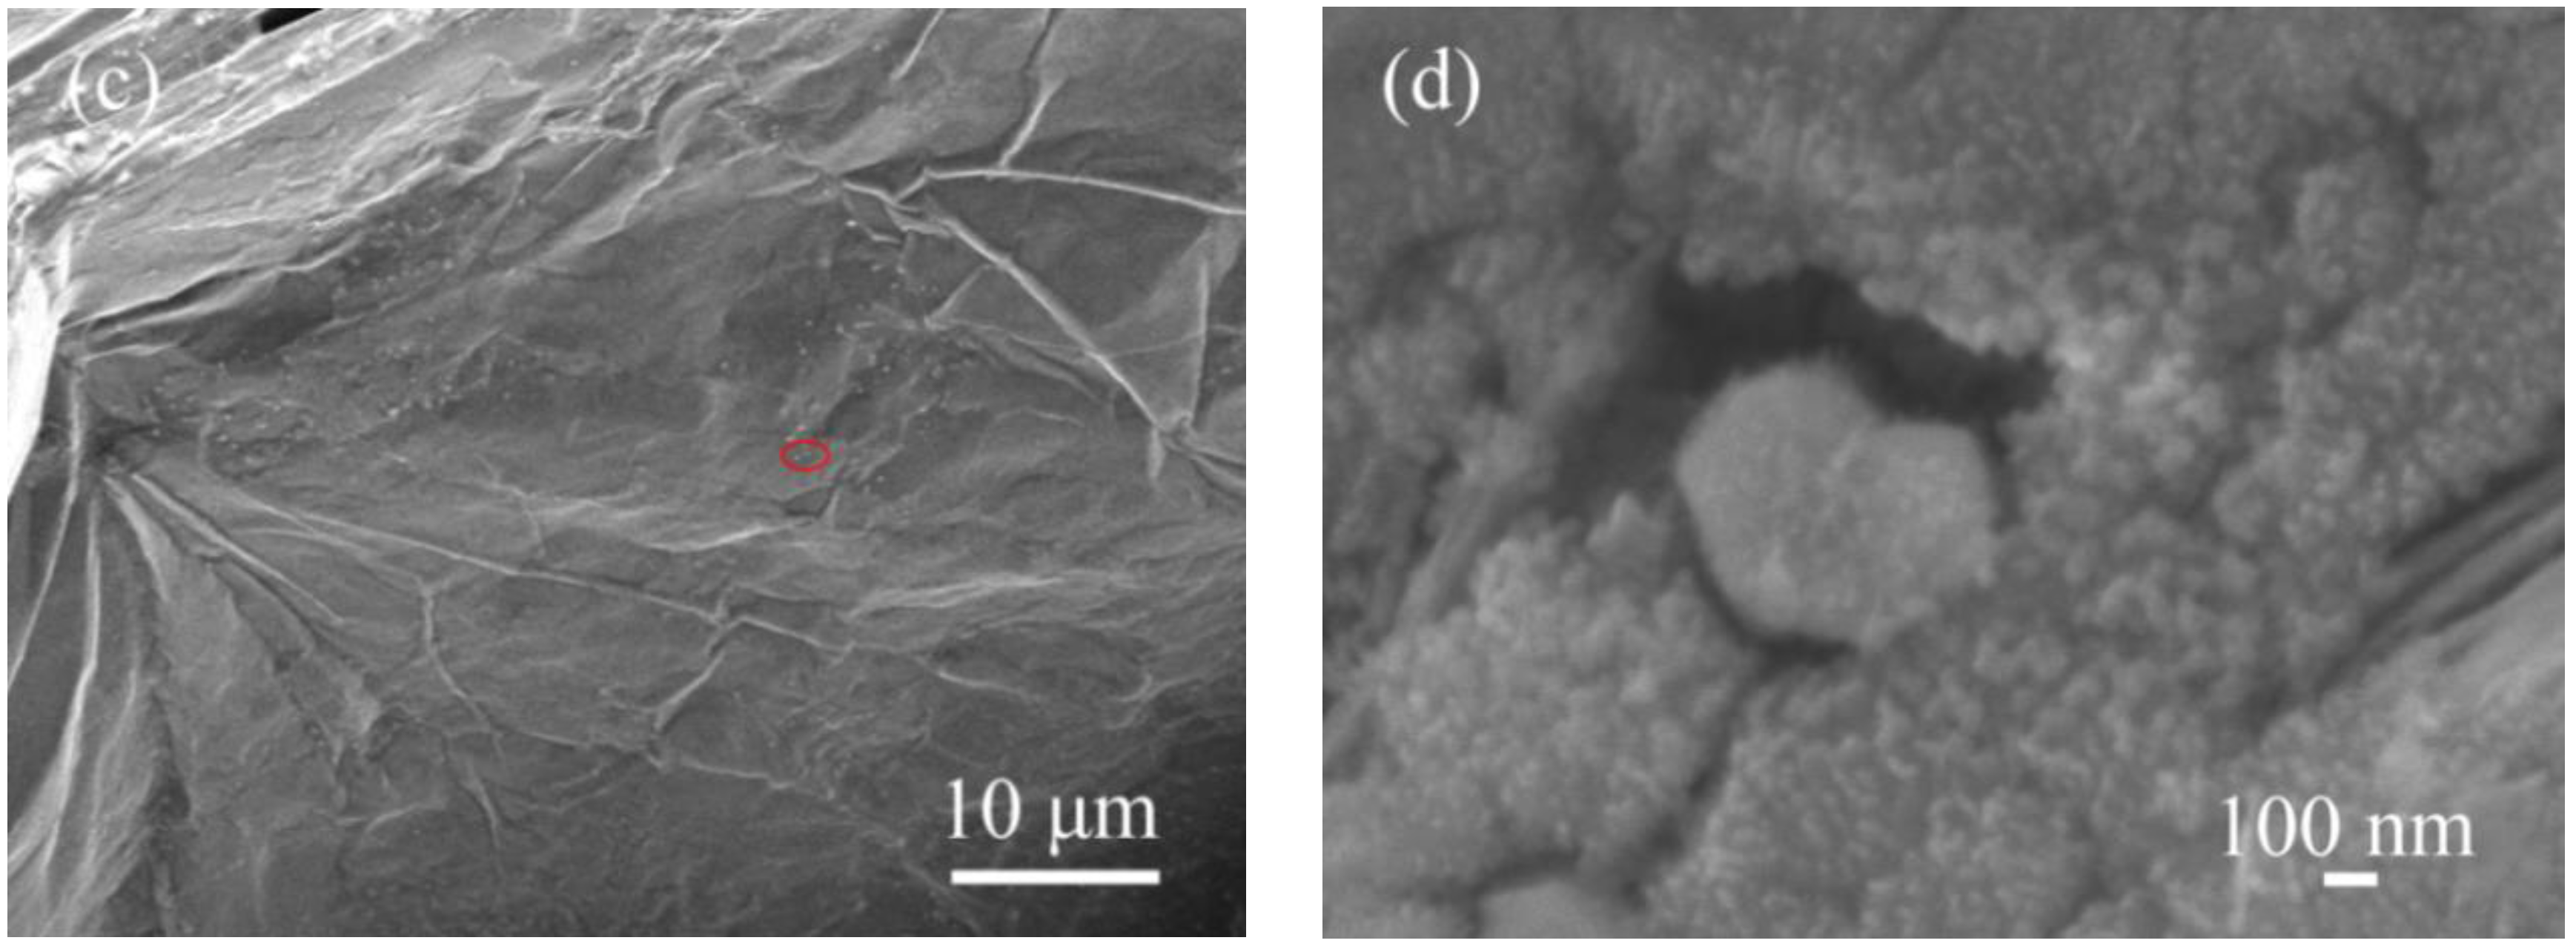
3.1. Textural Properties
3.2. Sorption Kinetics
3.3. Thermal Characterizations Measurement
3.4. Theoretical Evaluation of Sorption Performance
3.5. Theoretical Evaluation of Energy Storage Density
4. Conclusions
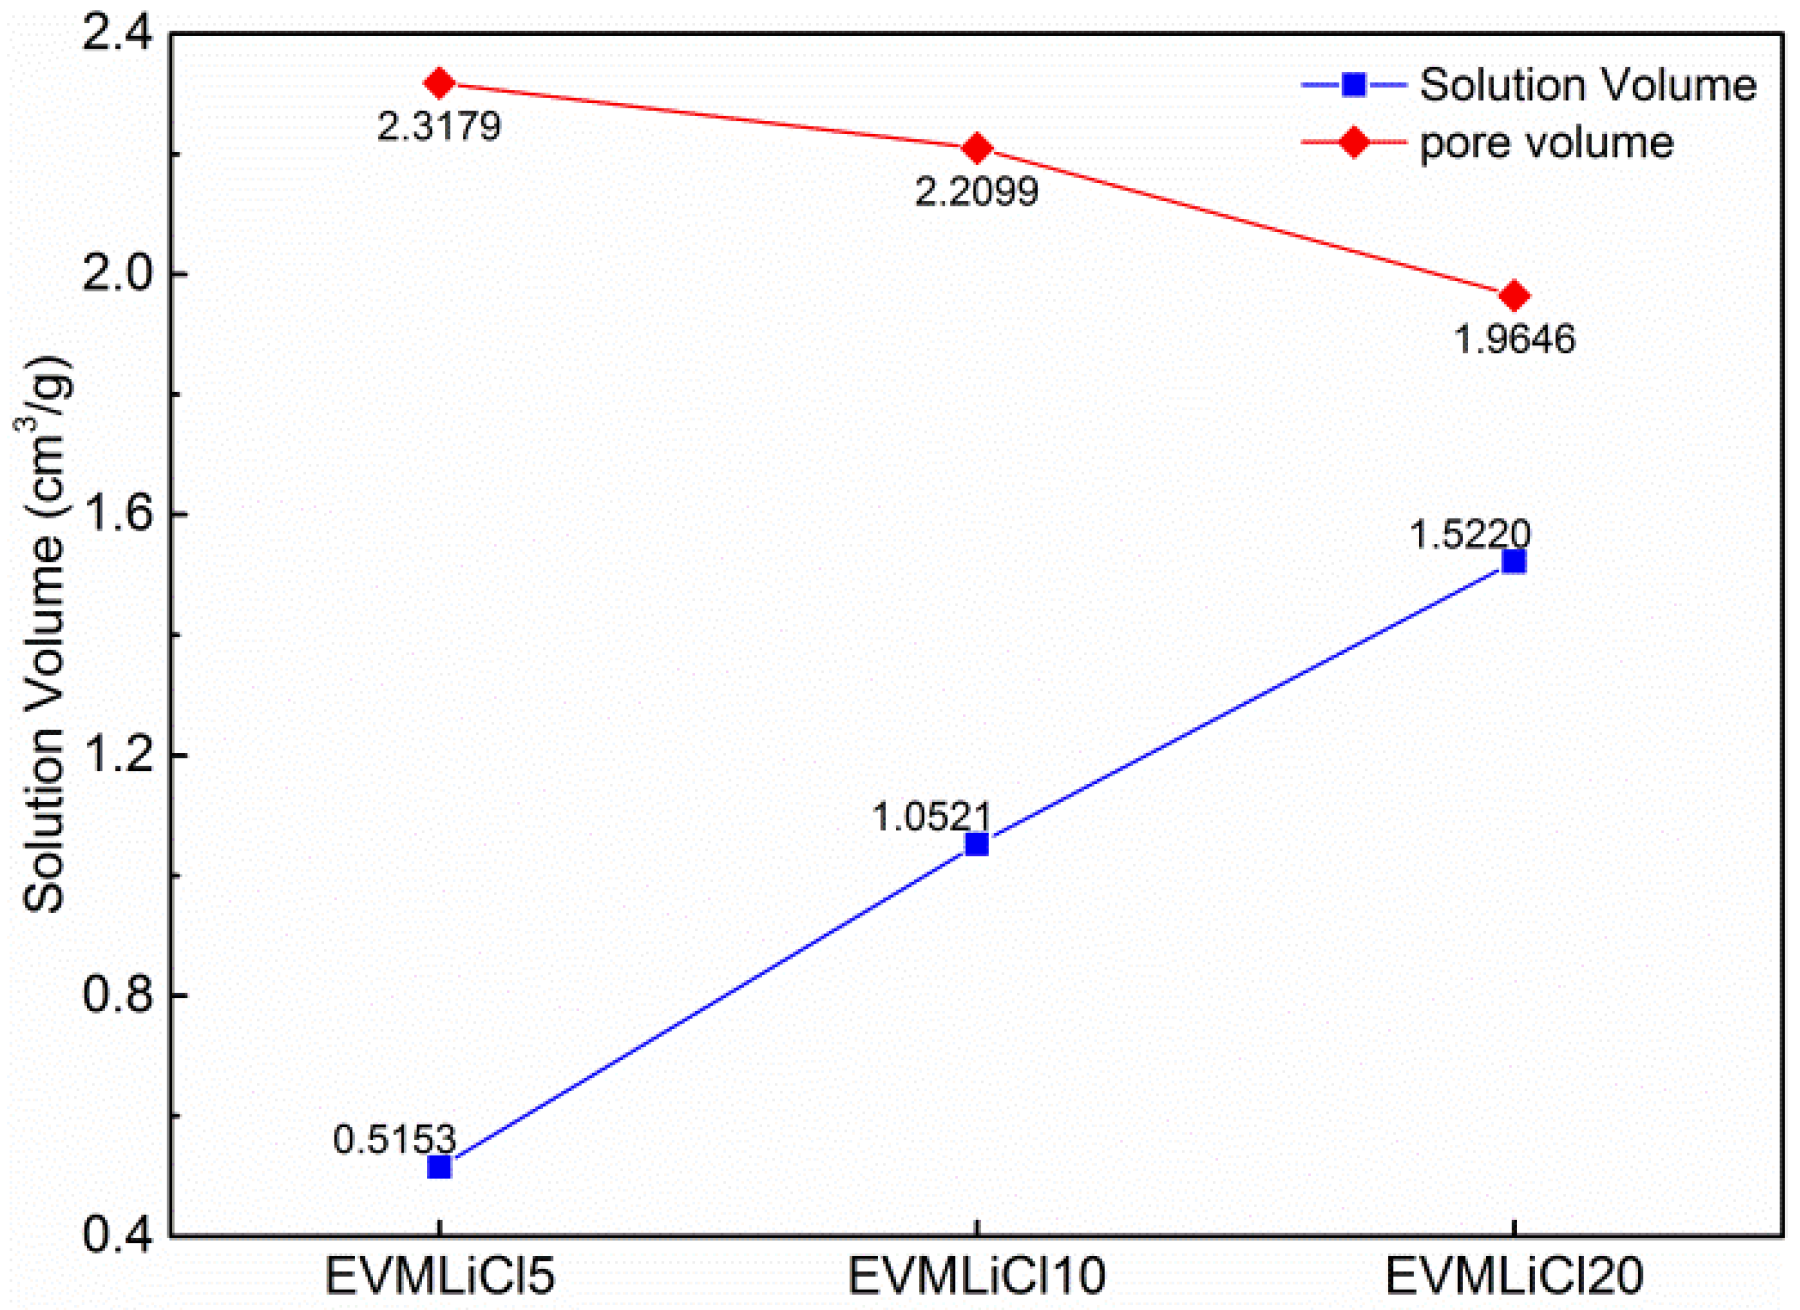
- Sorption process of EVM/LiCl composite sorbents is composed of three parts: physical adsorption of EVM, chemical adsorption of LiCl crystal, and liquid-gas absorption of LiCl solution. The salt content threshold for composite sorbents is 32.60%, beyond which solution leakage may appear. Not all of the pore volume of EVM can be utilized owing to some inaccessible volumes produced by the block of LiCl crystals and the stack of LiCl crystals.
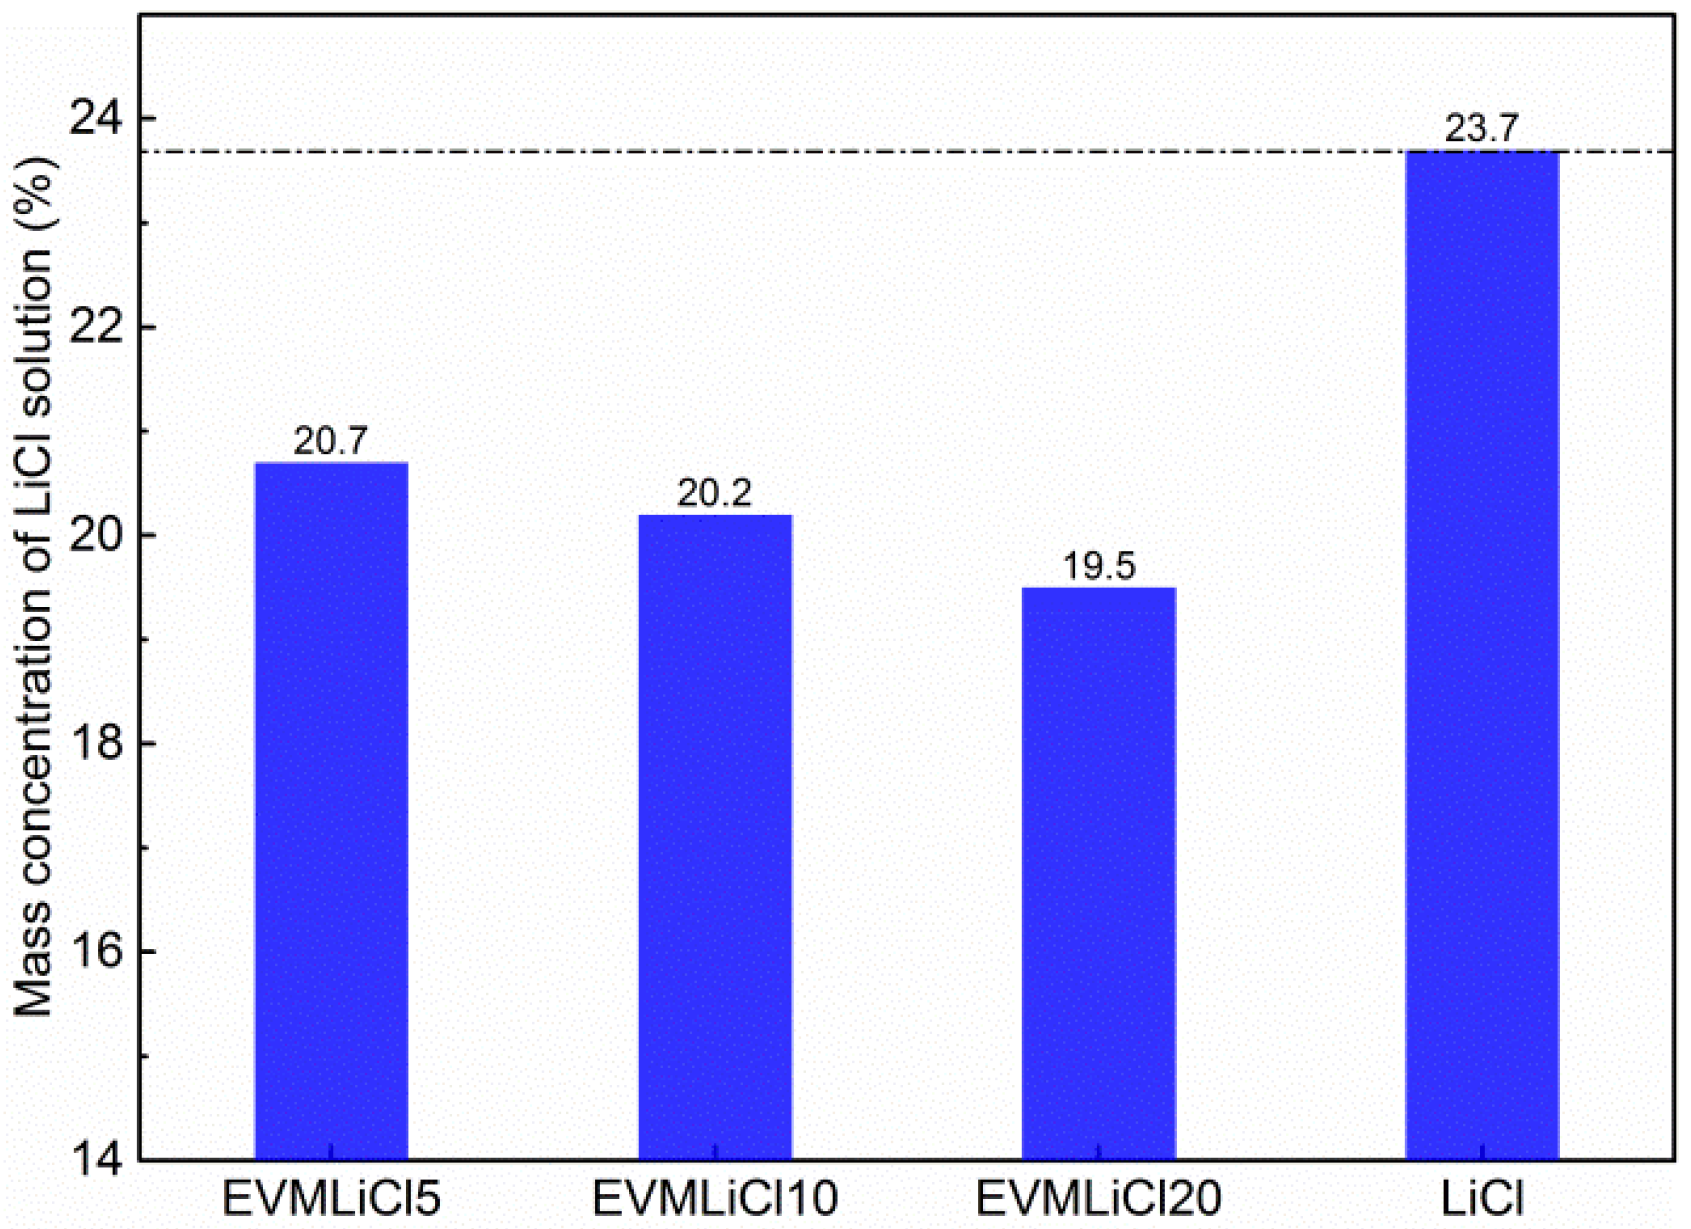
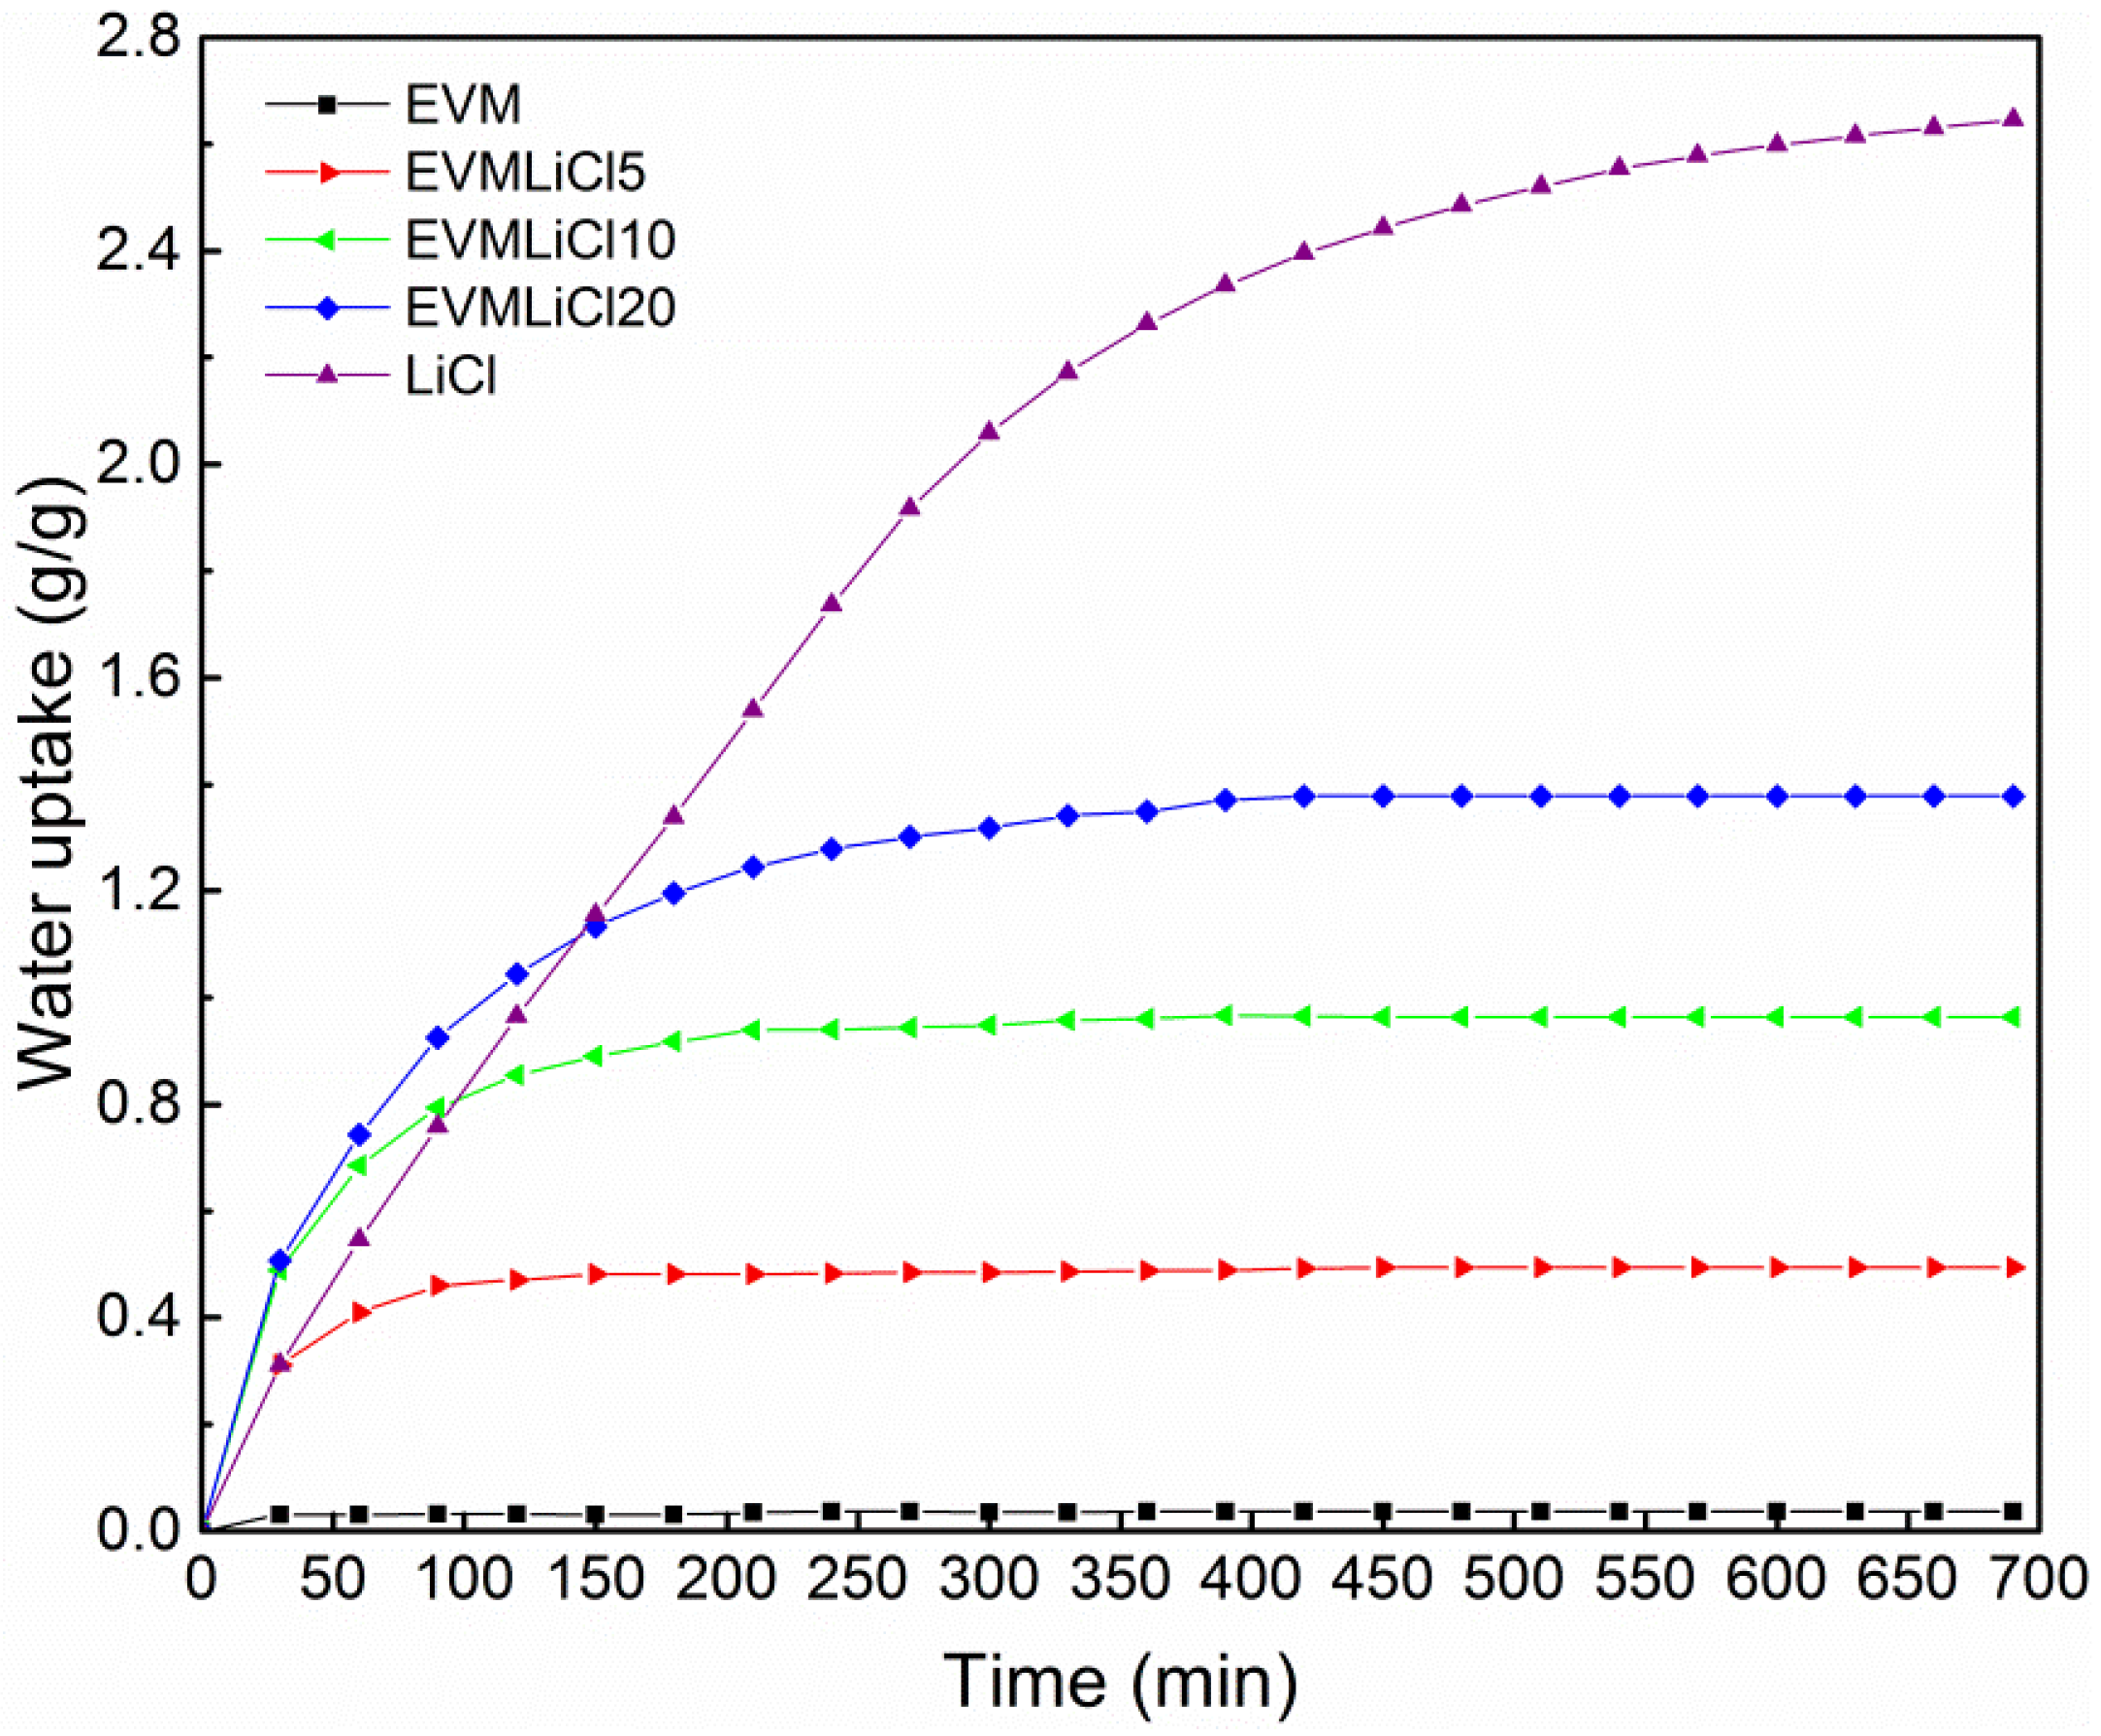
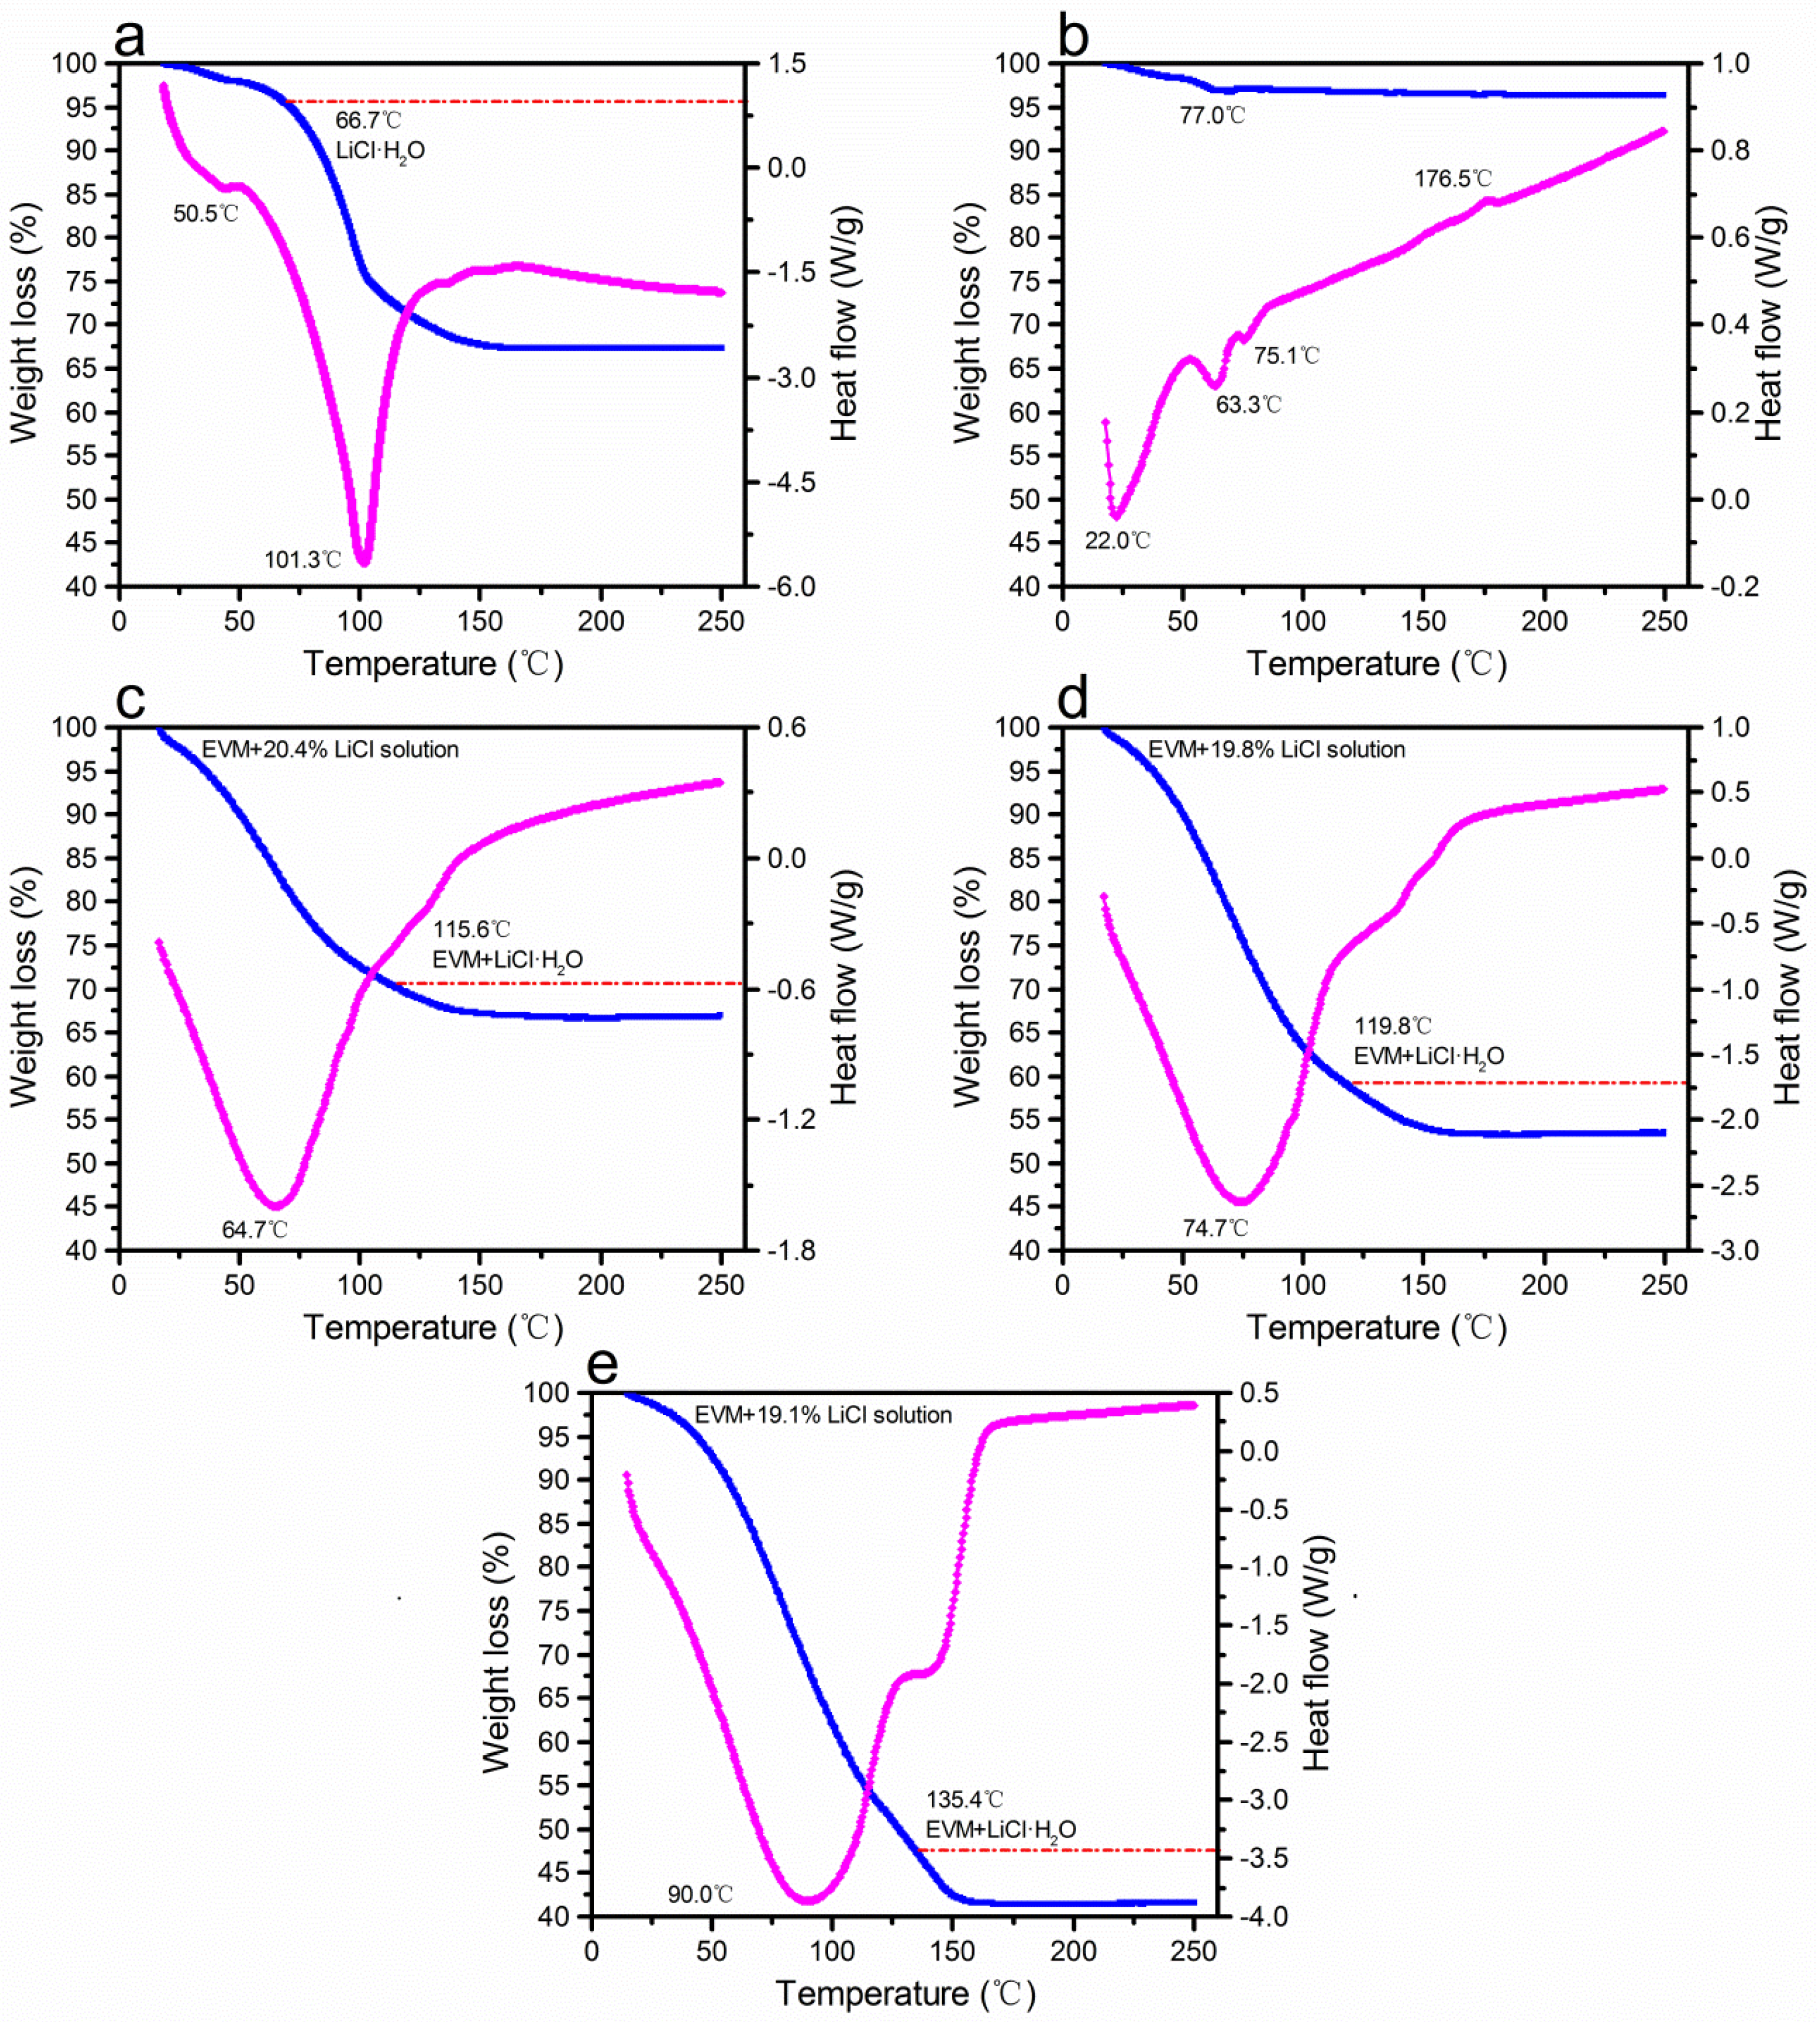
- Compared with pure LiCl, sorption kinetics and thermochemical performance of LiCl embedded into EVM present better performances: water uptake is increased as lower mass concentration LiCl solution is formed in EVM pores; desorption reaction enthalpy of LiCl solution is improved due to the contribution of adhesive forces between LiCl solution and the surface of pores and mass transfer resistance.
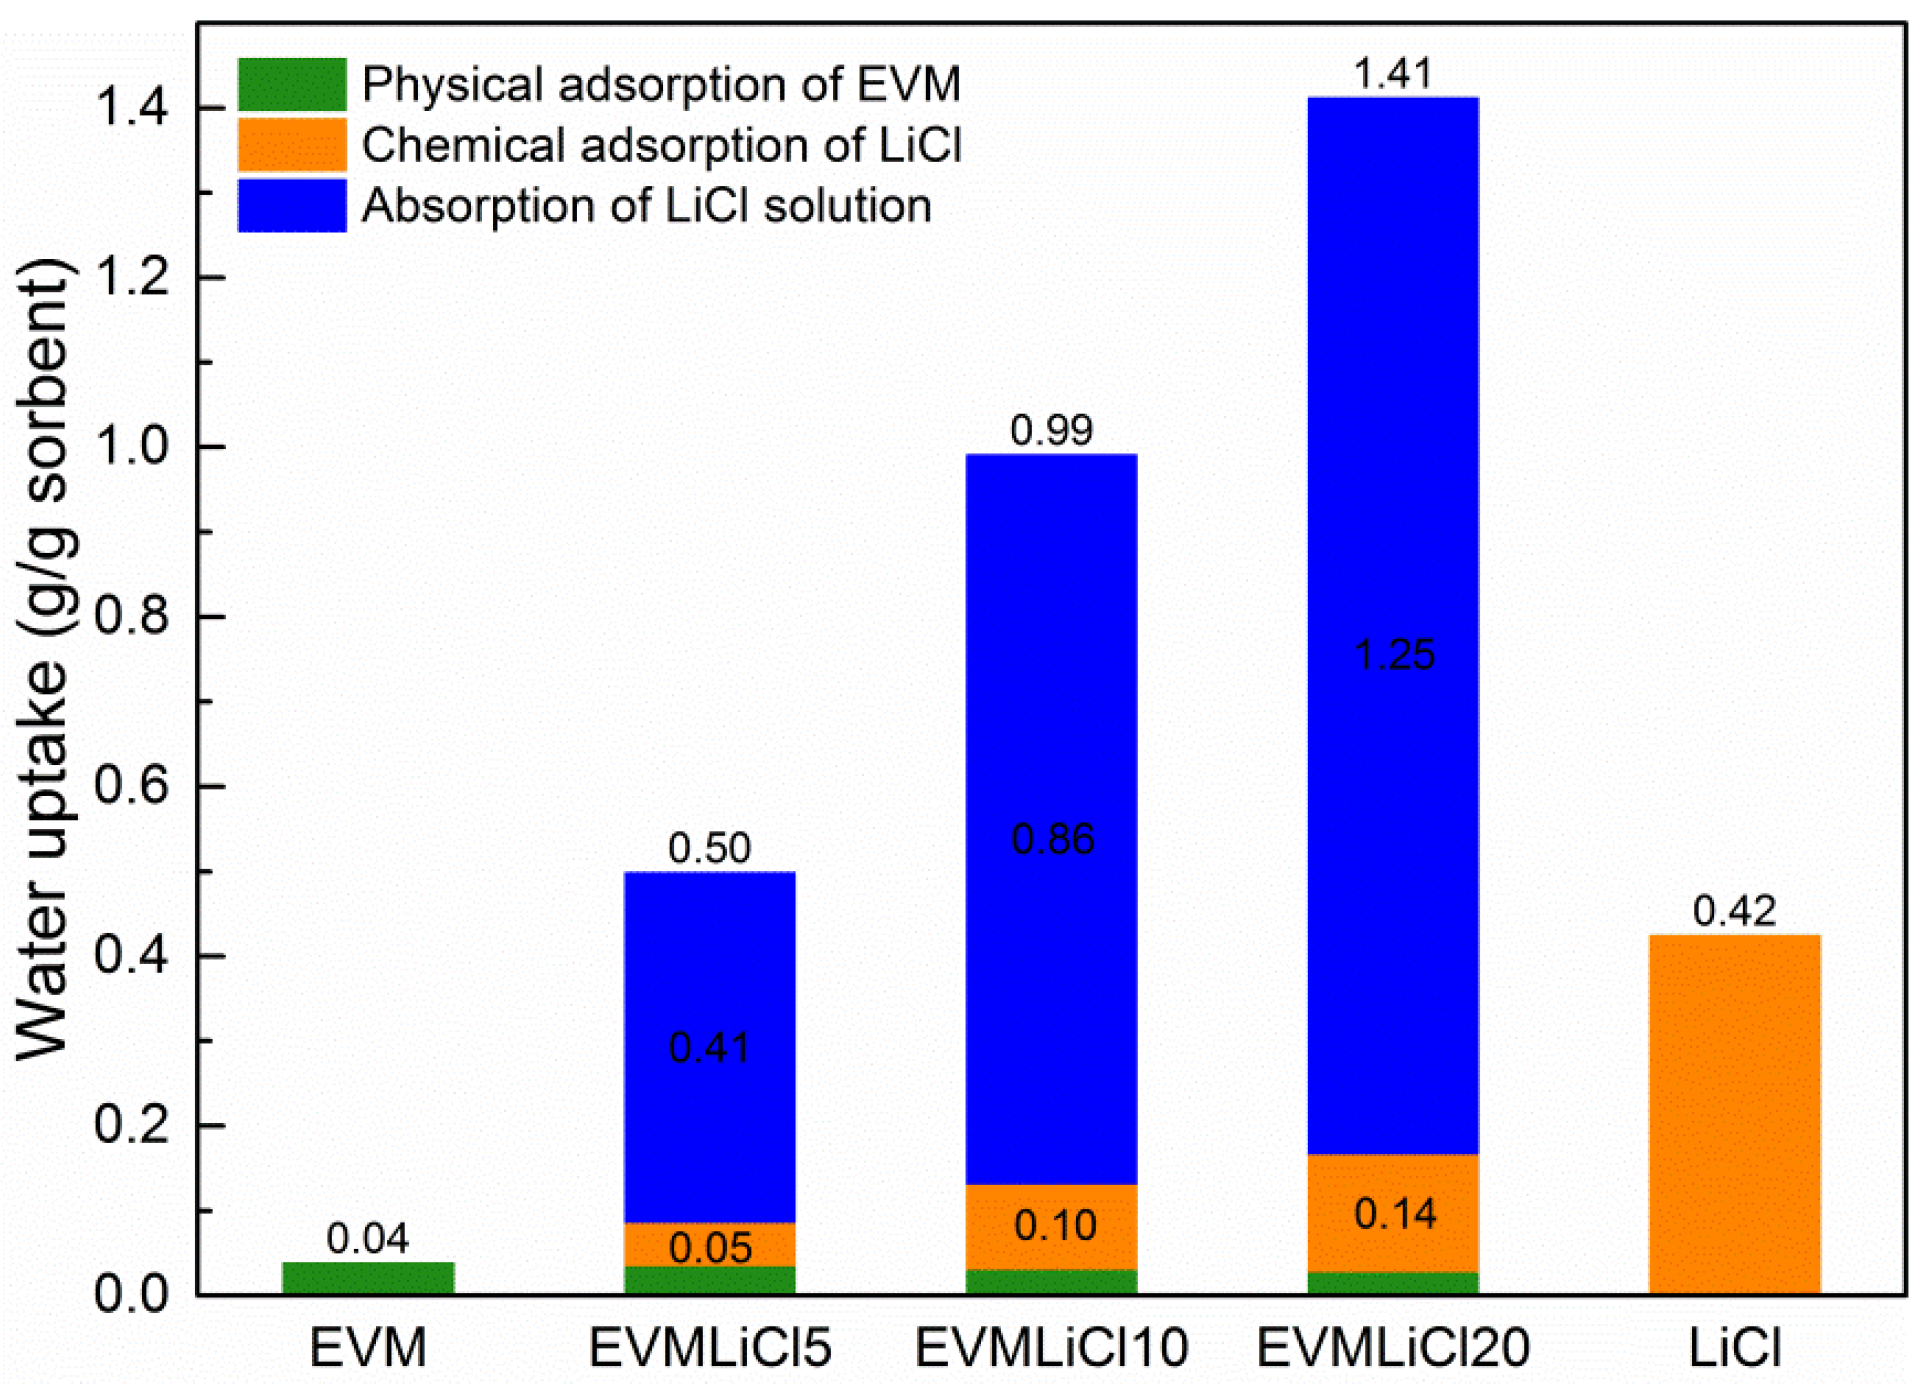
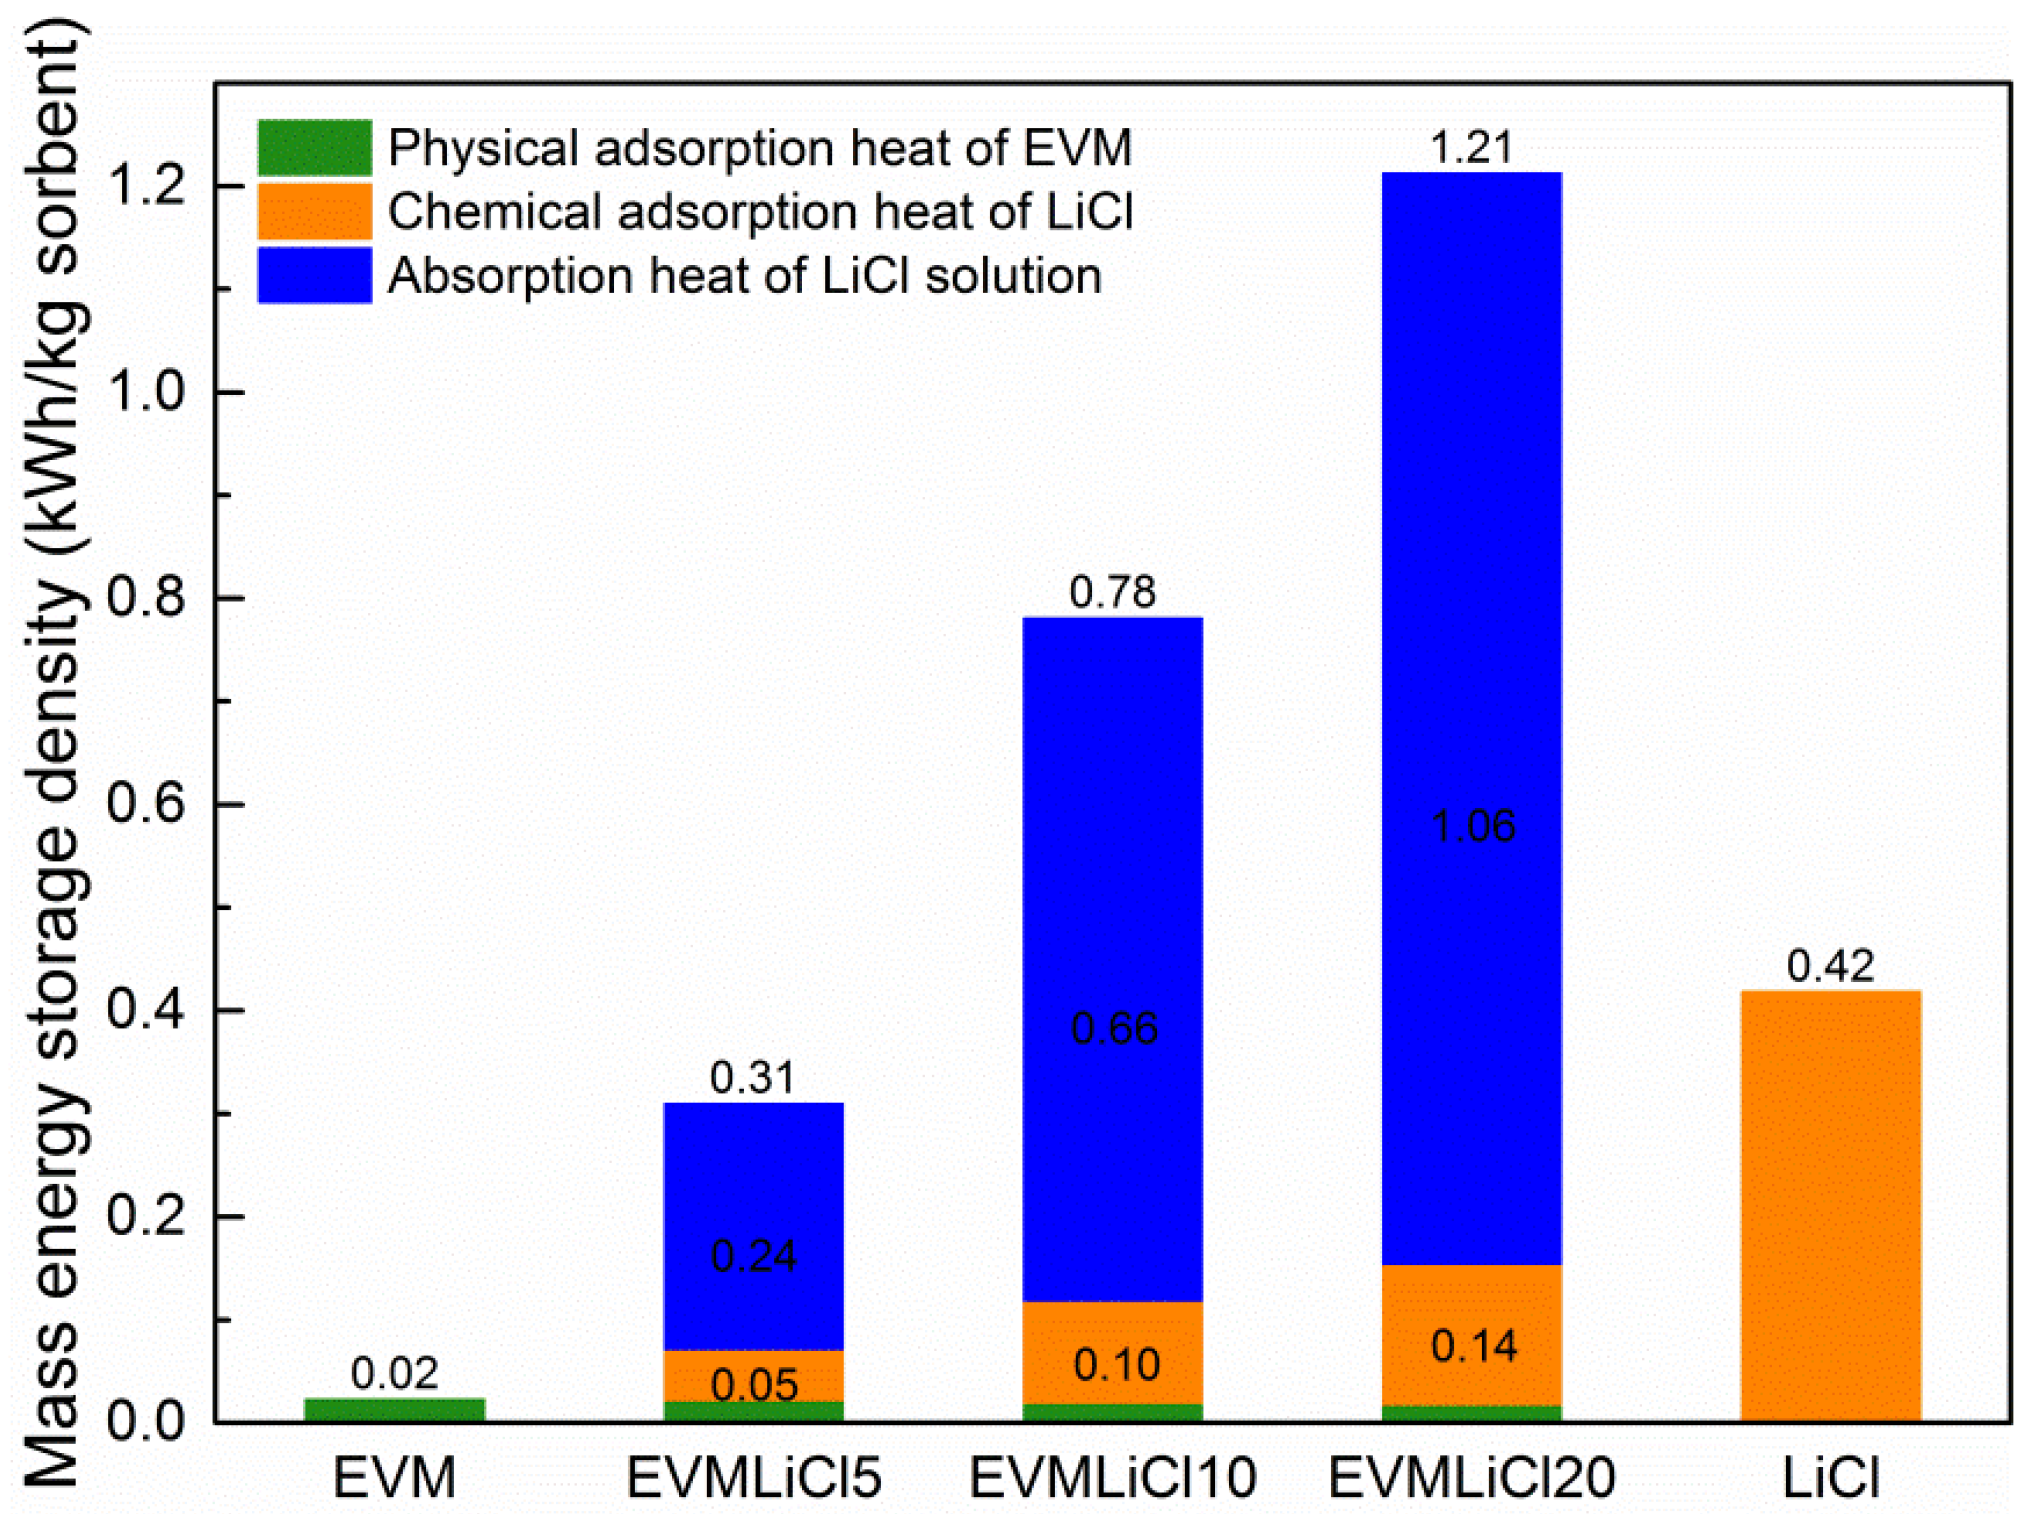
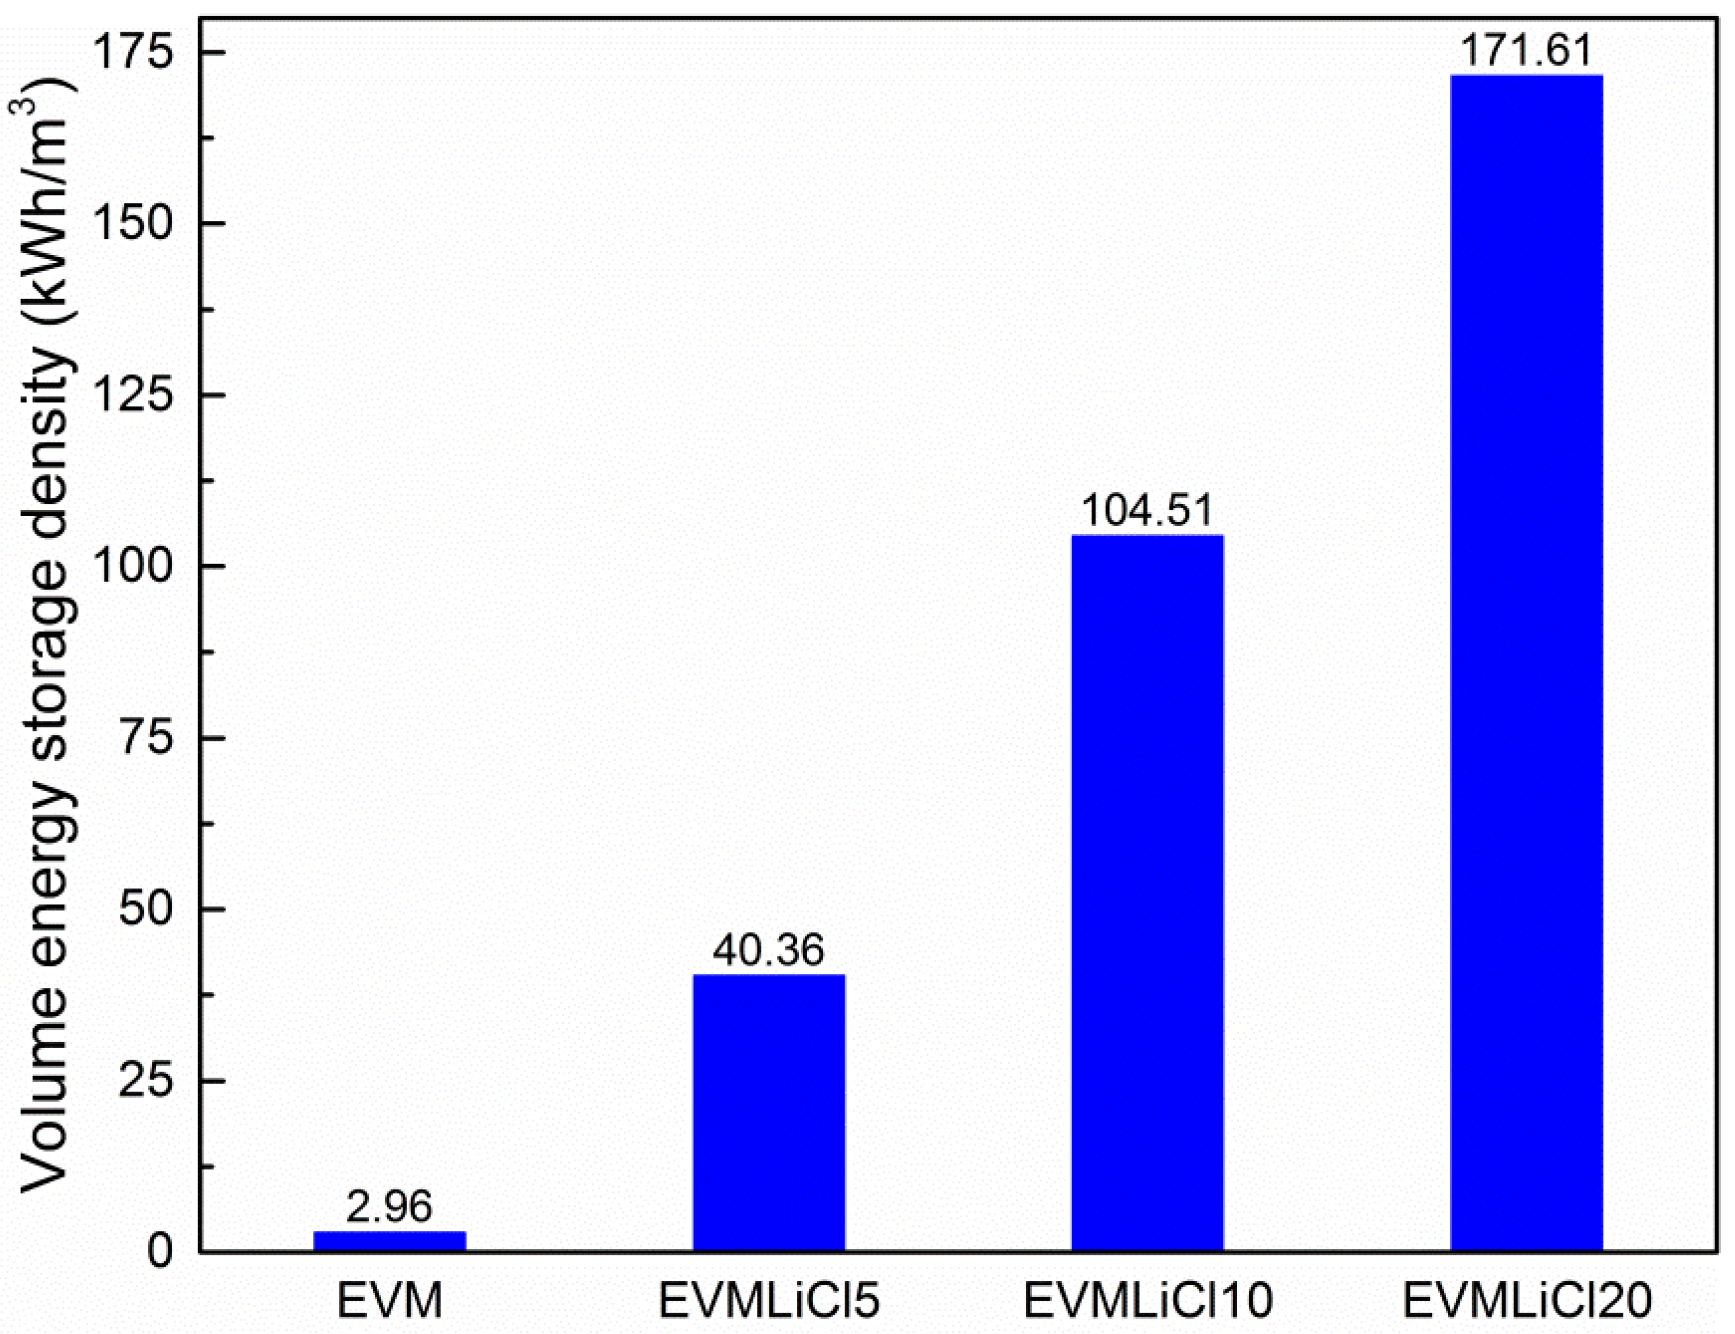
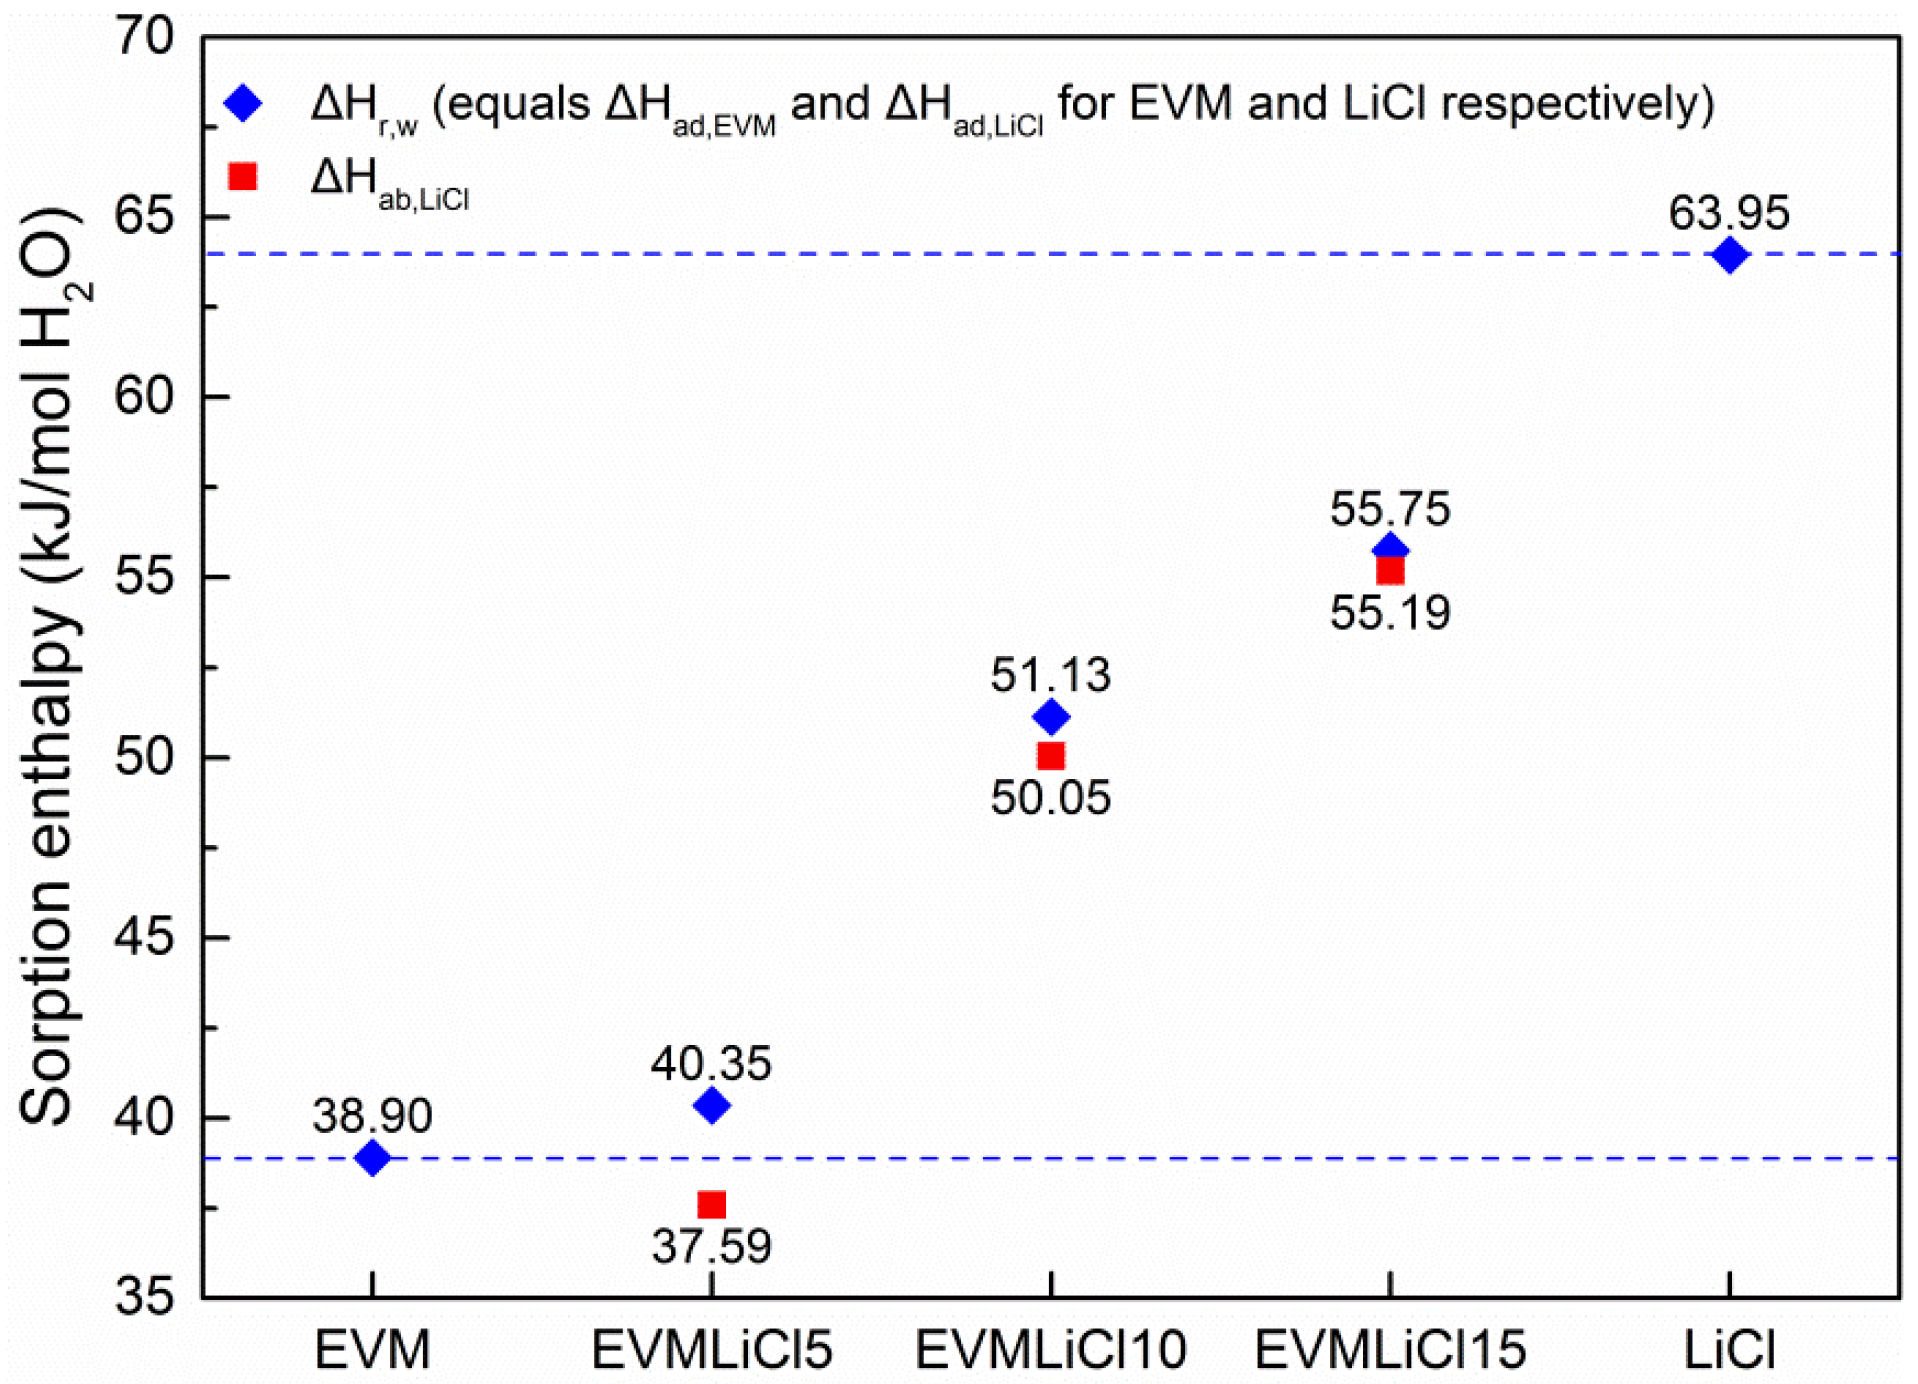
- Water uptake, mass energy storage density, and volume energy storage density increase with salt content. Water absorbed by LiCl solution contributes 83.0%–88.3% of total water uptake, and accordingly the sorption heat released in this process takes 77.4%–87.5% of the mass energy storage density. The desorption heat for losing one mole water ranges from 38 to 64 kJ. EVMLiCl20 was selected as the optimal composite sorbent, with water uptake of 1.41 g/g, mass energy storage density of 1.21 kWh/kg, and volume energy storage density of 171.61 kWh/m3.
Acknowledgments
Author Contributions
Conflicts of Interest
Abbreviations
| EVM | expanded vermiculite |
| TES | thermal energy storage |
| CSPM | salt inside porous matrix |
| RH | relative humidity |
| DRH | deliquescence relative humidity |
| PCM | phase change material |
Nomenclature
| w | mass concentration of LiCl solution in EVM pores, % |
| vs | volume of the LiCl solution formed in EVM pores, cm3/g |
| x | water uptake, g/g |
| qm | mass energy storage density of sorbent, kWh/kg |
| q | sorption heat of each part of the whole sorption process, kWh/kg |
| qv | volume energy storage density, kWh/m3 |
Greek symbols
| η | mass concentration of LiCl in composite sorbent, % |
| ρ | bulk density, kg/m3 |
| Δhr,w | reaction enthalpy for losing per mole water of the whole sorption process, kJ/mol |
| Δh | reaction enthalpy for losing per mole water of each part of the whole sorption process, kJ/mol |
Subscripts
| EVM | raw expanded vermiculite |
| LiCl | pure lithium chloride |
| cs | EVM/LiCl composite sorbent |
| ad,EVM | physical adsorption of EVM for EVM/LiCl composite sorbents |
| ad,LiCl | chemical adsorption of LiCl crystals in EVM/LiCl composite sorbents |
| ab,LiCl | liquid-gas absorption of LiCl solution for EVM/LiCl composite sorbents |
References
- Aydin, D.; Casey, S.P.; Riffat, S. The latest advancements on thermochemical heat storage systems. Renew. Sustain. Energy Rev. 2015, 41, 356–367. [Google Scholar] [CrossRef]
- Liu, H.; Nagano, K.; Togawa, J. A composite material made of mesoporous siliceous shale impregnated with lithium chloride for an open sorption thermal energy storage system. Sol. Energy 2015, 111, 186–200. [Google Scholar] [CrossRef]
- Nakabayashi, S.; Nagano, K.; Nakamura, M.; Togawa, J.; Kurokawa, A. Improvement of water vapor adsorption ability of natural mesoporous material by impregnating with chloride salts for development of a new desiccant filter. Adsorption 2011, 17, 675–686. [Google Scholar] [CrossRef]
- Posern, K.; Kaps, C. Calorimetric studies of thermochemical heat storage materials based on mixtures of MgSO4 and MgCl2. Thermochim. Acta 2010, 502, 73–76. [Google Scholar] [CrossRef]
- Michel, B.; Mazet, N.; Mauran, S.; Stitou, D.; Xu, J. Thermochemical process for seasonal storage of solar energy: Characterization and modeling of a high density reactive bed. Energy 2012, 47, 553–563. [Google Scholar] [CrossRef]
- Deshmukh, H.; Maiya, M.P.; Murthy, S. Study of sorption based energy storage system with silica gel for heating application. Appl. Therm. Eng. 2016. [Google Scholar] [CrossRef]
- Frazzica, A.; Sapienza, A.; Freni, A. Novel experimental methodology for the characterization of thermodynamic performance of advanced working pairs for adsorptive heat transformers. Appl. Therm. Eng. 2014, 72, 229–236. [Google Scholar] [CrossRef]
- Gong, L.X.; Wang, R.Z.; Xia, Z.Z.; Chen, C.J. Adsorption equilibrium of water on a composite adsorbent employing lithium chloride in silica gel. J. Chem. Eng. Data 2010, 55, 2920–2923. [Google Scholar] [CrossRef]
- Yu, N.; Wang, R.Z.; Lu, Z.S.; Wang, L.W. Development and characterization of silica gel-LiCl composite sorbents for thermal energy storage. Chem. Eng. Sci. 2014, 111, 73–84. [Google Scholar] [CrossRef]
- Zheng, X.; Ge, T.S.; Wang, R.Z.; Hu, L.M. Performance study of composite silica gels with different pore sizes and different impregnating hygroscopic salts. Chem. Eng. Sci. 2014, 120, 1–9. [Google Scholar] [CrossRef]
- Whiting, G.T.; Grondin, D.; Stosic, D.; Bennici, S.; Auroux, A. Zeolite-MgCl2 composites as potential long-term heat storage materials: Influence of zeolite properties on heats of water sorption. Sol. Energy Mater. Sol. Cells 2014, 128, 289–295. [Google Scholar] [CrossRef]
- Casey, S.P.; Elvins, J.; Riffat, S.; Robinson, A. Salt impregnated desiccant matrices for open thermochemical energy storage—Selection, synthesis and characterisation of candidate materials. Energy Build. 2014, 84, 412–425. [Google Scholar] [CrossRef]
- Veselovskaya, J.V.; Tokarev, M.M.; Grekova, A.D.; Gordeeva, L.G. Novel ammonia sorbents “porous matrix modified by active salt” for adsorptive heat transformation: 6. The ways of adsorption dynamics enhancement. Appl. Therm. Eng. 2012, 37, 87–94. [Google Scholar] [CrossRef]
- Aristov, Y.I.; Restuccia, G.; Tokarev, M.M.; Buerger, H.D.; Freni, A. Selective water sorbents for multiple applications. 11. CaCl2 confined to expanded vermiculite. React. Kinet. Catal. Lett. 2000, 71, 377–384. [Google Scholar] [CrossRef]
- Shkatulov, A.; Ryu, J.; Kato, Y.; Aristov, Y. Composite material “Mg(OH)2/vermiculite”: A promising new candidate for storage of middle temperature heat. Energy 2012, 44, 1028–1034. [Google Scholar] [CrossRef]
- Sapienza, A.; Glaznev, I.S.; Santamaria, S.; Freni, A.; Aristov, Y.I. Adsorption chilling driven by low temperature heat: New adsorbent and cycle optimization. Appl. Therm. Eng. 2012, 32, 141–146. [Google Scholar] [CrossRef]
- Grekova, A.D.; Veselovskaya, J.V.; Tokarev, M.M.; Gordeeva, L.G. Novel ammonia sorbents “porous matrix modified by active salt” for adsorptive heat transformation: 5. Designing the composite adsorbent for ice makers. Appl. Therm. Eng. 2012, 37, 80–86. [Google Scholar] [CrossRef]
- Veselovskaya, J.V.; Critoph, R.E.; Thorpe, R.N.; Metcalf, S.; Tokarev, M.M.; Aristov, Y.I. Novel ammonia sorbents “porous matrix modified by active salt” for adsorptive heat transformation: 3. Testing of “BaCl2/vermiculite” composite in a lab-scale adsorption chiller. Appl. Therm. Eng. 2010, 30, 1188–1192. [Google Scholar] [CrossRef]
- Guan, W.M.; Li, J.H.; Qian, T.T.; Wang, X.; Deng, Y. Preparation of paraffin/expanded vermiculite with enhanced thermal conductivity by implanting network carbon in vermiculite layers. Chem. Eng. J. 2015, 277, 56–63. [Google Scholar] [CrossRef]
- Kheradmand, M.; Castro-Gomes, J.; Azenha, M.; Silva, P.D.; De Aguiar, J.L.B.; Zoorob, S.E. Assessing the feasibility of impregnating phase change materials in lightweight aggregate for development of thermal energy storage systems. Constr. Build. Mater. 2015, 89, 48–59. [Google Scholar] [CrossRef]
- Gordeeva, L.G.; Aristov, Y.I. Composite sorbent of methanol “LiCl in mesoporous silica gel” for adsorption cooling: Dynamic optimization. Energy 2011, 36, 1273–1279. [Google Scholar] [CrossRef]
- Yu, N.; Wang, R.Z.; Wang, L.W. Theoretical and experimental investigation of a closed sorption thermal storage prototype using LiCl/water. Energy 2015, 93, 1523–1534. [Google Scholar] [CrossRef]
- Grekova, A.; Gordeeva, L.; Aristov, Y. Composite sorbents “Li/Ca halogenides inside multi-wall carbon nano-tubes” for thermal energy storage. Sol. Energy Mater. Sol. Cells 2016, 155, 176–183. [Google Scholar] [CrossRef]
- Conde, M.R. Properties of aqueous solutions of lithium and calcium chlorides: Formulations for use in air conditioning equipment design. Int. J. Therm. Sci. 2004, 43, 367–382. [Google Scholar] [CrossRef]


| Sample | EVM | EVMLiCl5 | EVMLiCl10 | EVMLiCl20 | |
|---|---|---|---|---|---|
| Before deliquescence | Salt content 1 (wt %) | 0.00 | 11.89 | 23.74 | 34.30 |
| Bulk density 2 (kg/m3) | 127.74 | 130.00 | 133.71 | 143.91 | |
| After deliquescence | Salt content (wt %) | / | 11.89 | 23.74 | 32.60 |
| Bulk density (kg/m3) | / | 130.00 | 133.71 | 141.50 |
| Sample | EVM | EVMLiCl5 | EVMLiCl10 | EVMLiCl20 |
|---|---|---|---|---|
| Salt content (wt %) | 0.0 | 11.9 | 23.7 | 32.6 |
| Pore volume (cm3/g) | 4.7626 | 2.3179 | 2.2099 | 1.9646 |
| Volume of LiCl crystals (cm3/g) | 0 | 0.067 | 0.133 | 0.183 |
| Pore volume (cm3/g, related to the mass of pure EVM) | 4.7626 | 2.8977 | 2.9147 | 2.6307 |
| Volume of LiCl crystal 3 (cm3, related to the mass of pure EVM) | 0 | 0.076 | 0.175 | 0.272 |
| Pore area (m2/g) | 0.671 | 2.623 | 2.744 | 3.121 |
| Pore diameter (nm) | 7663.4 | 7939.4 | 7363.8 | 7364.5 |
© 2016 by the authors; licensee MDPI, Basel, Switzerland. This article is an open access article distributed under the terms and conditions of the Creative Commons Attribution (CC-BY) license (http://creativecommons.org/licenses/by/4.0/).
Share and Cite
Zhang, Y.; Wang, R.; Li, T.; Zhao, Y. Thermochemical Characterizations of Novel Vermiculite-LiCl Composite Sorbents for Low-Temperature Heat Storage. Energies 2016, 9, 854. https://doi.org/10.3390/en9100854
Zhang Y, Wang R, Li T, Zhao Y. Thermochemical Characterizations of Novel Vermiculite-LiCl Composite Sorbents for Low-Temperature Heat Storage. Energies. 2016; 9(10):854. https://doi.org/10.3390/en9100854
Chicago/Turabian StyleZhang, Yannan, Ruzhu Wang, Tingxian Li, and Yanjie Zhao. 2016. "Thermochemical Characterizations of Novel Vermiculite-LiCl Composite Sorbents for Low-Temperature Heat Storage" Energies 9, no. 10: 854. https://doi.org/10.3390/en9100854
APA StyleZhang, Y., Wang, R., Li, T., & Zhao, Y. (2016). Thermochemical Characterizations of Novel Vermiculite-LiCl Composite Sorbents for Low-Temperature Heat Storage. Energies, 9(10), 854. https://doi.org/10.3390/en9100854