Article

Comparison of Numerical and Experimental Studies for Flow-Field Optimization Based on Under-Rib Convection in Polymer Electrolyte Membrane Fuel Cells

Department of Mechanical Engineering and High Safety Vehicle Core Technology Research Center, Inje University, 607 Eobang-Dong, Gimhae-si, Gyongsangnam-do 621-749, Korea
*
Author to whom correspondence should be addressed.
Energies 2016, 9(10), 844; https://doi.org/10.3390/en9100844
Submission received: 15 August 2016 / Revised: 7 October 2016 / Accepted: 12 October 2016 / Published: 20 October 2016
(This article belongs to the Special Issue Polymer Electrolyte Membrane Fuel Cells 2016)

Abstract

:
The flow-field design based on under-rib convection plays an important role in enhancing the performance of polymer electrolyte membrane fuel cells (PEMFCs) because it ensures the uniform distribution of the reacting gas and the facilitation of water. This research focused on developing suitable configurations of the anode and cathode bipolar plates to enhance the fuel cell performance based on under-rib convection. The work here evaluated the effects of flow-field designs, including a serpentine flow field with sub channel and by pass and a conventional serpentine flow-field on single-cell performance. Both the experiment and computer simulation indicated that the serpentine flow field with sub channel and by pass (SFFSB) configuration enables more effective utilization of the electrocatalysts since it improves reactant transformation rate from the channel to the catalyst layer, thereby dramatically improving the fuel cell performance. The simulation and experimental results indicated that the power densities are increased by up to 16.74% and 18.21%, respectively, when applying suitable flow-field configurations to the anode and cathode bipolar plates. The findings in this are the foundation for enhancing efficient PEMFCs based on flow field design.

1. Introduction

Polymer electrolyte membrane fuel cells (PEMFCs) are considered one of the best technologies for mitigating problems pertaining to energy depletion and environmental pollution due to their high efficiency and low exhaust emission. PEMFCs possess many advantages in energy applications due to their ability to self-start at low temperatures and high power density and because they only produce water as a by-product [1,2].
PEMFCs use a proton-conductive membrane at the center as an electrolyte. This membrane is impermeable to gases, conducts only positively charged ions, and blocks electrons. The membrane is sandwiched between two catalyst layers and gas diffusion layers [3]. As noted in many studies, low power density is the main problem with fuel cells in comparison with traditional power sources [4]. However, corresponding to a given membrane electrode assembly (MEA), the fuel cell power density can be significantly improved when enhancing the transformation of reactants. The mass transfer in a PEMFC can be defined as the transfer of mass between the electrodes and the flow-field due to diffusion and convection. This process is influenced by the flow-field. Consequently, the selection of the flow-field pattern is important due to the effect of the shape, size, and pattern of the corresponding flow-field on fuel cell performance [1,5].
Many researchers have concentrated on optimizing the flow-field patterns to improve water management and fuel cell performance. However, the flow-field design in the bipolar plates (BPs) is very sophisticated due to the complex phenomena of mass transport and electrochemical reactions, which contribute greatly to fuel cell operation. One of the greatest difficulties when designing the flow-field in PEMFCs is predicting the development of the gas–liquid two-phase flow in the channels [6]. As presented in [7], a critical review of two-phase flow in gas flow channels of PEMFCs was conducted using both experimental and modeling techniques. Concerning the same research topic, Iranzo et al. [6] presented an experimental investigation of the preferential accumulation of liquid water in the channels of a multiple serpentine PEMFC using neutron imaging to visualize the liquid water distribution in the cells for a set of 15 different operating conditions. The results show that the gas flow direction has a major impact on the water accumulation within the channels, with significantly more water accumulated in channels with upwards gas flow. Meanwhile, to optimize the flow-field in PEMFCs, computational fluid dynamics techniques were investigated, as described in [8]. To understand dominant mechanisms of water transfer and explain in detail the fuel cell performance, the research [9] conducted a multifluid, multiphase PEMFC model consisting of separate transport equations for each phase. The model considered water formed at the cathode as a result of electrochemical reactions, two-phase change, and multiple mechanisms of water transfer between the ionomer phases distributed in the catalyst layer and the catalyst layer pores. In another research work, the water management and the two-phase transport in PEMFC electrodes affected by the interfacial phenomena at the macroscopic interfaces between fuel cell components were studied by analyzing multiphase multifluid computational fluid dynamics [10]. The results of their research gave the foundation for designing diffusion media with controlled structural properties at the interface with the channel.
Strong convection is key to the performance enhancement of PEMFCs because it not only significantly alters the reactant transport efficiency to porous gas diffusion layers (GDLs) and catalyst layers but also contributes to the discharge of the formed liquid water out of the cell [11,12,13,14,15,16,17,18]. To enhance convection in GDLs, previous studies [11,12,13,14,15] proposed configurations for the bipolar plates including multi-pass serpentine flow-fields, which enable higher under-rib convection, a more uniform concentration distribution of the gases, and fast discharge of liquid water from the under-rib regions. Nam et al. [19] investigated increasing the path-length difference in serpentine flow-fields based on the hypothesis that the resulting maximum path-length difference between neighboring flow-channels would enhance under-rib convection and transport, thereby improving the PEMFC performance. In a previous study [1], we also proposed a method to enhance the PEMFC performance by combining conventional serpentine flow field (CSFF) and serpentine flow field with sub channel and by pass (SFFSB) designs for bipolar plates in four configurations. The results revealed that the power densities of configurations in which SFFSB is applied in the cathode BP are higher than those for the flow-field configurations in which CSFF is applied in the cathode BP. The maximum power densities of the four flow-field configurations were found to be 0.52 W/cm2, 0.53 W/cm2, 0.61 W/cm2, and 0.62 W/cm2. The adoption of SFFSB at the cathode bipolar plate increases the output power density because the under-rib convection enables a more effective utilization of the electrocatalysts by minimizing the cathode flooding and improving the transformation of the reactants.
The water management characteristics, which affect directly PEMFC operation diversely change according to the respective flow-field patterns of the bipolar plate. When the active areas and the inlet boundary conditions are identical as described in [17], the serpentine flow-field pattern plays a more important role in water management than other configurations. In addition, the serpentine flow-field also contributes to improving gas convection through the diffusion media as described in [16]. In the case of using CSFF for the bipolar plate, under-rib convection is generated from the inlet to the outlet direction due to a high stoichiometry ratio. Consequently, at the adjacent main channels, there are migrations of reactants through rib bottom from the inlet to the outlet direction. Additionally, in the case of SFFSB, since a sub-channel is inserted in-between the main channels, the flow direction of under-rib convection is changed from the main channel to the sub-channel based on the sub-channel due to the difference in pressure between the sub channels, therefore improving gas permeability and overall gas diffusion force. Furthermore, when applying SFFSB to the cathode bipolar plate, the cathode flooding can be minimized and fuel cell performance is enhanced since water formed in the rib area is emitted to the sub channel and discharged toward the outlet. However, the water formation at the anode side and cathode side are different; therefore, it is necessary to find out the best configuration suitable for each side to improve the fuel cell performance. As a result, our research focused on developing suitable configurations of the anode and cathode bipolar plates to enhance the fuel cell performance by combining the CSFF and SFFSB configurations.
Based on the previous results, this research focused on developing suitable configurations of the anode and cathode bipolar plates to enhance the fuel cell performance based on the under-rib convection phenomenon. Numerical and experimental studies were conducted to evaluate the performance of PEMFCs when applying configurations II and IV for the bipolar plates with various boundary conditions of mass flow gas control, such as constant stoichiometry and constant mass flow rate. Simulations corresponding to these boundary conditions were also performed to analyze the water distribution behavior, current density concentrations, etc., to fully understand the effects of the flow-fields and boundary conditions on the PEMFC operation. As shown in Figure 1, four cases were studied: configurations I and II, in which an SFFSB and a CSFF were used at the anode and the cathode, respectively, and configurations III and IV, in which a CSFF and an SFFSB were used at the anode and the cathode, respectively. The stoichiometry ratios of supply gases were held constant in configurations I and III, and the mass flow rates were held constant in configurations II and IV. The information of flow-field of bipolar plates with five passes and four serpentine turns and a 25-cm2 reaction surface with and without sub-channels and ribs was described in detail in our previous studies [1].

2. Experimental Procedure

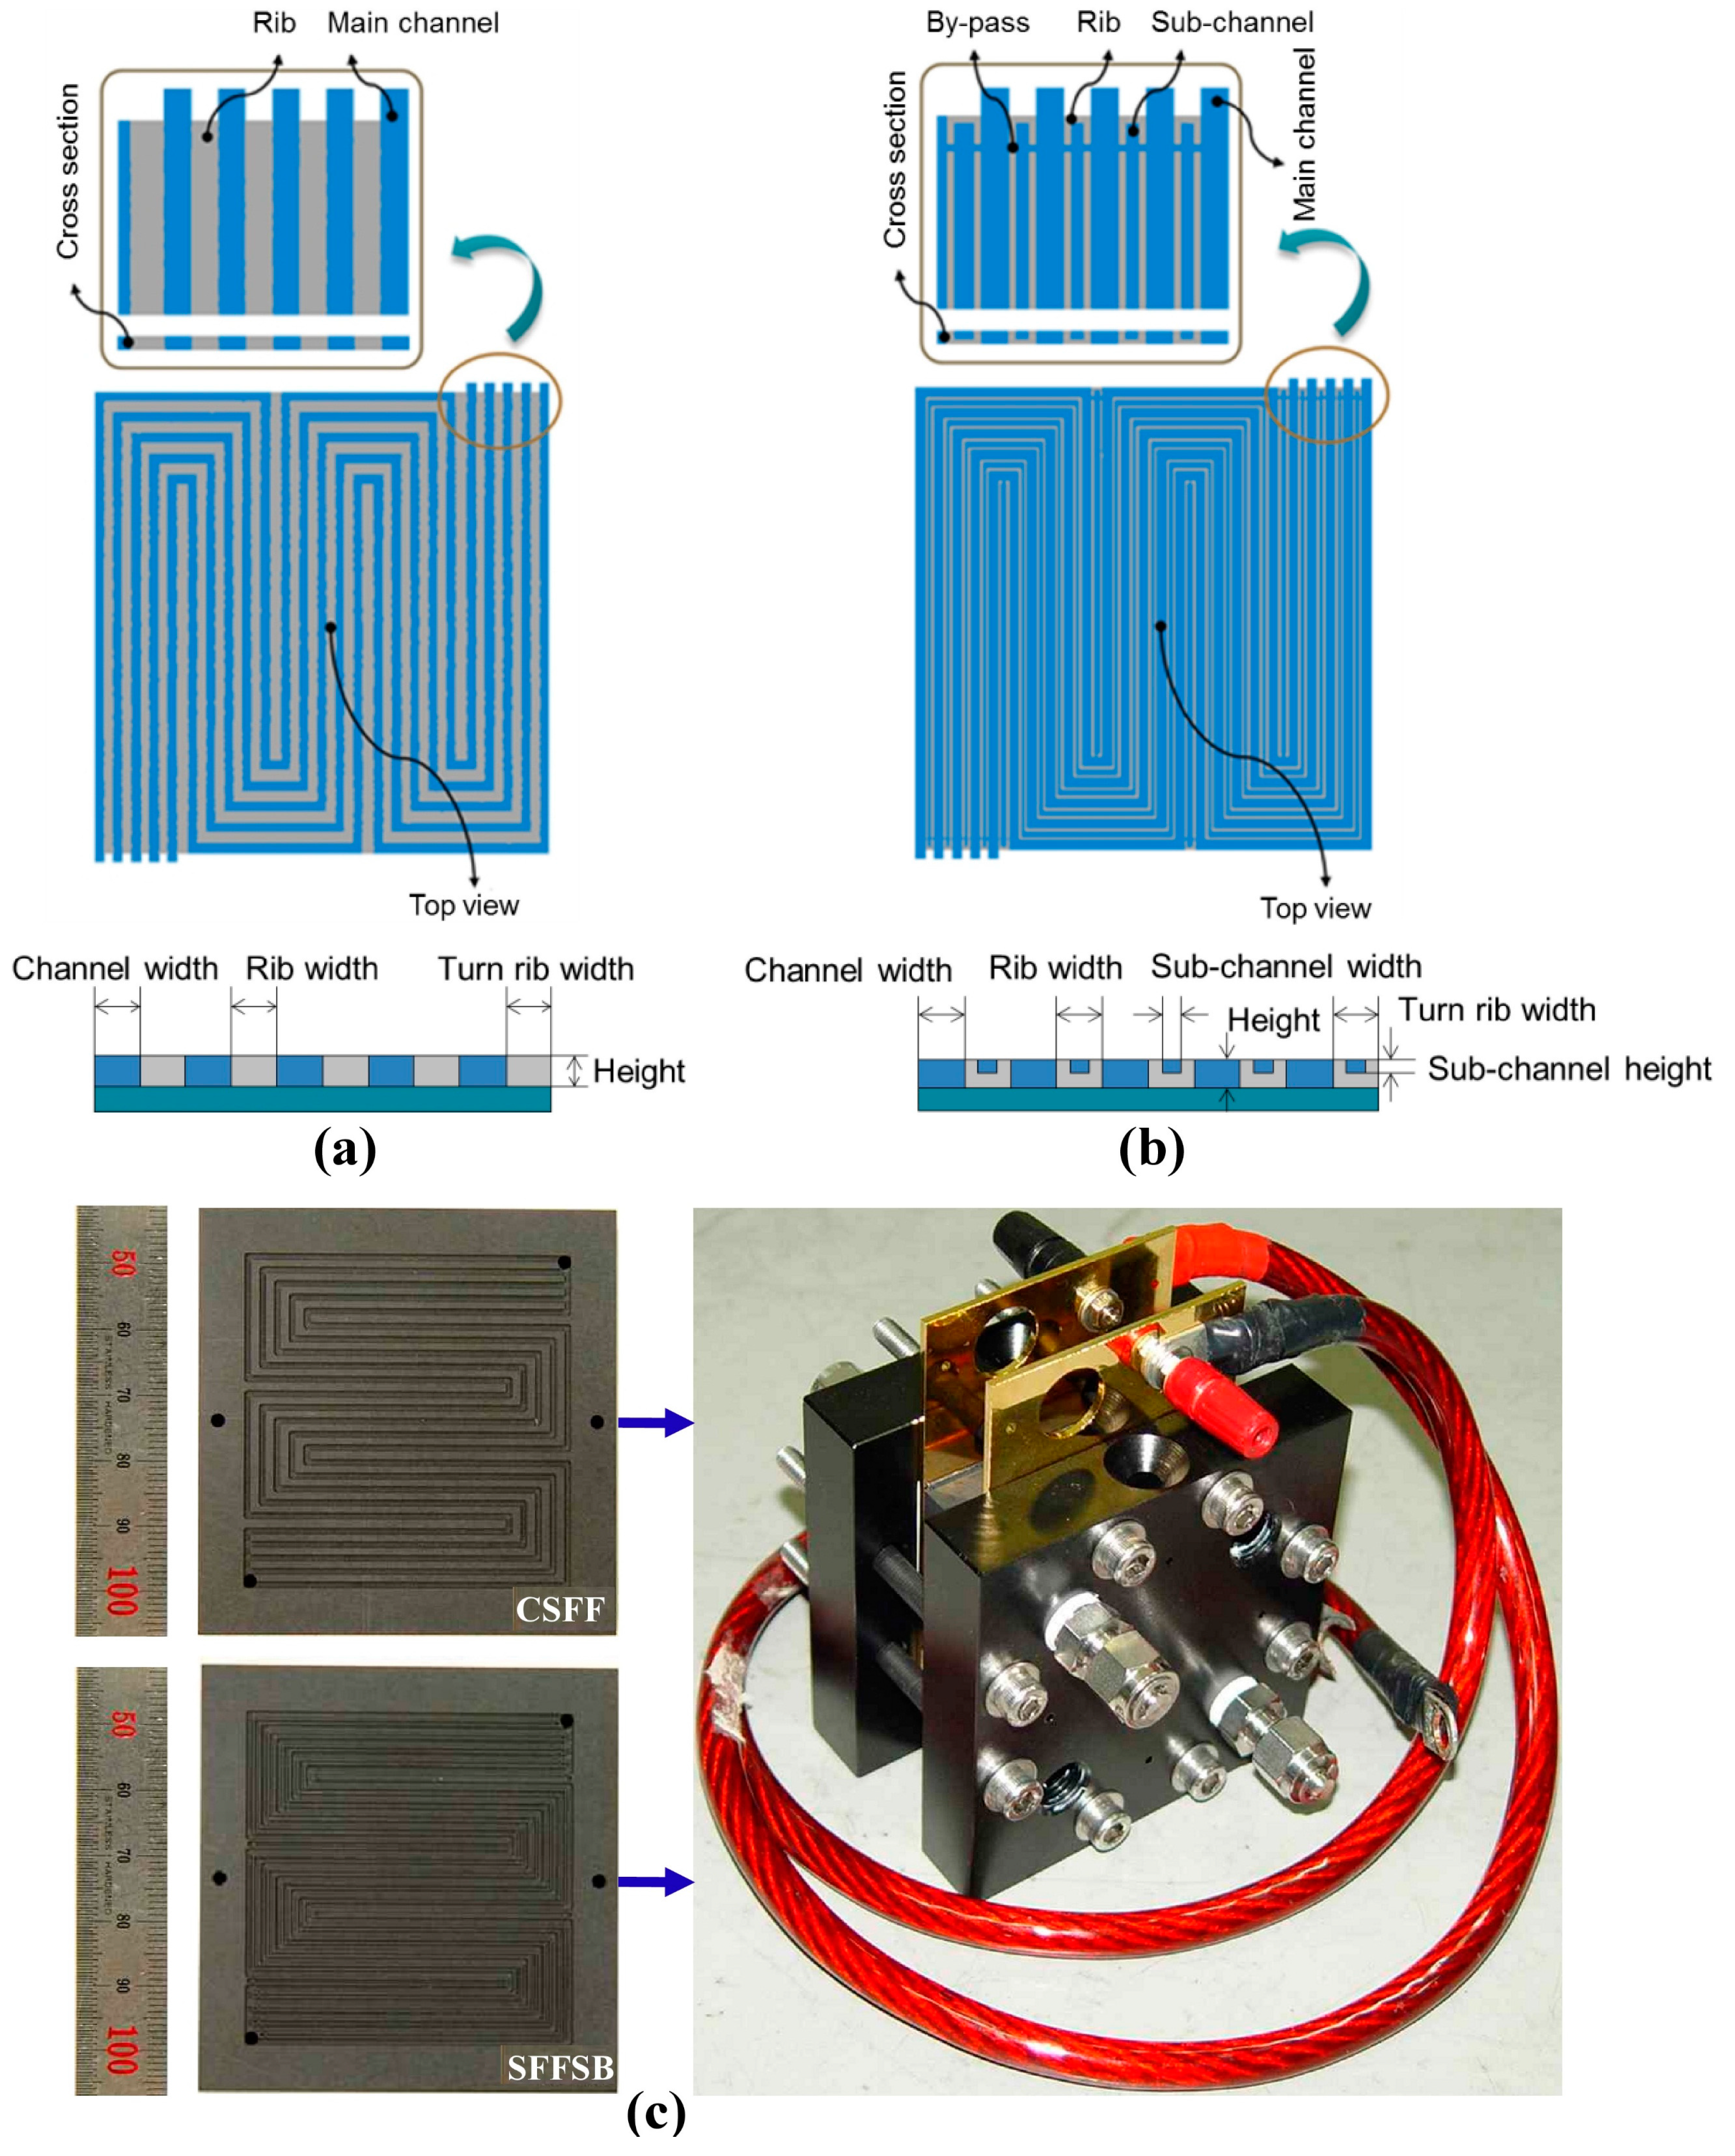
2.1. Fuel Cell Assembly

Two general types of flow-fields were developed in this study: a serpentine channel flow-field with five channels and a 25-cm2 active area with and without a sub-channel and rib made of graphite. The dimensions of the designed graphite BPs are shown in Table 1.
The fabricated anode and cathode BPs were assembled together with membrane electrode assembly (W.L. Gore & Associates PRIMEA® Series 57 MEA, W.L. Gore and Associates Inc., Newark, DE, USA) including a Nafion membrane with Pt loadings of 0.4 mg/cm2. The MEA and GDLs (SIGRACET® GDL, SGL CARBON GmbH, Augsburg, Germany) were pre-laminated at the factory with a 25-cm2 active area. Two metal endplates were used to sandwich all parts of the fuel cell to maintain good electrical contact between all fuel cell components. Because the electrical contact resistance between the BPs and the GDLs depends on the pressure applied to the contacting surface areas [20,21], all assemblies of fuel cells should be maintained at the same compression to ensure that the comparisons of the effects of other factors on fuel cell performance are based on the same contact resistance [20]. Consequently, all the cells were compressed at the same level.

2.2. Experimental Setup

Figure 2 shows the designs of BPs and fabricated BPs in the experimental setup. The main devices for the experiment include the electronic load, mass flow controller system, temperature controller, humidity and temperature measurement devices, power supply module, and data acquisition system. Each test procedure was proven in various supplemental literatures and experiments [22,23]. To evaluate fuel cell performance quantitatively, break-in procedure must be performed to minimize any physical damage to the MEA and maintain a stable electrical load.

3. Numerical Model

3.1. Governing Equations and Physical Models

The governing equations of the PEMFC mathematical models were constructed and solved using the commercial computational fluid dynamics (CFD) software ANSYS Fluent® 15 (ANSYS Inc., Canonsburg, PA, USA). The three-dimensional fluid flow and heat transfer were modeled by solving the Navier-Stokes transport equations in their conservative form. The electrochemistry model was constructed based on the oxidation and reduction reactions occurring at the catalyst surfaces. The conservation equation for the liquid water volume fraction or water saturation including all forms of these equations is presented in detail in [23,24].

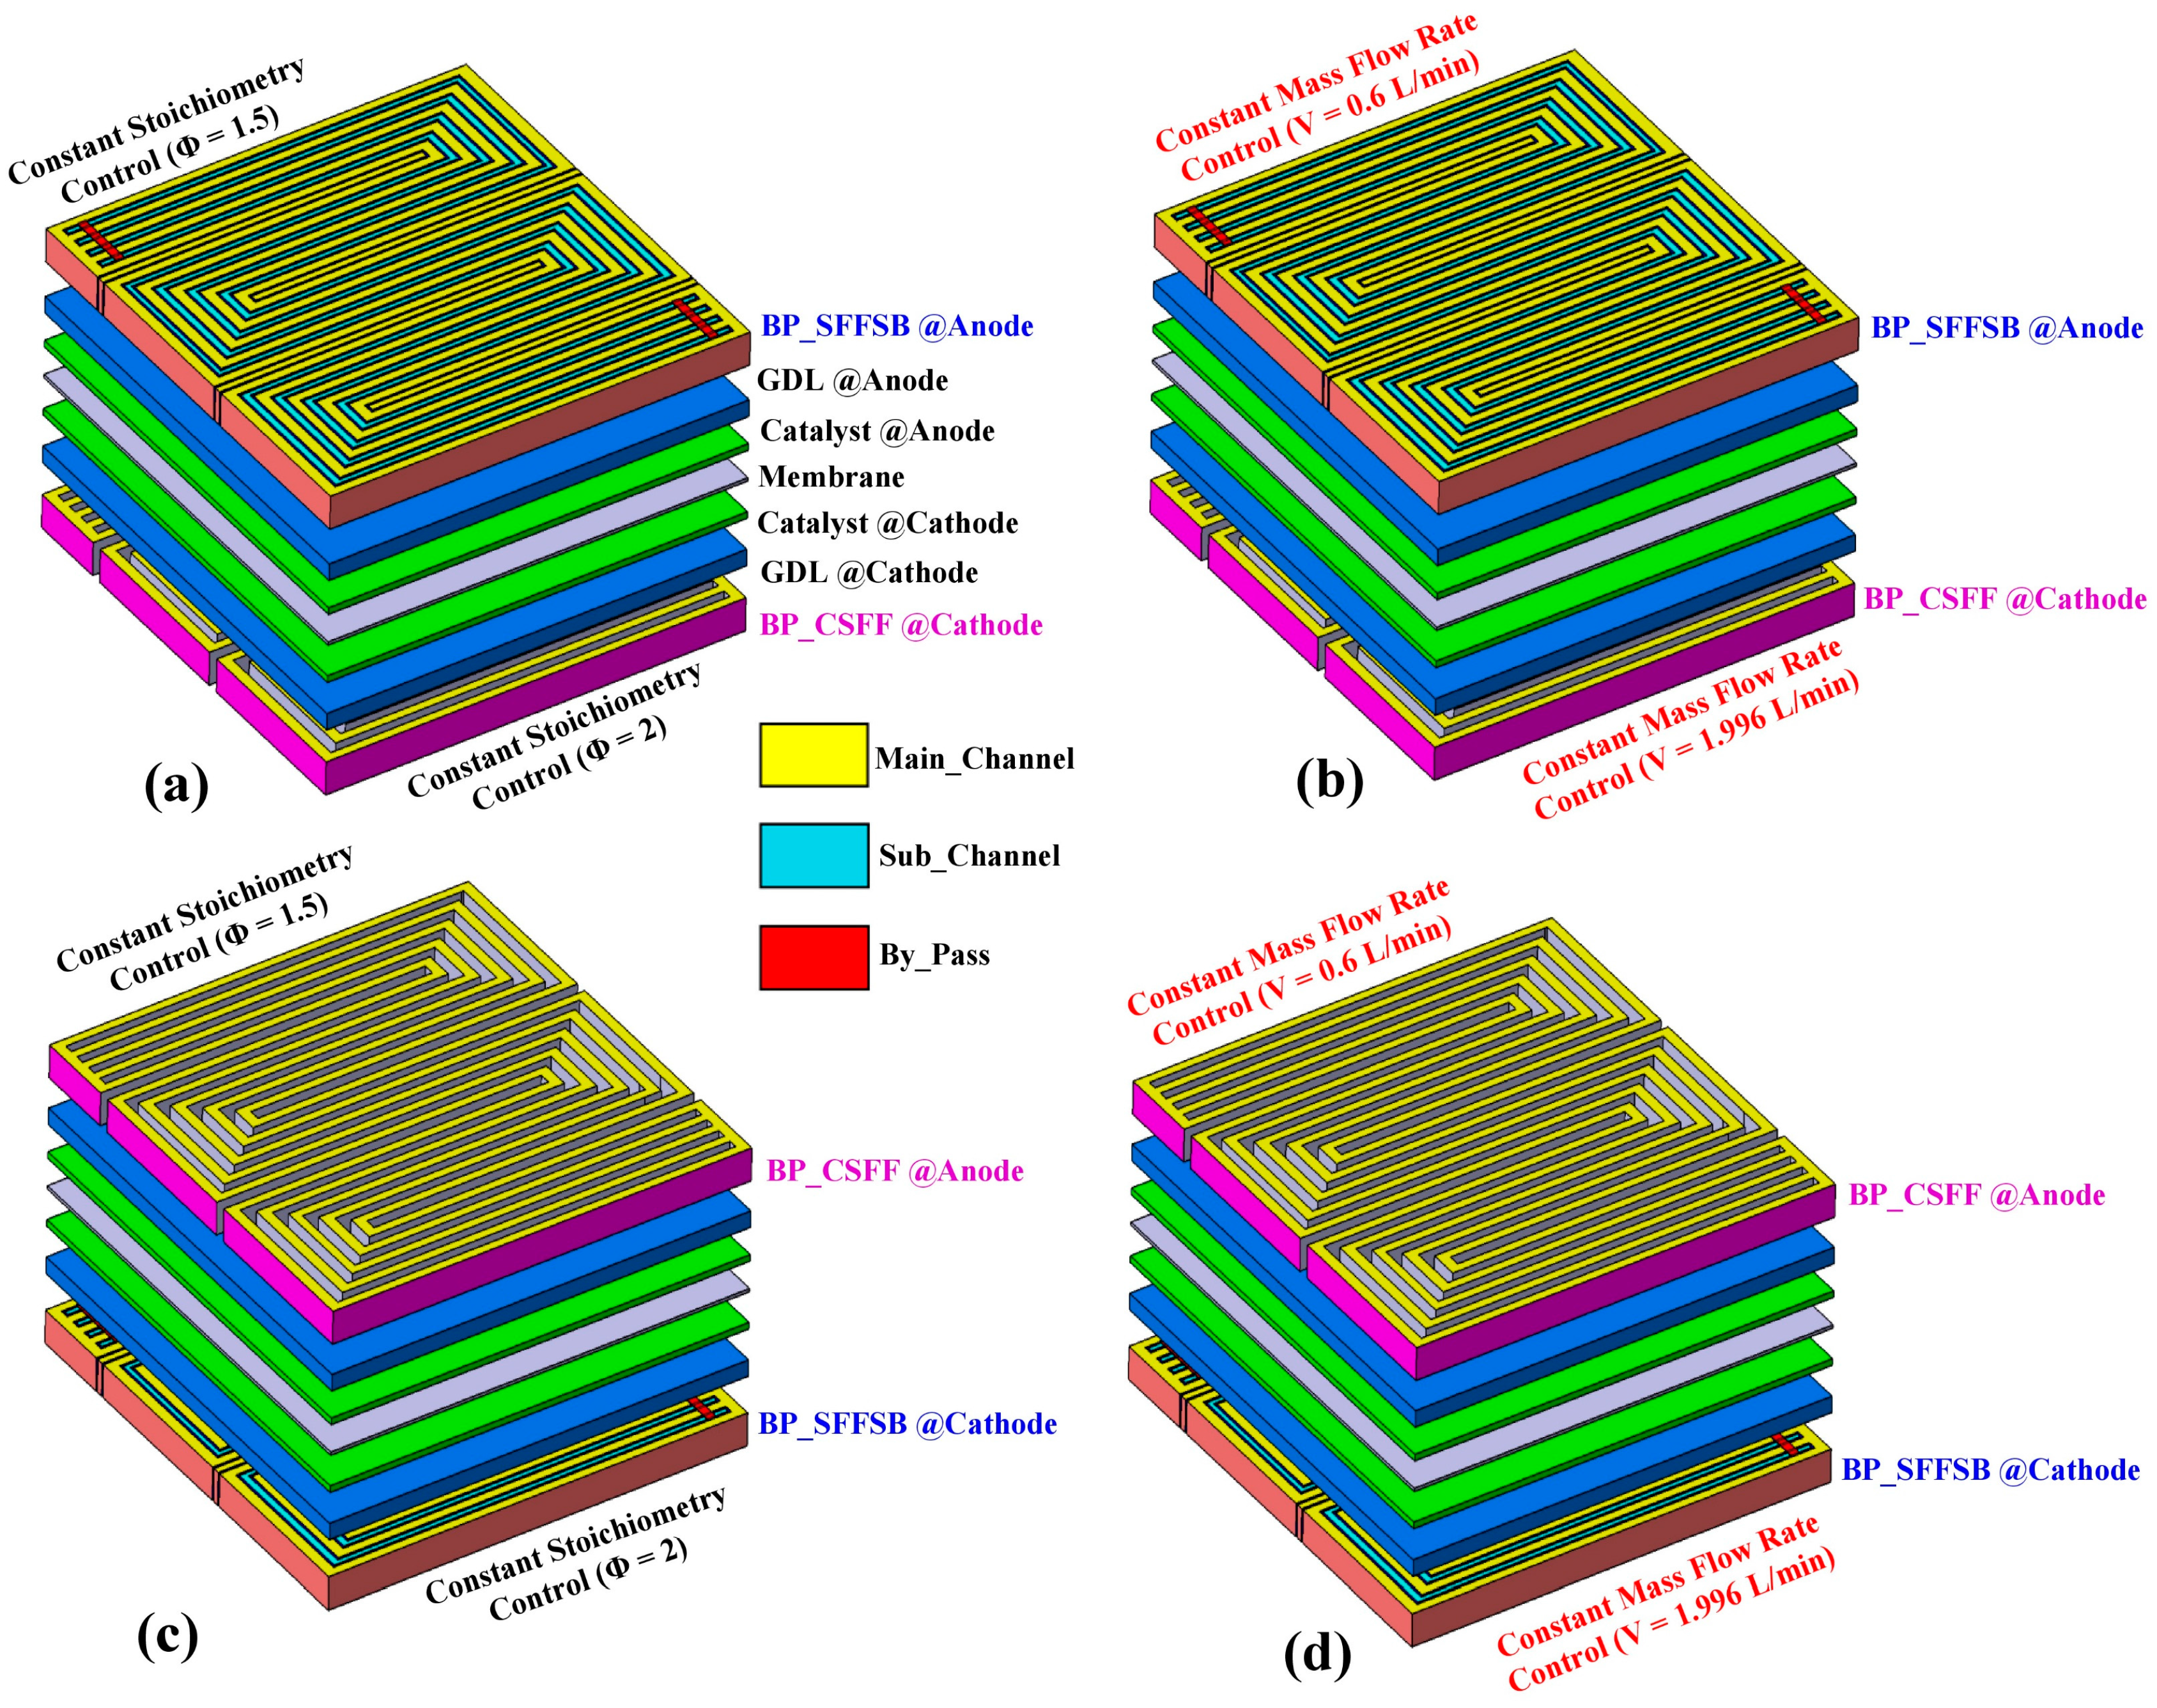
3.2. Simulation Model Description and Computational Domain

The geometric models of all parts of the PEMFCs were created using CATIA software (Dassault Systèmes, Vélizy-Villacoublay, France). The ANSYS Fluent® 15 PEMFC module was applied to solve the user-defined functions for a PEMFC. The computational domain, as shown in Figure 1, is composed of the anode and cathode BPs, anode/cathode gas channels, and MEA on a 25-cm2 active area [1]. The fuel cell operation is characterized as gas transport and transformation of one species to another [25]. The geometric details and other physical parameters of the cell components used in this research can be found in our previous papers [1,26,27,28] and are summarized in Table 1, Table 2 and Table 3.
Figure 2b shows the two serpentine flow-fields of CSFF and SFFSB with five channels on a 25-cm2 active area considered in this modeling. Through previous geometrical characterization of serpentine flow channels of various heights and widths, a CSFF was selected as a design standard. The geometric details of the above two flow-fields are listed in Table 1. As shown in Figure 1, numerical simulations were performed to compare the two configurations: (a) the configuration in which an SFFSB and a CSFF were used at the anode and the cathode, respectively; and (b) the configuration in which a CSFF and an SFFSB were used at the anode and the cathode, respectively.
Table 3 lists the values for the parameters used in this research. The physical properties of the materials (density, heat capacity, electric conductivity, thermal conductivity) were clarified from the cell supplier technical specifications and references [1,20,25,29]. The properties of the GDLs, catalysts and membrane were detailed as well in the technical data sheets.
In this research, the mesh generations based on hexahedron mesh were built by equalizing the node connectivity in each component. A detailed mesh independence analysis was conducted to assess the suitability of the meshing strategy and resolution. Consequently, approximately one million computational cells were involved in all geometries. In addition, the maximum skewness and aspect ratio of the meshes were limited to 0.5 and 20, respectively. The convergence criterions of the mass and energy balance were controlled to reduce to a value of less than 1 × 10⁻⁷ [1,26].

3.3. Operating Equations

PEM fuel cells operate under steady-state conditions and follow the ideal gas law. The gas flows are laminar, incompressible, and single-phase. The gas diffusion layers, catalyst layers, and membrane layer are isotropic materials. Serpentine channels and co-flow are assumed. The operating pressure is 101 kPa absolute, and the cell temperature is maintained at 343 K. The reactants are hydrogen-water vapor in the anode inlet and air-water vapor in the cathode inlet. The boundary conditions for the supplied gases are set as either constant mass flow rate or constant stoichiometry ratio. In the case of constant mass flow rate, the flow rates of both the anode inlet gas and the cathode inlet gas are kept constant during each experiment. The flow rates of air and hydrogen are maintained at 0.6 L/min and 1.996 L/min, respectively. In the case of constant stoichiometry ratio, the mass flow rates are adjusted according to the current densities to ensure a constant stoichiometry ratio of 1.5 for the anode inlet gas and 2 for the cathode inlet gas. Table 4 presents a summary of the boundary conditions used in the simulations.

4. Results and Discussion

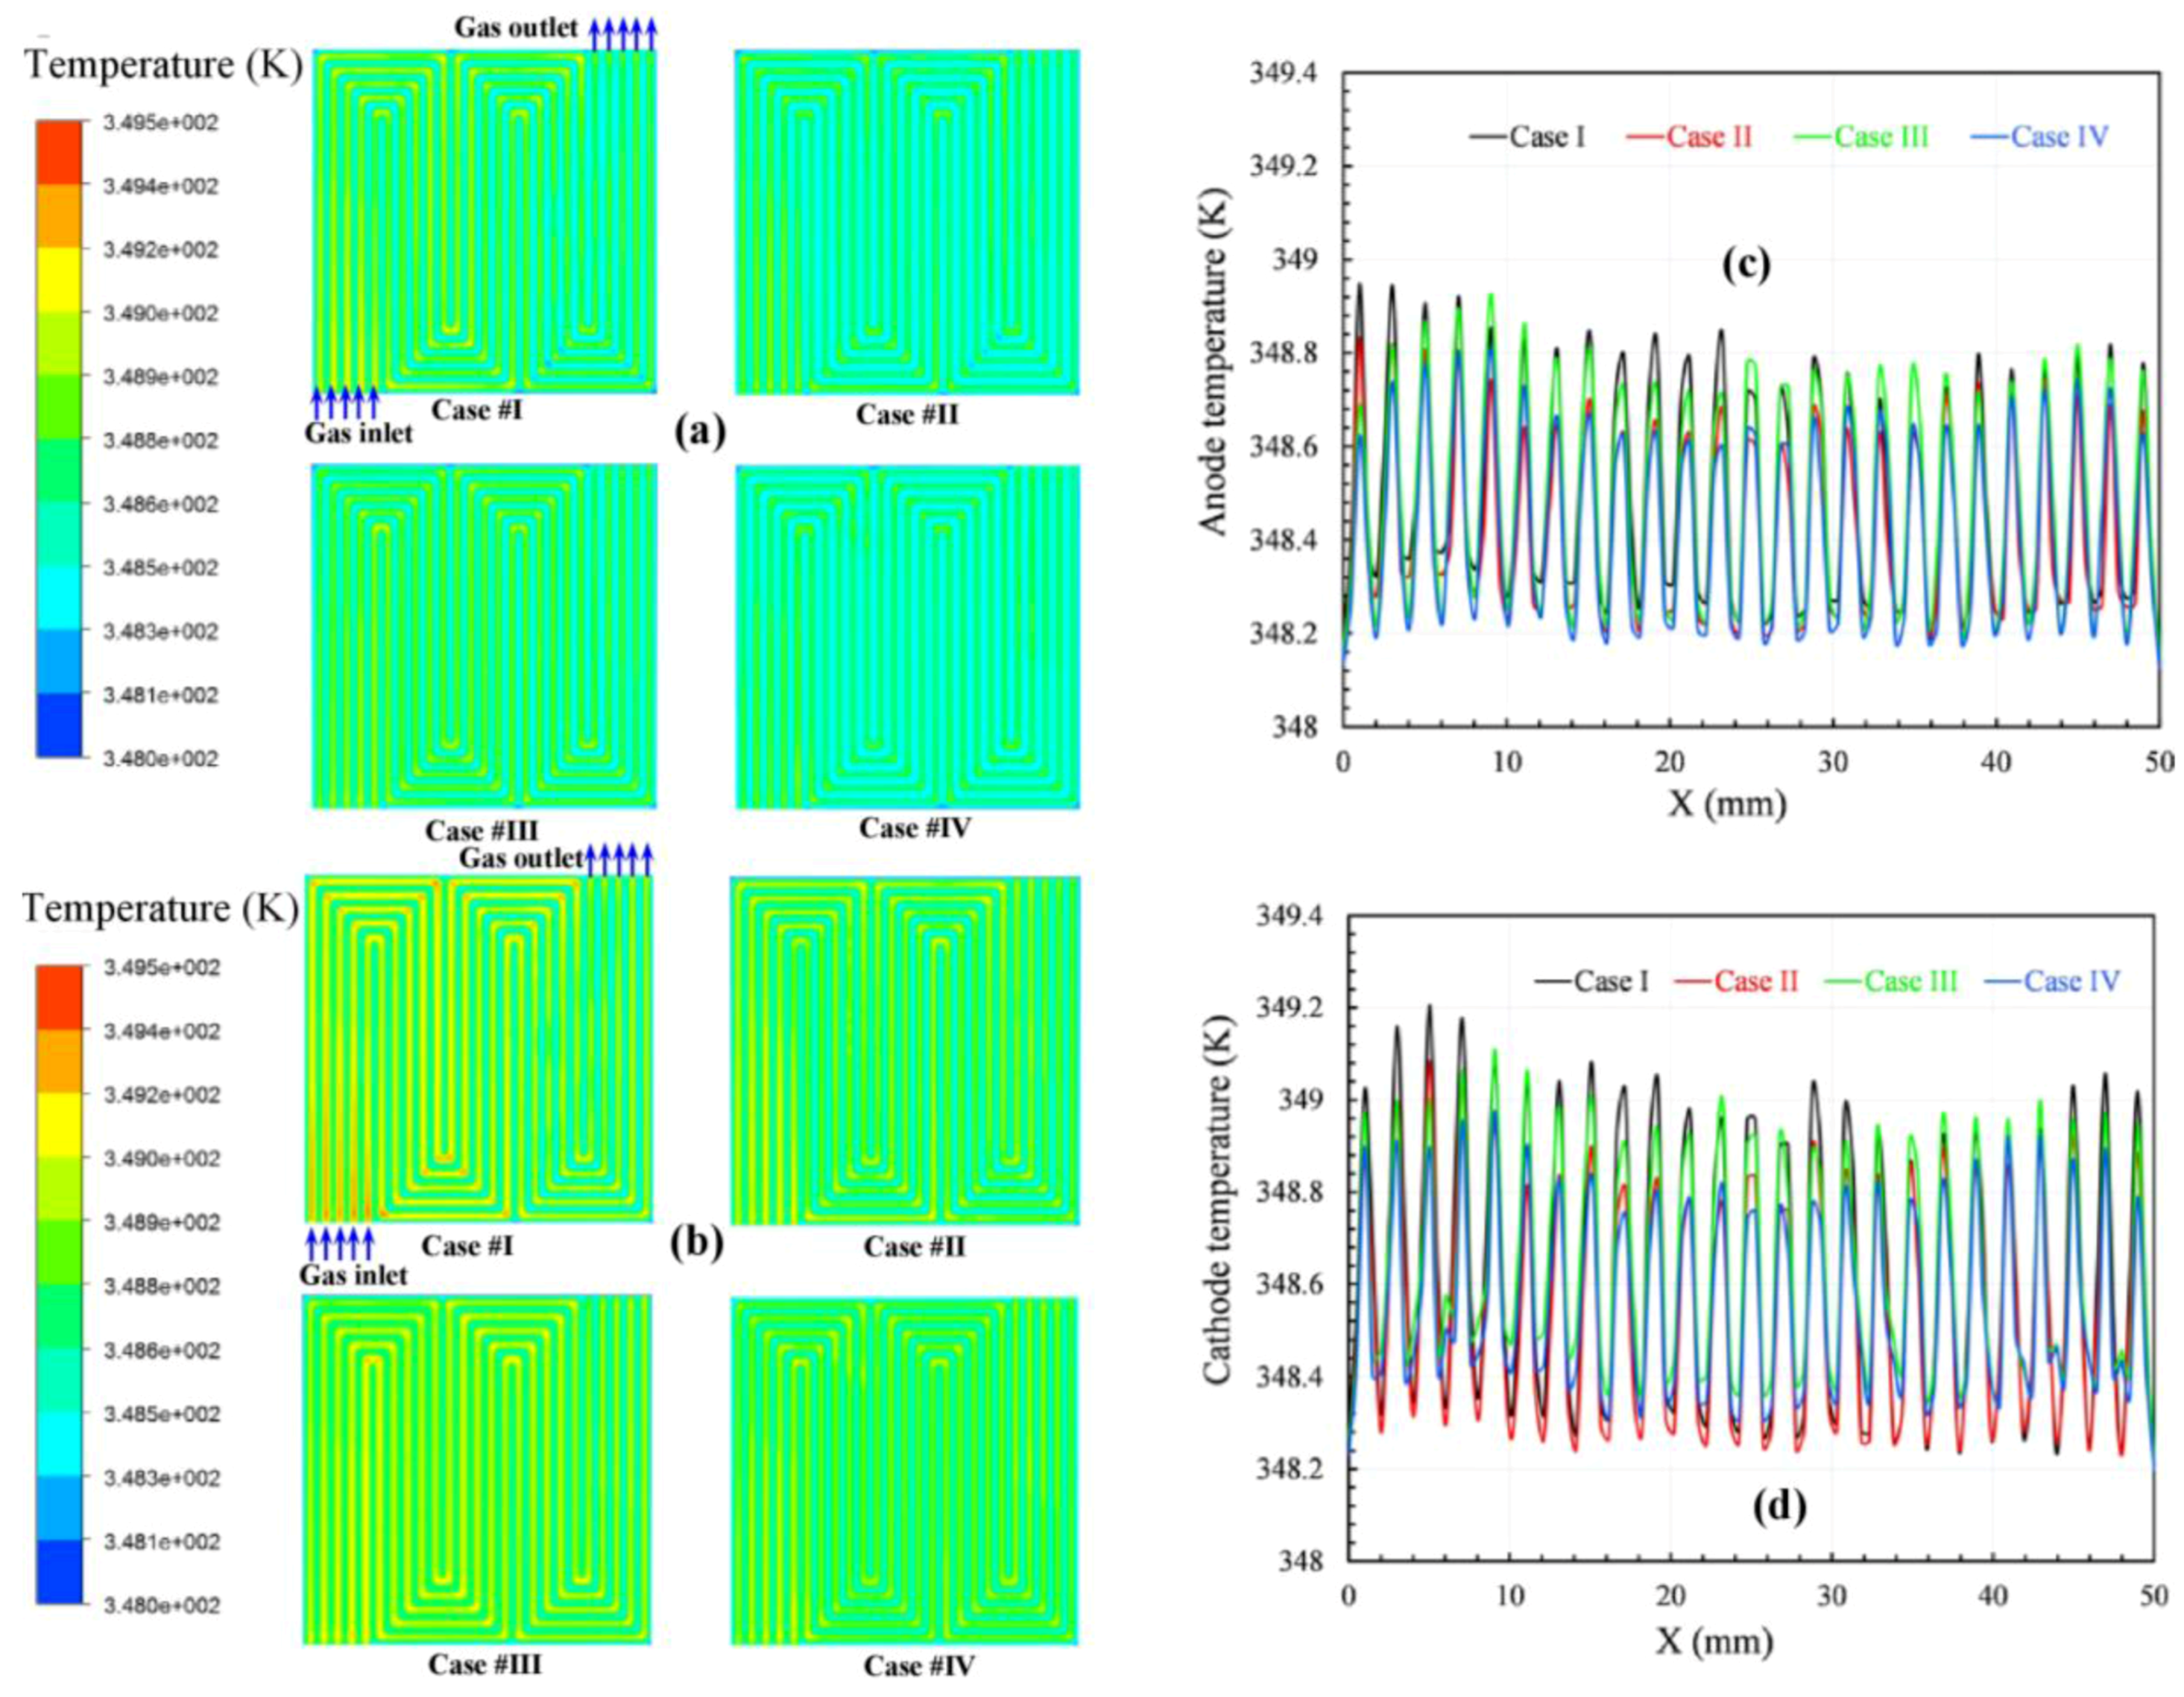
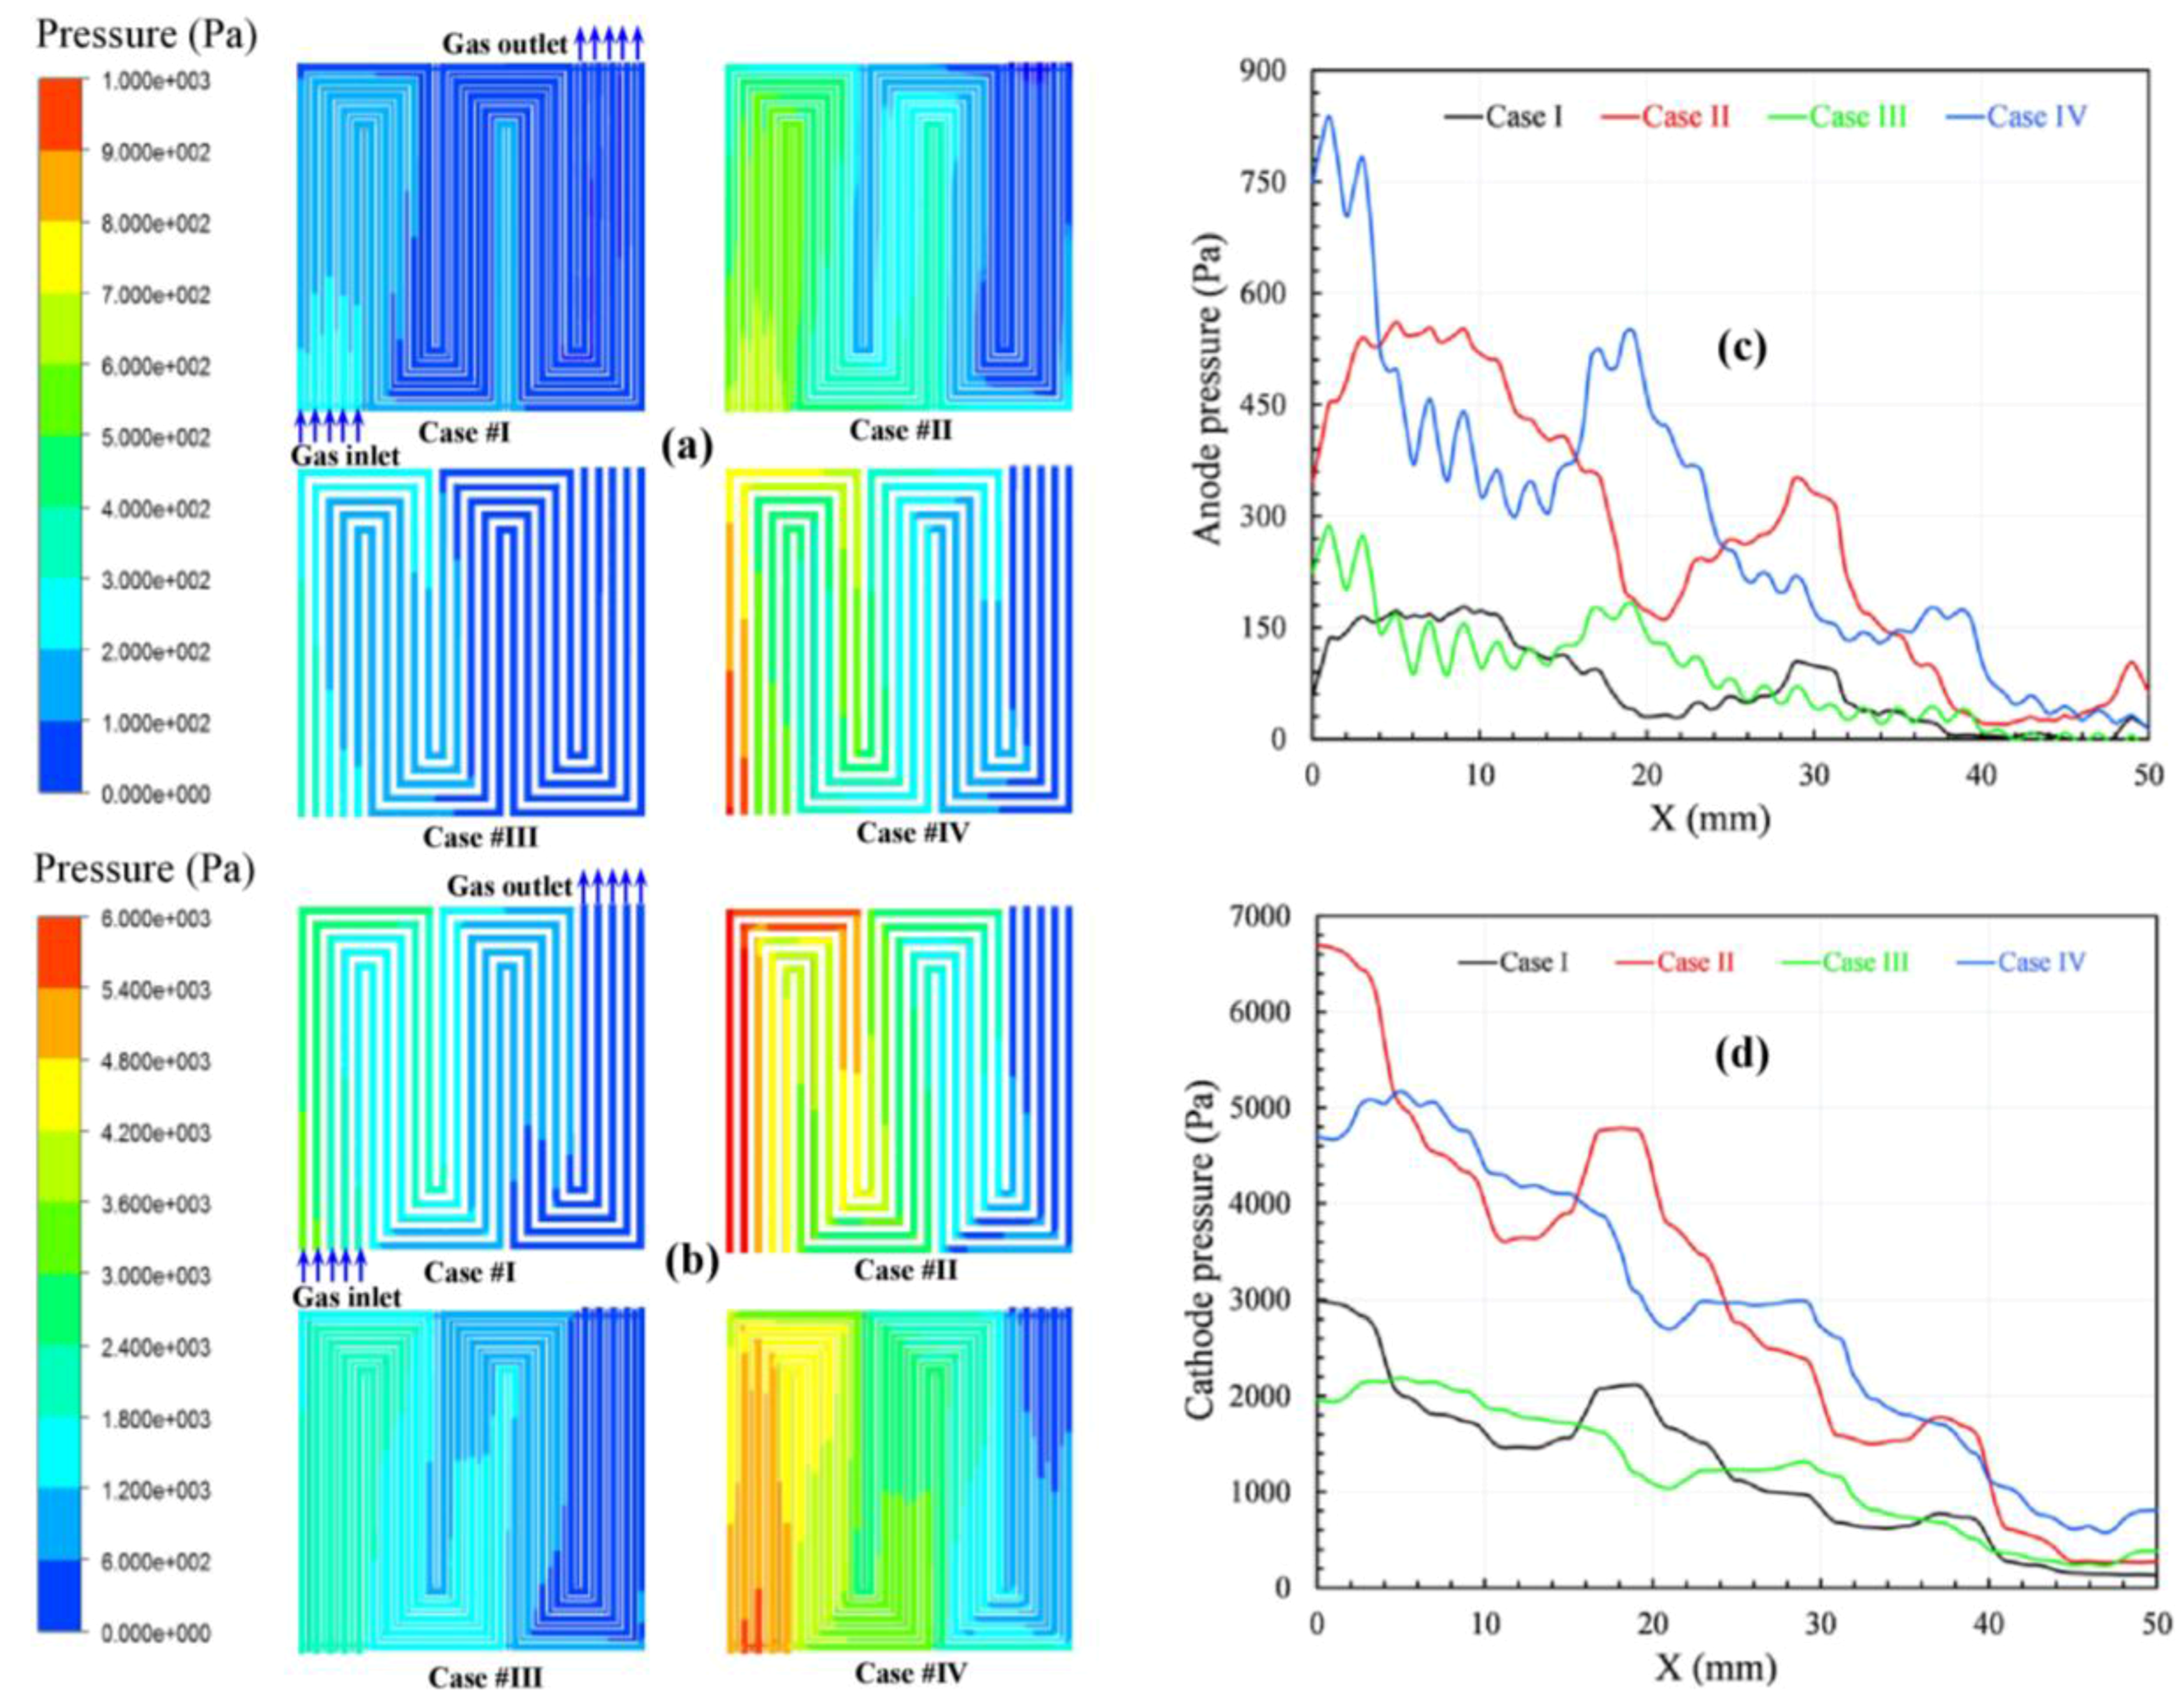
4.1. Effect of Flow-Field Design on Temperature and Pressure Distribution

The performance-related parameters of the temperature distributions and the temperatures along a reference location of the four simulation cases are compared at an average current density of 1.2 A/cm2, as shown in Figure 3. Generally, the temperature difference between the membrane surface and flow channel is less than 2 K. In addition, the temperature distributions along the flow path are uniform because the insulated boundary is on the top surfaces of both the cathode and anode side. Figure 3a,b show the temperature profiles at the membrane surfaces on the anode and cathode side along the flow path for configurations (a) and (b) with two different boundary conditions for the inlet gases, namely, a constant mass flow rate and a constant stoichiometry ratio. The local temperature depends on the electrochemical reaction rate, and this rate is usually governed by the reactant concentration, which varies along the channel. Generally, the temperature on the cathode side is higher than that on the anode side. Since the heat produced in the rib area is more easily transferred to the graphite block in comparison with the heat produced in the channels, then the temperature under the rib areas is lower than that under the adjacent channel areas. In addition, the heat released is also carried by the stream gases. Consequently, when comparing the same locations corresponding to a current density of 1.2 A/cm2, the temperatures of configurations I and III are higher than those of configurations II and IV because the mass flow rates of the gases in the case of constant mass flow rate are higher than in the case of constant stoichiometry ratios, as shown in Table 4. In addition, the temperature decreases from the inlet toward the outlet because the water formation increases along the axial flow channel due to the cooling of the liquid water at the outlet. The temperature distribution of configuration (b) is also more uniform than that of configuration (a). This finding suggests that applying SFFSB for the cathode bipolar plate better enhances heat transfer in fuel cells.
Figure 4 compares the pressure profiles on the anode and cathode channels at an average current density of 1.2 A/cm2. Generally, the pressure on the cathode side is higher than that on the anode side because of the higher mass flow rate of oxygen compared to hydrogen. Additionally, the total pressure decreases from the inlet toward the outlet in both the anode and cathode gas channels because of the pressure drop caused by the frictional and bending losses in the gas flow channel [1,26]. However, the total pressure fluctuates dramatically when considering the local positions due to the mutual effects of the channel areas and rib channel areas. The pressure drop at the corresponding location between the adjacent channels is substantial, and a significant pressure gradient is thus created across the porous electrode. This pressure gradient is much larger than that along the channel direction, which results in considerable cross-leakage flow between the adjacent channels. In fact, this flow generates a strong convection in the electrode; as a result, the reactant distribution and the water discharge are improved. This flow is responsible for the improvement in overall performance.

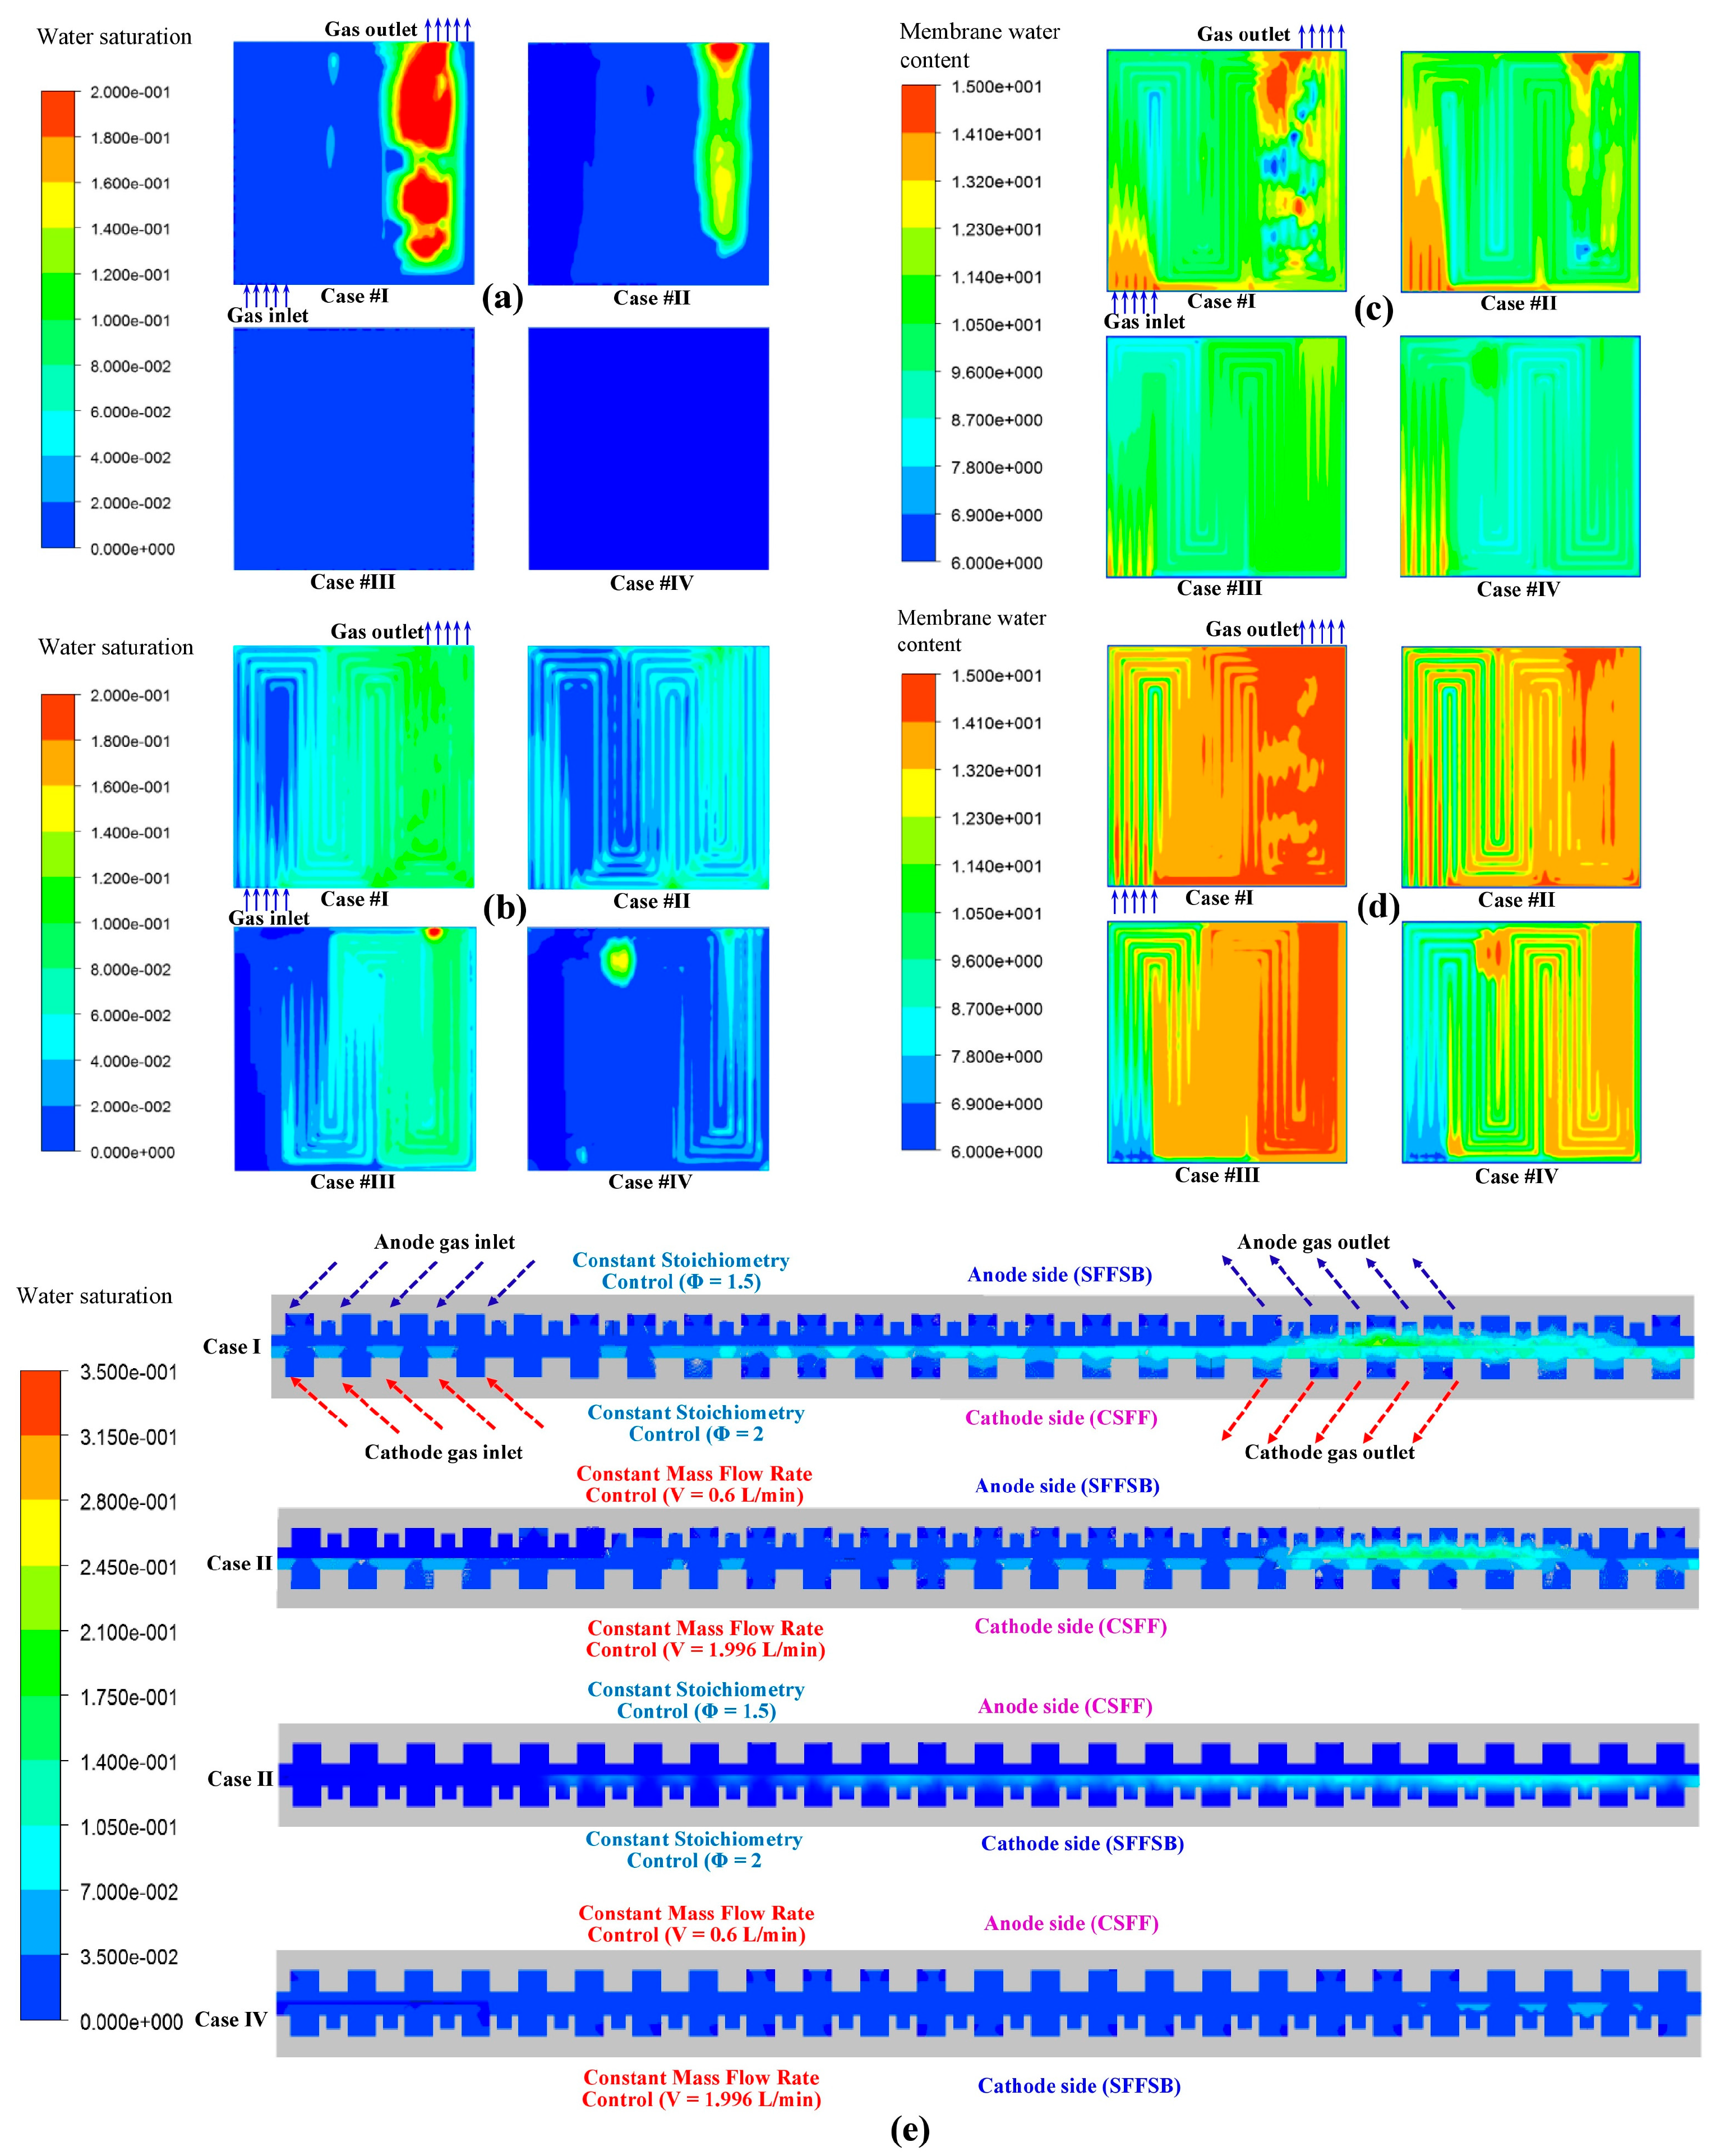
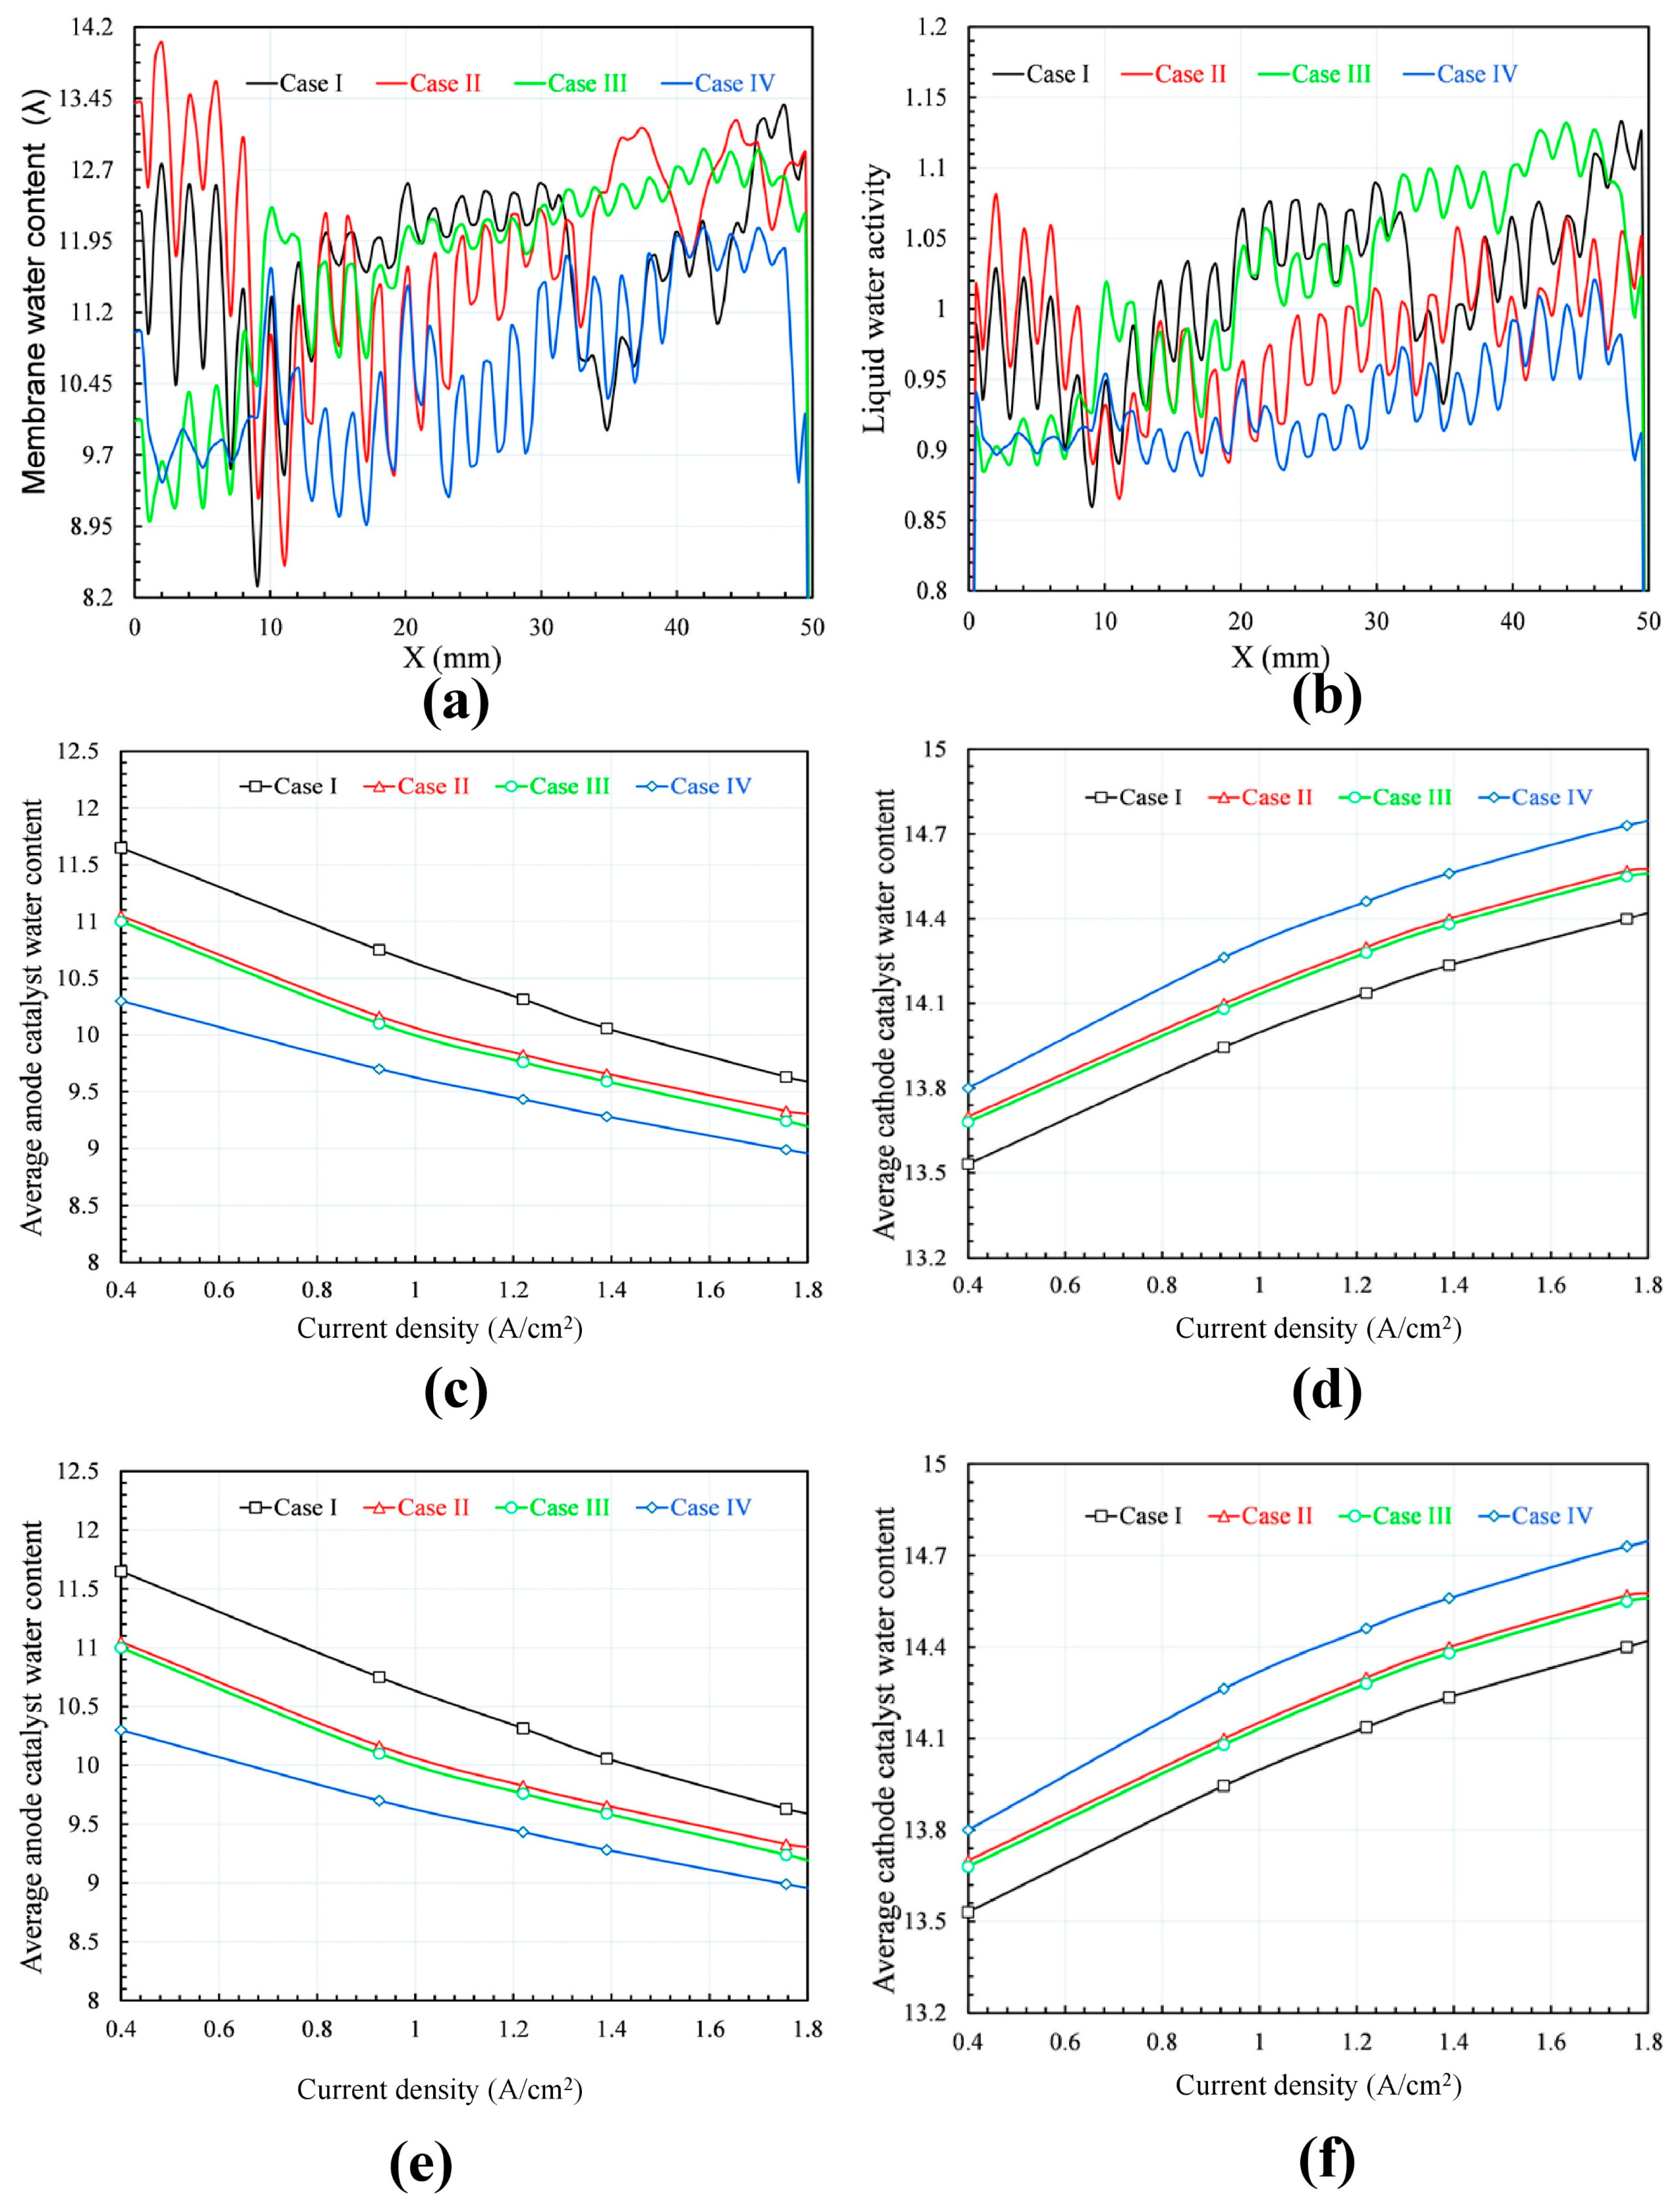
4.2. Effect of Flow-Field Design on Water Formation and Discharge

Because PEMFCs operate normally at temperatures significantly below 100 °C, the water vapor formed from chemical reactions may condense into the liquid phase, especially at high current densities. While the liquid water keeps the membrane hydrated, it also blocks the gas diffusion, reducing the diffusion rate and the effective reaction surface area and hence the PEMFC performance. In this numerical simulation, the formation and transport of liquid water are calculated by solving the conservation equation for the volume fraction of liquid water, which considers the capillary flow, the clogging of the porous media, and surface tension.
Figure 5a,b compares the liquid water distributions on the 25-cm2 active area of the anode and cathode membrane surfaces among the four configurations (I–IV) at an average current density of 1.2 A/cm2. The water saturation is negligible at the anode. However, there are some local areas of high water saturation for configurations I and II, when SFFSB and CSFF are used for the anode and cathode BPs, respectively. Meanwhile, the water saturation is dramatically high at the cathode side, especially the outlet area since the configuration of SFFSB plays a better role in discharging water formed in the cathode side than that of CAFF. The trend for the temperature profiles is observed for the water saturation as well; the water saturation of configurations I and III is higher than that of configurations II and IV because the lower mass flow rate of the supplied air leads to lower water discharges. These phenomena can be explained by the feature of PEMFC operation described in [1], where water is formed as a reaction product on the cathode side. Furthermore, water also reaches the membrane surface of the cathode side due to the osmotic water transport by the hydrated protons transferred from the anode side. This unilateral membrane water transport is compensated partially, but not completely, by the back diffusion of water because of the concentration gradient that develops. Anode dehydration is more serious at the inlet of the cell because of the higher water back-diffusion to the anode at the outlet of the cell, which is not surprising because the water content at the outlet of the cathode is higher due to water draining, and thus the back-diffusion is higher as well [30,31]. All these phenomena may lead to the huge difference in water saturation between the anode and cathode sides observed in Figure 5e. This difference hinders the improvement of fuel cell performance. Excess water at the cathode side leads to water flooding of the pores of the active layers through which oxygen reaches the catalyst. On the other hand, membrane dehydration on the anode side can increase the ohmic resistance and thereby decrease the discharge voltage of the cell [30,31].
The water content of the membrane is another important parameter for evaluating the water management of fuel cells. It is also determined by the balance between water formation and three water transport processes, including the water electro-osmotic drag, water back diffusion, and the diffusion of water to/from the oxidant/fuel gas streams, as mentioned in [32]. As cited in many studies, the membrane water content depends on the water activity, which is affected by the total pressure [1,29,31]. Use of a hydrophilic material is a major contributor to the membrane ionic conductivity ( σ mem ), which is related to the membrane water content ( λ ) and the water activity ( a k ) such that [1,18,24].
λ = 0.043 + 17.8 a k 39.85 a k 2 + 36.0 a k 3 ( 0 a k < 1 ) = 14.0 + 1.4 ( a k 1 ) ( 1 a k 3 )
a k = x w , k P ( x , y ) P w , k s a t
σ mem = ( 0.514 λ 0.326 ) exp [ 1268 ( 1 303 1 T ( x , y ) ]
where P w , k s a t is the vapor pressure of water in stream k, x w , k is the mole fraction of water in stream k, P ( x , y ) is the pressure in Pa and T ( x , y ) is the diffusion temperature in K.
Water activity is defined based on the total water or super-saturated water vapor and used in the membrane hydration model to determine water transport through the membrane. Water is transported from the membrane to the channel via a GDL as a gas and a liquid; therefore, under-saturated and saturated conditions should be considered separately. Under the under-saturated conditions, the water vapor transport direction depends on the relative humidity in the channel and that at the membrane/GDL interface. Under the saturated conditions, water generated in the catalyst layer will be transported through the GDL in liquid form. The liquid water in the GDL not only provides higher resistance to gas diffusion but also covers some of the activation sites on the catalyst layer, reducing the cell voltage [33]. Figure 5b shows that the liquid water activity fluctuates between the peak under the channels and the trough under the ribs, and the variation increases from the inlet toward the outlet. The liquid water activity directly affects the membrane water content as described in Equation (1).
Figure 5c,d shows the water content distributions on the anode and cathode sides of the membrane. Generally, since much of the water formed at the GDL and rib area is absorbed into the membrane by under-rib convection, then the water content under the rib is higher than that under the adjacent channel. Under-rib convection is the same process as cross-leakage flow [28]. On the membrane’s cathode side, the water content increases from the inlet toward the outlet because the decrease of total pressure affects the water discharge conducted by the air flow. The effect of flow gases on the membrane water content is also obvious, causing the membrane water contents of configurations I and II to be higher than those of configurations III and IV due to the difference in mass flow rate of the supplied gases. The SFFSB prevails against CSFF in contributing to the improvement of water discharge on both the anode and cathode membrane sides; as a result, the water distribution of the membrane water contents of configurations III and IV are more uniform than those of configurations I and II. The average water contents of the membrane, anode, and cathode catalysts are compared for the four configurations (I–IV) at various current densities in Figure 6c–e. The water content increases from the anode to the cathode and peaks at the cathode catalyst because the contents of the membranes and the anode catalysts are inversely proportional to the current density [1,29]. However, the trend is opposite in the cathode catalysts, where the water content increases with increasing current density. These phenomena can be explained as follows. An increasing current density results in an increase in the amount of water in the cathode catalyst because the back diffusion is not sufficiently high to compensate for the electro-osmotic drag in drying at the anode, and the anode drying is faster than the velocity of moving water [13]. For a fully humidified condition, a membrane water content value of λ = 14 is appropriate, as defined in Equation (1); therefore, it is assumed that flooding occurs at values of λ over 14 [1,27]. All the simulation results show that the average water content of the membrane is less than 14; thus, water flooding is predicted to be insignificant at the membranes. However, it may still occur in some local areas of the membrane and cathode catalyst areas where the water contents are very high despite the average water content of the whole being significantly less than the value of λ = 14, especially under high current density and low mass flow rate of the supplied gases. Indeed, as shown in Figure 6d, there are significant areas of the membrane cathode side of configurations I and III with water contents greater than 14. Additionally, there are some small areas of configuration II situated at the outlet zone where the membrane water content is higher than 14; meanwhile, membrane configuration I is dry enough to prevent flooding in all parts of the membrane due to the effective contribution of the SFFSB configuration.
The ionic conductivity membrane modeled by Equation (3) plays an important role in PEMFC operation, as it functions as a fuel and oxygen barrier and as a proton transport path from the anode to cathode to complete the reaction. The ionic conductivity of the membrane depends on the water content and is highest when the membrane is fully saturated [1]. As mentioned above, water is produced from the cell reactions as liquid and should be removed from the fuel cell. Too much water in the cell will cause the flooding of the electrodes and reduce gas diffusion. However, too little water in the cell will result in the dehydration of the membrane and a reduction in ionic conductivity. As shown in Figure 6e,f, the water content of the anode catalysts and the membranes of configurations I and II are somewhat higher than those of configurations III and IV, respectively; as a result, the average membrane conductivities of the four simulation cases also vary according to the same trends.

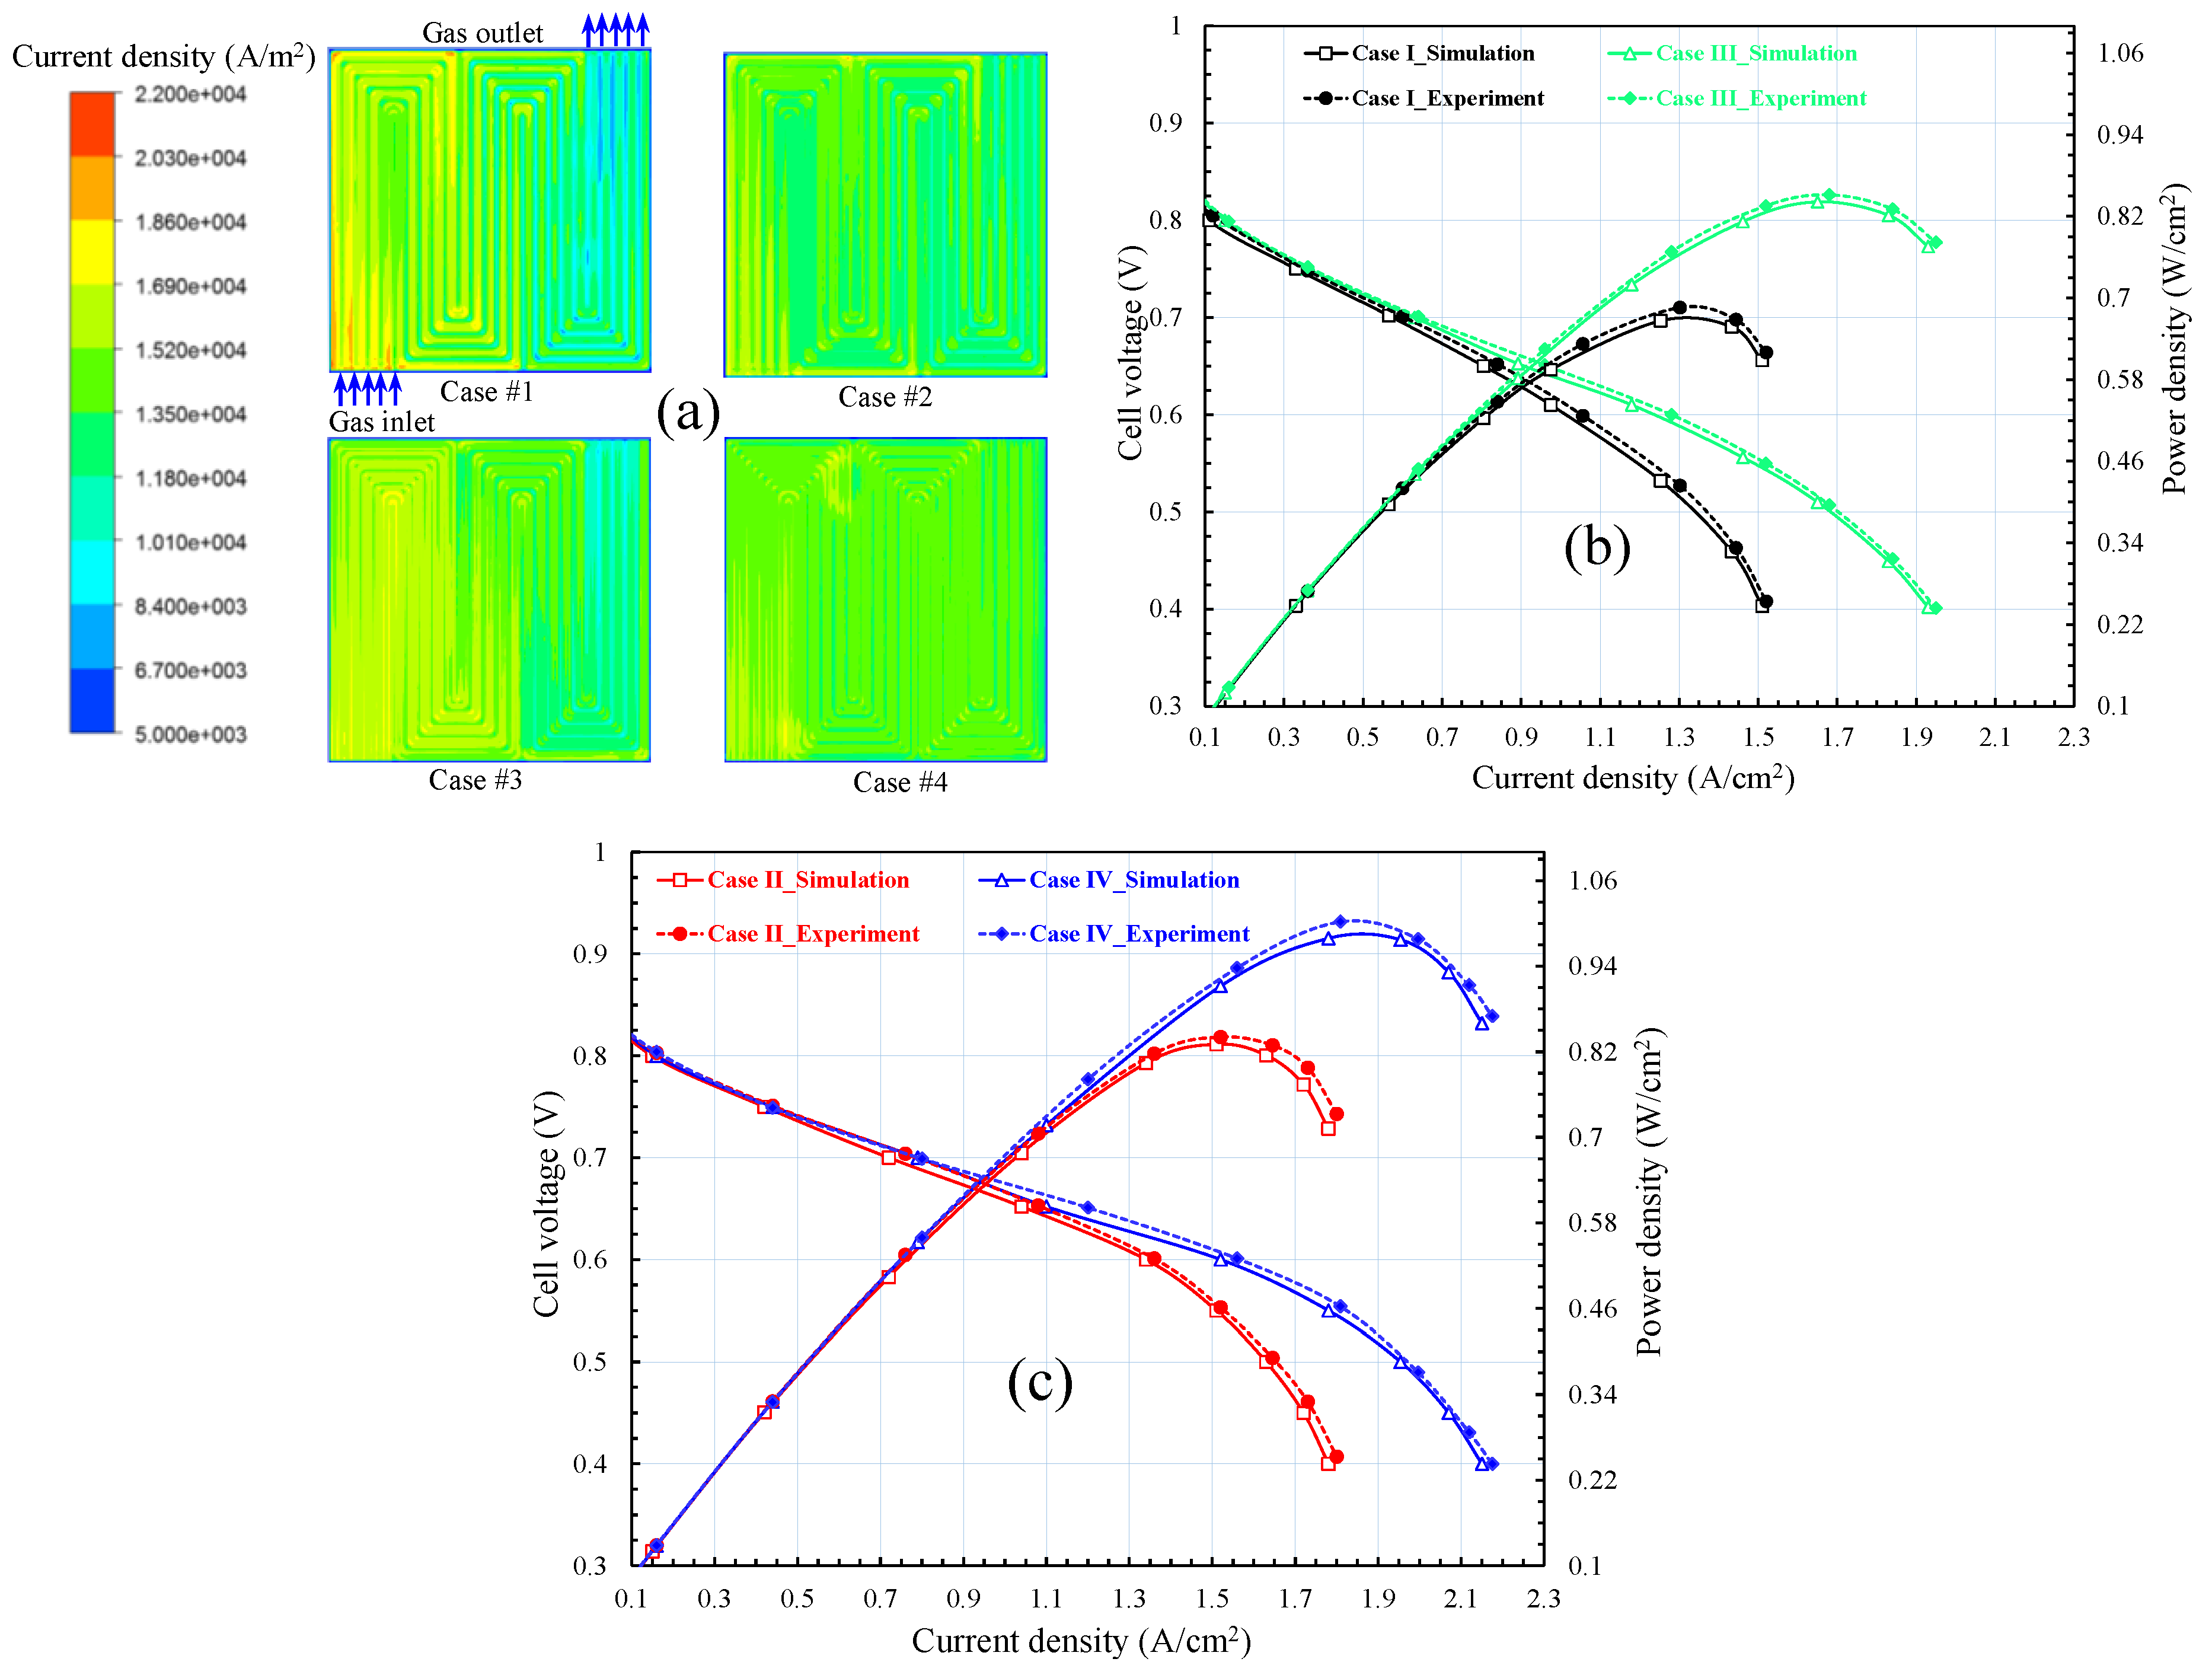
4.3. Effect of Flow-Field Design on Fuel Cell Performance

Figure 7a presents the current density distributions on the MEA surface of the four simulated configurations I to IV at an average current density of 1.2 A/cm2. Generally, the local current density degrades from the inlet toward the outlet because of the reduction of reacting gases. However, the current density distributions are changed because the different flow-field configurations have uneven electrochemical reactions. The average current densities of four simulation cases at 1.2 A/cm2 are respectively 0.5199 V, 0.5210 V, 0.5588 V, and 0.5599 V. When the current density is constant, the differences of the cell voltages between these cases may be attributed to the differences of pressure drop, water concentration, and membrane conductivity among those which relate directly to water content and liquid water saturation of catalyst and membrane [1]. Compared to the other cases, the membrane current density distribution of configuration IV is the most uniform. Meanwhile, the distribution is very non-uniform in configuration I especially not only between the inlet and outlet area but also the rib and channel area. In configuration III, the distribution of the inlet area is also slightly higher than the outlet area; however, the differences between the local rib and neighboring flow-channels areas are not significant. A highly uniform current distribution can also be observed in configuration II when the differences in current density contribution throughout all areas are small. These results prove that the SFFSB configuration of the cathode BP contributes positively to the uniform current density distribution; meanwhile, its role when applying to the anode BP is ambiguous. SFFSB prevails against CSFF in contributing to the improvement of water discharge in the cathode side where water is formed through the recombination and subsequent reaction between hydrogen ions, electrons and oxygen; as a result, reaction gases may penetrate throughout all the catalytic surface areas without the obstruction from water flooding to react and create electricity. In addition, the high gas flow rate also plays an important role in the water discharge and transfer of the reacting gases to the catalyst surface; thus, the current density distributions of configurations II and IV are more uniform than those of configurations I and III.
Figure 7b,c shows the polarization and power density curves of different configurations I–IV obtained by numerical simulation and experimental test according to the different boundary conditions of the flow gases. Generally, the result reveals that the power densities of configurations III and IV are higher in comparison with the flow-field configurations I and II. Maximum power densities of the four simulation configurations I–IV are 0.6665 W/cm2, 0.8305 W/cm2, 0.8415 W/cm2, and 0.9790 W/cm2, respectively. Meanwhile, these values are slightly higher in the experiment with the same boundary condition tests. In addition, there is always a good agreement between the experimental and simulation results for the cell voltage and power density curves at every test point when the maximum difference is only approximately 5%. As mentioned in [1], small variations between the experimental and simulated data can be a result of the assumptions of the simulation process; however, these assumptions cannot be controlled in the experiments. Furthermore, many important imported parameters used in the simulations are very difficult to verify in the experiment. Nonetheless, the simulations are still helpful for predicting the trends of the polarization, power density curves, and physical transport phenomena occurring within the fuel cell.
As shown in Figure 7, corresponding to the boundary conditions of constant stoichiometry control and constant mass flow rate control, the fuel cell performance is different. In case of constant stoichiometry control applied to configurations I and III, the constant stoichiometry ratios of supply gases were controlled by the values of 1.5 and 2 corresponding to the anode and cathode inlet boundary conditions, respectively. In general, the power densities of configuration III are dramatically higher than configuration I when comparing at the same current density. These results can be explained by the effects of CSFF and SFFSB on gas-flow contribution, water discharge, and other physical transport phenomena occurring within the fuel cell. The adoption of SFFSB at the cathode bipolar plate increases the output power density because when inserting sub-channels between the main channels, a shorter distance between channels results in a lower resistance to flow through the porous media and therefore increases the flow rate between adjacent channels. In addition, reducing the space between channels, even locally, improves the flow rate between channels. Consequently, the under-rib convection flows from the main channel toward the adjacent rib because of the pressure difference, which causes changes in that the internal pressure is reduced by the diffusion of reacting gases, water behavior, uniform temperature, and current density distribution [1,26]. Compared to CSFF, SFFSB makes a feature of low pressure at the entrance; therefore, it shows a better characteristic than that of CSFF due to the reacting gases transfer being closer to the exit, which generates a more effective utilization of the electrocatalysts by improving the mass transfer rates of the reactants from the flow channel to the inner catalyst layer. However, as mentioned above, the role of SFFSB prevails in the cathode side when it minimizes the pressure drop and facilitates the discharge of liquid water to reduce the water flooding. Meanwhile, its role in the anode side was not obvious because the water is only generated at the cathode–electrolyte interface by the electrochemical reaction, the water concentration therefore tends to be higher at the cathode side and water transport from the cathode side to the anode side is by back diffusion. This is in the opposite direction to the water transport caused by the electro-osmotic drag of protons from the anode side to the cathode side. However, electro-osmotic drag in a PEM fuel cell often dominates over the back diffusion and causes drying of the membrane at the anode side and results in the higher accumulation of water or the so-called flooding of the membrane at the cathode side. For these reasons, when applying the SFFSB for the cathode BP it will increase the water discharge; however, anode drying may occur when the SFFSB is applied to the anode BP. Nevertheless, in the case of using the CSFF for the cathode BP, cathode flooding can be serious due to its lack of contribution to water discharge. While drying of the membrane significantly reduces the proton transport in the membrane, flooding of the membrane at the cathode side prevents oxygen reactant gas from reaching the cathode–electrolyte interface for the electrochemical reaction, which dramatically reduces the fuel cell performance. To overcome the cathode flooding, some studies suggested that the PEM fuel cell should be maintained at a higher pressure at the cathode side. This means that high mass flow rates of inlet gases should be supplied. Indeed, both the simulation and experimental results of this research show that the power densities of configurations II and IV are higher than those of configurations I and III, respectively, due to the higher mass flow rates of inlet gases of configurations II and IV as described above.

5. Conclusions

This study shows how an increased number of sub-channels and by-passes in a common serpentine flow field may affect the gas transport under the ribs, with the expected improvement in the fuel cell performance. Consequently, the effects of flow-field designs in BPs and various boundary conditions, including constant stoichiometry and constant mass flow rate, on the fuel cell operation were investigated to study the physical transport phenomena occurring within the fuel cell in order to enhance fuel cell performance. The configurations of BPs used for the numerical analysis were CSFF, consisting of only the main channels, and SFFSB, consisting of the main channels, sub-channels, and by-passes. These configurations were applied flexibly to the anode and cathode BPs to develop suitable electrode configurations to enhance the fuel cell performance. In addition, the effects of various boundary conditions of mass flow gas control, such as constant stoichiometry and constant mass flow rate, on PEMFC operation were investigated. Consequently, numerical and experimental work was conducted on the following four cases: configurations I and II, in which an SFFSB and a CSFF were used at the anode and the cathode, respectively, and configurations III and IV, in which a CSFF and an SFFSB were used at the anode and the cathode, respectively. The stoichiometry ratios of the supply gases were held constant in configurations I and III, and the mass flow rates were held constant in configurations II and IV.
The results showed that the CSFF and SFFSB configurations play an important role in generating the power density and physical transport within the fuel cell. When applying the SFFSB for the anode bipolar plate, the flow direction of the under-rib convection changed from the main channel to the sub-channel, dragging water generated in the rib area to the sub-channel and discharging it toward the outlet. As a result, water flooding can be reduced and the water distribution becomes more uniform. Meanwhile, if the CSFF is used for the anode BP, its role is not clear due to the lack of water at the anode side, as analyzed above. As a result, the distributions of the temperature, current density, membrane water contents, and saturation in configurations III and IV are more uniform than those in configurations I and II, respectively. The effect of the mass flow gases on these parameters is also strong, resulting in the higher uniformity of the distributions for configurations II and IV relative to configurations I and III due to the higher mass flow rate of supply gases in configurations II and IV.
In this study, the simulation results were validated by comparison with the experimental results through the evaluation of the coincidence of the polarization and the power density curves obtained for configurations I–IV. Both the numerical and experimental results reveal that the power densities of configurations III and IV are higher in comparison with the flow-field configurations I and II. The maximum power densities of the four simulation configurations (I–IV) are 0.6665 W/cm2, 0.8305 W/cm2, 0.8415 W/cm2, and 0.9790 W/cm2, respectively. Meanwhile, these values are slightly higher in the experiments with the same boundary condition tests. In addition, the experimental and simulation results for the cell voltage and power density curves always agree well at each test point when the maximum difference is only approximately 5%.
The findings in this work provide a foundation for optimizing the design of the under-rib convection-driven flow-field for efficient PEMFCs. High cell voltage and uniform current density can be maintained by utilizing the benefits of SFFSB, which minimizes the pressure drop and facilitates the discharge of liquid water. Future research will focus on enhancing the PEMFC performance by optimizing the operation parameters, such as temperature, mass flow rates of inlet gases, and supply gas humidity. In addition, the effect of gravity and flow gas direction will also be studied to investigate the entire PEMFC operation.

Acknowledgments

This work was supported by the 2016 Post-doctoral Research Program of Inje University.

Author Contributions

Experimental design was by Nguyen Duy Vinh and Hyung-Man Kim, fieldwork was by Nguyen Duy Vinh, statistical analyses were Hyung-Man Kim. Nguyen Duy Vinh and Hyung-Man Kim contributed to the writing of the paper.

Conflicts of Interest

The authors declare no conflict of interest.

References

  1. Nguyen, V.D.; Lee, J.K.; Kim, K.C.; Ahn, J.W.; Park, S.H.; Kim, T.U.; Kim, H.M. Dynamic simulations of under-rib convection-driven flow-field configurations and comparison with experiment in polymer electrolyte membrane fuel cells. J. Power Sources 2015, 293, 447–457. [Google Scholar]
  2. Scott, H.; Amrit, C.; Robert, S.W. Fuel cell added value for early market applications. J. Power Sources 2015, 287, 297–306. [Google Scholar]
  3. Li, X.; Sabir, I. Review of bipolar plates in PEM fuel cells: Flow-field designs. Int. J. Hydrog. Energy 2005, 30, 359–371. [Google Scholar] [CrossRef]
  4. Óscar, G.E.; Teresa, J.L.; Emilio, N.A. Fuel cells: A real option for unmanned aerial vehicles propulsion. Sci. World J. 2014, 1. [Google Scholar] [CrossRef]
  5. Li, H.; Tang, Y.H.; Wang, Z.W.; Shi, Z.; Zhang, J.L.; Fatih, K.L.; Zhang, J.J.; Wang, H.J.; Liu, Z.H.; Abouatallah, R.; et al. A review of water flooding issues in the proton exchange membrane fuel cell. J. Power Sources 2008, 178, 103–117. [Google Scholar] [CrossRef]
  6. Iranzo, A.; Boillat, P.; Biesdorf, J.; Tapia, E.; Salva, A.; Guerra, J. Liquid water preferential accumulation in channels of PEM fuel cells with multiple serpentine flow fields. Int. J. Hydrog. Energy 2014, 39, 15687–15695. [Google Scholar] [CrossRef]
  7. Anderson, R.; Zhang, L.; Ding, Y.; Blanco, M.; Bi, X.; Wilkinson, D.P. A critical review of two-phase flow in gas flow channels of proton exchange. J. Power Sources 2010, 195, 4531–4553. [Google Scholar] [CrossRef]
  8. Hontaon, E.; Escudero, M.J.; Bautista, C.; Garcia-Ybarra, P.L.; Daza, L. Optimisation of flow-field in polymer electrolyte membrane fuel cells using computational fluid dynamics techniques. J. Power Sources 2000, 86, 363–368. [Google Scholar] [CrossRef]
  9. Gurau, V.; Zawodzinski, T.A.; Mann, J.A. Two-phase transport in PEM fuel cell cathodes. J. Fuel Cell Sci. Technol. 2008, 5, 21009–21012. [Google Scholar] [CrossRef]
  10. Gurau, V.; Mann, J.A. Effect of interfacial phenomena at the gas diffusion layer-channel interface on the water evolution in a PEMFC. J. Electrochem. Soc. 2009, 157, B512–B521. [Google Scholar] [CrossRef]
  11. Xu, C.; Zhao, T.S. A new flow field design for polymer electrolyte-based fuel cells. Electrochem. Commun. 2007, 9, 497–503. [Google Scholar] [CrossRef]
  12. Chen, F.C.; Gao, Z.; Loutfy, R.O.; Hecht, M. Analysis of optimal heat transfer in a PEM fuel cell cooling plate. Fuel Cells 2003, 3, 181–188. [Google Scholar] [CrossRef]
  13. Choi, J.; Kim, Y.H.; Lee, Y.; Lee, K.J.; Kim, Y. Numerical analysis on the performance of cooling plates in a PEFC. J. Mech. Sci. Technol. 2008, 22, 1417–1425. [Google Scholar] [CrossRef]
  14. Kaufman, A.; Terry, P.L. Hydrogen-Air Fuel Cell. U.S. Patent 5,776,625, 7 July 1998. [Google Scholar]
  15. Qi, Z.; Kaufman, A. PEM fuel cell stacks operated under dry-reactant conditions. J. Power Sources 2002, 109, 469–476. [Google Scholar] [CrossRef]
  16. Nguyen, V.D.; Lee, J.K.; Kim, K.C.; Ahn, J.W.; Park, S.H.; Kim, T.U.; Kim, H.M. Parametric simulations of optimum flow-field configuration for efficient proton exchange membrane fuel cell. Int. J. Electrochem. Sci. 2015, 10, 5842–5861. [Google Scholar]
  17. Lee, B.W.; Park, K.W.; Kim, H.M. Numerical optimization of flow field pattern by mass transfer and electrochemical reaction characteristics in proton exchange membrane fuel cells. Int. J. Electrochem. Sci. 2013, 8, 219–234. [Google Scholar]
  18. Wang, X.D.; Duan, Y.Y.; Yan, W.M.; Lee, D.J.; Su, A.; Chi, P.H. Channel aspect ratio effect for serpentine proton exchange membrane fuel cell: Role of sub-rib convection. J. Power Sources 2009, 193, 684–690. [Google Scholar] [CrossRef]
  19. Nam, J.H.; Lee, K.J.; Sohn, S.H.; Kim, C.J. Multi-pass serpentine flow-fields to enhance under-rib convection in polymer. J. Power Sources 2009, 188, 14–23. [Google Scholar] [CrossRef]
  20. Hong, L.; Peiwen, L.; Daniel, J.R.; Kai, W.; Abel, H.G. Experimental study and comparison of various designs of gas flow fields to PEM fuel cells and cell stack performance. Front. Energy Res. 2014, 2. [Google Scholar] [CrossRef]
  21. Yoon, Y.G.; Lee, W.Y.; Park, G.G.; Yang, T.H.; Kim, C.S. Effects of channel configurations of flow field plates on the performance of a PEMFC. Electrochim. Acta 2004, 50, 709–712. [Google Scholar] [CrossRef]
  22. Bove, R.; Malkow, T.; Saturnio, A.; Tsotridis, G. PEM fuel cell stack testing in the framework of an EU-harmonized fuel cell testing protocol: Results for an 11 kW stack. J. Power Sources 2008, 180, 452–460. [Google Scholar] [CrossRef]
  23. Iranzo, A.; Muñoz, M.; Rosa, F.; Pino, J. Numerical model for the performance prediction of a PEM fuel cell, Model results and experimental validation. Int. J. Hydrog. Energy 2010, 35, 11533–11550. [Google Scholar] [CrossRef]
  24. ANSYS Fluent® 15, ANSYS Fluent Fuel Cell Modules Manual. Available online: http://148.204.81.206/Ansys/150/ANSYS%20Fluent%20Fuel%20Cell%20Modules%20Manual.pdf (accessed on 11 August 2016).
  25. Shimpalee, S.; Dutta, S. Numerical Prediction of Temperature Distribution in PEM fuel cells. Numer. Heat Transf. A Appl. 2000, 38, 111–128. [Google Scholar]
  26. Choi, K.S.; Kim, H.M.; Moon, S.M. Numerical studies on the geometrical characterization of serpentine flow-field for efficient PEMFC. Int. J. Hydrog. Energy 2011, 36, 1613–1627. [Google Scholar] [CrossRef]
  27. Choi, K.S.; Kim, H.M.; Moon, S.M. An experimental study on the enhancement of the water balance, electrochemical reaction and power density of the polymer electrolyte fuel cell by under-rib convection. Electrochem. Commun. 2011, 13, 1387–1390. [Google Scholar] [CrossRef]
  28. Park, K.; Kim, H.M.; Choi, K.S. Numerical and experimental verification of the polymer electrolyte fuel cell performances enhanced by under-rib convection. Fuel Cells 2013, 13, 927–934. [Google Scholar] [CrossRef]
  29. Choi, K.S.; Kim, B.G.; Park, K.; Kim, H.M. Flow control of under-rib convection enhancing the performance of proton exchange membrane fuel cell. Comput. Fluids 2012, 69, 81–92. [Google Scholar] [CrossRef]
  30. Ji, M.; Wei, Z. A review of water management in polymer electrolyte membrane fuel cells. Energies 2009, 2, 1057–1106. [Google Scholar] [CrossRef]
  31. Nguyen, T.V.; White, R.E. A Water and Heat Management Model for Proton-Exchange-Membrane Fuel Cells. J. Electrochem. Soc. 1993, 8, 2178–2186. [Google Scholar] [CrossRef]
  32. Falcão, D.S.; Oliveira, V.B.; Rangel, C.M.; Pinho, C.; Pinto, M.F.R. Water transport through a PEM fuel cell: A one-dimensional model with heat transfer effects. Chem. Eng. Sci. 2009, 64, 2216–2225. [Google Scholar] [CrossRef]
  33. Chen, Y.S.; Peng, H. A segmented model for studying water transport in a PEMFC. J. Power Sources 2008, 185, 1179–1192. [Google Scholar] [CrossRef]
Figure 1. Schematics of the computational domains for the polymer electrolyte membrane fuel cell (PEMFC) system simulations and experiments: (a) configuration I, in which a serpentine flow-field with sub-channel and by-pass (SFFSB) and a conventional serpentine flow-field (CSFF) were used at the anode and cathode, respectively, and the constant stoichiometry ratios of supply gases were controlled; (b) configuration II, in which an SFFSB and a CSFF were used at the anode and cathode, respectively, and the constant mass flow rates were controlled; (c) Configuration III in which a CSFF and an SFFSB were used at the anode and cathode, respectively, and the constant stoichiometry ratios of supply gases were controlled; and (d) configuration IV, in which a CSFF and an SFFSB were used at the anode and cathode, respectively, and the constant mass flow rates were controlled.
Energies 09 00844 g001
Figure 2. Design of bipolar plates and experimental test setup: (a) CSFF configuration design; (b) SFFSB configuration design; and (c) fabricated CSFF and SFFSB configurations and fuel cell assembly in the experiment.
Energies 09 00844 g002
Figure 3. Comparisons of the temperatures of four simulation cases at an average current density of 1.2 A/cm2: (a) temperature distributions at the membrane’s anode side; (b) temperature distributions at the membrane’s cathode side; (c) temperature along a reference location of the anode GDL; and (d) temperature along a reference location of the cathode GDL.
Energies 09 00844 g003
Figure 4. Comparisons of the pressures in four simulation cases at an average current density of 1.2 A/cm2: (a) total pressure distributions at the anode channel; (b) total pressure distributions at the cathode channel; (c) total pressures along a reference location of the anode channel; and (d) total pressures along a reference location of the cathode channel.
Energies 09 00844 g004
Figure 5. Comparisons of the water distributions of four simulation cases at an average current density of 1.2 A/cm2: (a) liquid water distributions at the anode side of the membrane; (b) liquid water distributions at the cathode side of the membrane; (c) anode membrane water content distributions; (d) cathode membrane water content distributions; and (e) liquid water distributions along a reference location.
Energies 09 00844 g005
Figure 6. Comparisons of (a) membrane water contents along a reference location; (b) liquid water activities along a reference location; (c) average anode catalyst water contents; (d) average cathode catalyst water contents; (e) average membrane water contents; and (f) membrane protonic conductivities.
Energies 09 00844 g006
Figure 7. Comparisons of (a) current density distributions on a 25-cm2 active area at an average current density of 1.2 A/cm2; (b) performance curves of different simulation configurations I–IV obtained by numerical simulation and experimental testing using constant stoichiometry ratios of the supply gases; and (c) performance curves of different simulation configurations I–IV obtained by numerical simulation and experimental testing using constant mass flow rates.
Energies 09 00844 g007
Table 1. Geometrical details of the two flow-fields of CSFF and SFFSB used in this research.
Flow-Field PatternsCSFFSFFSB
Main channel width (mm)1.01.0
Main channel rib width (mm)1.01.0
Main channel turn rib width (mm)1.251.25
Sub-channel width (mm)-0.5
Sub-channel turn rib width (mm)-0.75
Main channel height (mm)0.50.5
Sub-channel height (mm)-0.334
Table 2. Geometric details of the cell components used in this simulation [1,26,27,28]. GDL: gas diffusion layer.
PartLength (mm)Width (mm)Thickness (mm)
GDL50500.25
Catalyst layer50500.0125
Membrane50500.035
Collector646420
Table 3. Details of the parameters and properties used in this simulation [1,26,27,28].
Fuel Cell ComponentParametersValue
Current collectorThermal conductivity (W/(m·K))5.7
Electric conductivity (1/(Ω·m))10,000
GDLThickness after compressed (μm)250
Permeability of GDL (m2)1.0 × 10⁻¹²
Porosity after compressed (%)70
Diffusion adjustment (%)50
Thermal conductivity of GDL (W/(m·K))0.21
Membrane electrode assemblyThickness including catalyst layer (μm)50
Thermal conductivity of membrane (W/(m·K))0.15
Reference diffusivity of H2 (m2/s)8 × 10−5
Reference diffusivity of O2 (m2/s)2 × 10−5
Reference diffusivity of H2O (m2/s)5 × 10−5
Dry membrane density (g/cm3)2.0
Equivalent weight of dry membrane (g/mol)1100
Anode reference current density (A/cm2)10,000
Cathode reference current density (A/cm2)200
Table 4. Details of the operation conditions used in this research [1,26,27,28].
ParameterInlet ConditionsValue
AnodeConstant mass flow rate inlet (L/min)0.6
Constant stoichiometry inlet1.5
Inlet temperature (°C)75
Anode inlet relative humidity (%)100
CathodeConstant mass flow rate inlet (L/min)1.996
Constant stoichiometry inlet2
Inlet temperature (°C)75
Cathode inlet relative humidity (%)100
Operating conditionsExit pressure (kPa)101
Gravitational acceleration (m/s2)9.8
Open circuit voltage (V)0.96
Cell temperature (°C)75

