Article

Comparative Analysis of Battery Behavior with Different Modes of Discharge for Optimal Capacity Sizing and BMS Operation

1
Energy and Power Conversion Engineering, University of Science and Technology, Daejeon 34113, Korea
2
Korea Electrotechnology Research Institute, Changwon 51543, Korea
*
Author to whom correspondence should be addressed.
Energies 2016, 9(10), 812; https://doi.org/10.3390/en9100812
Submission received: 25 June 2016 / Revised: 18 September 2016 / Accepted: 30 September 2016 / Published: 12 October 2016

Abstract

:
Battery-operated systems are always concerned about the proper management and sizing of a battery. A Traditional Battery Management System (BMS) only includes battery-aware task scheduling based on the discharge characteristics of a whole battery pack and do not take into account the mode of the load being served by the battery. On the other hand, an efficient and intelligent BMS should monitor the battery at a cell level and track the load with significant consideration of the load mode. Depending upon the load modes, the common modes of discharge (MOD) of a battery identified so far are Constant Power Mode (CPM), Constant Current Mode (CCM) and Constant Impedance Mode (CIM). This paper comparatively analyzes the discharging behavior of batteries at an individual cell level for different load modes. The difference in discharging behavior from mode to mode represents the study of the mode-dependent behavior of the battery before its deployment in some application. Based on simulation results, optimal capacity sizing and BMS operation of battery for an assumed situation in a remote microgrid has been proposed.

1. Introduction

As remote areas are far away from the large electric systems, the use of local renewable resources to construct a microgrid (MG) is the only feasible choice. Since renewable energy resources (RES) fluctuate by nature they cannot support a practical MG concept in terms of load management, reliability and power quality without using an Energy Storage System (ESS). During the last few decades, ESSs have been studied as an important complementary technology to MGs [1].
Some of the known energy storage technologies so far include flywheels, batteries, capacitors, fuel cells, and others. Response time and capacity expansion are two important variables to select a suitable storage technology for MGs. Rapid response requirements can be met by both batteries and flywheels but in terms of capacity expansion, battery technology is superior to flywheels [2]. It depends upon the application being served whether the decisive factor should be the response of the battery or the capacity. Energy-applications of Battery Energy Storage Systems (BESSs) which are currently in the market recognition phase are load leveling and electrification, while frequency regulation support to utility grids by BESSs has been an on-the-horizon application of BESSs for the last couple of years. Usually energy-applications of BESS are common and appreciated in remote MGs while in case of grid-dependent (GD) microgrids, BESS use is limited to power-applications such as dispatch operation and averaging operation as explained in [3].
It is critically required to analyze the load domain being served to ensure proper sizing, investigate the robustness to new features and accommodate new features into the source technology. Load analysis is also necessary to develop short as well as long term source technology planning [4]. Based on the research so far it can be stated the load is always accompanied by uncertainties. These uncertainties may be associated with the state of the network, energy demand, energy cost, mode-shift and many others. Incentives due to optimization can’t be ensured without considering these uncertainties. Deterministic sizing and probabilistic sizing are two well-known approaches adopted for sizing of energy technologies, both of which use the load as input data. In the first case, certain conditions about the load are assumed, while in the second case, uncertainties in load are introduced and modelled probabilistically. Probabilistic sizing includes both short-term and long term factors [5].
Based on the above discussion it can be inferred that load analysis is the most important step in defining the sizing framework for BESS and the aforementioned uncertainties also exist in the loads served by BESS. The literature about probabilistic sizing of BESS to address uncertainties is abundant. The probabilistic sizing of a battery storage system was conducted in [6] to take into account the unavoidable uncertainties involved with the energy cost and energy demand. A stochastic sizing algorithm for BESS was proposed in [7] to tackle uncertainties in life cycle cost. Wind forecast uncertainty makes the BESS with probabilistic-based sizing a complementary partner for wind energy technology as discussed in [8]. Sizing and control of BESS for Peak Load Shaving was proposed in [9]. A control strategy to smooth out the power from wind farm sizing of BESS was presented in [10]. None of the above research works, whether using probabilistic or deterministic approaches, discussed the load mode and its possible impact on the sizing of batteries. The behavior of batteries for different load modes must be studied to know whether battery behavior is mode-dependent or independent of it. Well-known approaches for the analysis of the load mode are measurement-based approaches and component-based approaches. Irrespective of the approach applied, the behavior of the loads as a function of voltage can be categorized into Constant Power Load (CPL), Constant Current load (CCL) and Constant Impedance Load (CIL). Although no load falls 100% in one mode, every load has one dominant behavior. The correlation between different modes of load and the design as well as operation of the source supplying constant voltage throughout operation can be predicted and predefined. In case the voltage source changes its voltage with time, this correlation must be tracked over time and control actions be issued on the spot. The case of batteries whose voltage supply changes with time is similar. Secondly the initial lighting loads were mostly CILs, but the proliferation of power electronics has changed the way loads behave; for example electronic ballasts with constant power consumption have replaced magnetic ballasts which behave as CILs [11]. This load transition from one mode to another has made the optimal operation and accurate sizing of BESSs a challenging task. The above-discussed issues are the motivation for this work.
This paper contributes by presenting a model-based comparative analysis of the battery behavior for different modes (MOD). It was found that the battery behavior is dependent on the MOD. Since the battery sizing and operation depend on the behavior of the battery, so the MOD is also correlated with the sizing and battery operation. The MOD is dictated by the load, so the load-aware analysis of battery behavior can impact on the sizing and BMS operation in the following way:
  • Minimizing the power capacity of the battery at the operational level.
  • Avoiding the battery damage caused by loads exceeding the rated value.
  • Avoiding the undersizing of the battery as undersizing is not acceptable for critical loads.
  • At the operational level battery utilization can be increased.
The rest of paper is distributed as follows: Section 2 presents a basic introduction about battery behavior for the discharge cycle only. Section 3 correlates the BMS design with battery behavior. Section 4 develops a model more suitable for the study of battery behavior in the context of the objective of this paper. Section 5 discusses the simple load model used for the purpose of simulation. Section 6 presents the simulation model and procedure. Section 7 presents the simulation results. Section 8 proposes an idea for capacity sizing and BMS operation based on the simulation results.

2. An Overview of Battery Behavior

In this section only those battery characterisctics which will be referred to in Section 7 and Section 8 are discussed.

2.1. Usable Capacity

Usable capacity is the energy extracted in discharging a battery from a fully charged state to the point where its voltage reaches the cut-off voltage. The state of charge (SOC) corresponding to the cut-off voltage determines the lower limit of SOC. Cut-off voltage is decided by the manufacturer based on the battery topology. The battery topology referred in this paper is Lithium PL-383562 and the lower limit of SOC for this topology is roughly 5%, so the usable capacity ranges from 100% SOC to 5% SOC as shown in Figure 1. The time lapse in discharging the battery from 100% SOC to 5% SOC is the runtime of the battery.
Practically this battery is not discharged to 0% SOC, because at low SOC the internal resistances change abruptly as shown in Figure 2, and this behavior causes self-heating resulting in degradation of battery [12]. In Figure 2 the yellow dot points at 5% SOC and red dot points at 0% SOC. The terminal voltage of the battery does not remain constant throughout the discharge. It also decreases with the decrease in SOC as shown in Figure 3.

2.2. Polarizations

During the chemical reactions inside a battery undesirable impedances arise. These undesirable impedances are commonly known as polarizations. The reactions occur in steps and the polarization due to the slowest step is called activation polarization. The rate of reaction is also affected by the diffusion between reactants and products due to concentration differences called concentration polarization. The electronic resistance of active mass and current collectors, ionic resistance of electrolytes, contact resistance between active mass and current collectors, all contribute to Ohmic polarization [13]. Losses resulting from these polarizations are taken into account by resistances R_trans_L, R_series and R_trans_S. The responses of these resistances to changes in SOC for a lithium ion battery are simulated in Figure 4. All polarizations are responsible for losses commonly known as I 2 R losses. This loss is usually in the form of heat and increases the temperature of the battery. The increase in temperature can be taken into account by Equation (1):
T e m p r i s e = I 2 R × R t h e r m a l
In the above equation R t h e r m a l is the thermal resistance of the battery.

2.3. State of Health (SOH)

State of health (SOH) is the ratio of current available capacity to its initial capacity when the battery was new and expressed in a percentage. SOH determines how many cycles further the battery can work before reaching end of life (2).
S t a t e   o f   H e a l t h =   C u r r e n t   C a p a c i t y I n i t i a l   C a p a c i t y × 100
The available capacity decreases with charge/discharge cycles. Degradation of active material, increases in internal resistance and irreversible reactions are the most common explanations presented by electrochemical analysts to explore the decrease in SOH of the battery with cycles. There seems to be great interest in finding ways which could increase the lifetime of a battery. Identification of the most aged cell and it’s on-time replacement in the case of battery packs with multiple cells can boost the number of cycles before the battery reaches it’s end of life as suggested by [14]. This idea will be referenced in the discussions of our results.

2.4. Charge Recovery Effect

The battery recovery effect exploits a hidden phenomenon taking place inside the battery. When the rate of external activity is faster, such as when the battery is discharged at high load, the rate of chemical reactions inside the battery cannot keep a pace with it. As a result the concentration of the active charges near the electrodes becomes less than their concentration in the interior of the battery. This phenomenon accounts for the decrease in usable capacity as shown in Figure 5. When the battery has low load or no load for some time, active charges have enough time to diffuse to the electrodes, and charge recovery takes place. Thus the usable capacity of the battery discharged at high rate is lower than that of one discharged at low rate [15].

2.5. Utilization Factor

The battery utilization factor commonly known as battery efficiency is usually expressed as Coulomb efficiency, energy efficiency or voltage efficiency. Energy efficiency is an umbrella term which takes into account both voltage and Coulomb efficiency. In general energy efficiency of the battery is expressed using Equation (3) taken from [16]:
E n e r g y   E f f i c i e n c y =   O u t p u t   E n e r g y I n p u t   E n e r g y ×   100
O u t p u t   E n e r g y = D i s c h a r g e d   E n e r g y
I n p u t   E n e r g y = E n e r g y   n e e d e d   t o   b e   c h a r g e d   t o   I n i t i a l   S t a t e
Output energy can also be expressed as a function of input energy and energy lost. The polarizations inside the battery cause the lost energy:
O u t p u t   E n e r g y = I n p u t   E n e r g y E n e r g y   l o s t
The efficiency of the battery is affected by the energy lost ( I 2 R ) . Thus the efficiency decreases as the average discharge current increases. This implies that battery life is a super-linear function of the average discharge current [17].

3. Battery Management System (BMS) Design Correlation with Battery Behavior

As an electrochemical device, a battery acts differently under different operational and environmental conditions. This is the BMS which is responsible to keep the battery operating at high performance by tracking the changing circumstances. The design of the BMS is not an easy task as it involves a good understanding of the battery’s electrochemical characteristics. The purpose of the BMS used with portable electronics, electric vehicles (EVs) and MGs is almost the same, including optimal operation, life-time management, reliability, and safety but the conditions are different from application to application. Thus battery management systems are not interchangeable [18]. Since the design and operational algorithm of a BMS is dictated by the behavior of battery, the analysis of battery behavior for different mode of loads is very critical. Both model-based and test-based analyses of battery behavior are available in the literature, but model-based analysis of the battery for the design of BMS is very well established in industry and academia to understand and test the dynamics quickly and efficiently compared to traditional methods that rely on using real components or test data [19]. There have been a lot of investigations to ascertain the most suitable level of model for analysis. Both single cell and battery pack models have been investigated by various researchers. An idea of a smart BMS based on a single cell level approach has been proposed in [20]. This idea seems more practical with portable electronics where the number of cells is limited while the BESS used with MGs has plenty of cells to fulfill high voltage and current requirements. Although a very complex hardware and communication system is required to implement the idea [21] for BMSs used in MGs but this idea is still very significant because it provides a solid base for designing BMSs for high current and high voltage applications such as EVs and MGs. The features that need to be analyzed for high rated BMS can be done with this battery cell level system and the results can be applied to monolithic units or battery packs or modules. Comparative analysis of the battery single cell model and stacked cell model for steady state and transient conditions has been discussed in [22]. The single cell model was found more accurate than the stacked cell model. Even for the analysis at system level it is more appropriate to conduct analysis at the cell level and extend the results to the system. The idea of extension from unit cell to battery back which starts from the Thevenin model of a single cell and analyzes the differences between the cells as a function of polarization resistance in order to extend the model has been proposed in [23]. Similarly [24] has also developed a method to extend the model from single cells to battery packs. It has taken the cell with minimum capacity as a focal entity to include the worst conditions in the pack. In one way or another the unit cell has behavior representative of all mega structures developed from it by series, parallel or hybrid combinations. Thus the battery unit cell model will be used for all the simulations in this paper.

4. Modified Battery Model

There are various battery models such as electrochemical models, mathematical models, electrical models and many others. Researchers have done a lot of work to define the domain of every model as a tradeoff between accuracy and complexity. For electrical engineers electrical models are more intuitive, useful and easy to handle, especially when they can be used in circuit simulators and alongside application circuits.
Among the electrical models, the selection of an appropriate model is directed by the application for which model is to be used. This paper is limited to the discharge characteristics of a battery at the cell level as a direct or indirect function of discharge current with different MOD, which is the basis for model selection. The following are some of the studies on electrical battery models with applications.
The model proposed in [25] was used to simulate the application of BESS as an active filter. All elements included in this model are functions of the open circuit voltage of the battery, which in turn relates to the SOC. This model has less accuracy for the said application. A long term integrated model based on Giglioli’s fourth was presented in [26] to investigate the system performance of a dynamic voltage restorer. All parameters are functions of SOC, discharge current and temperature. This model is very complex because it requires multiple types of entries such as nominal quantities, empirical parameters and experimental parameters. A battery model made from a combination of the Thevenin model and the run-time model was proposed in [27] to study a coordinated strategy for BESS, RES and load management. This model calculates SOC as a function of the discharge current but it works accurately only for constant current. A simple voltage source was used as a battery to study the effects caused by changing parameters of microsources on the outputs at the point of common coupling, but it cannot predict the battery behavior [28]. A model was used in [26] to predict SOC throughout drive cycles for HEV simulations. It simulates the transient response to short duration loads of less than 1 s. Since time constants less than 1 s have no impact on the exponential dynamics of battery they can be avoided. A model proposed in [
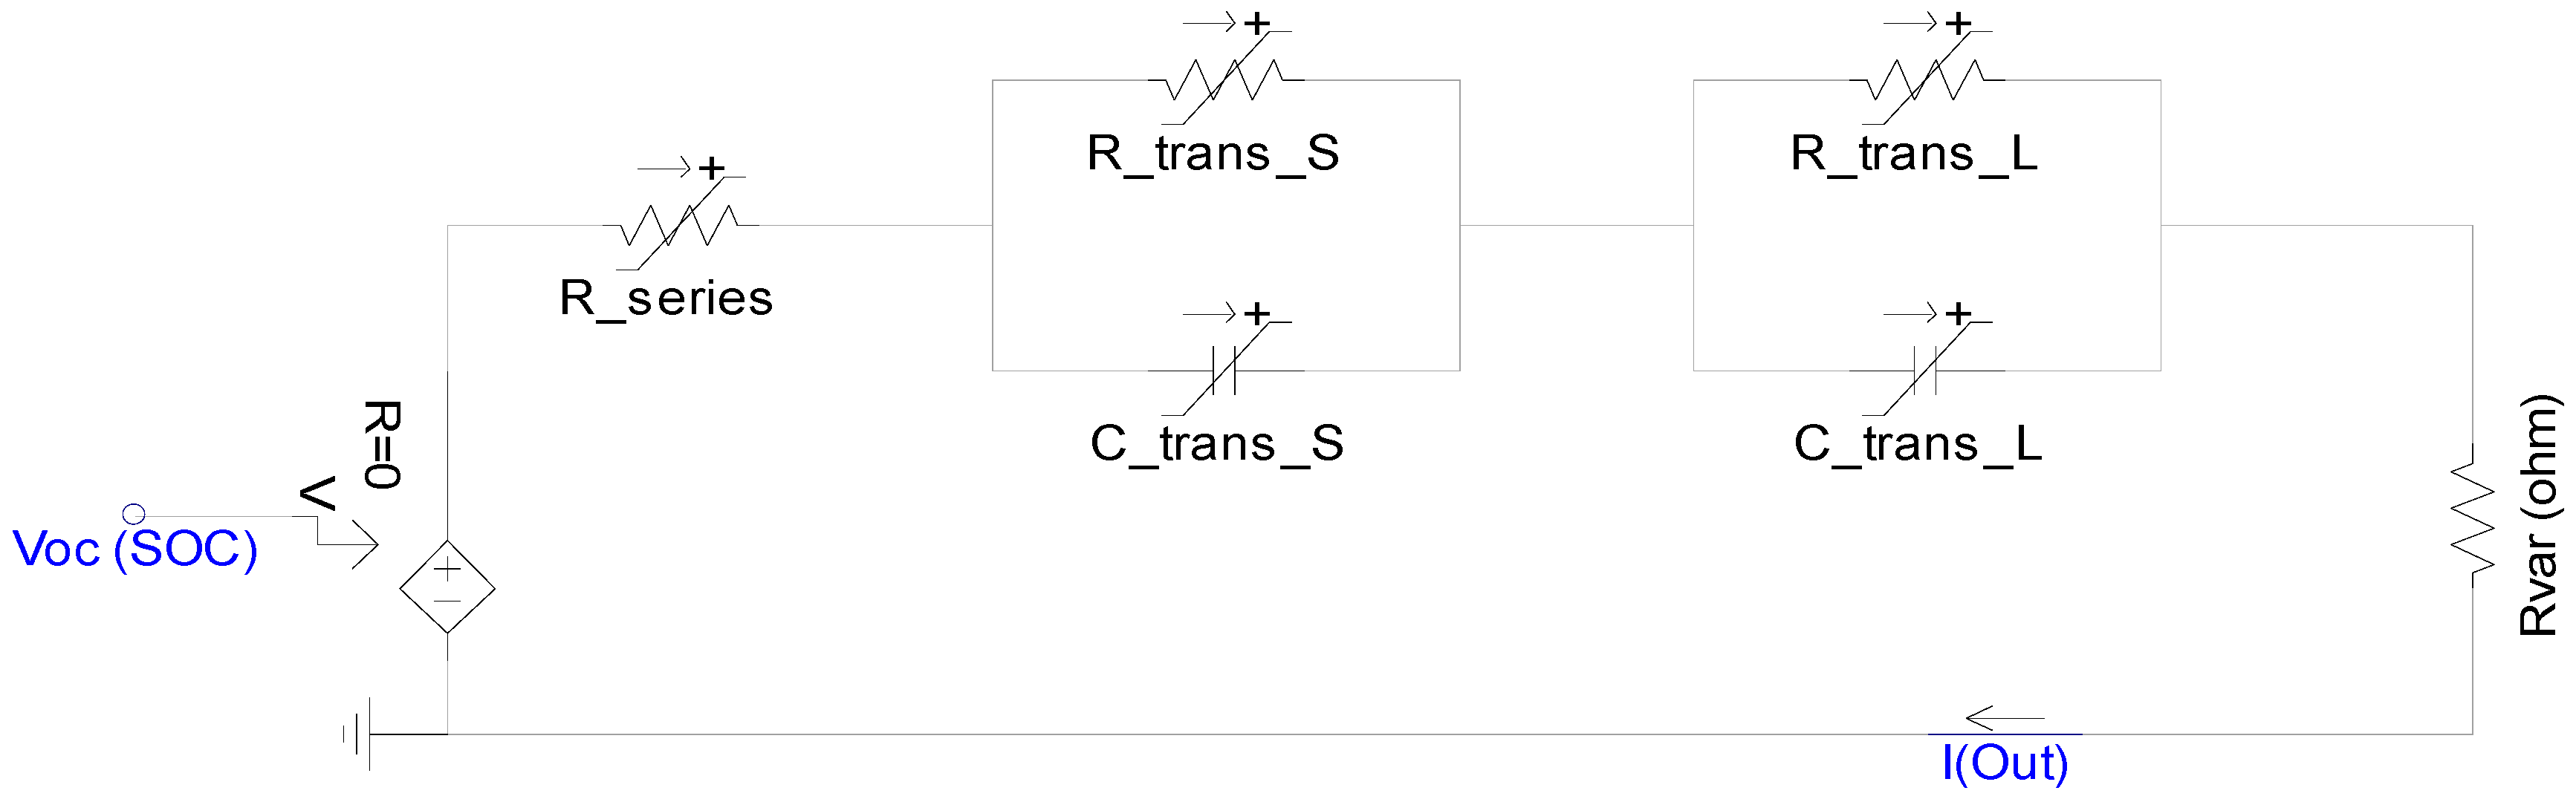
29] has good accuracy in predicting runtime, power loss and I-V performance. This model has two modules. One module measures the I-V characteristics of battery as a function of SOC as shown graphically in Figure 6.
The second module quantitatively estimates the SOC based on the voltage of a capacitor. In this paper we have modified this module so that it can estimate SOC as a function of discharge current. The subsystem designated for SOC estimation based on capacitor voltage was replaced with a mathematical model based on the “Coulomb Counting Method” without sacrificing accuracy. The Coulomb counting method uses the current flowing in (charging mode) and flowing out (discharging mode) of the battery and integrates this current over time in order to determine the battery capacity (Q) for SOC estimation.
This method is simple and directly takes in to account the discharge current. Calculation of SOC using Coulomb counting follows (7) and (8). SOC directly depends on discharge current I o u t and other parameters are a function of SOC. The electrical model for SOC estimation (discharging mode) is shown in Figure 7:
S O C   = 1 ( i n i t i a l I O u t   d t Q )  
i n i t i a l   = ( 1 S O C 0 100 ) Q
This model can be used with both Li-ion and NiMH batteries. This model is also extendable to NiCad and Lead-acid batteries. A brief summary of the characteristics of some of the batteries used for energy applications are indicated in Table 1. Since energy applications of BESSs in remote MGs is the concern of this paper, keeping this target in view, battery selection will be governed by parameters like high specific energy, high energy density and long cycle life. Li-ion batteries have all the necessary features to become an integral part of remote MGs [30], so we have used the parameters extracted for this model in relation to Li-ion batteries in [29] for our simulations.

5. Load Model

The two well-known approaches for the modelling of the load are the measurement-based approach and component-based approach. There are many load models developed using these approaches to study the static and dynamic behaviors of power systems, distributed generators and other sources. Among these models static load models still can be used to realize the load behavior without losing accuracy and adequacy. Among static models exponential models are easy to implement as they require less parameters and also have acceptable accuracy with the loads having too high dominancy in one behavior such that other behaviors can be neglected [31,32]. In this paper we have taken in to account only the dominant load behavior, so an exponential model of load is used. A simple variable resistor modelled in (11) based on exponential load model scheme (9) and (10) will be used to represent all loads:
P =   P o   ( V V o ) n p
P =   V 2 R 0   , P o =   V o 2 R v a r
R v a r =   ( V V o ) n p ×   R o
where R v a r = variable resistor; R o   = initial value of resistance; V = battery terminal voltage. When n p = 0 , the load is CPL; when n p = 1 the load is CCL; and when n p = 2 the load is CIL.

6. Simulation Model and Procedure

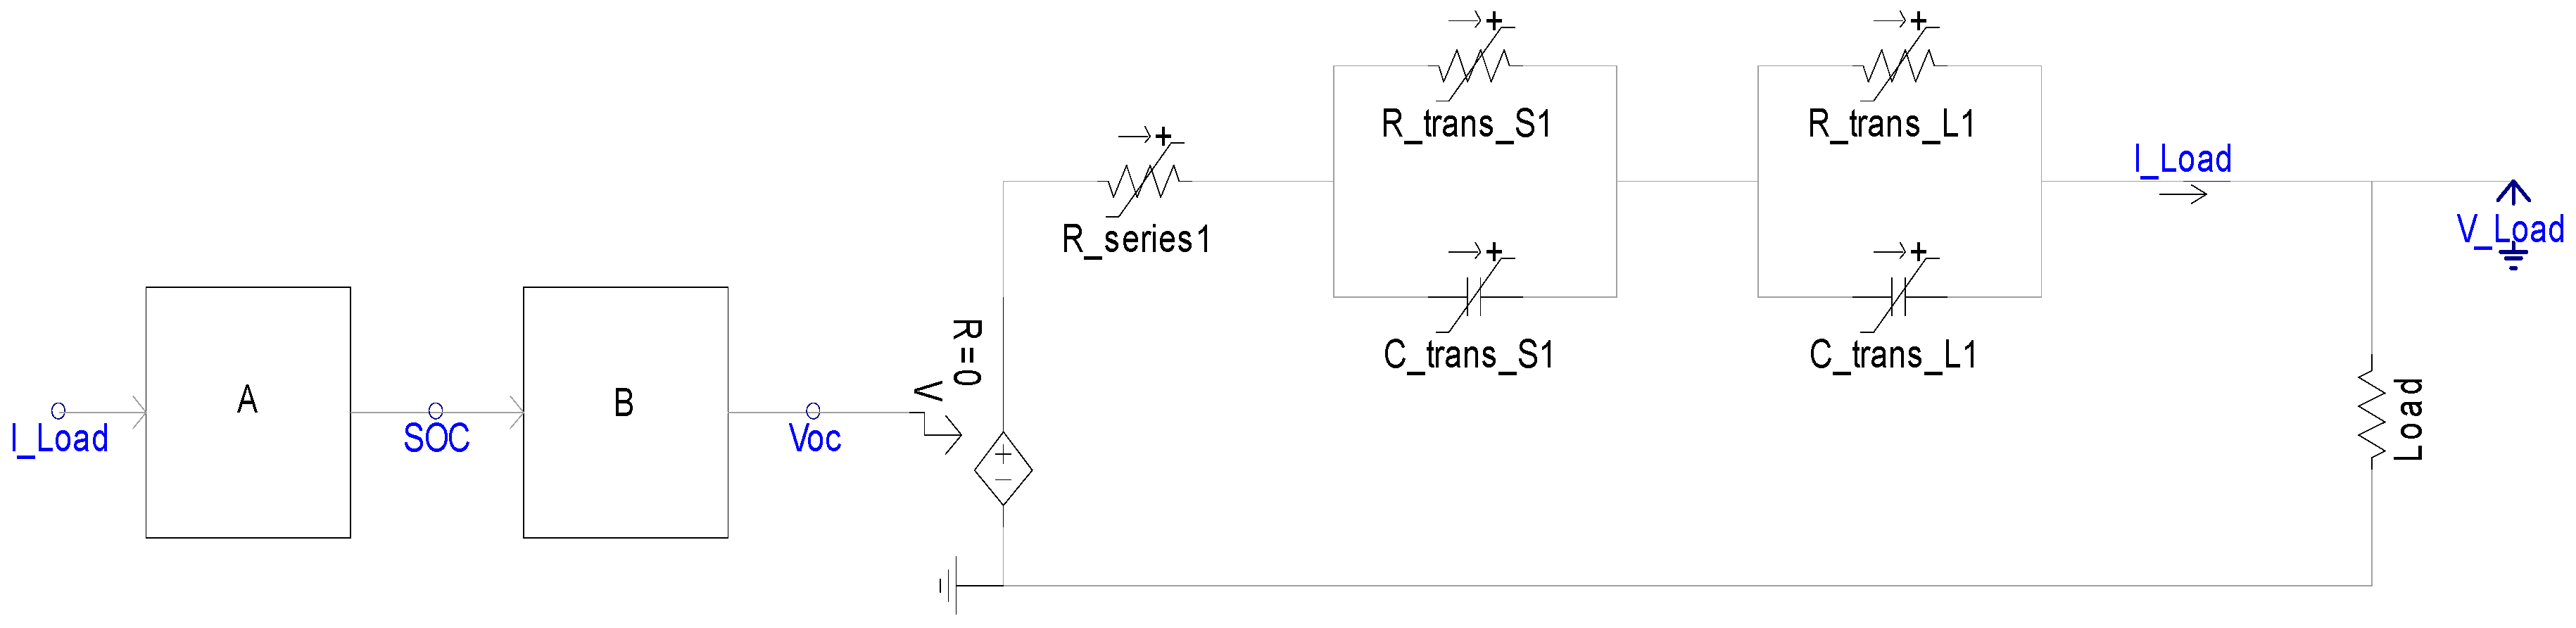
An acceptably accurate electrical model to reproduce the behavior of a polymer Li-ion battery was used. The model selection and modification was discussed in Section 4 and the model is shown in Figure 8. The internal parameters of the polymer Li-ion battery PL-383562 extracted based on experimental measurements reported in [29] were applied to this model. The parameters are function of SOC and following the relations expressed below.
R_series1 = 0.1562 × e^ (−24.37 × SOC) + 0.07446
R_trans_S1 = 0.3208 × e^ (−29.1 × SOC) + 0.04669
C_trans_S1 = −752.9 × e^ (13.51 × SOC) + 703.6
R_trans_L1 = 6.603 × e^ (−155.2 × SOC) + 0.04984
C_trans_S1 = −752.9 × e^ (13.51 × SOC) + 703.6
The block B measures the Voc as a function of the SOC. The circuit inside the block B is the PSCAD based model of the relation between SOC and Voc expressed by Equation.
Voc = −1.031 × e^ (−35 × SOC) + 3.685 + 0.2156 × SOC – 0.117 × (SOC)^2 + 0.3201 × (SOC)^3
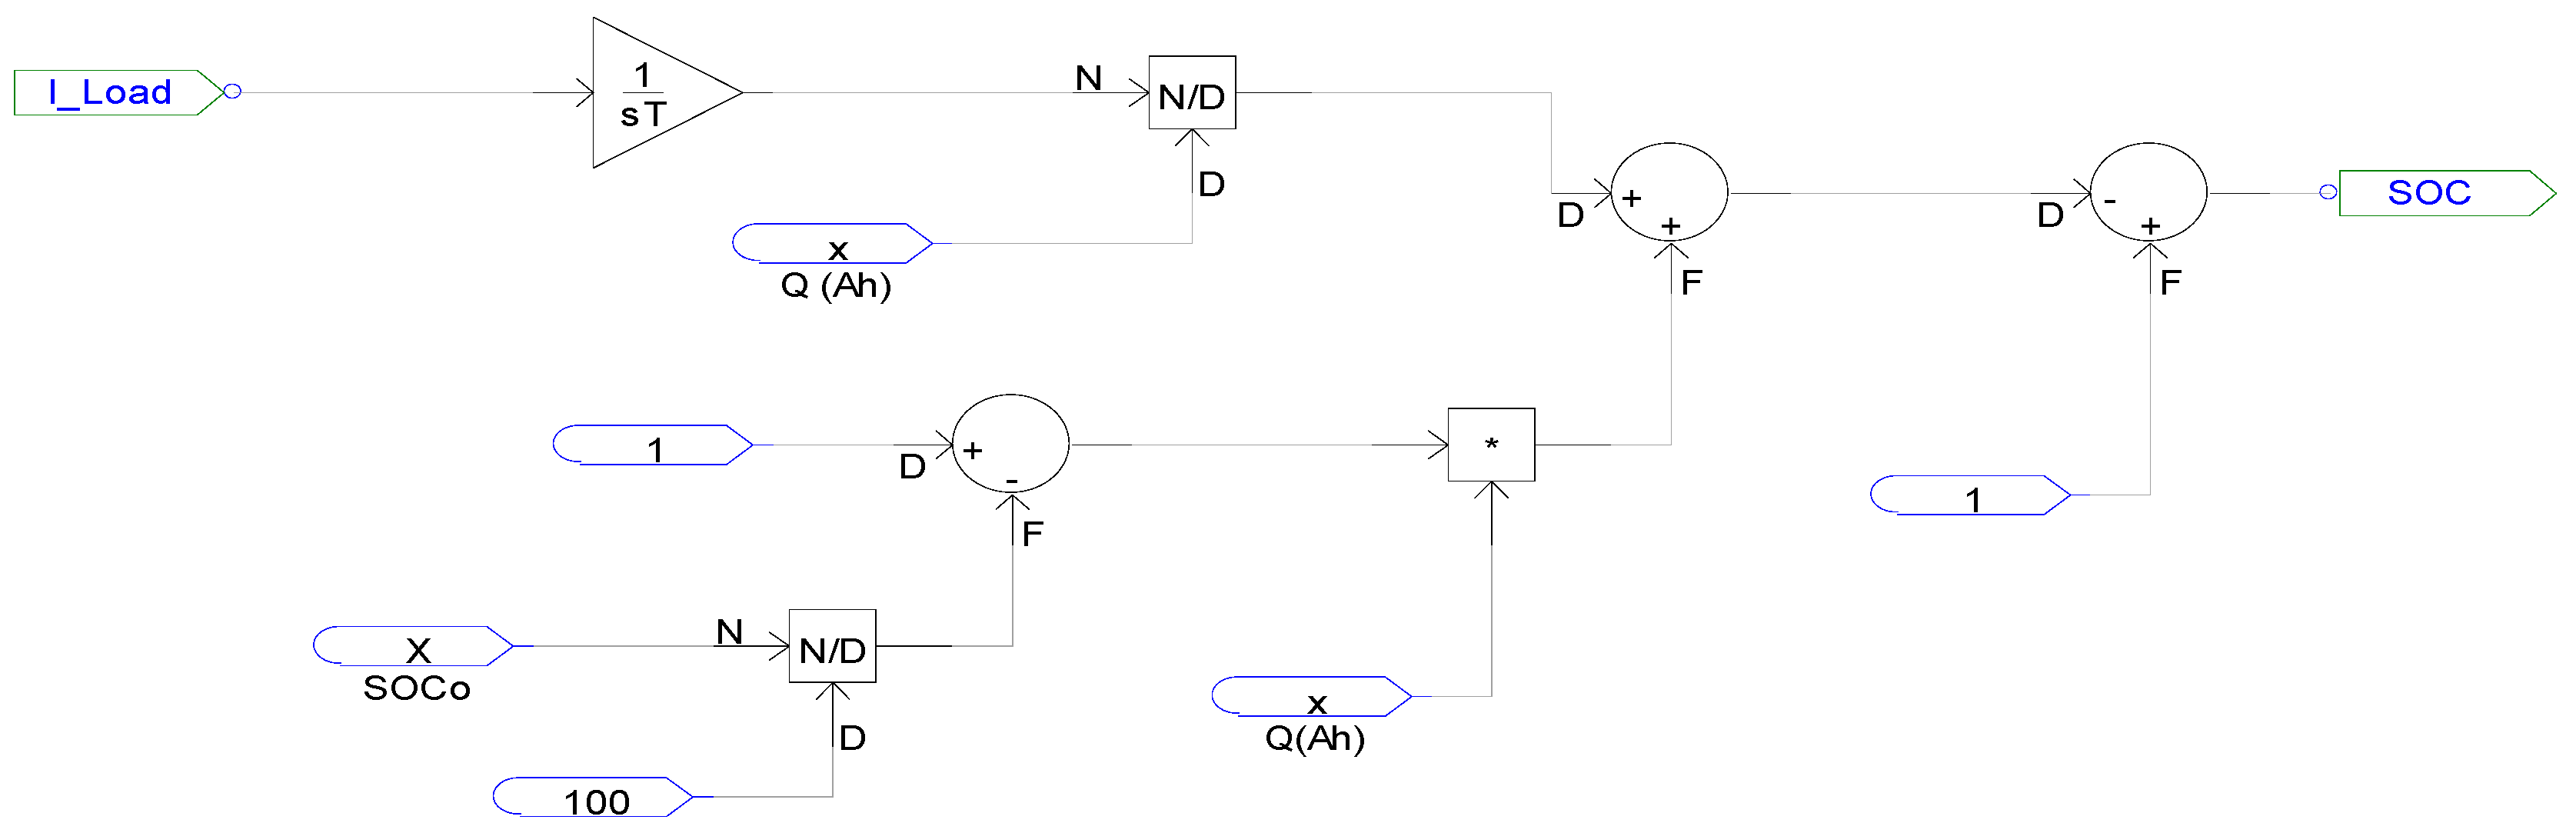
The block A measures the SOC by integrating the current flowing out from a battery during discharging and flowing into the battery during the charging. The circuit model inside the block A is shown in Figure 8, where Q (Ah) = battery capacity; SOCo = initial value of SOC; I Load = battery discharge current.
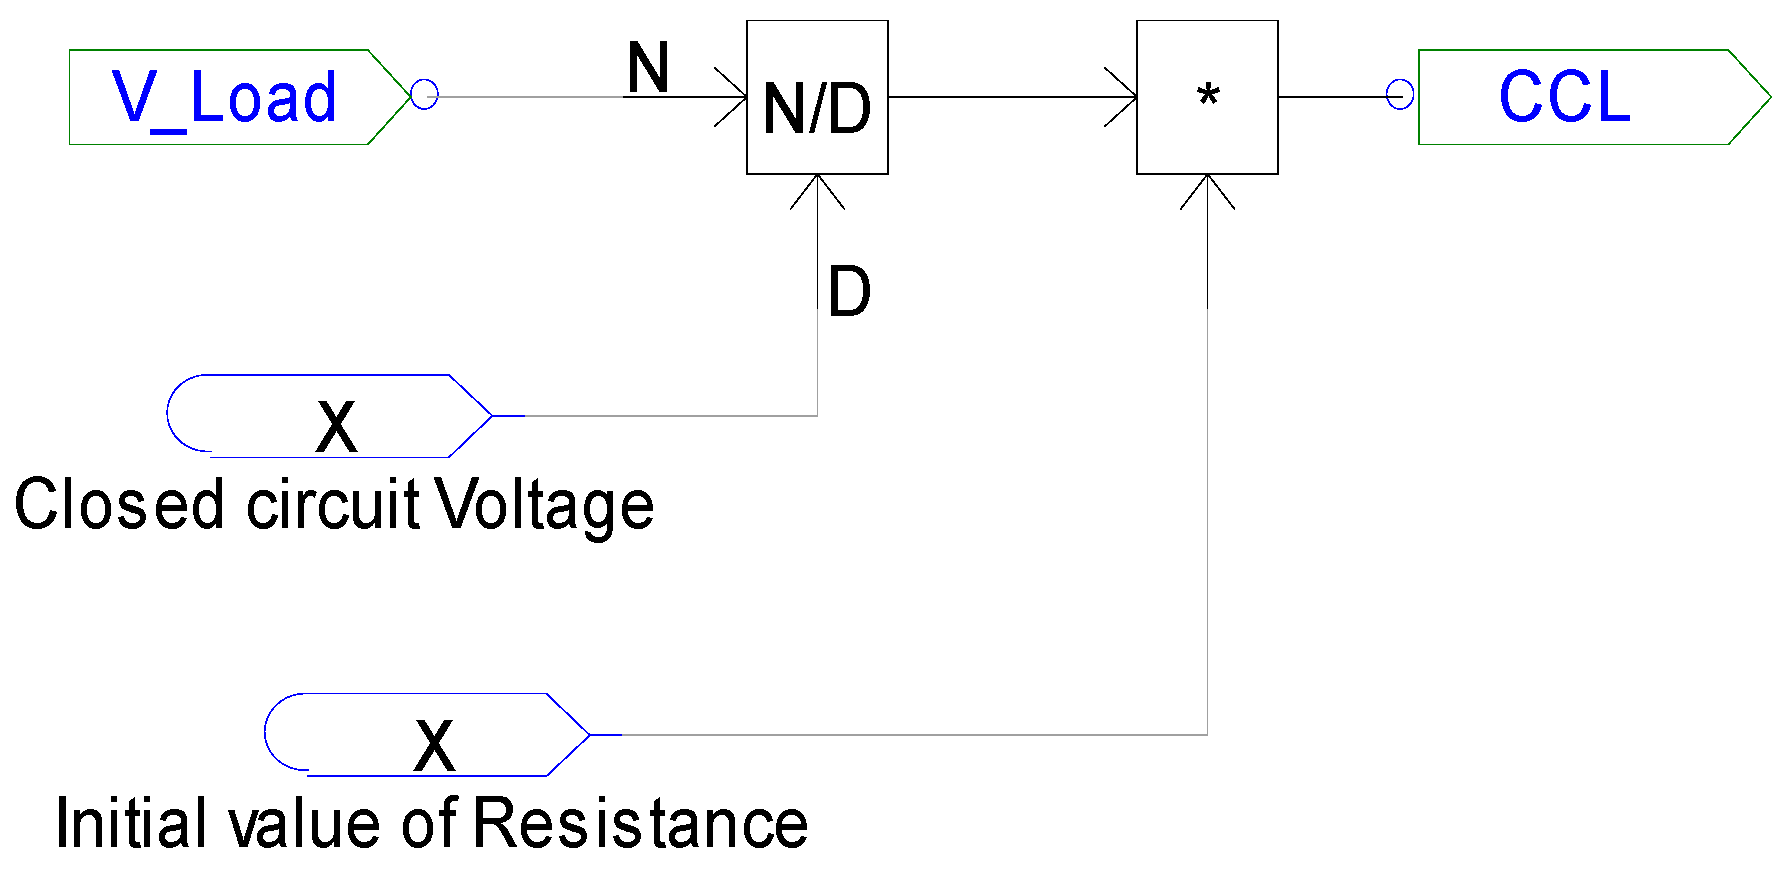
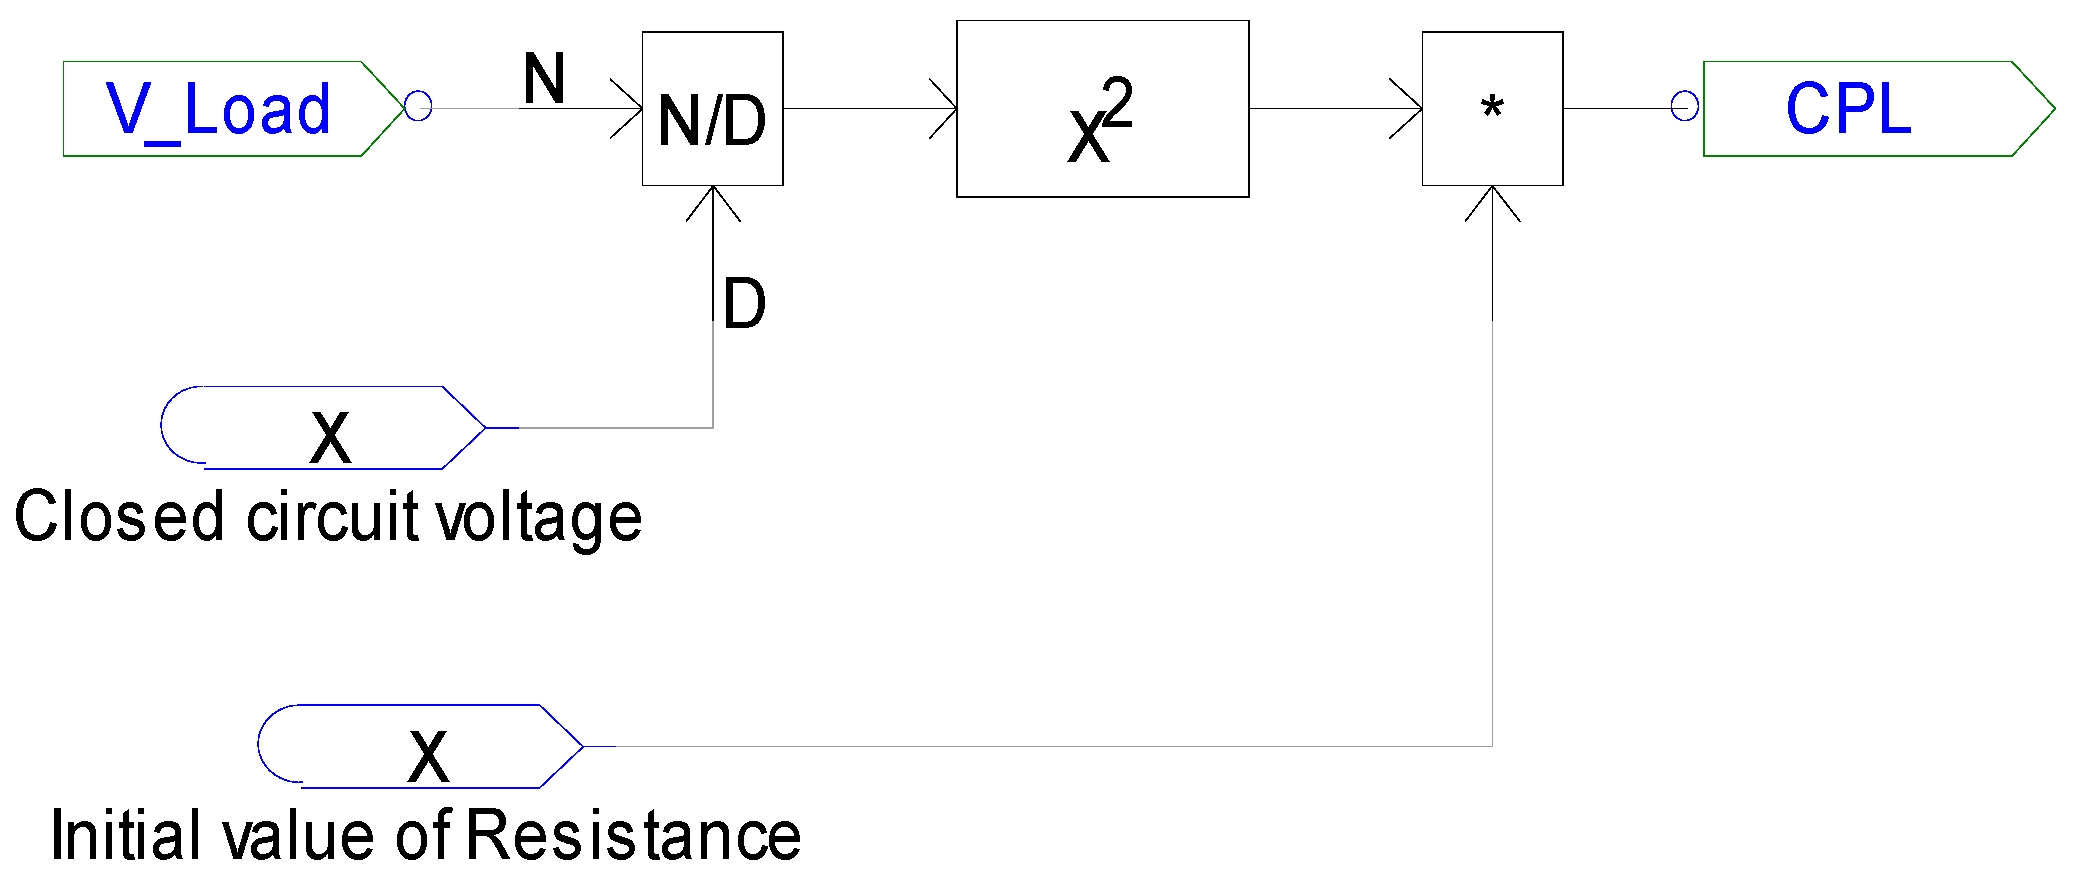
To simulate the battery for CIM a simple constant value a resistor was used as the load and the load models used for CCM and CPM are shown in Figure 9 and Figure 10, respectively. The voltage under the load condition is called closed circuit voltage. Here the closed circuit voltage is the initial value of the voltage that corresponds to the initial value of the resistance. This is a constant value while the operating voltage V_Load changes with the time depicting what actually happens in real battery applications.
The initial resistance value was taken as such a value that the initial discharge was set to 1 C for all loads and all loads will continue to flow at 1 C till the end of discharge in the case the battery supplies a constant voltage. Since the battery voltage changes with time, the loads also change following the change in battery voltage. The dependence of usable capacity on ambient temperature and self-discharge has not been included in the simulation for the following reasons.
  • The same battery was used for a comparative study of different MOD, so the effect of ambient temperature will be same for the different modes.
  • Self-discharge (2%–10%) per month was ignored for its negligible effect in polymer Li-ion batteries.

7. Results and Discussion

The main parameters of battery behavior discussed below in relation to the mode dependency are: discharge current, battery rating, SOC, capacity sizing, terminal voltage, negative impedance stability, average discharge current and efficiency.

7.1. Discharge Current and Power Rating of Battery

The rated current of a battery is determined either by testing the battery for the maximum load value or calculating the battery discharging current for maximum power of the load by using the mathematical formula given by (18):
P r a t e d =   V r a t e d ×   I r a t e d
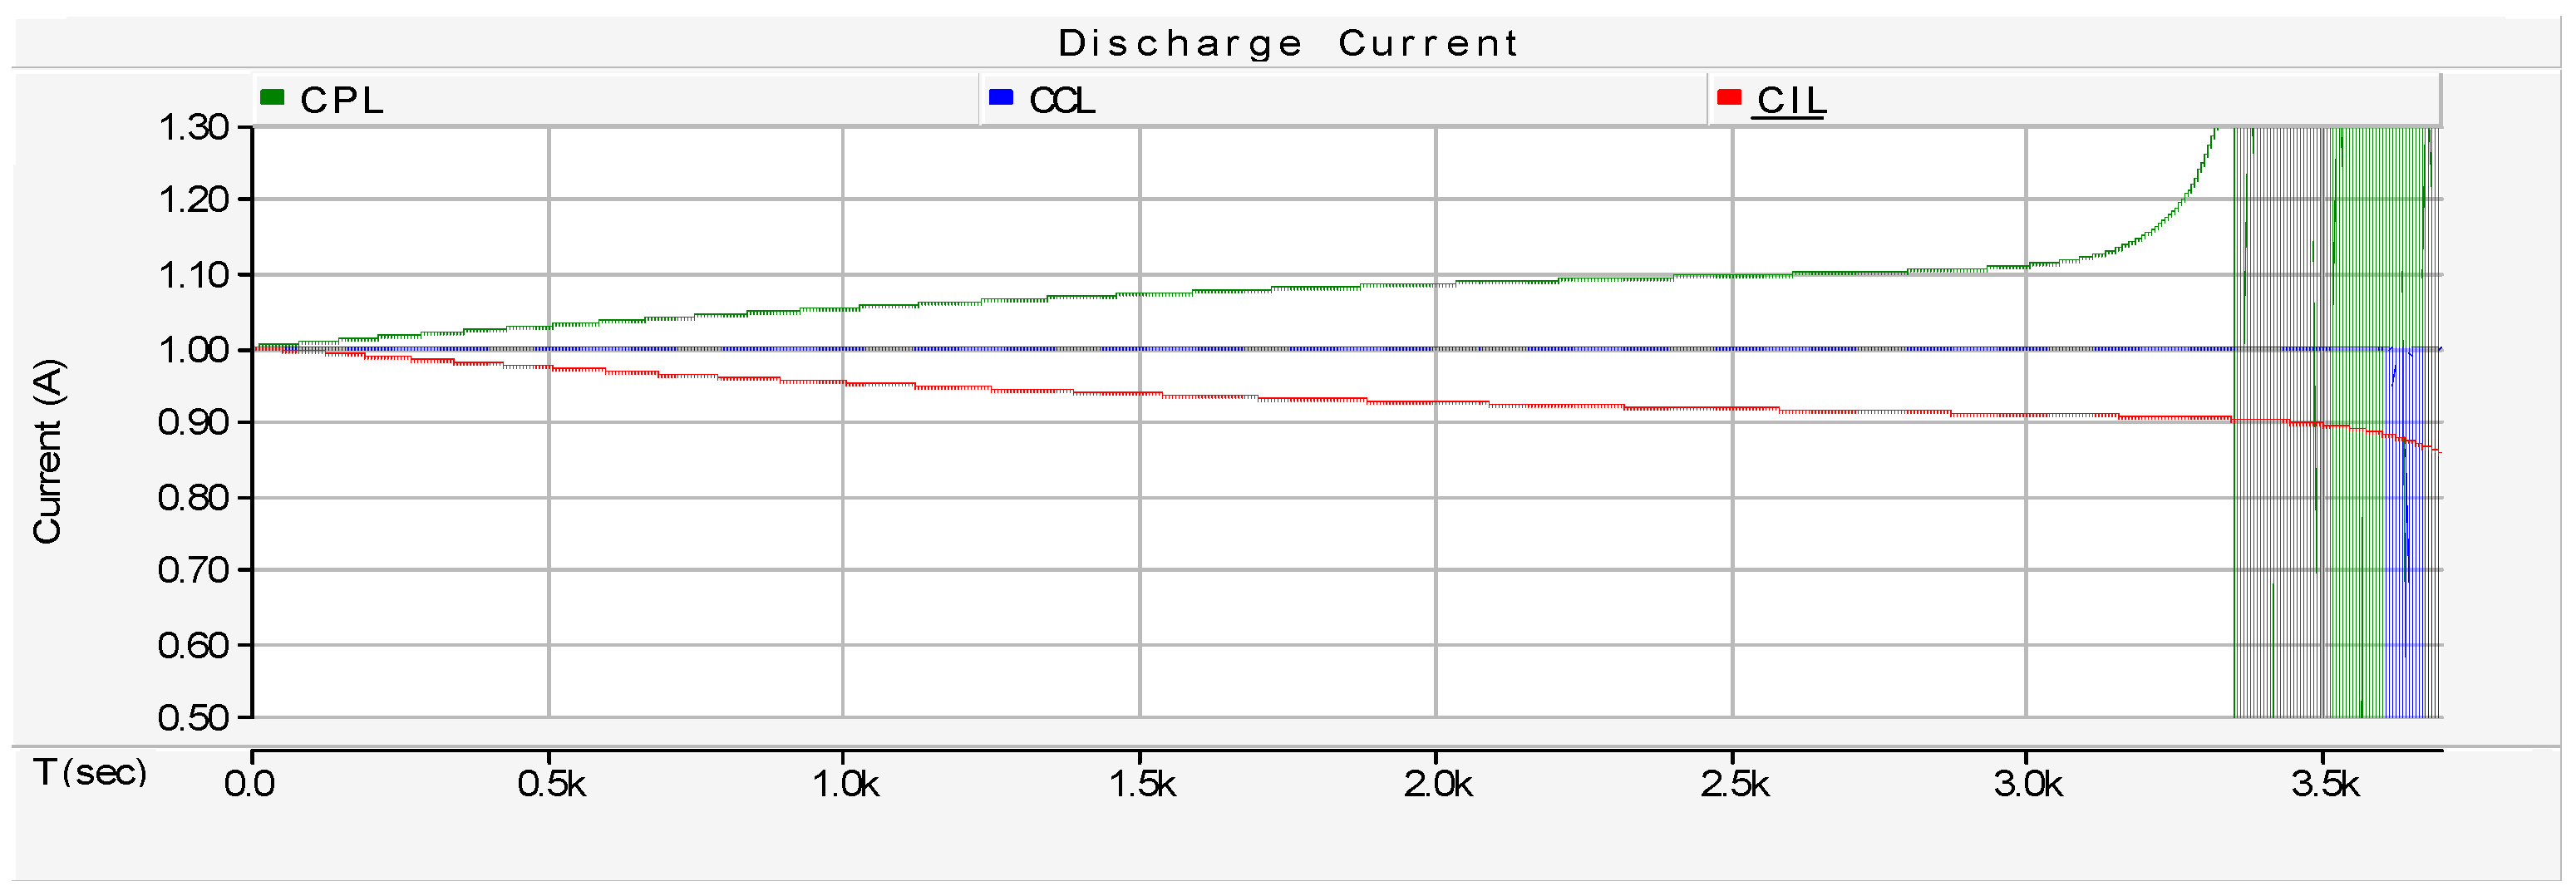
In case the battery discharge current remains constant throughout the discharge cycle any instantaneous value can be taken to define the maximum rating. On the other hand if the battery current changes with time of use, then the maximum value of current will define the battery rating. Since the battery voltage changes with the discharge time, the corresponding load drawn by different modes will also respond to voltage changes. This behavior of discharge current in response to the change in battery voltage has been simulated for all modes of load in Figure 11, which shows that maximum value of discharge current for CPL is greater than that of CIL or CCL. The battery should be rated for maximum power based on the CPM. Two possible and significant cases are highlighted below to explore the issues caused by mode-ignorant power rating of the battery:
Case 1: The battery was rated for maximum power based on the CPL but the load supplied by it is CIL: ehat is the issue in this case which can be solved by considering mode-aware sizing? The power capacity needed to feed the CIL is less that CPL, thus by considering mode-aware sizing at the planning level the power capacity of the battery can be minimized. The increase in the power capacity always corresponds to an increase in cost.
Case 2: The battery was rated for maximum power based on the CCL but the load supplied by it is CPL. The maximum current drawn by the CPL is greater than the rated current designated based on CCL and the battery will be damaged due to the current exceeding the rated value. Mode-aware rating compensates for these issues at the planning level. In the case of urban areas the loads are usually congested and all modes of load are observed at one location. It is very difficult to segregate each mode of load and operate separately. In case of remote areas we still have such flexibility. The residential loads in remote areas are mostly resistive loads with dominant CIL behavior. The small industrial loads are also far away from the residential loads and these loads are dominated by CPLs.

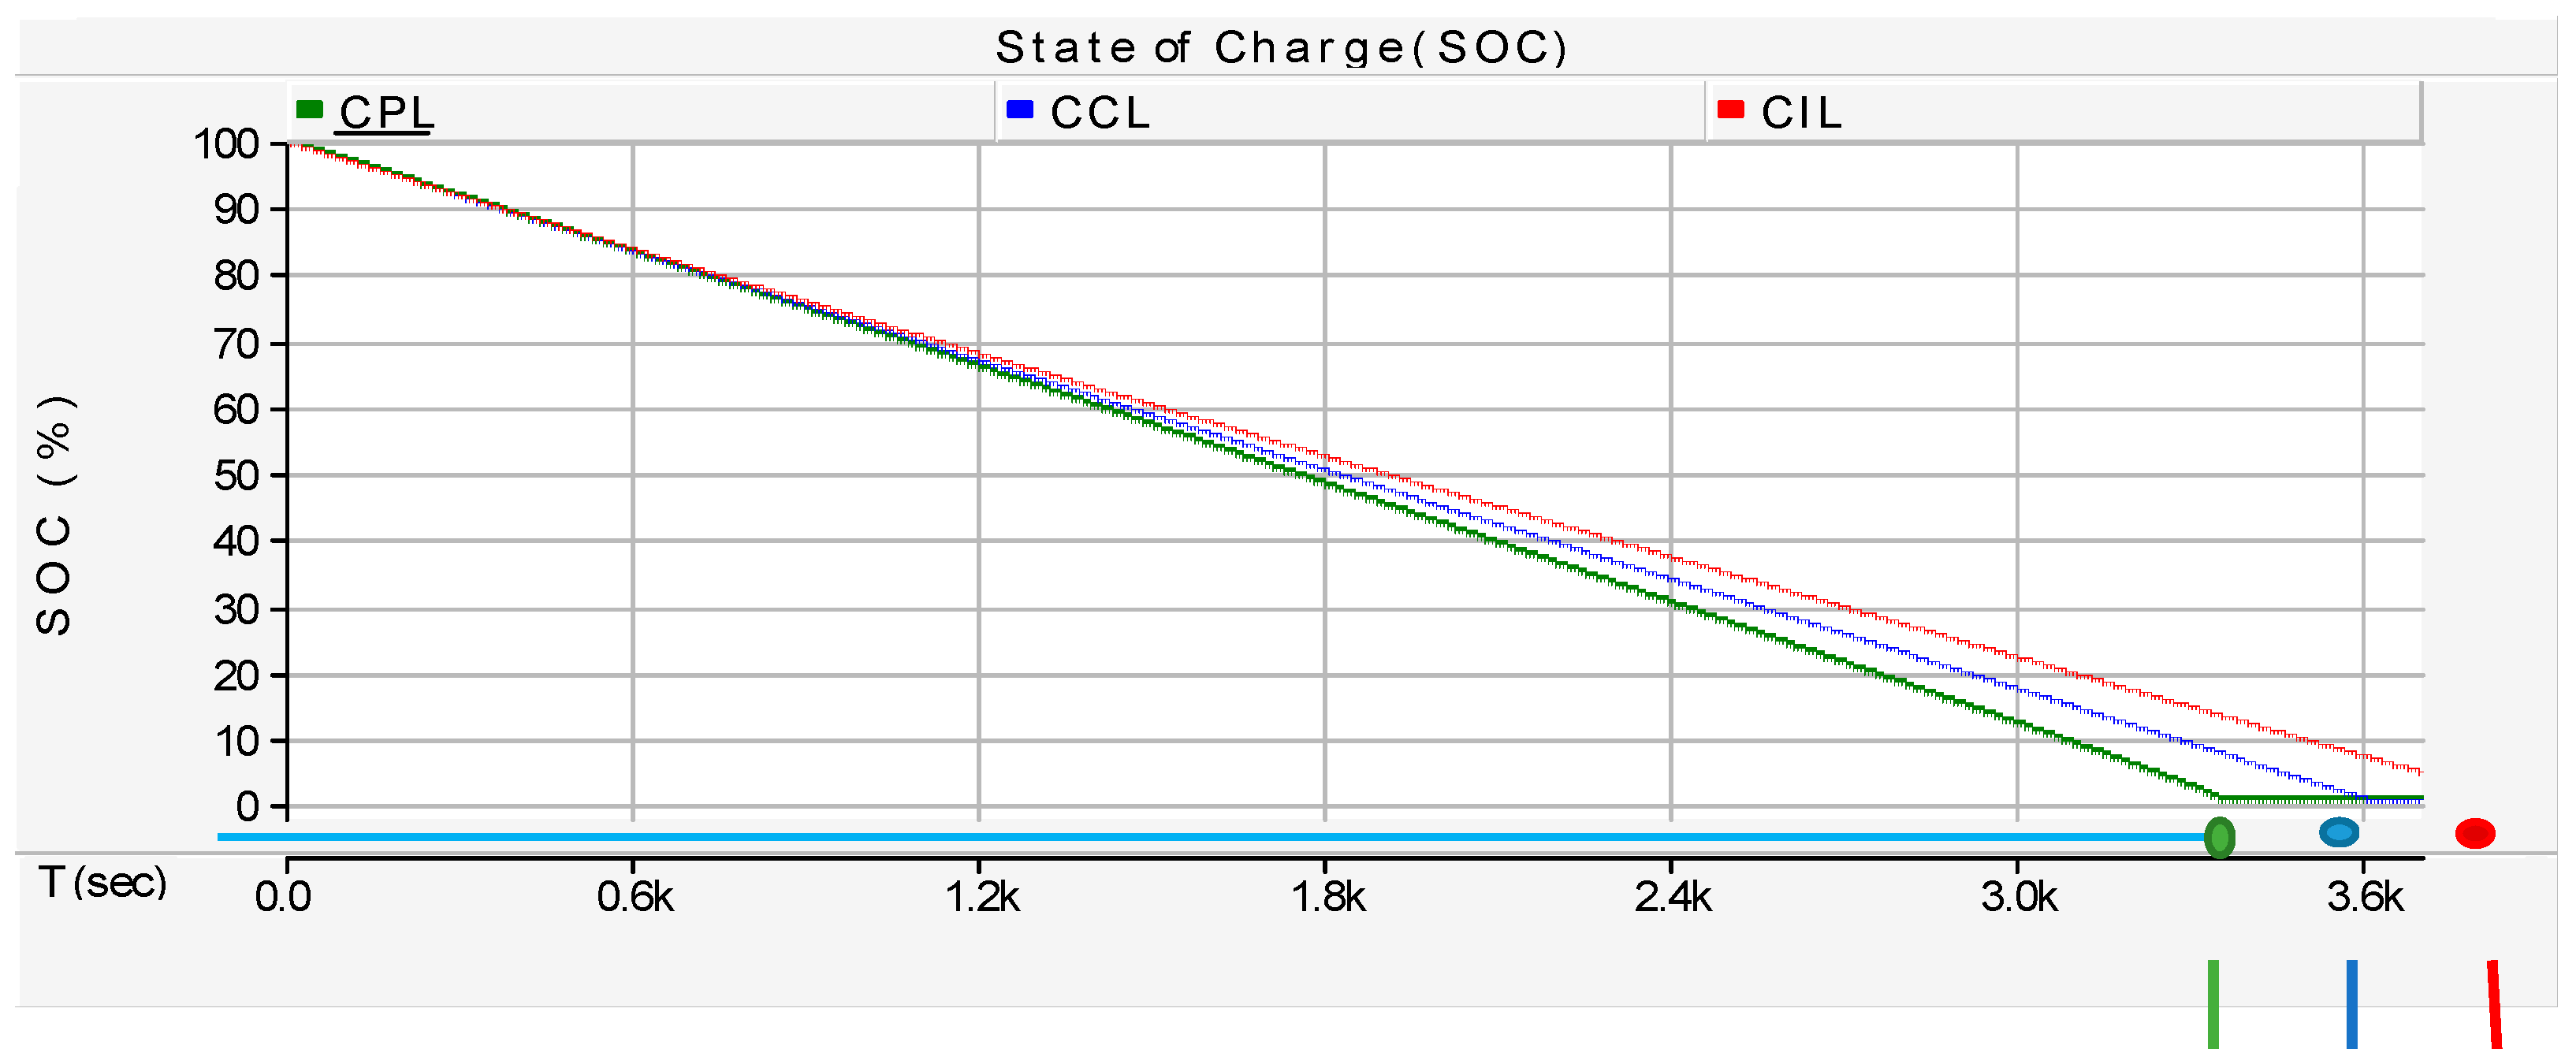
7.2. SOC and Optimal Capacity Sizing

Different objectives and constraints are taken into account to develop an optimal capacity sizing function for batteries. Due to the differences in nature of BESS applications between GD and remote MGs, the optimal battery size differs in both cases [
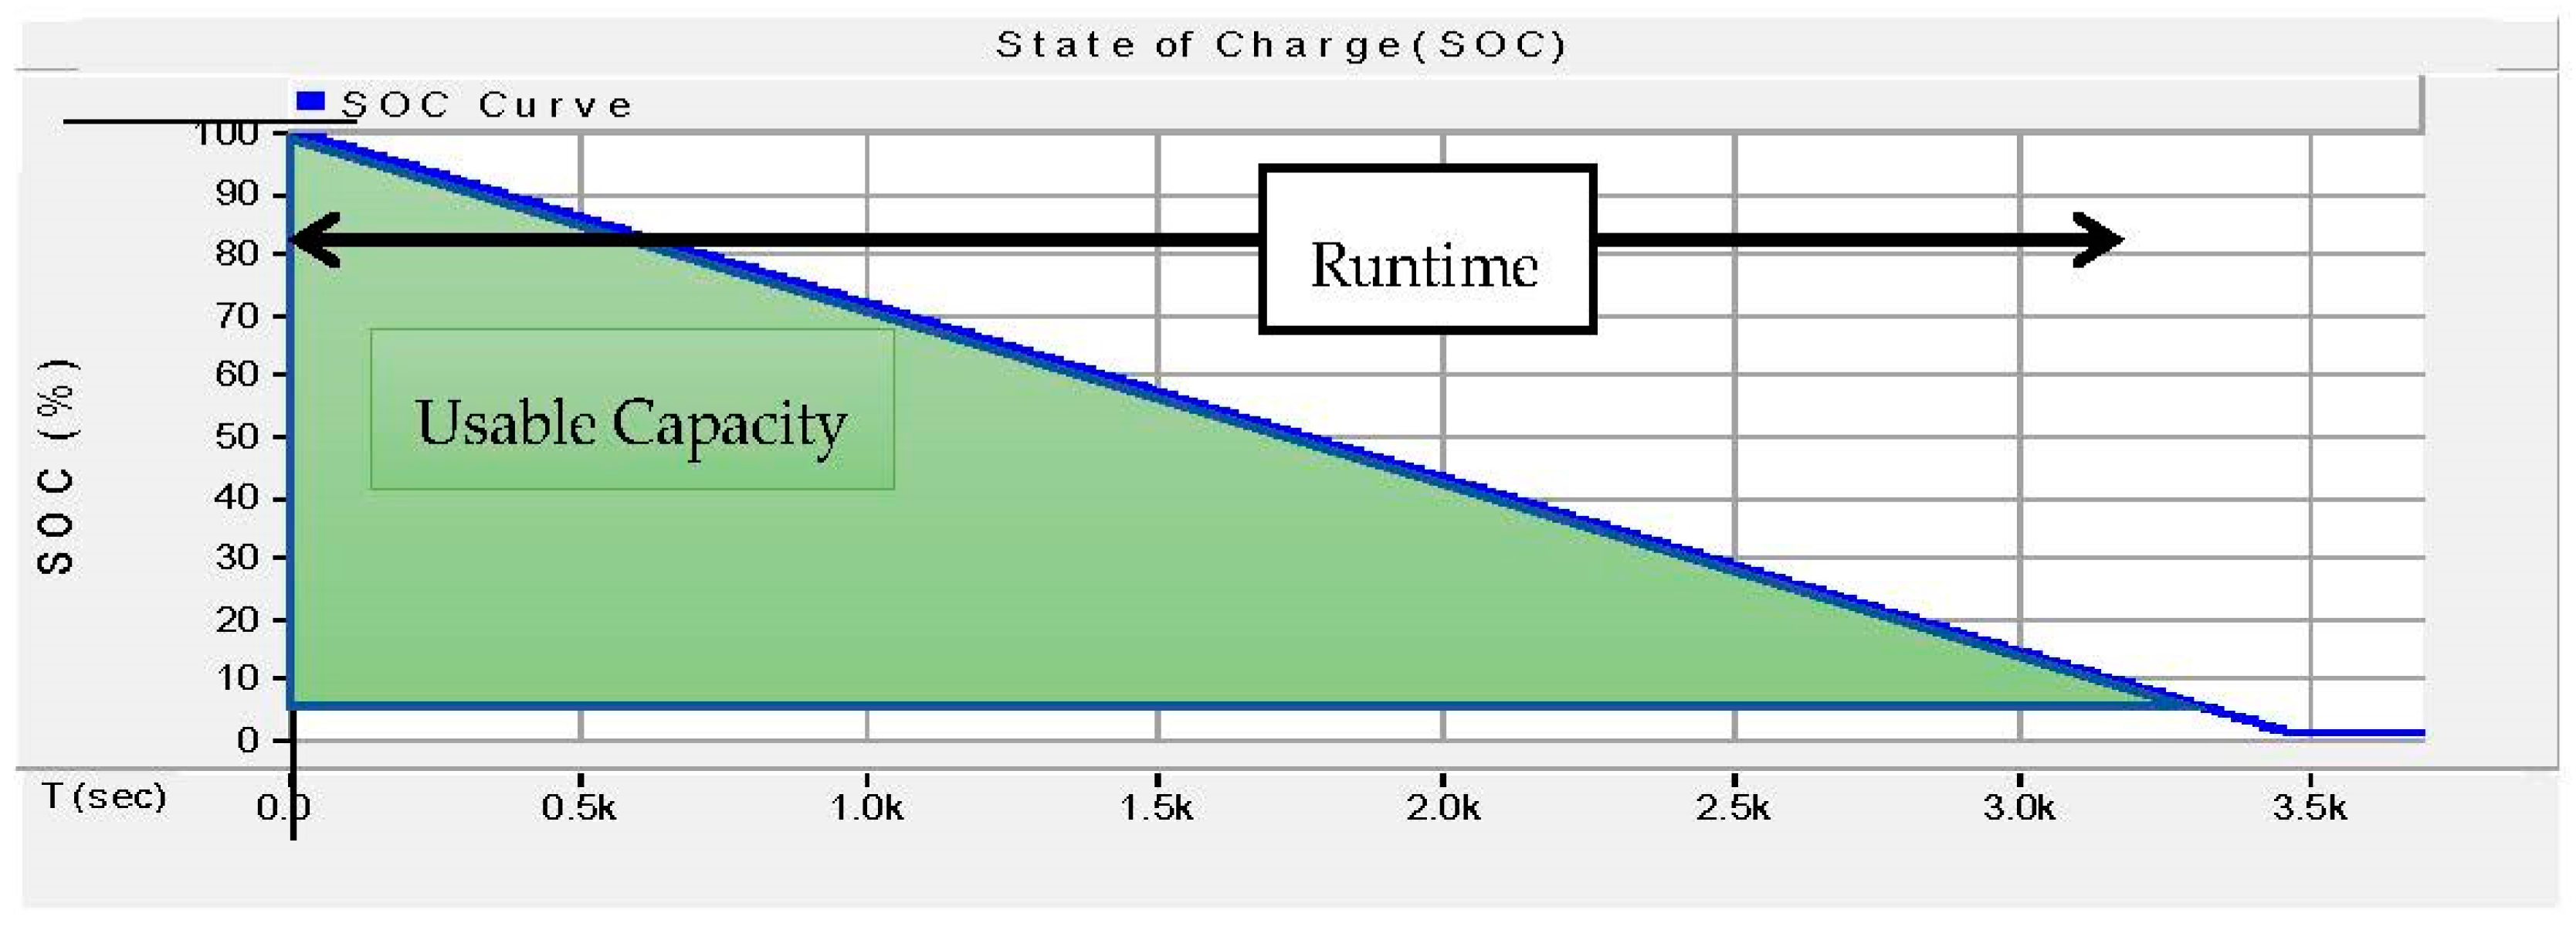
33]. Even for the remote MGs, the sizing considerations vary from situation to situation. Runtime is one of the determinants of capacity sizing. As discussed in Section 2.1, the time lapse in discharging battery from fully charged state to lower limit of SOC is the runtime of battery. The runtime of the same battery is different for different MODs as simulated in Figure 12 for a lithium battery.
Information about the proper capacity sizing of the battery can be obtained from this result. A situation was assumed below to verify the impact of runtime comparisons between different DCMs on the battery sizing. The situation is that the battery was designated to feed a critical load from 6:00 p.m. to 6:00 a.m. and it must be recharged again from 6:00 a.m. to 6:00 p.m. During 6:00 a.m. to 6:00 p.m. both the critical load and battery will be supplied by a utility. The utility is scheduled to supply only from 6:00 a.m. to 6:00 p.m. Since the load is critical the battery must supply every second from 6:00 p.m. to 6:00 a.m. which requires a proper capacity sizing. Only two cases out of the possible cases are discussed below:
Case 1: The battery capacity is sized based on CIL to feed the critical load from 6:00 p.m. to 6:00 a.m. Is the capacity sizing of battery accurate for the load other than CIL? The same battery if discharged to CPL, it will reach the end point before 6:00 a.m. and before 6:00 a.m. the utility is also not available as assumed in the developed situation. The load is critical load so this sort of situation is not acceptable. The battery will be undersized for the case.
Case 2: The battery capacity is sized based on CPL. Now the capacity will be enough to feed the critical CPL for every second from 6:00 p.m. to 6:00 a.m. This capacity will be more than enough to feed the CIL and CCL but the power rating done based on CPL will be overred for CIL and CCL. Thus a tradeoff between different DCMs must be investigated so that a battery neither faces overrating nor undersizing.

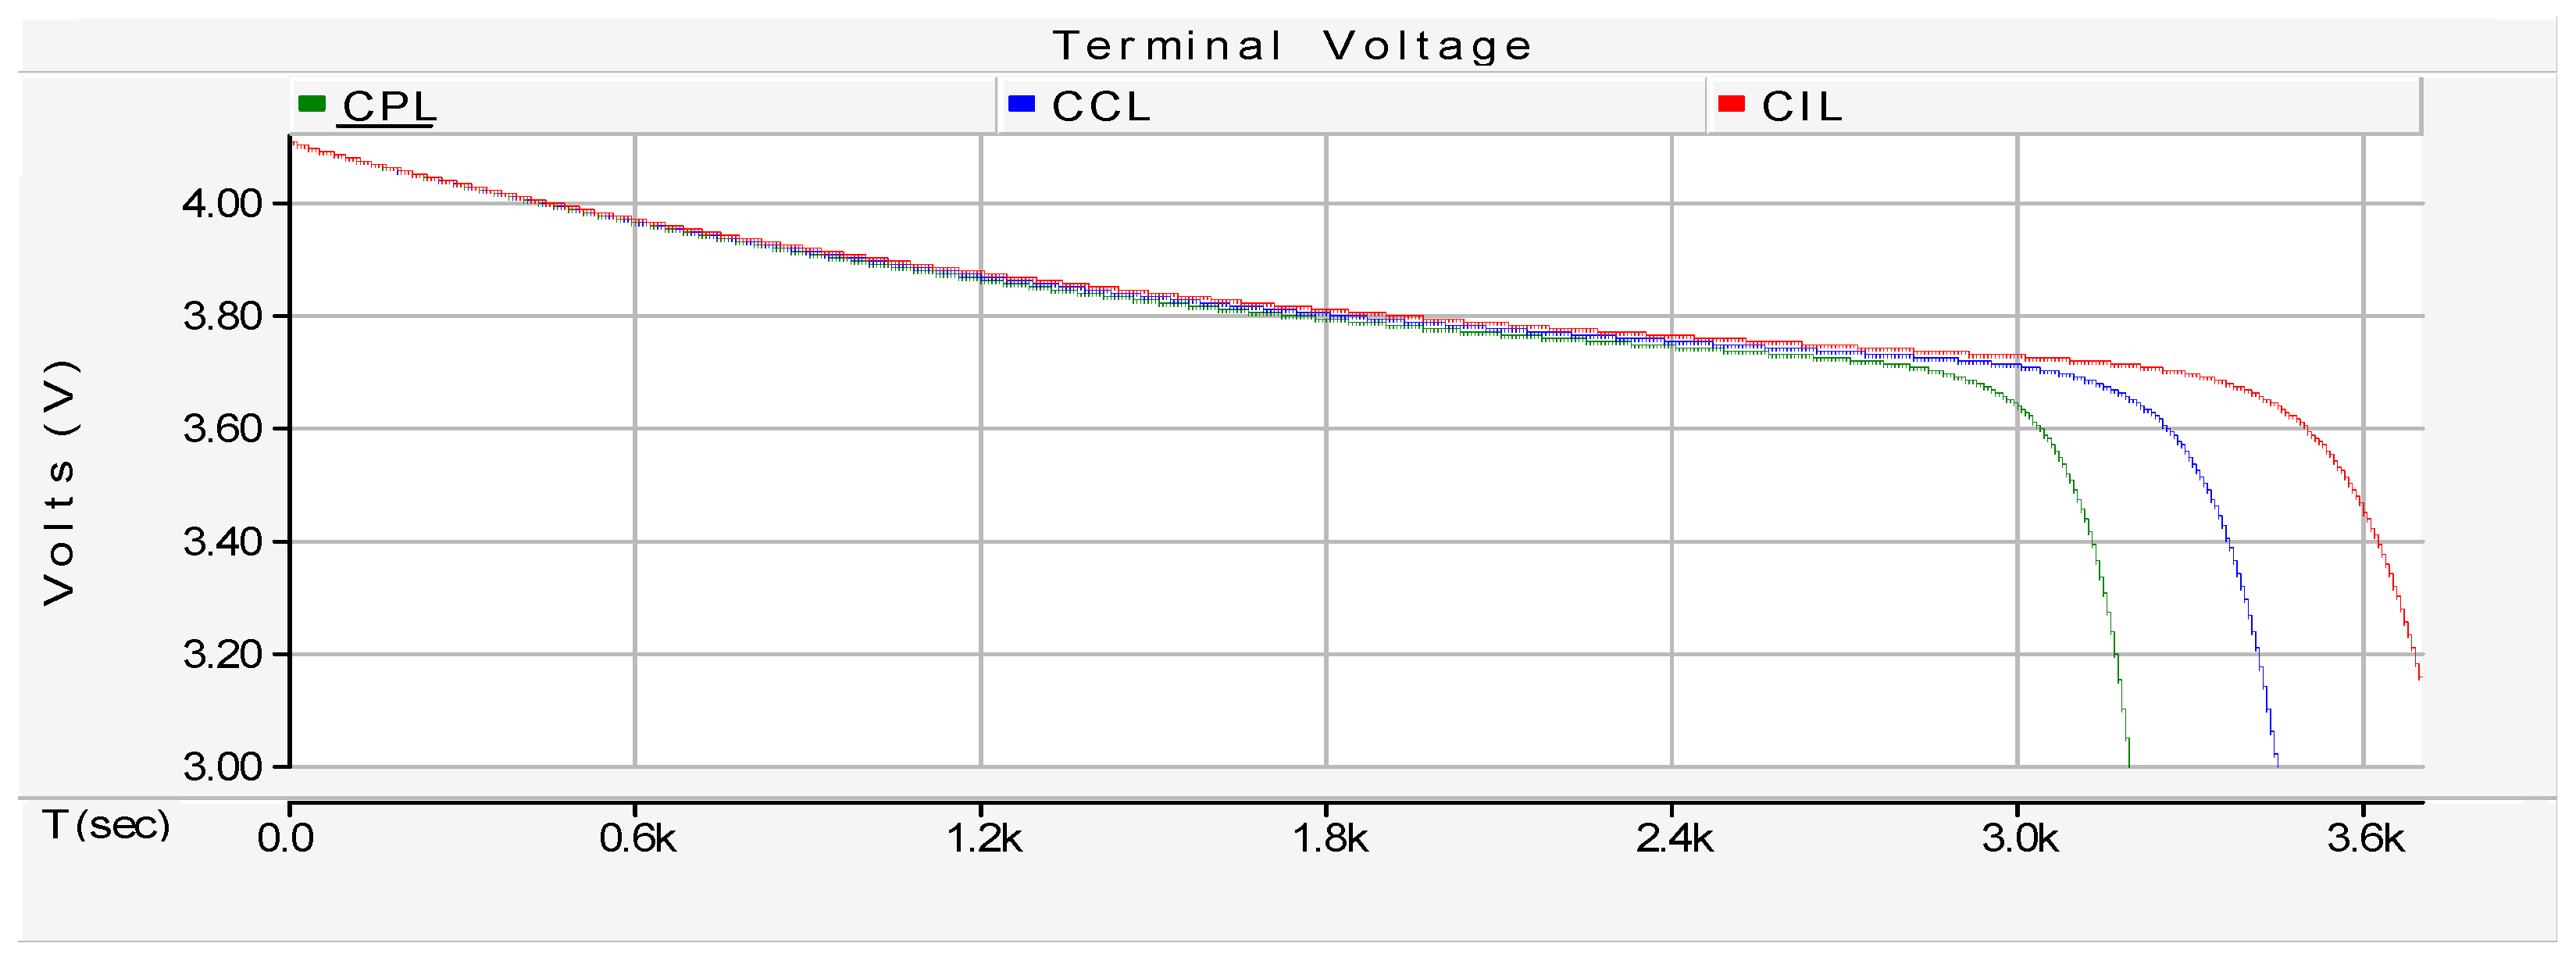
7.3. Terminal Voltage and Negative Impedance Stability

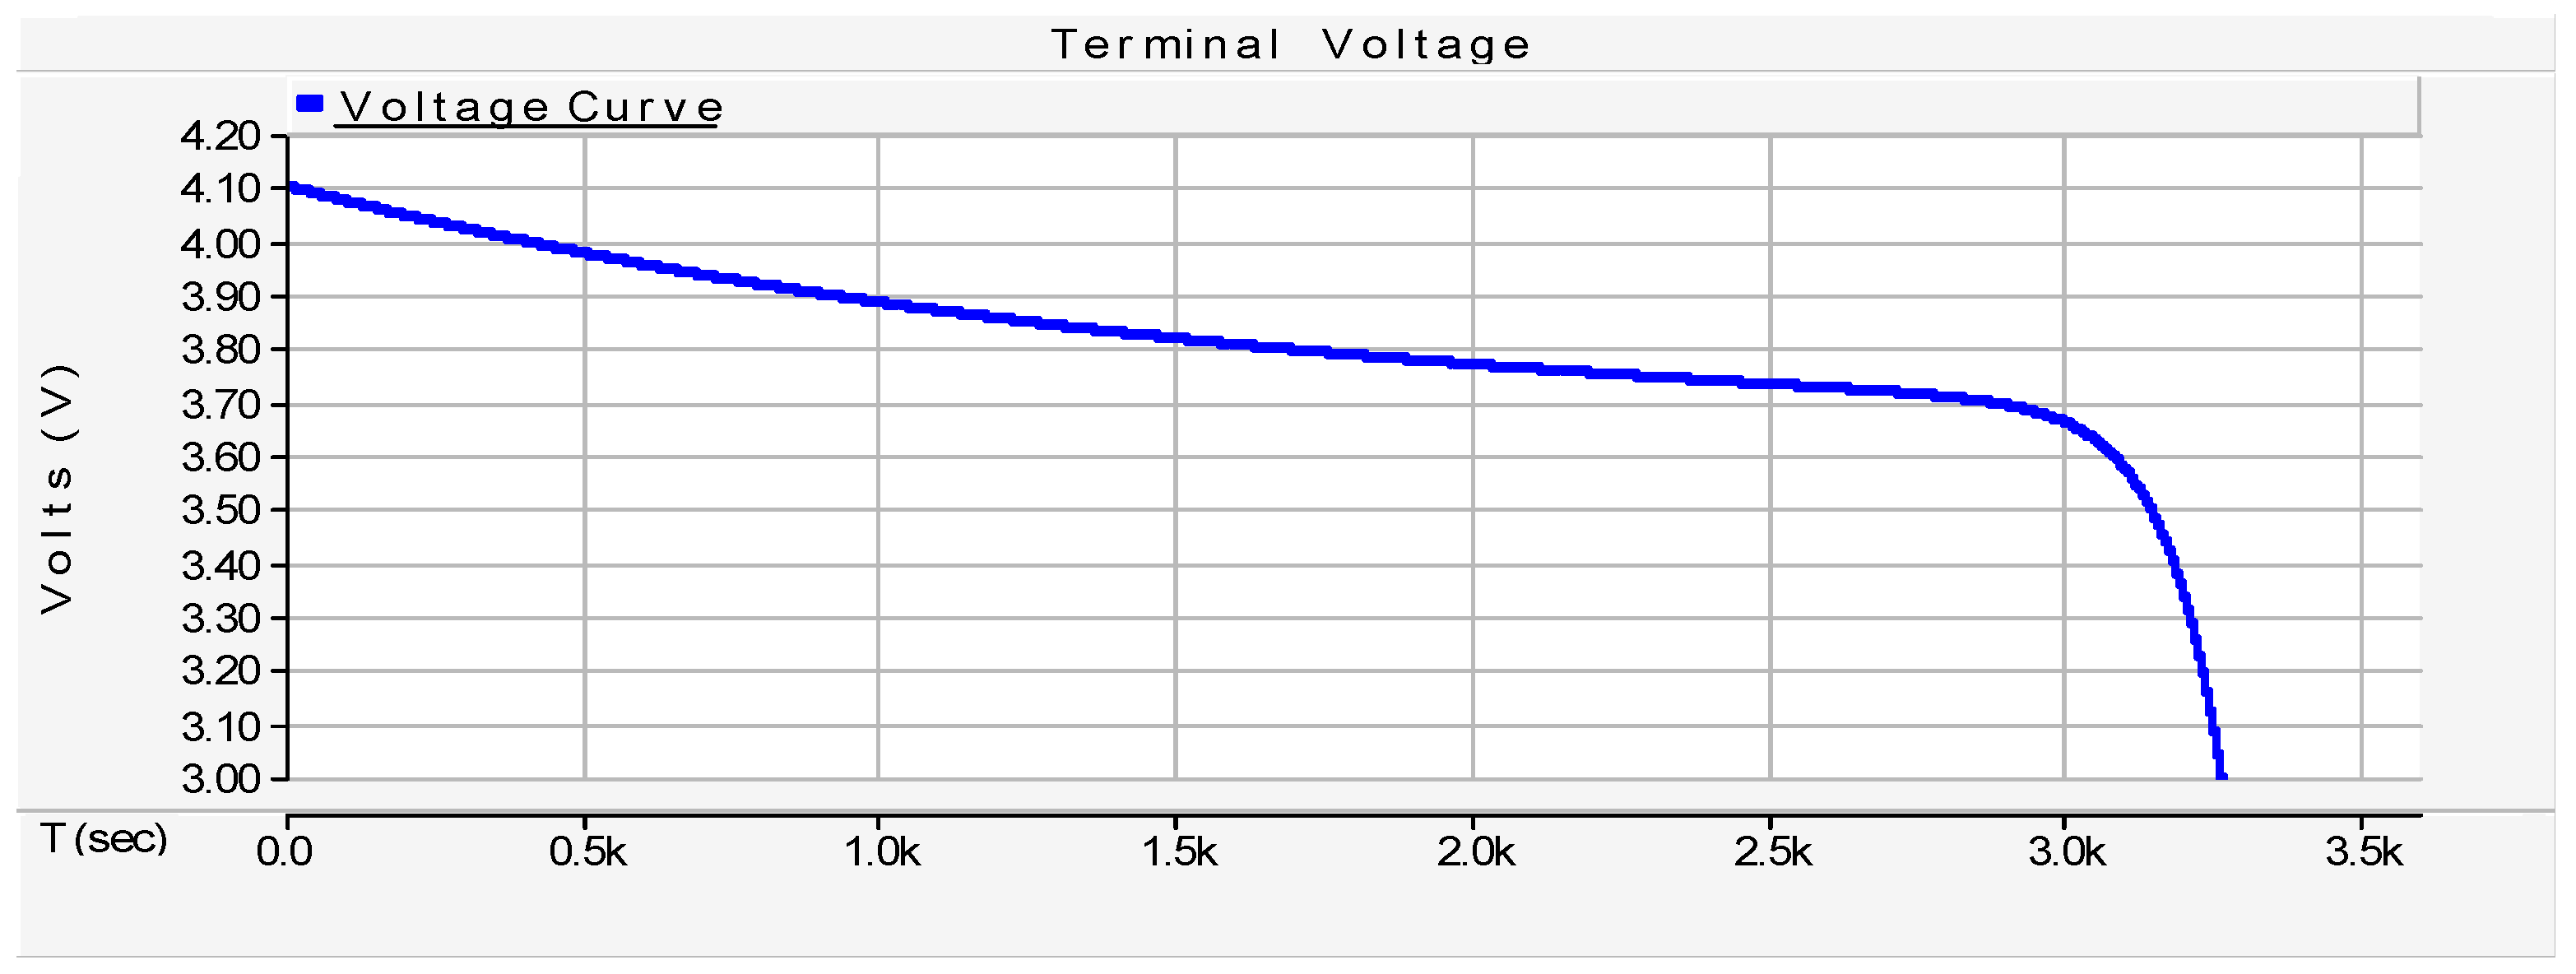
The decreasing pattern of the terminal voltage with the decrease in SOC (from left to right) is shown in Figure 13. As the voltage increases the current must decrease and vice versa to keep the power constant in CPL. This sort of transient current behavior brings instability in open-loop systems and makes the design of controllers a challenging task in closed loop systems [34] to which the CPL is connected. This stability issue can be resolved by making the curve for terminal voltage flat.

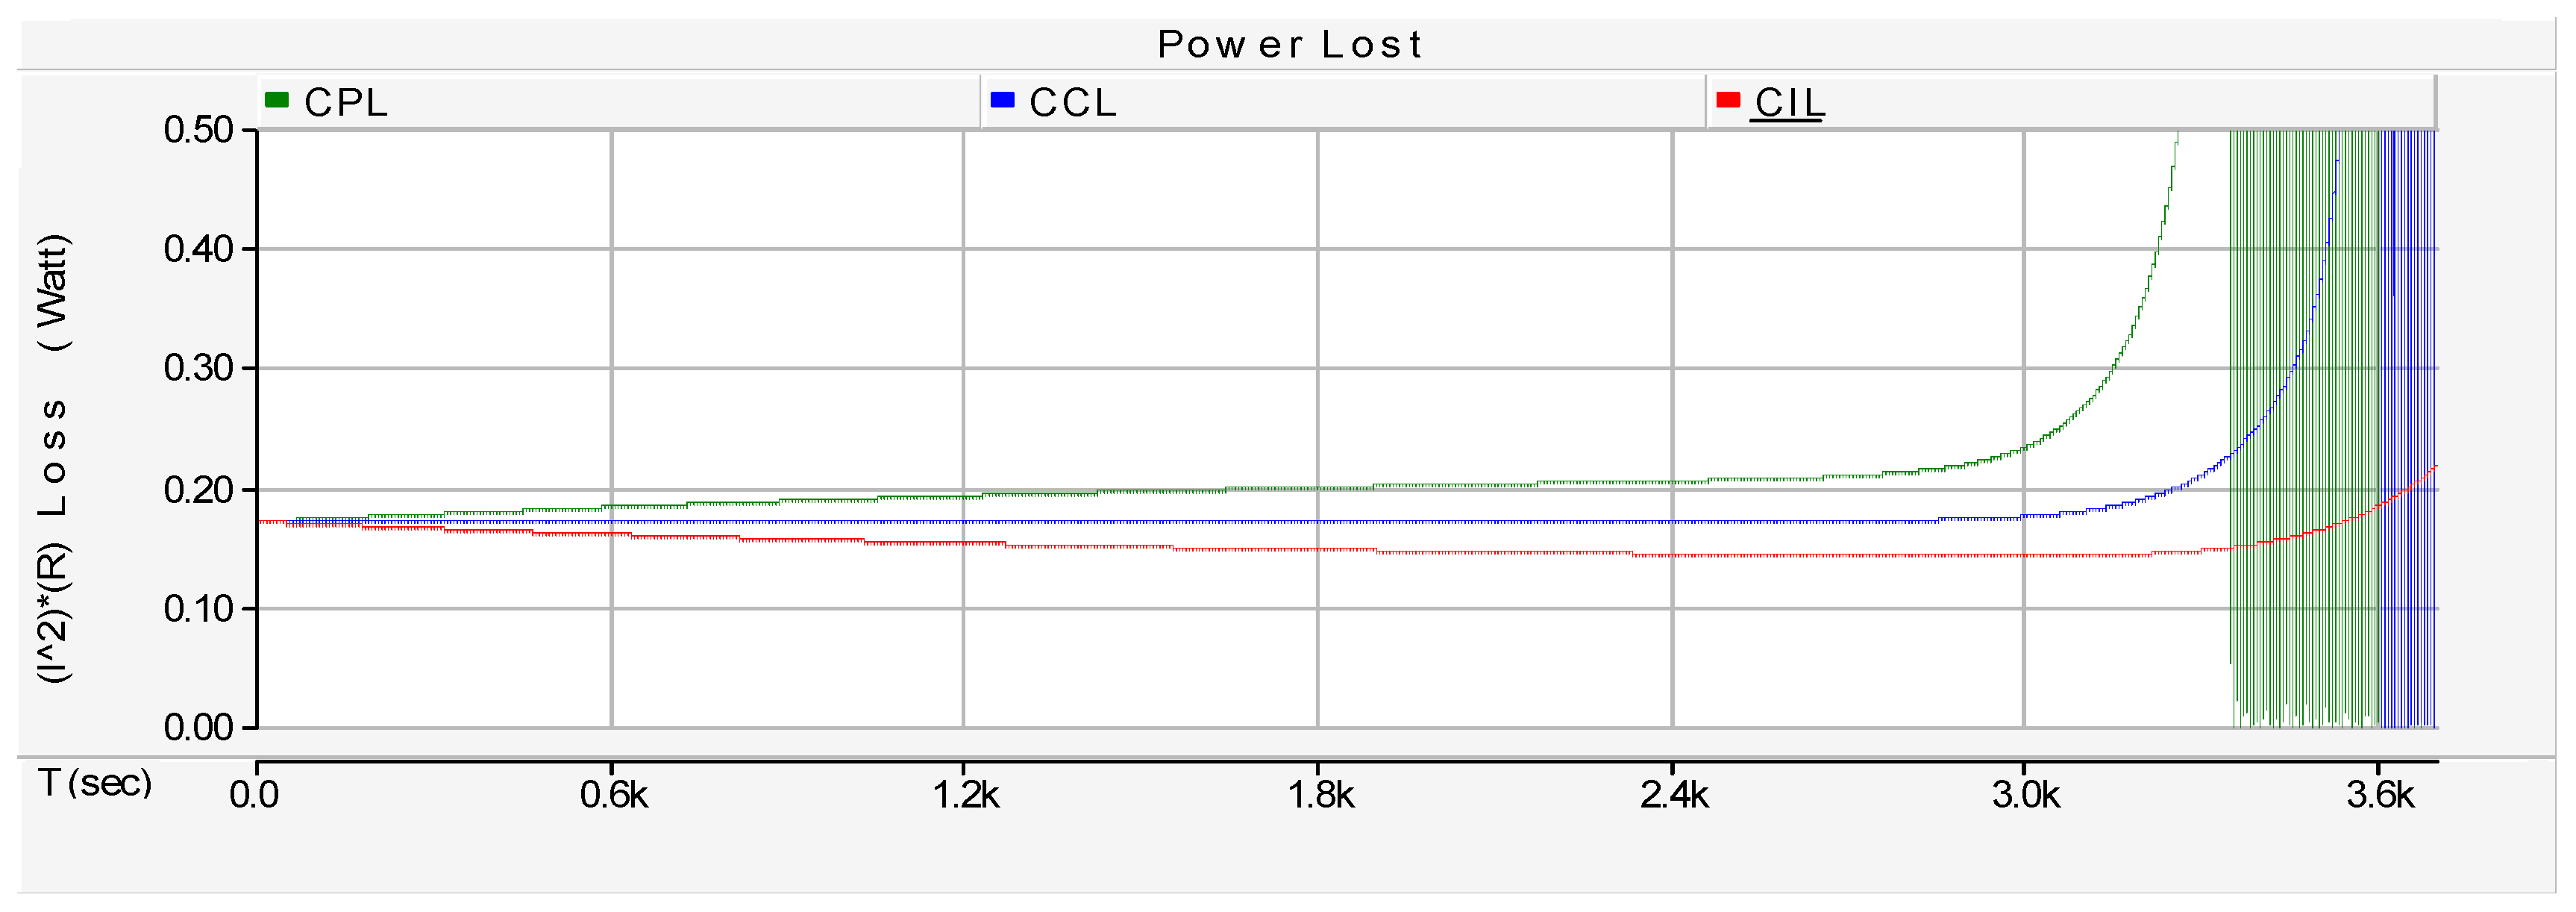
7.4. Discharge Current and Power Lost

The power lost I 2 R shown in 
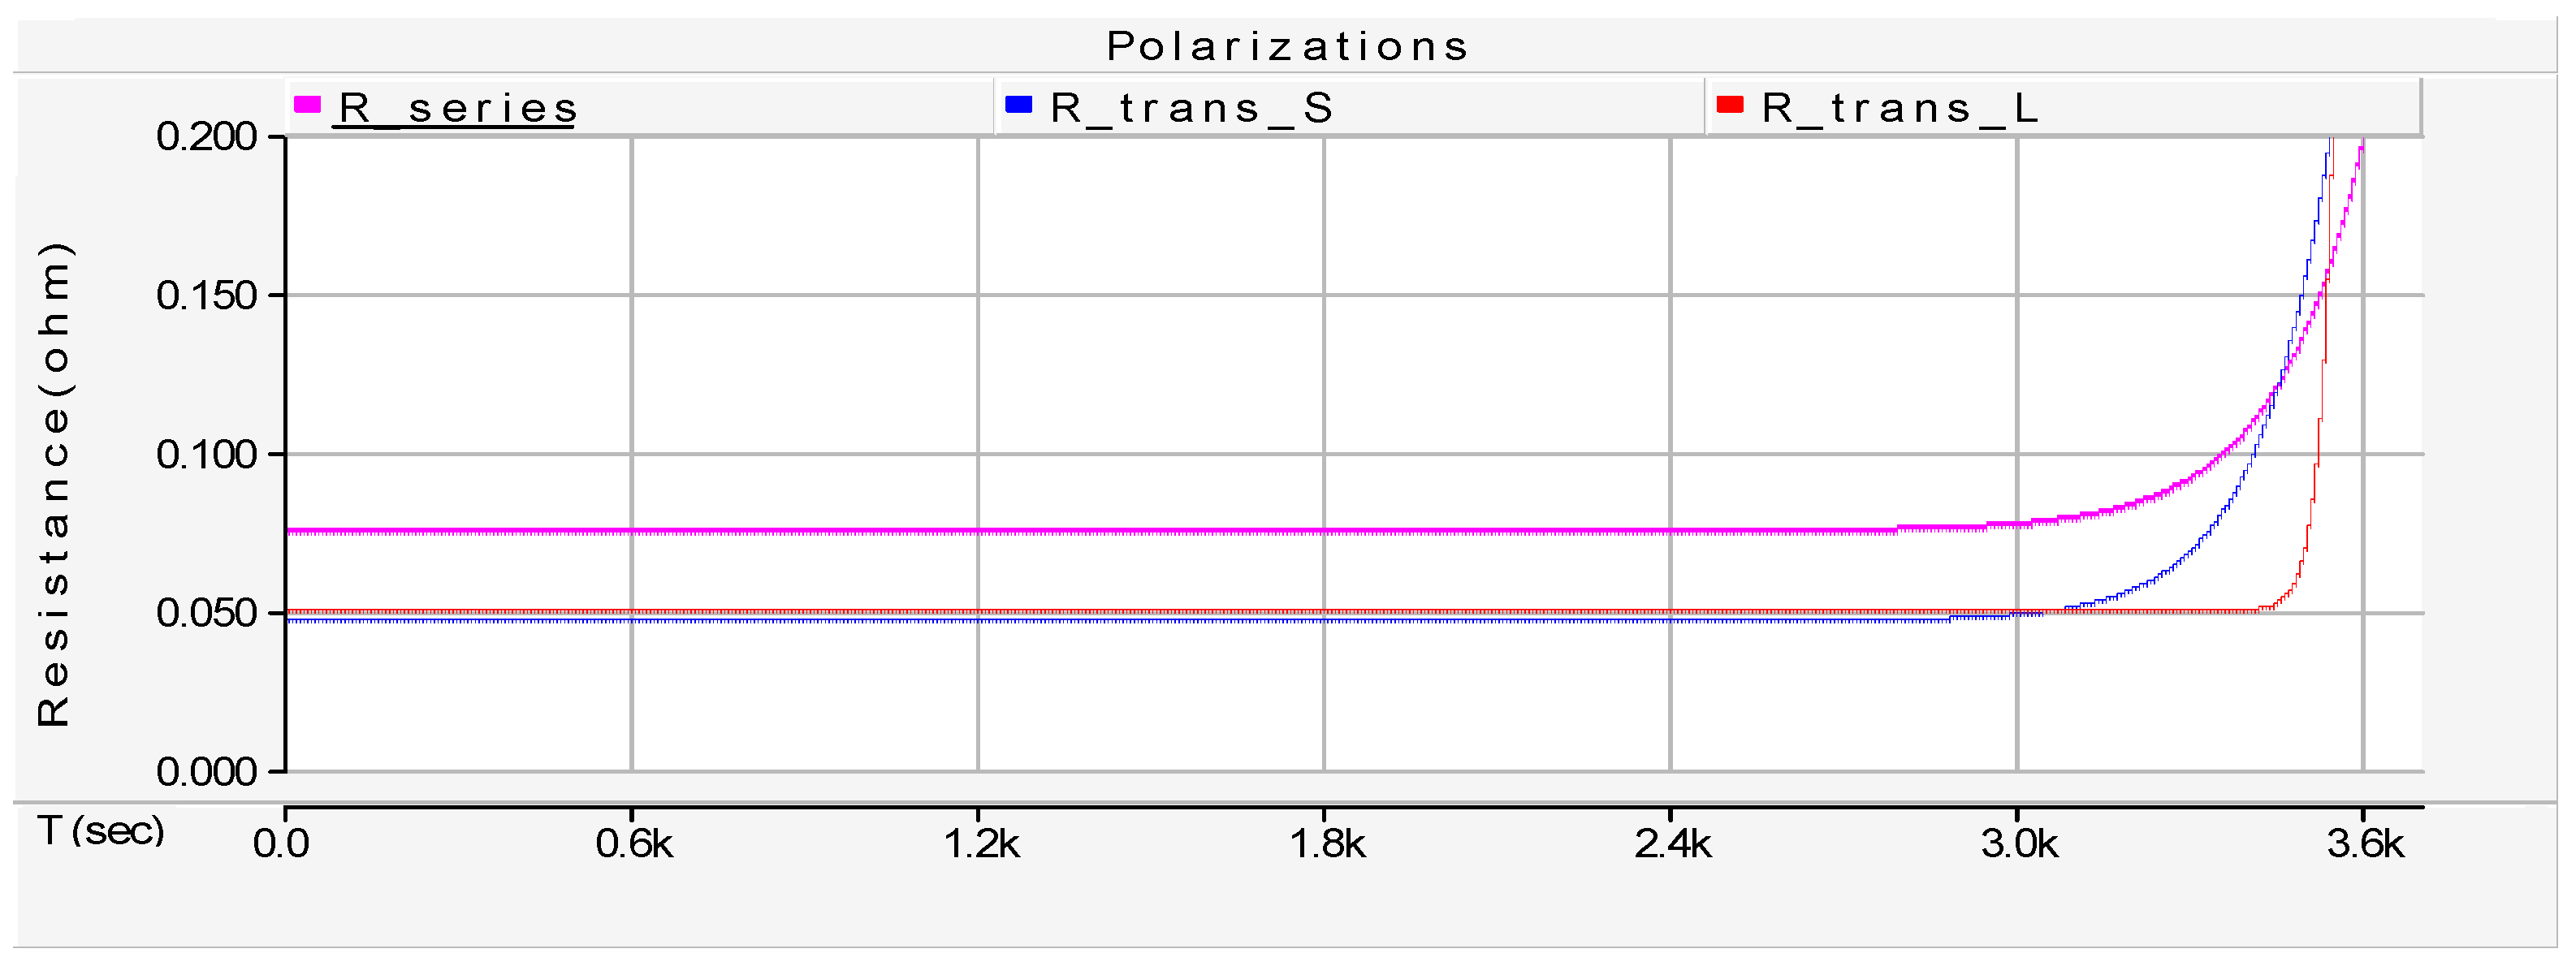
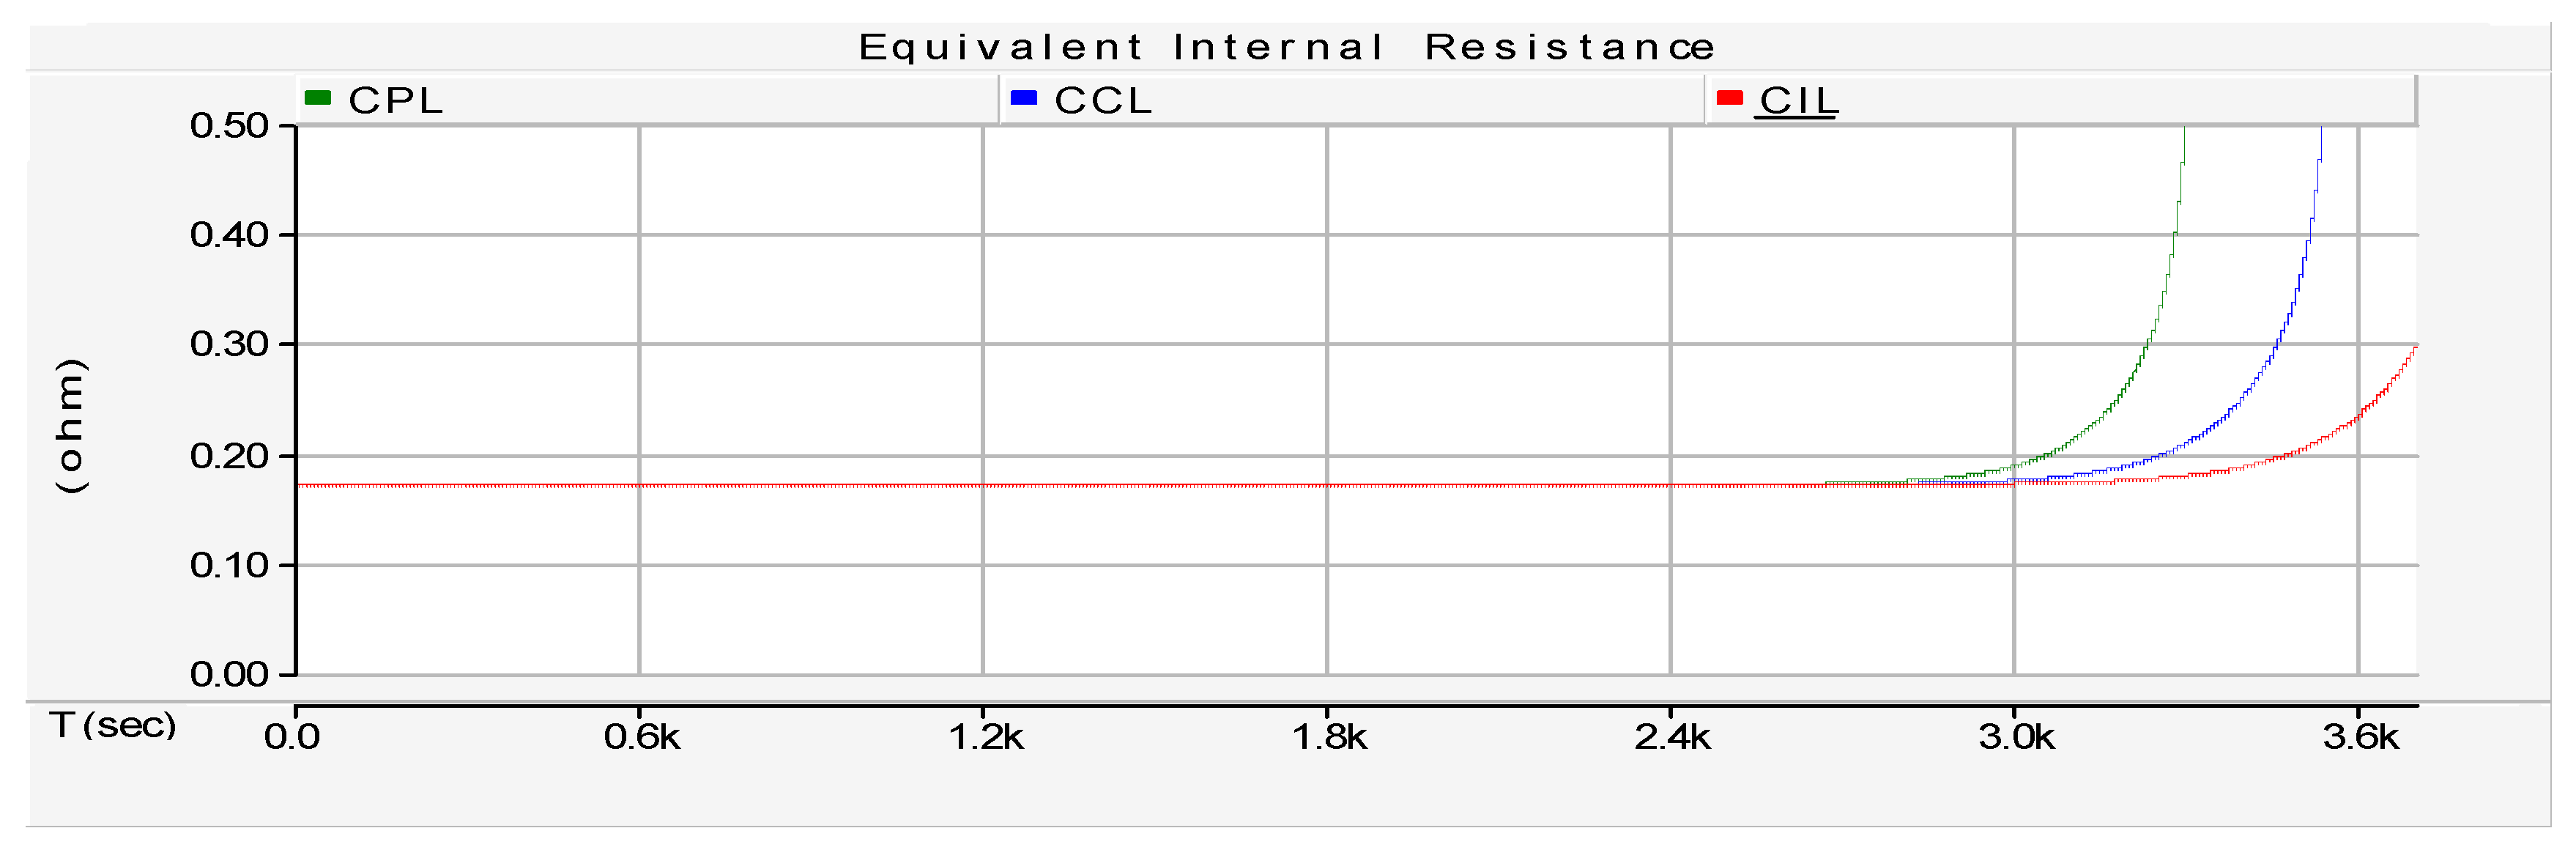
Figure 14 depends on the discharge current and internal resistance of the battery. The internal resistance for all the modes is almost same in the operational region, as can be seen in 
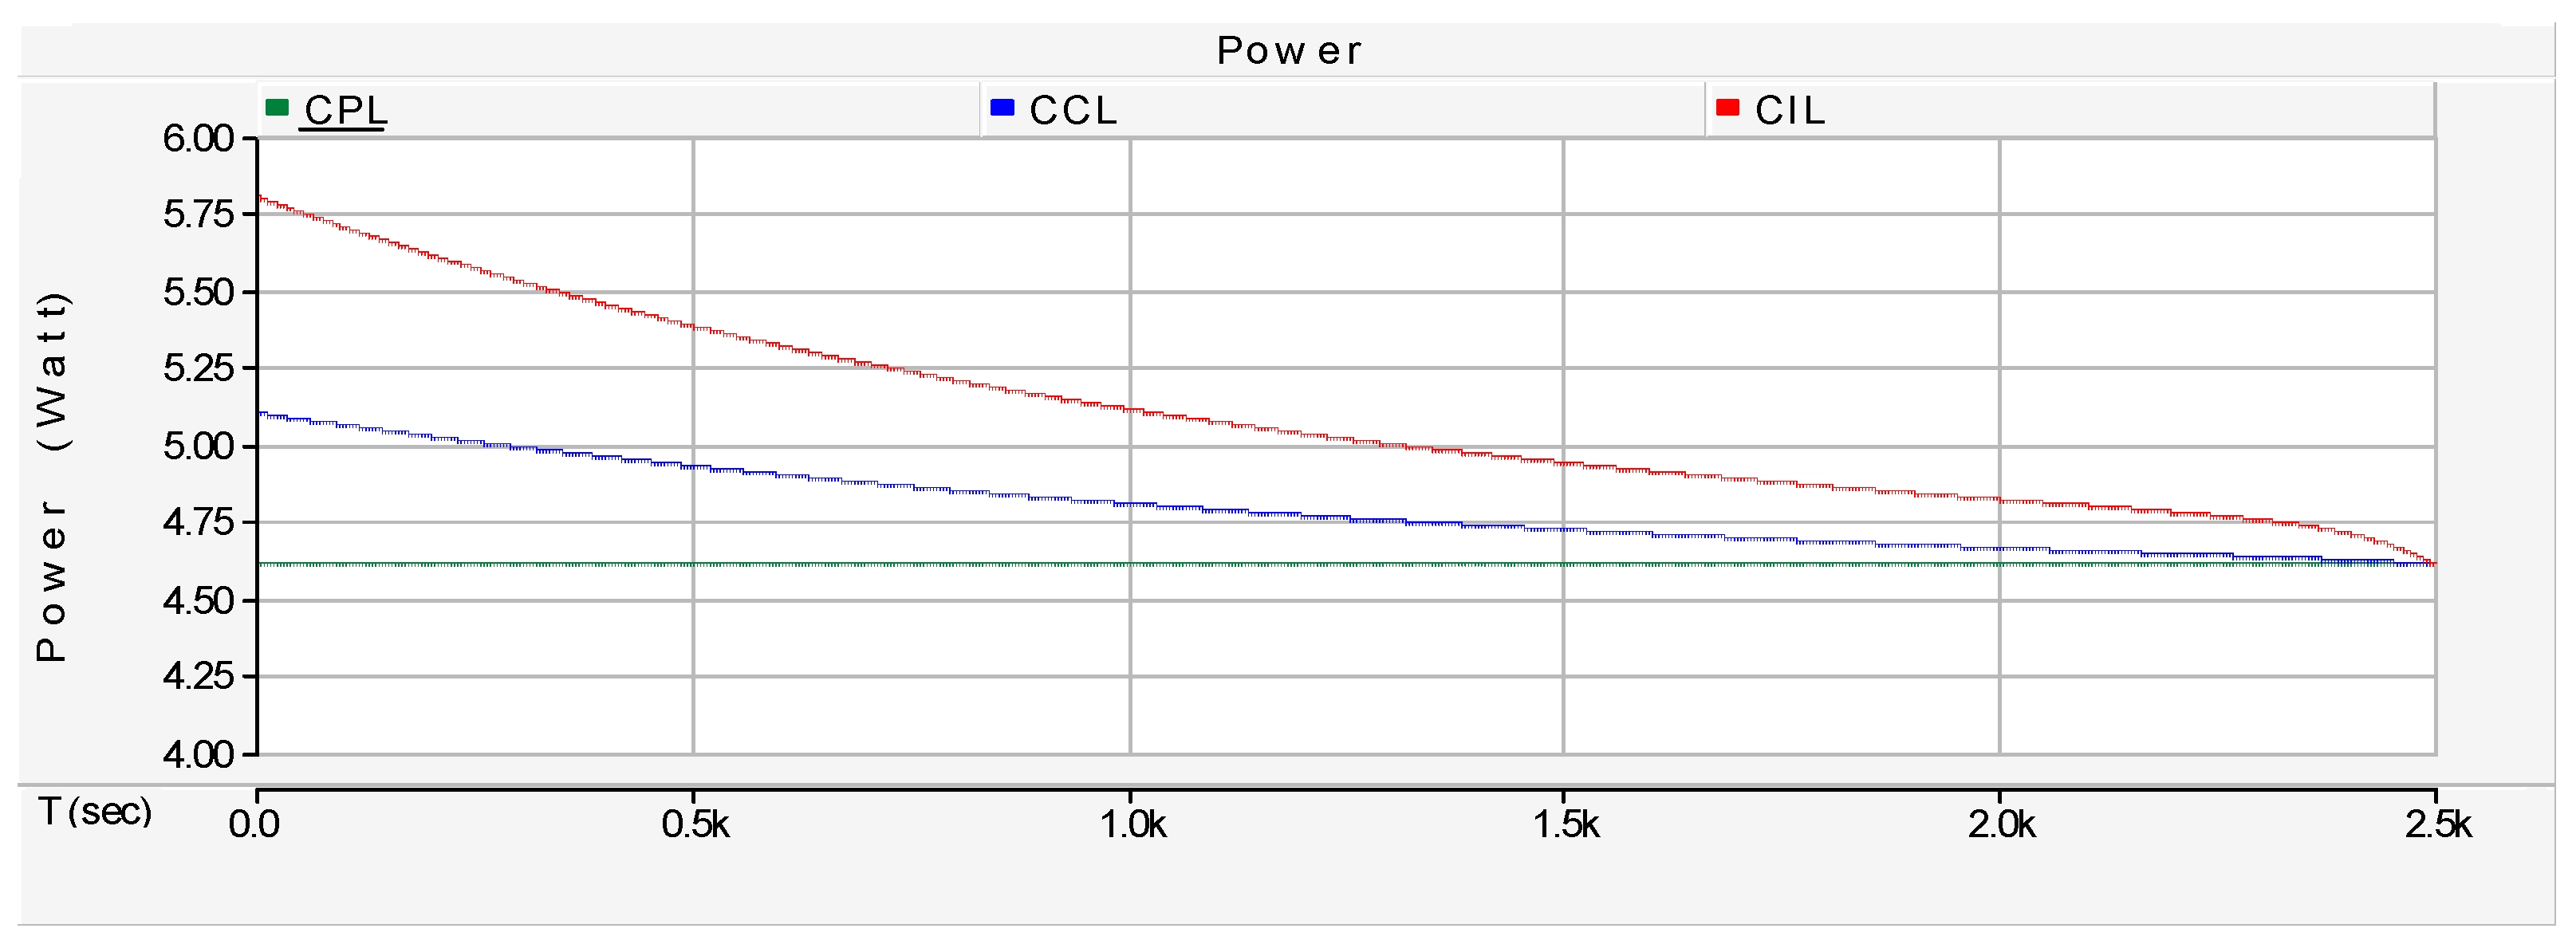
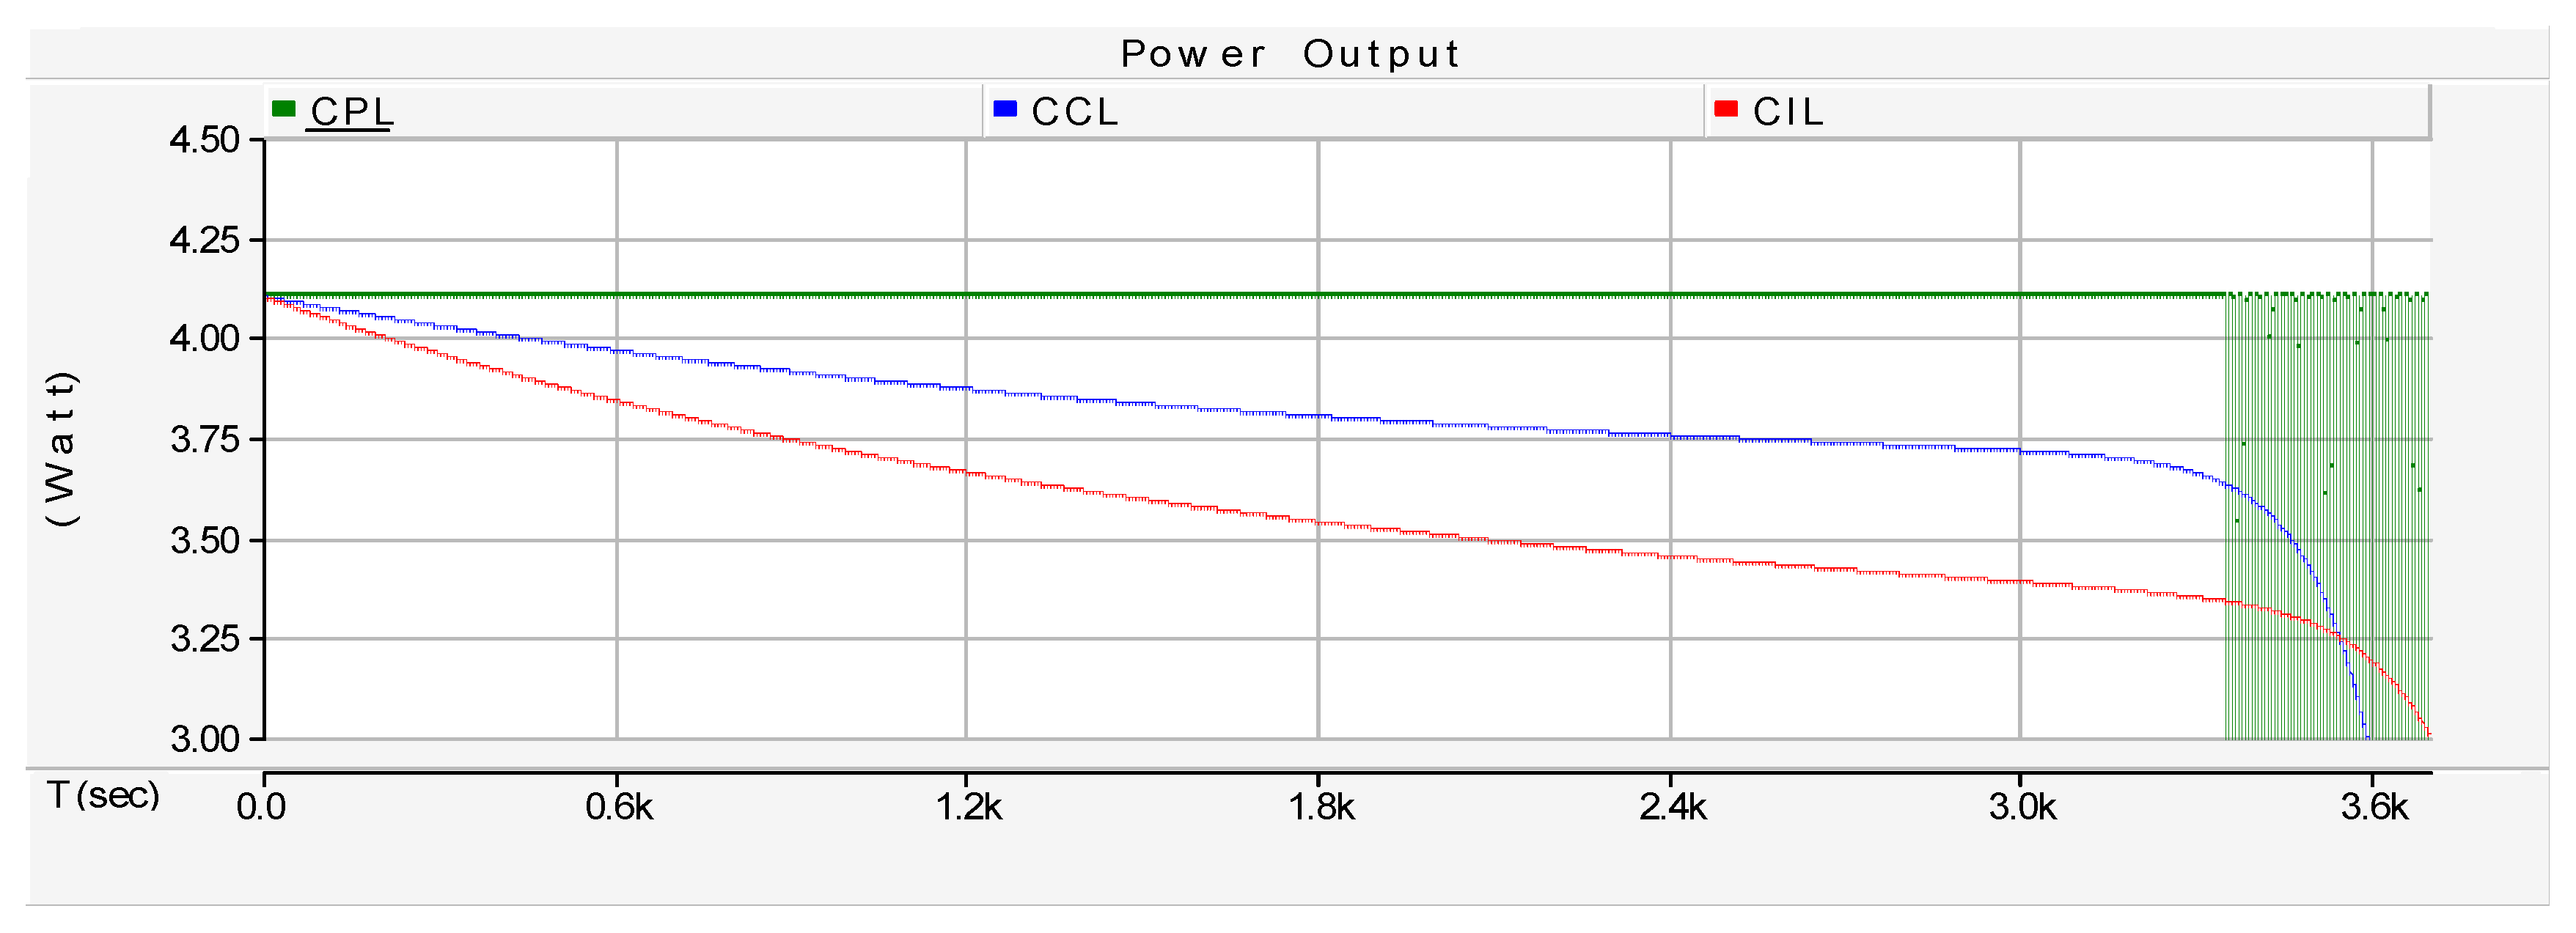
Figure 15, so the different discharge current results in different power lost for every mode. As a result the output power is also different for every mode simulated in 
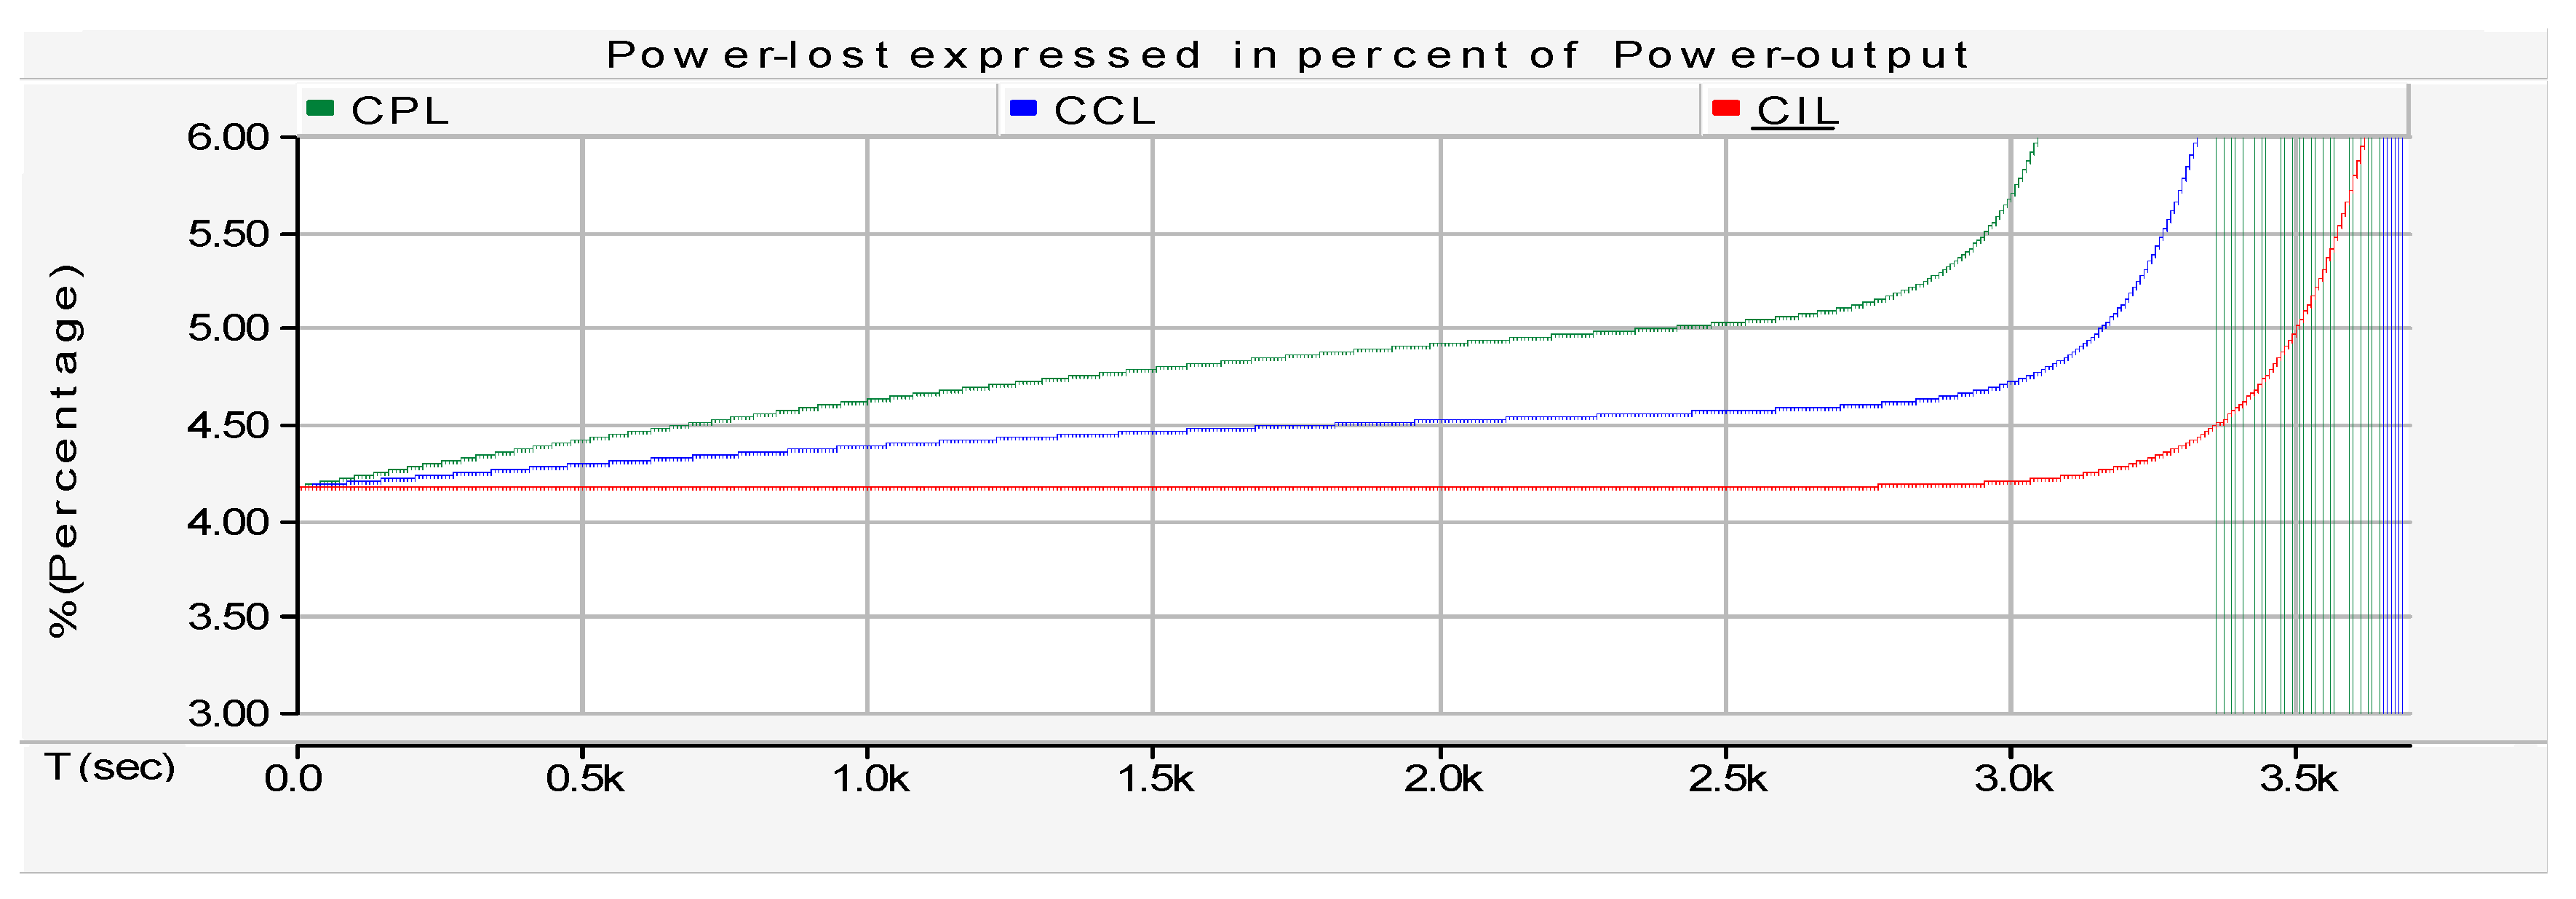
Figure 16. The power-lost was calculated also in terms of percent of the power-output as shown in Figure 17. It is observed that the more the output power required the more the power is lost such that the output power for CPL is maximum and also the power lost in CPL is maximum. In other words the battery must supply more current to increase the output power and decrease the current to decrease the output power. This increase and decrease in current is responsible for increase and decrease of power loss and output power.

7.5. Average Discharge Current and Efficiency

The efficiency of the battery is affected by the power lost I 2 R as discussed in 
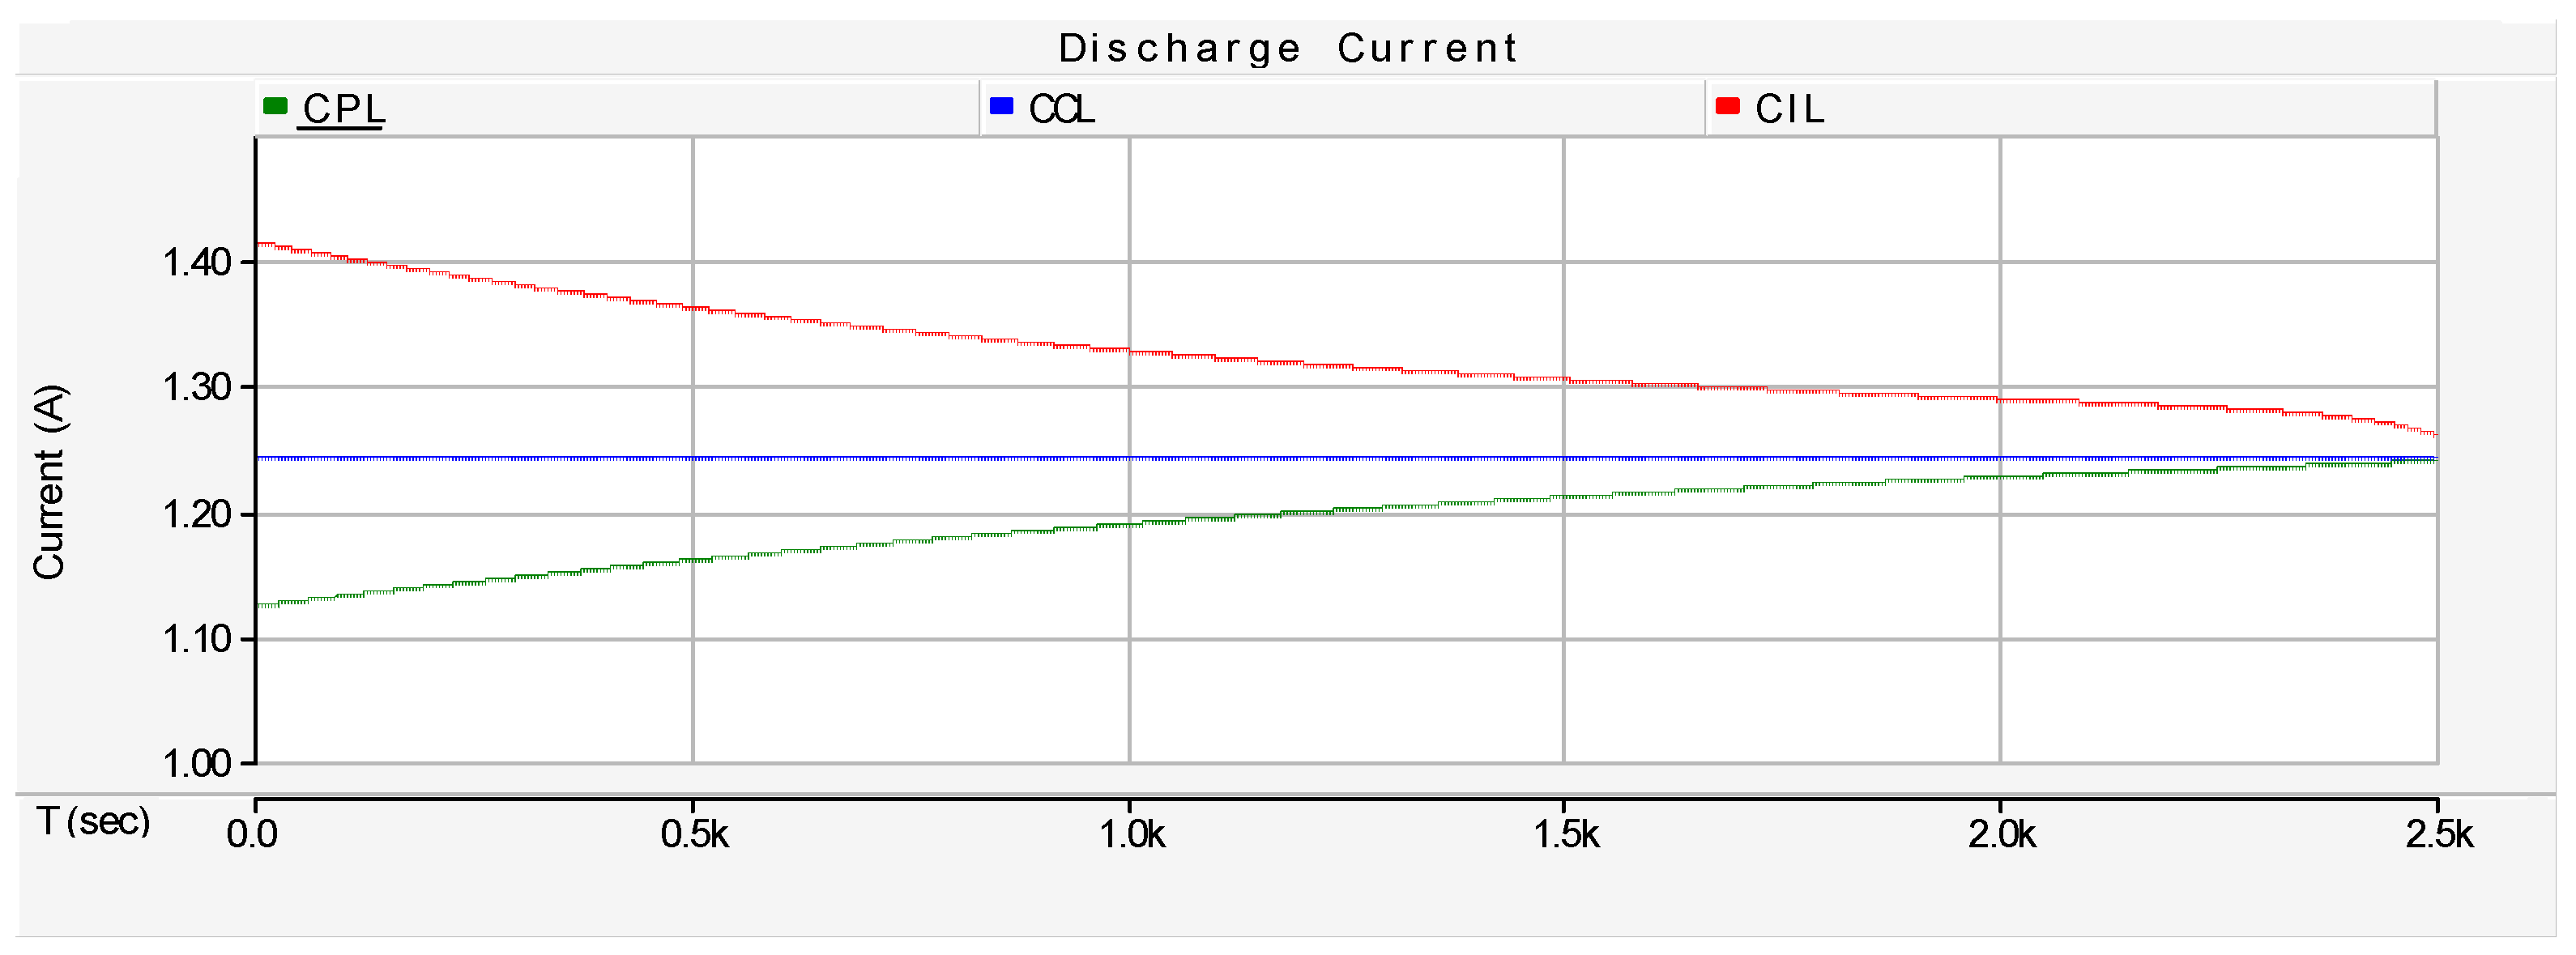
Section 2.5. To compare the efficiency of a battery for different modes it is necessary to know the power lost inside the battery to supply the same amount of output power. The battery DCM with minimal power lost to supply the same output power will have highest efficiency. As discussed above the internal resistance is almost same for all modes, so the discharge current shown in Figure 18 is the only indicator to compare the power lost. The most efficient DCM will have the least discharge current for the same output power as other modes. The discharge current is minimal for the CPL (Figure 15) which indicates the minimum power lost in CPM among the modes. Thus battery discharge in CPM has the highest efficiency. The same result can also be inferred from the power profile of the battery. To supply the same output power the initial power required for the CPM is least as shown in Figure 19.

8. Idea of Optimal Capacity Sizing and BMS Operation

The possible problems a battery may face for ignoring load mode in the sizing of the battery are already discussed in Section 7. An idea is proposed below which can tackle these problems. A load sample from a remote village has been considered to make obvious the impact of this idea. It is assumed that the village load consists of one grist mill and the lighting load of the residential area. Lighting load consists of incandescent bulbs which behave as CIL and magnetic ballast-based CFLs which behave as CCL. The power electronics coupled with the drives of the grist mill are tightly regulated and behave as CPLs. Both the loads are equal in magnitude and can be connected and disconnected to battery through respective switches (Sw). This situation is pictured in Figure 20. In context to the aforementioned load situation the proposed idea can be stated as:
(a)
Modular design of battery with option of flexible capacity to feed all modes of the load optimally and safely (Section 8.1).
(b)
An option to attach and detach cells within a module allows extra cycles before the battery is fully exhausted (Section 8.2).
(c)
In case of low power capacity requirements unused cells can be utilized in such a way that the battery hidden charge could be recovered as well as the battery be fully utilized (Section 8.3).

8.1. Optimal Capacity Sizing Based on Modularization

The idea of optimal capacity sizing based on modularization is implemented by dividing the battery pack into modules. Each module consists of a number of cells arranged in parallel and detachable within the module and from the outside as well. This idea is shown in Figure 21.
Since the cells in the module can be selected and deselected, the capacity can be changed according to the optimum capacity requirements. In other words it can be said that this idea takes into account the worst case but provides an option for the optimal situation.

8.2. Deferral of the Battery Replacement

The capacity of the battery fades with the time and number of cycles. Once the battery approaches the upper limit of cycles it must be replaced with a new one. The most aged cell in the battery determines the end of the battery life. Thus identification of the most aged cell and it’s on- time replacement in the case of battery pack with multiple detachable cells can boost the number of cycles before the battery reaches end of life (Section 2.3).

8.3. Optimized BMS Operation

Although the modularized structure of battery provides an option to select or deselect the units the target should be the most optimized way to operate the selection and deselection of cells within the module. If n cells are enough to feed the load with CIL or CCL behavior then for CPL it is required to increase the maximum current rating of the battery as discussed in Section 7.1, so one or more cells need to be attached in parallel within the module to increase the maximum current capability. Similarly if n cells are enough to feed the load with CPL behavior then to feed the CIL/CCL one or more cells need to be detached within the module to avoid oversizing as discussed in Section 7.1. For the situation described by Figure 20 and Figure 21 it is assumed that all cells must be connected to supply CPL and any four cells must be connected to supply CIL/CCL (Figure 18) and based on the situation an operational flow process is proposed below in Figure 22.
The unconnected cell is replaced periodically with one of the connected cells and the replaced cell is given time to recover its charge. Since the SOC of newly connected cells differs from the SOC of already working cells, a cell balancing mechanism is a must. As the battery structure is modular, the cell balancing system also should be modular. The ultimate objective of this proposed algorithm is to fulfill the maximum current requirements for the CPL and fully utilize the battery during the CIL/CCL load. To facilitate the understanding of the proposed operation, let us say the dispatch schedule for the BESS is as below.
  • 05:00 p.m.–10:00 p.m.: Residential Load
  • 10:00 p.m.–06:00 a.m.: Charging by wind setup
  • 06:00 a.m.–11:00 a.m.: Mill load
  • 11:00 a.m.–05:00 p.m.: Charging by both wind and solar set up
Following the above dispatch schedule, the proposed operational schedule for BMS is tabulated in Table 2.

9. Conclusions

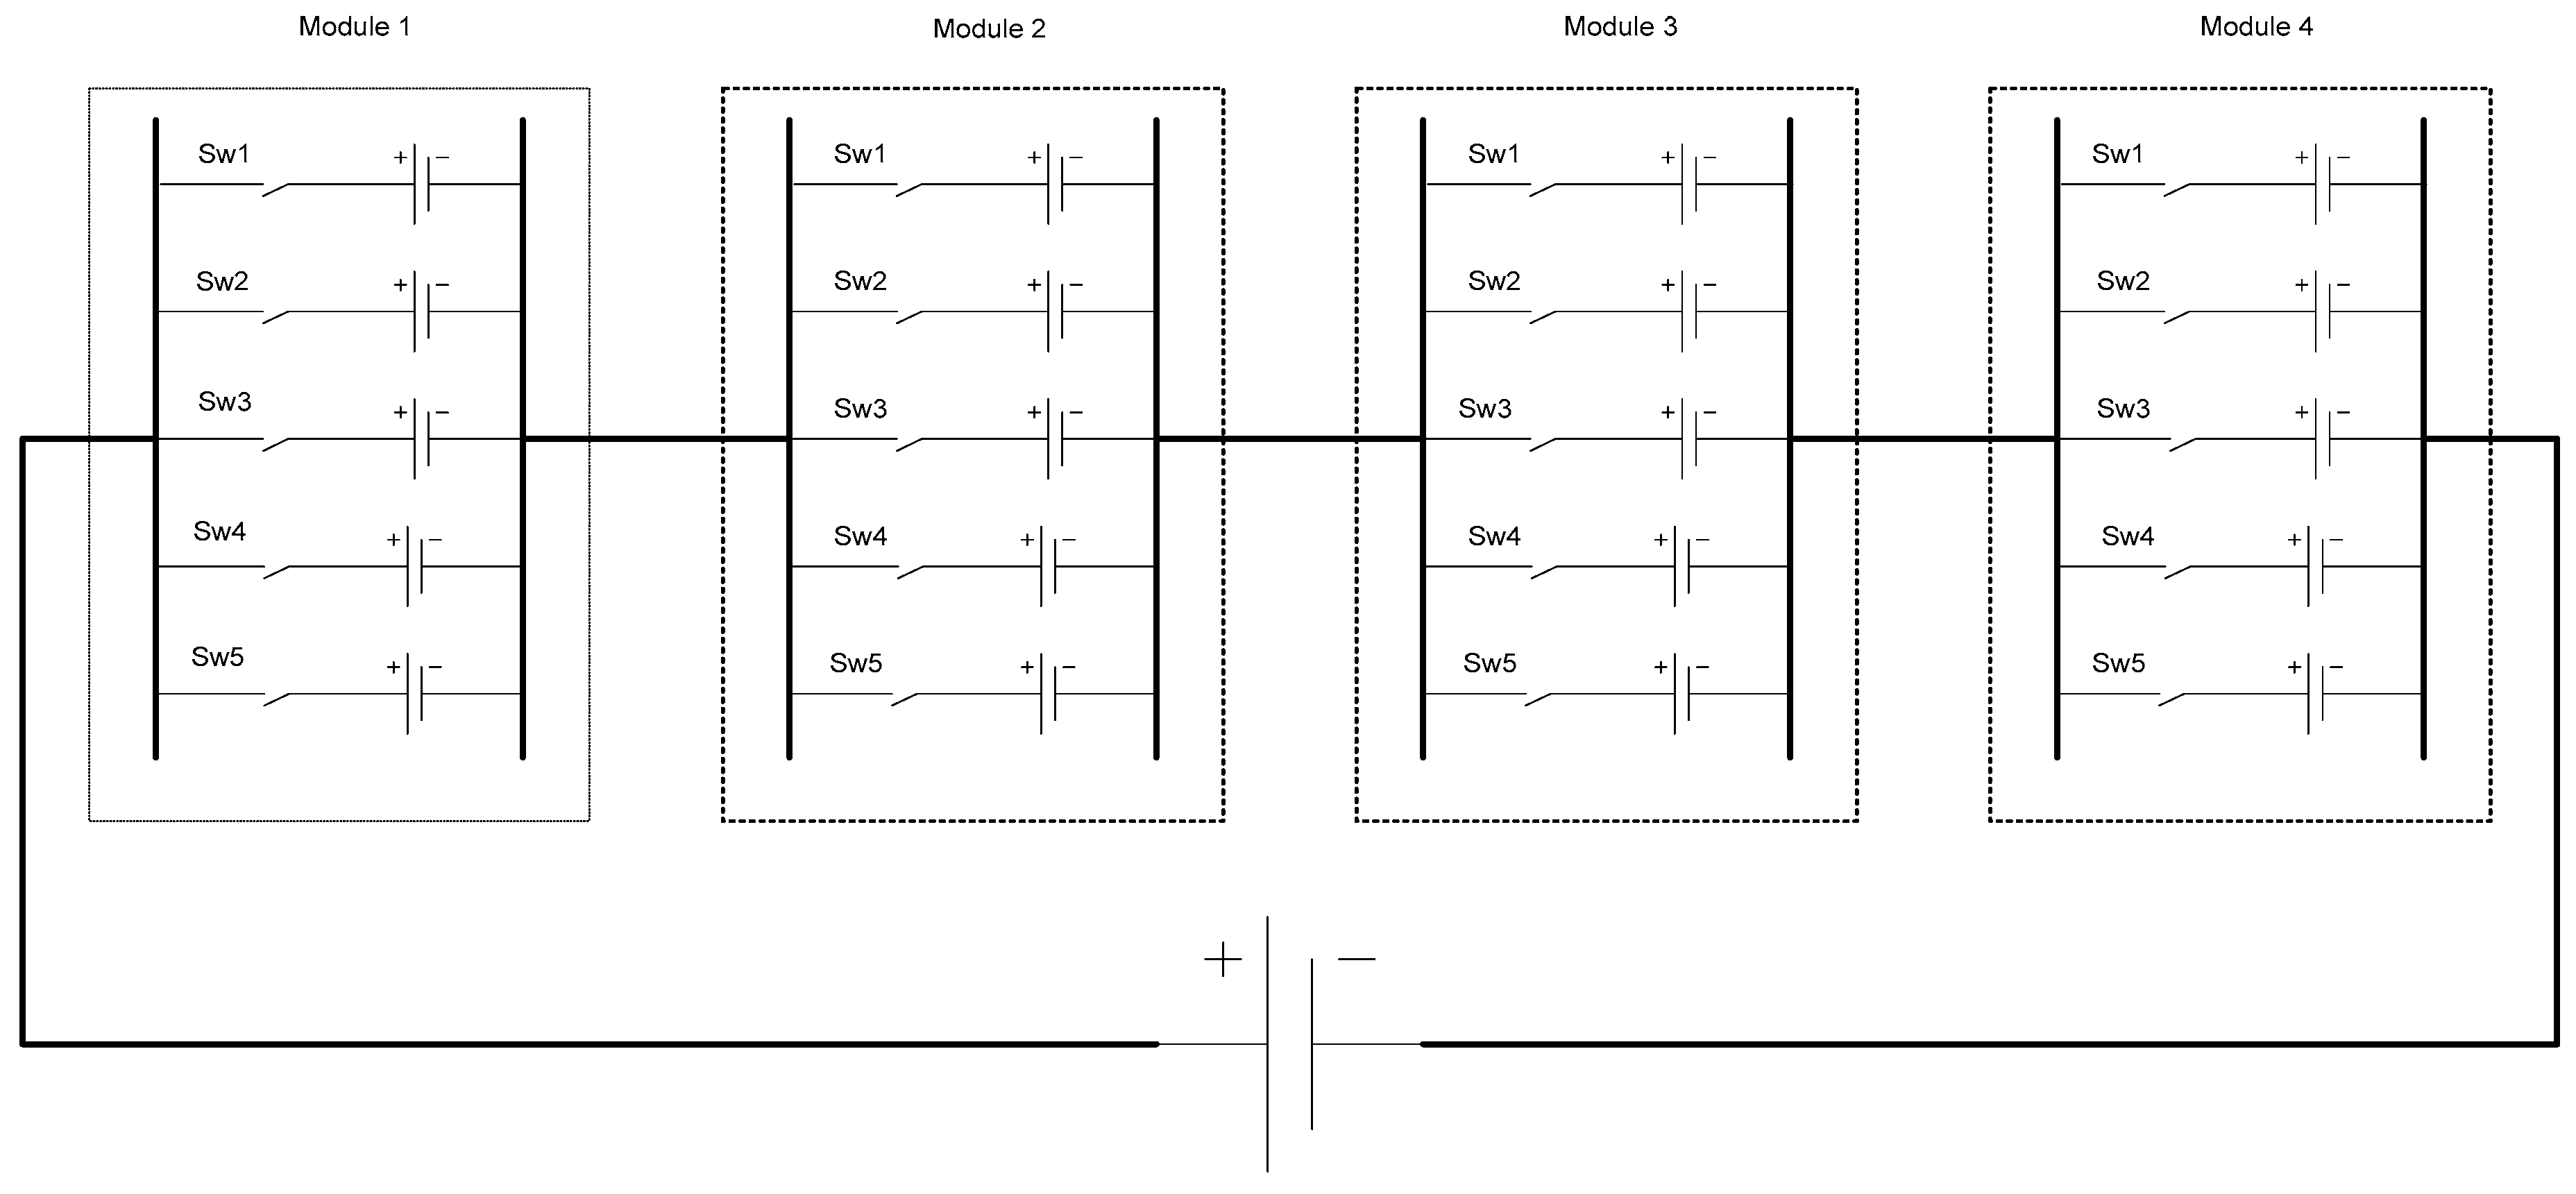
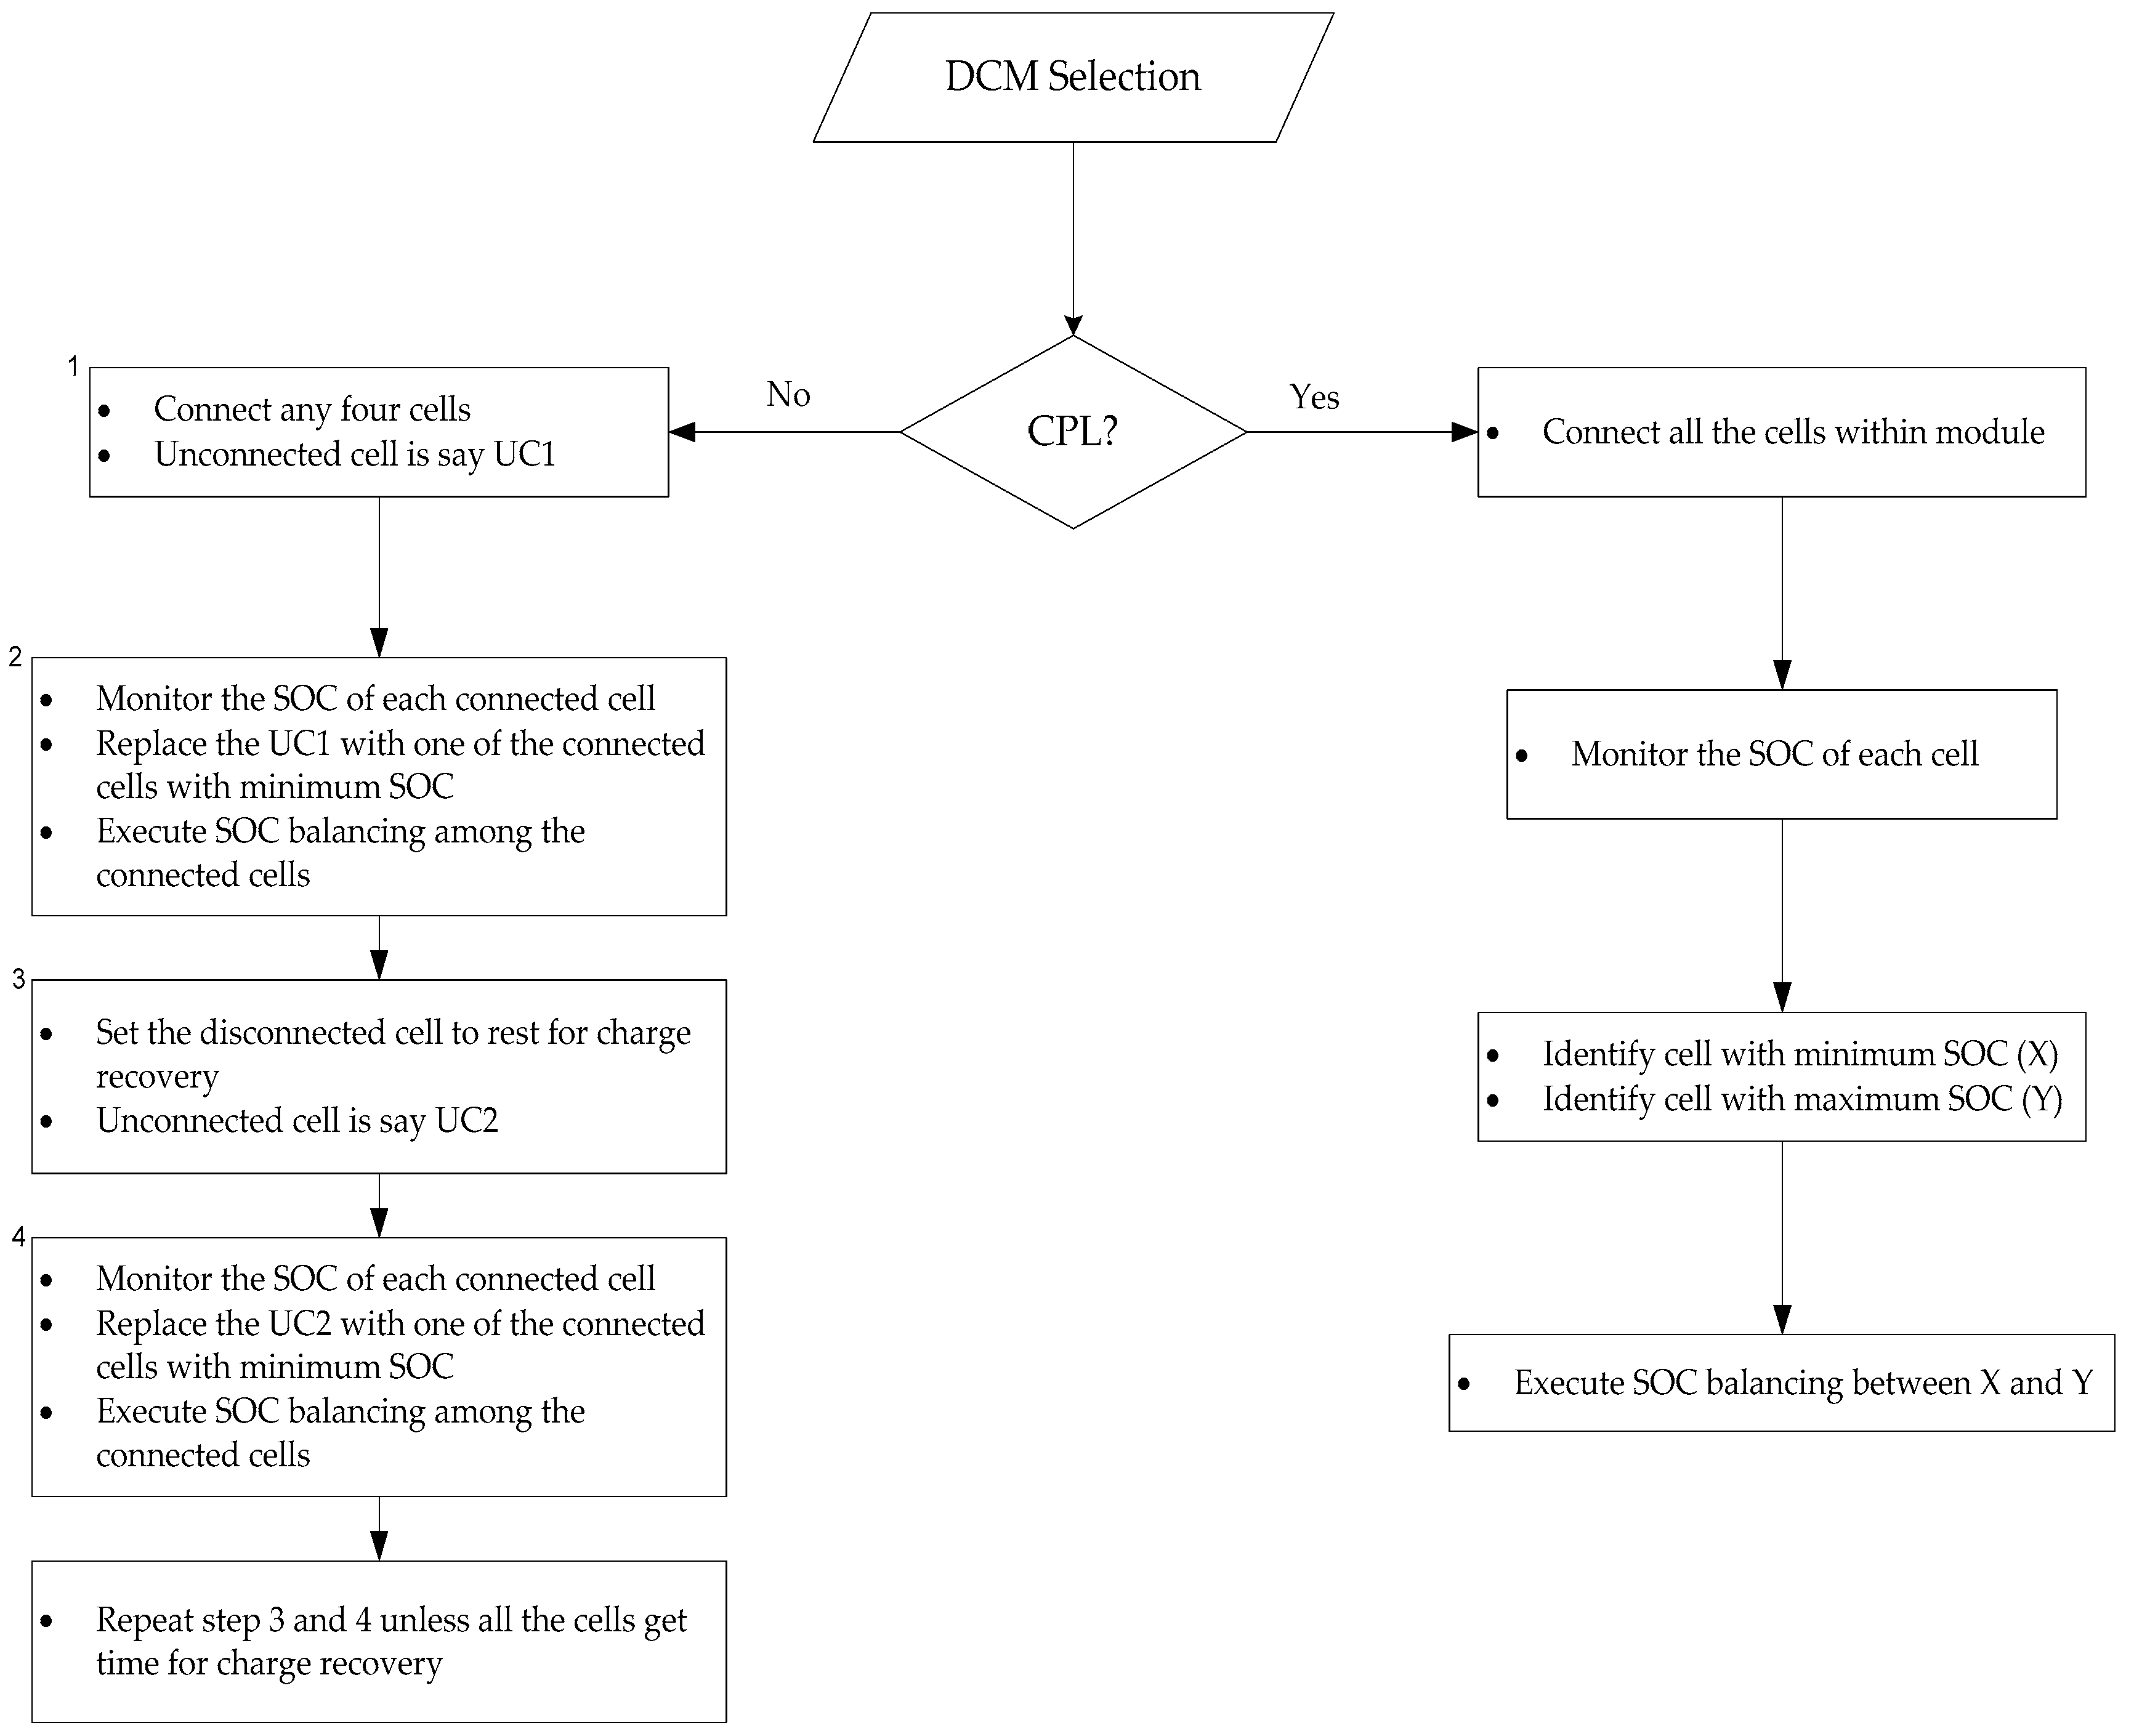
The behavior of the battery has been simulated for different load modes. The parameters simulated and compared for different modes of load are: average discharge current, peak discharge current, SOC, terminal voltage, maximum rating, efficiency, and negative impedance stability. It was found that the battery behaves differently from mode to mode. SOC and peak discharge current which are determinants in battery sizing were analyzed in detail and many problems which a battery might face by neglecting the mode of the load as a determinant in sizing of the battery were identified. An idea to design the battery was proposed which provides an option of flexible sizing to tackle the issues caused by mode-switching. Based on the proposed battery design and assumed load condition, a BMS algorithm was proposed which would ensure the full utilization of battery besides handling the mode-switch issues. Simply stated this paper has explored the importance of mode-aware analysis of batteries for efficient deployment of BESS. This study provides a new dimension to the analysis of battery behavior for the purpose of capacity sizing and BMS operation.

Acknowledgments

This research was supported by Korea Electrotechnology Research Institute (KERI) Primary research program through the National Research Council of Science & Technology (NST) funded by the Ministry of Science, ICT and Future Planning (MSIP) (No. 16-12-N0101-04).

Author Contributions

Mazhar Abbas designed the study, developed the models, conducted simulations and wrote the manuscript. Seul-Ki Kim helped in analyzing the simulations. Yun-Su Kim reviewed the manuscript both for technical and editorial aspects as he has already published articles in “Energies” and Eung-Sang Kim is the advisory professor of Mazhar Abbas.

Conflicts of Interest

The authors declare no conflict of interest.

References

  1. Asmus, P.; Lawrence, M. Microgrid Enabling Technologies. Navig. Res. 2014, 3Q, 62–64. [Google Scholar]
  2. Kusko, A.; Dedad, J. Short-term and long-term energy storage methods for standby electric power systems. In Proceedings of the Conference Record of the 2005 IEEE Industry Applications Conference, Fortieth IAS Annual Meeting, Kowloon, Hong Kong, China, 2–6 October 2005. [CrossRef]
  3. Kim, S.K.; Jeon, J.H.; Cho, C.H.; Ahn, J.B.; Kwon, S.H. Dynamic modelling and control of a grid-connected hybrid generation system with versatile power transfer. IEEE Trans. Ind. Electron. 2008, 55, 1677–1688. [Google Scholar] [CrossRef]
  4. Pakka, V.H.; Rylatt, R.M. Design and analysis of electrical distribution networks and balancing markets in the uk: A new framework with applications. Energies 2016, 9, 101. [Google Scholar] [CrossRef] [Green Version]
  5. Nguyen, D.T. Modelling load uncertainty in distribution network. IEEE Trans. Power Syst. 2015, 30, 2321–2328. [Google Scholar] [CrossRef]
  6. Carpinelli, G.; Fazio, A.R.D.; khormali, S.; Mottola, F. Optimal sizing of battery storage systems for industrial applications when uncertainties exist. Energies 2014, 7, 130–149. [Google Scholar] [CrossRef]
  7. Li, J.; Wei, W.; Xiang, J. A simple sizing algorithm for stand-alone pv/wind/battery hybrid microgrids. Energies 2012, 5, 5307–5323. [Google Scholar] [CrossRef]
  8. Bludszuweit, H.; Navarro, J.A. A probabilistic method for energy storage sizing based on wind power forecast uncertainty. IEEE Trans. Power Syst. 2011, 26, 1651–1658. [Google Scholar] [CrossRef]
  9. Lu, C.; Xu, H.; Pan, X.; Song, J. Optimal sizing and control of battery energy storage system for peak load shaving. Energies 2014, 7, 8396–8410. [Google Scholar] [CrossRef]
  10. Teleke, S.; Baran, M.E.; Huang, A.Q.; Bhattacharya, S.; Anderson, L. Control strategies for battery energy storage for wind farm dispatching. IEEE Trans. Energy Convers. 2009, 24, 725–732. [Google Scholar] [CrossRef]
  11. Bokhari, A.; Alkan, A.; Francisco, D.L.; Czarkowski, D.; Zabar, Z.; Birenbaum, L.; Neol, A.; Uosef, R.E. Experimental determination of the zip coefficients for modern residential, commercial, and industrial loads. IEEE Trans. Power Deliv. 2014, 29, 1372–1381. [Google Scholar] [CrossRef]
  12. AA Portable Power Corp. Available online: http://www.batteryspace.jp (accessed on 6 September 2016).
  13. Park, M.; Zhang, X.; Less, G.; Chung, M.; Sastry, A.M. A review of conduction phenomena in Li-ion batteries. J. Power Sources 2010, 195, 7904–7929. [Google Scholar] [CrossRef]
  14. Huynh, P.L.; Mohareb, O.A.; Grimm, M.; Maurer, H.J.; Richter, A.; Reuss, H.C. Impact of cell replacement on the state-of-health for parallel Li-ion battery pack. In Proceedings of the IEEE Vehicle Power and Propulsion Conference, Coimbra, Portugal, 27–30 October 2014.
  15. Dung, L.R.; Yuan, H.F.; Yen, J.H.; She, C.H.; Lee, M.H. A lithium-ion battery simulator based on diffusion and switching over potential hybrid model for dynamic discharging behavior and runtime predictions. Energies 2016, 9, 51. [Google Scholar] [CrossRef]
  16. Lu, R.; Yang, A.; Xue, Y.; Xu, L.; Zhu, C. Analysis of the key factors affecting the energy efficiency of batteries in electric vehicle. World Electr. Veh. J. 2010, 4, 9–13. [Google Scholar]
  17. Pedram, M.; Qing, W. Design considerations for battery-powered electronics. In Proceedings of the 36th annual ACM/IEEE Design Automation Conference, Los Angeles, CA, USA, 21–25 June 1999.
  18. Xing, Y.; Eden, W.M.; Tusi, K.L.; Pecht, M. Battery management system in electric and hybrid vehicles. Energies 2011, 4, 1840–1857. [Google Scholar] [CrossRef]
  19. Gama-Valdez, M.A.; Tucker, M.R. On model-based design for fast-prototyping battery management systems. In Proceedings of the Hybrid and Electric vehicles Conference, London, UK, 5–6 November 2014.
  20. Mandal, S.K.; Bhojwani, P.S.; Mohanty, S.P.; Mahapatra, R.N. IntellBatt: Towards smarter battery design. In Proceedings of the Design Automation Conference, Anaheim, CA, USA, 8–13 June 2008.
  21. Subburaj, A.S.; Bayne, S.B. Analysis of dual polarization battery model for grid applications. In Proceedings of the 36th International Telecommunications Energy Conference, Vancouver, BC, Canada, 28 September–2 October 2014.
  22. Dubarry, M.; Vuillaume, N.; Liaw, B.R. From single cell model to battery pack simulation for li-ion batteries. J. Power Sources 2009, 186, 500–507. [Google Scholar] [CrossRef]
  23. Enache, B.A.; Alexandru, M.E.; Constantinescu, L.M. Extending the battery model from a single cell to a battery pack with BMS. In Proceedings of the Electronics, Computers and Artificial Intelligence, Bucharest, Romania, 25–27 June 2015.
  24. Chan, H.L.; Sutanto, D. A new battery model for use with battery energy storage systems and electric vehicles power systems. In Proceedings of the Power Engineering Society Winter Meeting, Hung Hom, Hong Kong, China, 23–27 January 2000.
  25. Zhan, C.J.; Wu, X.G.; Kromlidis, S.; Ramachandaramurthy, V.K.; Barnes, M.; Jenkins, N.; Ruddell, A.J. Two electrical models of the lead-acid battery used in a dynamic voltage restorer. IEEE Proc. Gener. Transm. Distrib. 2003, 150, 175–182. [Google Scholar] [CrossRef]
  26. Eghtedarpour, N.; Farjah, E. Distributed charge/discharge control of energy storages in a renewable-energy-based DC micro-grid. IET Renew. Power Gener. 2012, 8, 45–57. [Google Scholar] [CrossRef]
  27. Khamis, A.; Mohamed, A.; Shareef, H.; Ayob, A. Modelling and simulation of small scale microgrid system. Aust. J. Basic Appl. Sci. 2012, 6, 412–421. [Google Scholar]
  28. Kroeze, R.C.; Krein, P.T. Electrical battery model for use in dynamic electric vehicle simulators. In Proceedings of the IEEE Power Electronics Specialist Conference, Rhodes, Greece, 15–19 June 2008.
  29. Chen, M.; Rincon-Mora, G.A. Accurate electrical battery model capable of predicting runtime and I-V performance. IEEE Trans. Energy Convers. 2006, 21, 504–511. [Google Scholar] [CrossRef]
  30. Reddy, T.B.; Linden, D. Linden’s Handbook of Batteries, 4th ed.; McGraw-Hill Companies: New York, NY, USA, 2011. [Google Scholar]
  31. Collin, A.J.; Acosta, J.L.; Hayes, B.P. Component-based aggregate load models for combined power flow and harmonic analysis. In Proceedings of the 7th Mediterranean Conference and Exhibition on Power Generation, Transmission, Distribution and Energy Conversion, Agia Napa, Cyprus, 7–10 November 2010.
  32. Li, Y.; Chiang, H.D.; Choi, B.K.; Chen, Y.T.; Lauby, M.G. Representative static load models for transient stability analysis: Development and examination. IET Gener. Transm. Distrib. 2007, 1, 422–431. [Google Scholar] [CrossRef]
  33. Chen, S.X.; Gooi, H.B.; Wang, M.Q. Sizing of energy storage for microgrids. IEEE Trans. Smart Grids 2011, 3, 142–151. [Google Scholar] [CrossRef]
  34. Emadi, A.; Khaligh, A.; Rivetta, C.H.; Williamson, G.A. Constant power loads and negative impedance instability in automotive systems: Definition, modelling, stability, and control of power electronic converters and motor drives. IEEE Trans. Veh. Technol. 2006, 55, 1112–1125. [Google Scholar] [CrossRef]
Figure 1. Demonstration of usable capacity and runtime.
Energies 09 00812 g001
Figure 2. Change of internal resistance to decrease in SOC along time axis.
Energies 09 00812 g002
Figure 3. Change of terminal voltage to decrease in SOC along time axis.
Energies 09 00812 g003
Figure 4. Change of battery polarizations with decrease in SOC along a time axis.
Energies 09 00812 g004
Figure 5. Demonstration of charge recovery effect.
Energies 09 00812 g005
Figure 6. I-V characteristics of the battery as a function of SOC.
Energies 09 00812 g006
Figure 7. Simulation model.
Energies 09 00812 g007
Figure 8. Model for current integration-based SOC estimation.
Energies 09 00812 g008
Figure 9. Circuit model for CCL.
Energies 09 00812 g009
Figure 10. Circuit model for CPL.
Energies 09 00812 g010
Figure 11. Battery discharge current response to a decrease in voltage (left to right).
Energies 09 00812 g011
Figure 12. Battery runtime comparison for all modes of discharge.
Energies 09 00812 g012
Figure 13. Decreasing pattern of the terminal voltage with the decrease in SOC (left to right).
Energies 09 00812 g013
Figure 14. Instantaneous I2R loss curves.
Energies 09 00812 g014
Figure 15. Change in internal resistance with the decrease in SOC (left to right).
Energies 09 00812 g015
Figure 16. Instantaneous output-power at the battery terminal.
Energies 09 00812 g016
Figure 17. Power-lost expressed as percent of power-output.
Energies 09 00812 g017
Figure 18. Current profile of battery for the same output-power in all modes.
Energies 09 00812 g018
Figure 19. Power profile to reach point of same output-power in all modes.
Energies 09 00812 g019
Figure 20. Demonstration of the assumed situation.
Energies 09 00812 g020
Figure 21. Modularization for utilization of optimal capacity.
Energies 09 00812 g021
Figure 22. Operational process flow for battery management system (BMS).
Energies 09 00812 g022
Table 1. Important characteristics of batteries well recognized for energy applications.
Battery TypeSpecific Energy (Wh/Kg)Energy Density (Wh/L)Power Density
Lead Acid10–2050–70Moderately High
Lithium-ion203570Moderate
Nickel-cadmium10–4015–80Very high
Table 2. Proposed operational schedule for battery management system (BMS).
TimeSw1Sw2Sw3Sw4Sw5Cell Balancing
5:00 p.m.–6:00 p.m.ONONONONReserveON
6:00 p.m.–7:00 p.m.ONONONRest timeONON
7:00 p.m.–8:00 p.m.ONONRest timeONONON
8:00 p.m.–9:00 p.m.ONRest timeONONONON
9:00 p.m.–10:00 p.m.Rest timeONONONONON
10:00 p.m.–6:00 a.m.OFFOFFOFFOFFOFFON
6:00 a.m.–11:00 a.m.ONONONONONON
11:00 a.m.–05:00 p.m.OFFOFFOFFOFFOFFON

