Article

Consumer Travel Behaviors and Transport Carbon Emissions: A Comparative Study of Commercial Centers in Shenyang, China

1
Northeast Institute of Geography and Agroecology, Chinese Academy of Sciences, Changchun 130102, Jilin, China
2
Department of Geography, Hong Kong Baptist University, Kowloon Tong, Hong Kong, China
3
School of Geographical Sciences, Northeast Normal University, Changchun 130024, Jilin, China
*
Author to whom correspondence should be addressed.
Energies 2016, 9(10), 765; https://doi.org/10.3390/en9100765
Submission received: 15 June 2016 / Revised: 27 August 2016 / Accepted: 15 September 2016 / Published: 22 September 2016

Abstract

:
Current literature highlights the role of commercial centers in cities in generating shopping trips and transport carbon emissions. However, the influence of the characteristics of commercial centers on consumer travel behavior and transport carbon emissions is not well understood. This study addresses this knowledge gap by examining shopping trips to eight commercial centers in Shenyang, China, and the CO2 emissions of these trips. We found that the locations and types of commercial centers strongly influence CO2 emissions. CO2 emissions per trip to commercial centers in the suburbs of Shenyang were on average 6.94% and 26.92% higher than those to commercial centers in the urban core and the inner city, respectively. CO2 emissions induced by wholesale centers were nearly three times higher than the lowest CO2 emissions of commercial centers in the inner city. These empirical results enhance our understanding of shopping-related transport carbon emissions and highlight the importance of optimizing urban space structure, in particular, the layout of commercial centers.

1. Introduction

Cities are the large-scale consumers of energy and emitters of greenhouse gases, contributing preeminently to global climate change with irreversible long-term consequences [1,2,3]. According to some studies, the transport sector is the fastest growing energy-consuming sector [4,5,6]. The 2014 report on CO2 emissions by the International Energy Agency states that approximately 23% of global CO2 emissions arises from transportation-related activities, and that 50% and 20% of the air pollution in the United States and Japan, respectively, are due to vehicular emissions. The Asian Development Bank estimates global transport CO2 emissions to increase by 57% in the next 25 years due to rapid growth of the automobile industry in the developing world.
A growing body of literature examines how urban form and design influence travel behavior and transport carbon emissions [7,8,9,10]. Some empirical studies have identified population density, land use, street design, network characteristics and destination accessibility as factors that significantly influence travel behavior and emissions [11,12,13,14]. However, the extent to which urban form influences travel behavior and emissions remains controversial. For example, Echenique et al. [15] maintains that current planning strategies for land use and transport have virtually no impact on major long-term increases in resource and energy consumption. Kitamura et al. [16] argues that the effects of urban setting such as density and accessibility on travel are limited. Therefore, empirical evidence on the relationship between urban form, travel behavior, and transport carbon emission are still inconclusive, and more empirical research is necessary to systematically evaluate the usefulness of smart growth and other low-carbon transport policies in mitigating carbon emissions [17].
Commercial centers generate a substantial amount of traffic, but their effects on transport carbon emissions have not been extensively studied. Most related studies have instead focused on the influence of distribution of residential areas and employment hubs on the daily commute of workers [18,19,20]. This knowledge gap prevents a comprehensive understanding of urban transport.
Moreover, consumption activities in cities are gravitating toward large-scale shopping facilities. In many developed countries that have undergone suburbanization over several decades, the retail structure in metropolitan areas is dominated by suburban arterial strips and shopping malls [21]. However in China’s metropolises large departmental stores have aggregated into municipal commercial centers. Suburban shopping centers, large supermarkets, convenience stores and other retail facilities have become a shopping hub for suburban residents [22]. Therefore, the layout of commercial centers is of interest to urban planners and geographers concerned with urban sprawl, transport cost and environmental externalities [23,24,25,26,27]. Thus, examining shopping trips from the perspective of sustainable and low-carbon urban planning is crucial.
With economic and social development, retailing in China has entered a phase of rapid growth, especially with regard to the emergence of large-scale commercial centers, and many cities are transforming or have transformed from producing cities to consuming cities [28]. With an increasingly affluent middle class buying cars as soon as they can afford to, Chinese cities are also becoming increasingly congested with automobiles [29]. According to the China Statistical Yearbook, the number of small private passenger cars nationwide has increased from 10.8 million to 105.9 million from 2005 to 2014 (an annual growth rate of 31.1%). With rapid economic growth and unprecedented urbanization and motorization, reducing CO2 emissions in the transport sector, especially from private cars, is an urgent target in China. This study focuses on shopping trips to commercial centers and their carbon emissions in the city of Shenyang, one of the largest metropolitan areas in China. In particular, we examine the following question: what is the difference in consumers’ travel behavior to different types of commercial centers and in the CO2 emissions of these behaviors? The rest of this paper is organized as follows. We present the data collection and analysis methods in Section 2 and compare the carbon emissions between different types of commercial centers in Section 3. The implications of these results are discussed in Section 4, and Section 5 summarizes the conclusions of this study.

2. Data and Methodology

2.1. Study Area

Shenyang, the capital of Liaoning province, is one of China’s most developed metropolitan areas and a regional center of economy, culture, transportation, and trade in China’s northeast [30]. In recent years, the city has undergone substantial economic transformation, leading to both the rapid growth of and increasingly crucial economic role of tertiary and retail sectors. With more than 163,000 commercial sites within its municipal boundaries, urban retail sales of consumer goods in Shenyang reached 46.12 billion USD (1 USD = 6.67 CNY) by the end of 2014.
On the basis of their location and retail type, we carefully selected eight commercial centers in Shenyang as our field sites. Regarding location, the commercial centers of Middle Street and Taiyuan Street are located at the city center (Figure 1), with one subway line and 68 bus routes serving Middle Street and one subway line and 43 bus routes serving Taiyuan Street. Wuai, Beihang, and Xita-Beishi are located farther away from the city center but within the first circumferential road, where the urban population density is approximately 30,800 person/km2. The two shopping centers in Tiexi and Nanta are located between the first and second circumferential roads, where the urban population density is approximately 21,400 person/km2. Only some of these centers can be accessed by subway, but all are serviced by bus lines (Table 1). Hunnan commercial center is farthest from the city center, located between the second and third circumferential roads, where the urban population density is approximately 6600 person/km2. Hunnan commercial center is serviced by 25 bus routes and one subway line. Thus, our samples were spatially well-dispersed.
Regarding retail type, Middle Street and Taiyuan Street are highly developed and popular shopping districts, with a large business circle covering the entire municipality of Shenyang and even extending to surrounding cities. These centers attract over 300,000 shoppers each day and contain departmental stores, specialty stores, exclusive high-end shops, pedestrian streets, hypermarkets, and shopping malls. These two commercial centers together have only approximately 2000 parking spaces, making parking difficult. The commercial centers of Beihang, Xita-Beishi, Tiexi, and Hunnan are regional shopping centers that are smaller than Middle Street and Taiyuan Street. The parking facilities in these suburban shopping centers adequately meet the demand. Wuai and Nanta are specialized wholesale markets with retailing activities. Wuai is one of the most famous and comprehensive shopping destinations for clothing, footwear, knitwear, small articles of daily use, and other light industrial products, whereas Nanta specializes in footwear, electronics, and groceries.

2.2. Data Collection

Questionnaires targeting shoppers were administered face-to-face in the eight commercial centers on weekends in August 2013 and again in October 2014. The questionnaire comprised four sections: (1) travel behavior, including travel mode, travel time, frequency of trips, and travel routes; (2) residence location and its environment, such as the availability of commercial and transport facilities; (3) individual socioeconomic characteristics, such as car ownership, gender, age, education, occupation, and income; and (4) attitudinal questions, such as shoppers’ reasons for not taking public transport, willingness towards the improvement of public transport in Shenyang, and their opinions on shopping by private car. In total, 920 shoppers were invited to respond to the questionnaire, out of which 856 completed the survey: Middle Street (105), Taiyuan Street (97), Wuai (102), Beihang (114), Xita-Beishi (114), Tiexi (109), Nanta (107) and Hunnan (108).

2.3. CO2 Emissions Model

Studies estimating transport CO2 emissions have used either the top-down or the bottom-up approach [31,32,33,34]. In the top-down approach, emissions are calculated on the basis of transportation fuel sales and CO2 emission factors for each fuel type. The main drawback of this approach is that it is inapplicable to situations where aggregated fuel sale data is unavailable [35,36]. In the bottom-up approach, emissions are estimated using individual travel attributes, such as trip frequency, travel mode, vehicle kilometers traveled, and CO2 emission factors [37,38]. In this study, we calculated travel CO2 emissions using the bottom-up approach because of the lack of reliable aggregated fuel sale data. Travel modes of shoppers were classified into six types: walking and cycling, bus, rail transit, electric bike, taxi, and private car. Walking and cycling generate no emissions. The carbon emissions per trip for bus, taxi, and private car can be calculated using the following formula:
ECO 2 i = F i × ρ i × D i × E F i A C i ,
where i represents the travel mode, ECO2 is the estimated CO2 emissions (g), F is the average fuel consumption rate of travel mode i (m3/100 km or L/100 km), ρ is the fuel density (kg/m3), D is the travel distance (km), EF is the carbon emission factor of fuel (tCO2/1000 Nm3 or tCO2/t), and AC is the estimated transport capacity.
Carbon emissions for electric bike and rail transit can be calculated using the following formula:
ECO 2 p = C p × D p × E F p A C p ,
where p represents the travel mode, ECO2 is estimated CO2 emissions (g), C is the average power consumption (kWh/100 km), D is the travel distance (km), EF is the carbon emissions factor of power (kg/kWh) and AC is the estimated transport capacity.
The average natural gas consumption rates for bus transit (Fbus) and taxi (Ftaxi), the petrol consumption rate for private car (Fprivate car), and the power consumption rates for electric bike (Celectric bike) and subway (Csubway) in Shenyang are 34.0 m3/100 km, 8.7 m3/100 km, 10.5 L/100 km, 2.8 kWh/100 km and 454.0 kWh/100 km, respectively. Data on the origins (respondents’ residency), destinations (commercial centers), and transport routes (extracted from detailed descriptions provided by the respondents) were entered into ArcGIS 10.2 (Esri, Redlands, CA, USA) to calculate the vehicle kilometers traveled (D). Average fuel/power consumption rate (F or C), fuel density (ρ), carbon emission factor of energy used in travel mode (EF), and estimated capacity (AC) were obtained from Volkswagen Group China, the TREMOVE2.4 manual used in the European Union (2006), the Intergovernmental Panel on Climate Change (IPCC) in 2006, and relevant literature (Table 2).

3. Results

3.1. Characteristics of Shoppers

Table 3 lists the socioeconomic and demographic characteristics of the survey respondents. Shoppers were predominantly young (64.5% were 35 years of age or younger) and female (59.9%). They were mostly highly educated (63.1% received tertiary education) and earned high incomes (33.9% earned 3000–5000 CNY, and 21.7% earned more than 5000 CNY per month; the average in urban Shenyang was 2423 CNY). The respondents were mostly employed in business (38.6%) and public (23.3%) sectors or were self-employed (17.2%). Unemployed and retired accounted for 7.5% and 13.4%, respectively, of the respondents. Approximately 36.0% of the respondents owned private cars. Regarding mode of transport, public transport accounted for 59.9%, and buses were used three times more than the subway. Approximately one-fifth of the respondents traveled by private cars and taxis to the commercial centers, whereas 17.8% walked or cycled to the commercial centers.

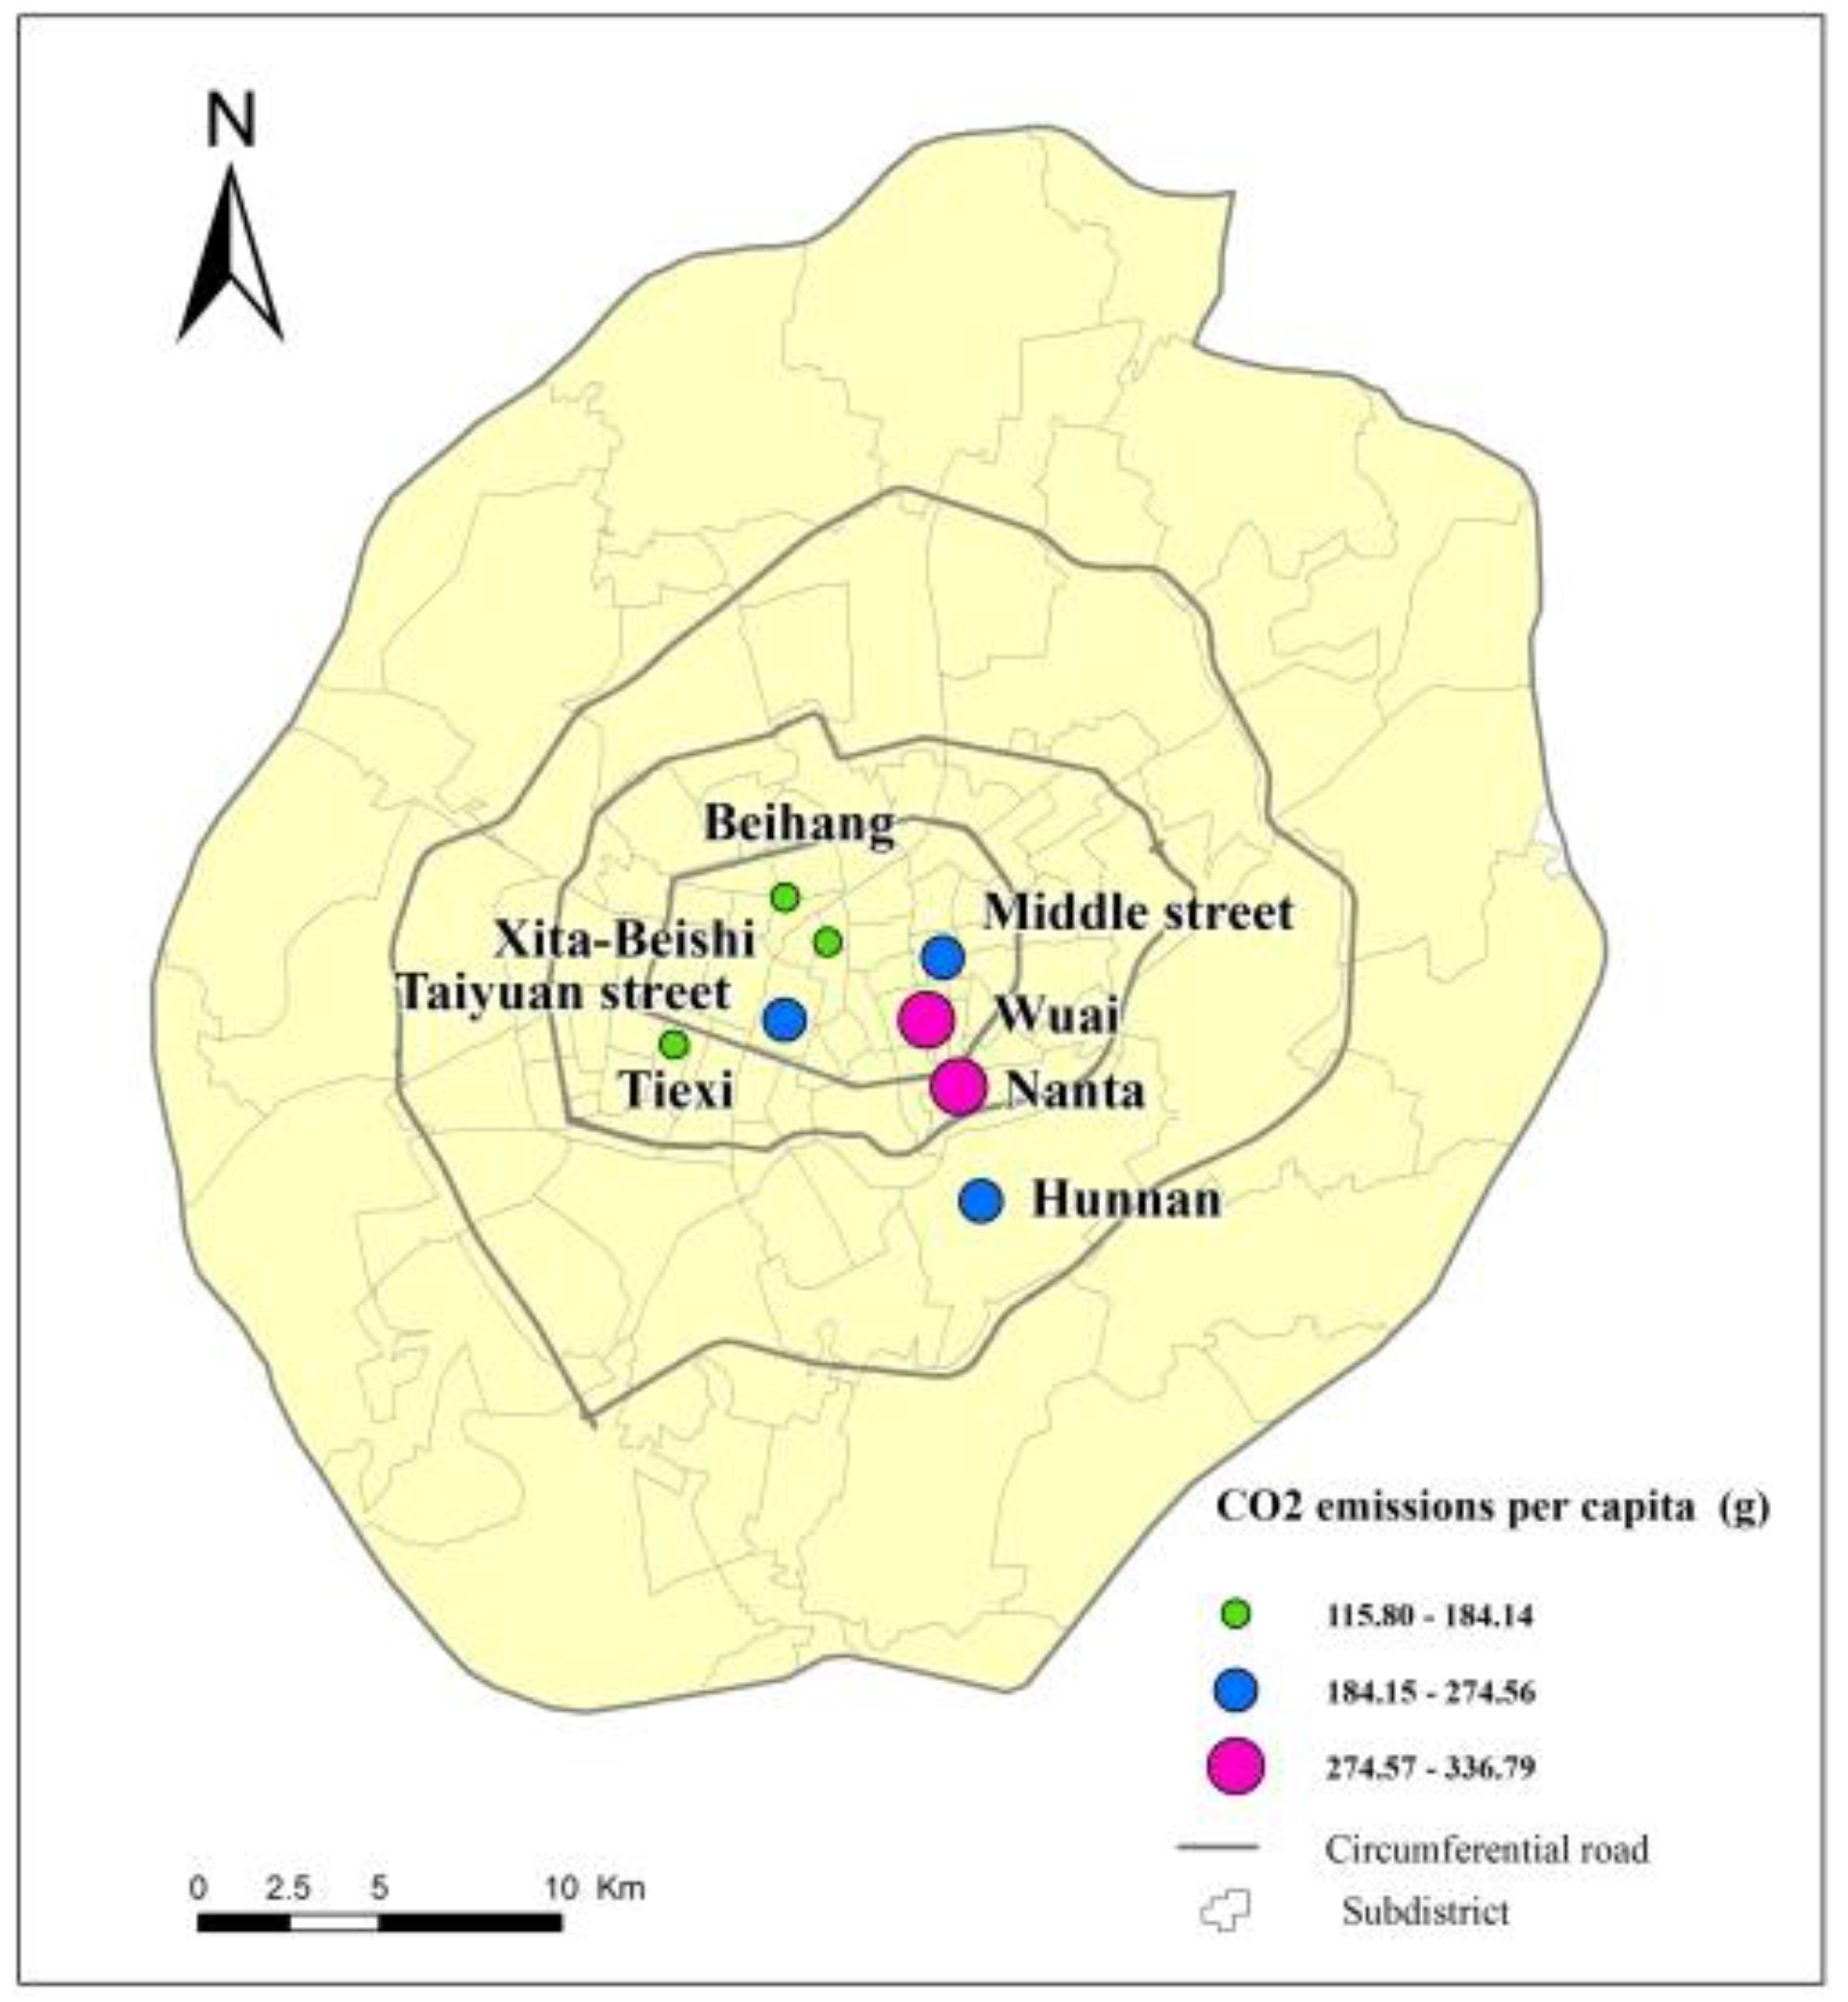
3.2. Transport CO2 Emissions

On the basis of the travel characteristics obtained through the questionnaire survey, we calculated the transport CO2 emissions per trip to the eight commercial centers by using the model described in Section 2.3. The CO2 emissions of these commercial centers were classified into three levels, namely high, medium, and low, by using the natural breaks (Jenks) method in ArcGIS 10.2 [44,45].
The results (Figure 2) showed that these eight commercial centers incurred different levels of transport carbon emissions, with the highest being nearly three times as much as the lowest. The wholesale centers of Wuai and Nanta belonged to the high CO2 emissions group. On average, shoppers visiting these two destinations produce 336.79 and 274.57 g of CO2 emissions per trip. Hunnan (265.45 g), Taiyuan Street (254.54 g), and Middle Street (241.90 g) belonged to the medium emissions group, and regional commercial centers in the inner city to the low emissions group. Shopping trips to Xita-Beishi, Beihang and Tiexi only produce an average of 184.14, 134.43, and 115.80 g of carbon emissions.
To clarify these large differences in the emission levels among the centers, we classified the shopping trips into five levels—very high, high, medium, low, and very low—according to their level of CO2 emissions using the natural breaks (Jenks) method in ArcGIS 10.2 (Table 4). Subsequently, we analyzed the relationship among emissions level, place of residence, and travel mode.

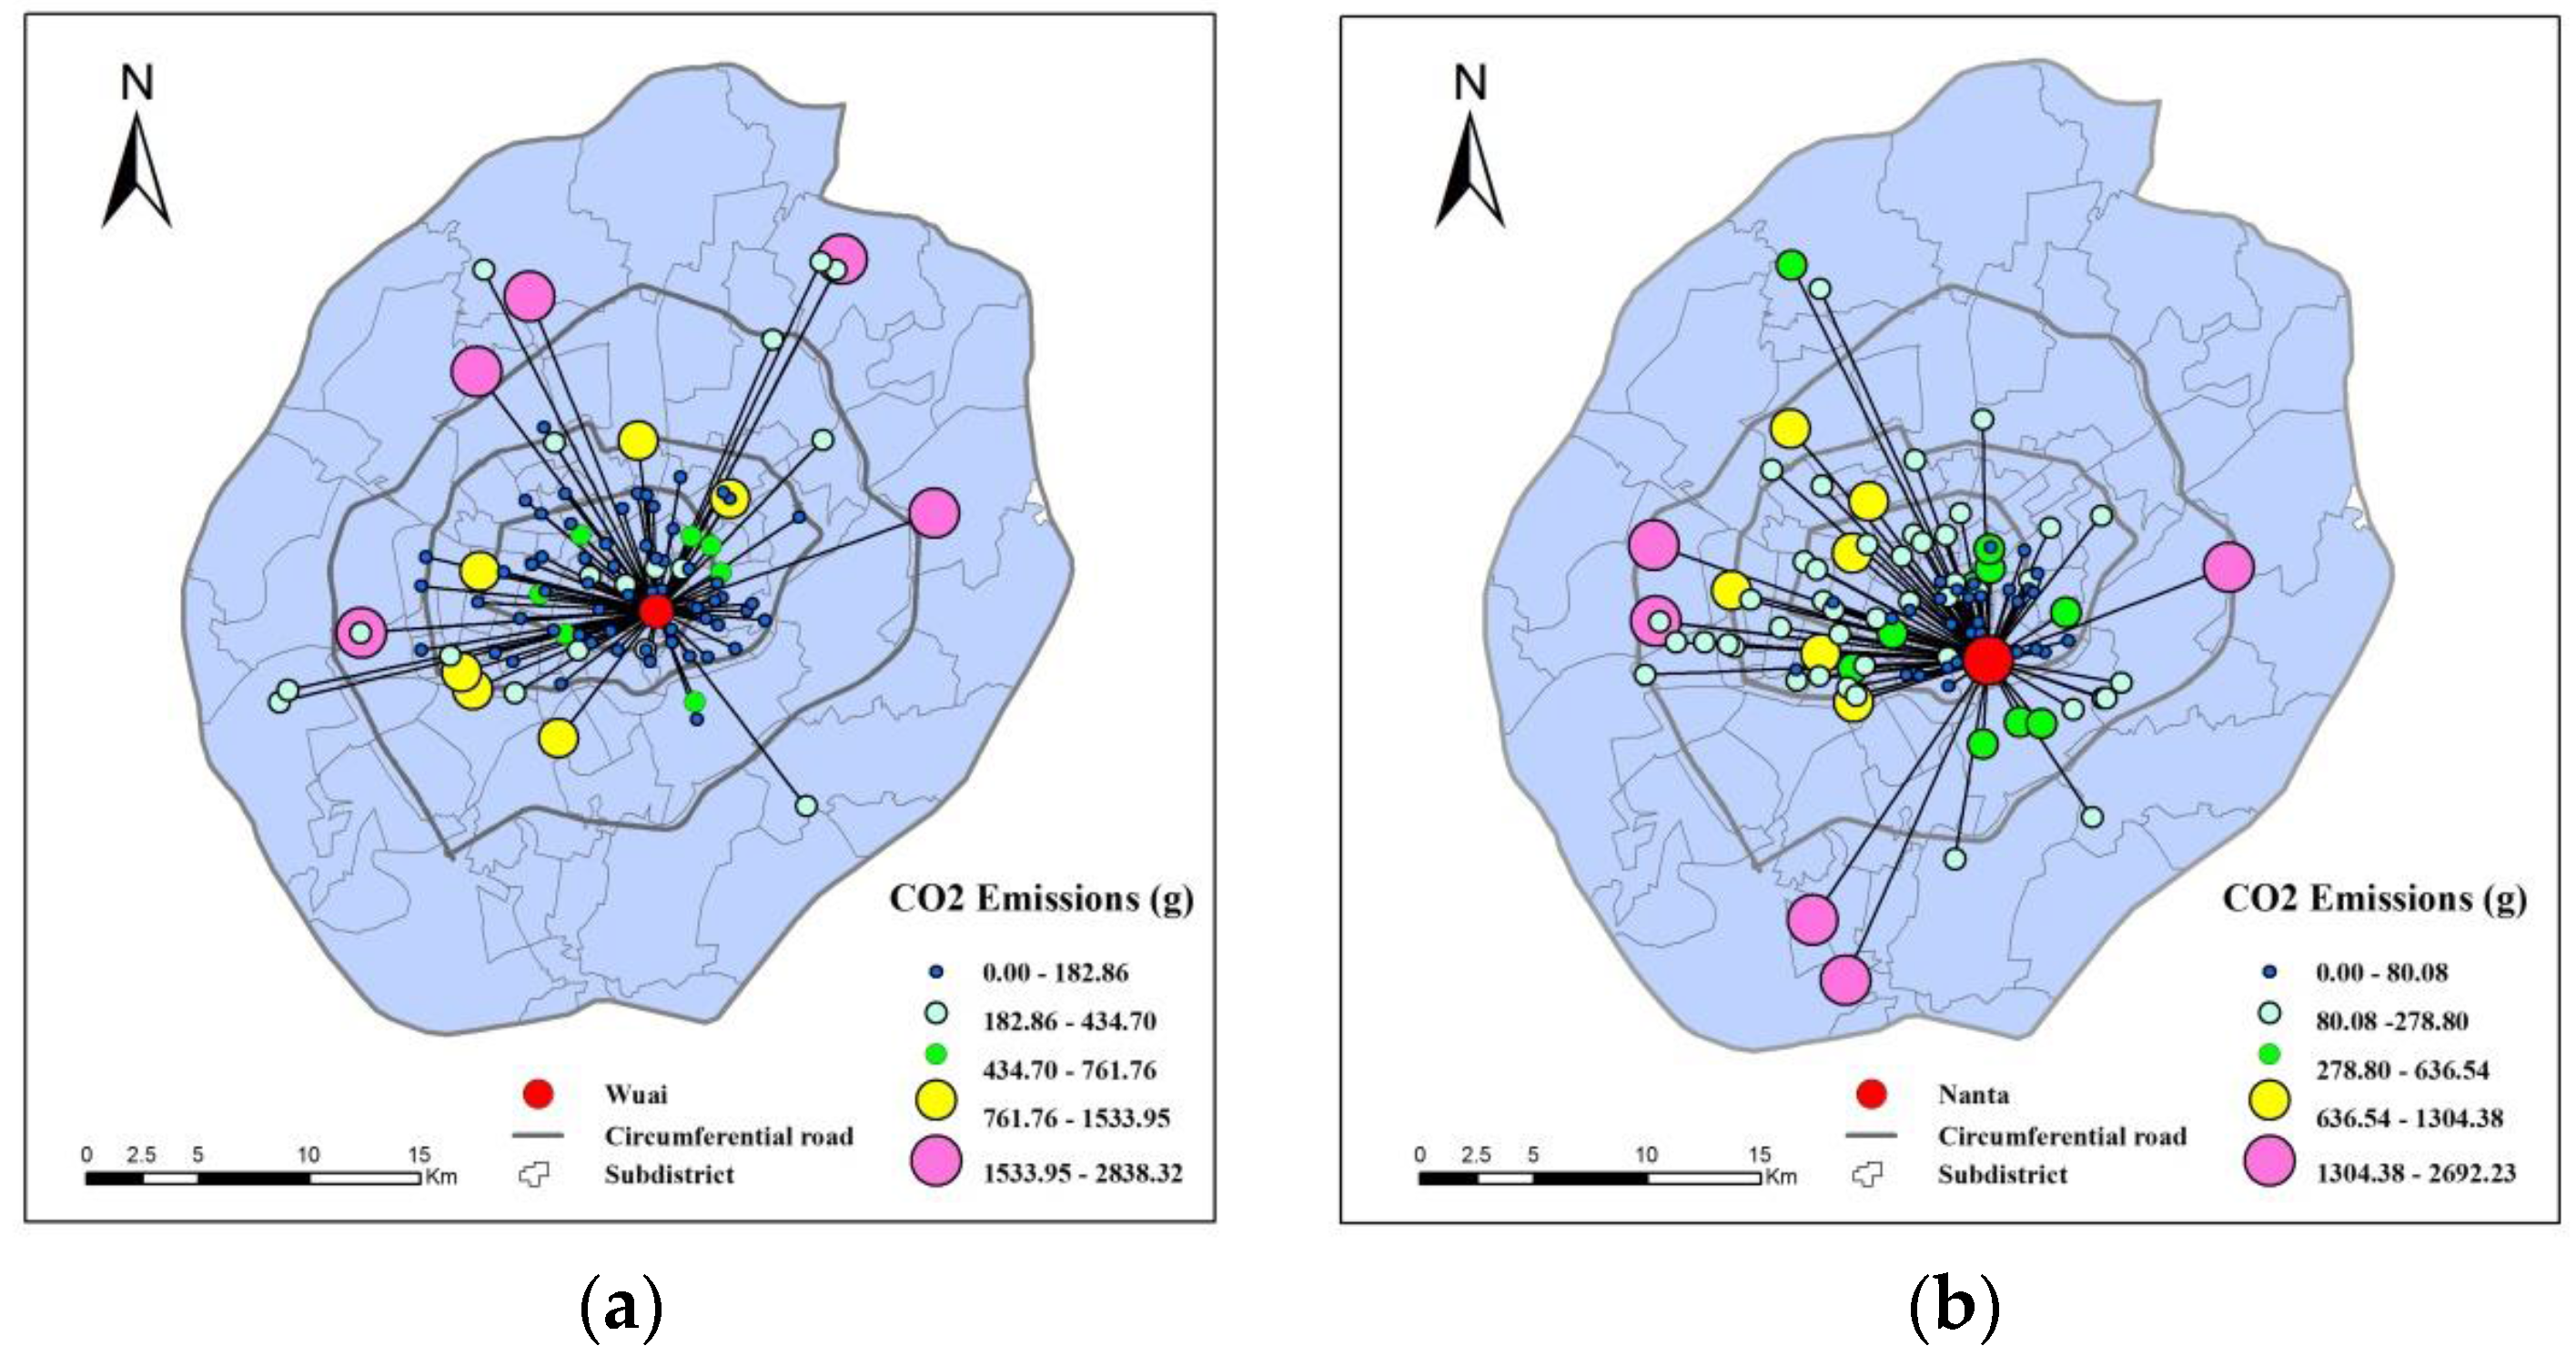
3.2.1. Commercial Centers with High CO2 Emissions: Wuai and Nanta

Wuai has a high CO2 emissions level primarily because, as a popular wholesale center famous for cheap goods, the commercial centers attracted shoppers travelling long-distance by cars. As shown in Figure 3a, shoppers whose travel behaviors had very high CO2 emissions (1533.95–2838.32 g) mainly lived beyond the third circumferential road, north of the commercial center, at an average distance of 13.72 km. Shoppers whose travel behaviors had high CO2 emissions typically lived between the second and third circumferential roads, at an average distance of 7.20 km. These high and very high emission trips all involved private cars. Shoppers whose travel behavior entailed low and very low emissions mainly resided around Wuai and within the second circumferential road and used public transport. Some shoppers living beyond the third circumferential road also took public transport, thereby achieving a low level of emissions.
The travel characteristics of shoppers in Nanta, also a wholesale commercial center, were similar to those of shoppers in Wuai. Shoppers whose travel behavior entailed very high CO2 emissions mainly lived beyond the third circumferential road, at an average distance of 14.21 km. Shoppers whose travel behavior had high carbon emissions mostly lived northwest of Nanta, between metro lines 1 and 2, at an average distance of 9.20 km. All respondents whose travel behavior involved very high and high emissions used private cars for shopping travel, and those whose behavior had a medium emissions level mainly used taxis in addition to private cars. Most shoppers whose behavior had low and very low emissions lived around Nanta, and within the second circumferential road, and used public transport.
Overall, car travel (private cars and taxis) distance and associated CO2 emissions in Nanta were 9.91 km and 1028.72 g, and those for Wuai were 9.23 km and 826.10 g, respectively. These distances and emissions are significantly higher than those for the other commercial centers, and this is the primary reason for the high emissions in Nanta and Wuai. The average travel distance to Wuai and Nanta by public transport was 8.77 and 8.36 km, respectively, and the corresponding CO2 emissions were 122.27 and 123.42 g, respectively. Nearly 51% of car owners living within the second circumferential road used public transport for shopping-related travel, and only 25% used private cars.

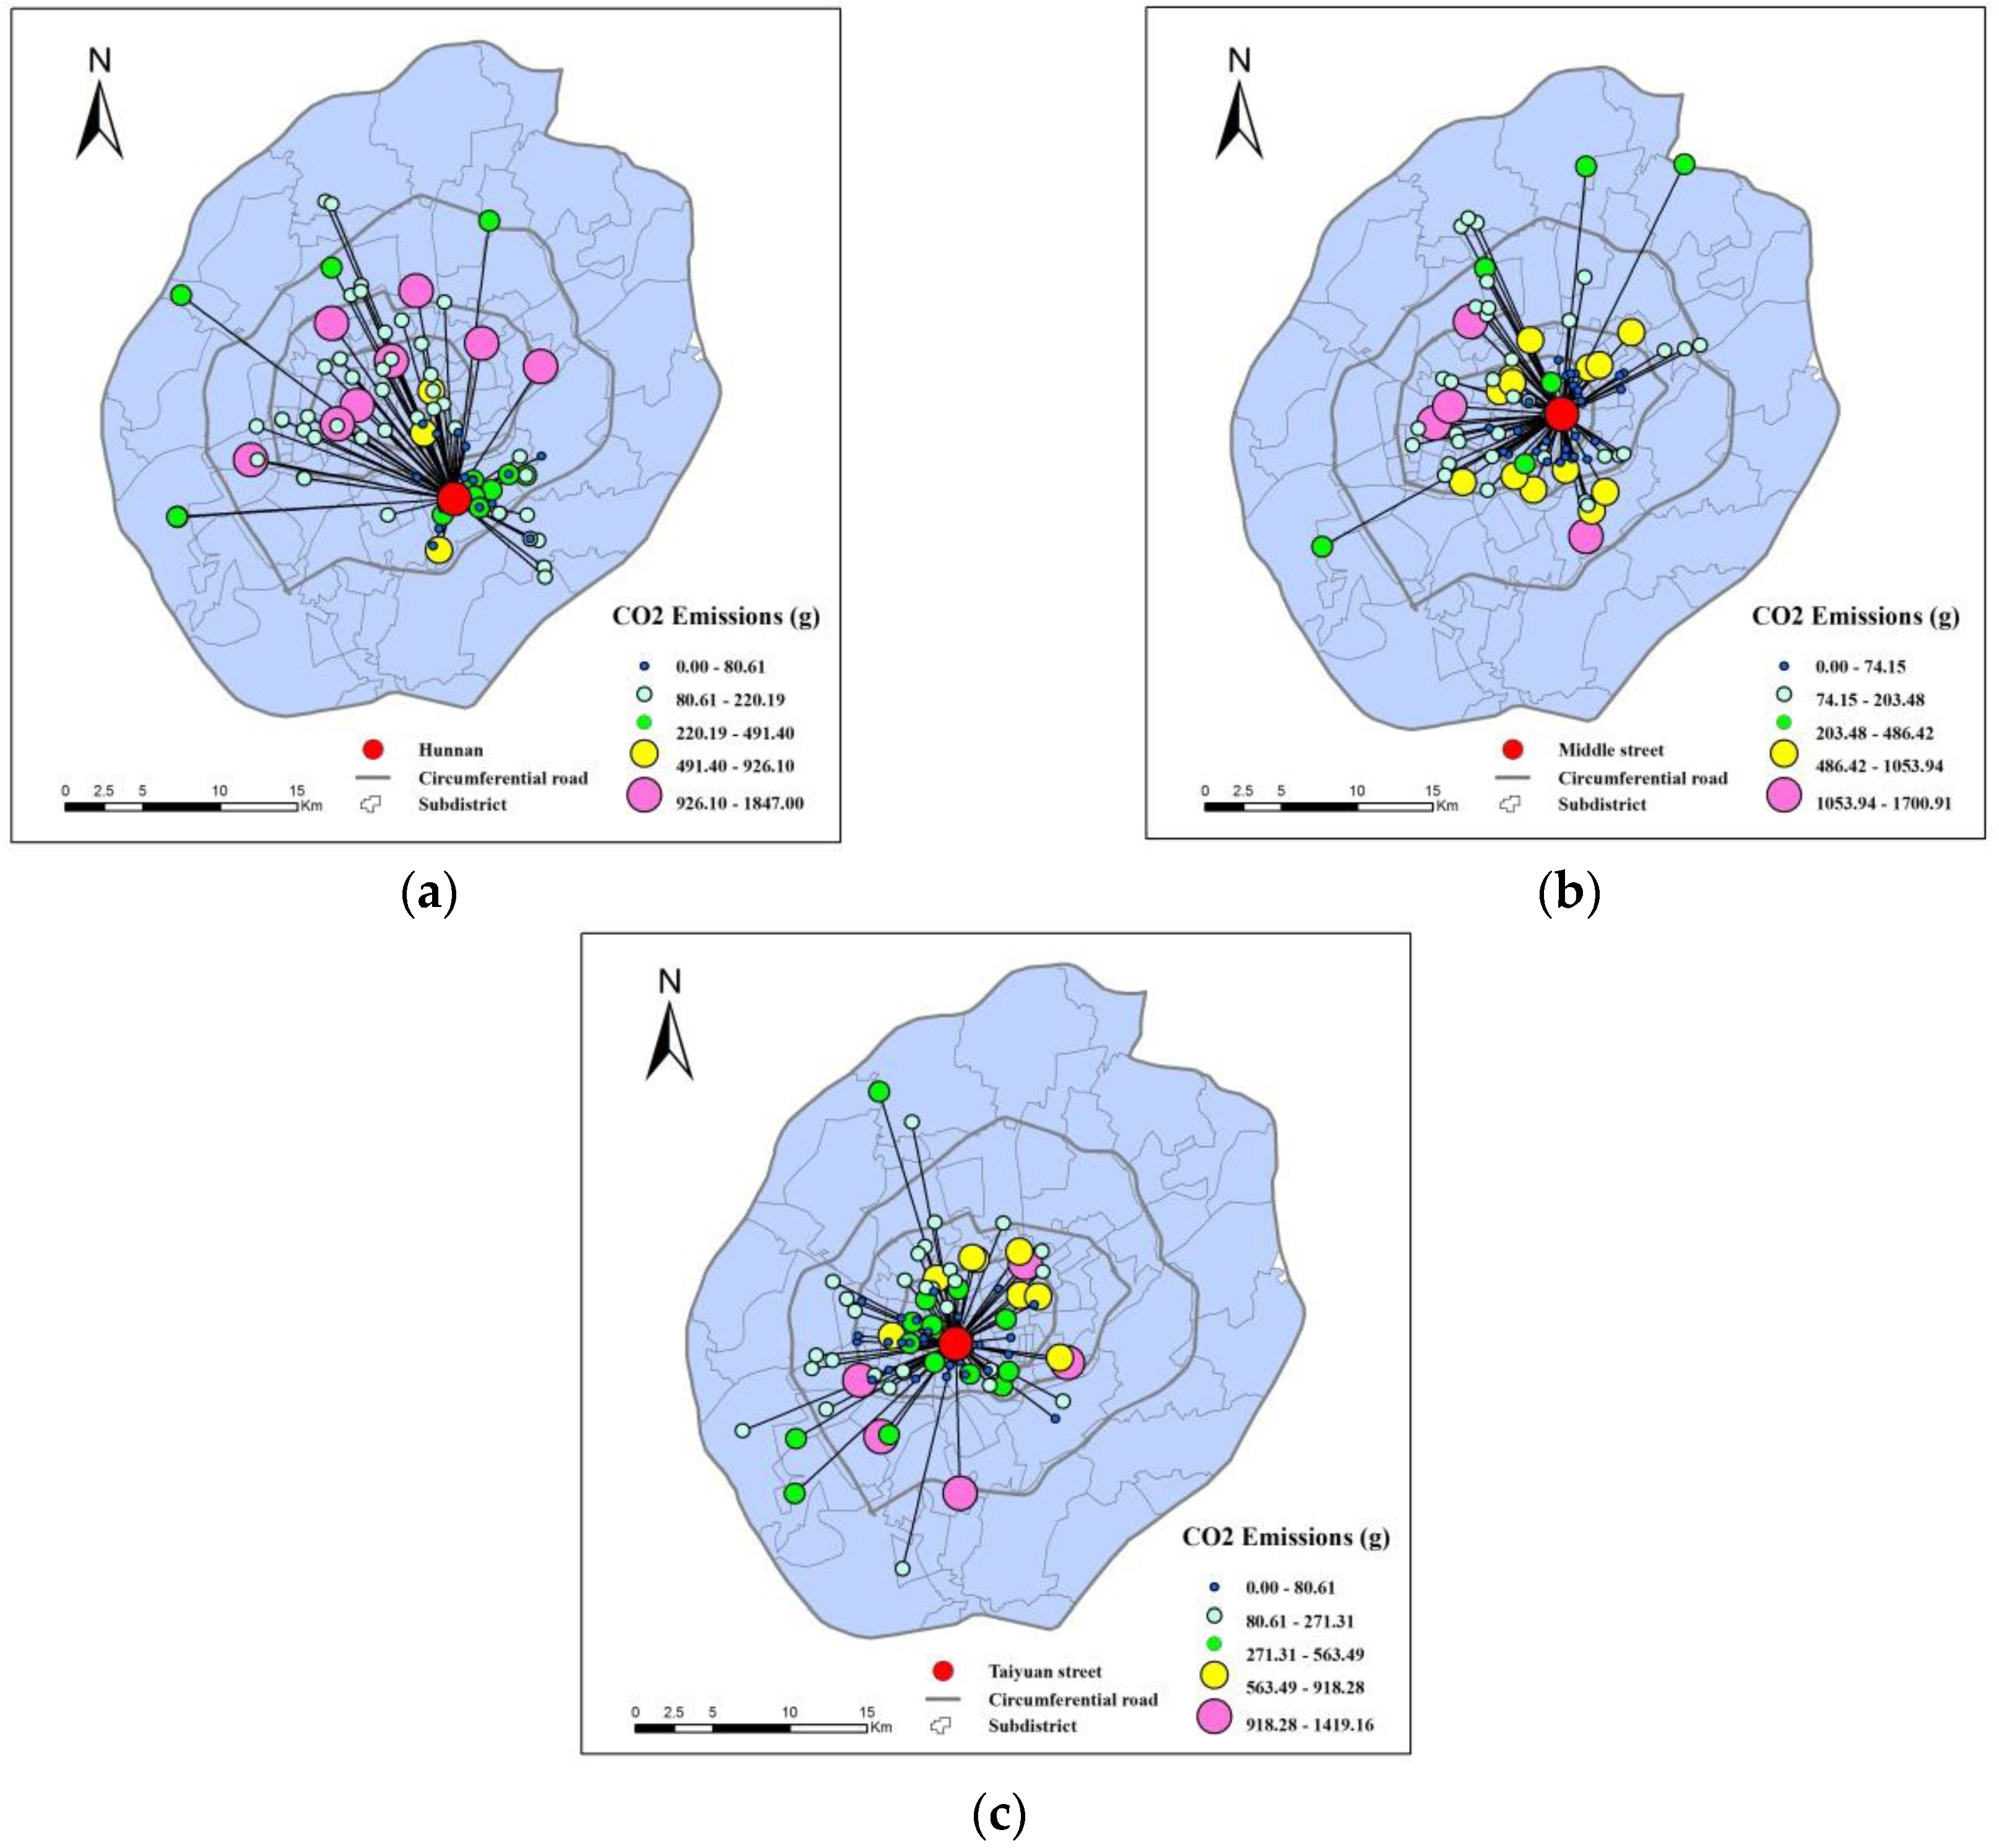
3.2.2. Commercial Centers with Medium CO2 Emissions: Hunnan, Middle Street and Taiyuan Street

The average travel distance of shoppers to Hunnan was approximately 9.92 km, which is 13.37% and 31.22% longer than that to Middle Street and Taiyuan Street, respectively. In Hunnan, shoppers whose travel behavior entailed very high and high CO2 emissions mostly traveled by private cars and lived within the second circumferential road, approximately 11.12 km from the shopping center on average (Figure 4a). Almost 75% of the shoppers whose travel behavior involved medium CO2 emissions resided near Hunnan, at a distance of 2.35 km on average, and traveled by private cars or taxis for shopping. Shoppers whose behavior entailed low and very low levels of CO2 emissions mainly used public transport, and nearly half of such shoppers lived within the second circumferential road. The longest shopping trips undertaken through public transit was 11.92 km long.
In Middle Street, all shoppers whose travel entailed high and very high emissions used private cars, and most lived within the second circumferential road, particularly between the first and second circumferential roads; the average travel distance was only approximately 5.74 km. Similarly, in Taiyuan Street, most shoppers whose travel generated very high and high CO2 emissions lived within the first circumferential road. The most common modes of travel to Middle Street and Taiyuan Street were bus (33.59% and 38.09%, respectively) and subway (31.17% and 31.71%, respectively). Shoppers whose travel behavior had low and very low emissions used public transport to travel to Middle Street and Taiyuan Street, with most traveling long distances; the corresponding emissions per shopper were 126.24 and 111.03 g, respectively (Figure 4b,c).

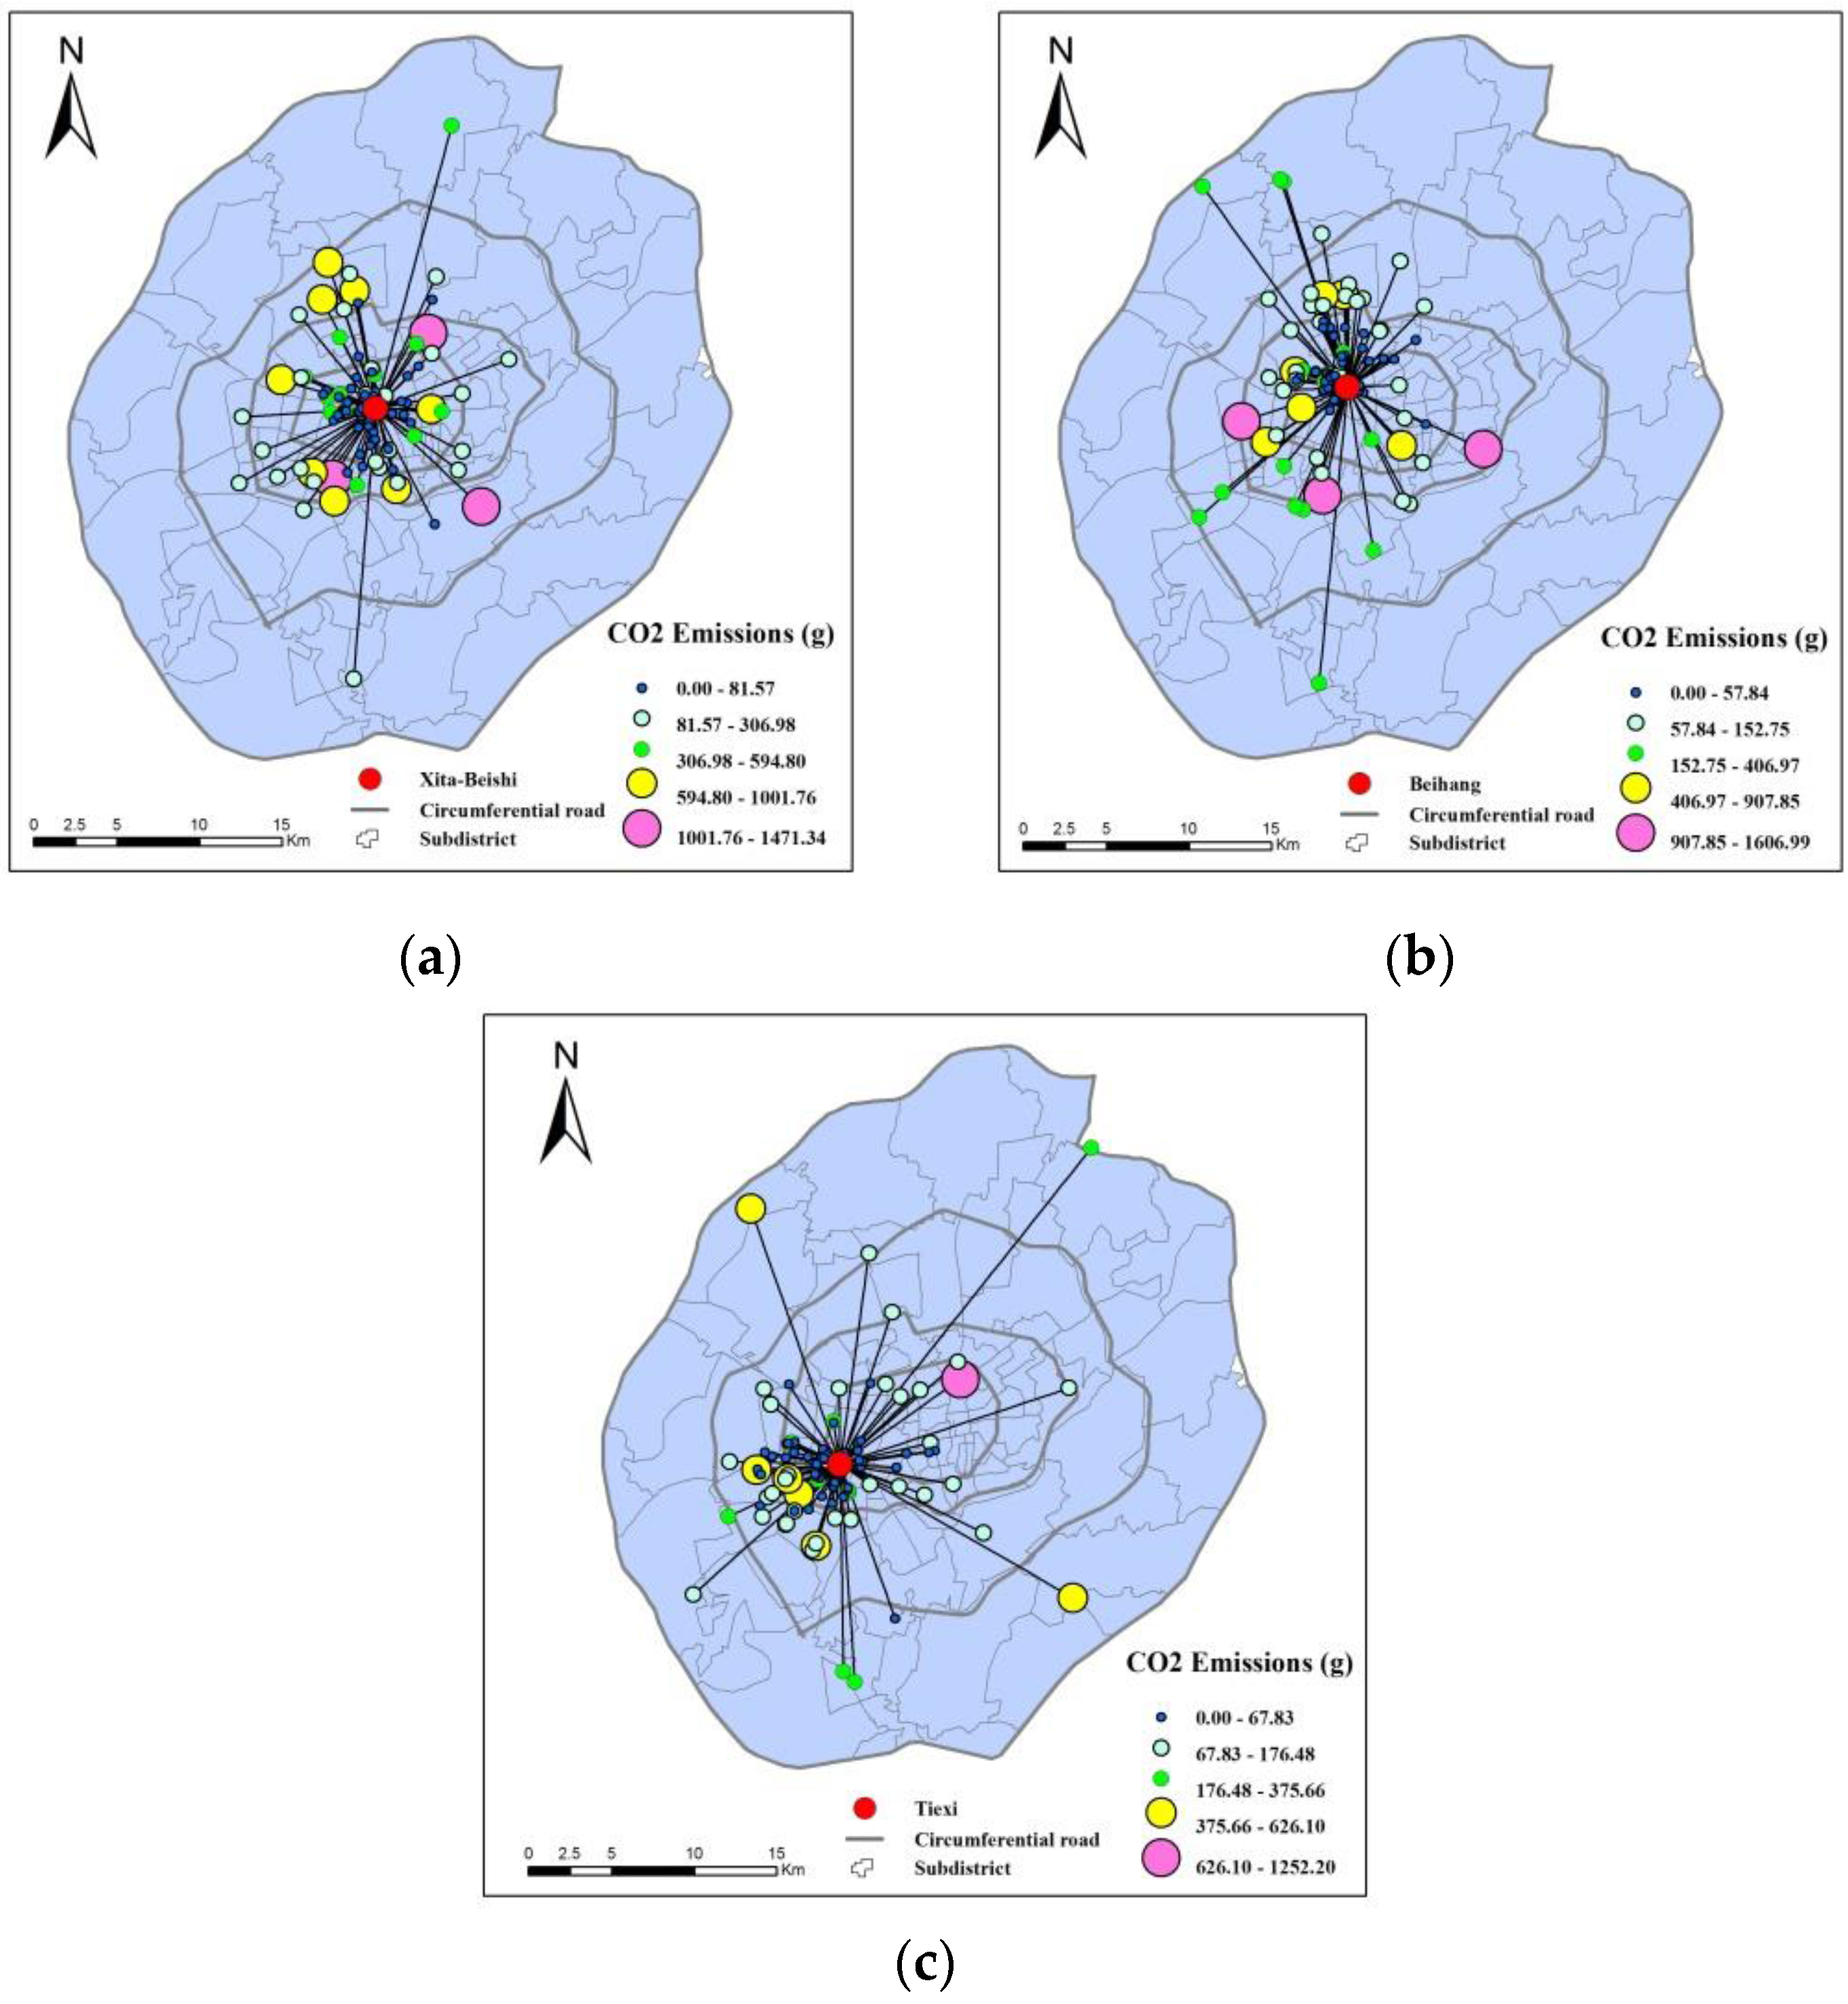
3.2.3. Commercial Centers with Low CO2 Emissions: Xita-Beishi, Beihang and Tiexi

As regional business circles, the commercial centers in Xita-Beishi, Beihang, and Tiexi mainly serve the residents in the surrounding areas, and, therefore, the average travel distance to these centers is short (4.46, 4.48, and 6.01 km, respectively). The proportion of shoppers traveling by private cars to these centers was very low but with the exception of Xita-Beishi (22.61%), which is a specialized business street housing Korean departmental stores and markets for flowers, birds, fish, works of art, and antiques. In addition, travel distance by car was short and was on average 5.45, 5.64, and 4.07 km for Xita-Beishi, Beihang, and Tiexi respectively. The most common travel mode in these low-emission commercial centers was bus (32.17%, 58.26%, and 38.96% in Xita-Beishi, Beihang, and Tiexi, respectively). In Beihang and Tiexi, shoppers whose travel generated low, very low, and even medium levels of CO2 emissions used public transport for shopping. The proportions of shoppers who walked and cycled to these centers were higher than those for the other commercial centers (39.13%, 23.48%, and 24.07% in Xita-Beishi, Beihang, and Tiexi, respectively; Figure 5a–c).

4. Discussion

4.1. Location and Transport Carbon Emissions

Regarding location, commercial centers in the inner city had the lowest level of per-trip emissions because they mainly attracted local shoppers, whereas commercial centers at the city center had higher emissions because they attracted both local and regional shoppers. Suburban centers had the highest emissions because they attracted a large number of long-distance, car-driving shoppers from both the surrounding areas and the city center. Moreover, nearly half of all shoppers traveling to suburban commercial centers resided in the urban core and had the longest travel distance of 12.12 km and the highest CO2 emissions of 376.60 g on average. Carbon emissions when traveling to commercial centers in the outskirts of Shenyang were 6.94% and 26.92% higher than those in the downtown region and the inner city, respectively.
These findings have profound implications for regional planning in Shenyang. Since the 1990s, Shenyang has experienced population decentralization, with people moving from the city center to the suburbs [46]. Furthermore, since the 1980s, the population distribution in Shenyang has become increasingly polycentric, with the population concentration in the inner suburbs increasing gradually [47]. Therefore, whether polycentric development is effective for relieving traffic congestion and reducing transport carbon emission in Shenyang is a crucial question. Our findings suggest that the current polycentric urban design is ineffective in reducing traffic demand. Yu et al. [48] reported that, although development of local large-scale shopping centers in suburbs and along arterial roads increase citizens’ quality of life in terms of shopping convenience, it increases city sprawl and generates high car traffic. Thus, excessive retail development may increase pollution and greenhouse gas emissions [49]. Therefore, we recommend spatial planning that balances regeneration of inner city shopping centers and development of new commercial centers in suburban areas; such planning would optimize urban spatial structure, which, in turn, can effectively reduce carbon emissions.

4.2. Retail Type and Energy Consumption

Wholesale markets are attractive to consumers because of the relatively low product prices. Our results showed that the wholesale markets investigated in this study induce high carbon emissions because they attract a substantial number of long-distance shoppers who travel by private cars or taxis. Moreover, the demand for high-end shops and products generates longer travel distances to commercial centers in the downtown region and in the suburbs, especially to outlet malls emerging in Hunnan. Consistent with our results, Carling et al. [50] found that shopping carbon emissions are influenced by the spatial distribution of different types of retail centers. Therefore, we recommend that the type of retail center be considered in the spatial configuration of commercial centers. In particular, for declining regional traditional commercial centers in inner cities, such as Xita-Beishi, Beihang, and Tiexi, establishing retailing facilities to meet the needs of a growing urban population is essential to reduce travel emissions: when these regional centers are fully developed, long-distance shopping travel would be reduced. Our findings echo those of [6], who inferred that the development of regional centers can effectively reduce travel distance, dependence on cars, and environmental pollution.

4.3. Sustainability of Travel Behavior

In this study, CO2 emissions per trip when using private cars were on average nearly six times higher than those when using public transport. Hence, reducing private car use is crucial for reducing emissions. Apart from the location of the commercial centers, private car use is related to the socioeconomic status of shoppers and their area of residence. Shoppers with high income (>5000 CNY per month) and high education level (undergraduate degree or higher) and those in the 26–35 year age group were most likely to drive. This result agrees well with that of Stead [51], who reported that travel behaviors vary according to individuals’ socioeconomic characteristics such as age, income, and education level. Considering the area of residence, 39.34% of car owners living within the second circumferential road used private cars for shopping travel; this result is more than 10 percentage points lower than that for car owners living beyond the second circumferential road. Car-driving shoppers mainly lived in newly developed suburban districts that had insufficient business services facilities and public transit accessibility. Private car usage rate was the highest for shoppers to Hunnan who lived in the surrounding low-density suburbs; this region has a relatively high car ownership rate of 57.14%.
Technological measures and policies can reduce carbon emissions to a certain extent. Nevertheless, policymakers in China can realize their low-carbon agenda by optimizing urban form, ensuring safety and comfort of low-carbon public transport modes (in particular, subway-based mass transit systems), investing in basic transport infrastructure, connecting city centers to suburban areas, developing sustainable transport intervention (e.g., parking regulations, vehicle and fuel taxes, and congestion taxes), and promoting low carbon consumption behaviors, all of which crucially influence shoppers’ choice of travel mode [29,52].

5. Conclusions

We examined the influence of the characteristics of commercial centers on consumer travel behavior and transport carbon emissions through a bottom-up approach. Individual shopping-related travel activities of shoppers in eight commercial centers in Shenyang, China were analyzed. This study contributes to the literature on the relationship between commercial centers and shopping-related transport carbon emissions in three ways. First, the results show that suburban commercial centers induce higher CO2 emissions than do similar commercial centers in the downtown and inner city regions. Second, we found that the retail type of the commercial centers influenced shopping-related carbon emissions. Finally, our analysis showed that changes in travel behavior can contribute to carbon emission reduction. A number of local transport policies can be implemented to encourage low-carbon travel behavior in Shenyang city, including the development of new energy vehicles, improving public transport and non-motorized infrastructure and service, accelerating the construction of subway-based mass transit systems, and introducing well-coordinated automobile control interventions such as vehicle and fuel taxes, parking regulations, rationing car use and congestion pricing. Thus, increasing the sustainability of low-carbon travel behavior must be adopted as a top policy to reduce CO2 emissions; this can be realized by considering the location and type of commercial centers in city planning as well as through the provision of efficient public transport systems.

Acknowledgments

This work was supported by grants from the National Natural Science Foundation of China (41201159; 41571152; 41401478; 41201160; 41001076) and the Key Research Program of the Chinese Academy of Sciences (KSZD-EW-Z-021-03; KZZD-EW-06-03).

Author Contributions

Jing Li conceived the analytical framework and wrote the manuscript with guidance from Pingyu Zhang. Kevin Lo reviewed the work and improved the paper continuously. Jing Li and Meng Guo processed questionnaires’ data and CO2 emissions models.

Conflicts of Interest

The authors declare no conflict of interest.

References

  1. Ishii, S.; Tabushi, S.; Aramaki, T.; Hanaki, K. Impact of future urban form on the potential to reduce Greenhouse gas emissions from residential, commercial and public buildings in Utsunomiya, Japan. Energy Policy 2010, 38, 4888–4896. [Google Scholar] [CrossRef]
  2. Pearce, D. The role of carbon taxes in adjusting to global warming. Econ. J. 1991, 101, 938–948. [Google Scholar] [CrossRef]
  3. Banister, D. Cities, mobility and climate change. J. Transp. Geogr. 2011, 19, 1538–1546. [Google Scholar] [CrossRef]
  4. Alkhathlan, K.; Javid, M. Carbon emissions and oil consumption in Saudi Arabia. Renew. Sustain. Energy Rev. 2015, 48, 105–111. [Google Scholar] [CrossRef]
  5. Walmsley, M.R.W.; Walmsley, T.G.; Atkins, M.J.; Kamp, P.J.J.; Neale, J.R.; Chand, A. Carbon emissions pinch analysis for emissions reductions in the New Zealand transport sector through to 2050. Energy 2015, 92, 569–576. [Google Scholar] [CrossRef]
  6. Sim, L.L.; Malone-Lee, L.C.; Chin, K.H.L. Integrating land use and transport planning to reduce work-related travel: A case study of tampines regional centre in Singapore. Habitat Int. 2001, 25, 399–414. [Google Scholar] [CrossRef]
  7. Hankey, S.; Marshall, J.D. Impacts of urban form on future U.S. passenger-vehicle Greenhouse gas emissions. Energy Policy 2010, 38, 4880–4887. [Google Scholar] [CrossRef]
  8. Wang, S.; Fang, C.; Wang, Y.; Huang, Y.; Ma, H. Quantifying the relationship between urban development intensity and carbon dioxide emissions using a panel data analysis. Ecol. Ind. 2015, 49, 121–131. [Google Scholar] [CrossRef]
  9. Yang, W.; Li, T.; Cao, X. Examining the impacts of socio-economic factors, urban form and transportation development on CO2 emissions from transportation in China: A panel data analysis of China’s provinces. Habitat Int. 2015, 49, 212–220. [Google Scholar] [CrossRef]
  10. Ye, H.; He, X.; Song, Y.; Li, X.; Zhang, G.; Lin, T.; Xiao, L. A sustainable urban form: The challenges of compactness from the viewpoint of energy consumption and carbon emission. Energ Build. 2015, 93, 90–98. [Google Scholar] [CrossRef]
  11. Ewing, R.; Cervero, R. Travel and the built environment: A meta-analysis. J. Am. Plan. Assoc. 2010, 76, 265–294. [Google Scholar] [CrossRef]
  12. Handy, S.; Cao, X.; Mokhtarian, P. Correlation or causality between the built environment and travel behavior? Evidence from Northern California. Transp. Res. Part D Transp. Environ. 2005, 10, 427–444. [Google Scholar] [CrossRef]
  13. Wegener, M. Overview of land-use transport models. Handb. Transp. Geogr. Spat. Syst. 2004, 5, 127–146. [Google Scholar]
  14. Anderson, W.P.; Kanaroglou, P.S.; Miller, E.J. Urban form, energy and the environment: A review of issues, evidence and policy. Urban Stud. 1996, 33, 7–35. [Google Scholar] [CrossRef]
  15. Echenique, M.H.; Hargreaves, A.J.; Mitchell, G.; Namdeo, A. Growing cities sustainably: Does urban form really matter? J. Am. Plan. Assoc. 2012, 78, 121–137. [Google Scholar] [CrossRef]
  16. Kitamura, R.; Akiyama, T.; Yamamoto, T.; Golob, T. Accessibility in a metropolis: Toward a better understanding of land use and travel. Transp. Res. Rec. J. Transp. Res. Board 2001, 64–75. [Google Scholar] [CrossRef]
  17. Lee, S.; Lee, B. The influence of urban form on GHG emissions in the U.S. household sector. Energy Policy 2014, 68, 534–549. [Google Scholar] [CrossRef]
  18. Cirilli, A.; Veneri, P. Spatial structure and carbon dioxide (CO2) emissions due to commuting: An analysis of Italian urban areas. Reg. Stud. 2014, 48, 1993–2005. [Google Scholar] [CrossRef]
  19. Scott, D.M.; Kanaroglou, P.S.; Anderson, W.P. Impacts of commuting efficiency on congestion and emissions: Case of the Hamilton CMA, Canada. Transp. Res. Part D Transp. Environ. 1997, 2, 245–257. [Google Scholar] [CrossRef]
  20. Chai, Y.; Zhang, Y.; Liu, Z. Spatial differences of home-work separation and the impacts of housing policy and urban sprawl: Evidence from household survey data in Beijing. Acta Geogr. Sin. 2011, 66, 157–166. [Google Scholar]
  21. Yeates, M.; Montgomery, D. The changing commercial structure of non-metropolitan urban centres and vacancy rates. Can. Geogr. 1999, 43, 382–399. [Google Scholar] [CrossRef]
  22. Cao, L.; Chai, Y. Daily shopping activity space of the elderly in Shanghai city. Hum. Geogr. 2006, 21, 50–54. [Google Scholar]
  23. Shi, Y.; Wu, J.; Wang, S. Spatio-temporal features and the dynamic mechanism of shopping center expansion in Shanghai. Appl. Geogr. 2015, 65, 93–108. [Google Scholar] [CrossRef]
  24. Sun, G.; Chen, Z. The retrospect and prospect on the commercial spatial researches in China and the corresponding compaer with western countries since the 1920’s. Hum. Geogr. 2008, 23, 78–83. [Google Scholar]
  25. Guan, C.; Cui, G. Progress in research on foreign commercial geography since the 1990’s. World Reg. Stud. 2003, 12, 44–53. [Google Scholar]
  26. Cachon, G.P. Retail store density and the cost of Greenhouse gas emissions. Manag. Sci. 2014, 60, 1907–1925. [Google Scholar] [CrossRef]
  27. Motoshita, M.; Sakagami, M.; Kudoh, Y.; Tahara, K.; Inaba, A. Potential impacts of information disclosure designed to motivate Japanese consumers to reduce carbon dioxide emissions on choice of shopping method for daily foods and drinks. J. Clean. Prod. 2015, 101, 205–214. [Google Scholar] [CrossRef]
  28. Wang, D.; Wang, C.; Xie, D.; Zhong, W.; Wu, M.; Zhu, W.; Zhou, J.; Li, Y. Comparison of retail trade areas of retail centers with different hierarchical levels: A case study of east nanjing road, wujioachang, anshan road in Shanghai. Urban Plan. Forum 2015, 3, 50–60. [Google Scholar]
  29. Li, J.; Zhang, P.; Lo, K.; Guo, M.; Wang, M. Reducing carbon emissions from shopping trips: Evidence from china. Energies 2015, 8, 10043–10057. [Google Scholar] [CrossRef]
  30. Ren, W.; Xue, B.; Geng, Y.; Lu, C.; Zhang, Y.; Zhang, L.; Fujita, T.; Hao, H. Inter-city passenger transport in larger urban agglomeration area: Emissions and health impacts. J. Clean. Prod. 2016, 114, 412–419. [Google Scholar] [CrossRef]
  31. Lin, T. Carbon dioxide emissions from transport in Taiwan’s national parks. Tour. Manag. 2010, 31, 285–290. [Google Scholar] [CrossRef]
  32. Dai, H.; Mischke, P.; Xie, X.; Xie, Y.; Masui, T. Closing the gap? Top-down versus bottom-up projections of China’s regional energy use and CO2 emissions. Appl. Energy 2016, 162, 1355–1373. [Google Scholar] [CrossRef]
  33. Selvakkumaran, S.; Limmeechokchai, B. Low carbon society scenario analysis of transport sector of an emerging economy—The aim/enduse modelling approach. Energy Policy 2015, 81, 199–214. [Google Scholar] [CrossRef]
  34. Wang, C.; Cai, W.; Lu, X.; Chen, J. CO2 mitigation scenarios in China’s road transport sector. Energy Convers. Manag. 2007, 48, 2110–2118. [Google Scholar] [CrossRef]
  35. Wang, Z.; Chen, F.; Fujiyama, T. Carbon emission from urban passenger transportation in Beijing. Transp. Res. Part D Transp. Environ. 2015, 41, 217–227. [Google Scholar] [CrossRef]
  36. Tichavska, M.; Tovar, B. Environmental cost and eco-efficiency from vessel emissions in Las Palmas Port. Transp. Res. Part E Logist. Transp. Rev. 2015, 83, 126–140. [Google Scholar] [CrossRef]
  37. Ma, J.; Heppenstall, A.; Harland, K.; Mitchell, G. Synthesising carbon emission for mega-cities: A static spatial microsimulation of transport CO2 from urban travel in Beijing. Comput. Environ. Urban Syst. 2014, 45, 78–88. [Google Scholar] [CrossRef]
  38. Howitt, O.J.; Revol, V.G.; Smith, I.J.; Rodger, C.J. Carbon emissions from international cruise ship passengers’ travel to and from New Zealand. Energy Policy 2010, 38, 2552–2560. [Google Scholar] [CrossRef]
  39. Zhang, Q.; Tao, X.; Yang, P. Research on carbon emissions from metropolis urban passenger transport and countermeasures. Chin. Popul. Resour. Environ. 2012, 22, 35–42. [Google Scholar]
  40. Chu, C.; Chen, H.; Chen, J. Empirical analysis and accounting of carbon emissions for urban road passenger transportation. Ecol. Econ. 2015, 31, 56–60. [Google Scholar]
  41. Liu, S.; Zhao, M.; Bao, C.; Liu, J. Carbon emission calculation for urban transport based on scenario analysis of traffic structure. J. Transp. Syst. Eng. Inf. Technol. 2015, 15, 222–227. [Google Scholar]
  42. Tong, K.; Ma, K. Significant impact of job-housing distance on carbon emissions from transport: A scenario analysis. Acta Ecol. Sin. 2012, 32, 2975–2984. [Google Scholar] [CrossRef]
  43. Xu, Z.; Zou, Z.; Cao, B. Carbon emission assessments of passenger transport in urban city and approaches to low carbon development-take Tianjin city as an example. J. Beijing Univ. Technol. 2013, 39, 1007–1013. [Google Scholar]
  44. Masucci, A.P.; Stanilov, K.; Batty, M. Limited urban growth: London’s street network dynamics since the 18th century. PLoS ONE 2013, 8. [Google Scholar] [CrossRef] [PubMed]
  45. Chen, J.; Yang, S.T.; Li, H.W.; Zhang, B.; Lv, J.R. Research on geographical environment unit division based on the method of natural breaks (jenks). ISPRS—Int. Arch. Photogramm. Remote Sens. Spat. Inf. Sci. 2013, XL-4/W3, 47–50. [Google Scholar] [CrossRef]
  46. Wang, F.; Meng, Y. Analyzing urban population change patterns in Shenyang, China 1982–90: Density function and spatial association approaches. Geogr. Inf. Sci. 1999, 5, 121–130. [Google Scholar] [CrossRef]
  47. Qin, Z.; Zhang, P. Simulation analysis on spatial pattern of urban population in Shenyang city, China in late 20th century. Chin. Geogr. Sci. 2011, 21. [Google Scholar] [CrossRef]
  48. Yu, B.; Yang, Z.; Cheng, C. Optimizing the distribution of shopping centers with parallel genetic algorithm. Eng. Appl. Artif. Intell. 2007, 20, 215–223. [Google Scholar] [CrossRef]
  49. Erkip, F.; Ozuduru, B.H. Retail development in Turkey: An account after two decades of shopping malls in the urban scene. Prog. Plan. 2015, 102, 1–33. [Google Scholar] [CrossRef]
  50. Carling, K.; Håkansson, J.; Jia, T. Out-of-town shopping and its induced CO2-emissions. J. Retail. Consum. Serv. 2013, 20, 382–388. [Google Scholar] [CrossRef]
  51. Stead, D. Relationships between land use, socioeconomic factors, and travel patterns in Britain. Environ. Plan. B 2001, 28, 499–528. [Google Scholar] [CrossRef]
  52. Jain, D.; Tiwari, G. How the present would have looked like? Impact of non-motorized transport and public transport infrastructure on travel behavior, energy consumption and CO2 emissions-Delhi, Pune and Patna. Sustain. Cities Soc. 2016, 22, 1–10. [Google Scholar] [CrossRef]
Figure 1. Location of Shenyang city and eight commercial centers.
Energies 09 00765 g001
Figure 2. CO2 emissions per trip to the eight commercial centers.
Energies 09 00765 g002
Figure 3. (a) CO2 emissions per trip to Wuai; (b) CO2 emissions per trip to Nanta.
Energies 09 00765 g003
Figure 4. (a) CO2 emissions per trip to Hunnan; (b) CO2 emissions per trip to Middle Street; and (c) CO2 emissions per trip to Taiyuan Street.
Energies 09 00765 g004
Figure 5. (a) CO2 emissions per trip to Xita-Beishi; (b) CO2 emissions per trip to Beihang; (c) CO2 emissions per trip to Tiexi.
Energies 09 00765 g005
Table 1. Characteristics of the studied shopping centers.
Commercial CenterLocationTypeNo. of Subway LinesNo. of Bus Routes
Middle StreetCity centerMunicipal168
Taiyuan StreetCity centerMunicipal143
WuaiInner cityWholesale119
BeihangInner cityRegional030
Xita-BeishiInner cityRegional030
TiexiInner cityRegional019
NantaInner cityWholesale117
HunnanSuburbanRegional125
Table 2. Parameters of CO2 emissions model [39,40,41,42,43].
Travel ModeAverage Fuel/Power Consumption Rate (F or C)Fuel Density (ρ)Emission Factor (EF)Transport Capacity (AC)
Bus34.0 m3/100 km-2.2 tCO2/1000 Nm349.5
Subway454.0 kWh/100 km-0.8 kg/kWh360.0
Electric bike2.8 kWh/100 km-0.8 kg/kWh1.2
Taxi8.7 m3/100 km-2.2 tCO2/1000 Nm32.0
Private car10.5 L/100 km740.8 kg /m32.9 tCO2/t2.2
Table 3. Characteristics of the survey respondents.
Car Ownership (%)Travel Mode (%)Gender (%) Age Group, Years (%)Education Level (%)Occupation (%)Per Capita Monthly Income, CNY (%)
Yes (36.0);
No (64.0)
Walking,
Cycling (17.8);
Bus (44.5);
Subway (15.4);
Electric bike (2.2);
Taxi (4.4);
Private car (15.7)
Male (40.1);
Female (59.9)
≤18 (2.8);
19–25 (26.7);
26–35 (35.0);
36–50 (19.7);
51–65 (12.7);
>65 (3.1)
Below High school (22.3);
High school (14.6);
Undergraduate degree (57.8);
Master’s degree or higher (5.3)
Public (23.3);
Business (38.6);
Self-employed (17.2);
Unemployed (7.5);
Retirement (13.4)
<2000 (16.6);
2000–3000 (27.8);
3000–5000 (33.9);
>5000 (21.7)
Table 4. Emissions data for the eight commercial centers.
Commercial CenterLevelRange (g)Percentage (%)
WuaiVery high1533.95–2838.324.59
High761.76–1533.955.94
Medium434.70–761.767.92
Low182.86–434.7016.83
Very low0.00–182.8664.36
NantaVery high1304.38–2692.234.81
High636.54–1304.385.77
Medium278.80–636.539.62
Low80.08–278.8043.27
Very low0.00–80.0836.54
HunnanVery high926.10–1847.007.48
High491.40–926.104.67
Medium220.19–419.4015.89
Low80.61–220.1948.60
Very low0.00–80.6123.36
Middle StreetVery high1053.94–1700.913.85
High486.42–1053.9413.46
Medium203.48–486.427.69
Low74.15–203.4836.54
Very low0.00–74.1538.46
Taiyuan StreetVery high918.28–1419.165.21
High563.49–918.288.33
Medium271.31–563.4915.63
Low80.61–271.3132.29
Very low0.00–80.67138.54
Xita-BeishiVery high1001.76–1471.342.61
High594.80–1001.766.96
Medium306.98–594.8010.43
Low81.57–306.9823.48
Very low0.00–81.5756.52
BeihangVery high907.85–1606.992.61
High406.97–907.855.22
Medium152.75–406.9713.04
Low57.84–152.7526.09
Very low0.00–57.8453.04
TiexiVery high626.10–1252.200.93
High375.66–626.105.56
Medium176.48–375.6610.19
Low67.83–176.4830.56
Very low0.00–67.8352.78

