Article

Influence of Hydrogen-Based Storage Systems on Self-Consumption and Self-Sufficiency of Residential Photovoltaic Systems

by
Christian Pötzinger
*,
Markus Preißinger
and
Dieter Brüggemann
Lehrstuhl für Technische Thermodynamik und Transportprozesse, Zentrum für Energietechnik, Universität Bayreuth, Universitätsstraße 30, 95447 Bayreuth, Germany
*
Author to whom correspondence should be addressed.
Energies 2015, 8(8), 8887-8907; https://doi.org/10.3390/en8088887
Submission received: 17 July 2015 / Revised: 11 August 2015 / Accepted: 12 August 2015 / Published: 21 August 2015

Abstract

:
This paper analyzes the behavior of residential solar-powered electrical energy storage systems. For this purpose, a simulation model based on MATLAB/Simulink is developed. Investigating both short-time and seasonal hydrogen-based storage systems, simulations on the basis of real weather data are processed on a timescale of 15 min for a consideration period of 3 years. A sensitivity analysis is conducted in order to identify the most important system parameters concerning the proportion of consumption and the degree of self-sufficiency. Therefore, the influences of storage capacity and of storage efficiencies are discussed. A short-time storage system can increase the proportion of consumption by up to 35 percentage points compared to a self-consumption system without storage. However, the seasonal storing system uses almost the entire energy produced by the photovoltaic (PV) system (nearly 100% self-consumption). Thereby, the energy drawn from the grid can be reduced and a degree of self-sufficiency of about 90% is achieved. Based on these findings, some scenarios to reach self-sufficiency are analyzed. The results show that full self-sufficiency will be possible with a seasonal hydrogen-based storage system if PV area and initial storage level are appropriate.

Graphical Abstract

1. Introduction

A general objective of international energy policy is to protect climate effectively with more rational use of energy and by increasing the share of renewable energies. Germany, for example, has committed to reduce greenhouse gas emissions by 40% until 2020 compared to 1990, limiting the increase in the average global temperature to a maximum of 2 K compared to preindustrial levels [1]. Additionally, a share of renewables in German electricity supply of 40% to 45% by 2025 is intended, simultaneously ensuring a secure and affordable energy supply [2].
Despite the energy system transformation target, energy-related emissions have been rising since 2012 due to the increased use of coal [3]. However, to contain global warming, harmful emissions should be drastically reduced to avoid a temperature increase of up to 4 K [4]. Therefore, the development of renewable energy has to speed up. However, renewable power generation exhibits a fluctuating character, which is difficult to forecast. Thus, further expansion of storage capacities is necessary to compensate for differences between generation and demand. Until now, grid control has been done through pumped-storage power plants and adjustment of thermal power plants. Since the potential of the former is limited, distributed energy storage systems offer an interesting option appropriate to decentralized renewable energy generation.
According to guaranteed feed-in tariffs by the German Renewable Energy Sources Act [2] and especially the sharp drop in the price of photovoltaic (PV) systems, PV power capacity has grown substantially over the last few years. Up to 2014 a capacity of around 36 GWp was installed in Germany [5], corresponding to a share of 5.7% of the annual gross electricity production in 2014 [3].
The principal aim of installing a PV-system has been the feeding of generated electrical energy into the grid to get a feed-in remuneration. Obtaining a higher rate of payment, the systems are dimensioned as large as possible. Due to the strong increase in PV generation power, the feed-in tariffs continuously decrease until the remuneration terminates at a total installed PV capacity of 52 GWp [5]. As a consequence of the reduced profitability, only a few PV systems were installed in 2014.
In 2012, the feed-in tariffs for PV-generated electricity declined below the retail electricity prices for households [6]. Thus, instead of feeding into the grid, self-consumption of generated electricity became more attractive. A storage system can buffer excess renewable energy which can be used at night or at times with low irradiation to minimize grid purchases. Therefore, it offers a higher potential to increase self-consumption than optimal appliance scheduling (Demand Side Management) [7,8,9,10].
In residential buildings, the storage system can be based on common batteries (lead-acid or li-ion) or on hydrogen in the future. Several studies analyze the impact of batteries in a solar-powered system [11,12,13,14,15,16,17] or in a hybrid energy system [18,19,20,21]. Additionally, the influence of a perfect PV generation forecast and, in particular, operational strategies of energy storage systems are discussed [22,23,24,25].
Moreover, some studies are available on the modelling and the simulation of stand-alone hybrid systems with combined storage systems comprising hydrogen and batteries [26,27,28,29,30,31]. Only a few studies investigate hybrid hydrogen-based storage systems without batteries [32,33,34] or photovoltaic hydrogen systems [35]. Most hydrogen-based storage systems are compressed gas tanks. In contrast, Bocci et al. [36] shows a low-pressure metal hydride tank. Furthermore, hydrogen-based storage systems are compared with compressed-air storage [37] and with batteries [38,39]. In almost every study, energy systems are simulated either for one whole year based on hourly averaged/synthetic data or only for some special days (standard days or a week) with a smaller timescale which can be an important factor for error formation [40].
In this paper, a tool for the simulation of grid-connected residential energy systems is presented to characterize hydrogen-based storage systems. Simulations are performed on a timescale of 15 min for a consideration period of 3 years. First, the input data for modelling of load demand (based on standard load profile) and for solar energy generation (real weather data for temperature and global irradiation) are presented. Then, the simulation model and the behavior of a storage system are described. After defining assessment criteria, a PV direct consumption system is discussed. Furthermore, the effects of integrating a short-time storage system are shown. A sensitivity analysis is conducted to show the impact of different parameters. The section on variation of storage efficiencies considers the characteristics of different hydrogen storage possibilities (metal hydride, gas tank, etc.), which are not the focus of this paper. The transition from short-time to seasonal storing is presented by an increase of usable storage capacity. Finally, based on the high degree of self-sufficiency resulting from a seasonal storing of energy, several scenarios to achieve almost full self-sufficiency are presented.

2. Modelling

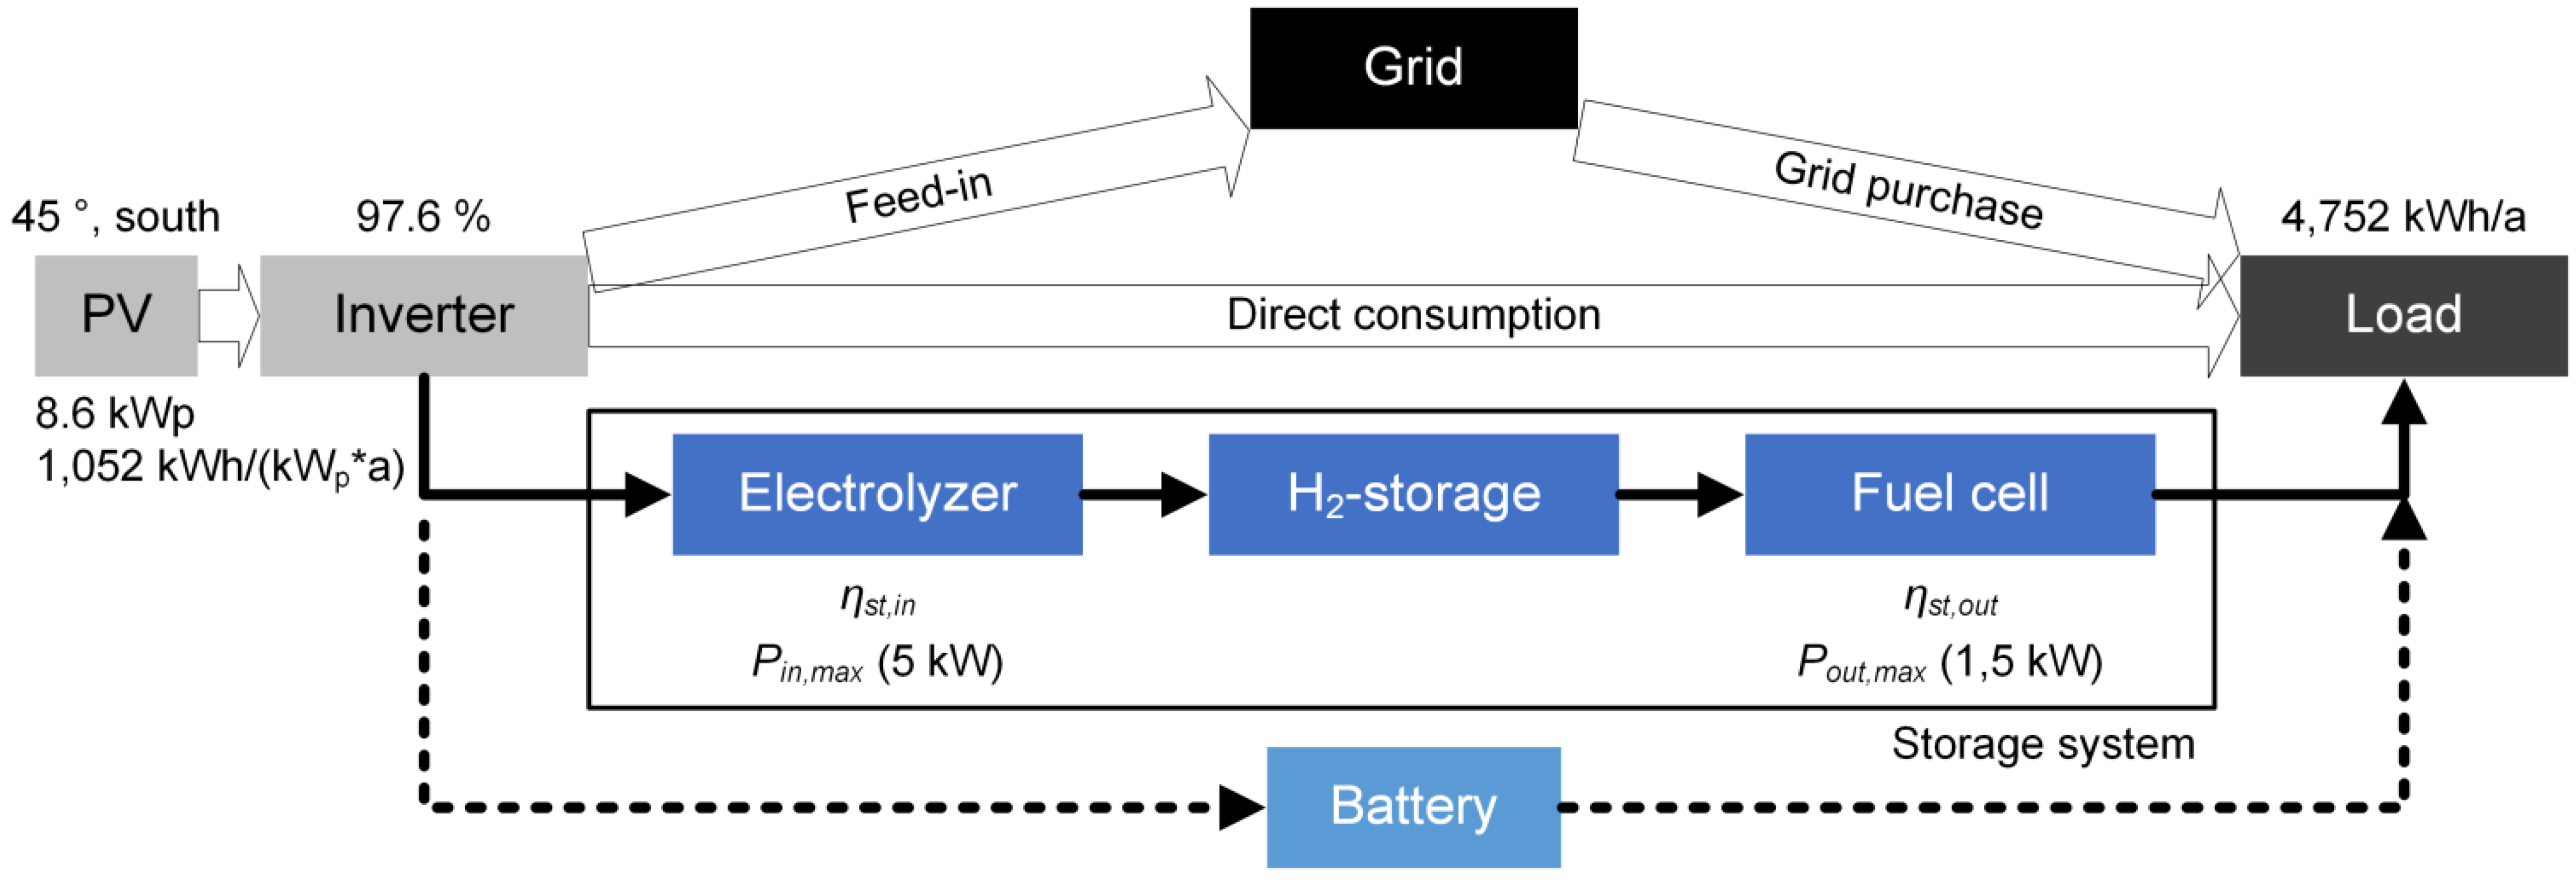
For analyzing storage behavior in residential energy systems, a time-discrete model is developed. Simulations are performed by MATLAB/Simulink [41]. A block diagram including relevant components and energy flows is displayed in Figure 1, in which important input data are shown near the specific blocks. The energy provided by the PV modules is primarily consumed directly. If generation exceeds the load of the household, this excess energy will be—in the case of a direct consumption system—fed into the grid. If there is a storage system available, the excess energy will be stored. Conversely, if the load demand is higher than the PV generation, energy will be provided whenever possible by the storage system or otherwise by the grid.
Figure 1. Block diagram of the considered energy system.
Energies 08 08887 g001
To model the energy flows, data series for both solar energy generation and load demand of a household are necessary. This study investigates a single-family house with a living space of 214 square meters and 4 residents [42]. For this building, a period of 3 years is simulated with a step size of 15 min.

2.1. Input Data

The simulation of the PV generation system is based on time series of meteorological data at the location of Nuremberg Airport. This weather station in central Bavaria is operated by the German weather service. Measured data of global irradiation and temperature as 10-min averaged values from the year 2011 until 2013 are taken from the Bavarian Hydrological Service [43]. The roof-mounted system covers the entire south-directed roof space of the model building to exploit a PV generation potential of 8.6 kWp, which accords well with the average potential of 8.7 kWp in suburban areas [44]. The roof inclination is 45° and no shading occurs.
The measured values of global radiation determine the power of the PV system. For an irradiation of 800 W/m2, a generator temperature increase of 27 K relative to the ambient temperature is expected. Consequently, the power output decreases with −0.45%/K compared to the standard test temperature of 25 °C. Additionally, a generator field efficiency of 96.5% (due to losses in diodes, power mismatch, dirt, etc.) and a constant inverter efficiency of 97.6% are taken into account [45]. Power degradation is ignored.
Based on an average sum of global radiation of 1160 kWh/(m2·a), corresponding to a radiation onto the inclined PV generator of 1382 kWh/(m2·a), the following annual yields are achieved: 1103 kWh/kWp (2011); 1,077 kWh/kWp (2012); 977 kWh/kWp (2013) (Table 1). Validation of the simulation with a commercial design program [45] in consideration of additional loss factors (data sheet tolerances, cabling, diodes, inverter design, etc.) shows deviations in annual yields lower than 3.5% and accordance with the generated electricity during the whole period under review.
Table 1. Overview of input values.
Solar potentialUnitValue
Average sum of global radiation on horizontal surfacekWh/(m2·a)1160
Average sum of global radiation on inclined surface (45°, south)kWh/(m2·a)1382
PV production
Installed PV powerkWp8.64
Average annual PV yieldkWh/(kWp·a)1052
Consumption
Annual electricity demandkWh/a4752
In addition to the PV generation profile, simulation of load demand is required, but the consumption in a household varies significantly dependent on environmental conditions and especially on consumer behavior, existing equipment and its home application [46].
These typical fluctuations are only observable at high time resolutions. The guideline VDI 4655 [47] allows for a time series of load demand with a discretization step of one minute. Indeed, it lacks statistically confirmed validity as only a few consumers are considered.
Due to the lack of meteorological data at a high temporal resolution, the standard load profile H0 [48,49,50] is used for modelling the load demand. This profile has a time resolution of 15 min and is deployed by transmission system operators and energy suppliers to predict the load demand of non-load metered consumers. Due to the statistical average, typical fluctuations are missing, but the profile is sufficiently accurate to predict the energy consumption in a large number of households [51].
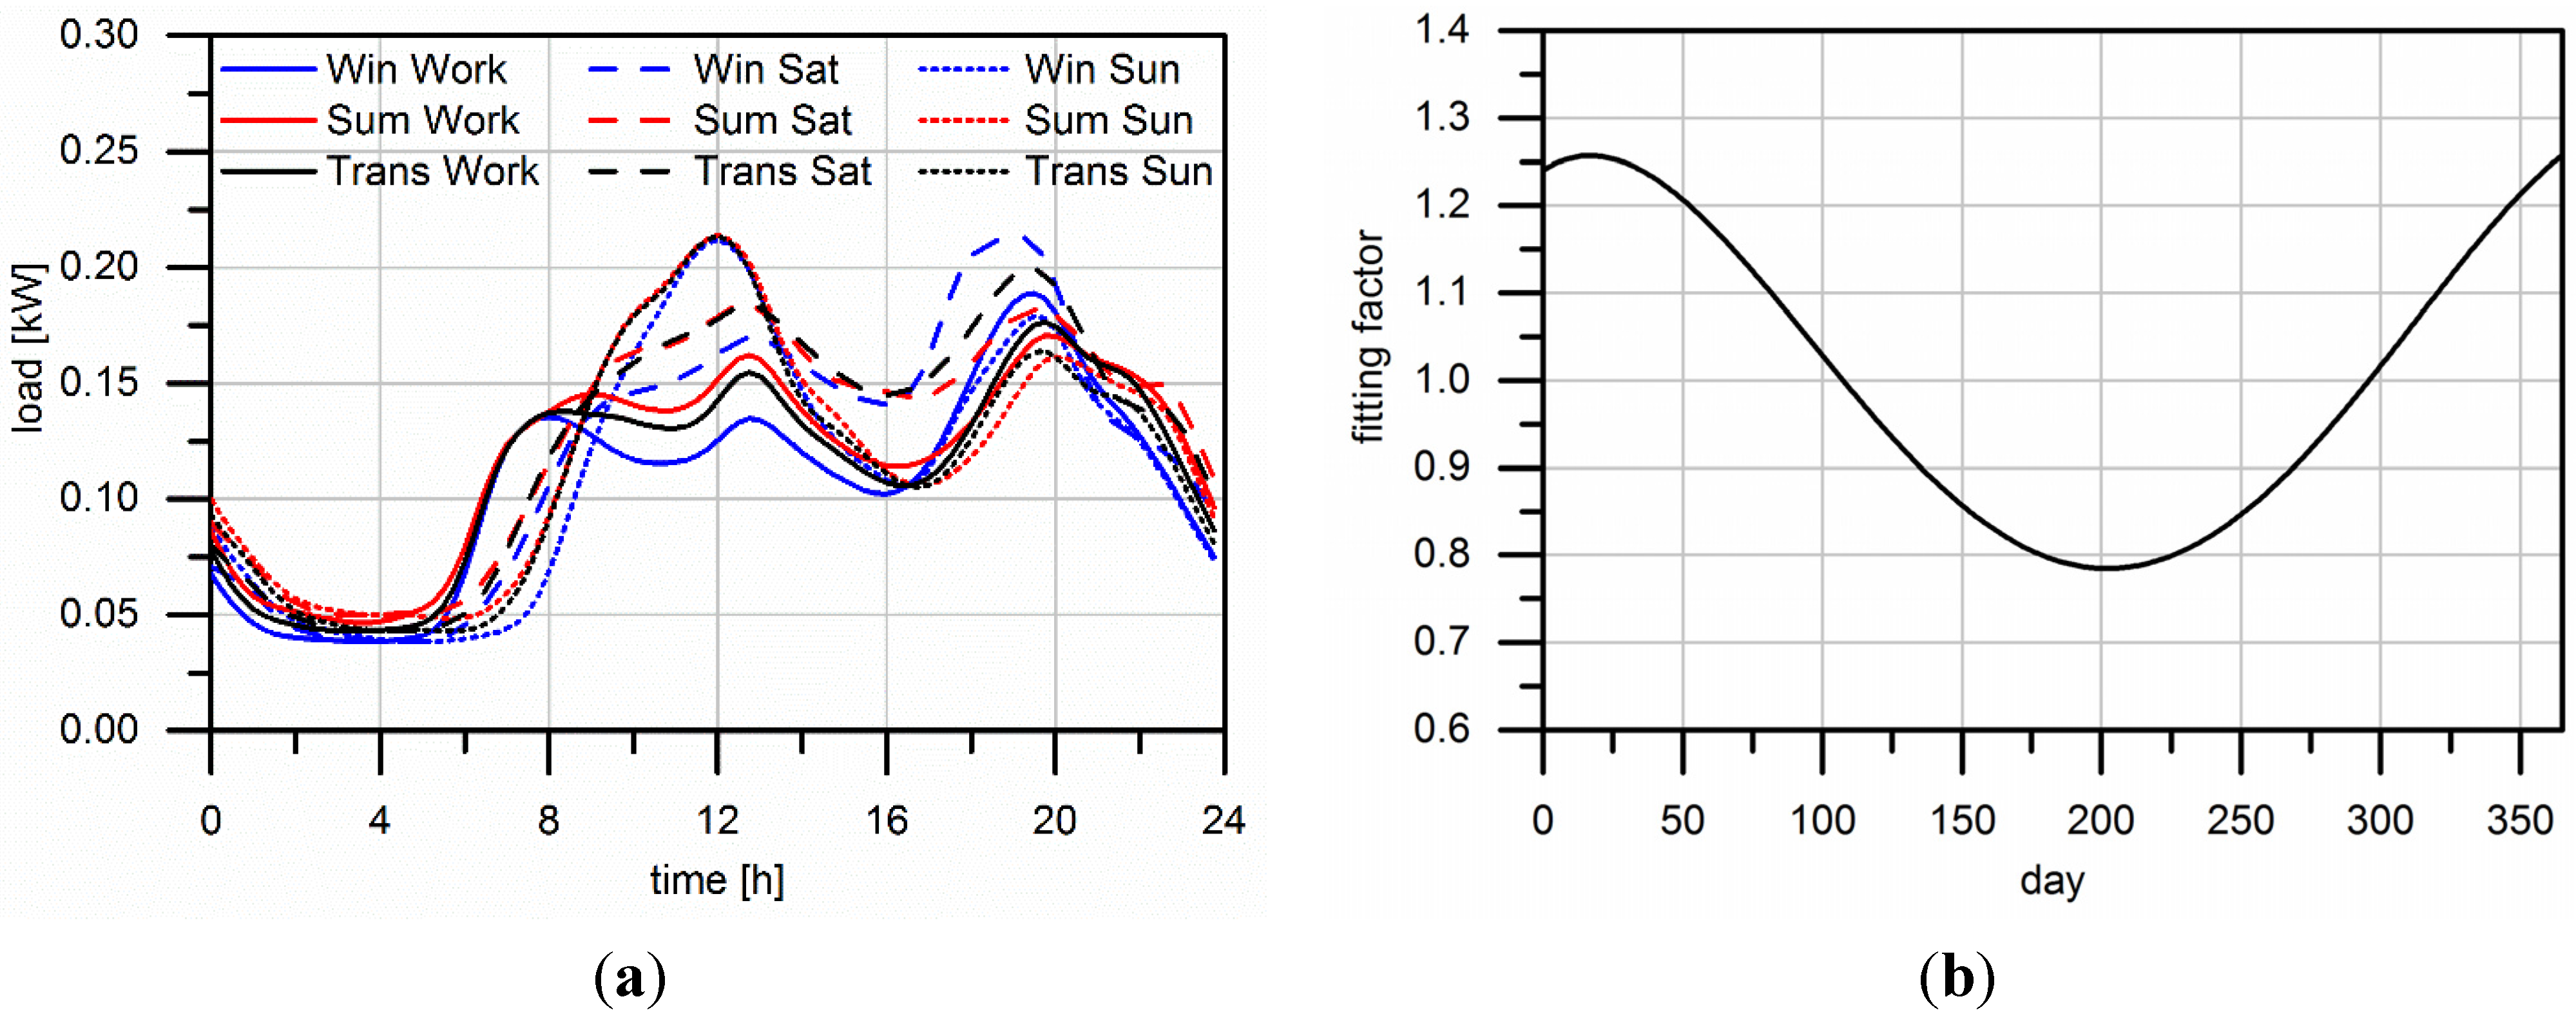
The course of the year is generated by a sequence of daily profiles (Figure 2a). They are characterized by both day type (working day (Work), Saturday (Sat), Sunday (Sun)) and season type (winter (Win), summer (Sum), transitional period (Trans)). A fitting factor for the nth day of the year takes into account seasonal effects depending on annual variations in temperature (Figure 2b) [50]:
f = − 3.92 × 10 10 n 4  + 3.20 × 10 7 n 3 7.02 × 10 5 n 2  + 0.0021 n  + 1.24
Other possibilities for minimizing the differences between generation and load like energy saving or demand-side management are not considered in particular [7,8,9,10]. For a four-person household, an annual electricity demand of 4,752 kWh is assumed [52]. In combination with the standard load profile, the power demand in each simulation step is determined.
Figure 2. (a) Daily load profiles characterized by day and season type; (b) Fitting function to take into account seasonal variations.
Energies 08 08887 g002

2.2. Direct Consumption

Based on the load and generation profiles described before, energy flows in the model house are simulated. First, a direct consumption system without storage is considered (see Figure 1). Generated electricity supplies primarily the simultaneously occurring direct consumption of the household. Additional available excess power is fed into the grid and the grid provides the required power. Hence, the residual load Pres results from the difference between load demand Pload and PV power PPV and describes the energy exchange with the grid:
P r e s  =  P l o a d   P P V
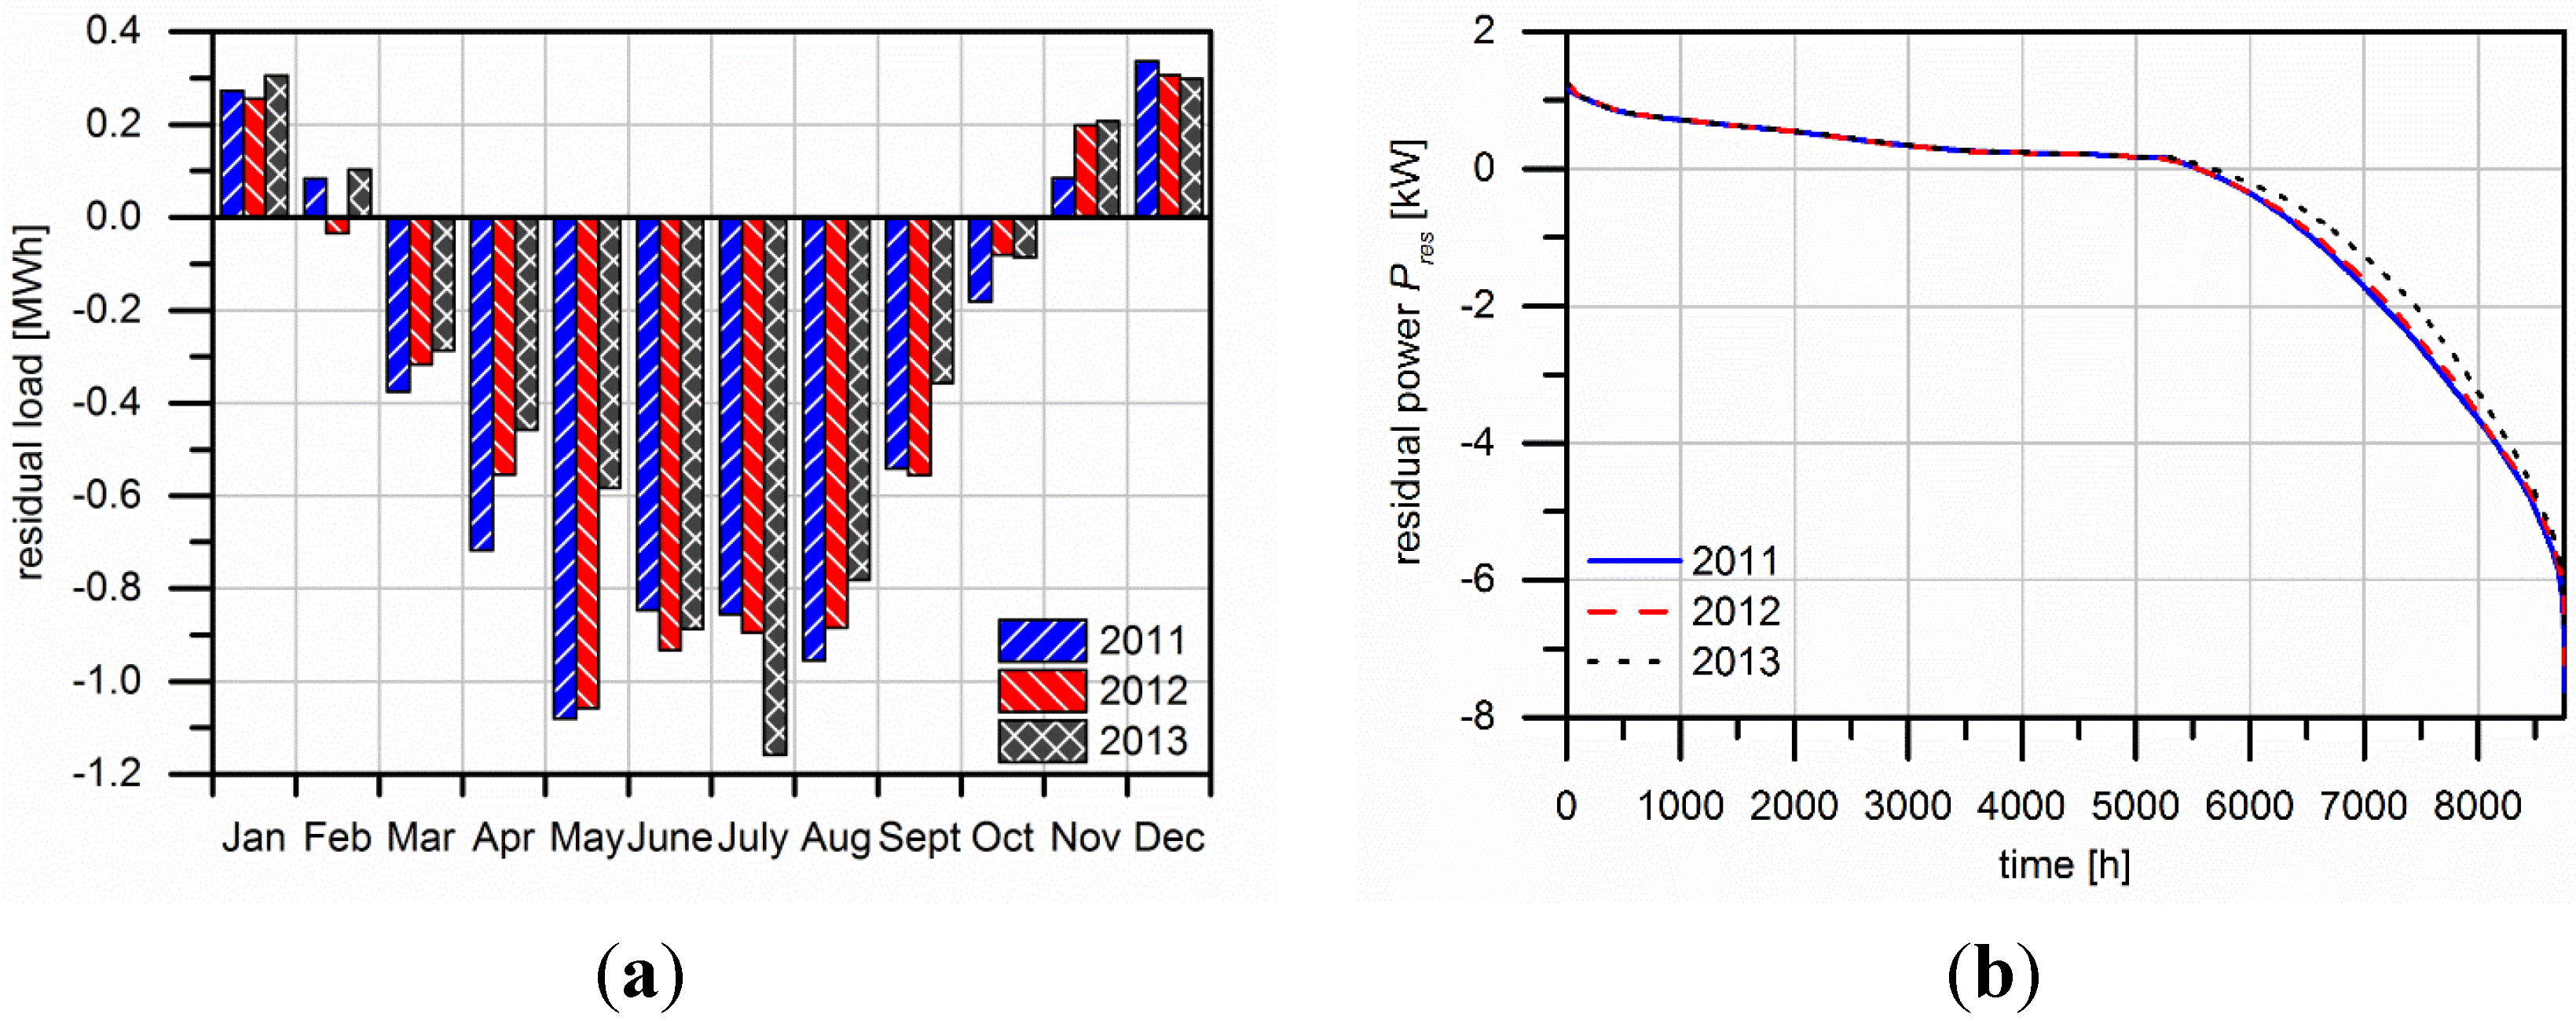
Caused by the design of the PV generation system, the power output at times of clear sky and sunshine is much higher than the load demand. Therefore, a large energy surplus arises in the summer months as shown in Figure 3a. Considering the whole period of 3 years, almost twice as much energy is produced as is needed. Since load and generation have to match at any time, electricity from the grid is required in two thirds of all annual hours. This is presented in Figure 3b by means of the annual duration curve of the residual power. Only small deviations occur caused by different weather conditions in each of the three years.
Figure 3. (a) Annual distribution of residual load; (b) Annual duration curve of residual power.
Energies 08 08887 g003
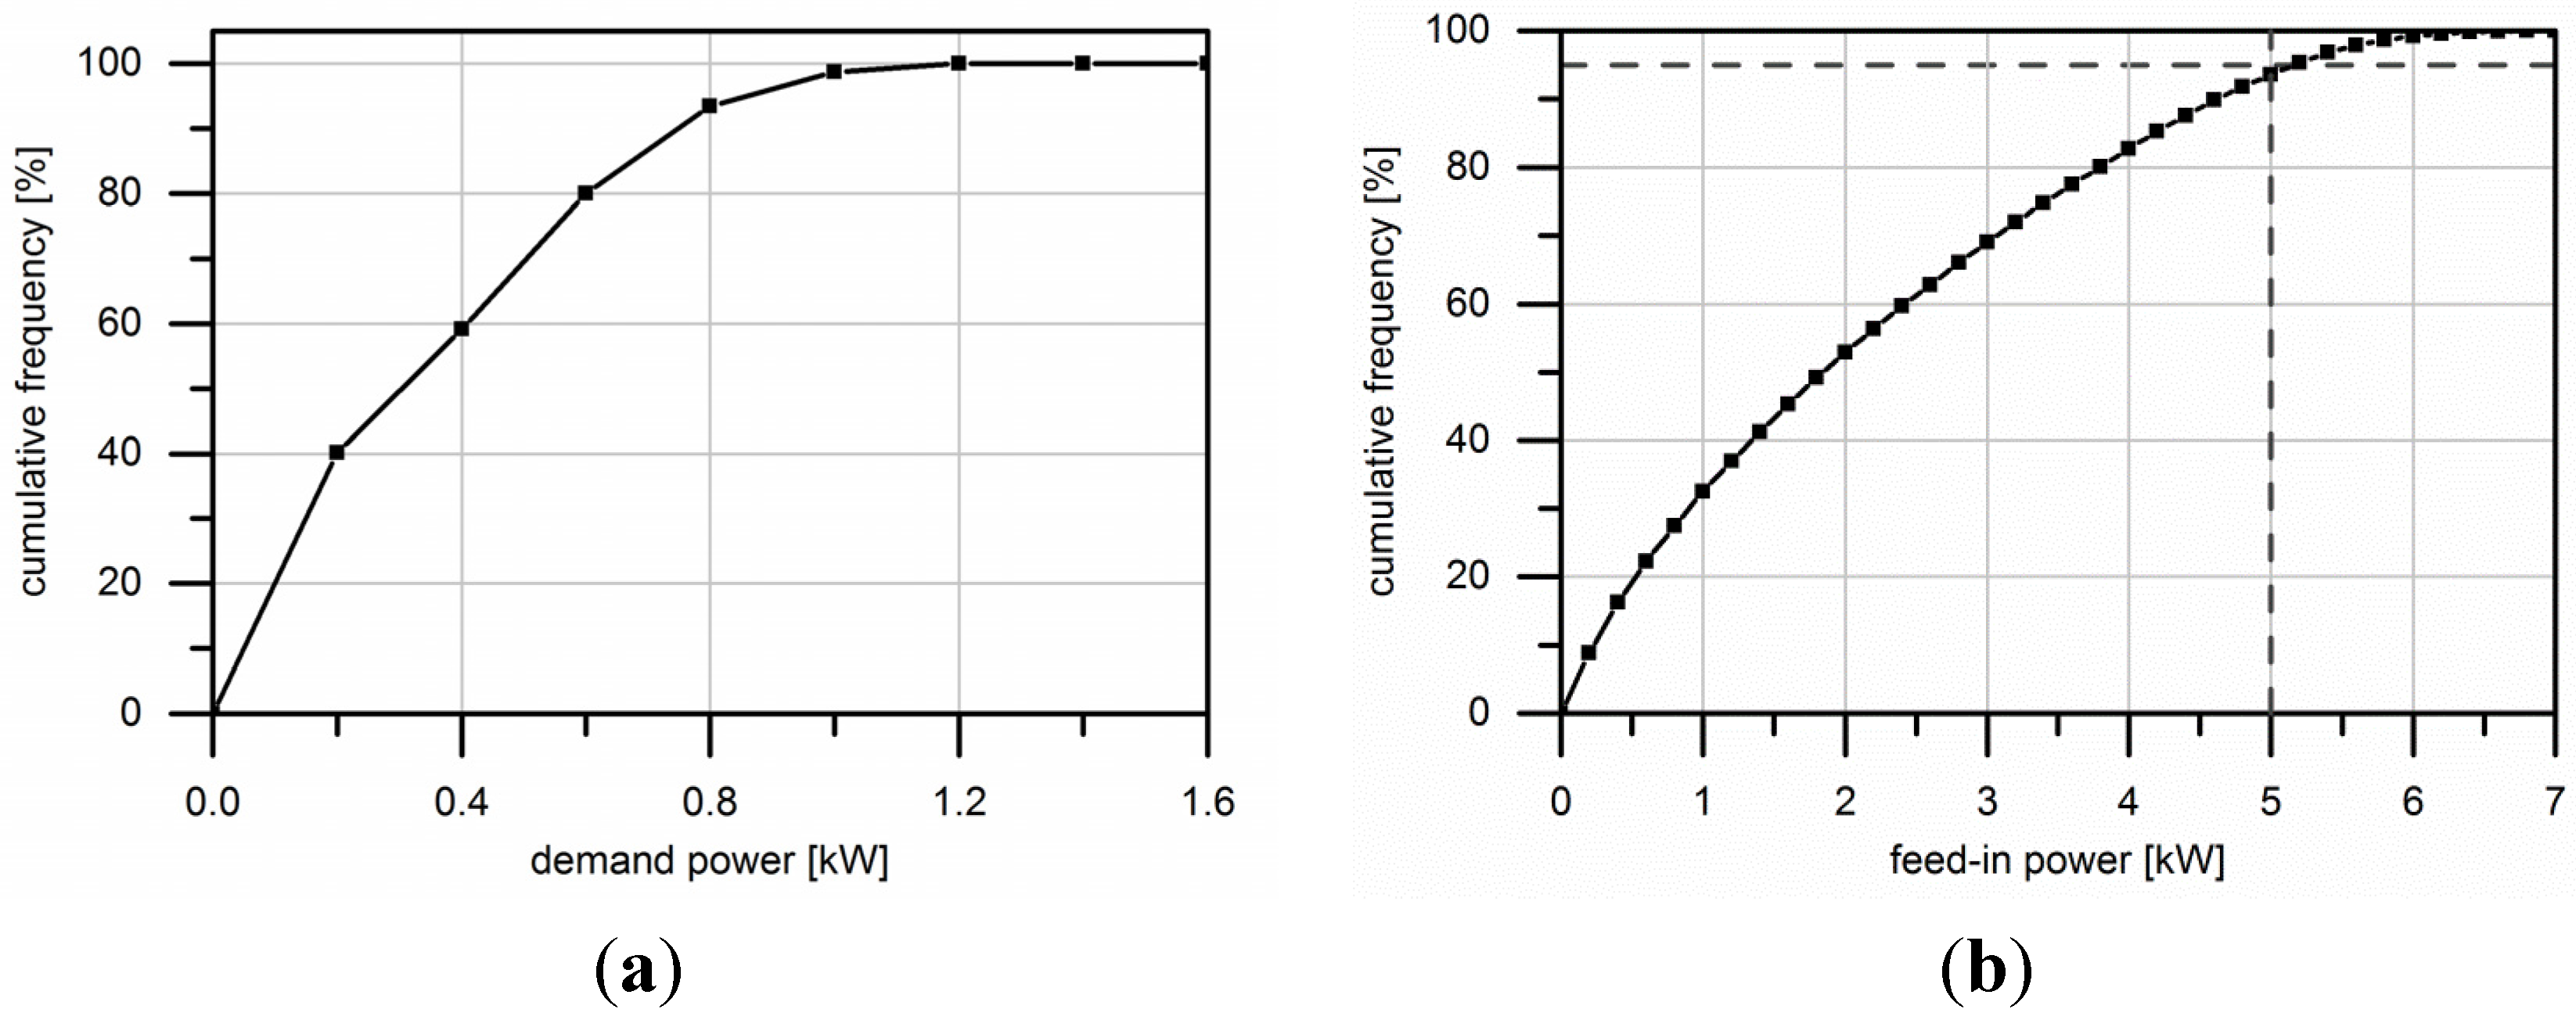
The rate and the frequency of feed-in and demand power are key factors for grid integration of consumers with PV generation systems. In Figure 4a the cumulative frequency distribution of demand power is presented. The demand power is in 60% of all cases less than 0.4 kW. Indeed, high power levels in households are present for a short period, but load demands higher than 0.9 kW occur very rarely due to averaging of the standard load profile.
A similar behavior is shown by the feed-in power, which is mainly characterized by PV generation (see Figure 4b). Despite an installed capacity of 8.6 kWp, power peaks are almost always lower than 6 kW. About 30% of all load demands have a power smaller than 1 kW. The rest is nearly evenly distributed to the power range between 1 and 5.5 kW.
Figure 4. (a) Cumulative frequency distribution of demand power; (b) Cumulative frequency distribution of feed-in power.
Energies 08 08887 g004

2.3. PV Storage System

Next to direct consumption and feed-in to the grid, a storage system can be implemented to store excess energy. In the simulation, the storage system is described as a simplified black box, characterized by a usable storage capacity Euse as well as by maximum filling Pin,max and withdrawal Pout,max rates (Figure 1).
Losses associated with filling and withdrawal or with conversion of energy forms are regarded in appropriate efficiency factors. Considering a hydrogen-based storage system, a filling efficiency ƞst,in of 60% is conservatively assumed (literature gives values up to 70% for water electrolysis [53]). A fuel cell reconverts hydrogen into electricity with an efficiency ƞst,out of 50% [53,54]. No further losses like ageing or self-discharge are taken into account. Neglecting the influence of power level and temperature, storage efficiencies are regarded as constant. An unlimited dynamic behavior according to response time and to changes in performance is assumed due to the lack of knowledge concerning dynamic properties of hydrogen-based storage systems. The influence of this assumption is investigated in Chapter 3.2.
The storage power Pst results from trying to compensate the residual load. Ideally, no power is fed into the grid or taken from it (Pgrid = 0).
P s t  +  P r e s  +  P grid
The permitted storage power levels for filling and withdrawal are the restrictive factors for this:
filling ( P s t    0):  P s t    P in,max
withdrawal ( P st  < 0):  | P st | P out,max
The maximum power of electrolysis (=filling) is set to 5 kW. Thereby, the possibility of using 93% of excess energy is enabled according to residual load’s characteristic in Figure 4b. Beyond a fuel cell (=withdrawal) with 1.5 kW is determined so that the power output is no limitation at any time step (Figure 4a).
At time steps in which the PV generation is higher than the load demand, the excess energy is stored and the storage level increases until it reaches the maximum storage capacity. If the power is higher than permitted or the storage system is full, any additional surpluses will be fed into the grid:
Δ E st,i = P st · Δt · η st,in  with  E st,i Δ E st,i E use
A positive residual load results for situations in which the load demand exceeds the generated PV power. Hence, energy is extracted from the storage, thereby decreasing the storage level. If the storage is empty, the grid will provide remaining demand:
Δ E st,i  P st · Δ t Δ st,out  with  E st,i 1  +  Δ E st,i    0
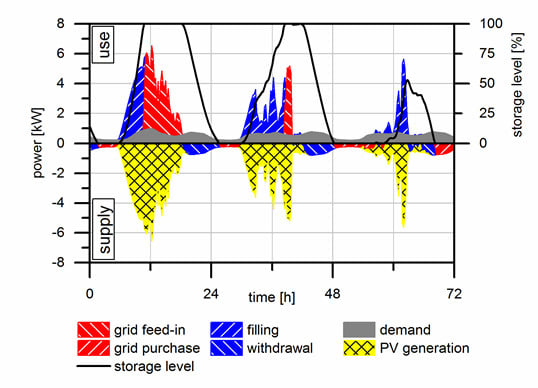
Figure 5 shows the distribution of supplied and used energy for three days in April 2011. On the first day, a high solar irradiation fills the storage system until it is fully charged by midday. In the afternoon, the generation is still higher than the load demand. Therefore, the excess energy is fed into the grid and no power needs to be provided by the storage system. In the evening, the load demand is met by the storage withdrawal. Consequently, the storage level decreases past midnight. On the second day, the storage system acts in a similar manner. However, the large fluctuations in PV generation and storage power level caused by passing clouds are noticeable. On the third day, solar irradiation is low so that the storage system is filled incompletely. Correspondingly, the storage system is emptied until the evening. Furthermore, frequent and fast transitions between filling and withdrawal occur in this case, as the low PV power level is of a similar size as the demand. Accordingly, Figure 5 demonstrates that in spite of an assumed unlimited dynamic behavior on small time scales, such a storage system has to meet highly dynamic requirements regarding the load gradients and the response characteristic.
Figure 5. Storage behavior of a PV storage system on three days in April 2011 (PV 8.6 kWp, storage 8 kWh, demand 4752 kWh/a).
Energies 08 08887 g005
For grid integration, a special problem occurs when the maximum storage level is achieved. If the storage system is completely filled, all residual excess power will be fed into the grid at once and high peaks occur. Weniger et al. [55] or Zeh and Witzmann [13] analyze some approaches consisting of different operation strategies in order to prevent the storage from being fully charged by noon on days with high solar irradiation; however, this is not the focus of this paper.

2.4. Assessment Criteria

The degree of self-sufficiency Φ is the ratio between generated PV energy either used directly Edir or taken from the storage Eout and the whole energy demand of the household Eload. It describes the part of energy purchased from the grid Egrid that is substituted by on-site generated energy:
Φ  =  E dir  +  E out E load  =  E load   E grid E load
Direct use of generated PV energy is assessed by the proportion of consumption Ω. It is defined by the ratio of energy which is used both directly Edir and for filling the storage Ein and the energy generated by the PV system EPV. Another possibility of calculating Ω takes into account the energy which is fed into the grid Efeed-in:
Ω =  E dir  +  E in E PV  =  E PV E feed-in E PV
An important criterion for storage evaluation is the number of full storage cycles nfc. It can be determined by the ratio of energy taken from the storage and the usable storage capacity.
n fc  =  E out E use

3. Results and Discussion

The simulation results are presented in this section. First, a direct consumption system is discussed. Subsequently, the effects of integrating a storage system and enlarging storage capacity are explained. Variable sensitivity analyses reveal the impact of storage efficiencies and the influence on reaching a high degree of self-sufficiency.

3.1. Direct Consumption System

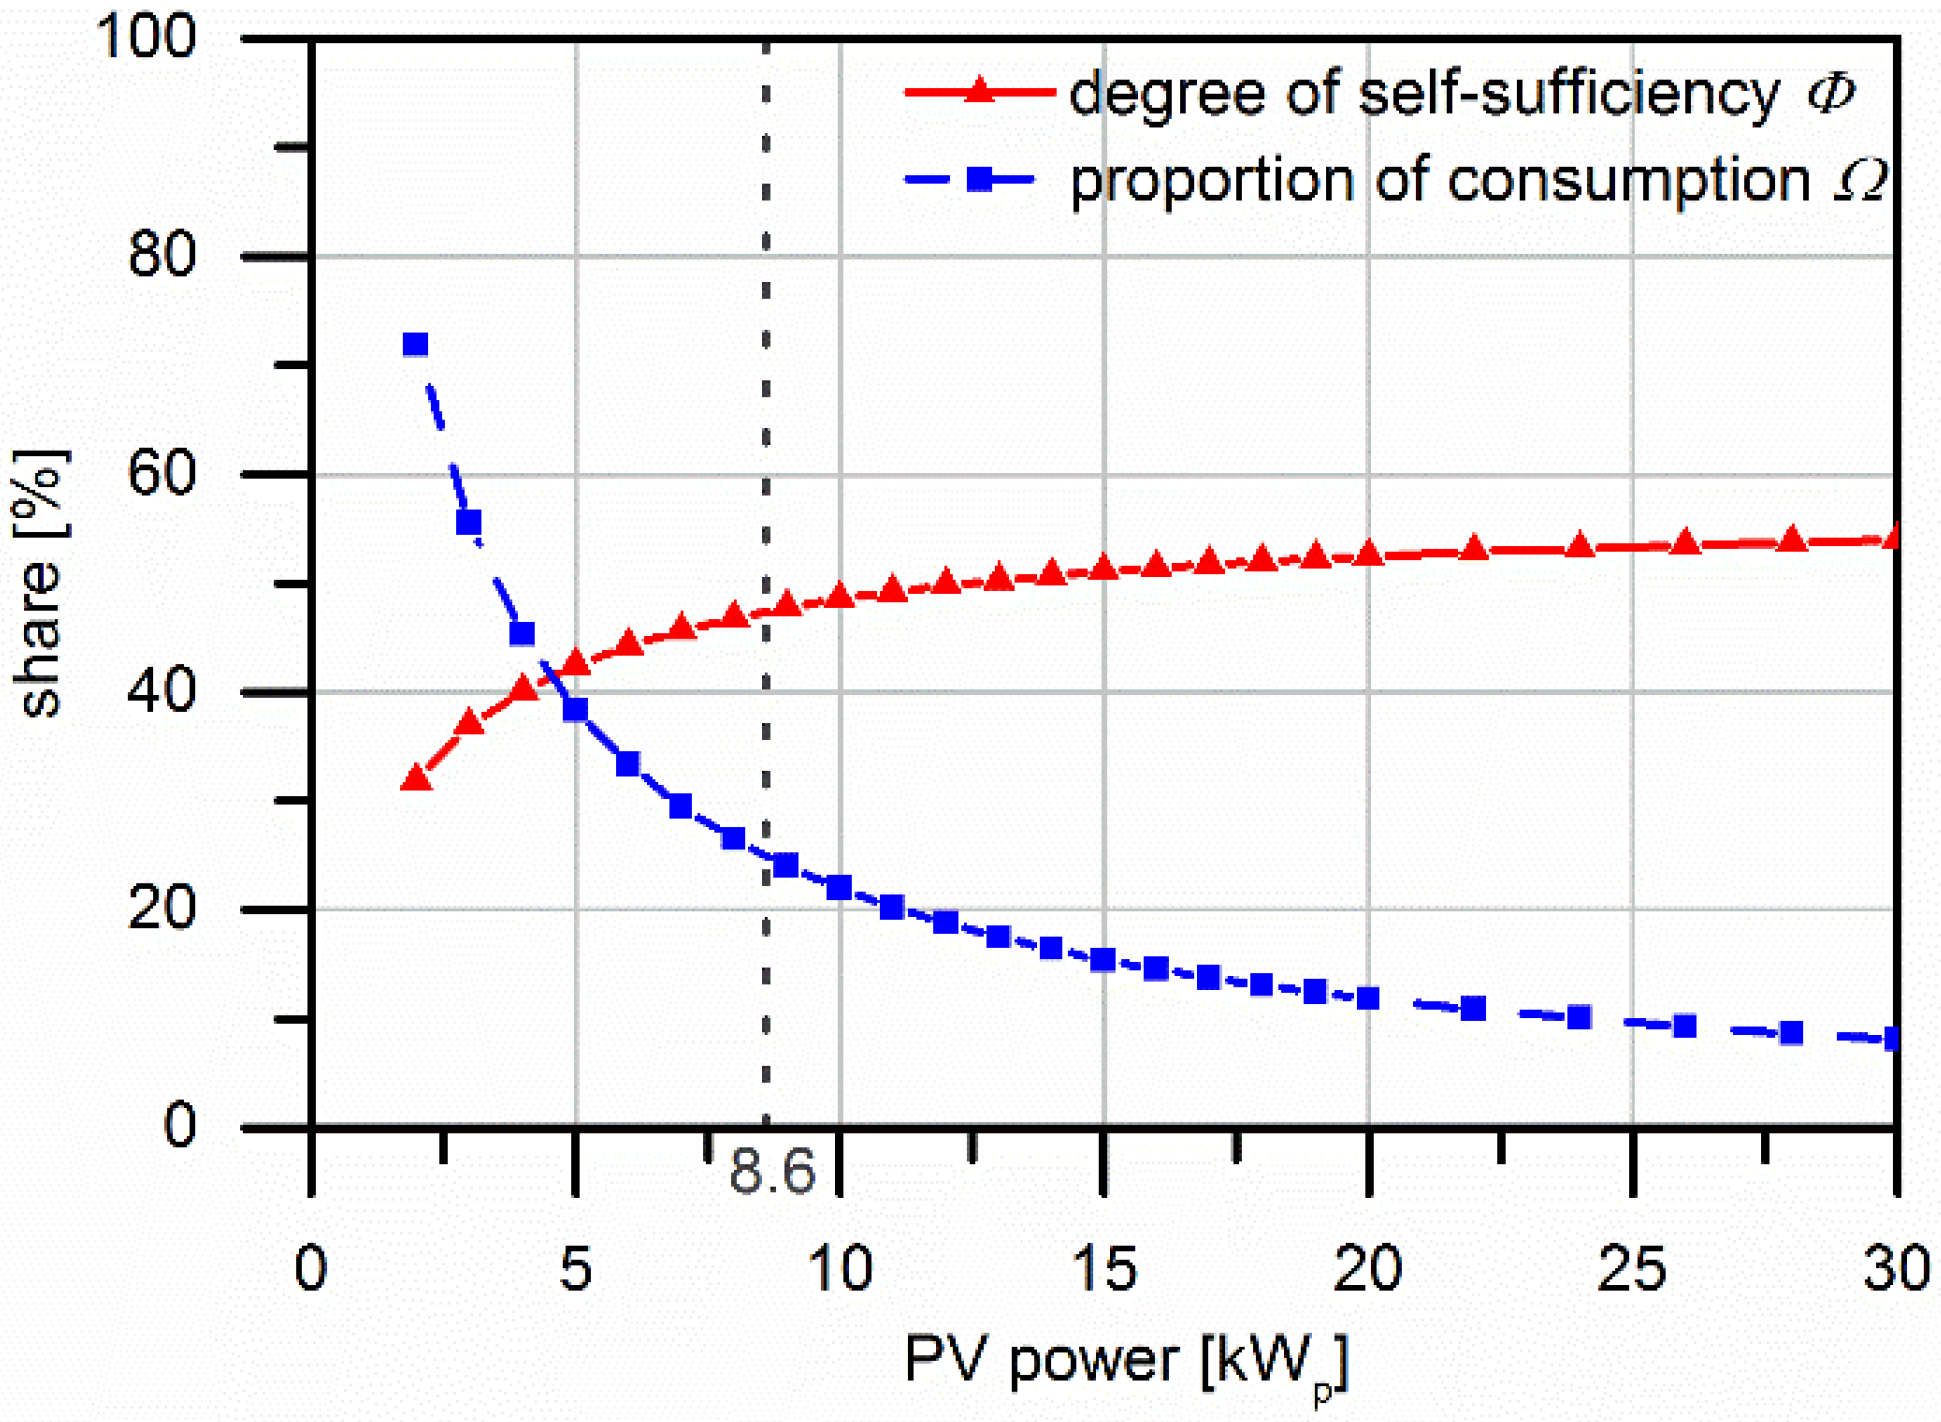
A model building with a PV generation system but without a storage possibility allows for a direct consumption of 6.77 MWh in the whole period under consideration. This corresponds to a proportion of consumption Ω of 24.8% and a degree of self-sufficiency Φ of 47.5%.
In Figure 6, the effects of a change on installed PV power are presented. A bigger PV generation system supplies a higher power at times of low solar irradiation and allows for more direct consumption. Consequently, a higher rate of self-sufficiency is achievable. This effect becomes less important with increasing PV power. However, at times of stronger irradiation, the excess energy becomes considerably greater because a simultaneous use of surpluses is impossible according to the predetermined load demand. Therefore, direct consumption decreases and the degree of self-sufficiency tends to saturate. The maximum degree of self-sufficiency Φ achievable with a PV generation system of 30 kWp is about 54%, along with a proportion of consumption Ω of 8.1%. Further simulations are based on the described PV system with 8.6 kWp.
Figure 6. Degree of self-sufficiency and proportion of consumption dependent on PV system power.
Energies 08 08887 g006

3.2. Short-Time Storage

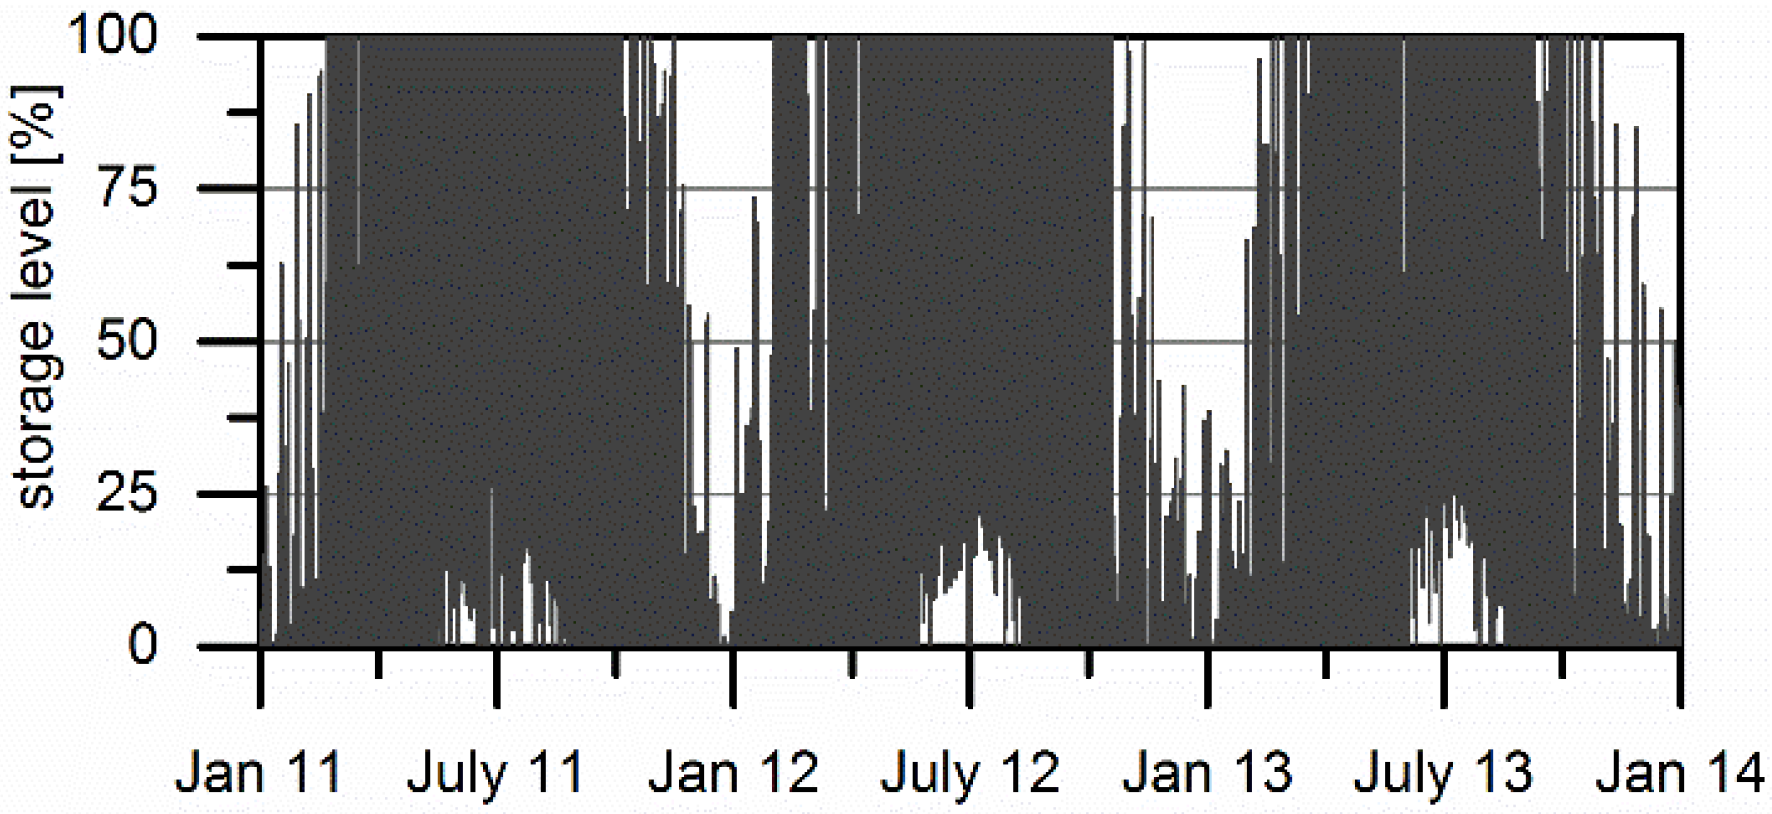
While in a PV direct consumption system the proportion of consumption and the degree of self-sufficiency develop in opposite directions (Figure 6), both values can be increased by integrating a storage system. The considered storage system (with a usable capacity of 8 kWh) exhibits a typical day-night cycle. The storage level over the entire 3-year period is displayed in Figure 7. 1626 changes (averagely 540 per year) between filling and withdrawal and vice versa are observed, corresponding to 118 full storage cycles per year.
Figure 7. Storage level over the 3-year period (usable storage capacity 8 kWh).
Energies 08 08887 g007
Even this storage system with a capacity of only 8 kWh is insufficiently used to a certain extent. During the winter months, the system is only partially filled due to the low solar irradiation. In the summer, the storage level is only rarely below 20%. If the storage is dimensioned too large for the load demand, the storage system will only be available with reduced capacity due to non-complete unloading at night. However, a higher storage capacity enables to bridge a longer period without or with only low solar irradiation than a night.
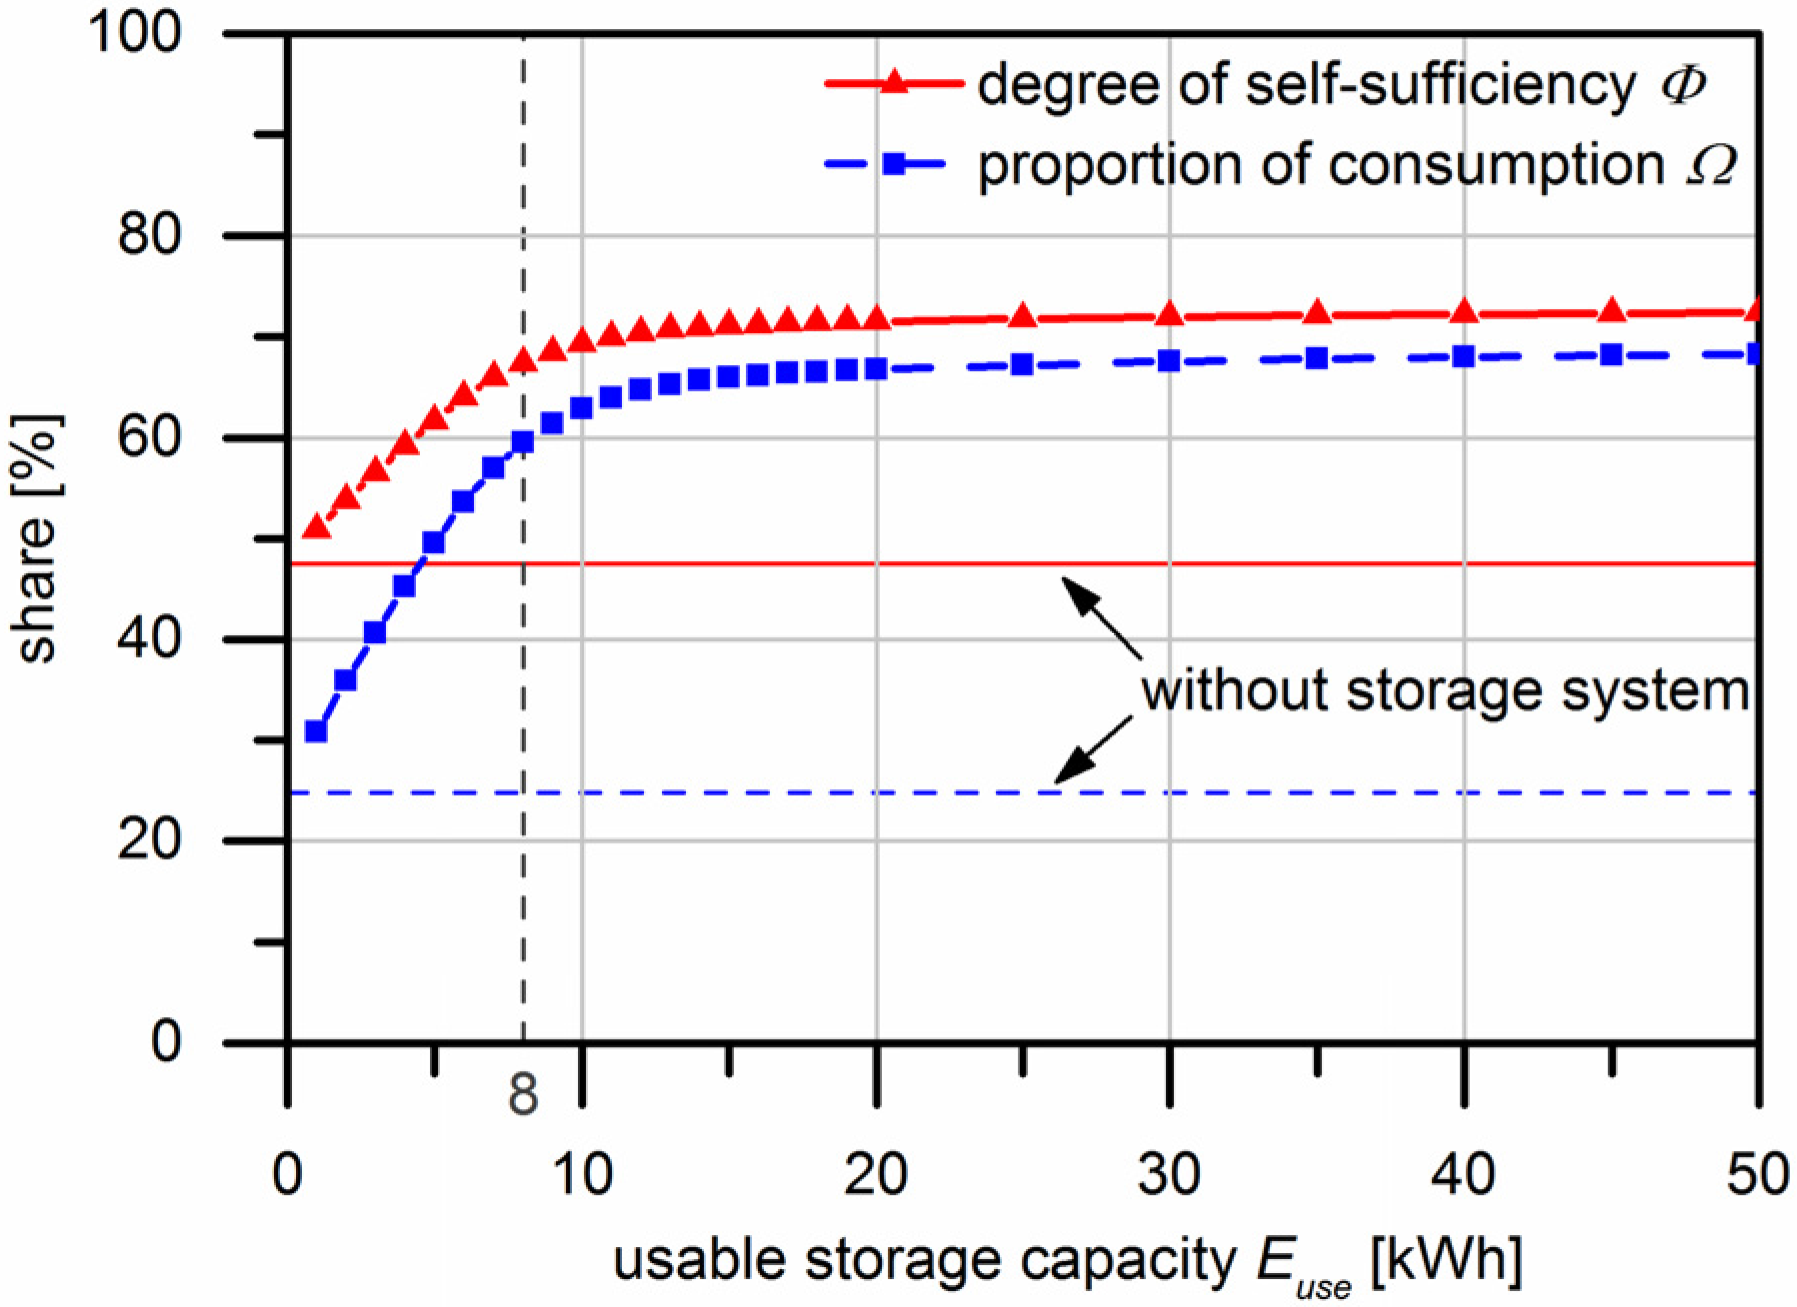
Increasing the usable storage capacity over a certain level has still only a small impact on the degree of self-sufficiency as shown in Figure 8. In contrast to a PV direct consumption system without storage, an enlargement of storage capacity leads to an increase in both degree of self-sufficiency and proportion of consumption. A storage capacity of 8 kWh already enables a rise of 42% concerning the degree of self-sufficiency Φ (absolute 67.4%) and 140% regarding the proportion of consumption Ω (absolute 59.5%) compared to a PV consumption system (horizontal lines). Accepting a (usable) storage capacity of 50 kWh as an upper limit of a short-time storage system, a capacity of 8 kWh already achieves 93% and 87%, respectively, of the maximum attainable level. This corresponds to a target achievement of 80% in each case which can be obtained by installing a storage system.
Figure 8. Degree of self-sufficiency and proportion of consumption in dependence of usable storage capacity.
Energies 08 08887 g008
As stated in Chapter 2.3., the results are based on infinitely fast dynamic responses of electrolysis and fuel cell. However, the impact of this assumption is likely to be very marginal as a time step of 15 min is used. Even a modified simulation model, in which a response delay of the filling and the withdrawal by one discretization step is taken into account, results only in a reduction of the degree of self-sufficiency by less than 0.3 and of the proportion of consumption by less than 0.5 percentage points.
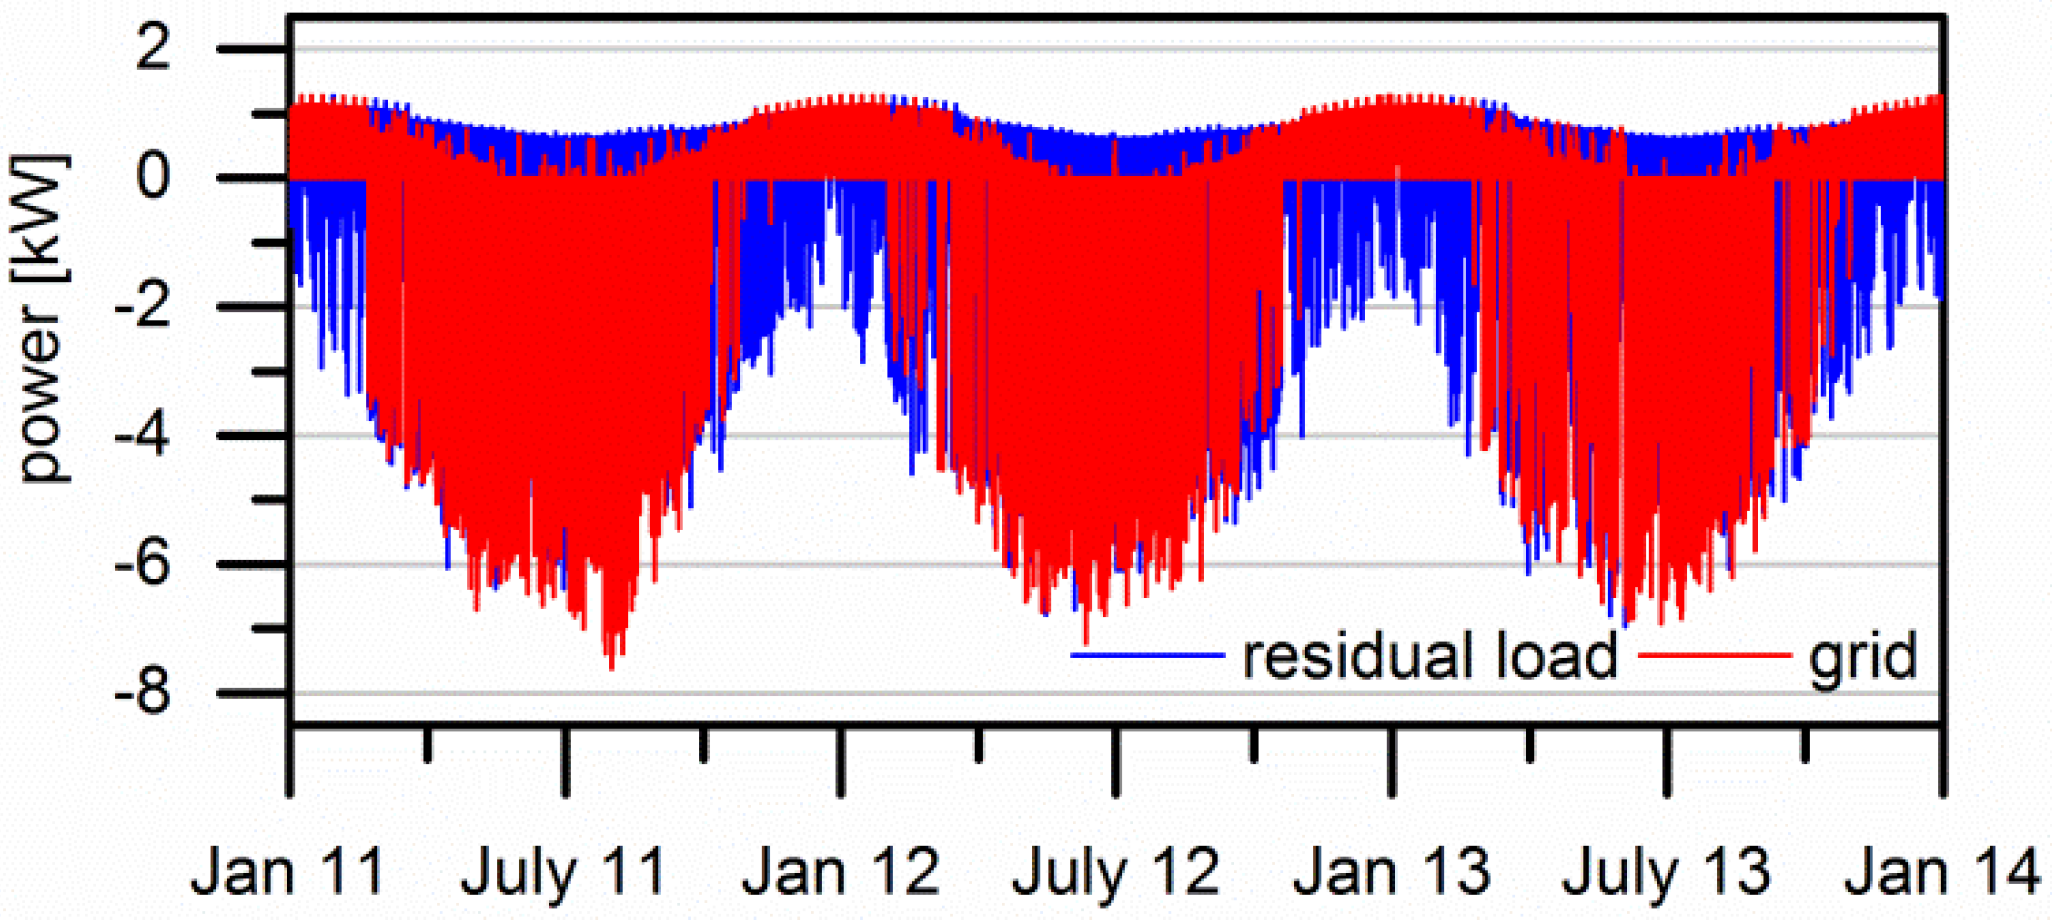
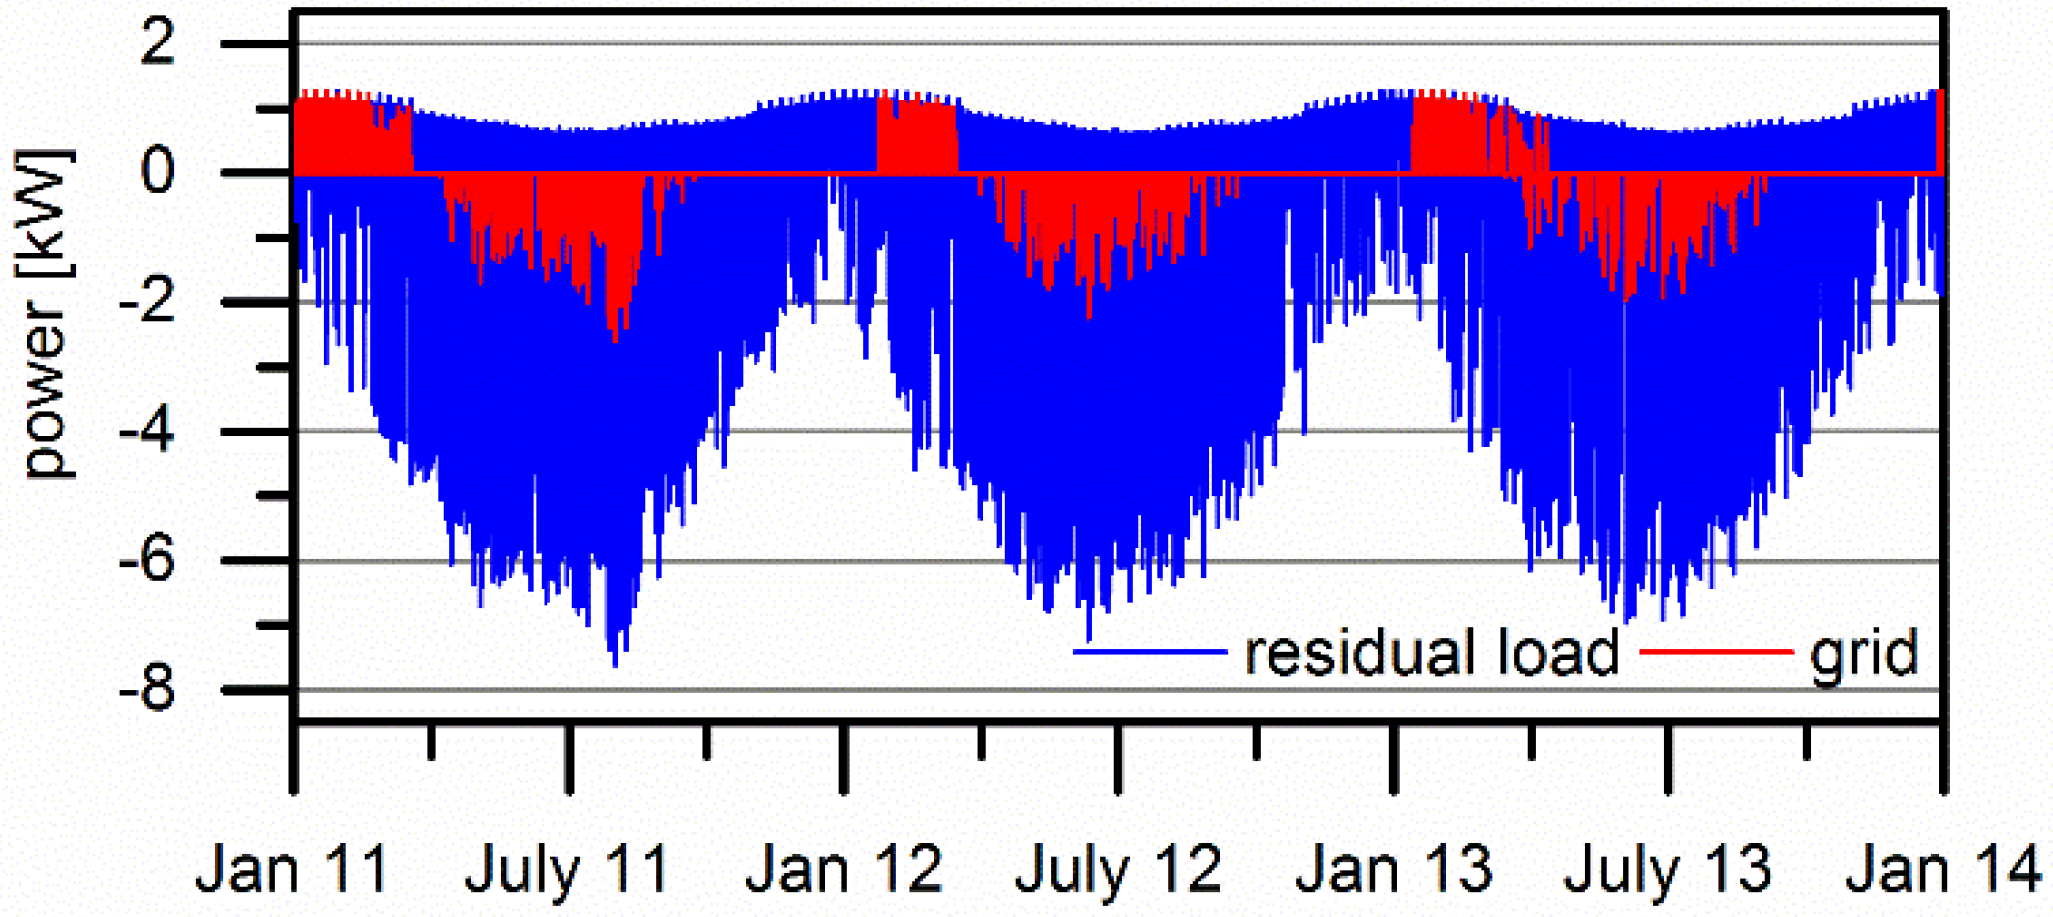
In Figure 9 the influence on the grid is shown by means of residual load and grid exchange. The storage system only has a noticeable impact on power at night in summer (fewer grid purchases) as well as during the day in winter (no feed-in at times of PV generation).
Figure 9. Power of residual load and grid exchange over the entire period under consideration.
Energies 08 08887 g009
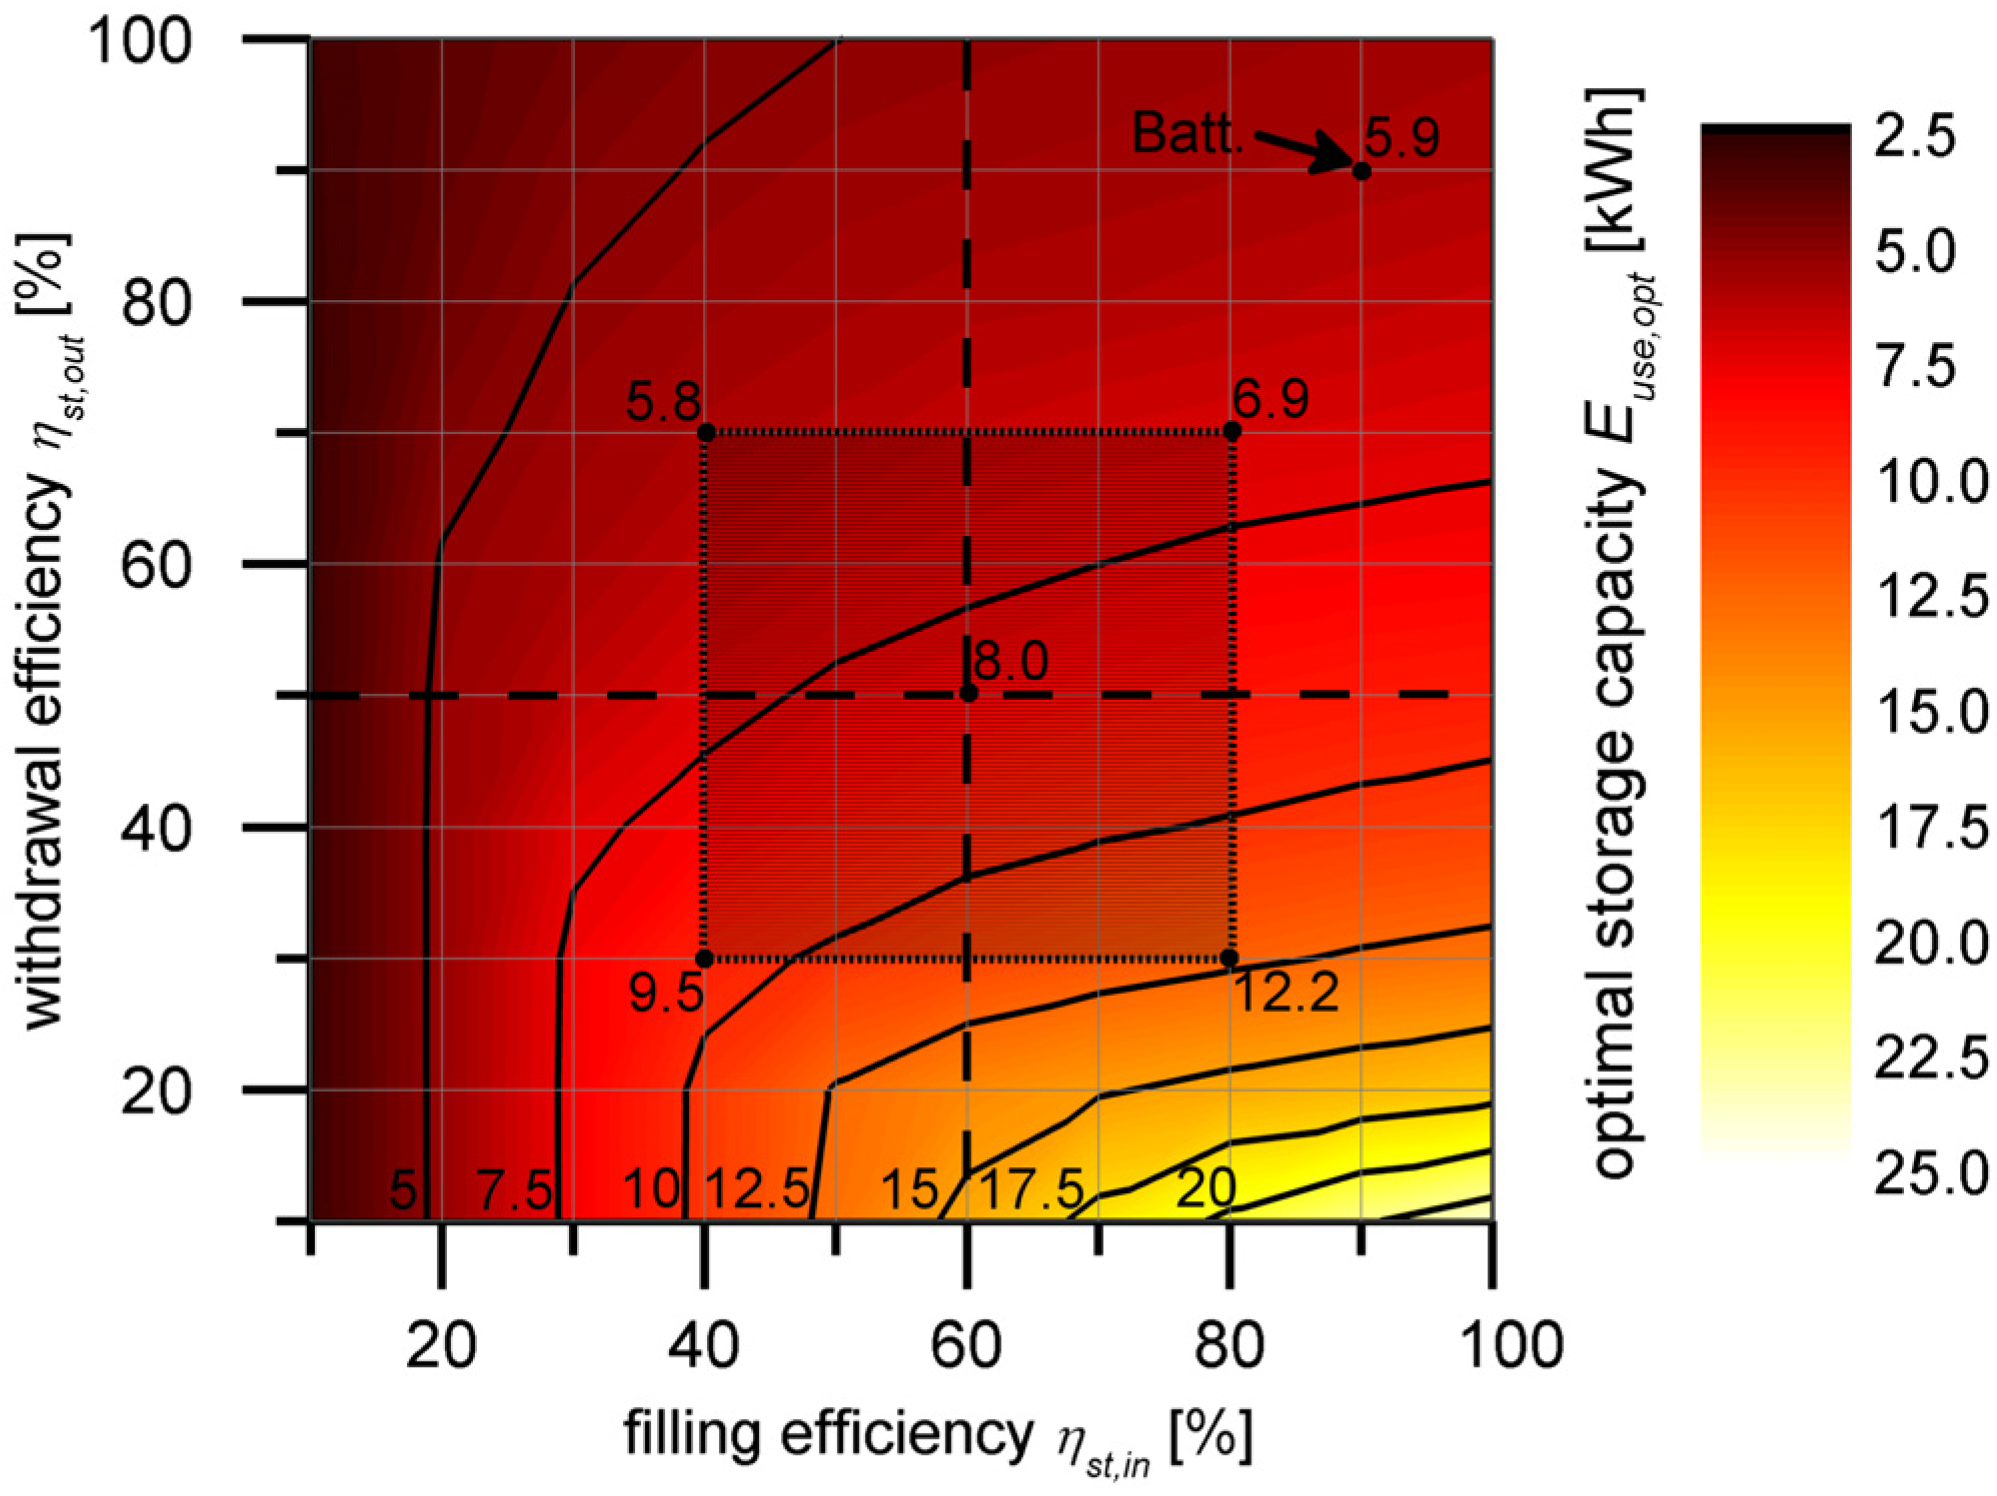
The analysis presented so far has been based on efficiency specifications of 60% for filling the storage system and 50% for returning stored energy. Efficiencies are assumed to be constant, independent of power level and other factors. The simulations also neglect the amount of energy which is required for preparation steps and on-site power supply. Therefore, a sensitivity analysis concerning storage efficiencies is conducted. Their impact on optimal storage capacity Euse,opt is shown in Figure 10. A storage capacity of 50 kWh is determined as a maximum storage size. As described above, a target achievement of 80% obtained by installing a storage system compared to a PV consumption system is selected as a decisive criterion (Equation (11)).
Φ ( E use,opt )   Φ (0 kWh) Φ (50 kWh) Φ (0 kWh)  = 0.8
Figure 10. Optimal storage capacity dependent on storage efficiencies.
Energies 08 08887 g010
Concerning a low filling efficiency, only a little energy gets into the storage so that it is emptied overnight in any case, almost independent of the withdrawal efficiency. This applies in reverse as well for high withdrawal efficiencies. The optimal storage capacity increases only a little for ascending filling efficiencies due to only partial unloading overnight. A high storage capacity can only be used if it is filled sufficiently during the day due to a high filling efficiency and mostly emptied overnight according to a low withdrawal efficiency. Therefore, the withdrawal efficiency has to be at least at a mid-level assuring a low storage size. Thus, the filling efficiency has only a small impact in a wide range.
The marked points in Figure 10 specify the optimal (usable) storage capacities at previously concluded assumptions and for deviations in the order of 20 percentage points. Thereby, changes due to technological progress and the consideration of additional auxiliary energies are taken into account. Attention should be paid to high efficiencies due to maximum thermodynamic efficiencies of electrolyzer and fuel cell of 80% [56].
Furthermore, a battery storage system with efficiencies of 90% each is drawn in as a reference. The comparison indicates a usable storage capacity of 5.9 kWh. However, lead acid batteries have a permitted depth-of-discharge of only 50% ensuring a certain battery lifetime [57]. Therefore, the storage capacity has to be doubled in the case of a battery system.
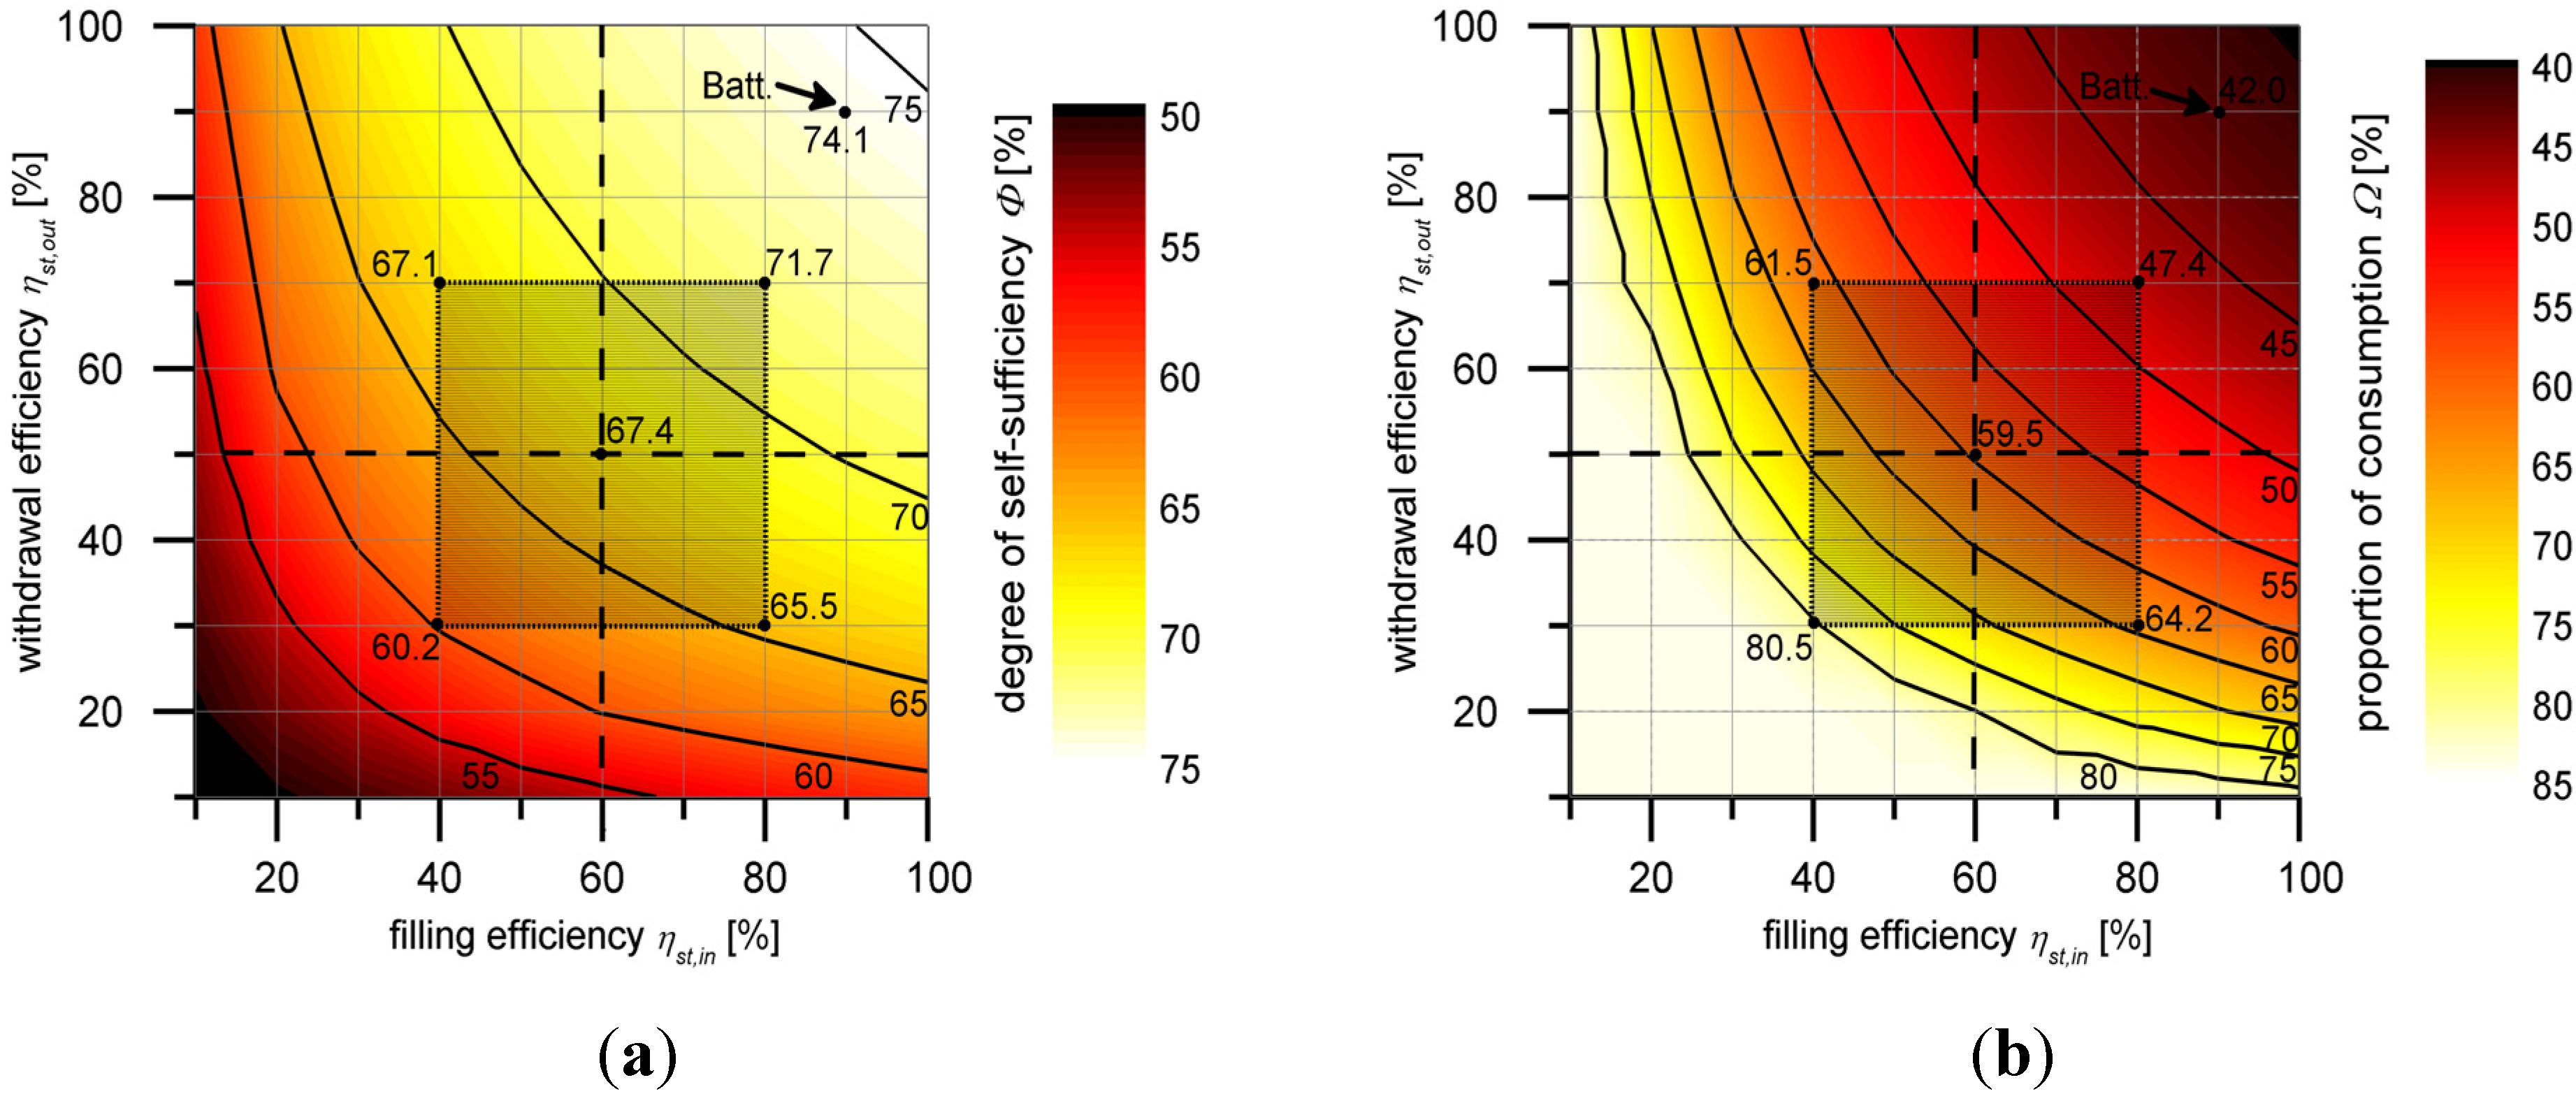
The degree of self-sufficiency Φ attainable by a storage system with optimal capacity is shown in Figure 11a in dependence of storage efficiencies. Supposing one of the two efficiencies is low, the level of the other efficiency has a high impact. A mid-level of each of the two factors already allows for a high degree of self-sufficiency. The degree can only be increased marginally by high efficiencies, thereby requiring almost the same storage capacity. Starting from the reference case, modifications in the order of up to 20 percentage points of one or both efficiencies influence the degree of self-sufficiency only by less than 5 percentage points. If both efficiencies are decreased by 20 percentage points, the only exception will exist and the degree of self-sufficiency drops by 7.2 percentage points. Higher modifications of storage efficiencies on the basis of technological progress and under the consideration of additional loss factors are assessed to be unlikely.
Figure 11. Evaluation dependent on storage efficiencies. (a) Degree of self-sufficiency; (b) Proportion of consumption.
Energies 08 08887 g011
For a system with optimal storage capacity, the proportion of consumption Ω in dependence of storage efficiencies is presented in Figure 11b. Only low storage efficiencies obtain a high share of direct use due to the installed PV area which is dimensioned as large as possible. Mid- or high-level storage efficiencies induce a significantly reduced proportion of consumption. The possibilities of achieving a high proportion of consumption are either scaling down the PV system or using the PV-generated energy elsewhere. Additionally, regarding the thermal energy demand of the model building, a part of the PV area can be substituted by a solar-thermal system or excess power can be converted into heat by a heating rod or a heat pump [58].

3.3. Seasonal Storage

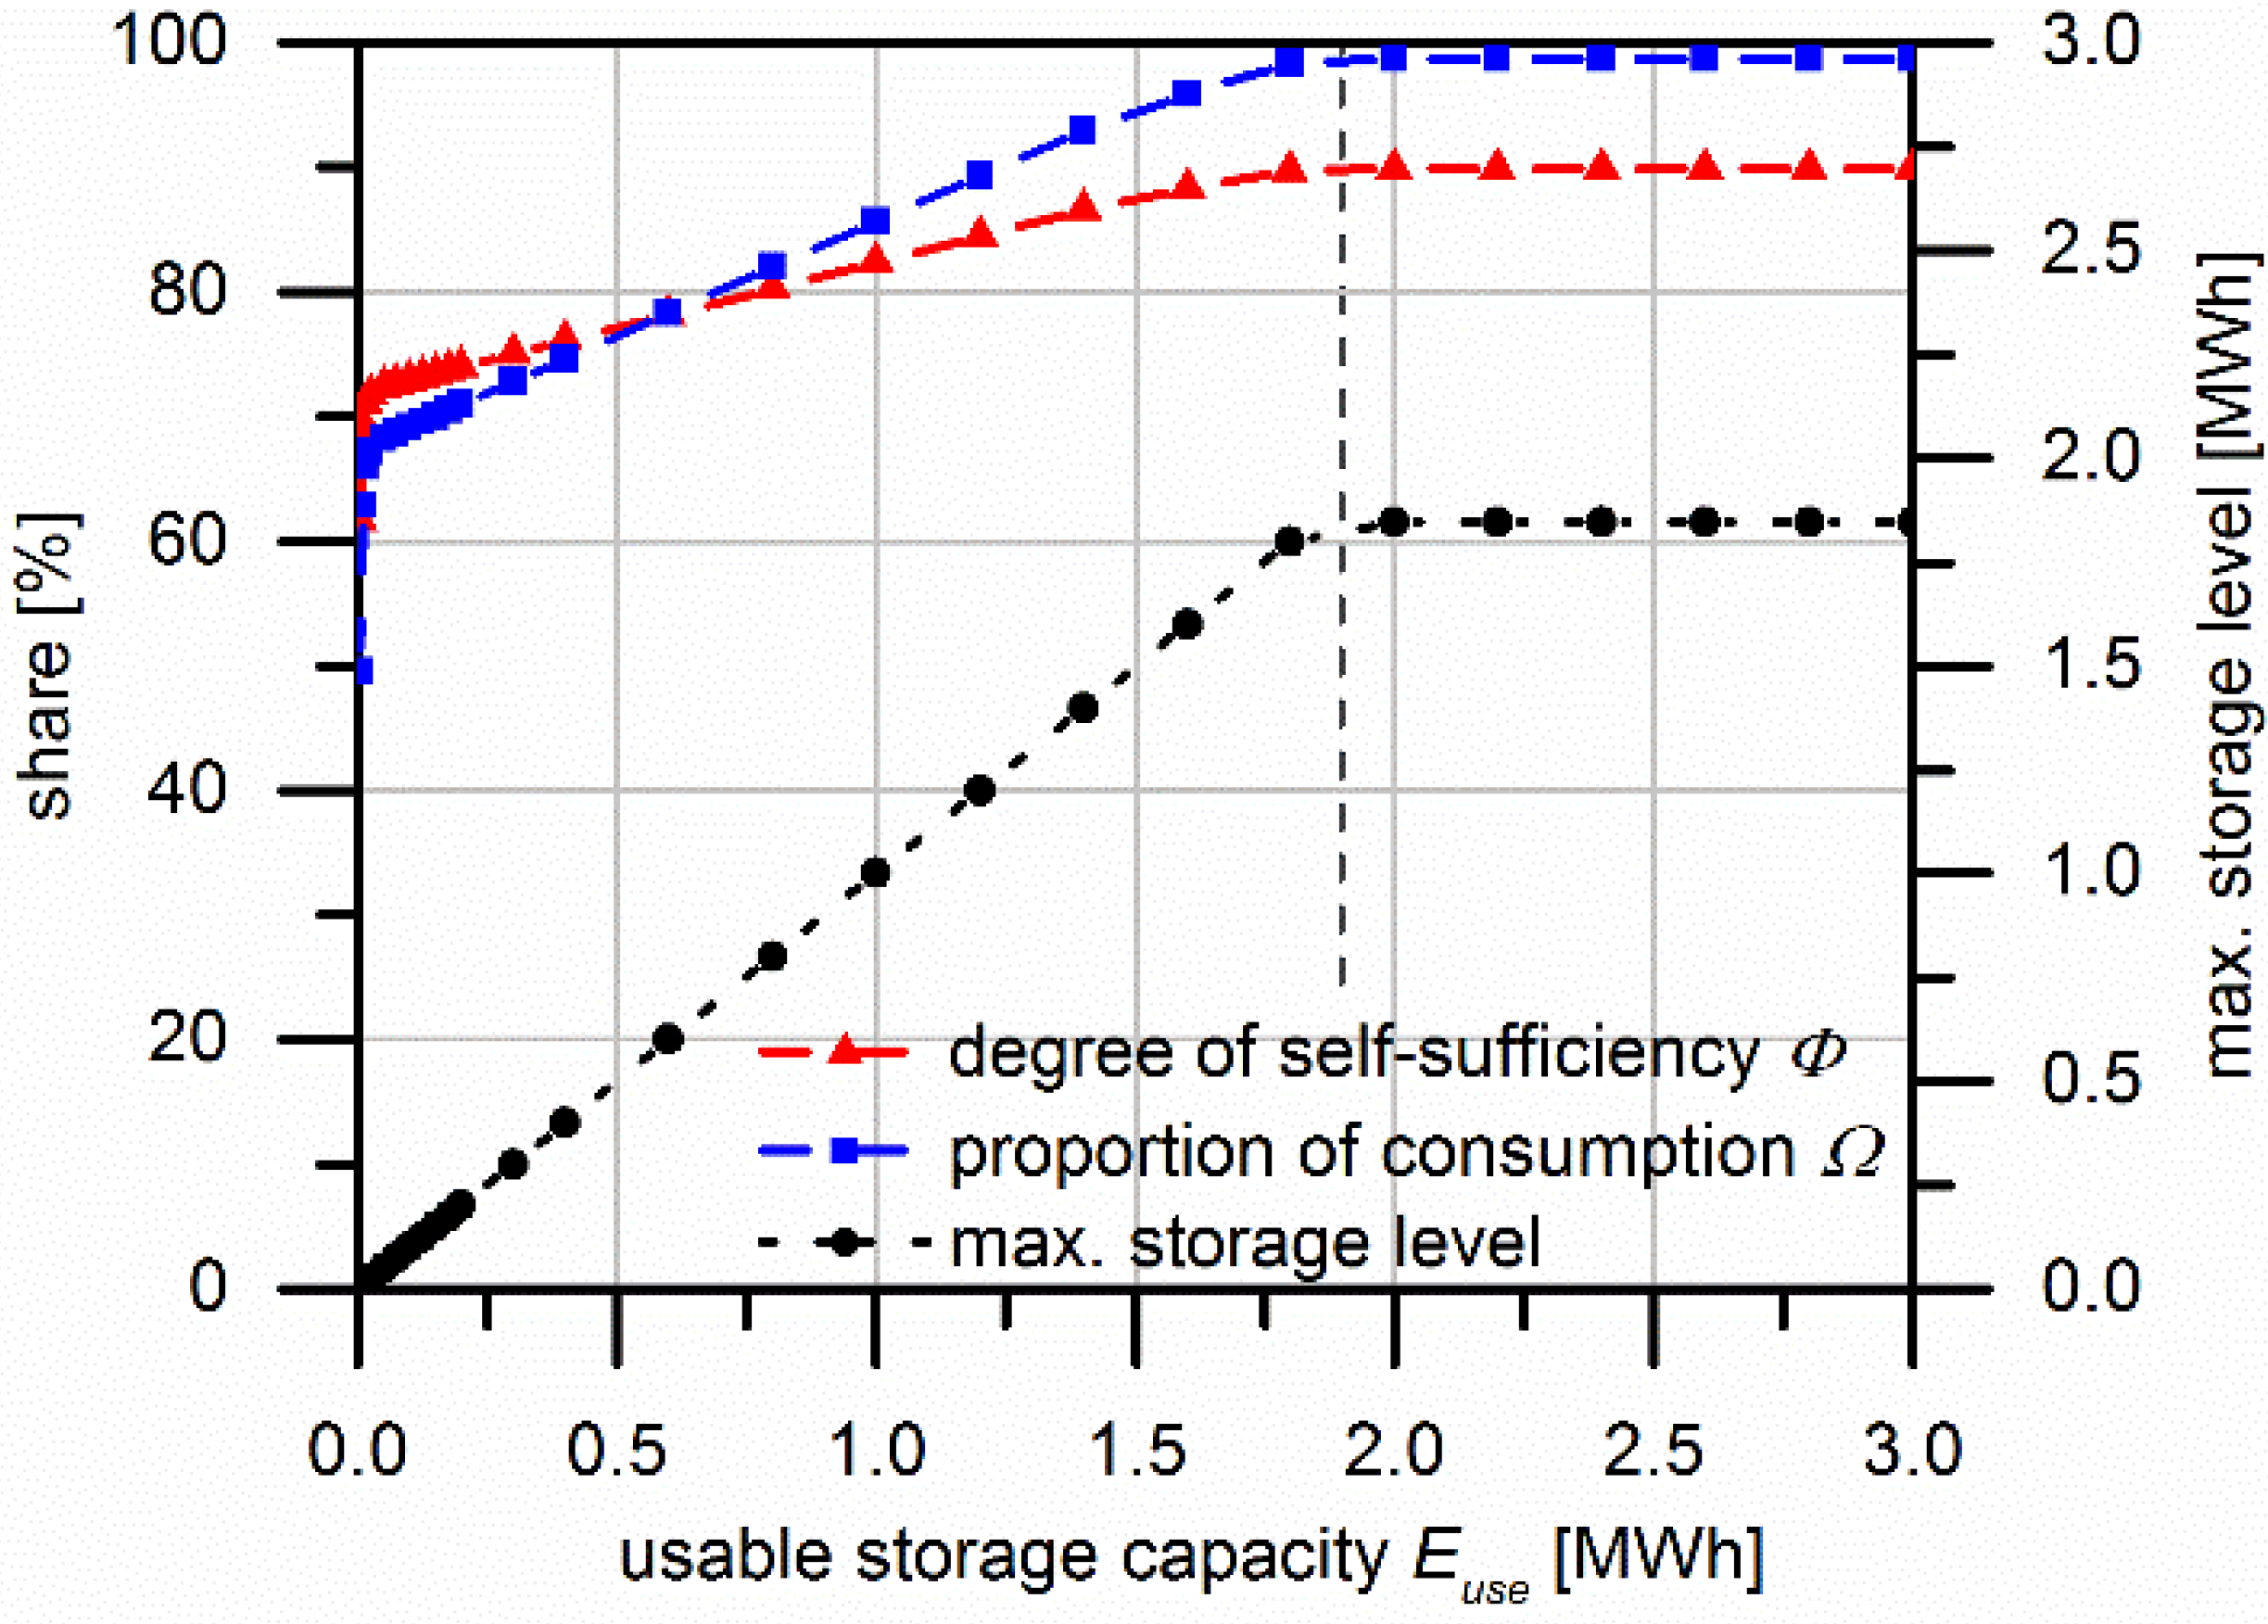
Next to a short-time storage system, which buffers excess solar energy during the day for night use, a seasonal storage system with greatly enlarged storage capacity also offers the opportunity to store energy not only for the short-term, but also for the winter months with lower irradiation conditions. It therefore has the same day-night cycle as the short-time storage system. However, due to the enlarged storage capacity, the daily solar energy surpluses result in a greater increase in storage level than the decrease in the night owing to the load demand. Therefore, the storage level increases over the summer and provides a compensation for the load demand in winter (Figure 3a). For seasonal storage, Figure 12 shows a further increase in the degree of self-sufficiency Φ and a disproportionately high growth of the proportion of consumption Ω. The limitation of filling rates to 5 kW (corresponding to 58% of installed PV generation potential) prevents it from reaching complete self-consumption so that the excess energy is fed into the grid at times of higher generation power. Based on these constraints, almost all the PV-generated energy is either used directly or stored. A higher storage capacity offers no advantage due to the limited PV energy. The result is a saturation of the maximum storage level at 1.9 MWh and, therefore, also of the degree of self-sufficiency and the proportion of consumption.
Figure 12. Degree of self-sufficiency and proportion of consumption dependent on usable storage capacity.
Energies 08 08887 g012
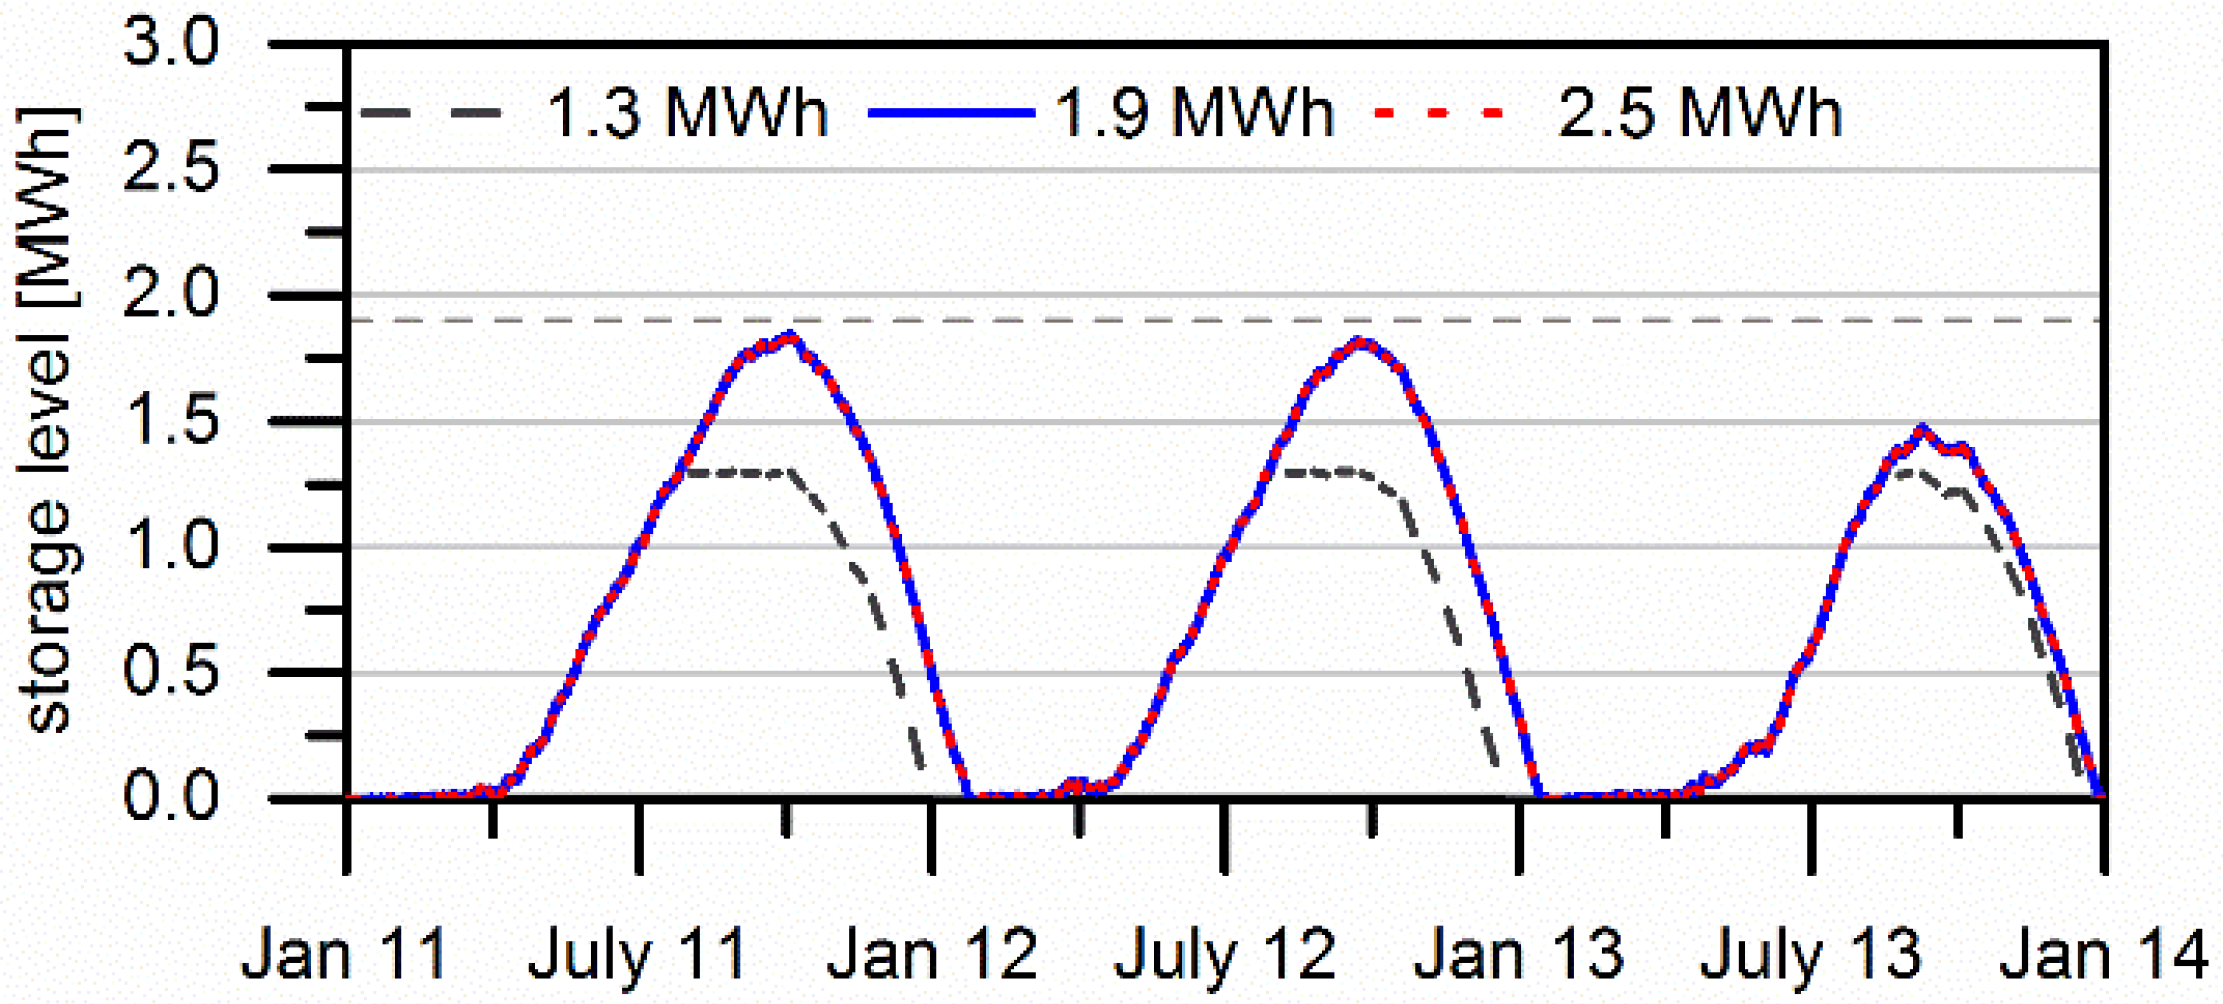
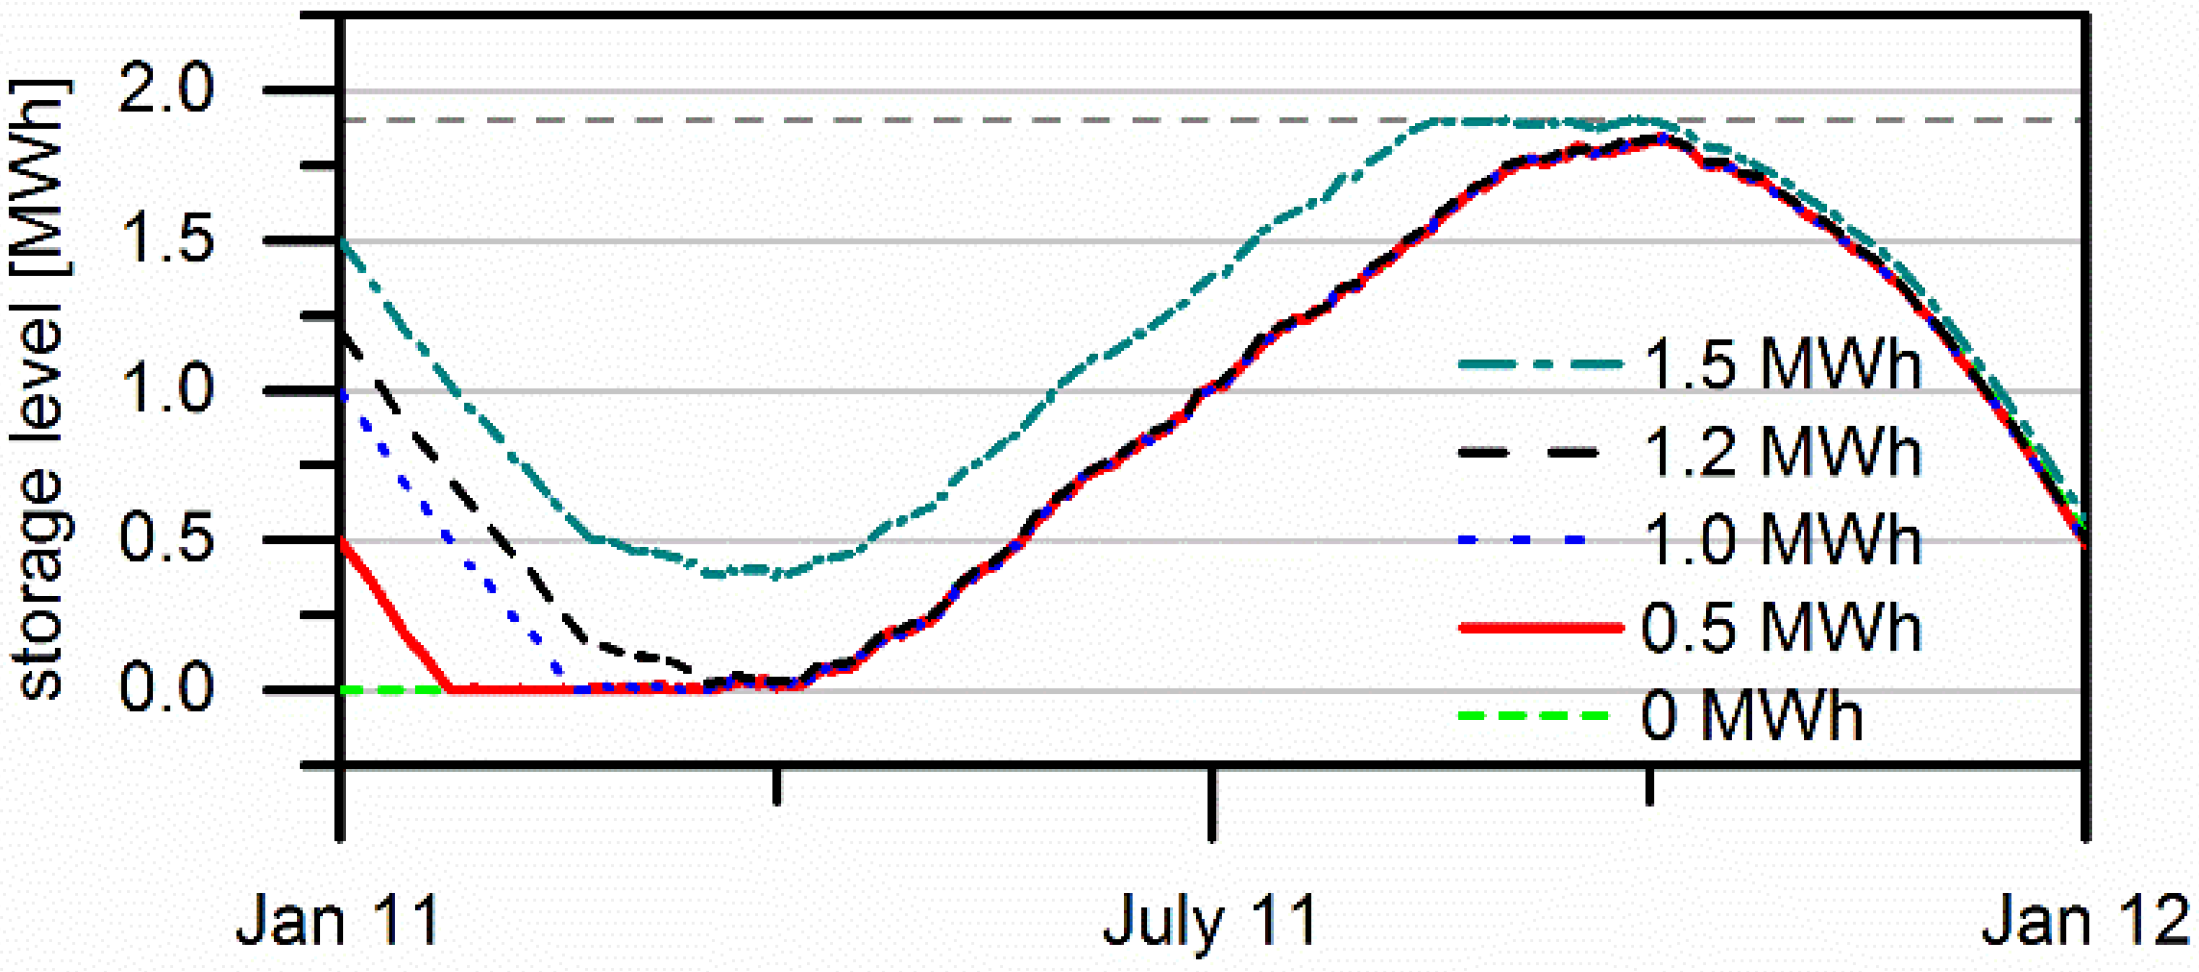
In Figure 13 the storage level over the whole consideration period of 3 years is presented. A degree of self-sufficiency Φ of only almost 90% is gained due to a start of the simulation in winter (year 1) and depleted storage in subsequent winters (year 2 and 3). A higher storage capacity than the saturation capacity does not have a noticeable impact on the system behavior which is visible in the overlapping graphs. This storage system enables a rise of 89% for the degree of self-sufficiency and of factor 3 regarding the proportion of consumption (absolute 98.7%) compared to a PV consumption system.
Figure 13. Storage level over the consideration period of 3 years.
Energies 08 08887 g013
Whereas in a PV direct consumption system without any storage possibility, power is exchanged with the grid in every time step, in combination with a seasonal storage system, grid power occurs only in winter (grid purchase, when the storage is empty) and at times of high solar radiation in summer (feed-in, when power generation is higher than the maximum filling rate) (Figure 14). In comparison with a short-time storage system (Figure 9), a seasonal storing reduces exchange with the grid dramatically. The frequency of feed-in and grid purchase decreases, as does the maximum feed-in power. The maximum feed-in power with a seasonal storage system is only 2.6 kW corresponding to about 30% of installed PV power.
Figure 14. Comparison of residual load and grid exchange power.
Energies 08 08887 g014

3.4. Scenarios to Achieve Self-Sufficiency
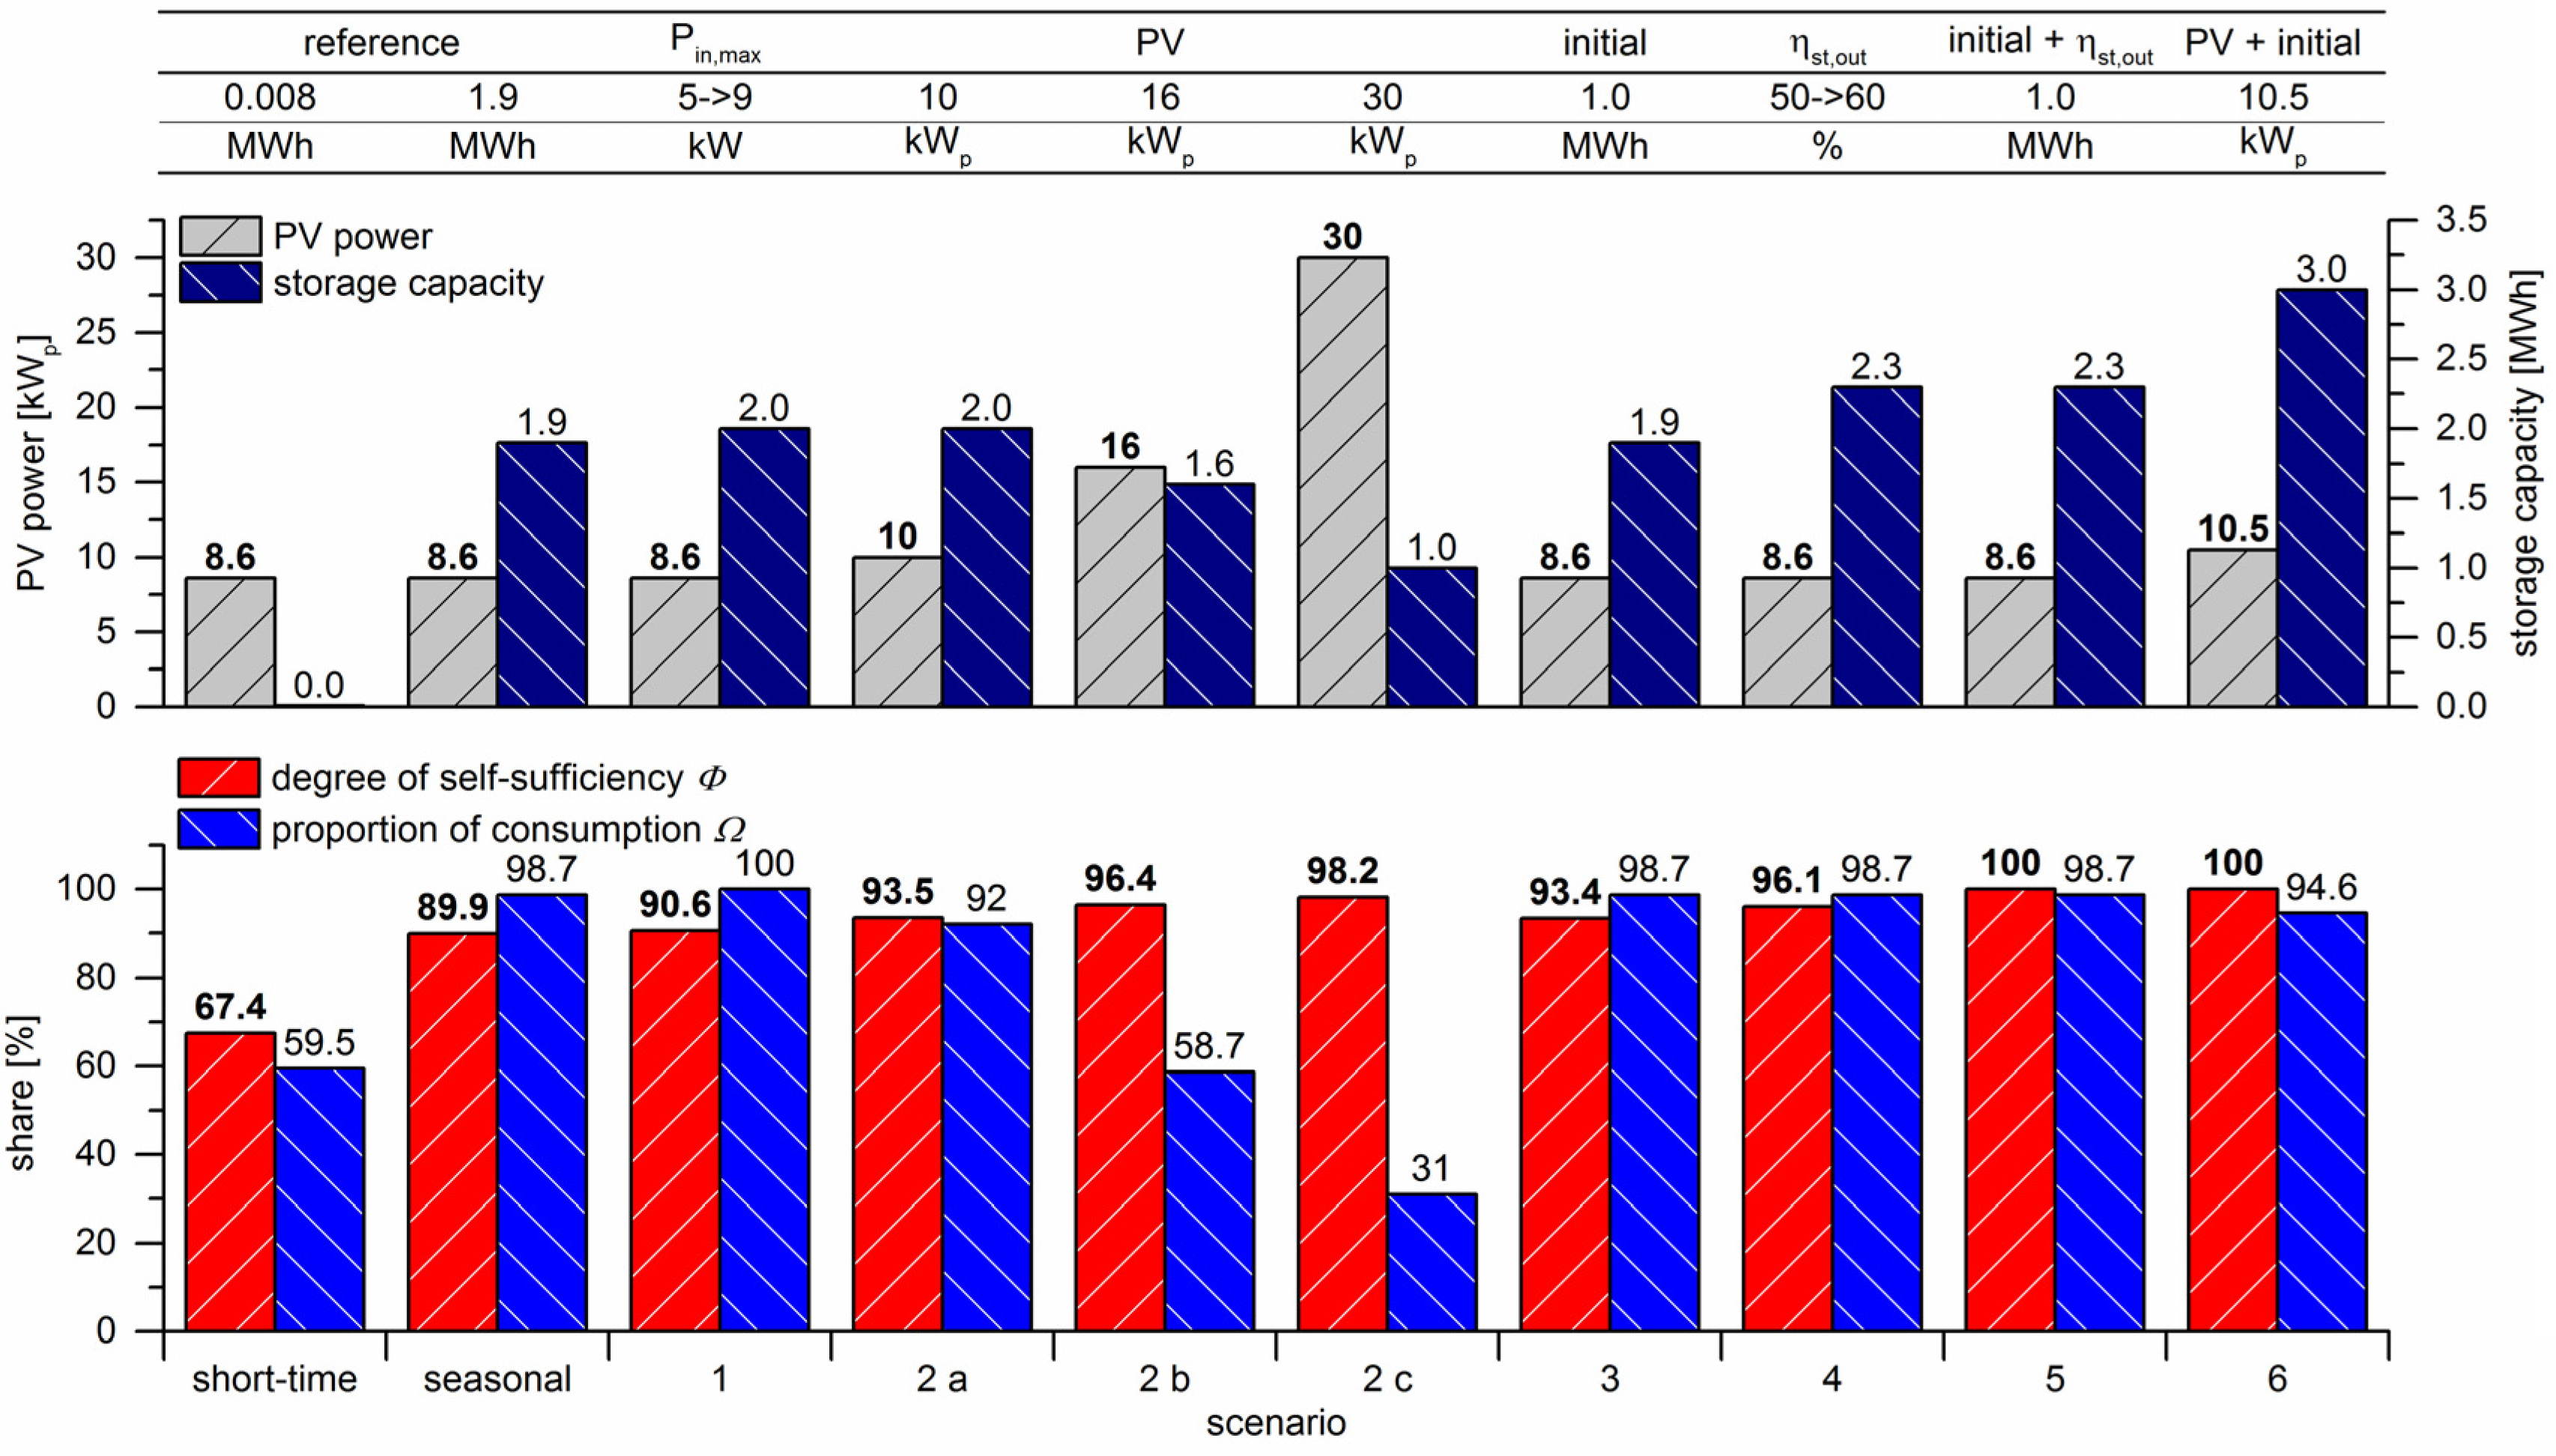
In the following section, different ways of reaching a high degree of self-sufficiency are discussed originating from the seasonal storage reference system (Figure 15):
Scenario 1: As already described, one restricting factor is the limitation of filling power. As no advantage can be taken of high power levels, this factor prevents from achieving a proportion of consumption of 100%. If this constraint is cancelled, all the PV-generated electricity will be used. In contrast, the degree of self-sufficiency increases only by even less than a percentage point. The storage capacity has to grow slightly to store high energy surpluses in summer.
Scenario 2: The PV area is another restriction. According to full covering of the south-directed roof surface, an increase in the installed PV power requires other areas. A more extensive system makes higher power available at already lower levels of solar irradiation which can be used directly. Thereby, losses are reduced, stored energy persists longer and the degree of self-sufficiency increases. Thus, the required storage capacity decreases along with the growing PV area. However, the excess energy rises significantly at times with high irradiation. Due to the limitation of the filling rate to 5 kW, this surplus cannot be used, causing a loss of the proportion of consumption. Even if, in combination with a 16 kWp PV system, the limitation of the filling rate is raised to 9 kW, just a small increase in the degree of self-sufficiency from 96.4% to 97.2% has an effect, thereby requiring a usable storage capacity of 1.8 MWh instead of 1.6 MWh. As it is shown in Figure 15, a very huge PV system (scenario 2 c) also does not achieve full self-sufficiency. This is caused by a minimal storage level at the start of the considered period, corresponding to a commissioning of the storage system in autumn or winter. The power of the PV system is insufficient for direct consumption and simultaneous storage filling until spring. A minimum initial level is implemented in simulation because not each storage system can be transported and installed in the filled state. Furthermore, different initial levels influence simulation results. Thus, devoid of an initial level, the comparison of simulation results of both short-time and seasonal storage systems is enabled.
Scenario 3: In this scenario, the storage system is filled partially (1.0 MWh) at the start of the simulation to quantify the impact of initial levels. This corresponds to a commissioning of the storage system in spring or summer. The PV area and the limitation of the filling rate are applied according to the reference system. It therefore appears that a deviating initial level is quite an important factor. The effects of different initial levels are presented in Figure 16. The initial level will be ideally dimensioned if the storage system is emptied just in spring of the first year when the PV generation is available in excess for filling the storage system (1.2 MWh for 2011). To some extent, an optimum initial level is dependent on weather conditions at the beginning of the period under consideration. The proportion of consumption will only be influenced if the initial level is set too high, thereby reaching maximum storage level at an earlier stage of the course of the year (1.5 MWh).
Scenario 4: As already described in Figure 11b for a short-time storage system, a higher withdrawal efficiency results in a higher degree of self-sufficiency. Therefore, a further technological development is assumed in this scenario (increase of withdrawal/fuel cell efficiency by 10 percentage points to 60%). The degree of self-sufficiency rises greatly even with a minimum initial level, although the storage capacity has to be increased by 21%.
Scenario 5: Scenarios 3 and 4 are combined, which means an initial storage level of 1.0 MWh and an increased withdrawal efficiency of 60%. Thereby, a degree of self-sufficiency of 100% is achieved. Indeed, the storage level at the end of the 3-year period is lower than the initial level so that no sustainable self-sufficiency is ensured. The enlargement of the considered period by another year would result in an imperfect self-sufficiency due to the too low PV energy generation in 2013 (Chapter 2.1.).
Scenario 6: Instead of technological development and the associated increase of withdrawal efficiency owing to the prediction reliability, the initial level is combined with a slightly increased PV area. Due to the completely covered roof surface, other areas like facades or carports are used. More installed power (approximately 2 kWp) is necessary to gain a full and sustainable self-sufficiency. In this scenario, the initial level is also outnumbered by the final storage level. Consequently, a low energy surplus is achieved in spite of a bad solar year in 2013 at the end of the considered period. However, the usable storage capacity has to be raised by 58%.
Figure 15. Different scenarios to achieve high degrees of self-sufficiency.
Energies 08 08887 g015
Figure 16. Storage level with different initial levels.
Energies 08 08887 g016
Only a bigger PV system and an optimal commissioning time obtain an (almost) full self-sufficiency. Therefore, a storage capacity in the size of 2.0 and 3.0 MWh is required, according to a mass of 60 and 90 kg hydrogen (referred to LHV). This corresponds to 1100–1700 kg LOHC (liquid organic hydrogen carrier; based on a mass storage density of 5.3%) or 12–18 m3 compressed hydrogen (120 bar) [59].Thereby, a very high proportion of consumption is achieved, which is induced by the high losses at conversion of electricity into hydrogen and vice versa.

4. Conclusions and Outlook

A simulation model is developed to analyze the behavior of PV consumption systems in residential buildings combined with hydrogen-based storage systems. Both the degree of self-sufficiency and the proportion of consumption can be increased significantly by integrating a short-time storage system. The analyses show that both key factors tend to reach saturation with increasing storage capacity. A high degree of self-sufficiency of nearly 70% is achievable. In particular, the predefined PV size and the correspondent annual yields affect the proportion of consumption resulting in an on-site use of about 60%. An optimum storage capacity especially depends on storage efficiencies. Therefore, the withdrawal efficiency has to be at least at a mid-level (about 40%–50%) to ensure a low storage capacity of around 8 kWh while the influence of the filling efficiency is lower. Comparing a battery with the presented hydrogen-based storage system, the storage capacity has to be increased by about 50% due to limited depth-of-discharge. This results in a higher degree of self-sufficiency and a very low proportion of consumption. Due to their technology specific self-discharge rate, battery storage systems enable only short-time storing.
However, hydrogen-based storage systems are favored for seasonal energy storing because losses are independent from the storage period. Such a system produces a further considerable increase in the degree of self-sufficiency as well as a disproportionately high growth of the proportion of consumption. The maximum storage capacity is restricted by the available PV energy. Additionally, commissioning time and initial level, respectively, have an influence on the degree of self-sufficiency. Focusing solely on electricity demand, full self-sufficiency is achievable with an appropriate PV area and initial level. Moreover, a seasonal storing system reduces the energy exchange with the grid to a minimum. However, such a storage system requires an expensive electrolysis and reconversion unit and is based on a large dimensioning of the hydrogen storage capacity and the PV generator. Therefore, it is not economical at the present time.
Although the sizing of such energy systems depends on detailed knowledge of generation and consumption profiles, some important general indications can already be adopted from the results of this paper. Additionally, results will be compared with experimental values gained by the associated workings groups of the Bavarian Hydrogen Center [60] in the near future. In this context, economics as well as life-cycle emissions will be evaluated. A detailed focus of further investigations will be on the distribution of rates and gradients of grid exchange power. Even though a seasonal storage will be integrated, much energy is fed into the grid at times of high solar irradiation. However, there are also other possibilities to exploit the excess energy. Electricity can be converted into heat by a heating rod or a heat pump. Therefore, consideration has to be extended to both electrical and thermal energy demand. Combining a short-time and a seasonal storage system will be an alternative approach to achieve self-sufficiency combined with higher energy surpluses suitable for thermal energy demand and optimum grid integration. Under certain circumstances, hydrogen-based storage systems offer the opportunity for a combined heat and power supply with the integration of waste heat flows or a hydrogen burner.

Acknowledgments

This research was carried out in the framework of the Bavarian Hydrogen Center (BHC) joint research program. The authors would like to acknowledge the support provided by the Bavarian State Ministry of Education, Science and the Arts. This publication was funded by the University of Bayreuth in the funding program Open Access Publishing.

Author Contributions

All authors contributed to this work. Christian Pötzinger is the main author of this work. Markus Preißinger assisted in the conceptual design of the study and contributed to reviewing the manuscript before submission. The whole project was supervised by Dieter Brüggemann. All authors revised and approved the publication.

Conflicts of Interest

The authors declare no conflict of interest.

References

  1. The Integrated Energy and Climate Programme of the German Government. Available online: http://www.bmub.bund.de/fileadmin/bmu-import/files/english/pdf/application/pdf/hintergrund_meseberg_en.pdf (accessed on 13 July 2015).
  2. Gesetz für den Ausbau erneuerbarer Energien (Erneuerbare-Energien-Gesetz—EEG 2014). Available online: http://www.bmwi.de/BMWi/Redaktion/PDF/G/gesetz-fuer-den-ausbau-erneuerbarer-energien,property=pdf,bereich=bmwi2012,sprache=de,rwb=true.pdf (accessed on 13 July 2015).
  3. Bundesministerium für Wirtschaft und Energie. BMWi—Energiedaten Gesamtausgabe, Stand April 2015. Available online: http://www.bmwi.de/BMWi/Redaktion/PDF/E/energiestatistiken-grafiken,property=pdf,bereich=bmwi2012,sprache=de,rwb=true.pdf (accessed on 13 July 2015).
  4. Intergovernmental Panel on Climate Change (IPCC). Summary for Policymakers. In Climate Change 2013: The Physical Science Basis; IPCC: Geneva, Switzerland, 2013; Available online: http://www.climatechange2013.org/images/report/WG1AR5_SPM_FINAL.pdf (accessed on 13 July 2015).
  5. Photovoltaic Power Systems Programme (IEA-PVPS), International Energy Agency (IEA). National Survey Report of PV Power Applications in Germany 2013; IEA: St. Ursen, Switzerland, 2013. [Google Scholar]
  6. Quaschning, V. Photovoltaik-Eigenverbrauchssysteme im Wohngebäudesektor—Der unterschätzte Markt. Available online: http://pvspeicher.htw-berlin.de/wp-content/uploads/2014/04/BWK-2012-Der-untersch%C3%A4tzte-Markt.pdf (accessed on 13 July 2015).
  7. Luthander, R.; Widén, J.; Nilsson, D.; Palm, J. Photovoltaic self-consumption in buildings: A review. Appl. Energy 2015, 142, 80–94. [Google Scholar] [CrossRef]
  8. Widén, J. Improved photovoltaic self-consumption with appliance scheduling in 200 single-family buildings. Appl. Energy 2014, 126, 199–212. [Google Scholar] [CrossRef]
  9. Castillo-Cagigal, M.; Caamaño-Martín, E.; Matallanas, E.; Masa-Bote, D.; Gutiérrez, A.; Monasterio-Huelin, F.; Jiménez-Leube, J. PV self-consumption optimization with storage and active DSM for the residential sector. Sol. Energy 2011, 85, 2338–2348. [Google Scholar] [CrossRef] [Green Version]
  10. Barbato, A.; Capone, A. Optimization models and methods for demand-side management of residential users: A survey. Energies 2014, 7, 5787–5824. [Google Scholar] [CrossRef]
  11. Mokhtari, G.; Nourbakhsh, G.; Gosh, A. Optimal sizing of combined PV-energy storage for a grid-connected residential building. Adv. Energy Eng. 2013, 1, 53–65. [Google Scholar]
  12. Velik, R. East-south-west orientation of PV systems and neighbourhood energy exchange to maximize local photovoltaics energy consumption. Int. J. Renew. Energy Res. 2013, 4, 566–570. [Google Scholar]
  13. Zeh, A.; Witzmann, R. Operational strategies for battery storage systems in low-voltage distribution grids to limit the feed-in power of roof-mounted solar power systems. Energy Procedia 2014, 46, 114–123. [Google Scholar] [CrossRef]
  14. Johann, A.; Madlener, R. Profitability of energy storage for raising self-consumption of solar power: Analysis of different household types in Germany. Energy Procedia 2014, 61, 2206–2210. [Google Scholar] [CrossRef]
  15. Bianchi, M.; Branchini, L.; Ferrari, C.; Melino, F. Optimal sizing of grid-independent hybrid photovoltaic-battery power systems for household sector. Appl. Energy 2014, 136, 805–816. [Google Scholar] [CrossRef]
  16. Santos, J.M.; Moura, P.S.; de Almeida, A.T. Technical and economic impact of residential electricity storage at local and grid level for Portugal. Appl. Energy 2014, 128, 254–264. [Google Scholar] [CrossRef]
  17. Moshövel, J.; Kairies, K.-P.; Magnor, D.; Leuthold, M.; Bost, M.; Gährs, S.; Szczechowicz, E.; Cramer, M.; Sauer, D.U. Analysis of the maximal possible grid relief from PV-peak-power impacts by using storage systems for increased self-consumption. Appl. Energy 2015, 137, 567–575. [Google Scholar] [CrossRef]
  18. Bayod-Rújula, Á.A.; Haro-Larrodé, M.E.; Martínez-Gracia, A. Sizing criteria of hybrid photovoltaic-wind systems with battery storage and self-consumption considering interaction with the grid. Solar Energy 2013, 98, 582–591. [Google Scholar] [CrossRef]
  19. Bhandari, B.; Poudel, S.R.; Lee, K.-T.; Ahn, S.-H. Mathematical modeling of hybrid renewable energy system: A review on small hydro-solar-wind power generation. Int. J. Precis. Eng. Manuf. Green Technol. 2014, 1, 157–173. [Google Scholar] [CrossRef]
  20. Wang, X.; Palazoglu, A.; El-Farra, N.H. Operational optimization and demand response of hybrid renewable energy systems. Appl. Energy 2015, 143, 324–335. [Google Scholar] [CrossRef]
  21. Dufo-López, R.; Bernal-Agustín, J.L.; Yusta-Loyo, J.M.; Domínguez-Navarro, J.A.; Ramírez-Rosado, I.J.; Lujano, J.; Aso, I. Multi-objective optimization minimizing cost and life cycle emissions of stand-alone PV-wind-diesel systems with batteries storage. Appl. Energy 2011, 88, 4033–4041. [Google Scholar] [CrossRef]
  22. Schmiegel, A.U.; Kleine, A. Optimized operation strategies for PV storages systems yield limitations, optimized battery configuration and the benefit of a perfect forecast. Energy Procedia 2014, 46, 104–113. [Google Scholar] [CrossRef]
  23. Schneider, M.; Boras, P.; Schaede, H.; Quurck, L.; Rinderknecht, S. Effects of operational strategies on performance and costs of electric energy storage systems. Energy Procedia 2014, 46, 271–280. [Google Scholar] [CrossRef]
  24. Daud, M.Z.; Mohamed, A.; Hannan, M.A. An optimal state of charge feedback control strategy for battery energy storage in hourly dispatch of PV sources. Procedia Technol. 2013, 11, 24–31. [Google Scholar] [CrossRef]
  25. Masa-Bote, D.; Castillo-Cagigal, M.; Matallanas, E.; Caamaño-Martín, E.; Gutiérrez, A.; Monasterio-Huelín, F.; Jiménez-Leube, J. Improving photovoltaics grid integration through short time forecasting and self-consumption. Appl. Energy 2014, 125, 103–113. [Google Scholar] [CrossRef]
  26. Castañeda, M.; Cano, A.; Jurado, F.; Sánchez, H.; Fernández, L.M. Sizing optimization, dynamic modeling and energy management strategies of a stand-alone PV/hydrogen/battery-based hybrid system. Int. J. Hydrog. Energy 2013, 38, 3830–3845. [Google Scholar] [CrossRef]
  27. Cau, G.; Cocco, D.; Petrollese, M. Modeling and simulation of an isolated hybrid micro-grid with hydrogen production and storage. Energy Procedia 2014, 45, 12–21. [Google Scholar] [CrossRef]
  28. Dufo-López, R.; Bernal-Agustín, J.L.; Contreras, J. Optimization of control strategies for stand-alone renewable energy systems with hydrogen storage. Renew. Energy 2007, 32, 1102–1126. [Google Scholar] [CrossRef]
  29. Gencoglu, M.T.; Ural, Z. Design of a PEM fuel cell system for residential application. Int. J. Hydrog. Energy 2009, 34, 5242–5248. [Google Scholar] [CrossRef]
  30. Onar, O.; Uzunoglu, M.; Alam, M. Modeling, control and simulation of an autonomous wind turbine/photovoltaic/fuel cell/ultra-capacitor hybrid power system. J. Power Sources 2008, 185, 1273–1283. [Google Scholar] [CrossRef]
  31. Maclay, J.D.; Brouwer, J.; Samuelsen, G.S. Dynamic modeling of hybrid energy storage systems coupled to photovoltaic generation in residential applications. J. Power Sources 2007, 163, 916–925. [Google Scholar] [CrossRef]
  32. Lacko, R.; Drobnič, B.; Sekavčnik, M.; Mori, M. Hydrogen energy system with renewables for isolated households: The optimal system design, numerical analysis and experimental evaluation. Energy Build. 2014, 80, 106–113. [Google Scholar] [CrossRef]
  33. Boscaino, V.; Miceli, R.; Capponi, G.; Ricco Galluzzo, G. A review of fuel cell based hybrid power supply architectures and algorithms for household appliances. Int. J. Hydrog. Energy 2014, 39, 1195–1209. [Google Scholar] [CrossRef]
  34. Santarelli, M.; Macagno, S. A thermoeconomic analysis of a PV-hydrogen system feeding the energy requests of a residential building in an isolated valley of the Alps. Energy Convers. Manag. 2004, 45, 427–451. [Google Scholar] [CrossRef]
  35. Hwang, J.J.; Lai, L.K.; Wu, W.; Chang, W.R. Dynamic modeling of a photovoltaic hydrogen fuel cell hybrid system. Int. J. Hydrog. Energy 2009, 34, 9531–9542. [Google Scholar] [CrossRef]
  36. Bocci, E.; Zuccari, F.; Dell’Era, A. Renewable and hydrogen energy integrated house. Int. J. Hydrog. Energy 2011, 36, 7963–7968. [Google Scholar] [CrossRef]
  37. Karellas, S.; Tzouganatos, N. Comparison of the performance of compressed-air and hydrogen energy storage systems: Karpathos island case study. Renew. Sustain. Energy Rev. 2014, 29, 865–882. [Google Scholar] [CrossRef]
  38. Richards, B.S.; Conibeer, G.J. A comparison of hydrogen storage technologies for solar-powered stand-alone power supplies: A photovoltaic system sizing approach. Int. J. Hydrog. Energy 2007, 32, 2712–2718. [Google Scholar] [CrossRef]
  39. Gray, E.; Webb, C.J.; Andrews, J.; Shabani, B.; Tsai, P.J.; Chan, S. Hydrogen storage for off-grid power supply. Int. J. Hydrog. Energy 2011, 36, 654–663. [Google Scholar] [CrossRef]
  40. Cao, S.; Sirén, K. Impact of simulation time-resolution on the matching of PV production and household electric demand. Appl. Energy 2014, 128, 192–208. [Google Scholar] [CrossRef]
  41. MathWorks Inc. MATLAB R2013b; MathWorks Inc.: Natick, MA, USA, 2013. [Google Scholar]
  42. Bundesinstitut für Bau-, Stadt- und Raumforschung im Bundesamt für Bauwesen und Raumordnung. In Planung neuer Wohngebäude nach Energieeinsparverordnung 2009 und Erneuerbare-Energien-Wärmegesetz; Federal Ministry of Transport and Digital Infrastructure, Federal Ministry for the Environment, Nature Conservation, Building and Nuclear Safety: Berlin, Germany, 2010.
  43. Bavarian Hydrological Service (GkD). Available online: http://www.gkd.bayern.de/?sp=en (accessed on 13 July 2015).
  44. Loedl, M.; Witzmann, R.; Metzger, M. Operation strategies of energy storages with forecast methods in low-voltage grids with a high degree of decentralized generation. In Proceedings of the IEEE Electrical Power and Energy Conference, Winnipeg, MB, Canada, 3–5 October 2011; pp. 52–56.
  45. Valentin Software GmbH. PV*SOL Expert 6.0; Valentin Software GmbH: Berlin, Germany, 2014. [Google Scholar]
  46. Caputo, P.; Gaia, C.; Zanotto, V. A methodology for defining electricity demand in energy simulations referred to the Italian context. Energies 2013, 6, 6274–6292. [Google Scholar] [CrossRef]
  47. Verein Deutscher Ingenieure (VDI)/Association of German Engineers. VDI 4655—Referenzlastprofile von Ein- und Mehrfamilienhäusern für den Einsatz von KWK-Anlagen (Reference Load Profiles of Single-Family and Multi-Family Houses for the Use of CHP Systems); VDI: Berlin, Germany, 2008. [Google Scholar]
  48. Bundesverband der Energie und Wasserwirtschaft (BDEW). Standardlastprofile Strom. Available online: https://www.bdew.de/internet.nsf/id/DE_Standartlastprofile (accessed on 13 July 2015).
  49. Meier, H.; Fünfgeld, C. Repräsentative Lastprofile der VDEW; VDEW Materialien M-32/99; Brandenburgische Technische Universität Cottbus, Lehrstuhl Energiewirtschaft: Frankfurt am Main, Germany, 1999. [Google Scholar]
  50. WEMAG Netz GmbH. Available online: http://www.wemag-netz.de/export/sites/wemagnetz/zugang/lastprofilkunden/SLP-Beschreibung_140401.pdf (accessed on 13 July 2015).
  51. Tjaden, T.; Weniger, J.; Bergner, J.; Schnorr, F.; Quaschning, V. Einfluss des Standorts und Nutzerverhaltens auf die energetische Bewertung von PV-Speichersystemen. In Proceeding of the Symposium Photovoltaische Solarenergie, Bad Staffelstein, Germany, 12–14 March 2014.
  52. Bundesverband der Energie- und Wasserwirtschaft e.V. BDEW—Energie-Info—Stromverbrauch im Haushalt; BDEW: Berlin, Germany, 2014. [Google Scholar]
  53. Töpler, J.; Lehmann, J. Wasserstoff und Brennstoffzelle: Technologien und Marktperspektiven; Springer Vieweg: Berlin, Germany, 2014. [Google Scholar]
  54. Yilanci, A.; Dincer, I.; Ozturk, H. Performance analysis of a PEM fuel cell unit in a solar-hydrogen system. Int. J. Hydrog. Energy 2008, 33, 7538–7552. [Google Scholar] [CrossRef]
  55. Weniger, J.; Tjaden, T.; Quaschning, V. Sizing of residential PV battery systems. Energy Procedia 2014, 46, 78–87. [Google Scholar] [CrossRef]
  56. Linares, J.I.; Herranz, L.E.; Moratilla, B.Y. Maximum efficiency of direct energy conversion systems. Application to fuel cells. Int. J. Hydrog. Energy 2011, 36, 10027–10032. [Google Scholar] [CrossRef]
  57. Martel, F.; Kelouwani, S.; Dubé, Y.; Agbossou, K. Optimal economy-based battery degradation management dynamics for fuel-cell plug-in hybrid electric vehicles. J. Power Sources 2015, 274, 367–381. [Google Scholar] [CrossRef]
  58. Tjaden, T.; Krien, U.; Breyer, C. Simulation und techno-ökonomischer Vergleich von solarthermischen Heizungskonzepten und Photovoltaik-Wärmepumpen-Kombinationen im Wohnungssektor. In Proceeding of the Symposium Thermische Solarenergie, Bad Staffelstein, Germany; 2013. [Google Scholar]
  59. Teichmann, D.; Arlt, W.; Wasserscheid, P. Liquid organic hydrogen carriers as an efficient vector for the transport and storage of renewable energy. Int. J. Hydrog. Energy 2012, 37, 18118–18132. [Google Scholar] [CrossRef]
  60. Bavarian Hydrogen Center. Available online: http://www.bh2c.de/imprint/?lang=en (accessed on 15 July 2015).