2.1.1. PRIDE
Korea has developed a back-end fuel cycle policy to solve the issue of saturation of the temporary spent nuclear fuel storage by pyroprocessing. Toward this end, first and foremost, it is necessary to prove the pyroprocessing technology through a pyroprocessing facility before commercialization. In the long-run, it is necessary to secure commercialization technology for the linkage among the unit processes and for the commercialization by securing pyroprocessing-specific proprietary source technology. KAERI started the pyroprocessing technology development strategy in 1997 and is currently operating PRIDE. The PRIDE facility design was carried out from 2007 to 2008, and construction was conducted from 2009 to June 2012. To prove the pyroprocess’ possibility of technology realization, this facility was subjected to a trial operation after July 2012, and many experiments are underway today to develop advanced technology.
This facility can prove the pyroprocessing technology for the first time on Earth. The facility can be a base facility to secure pyroprocessing’s commercialization technology through the results of joint research between Korea and the U.S. This joint research uses spent fuel as an experiment specimen in the U.S. Moreover, the pyroprocessing safety measure technology was developed in cooperation with the International Atomic Energy Agency (IAEA), and this is a facility that can significantly help to secure transparency in handling nuclear material. The cost object’s design condition is shown in
Table 1 to calculate the pyroprocessing unit operation cost.
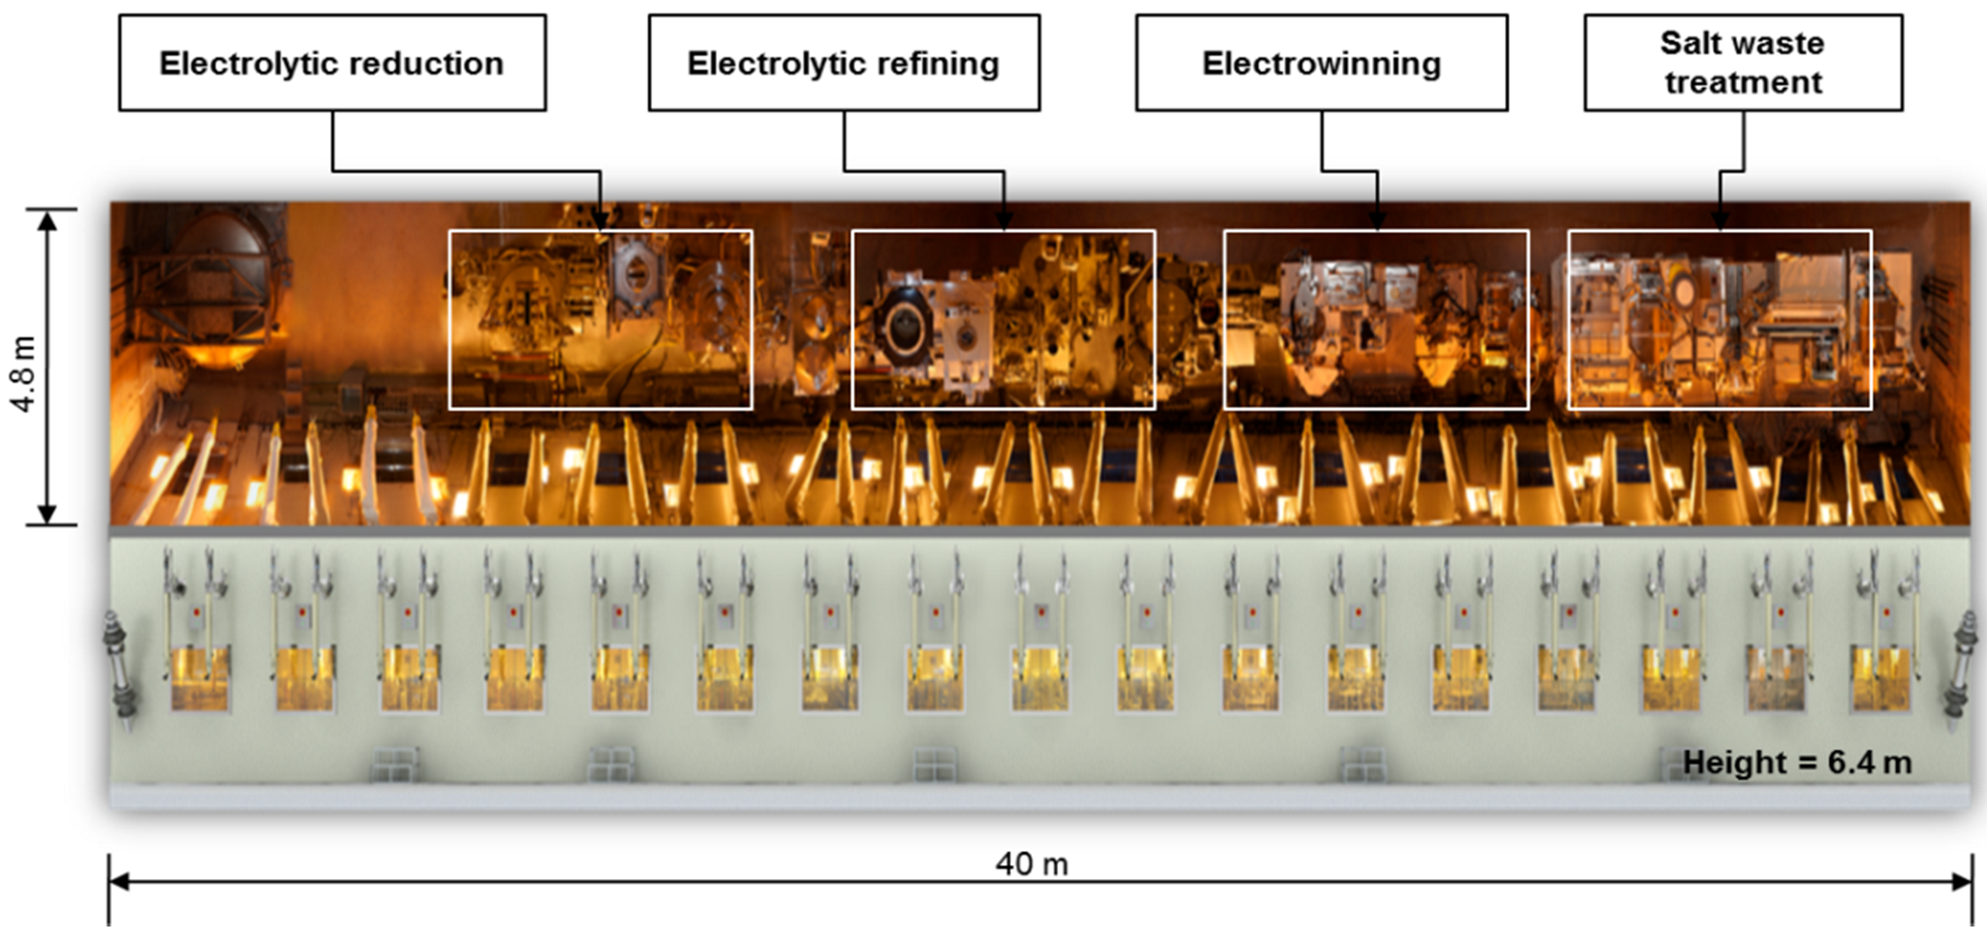
Figure 1 shows an inside view of PRIDE. In
Table 1, ACPF means advanced spent fuel conditioning facility for the laboratory-scale pyroprocess.
Table 1.
The main design criteria of PRIDE.
Table 1.
The main design criteria of PRIDE.
| Classification | Criteria |
|---|
| Capacity | Pretreatment *: SIM(simulated)-fuel of 10 tHM, containing the depleted uranium and rare earth elements (Nd, Ce, La, etc)/yr, Temporary storage: 10 tHM/yr,
Pyroprocessing: 10 tHM/yr/module × 1 module |
| Annual availability | Availability considering O&M (Operating and Maintenance): 55%, Annual usage: 200 d/yr |
| Design life | 60 yr |
| Input material | Depleted Uranium, LiCl and KCl |
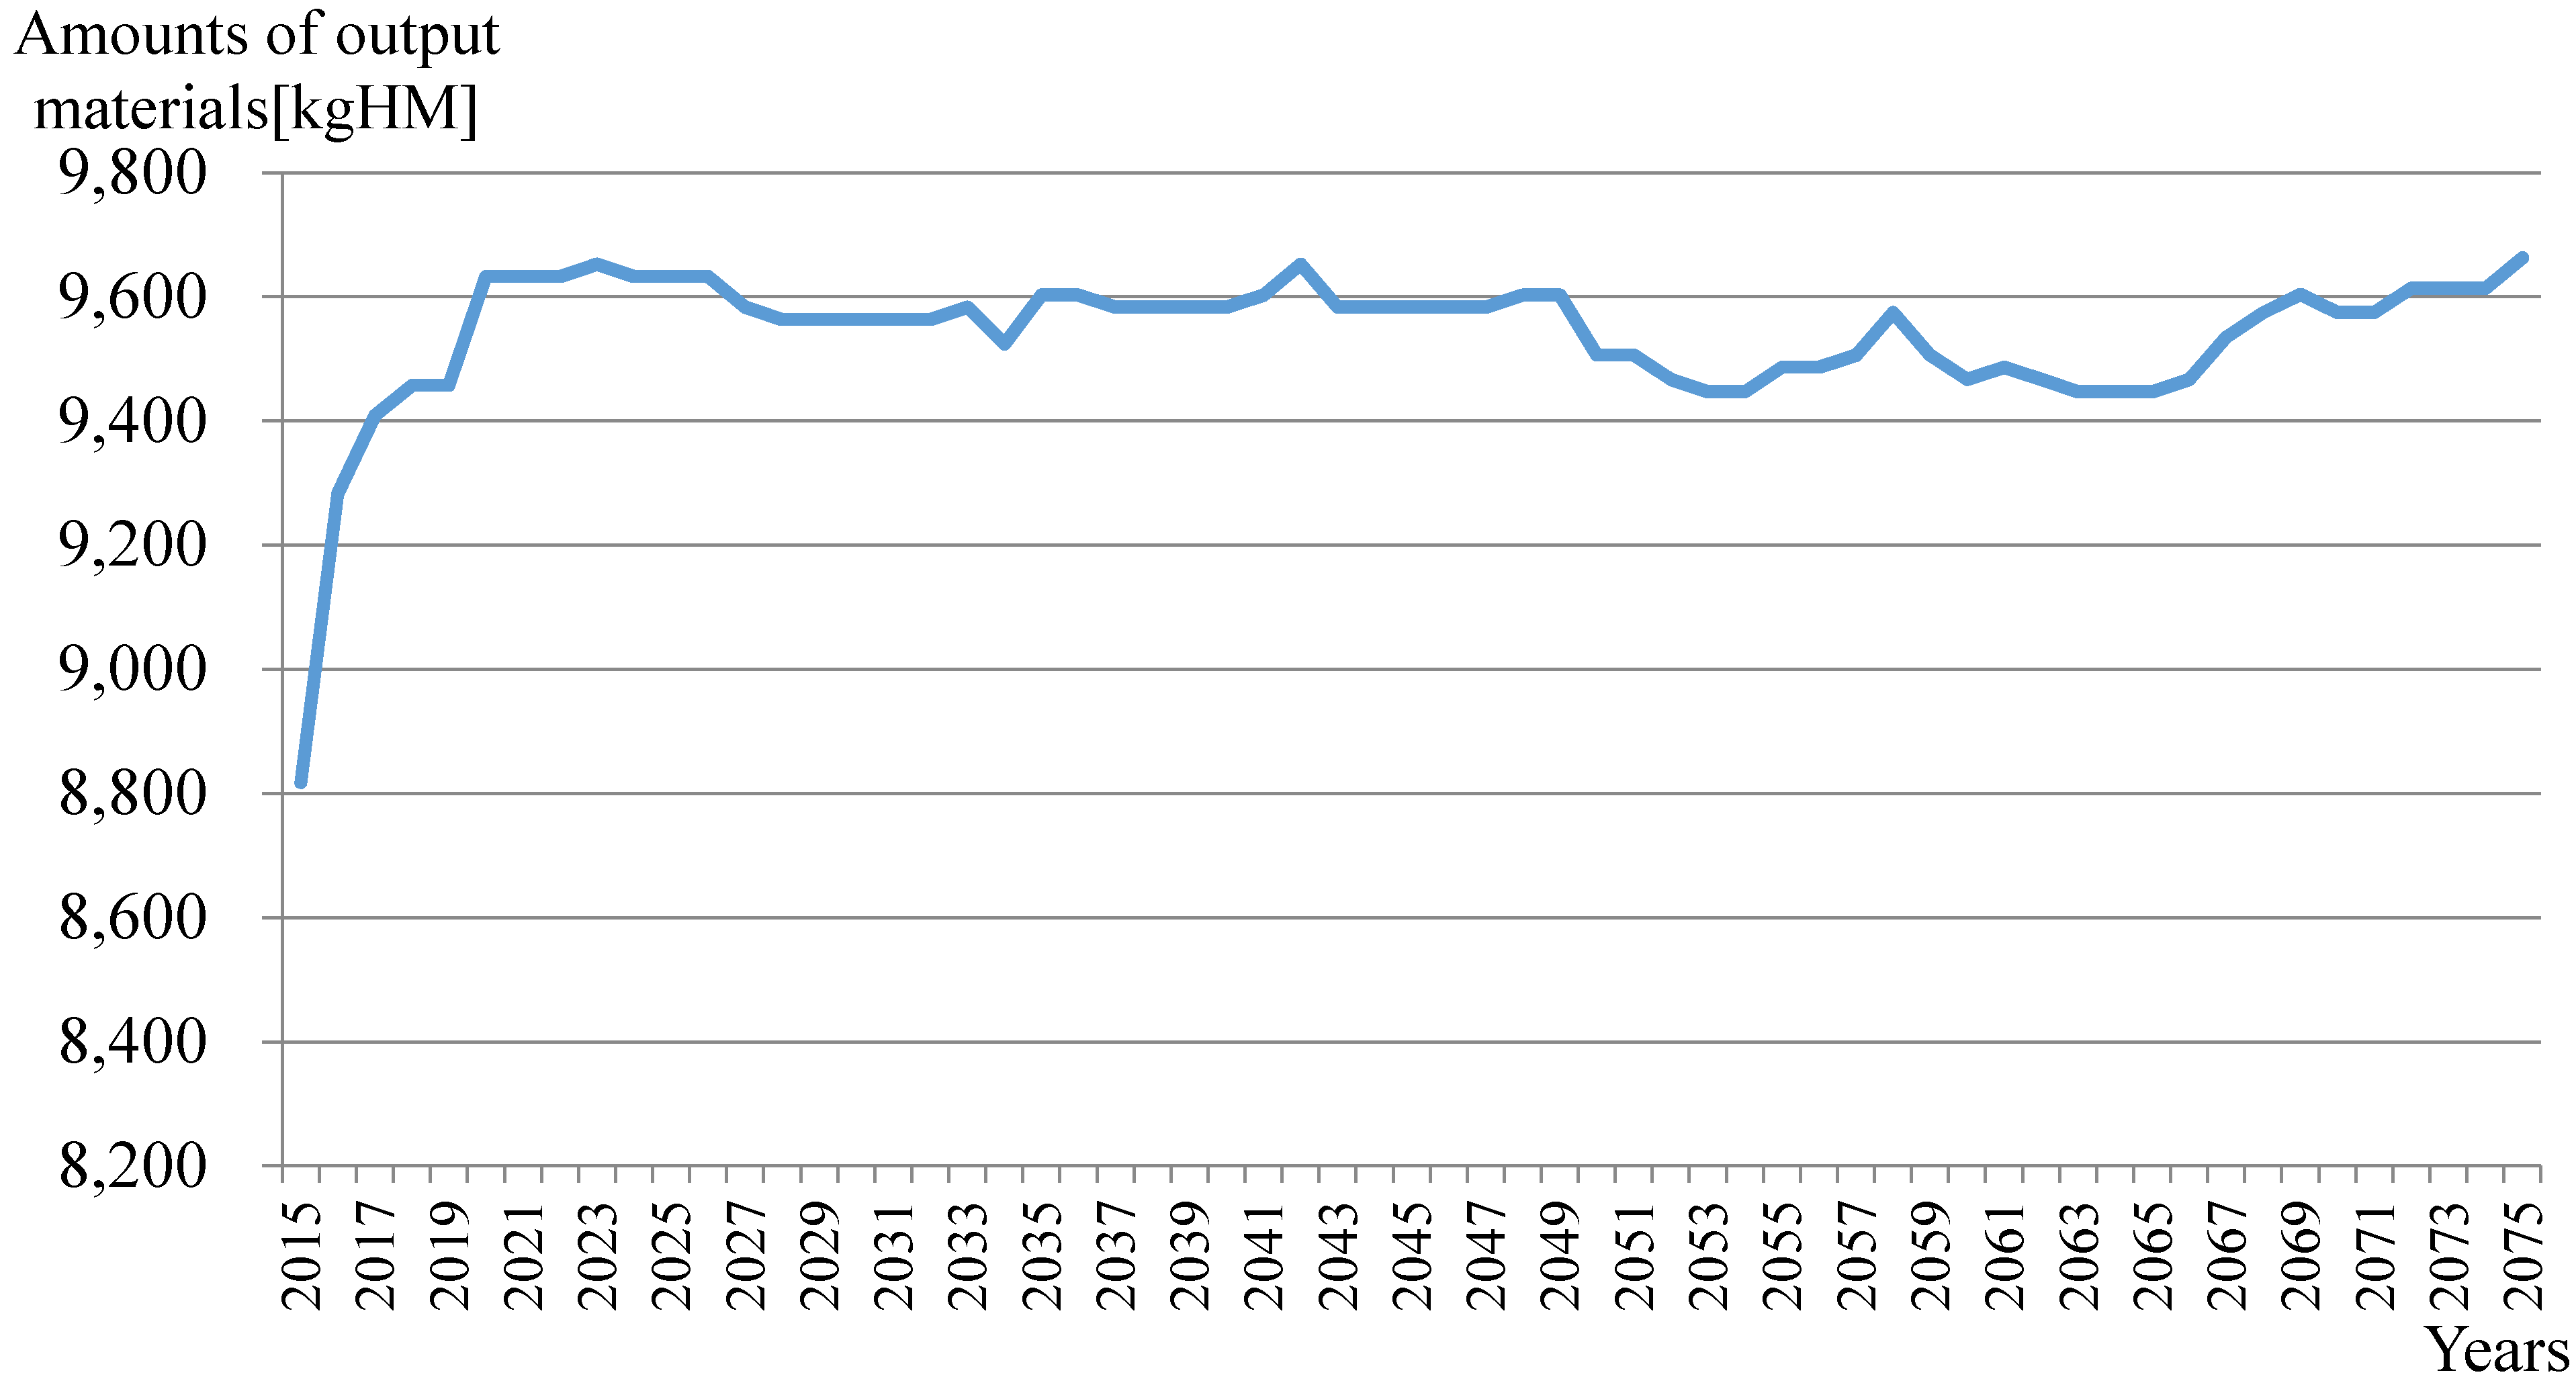
| Output material | U metal ingot, TRU, and wastes(Ceramic, metal, vitrification) |
Figure 1.
The sectional plane of the PyRoprocess Integrated inactive DEmonstration (PRIDE) facility.
Figure 1.
The sectional plane of the PyRoprocess Integrated inactive DEmonstration (PRIDE) facility.
PRIDE facility’s Ar cell dimensions are 40 m, 4.8 m, and 6.4 m in length, width, and height, respectively. The pretreatment process is implemented in an atmosphere of air. On the other hand, the pyroprocess is implemented in Ar cell with an atmosphere of argon gas where there exists virtually no oxygen/moisture (50 ppm or below) in order to suppress the oxidation reaction as required by the characteristics of the metal transformant [
9]. The PRIDE is designed to operate at negative pressure of 10 to 200 mmAq which are equivalent to 0.00096 atm and 0.01935 atm in magnitude, respectively.
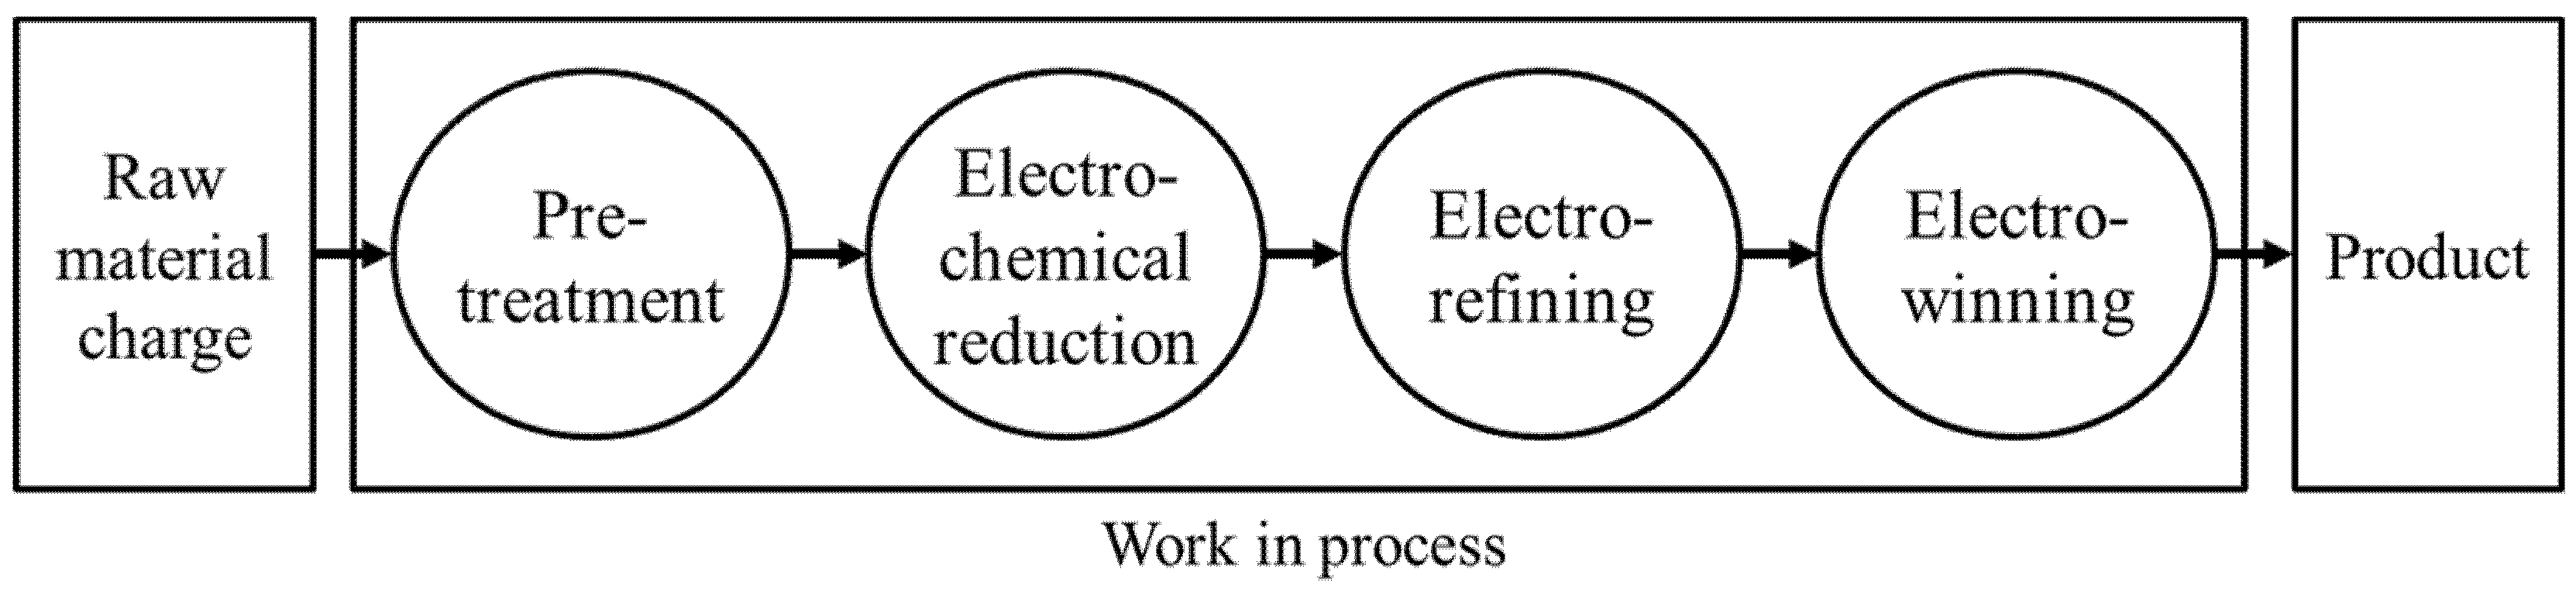
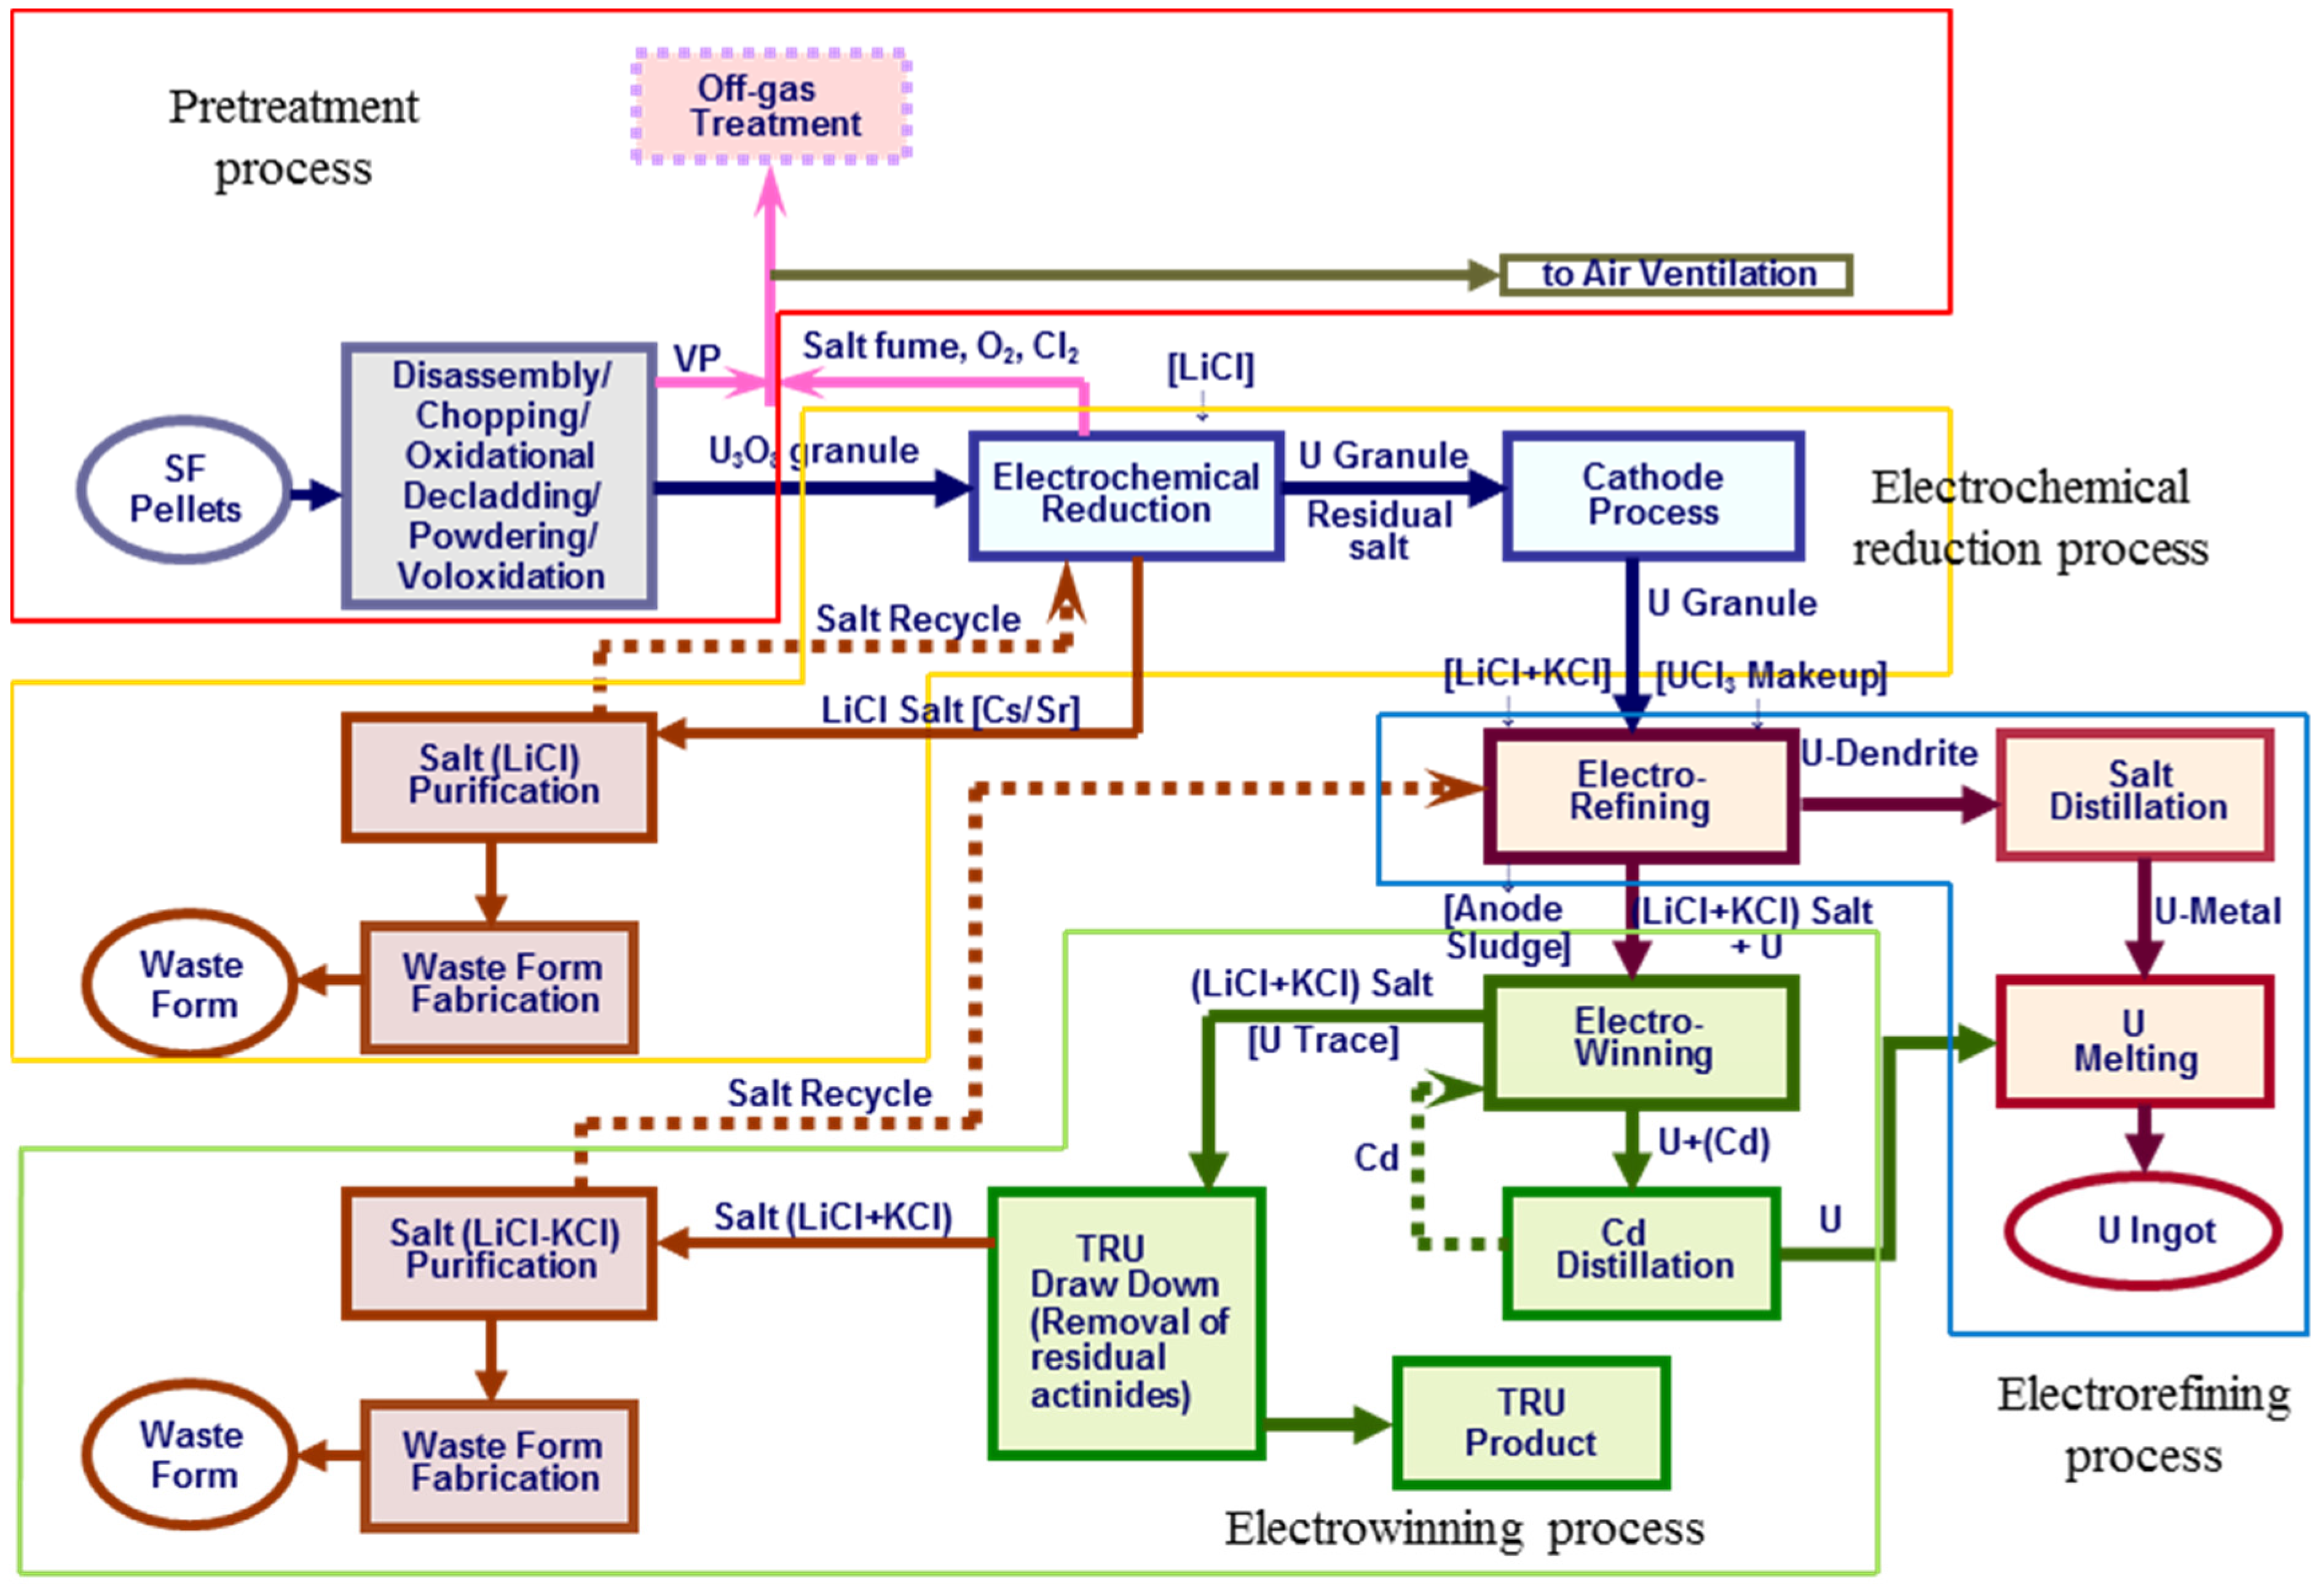
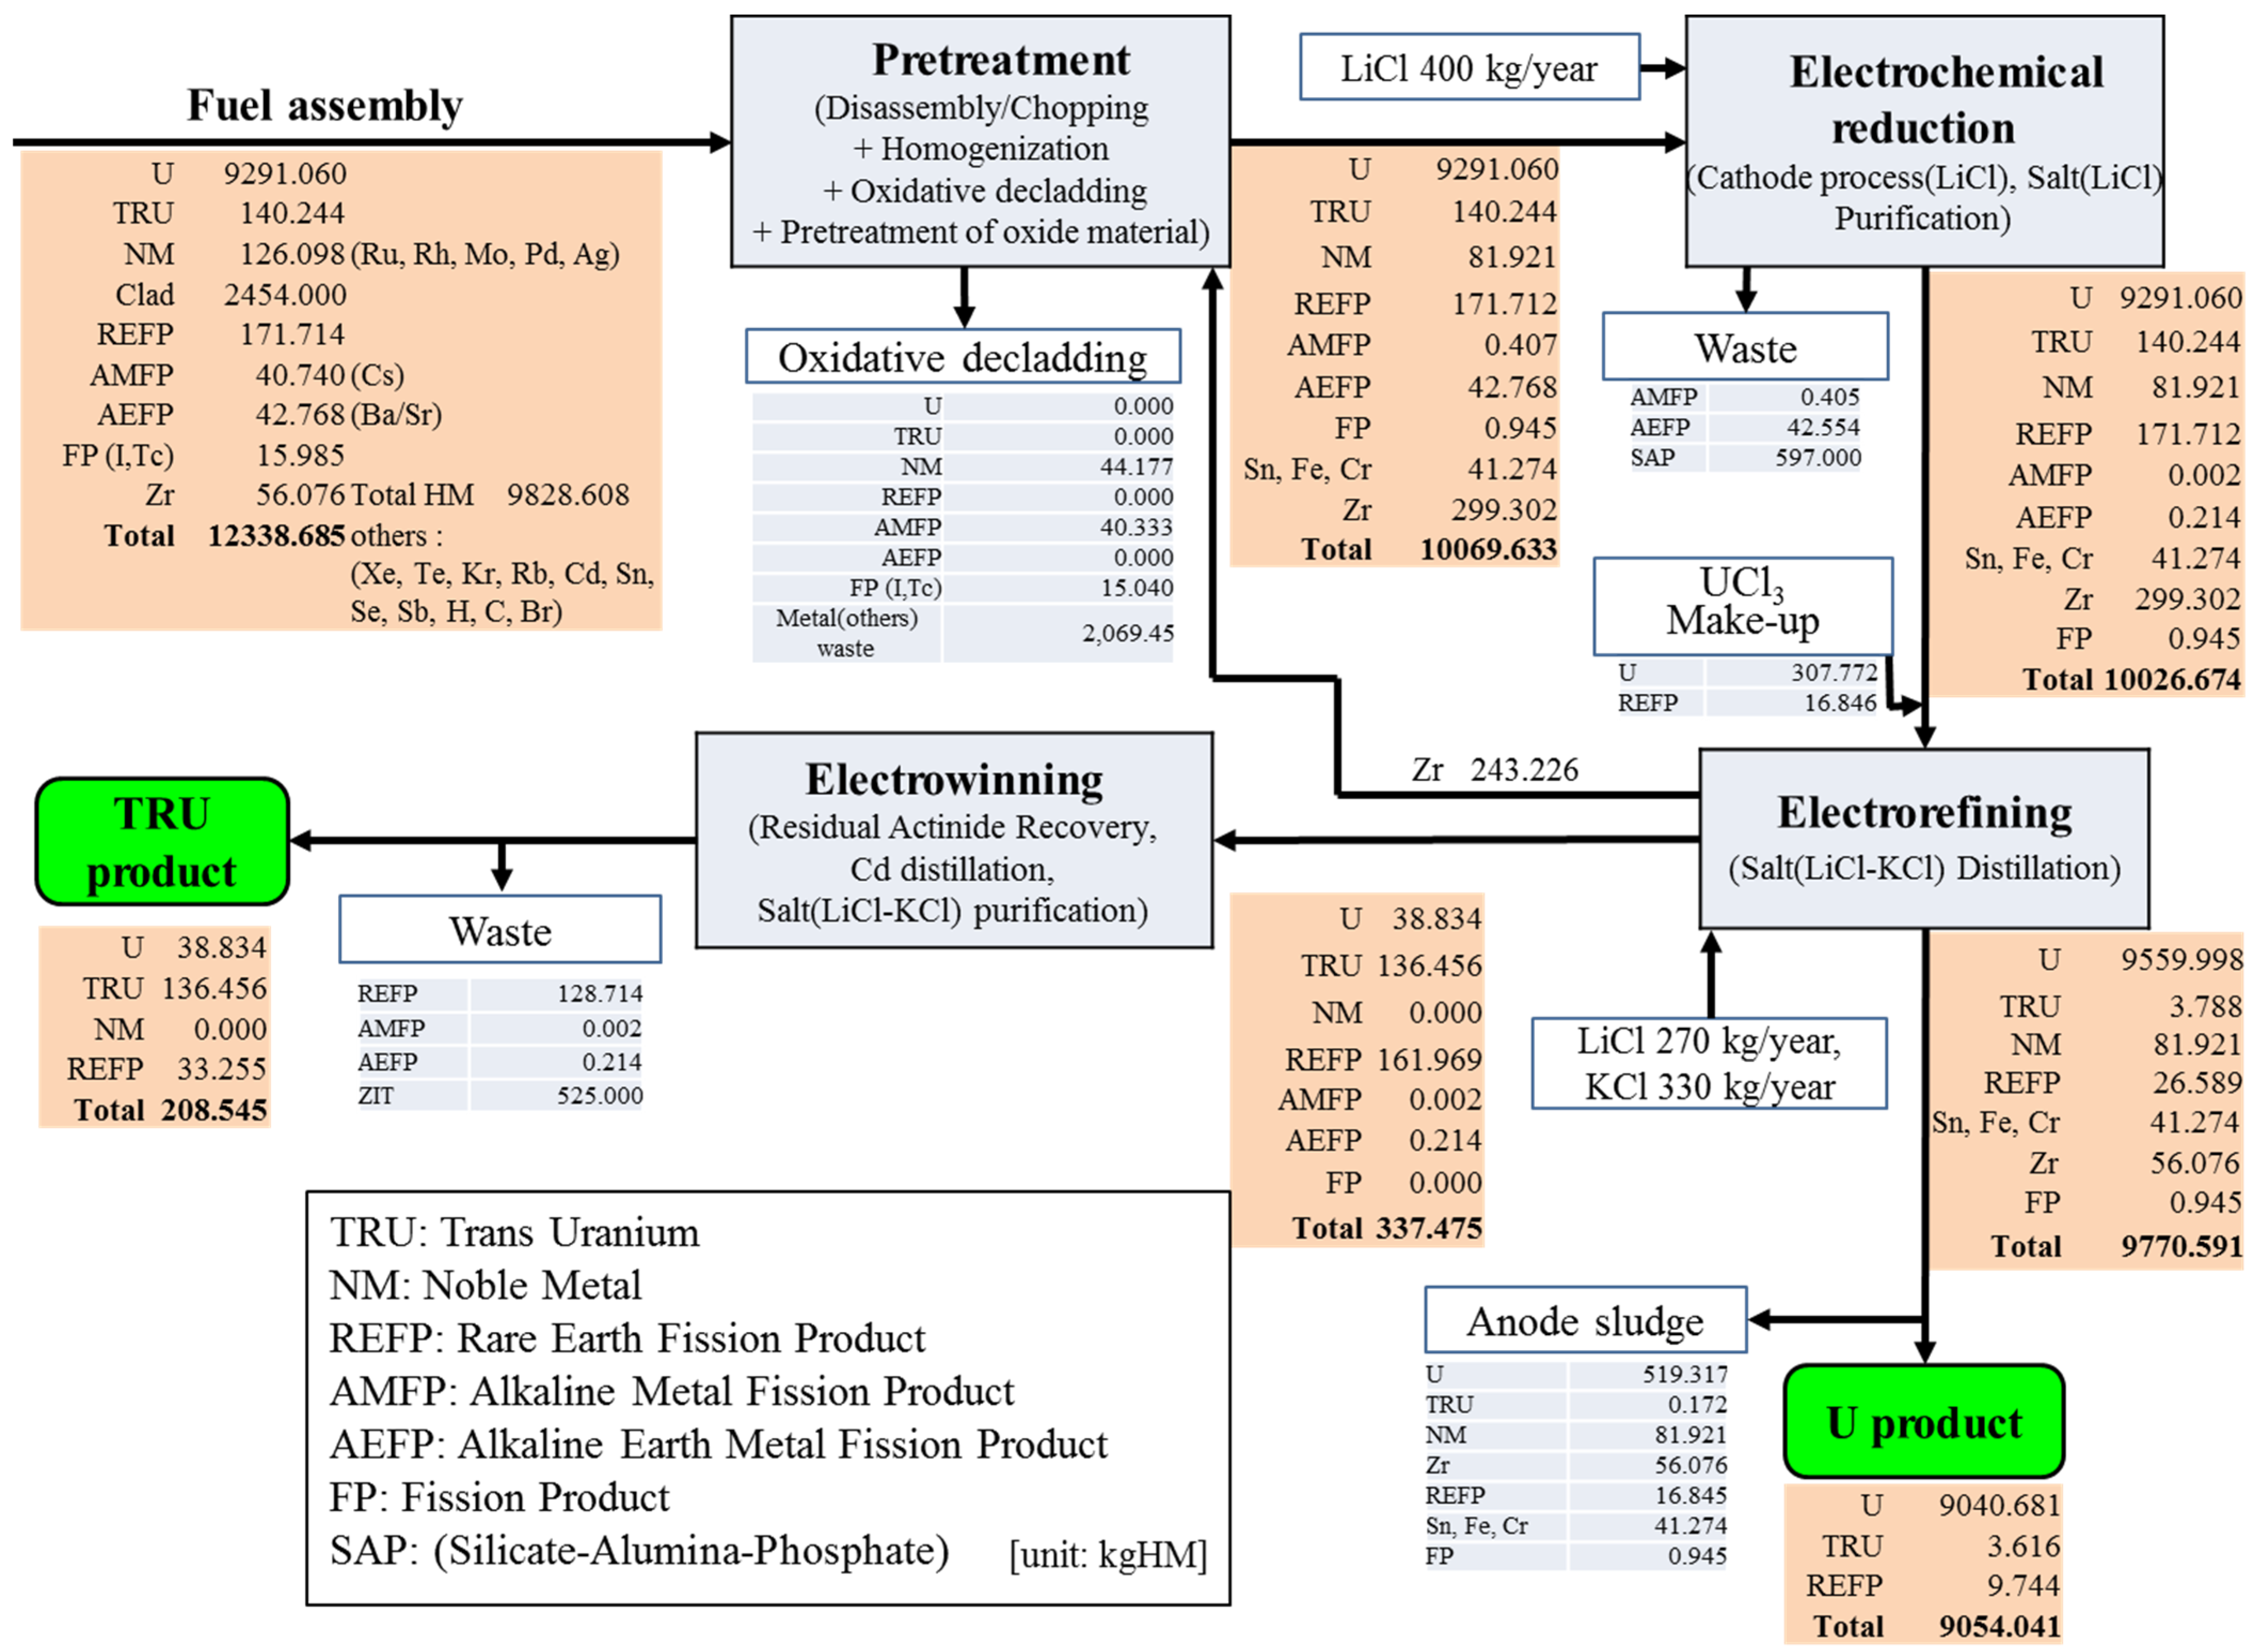
The pyroprocess consists of unit-processes such as pretreatment, electrochemical reduction, electrorefining, electrowinning, removal of residual actinide, manufacturing of uranium and uranium-TRU ingots, and the recycling of salt-wastes. The core process of the pyroprocess facility is divided into four sectors as shown in
Figure 2, including the pretreatment, electrochemical reduction, electrorefining and electrowinning.
Figure 2.
The manufacturing unit process of pyroprocess.
Figure 2.
The manufacturing unit process of pyroprocess.
The pretreatment process is a process in which the spent fuel that was emitted from light-water reactor power plants is received, dismantled, and cut, consisting of unit processes such as a dismantling of the assembly, fuel rod cutting, decladding and powdering, voloxidation, and waste disposal [
9].
The electrochemical reduction process consists of a cathode consolidation process removing salt residues from the metal products generated from the pretreatment process, and converts the oxide materials into the metallic product in a LiCl-Li2O molten salt at about 650 °C. This chemical reaction uses the decomposition potential difference between LiCl, Li2O and UO2. The potential of the electrolytic reduction process is determined where the Li2O electrolysis takes place without the decomposition of LiCl (−3.46 V < Vcell < −2.47 V). The metallic Li produced by the Li2O electrolysis reacts with UO2 within a cathode basket generating the reduced metal and Li2O. LiCl 400 kg/year are used as electrolyte solvent in the electrochemical reduction process.
The electrorefining process selectively collects high-purity uranium on the cathode from the reduced metal on the anode in the LiCl-KCl eutectic salt at about 500 °C. The salt distillation process recovers eutectic salt adhered to the uranium deposit.
The electrowinning system consists of an electrowinning process, a Cd (cadmium) distillation process and a TRU drawdown process. The electrowinning process recovers the residual uranium and TRU from the electro-refined LiCl-KCl salt using Cd. The recovered uranium and TRU moves to the liquid cadmium cathode (LCC) through the electrowinning process. The Cd distillation process performs to reuse cadmium from the liquid metal and TRU precipitates. Also the TRU drawdown process recovers a residual actinide from the waste salt. LiCl 270 kg/year and KCl 330 kg/year are used as electrolyte solvent in the electrowinning process.
Figure 3 shows the flowchart of pyroprocessing.
The material flow values were calculated by using the ORIGEN-ARP code developed by Oak Ridge National Laboratory. Radioactive salt waste handling cost was classified as the cost of electrowinning. Accordingly, it is possible to calculate the unit cost of the overall pyroprocess when the unit costs of the four unit processes are estimated and added up, and it is possible to identify which process incurs the highest cost.
Figure 3.
The pyroprocessing flowchart.
Figure 3.
The pyroprocessing flowchart.
2.1.2. Basics of the Process Costing Method
It is necessary to set up the cost object first in order to calculate the unit cost [
14], which is the pyroprocess facility’s unit process. This paper set PRIDE as the cost object to calculate the pyroprocessing cost. This paper calculated the pyroprocessing unit cost by utilizing the information of the cost incurred from the PRIDE facility, and the cost accuracy is higher than that of the commercialization facility’s estimated cost based on existing conceptual design. However, because the cost object is an engineering scale facility, it was assumed that the pyroprocessing cost is more expensive compared to that of a commercial facility because the PRIDE facility’s size is significantly smaller than that of the commercial facility. Thus, it is not possible to factor in the economic gains resulting from the large capacity facility size to the PRIDE process unit cost.
The pyroprocessing cost presented by the existing studies was calculated using the engineering cost estimation method based on a conceptual design of a pyroprocessing facility [
15]. In other words, the pyroprocessing unit cost was not discerned, and the costs that were consumed during the entire pyroprocess were estimated by dividing them into direct and indirect costs, and the sum of the capital investment cost, labor cost, expenses, and other costs was calculated as the total cost [
16]. The direct costs and indirect costs are shown in
Table 2.
In the engineering cost estimation, the indirect cost was calculated using the direct cost proportional method that relies on expert judgment [
17], and it is seriously disadvantaged due to the uncertainty of the cost calculation result. In sum, a weakness of this type of cost calculation method is that it cannot accurately estimate the cost of each unit process.
Table 2.
Direct costs and indirect costs.
Table 2.
Direct costs and indirect costs.
| Category | Capital Cost | O & M Cost |
|---|
| Direct cost | Site preparation | Labor cost: wage of production workers |
| Process systems (Equipment) | Equipment replacement |
| Main process building | Materials (depleted uranium, LiCl and KCl) |
| Site support facilities | Transportation |
| Indirect cost | Conceptual/Final design | Materials (office supplies) |
| Licenses | Labor cost: wage of facility inspector |
| Engineering and construction management | Utilities-service(water, electricity) |
| Startup and testing(Initial training) | Facilities-support (environment monitoring, security) |
| | General and administrative costs (Tax, Insurance) |
The process costing method, which can estimate the unit cost of each process, is an accounting method that can draw out the key cost drivers of pyroprocessing in a rational manner. It is a very effective cost calculation method that can mix the advantages of the engineering cost estimation method [
18]. In particular, raw material costs, labor costs, and others used by this paper are real costs that are generated in the PRIDE facility. Thus, the accuracy level of the calculation result is very high compared to the engineering cost estimation method.
The process costing method is suitable for the process for producing considerable quantities of uranium ingot products [
19]. Technology areas that can apply the process costing method include the chemical, oil refinery, and electronic industries [
20].
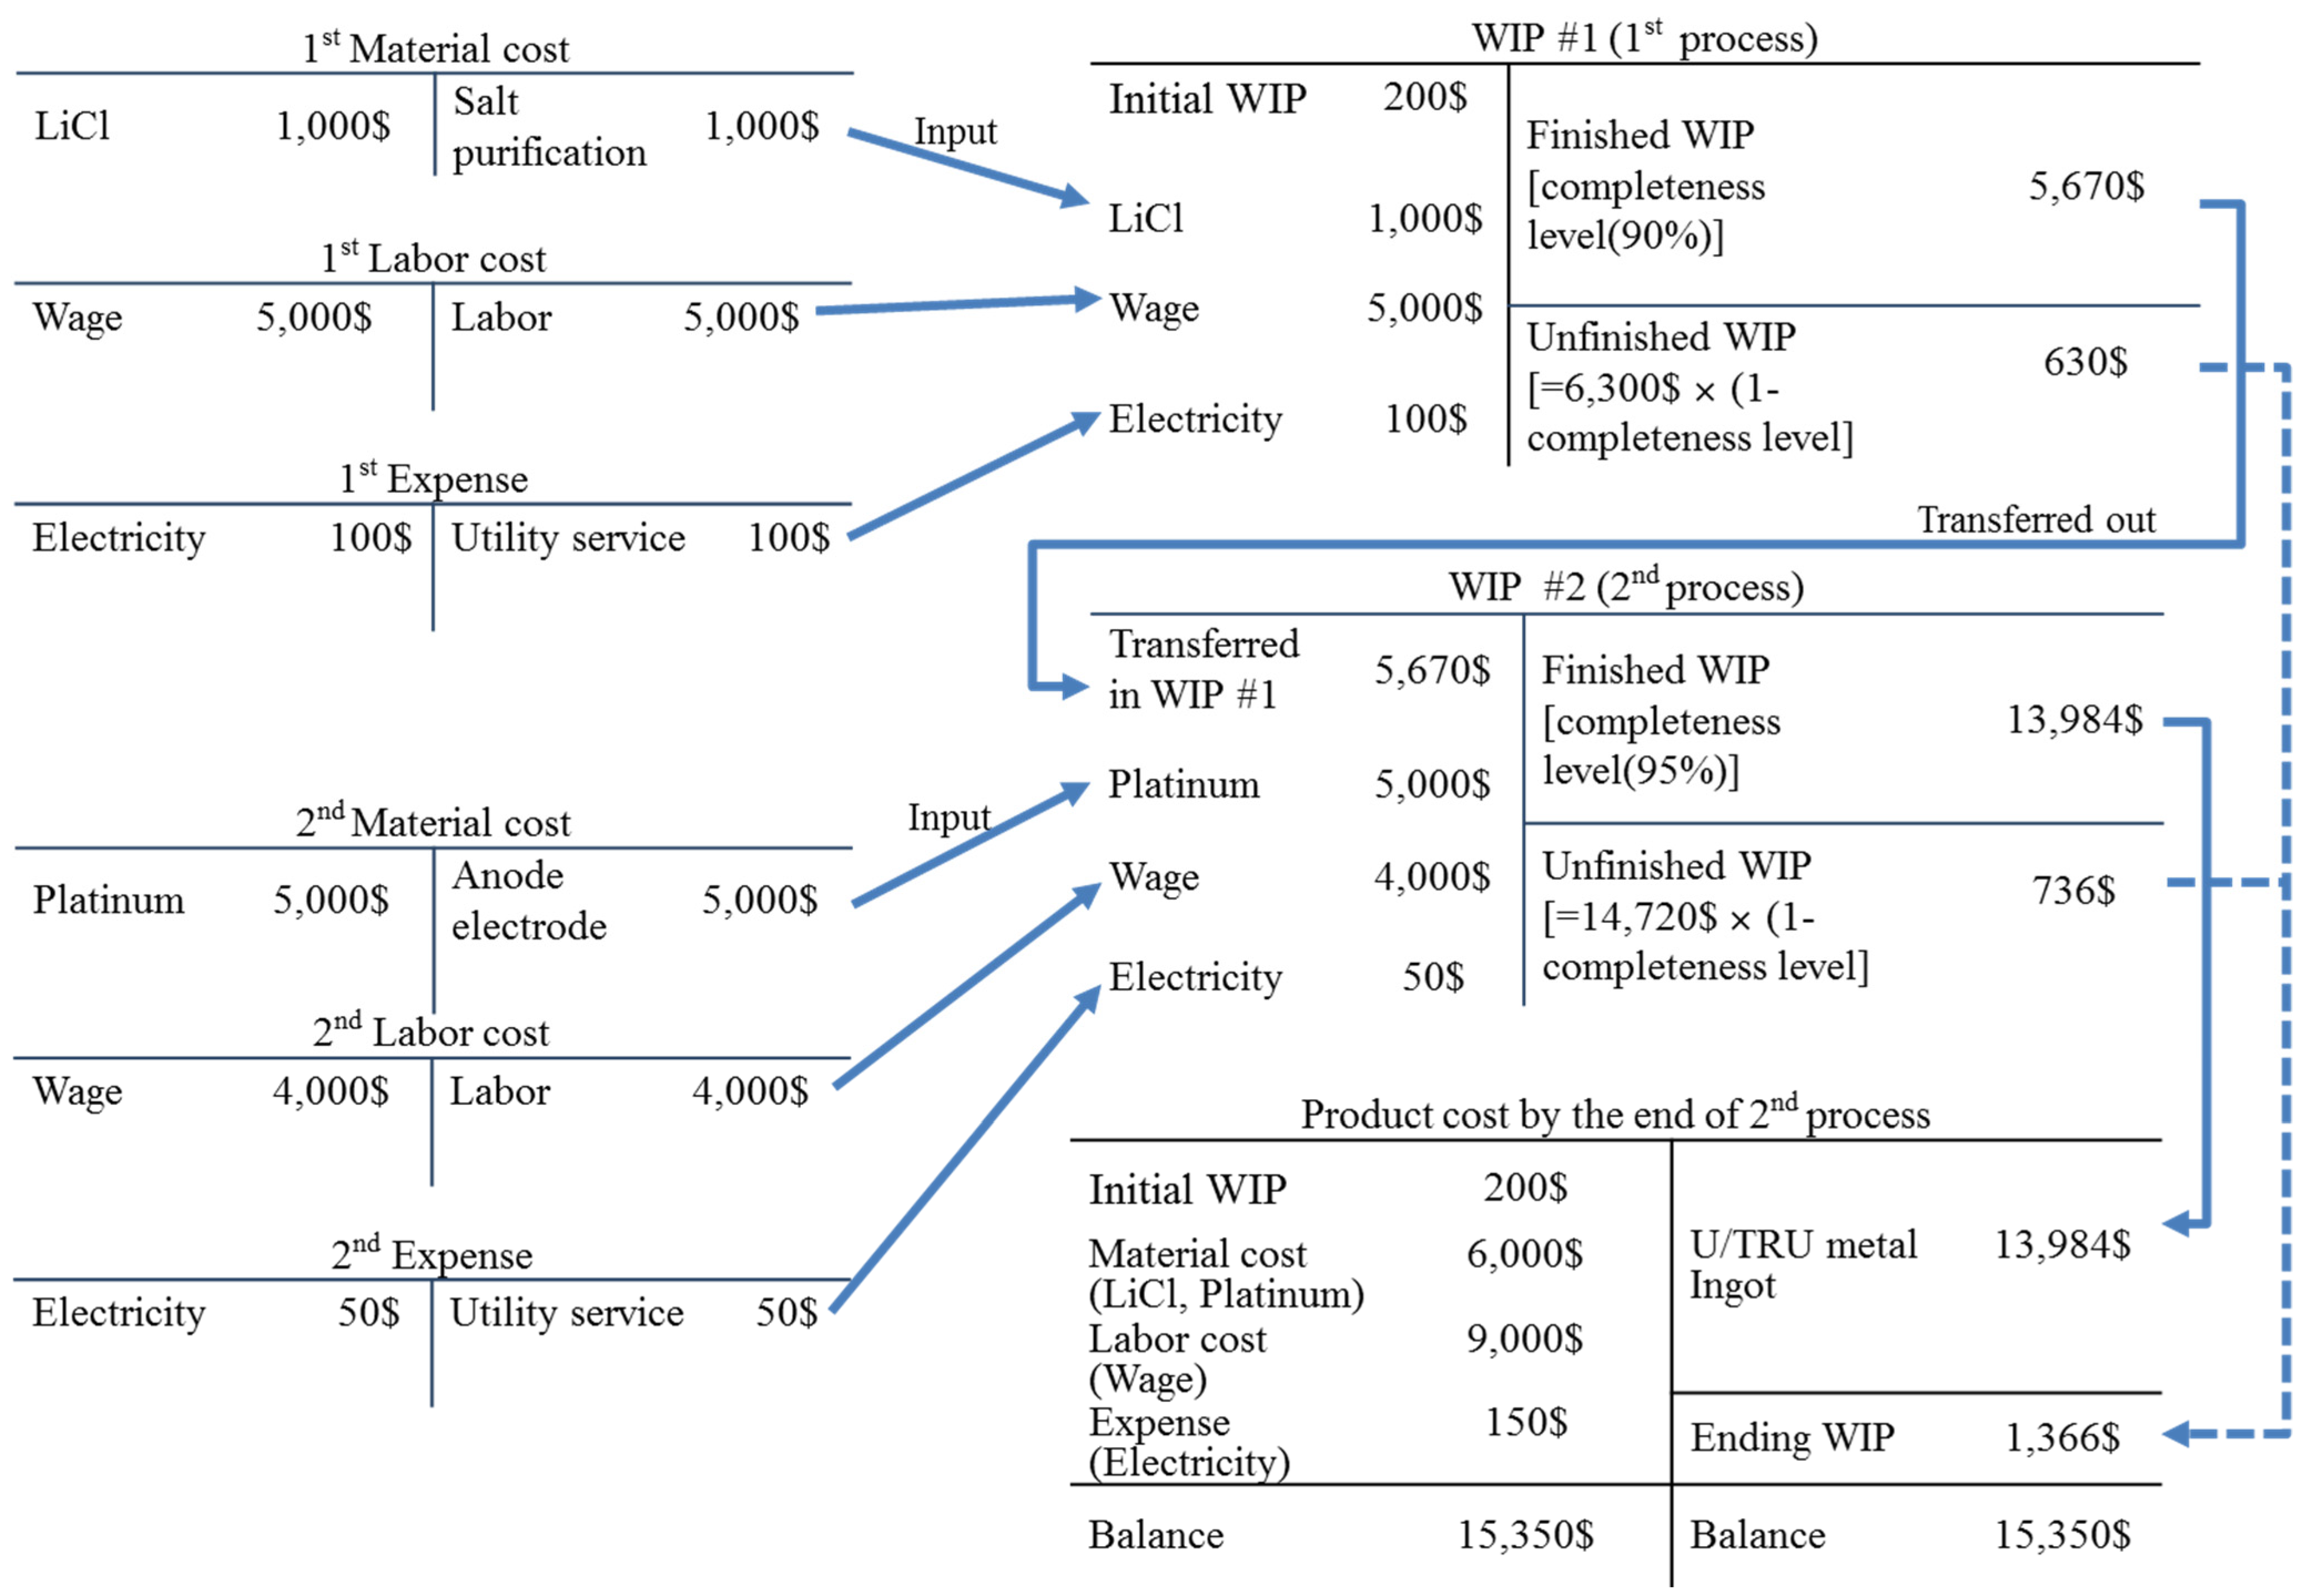
The following is a simple example of production using two continuous processes shown to increase our understanding of the process costing method. Direct material cost and direct labor cost, which are used in the first process, and are levied to the Work-In-Process (WIP), accounts for the first process’ production part, and the indirect manufacturing cost is distributed by the predetermined overhead rate [
21]. When the first process is completed, the Work-In Process produced in the first process is delivered to the second process. Thus, the Work-In Process cost of the first process is replaced by the WIP accounts of the second process. Moreover, direct material, direct labor, and indirect manufacturing costs used during the second process are levied to the WIP of the second process [
22]. Accordingly, it is possible to calculate the product cost since the product is completed when the production of the second process is completed. When this type of calculation method is applied to pyroprocessing, it is possible to calculate all costs required from the pretreatment of spent nuclear fuel to the electrowinning, which can be calculated by each unit process.
Figure 4 shows the cost flow in pyroprocessing. The left side and right side in the T-account as shown in
Figure 4 mean the debtor and the creditor, respectively.
Figure 4.
Flow of costs in pyroprocessing.
Figure 4.
Flow of costs in pyroprocessing.
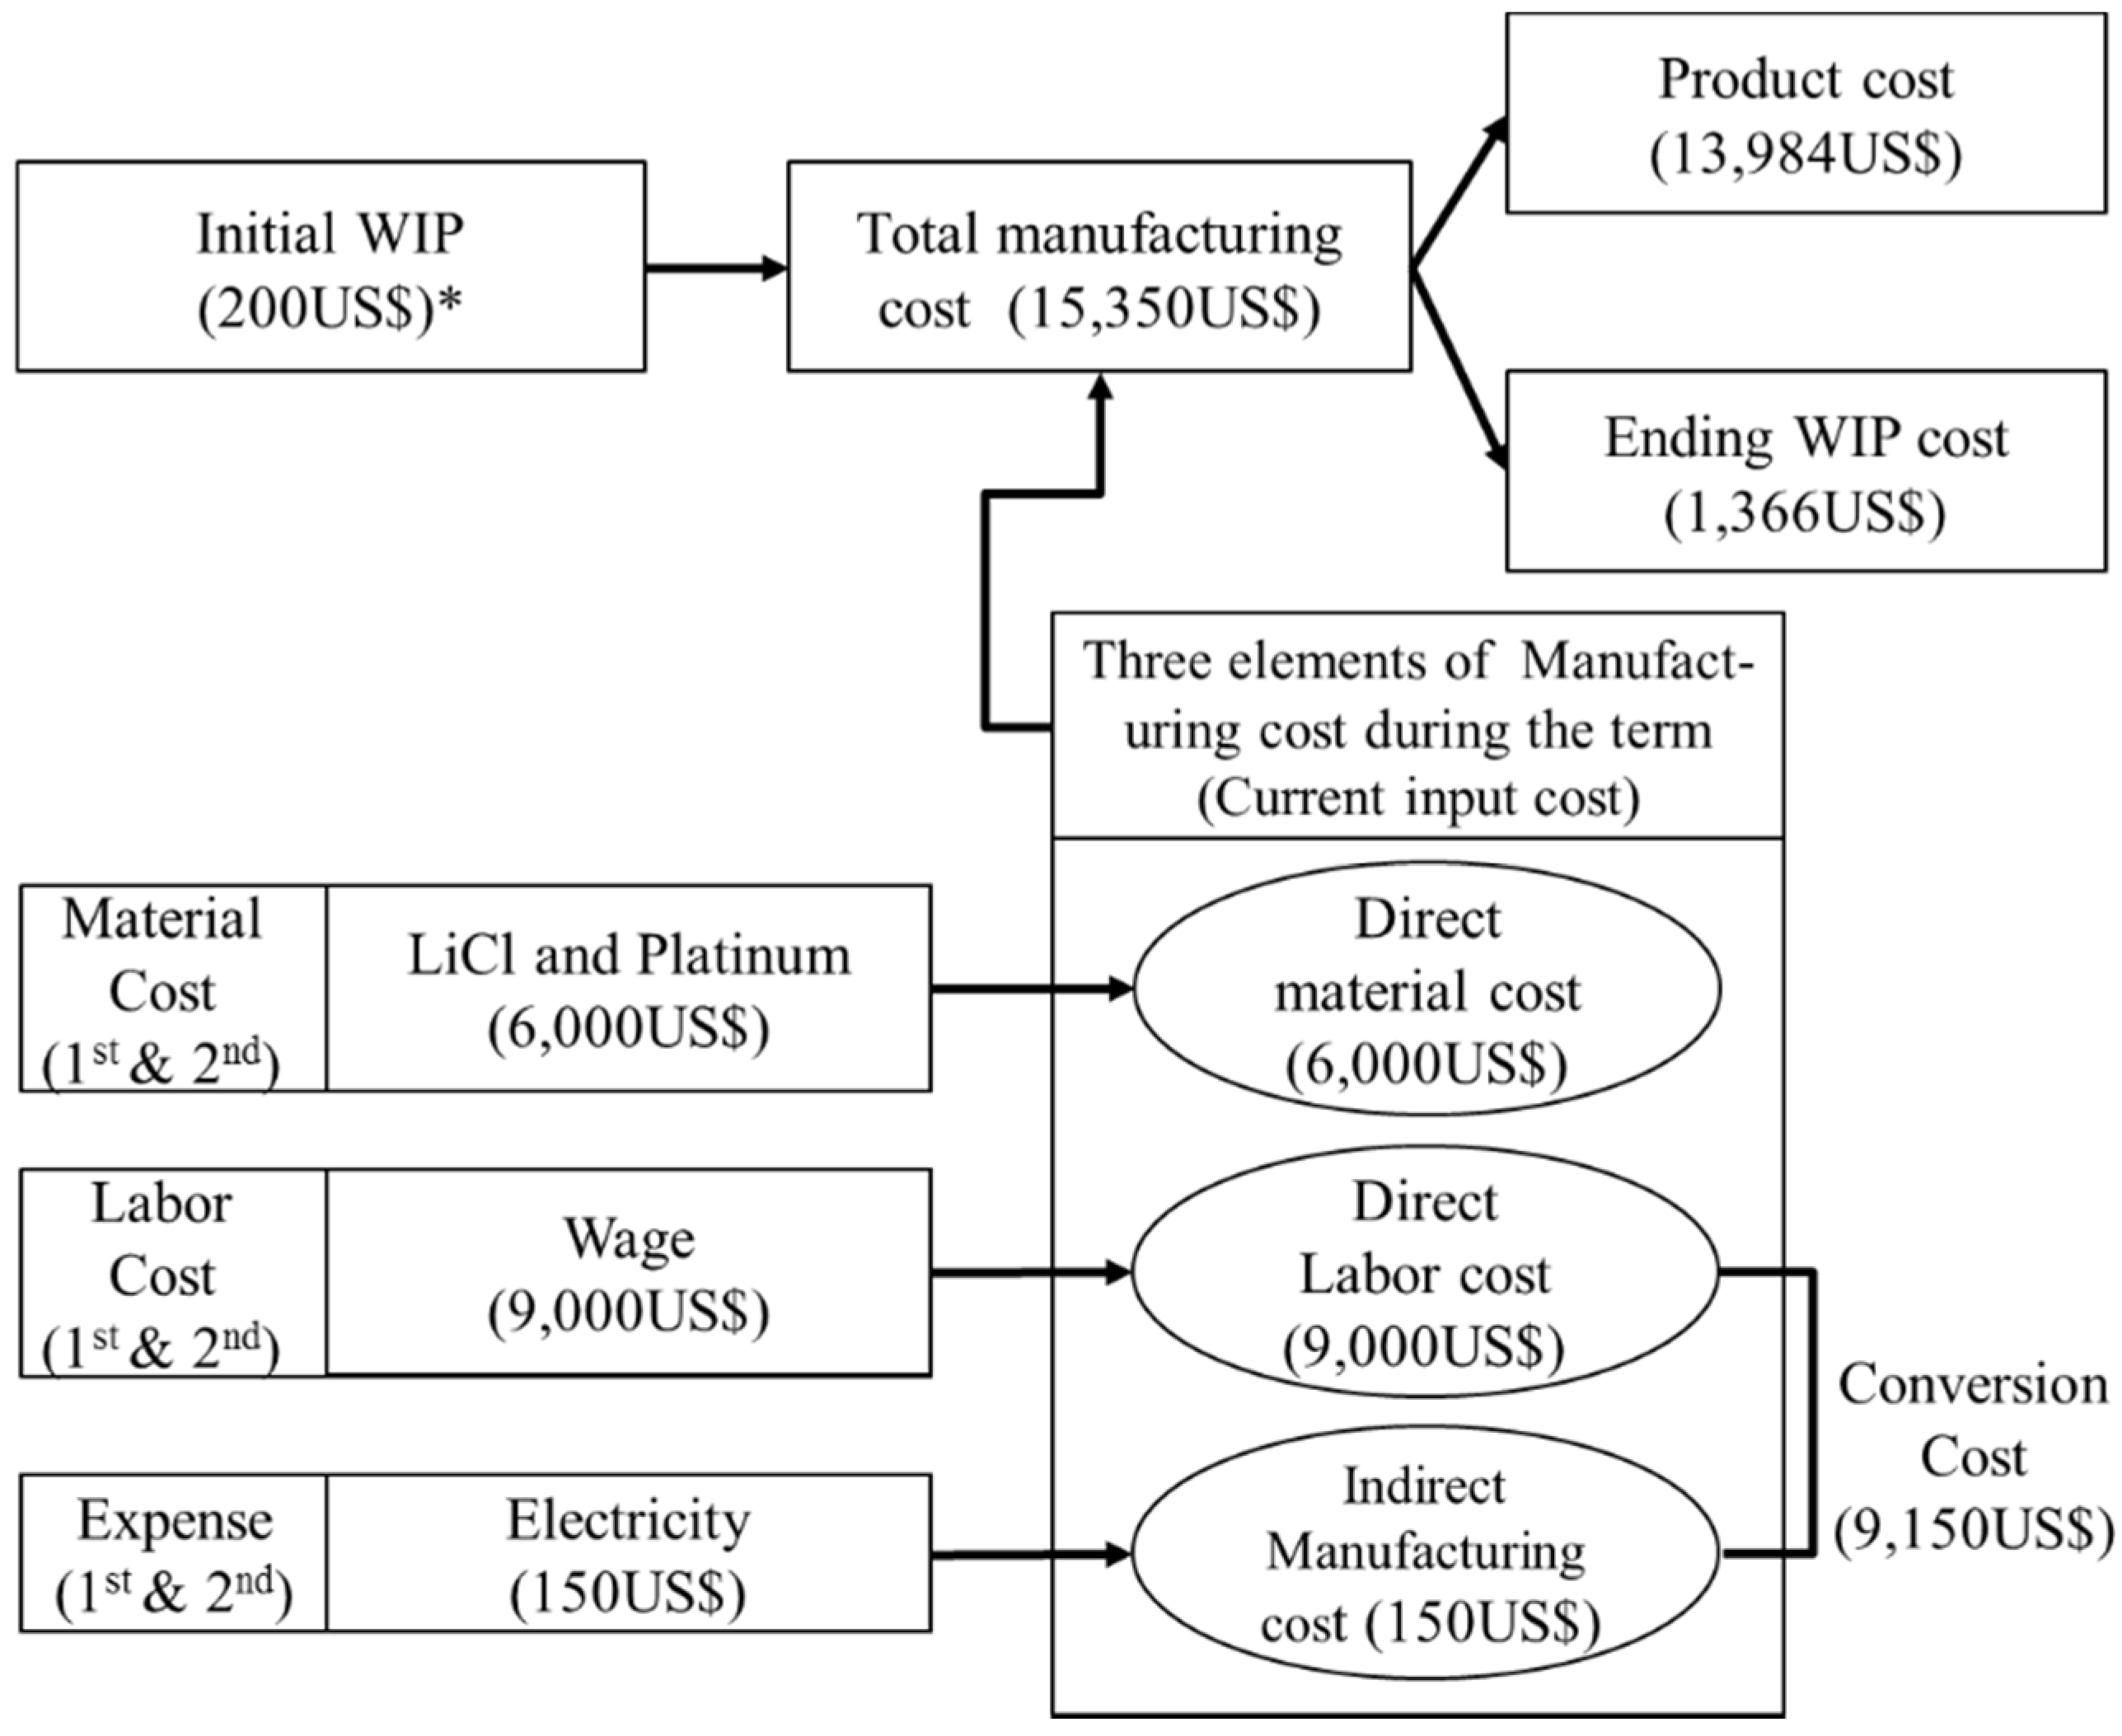
As for the process costing method, the cost in the Work-In-Process (WIP) accounts is replaced with the product accounts when the last unit process is completed. Moreover, the unit cost refers to the total average cost generated for one unit product, and the indirect manufacturing cost is distributed by referring to the manufacturing cost report. In other words, the WIP’s completeness level is factored to calculate the equivalent units of product. Then, the finished product cost and ending WIP cost are calculated. The manufacturing cost report is a summary of the cost information including the production volume by each process, unit cost, finished product cost, and ending WIP cost by the process are included. Moreover, other information needed for a cost allocation is included as well. Equivalent units of product used in the process costing method act as a parameter that can measure the amount of work that is being carried out in the production activity presently as the core element of the process cost that factors into the cost calculation. In general, the manufacturing cost is comprised of the direct material, direct labor, and indirect manufacturing costs [
22], which are the three cost elements, as shown in
Figure 5. The capital cost belongs to the expenses through capitalizing as depreciation costs. In addition, the labor costs as well as the utility service costs belong to the conversion costs.
These costs are not input as a consistent ratio in the production process. In other words, direct material cost starts from the point when the production process starts. Meanwhile, direct labor and indirect manufacturing costs are input during the entire production process. Accordingly, when all of the direct material costs are input during the initial stage of the production, the initial WIP’s completeness level is calculated as 100%. However, the conversion activity is input during the entire production process. Thus, the conversion completeness level is determined by the processing activity’s completeness level. For example, when the conversion activity completed is 60%, the product’s completeness level is 60%. When equivalent units of product are calculated by applying this concept, the WIP is calculated as the equivalent units of product of the 60 units by factoring in the 60% completeness level when 100 units are produced in terms of the production process. Thus, the process costing method calculates the cost by converting the direct material cost and conversion cost into the equivalent units of product instead of calculating the cost with the number of input units.
Figure 5.
The three element of manufacturing cost (*: US$ in parenthesis indicate the costs in
Figure 4).
Figure 5.
The three element of manufacturing cost (*: US$ in parenthesis indicate the costs in
Figure 4).
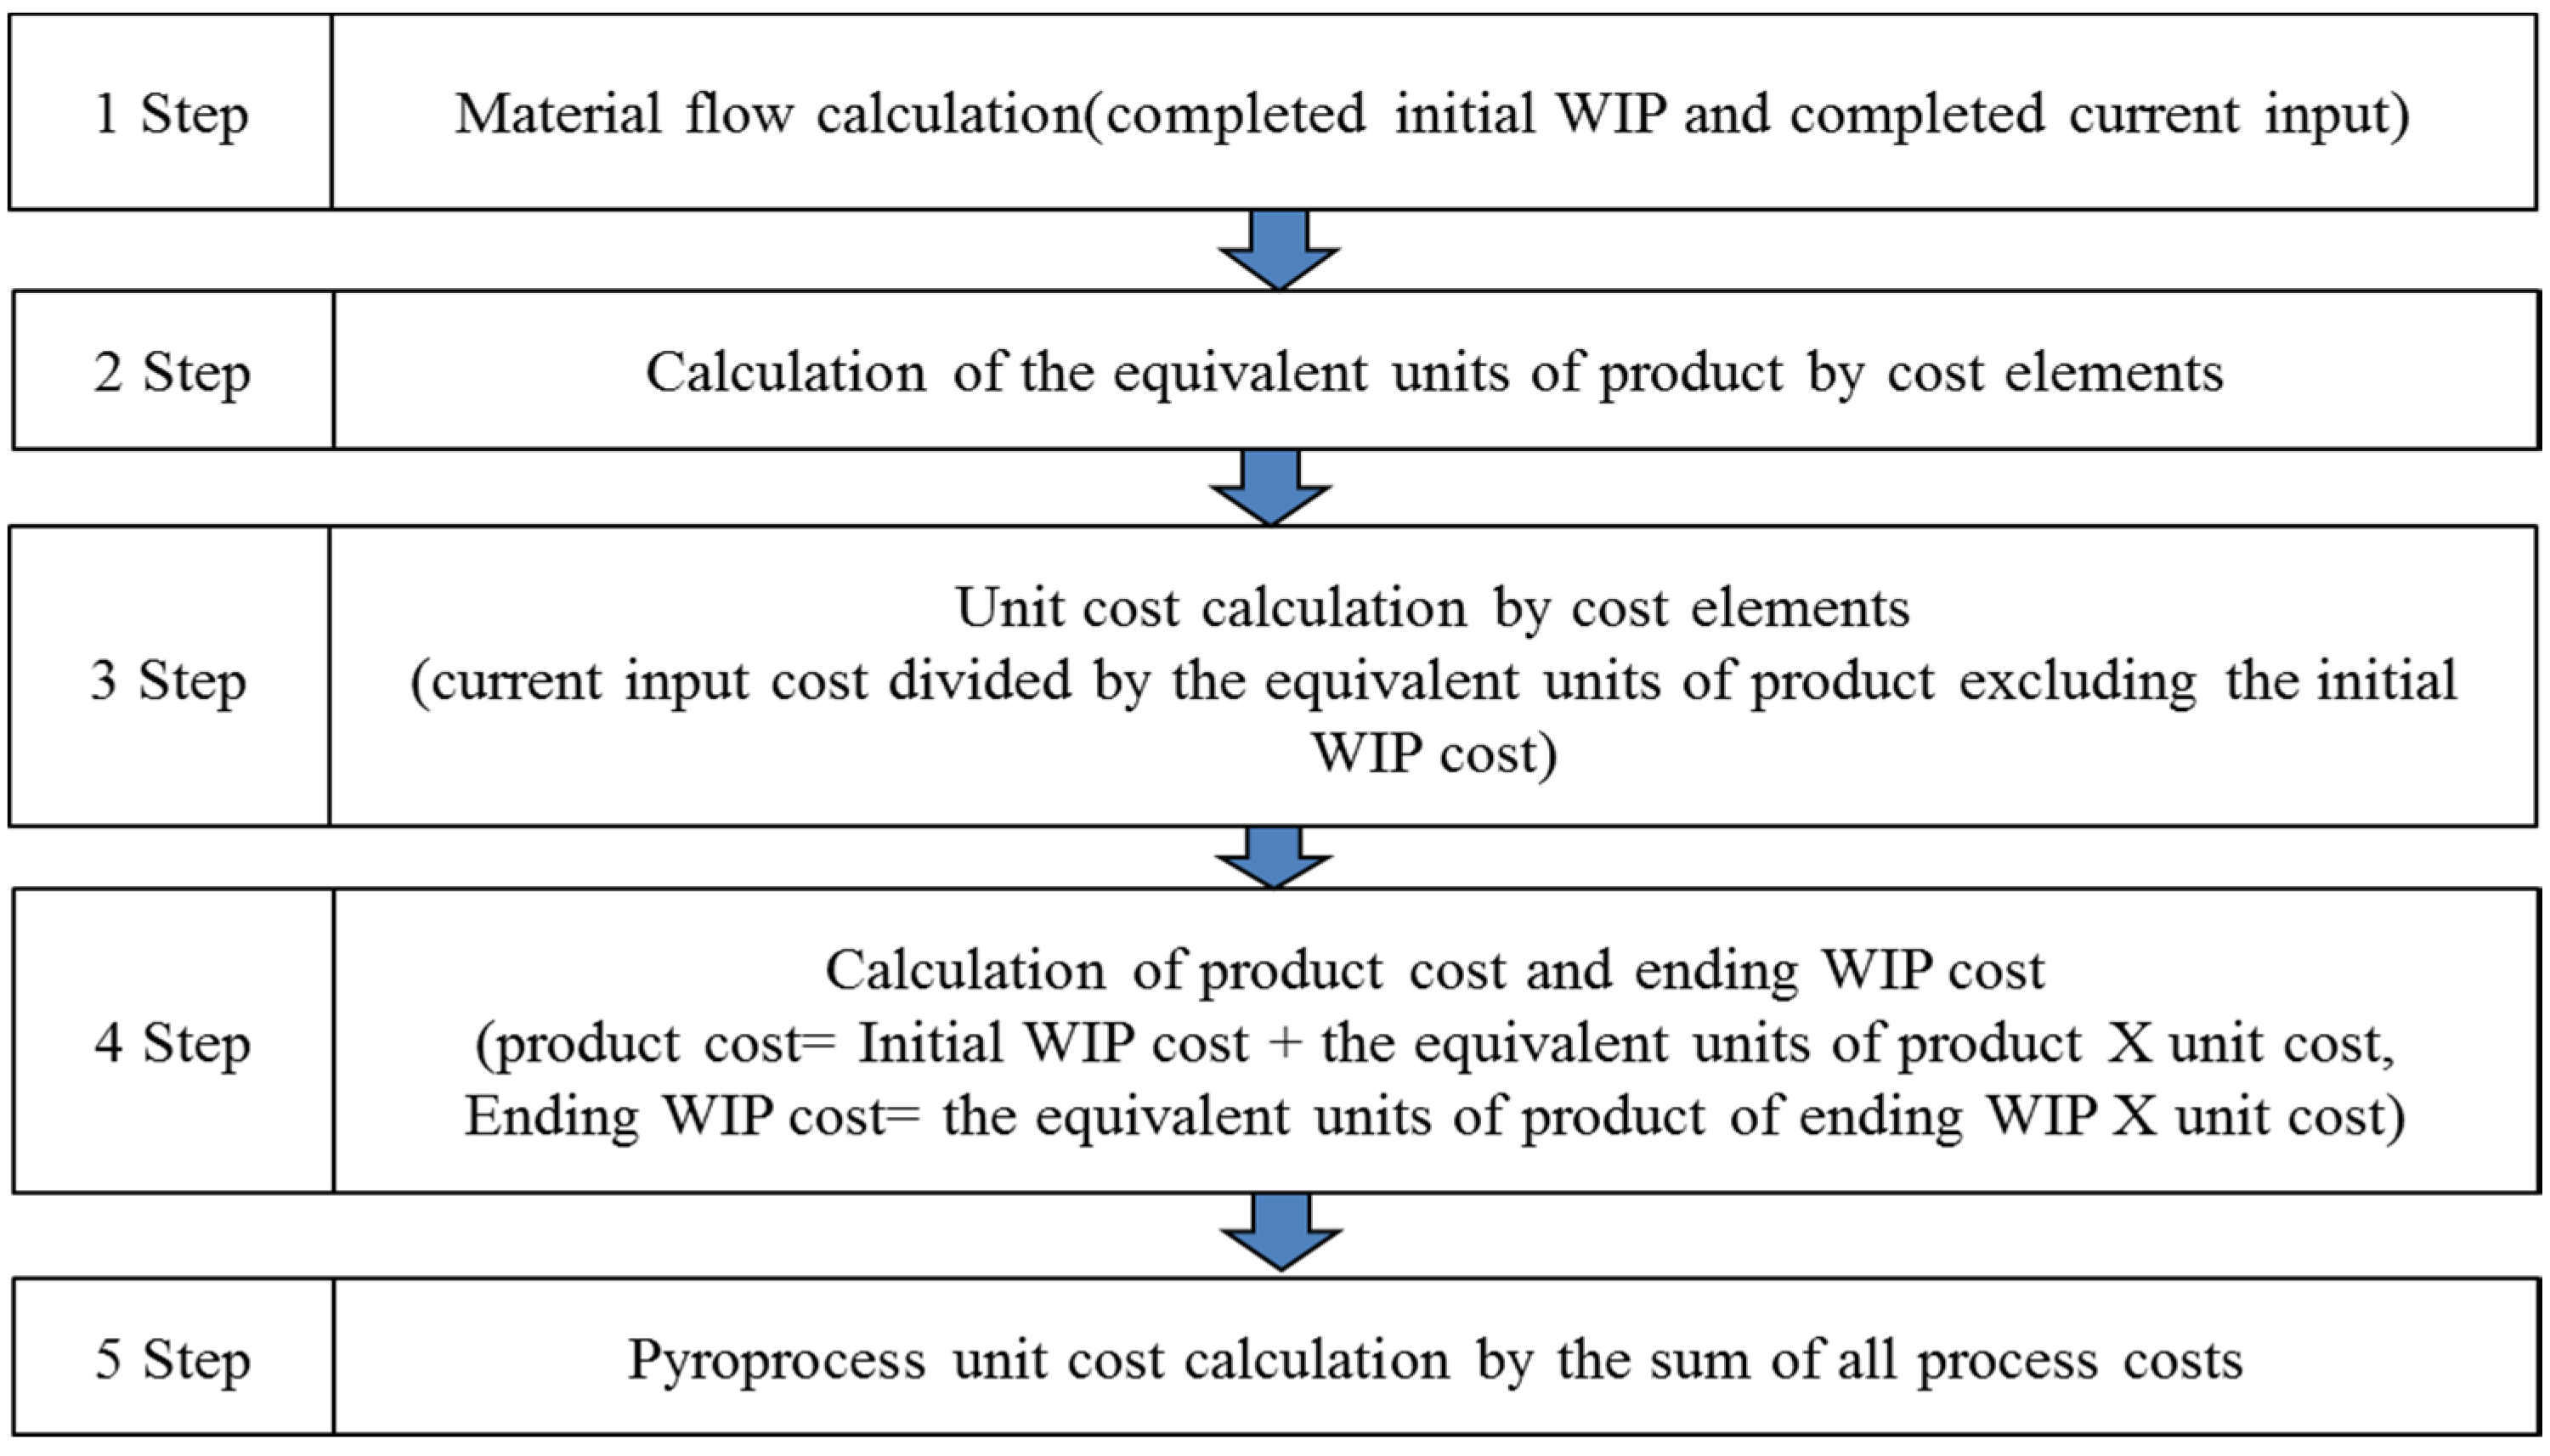
A flow chart of the process costing method is shown in
Figure 6.
Figure 6.
The procedure of a process costing method using First-In First-Out method.
Figure 6.
The procedure of a process costing method using First-In First-Out method.
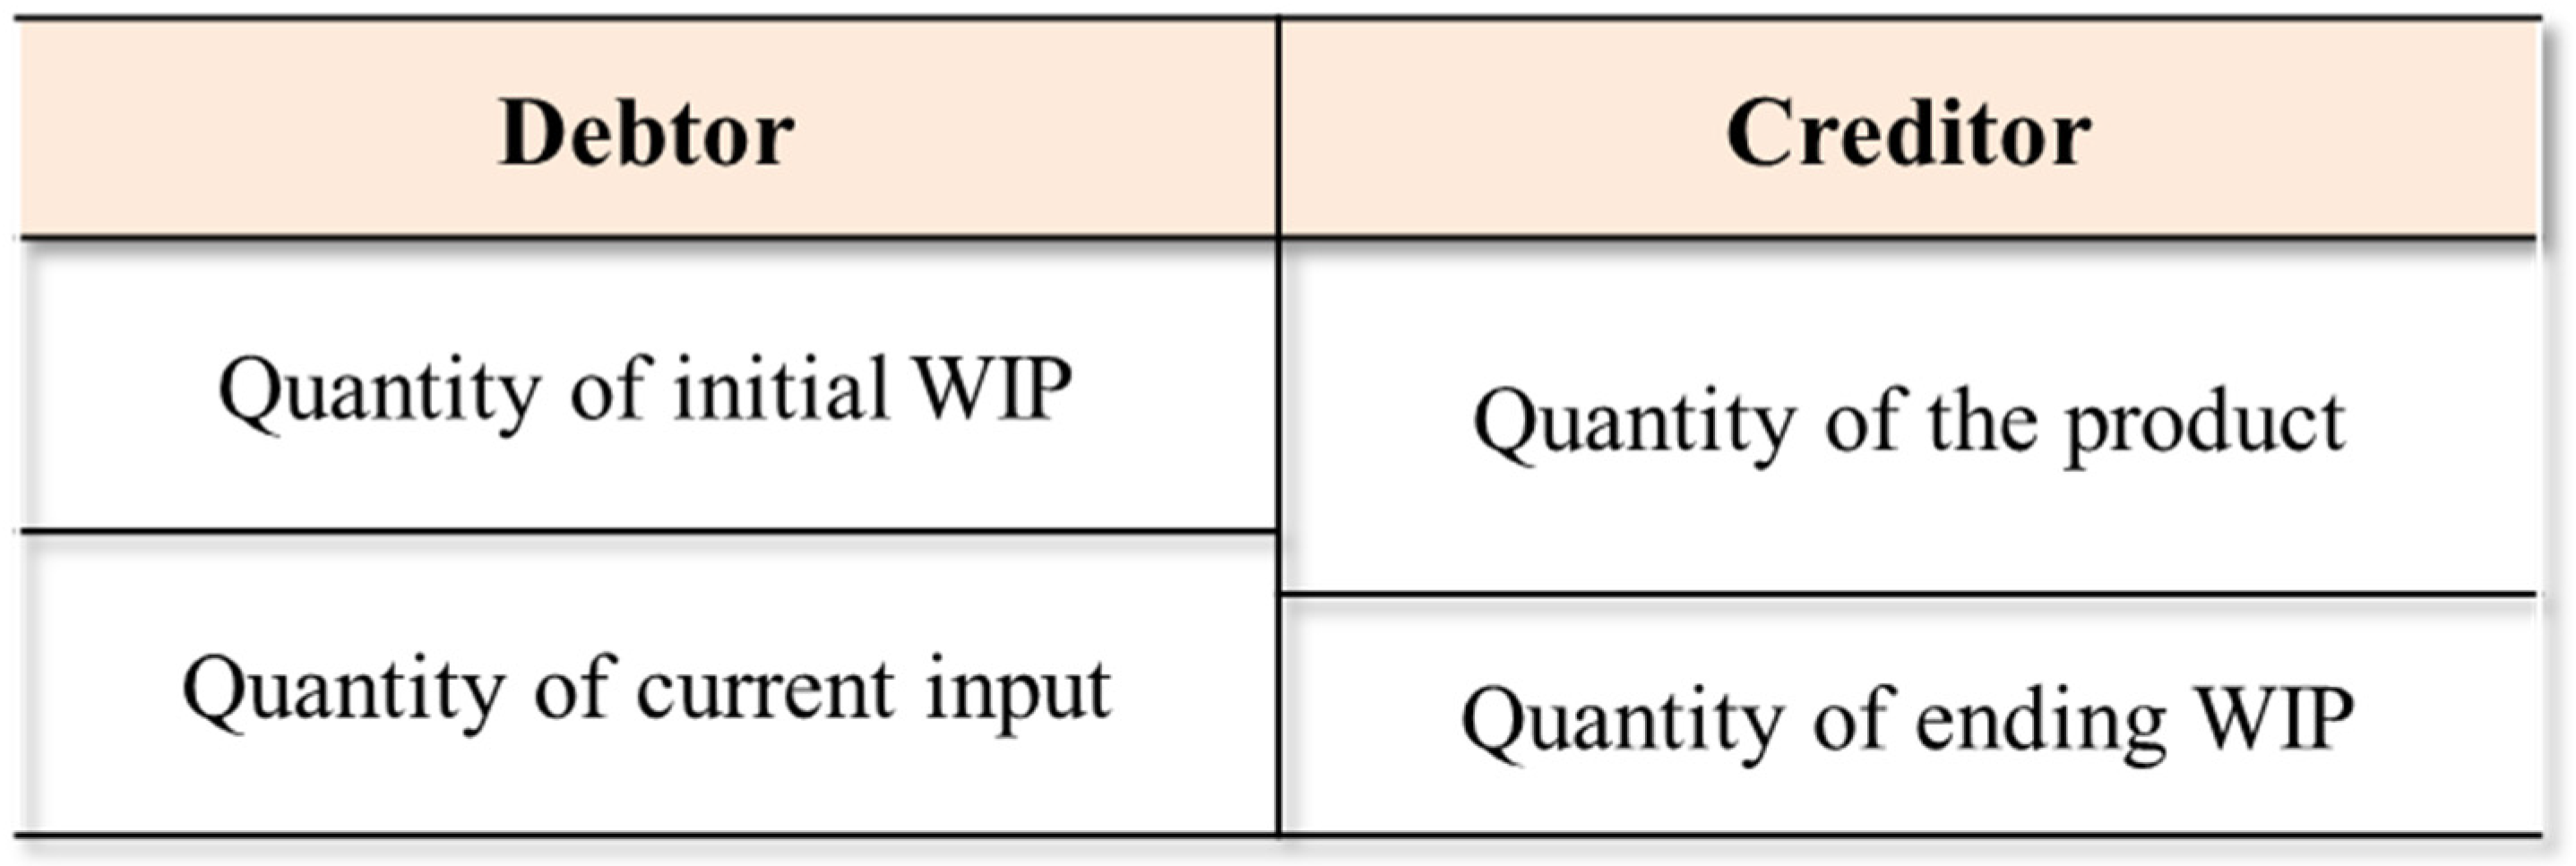
The process cost can be classified into the finished product cost that already underwent the product process and the WIP cost (ending WIP) that is still in product, as shown in
Figure 7. Such costs are used to calculate the unit process cost that is incurred during the continuous process. Accordingly, the pyroprocess cost is classified into the direct material and conversion costs, as shown in Equation (1) [
23]. The conversion cost is classified into the labor and indirect costs once again, as shown in Equation (2) [
23]:
where
= total cost of the pyroprocess (unit: US$),
= time (from the beginning of the year by year’s end),
= the direct material cost (including WIP) of the
i-th process at time
t (unit: US$), and
= the conversion cost (including the manufacturing cost during the term) of the
j-th process at time
t (unit: US$):
where
= the direct labor cost of the
j-th process at time
t (unit: US$), and
= the indirect manufacturing cost of the
j-th process at time
t (unit: US$).
Figure 7.
T-account for the quantity of product.
Figure 7.
T-account for the quantity of product.
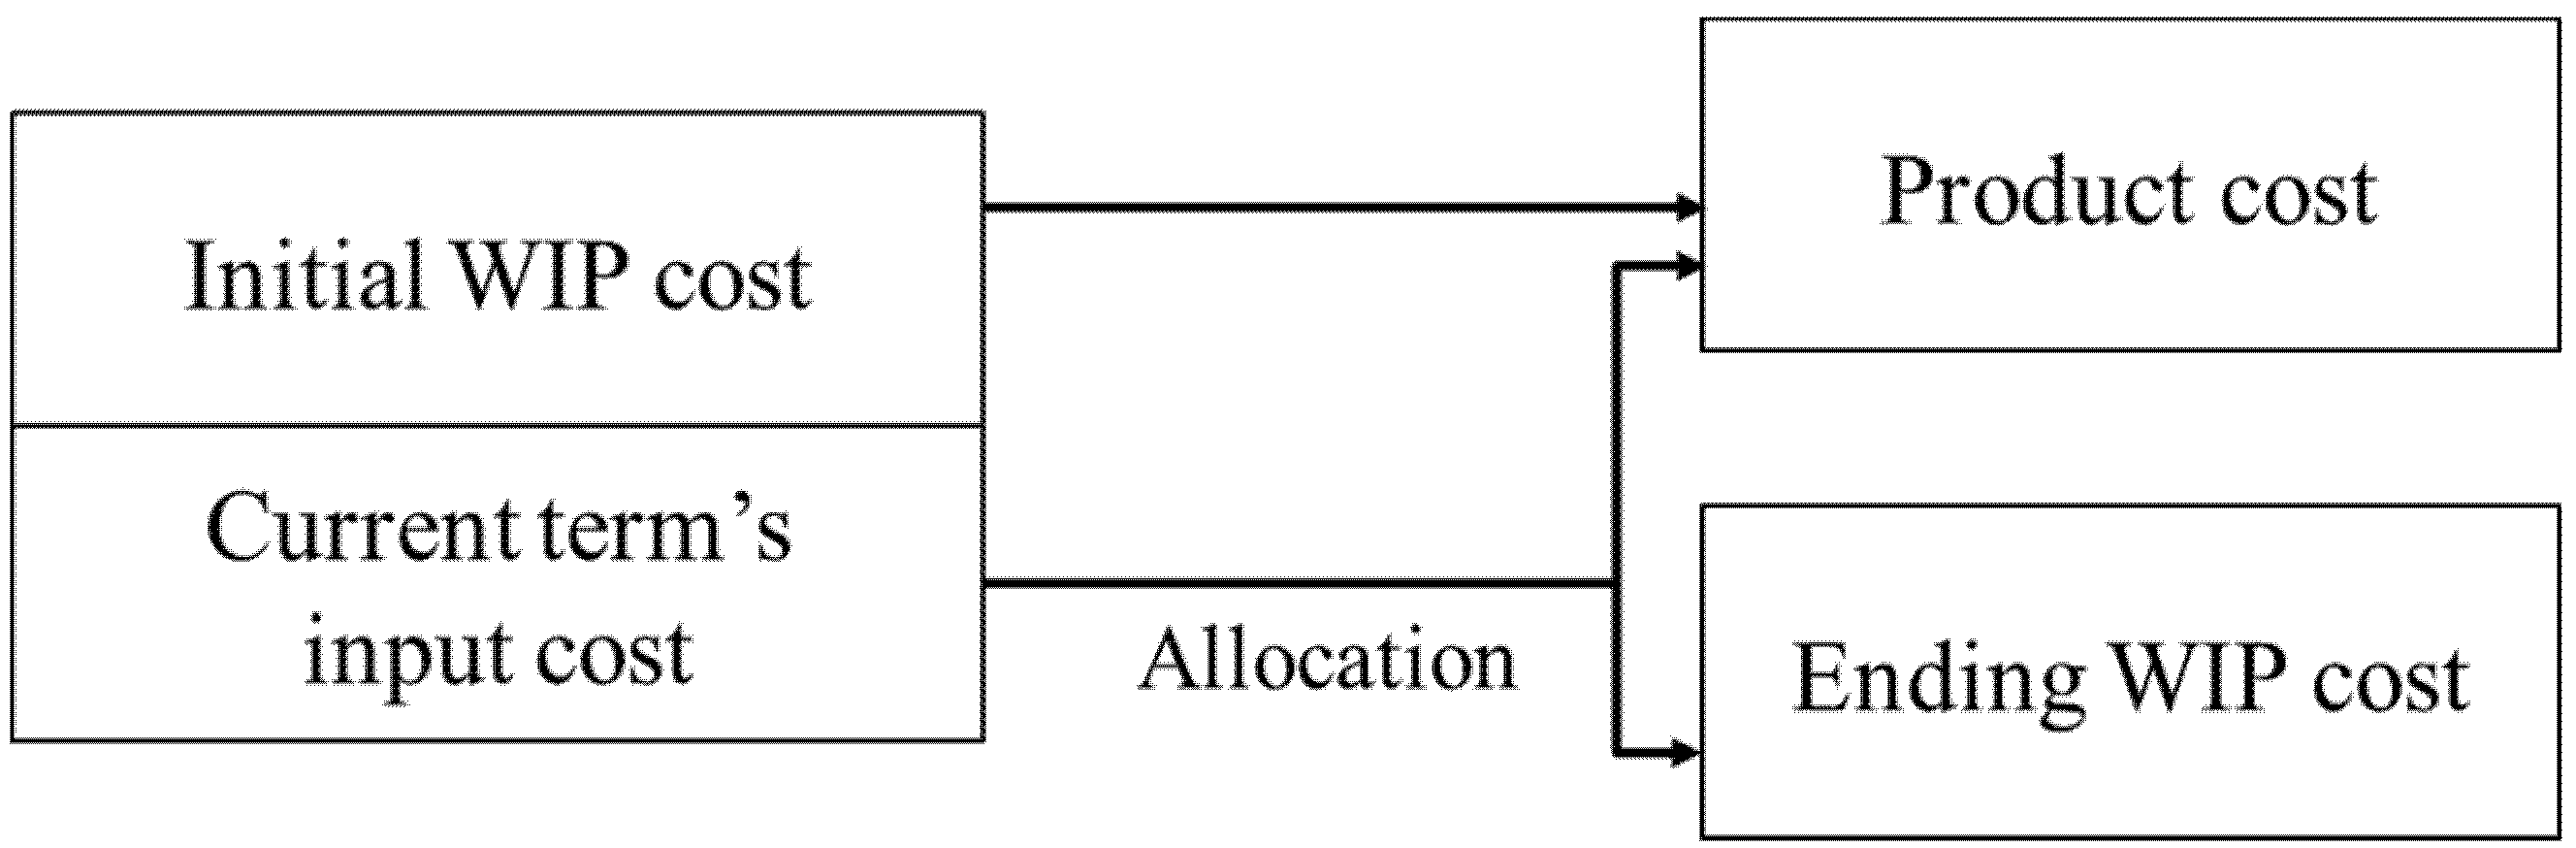
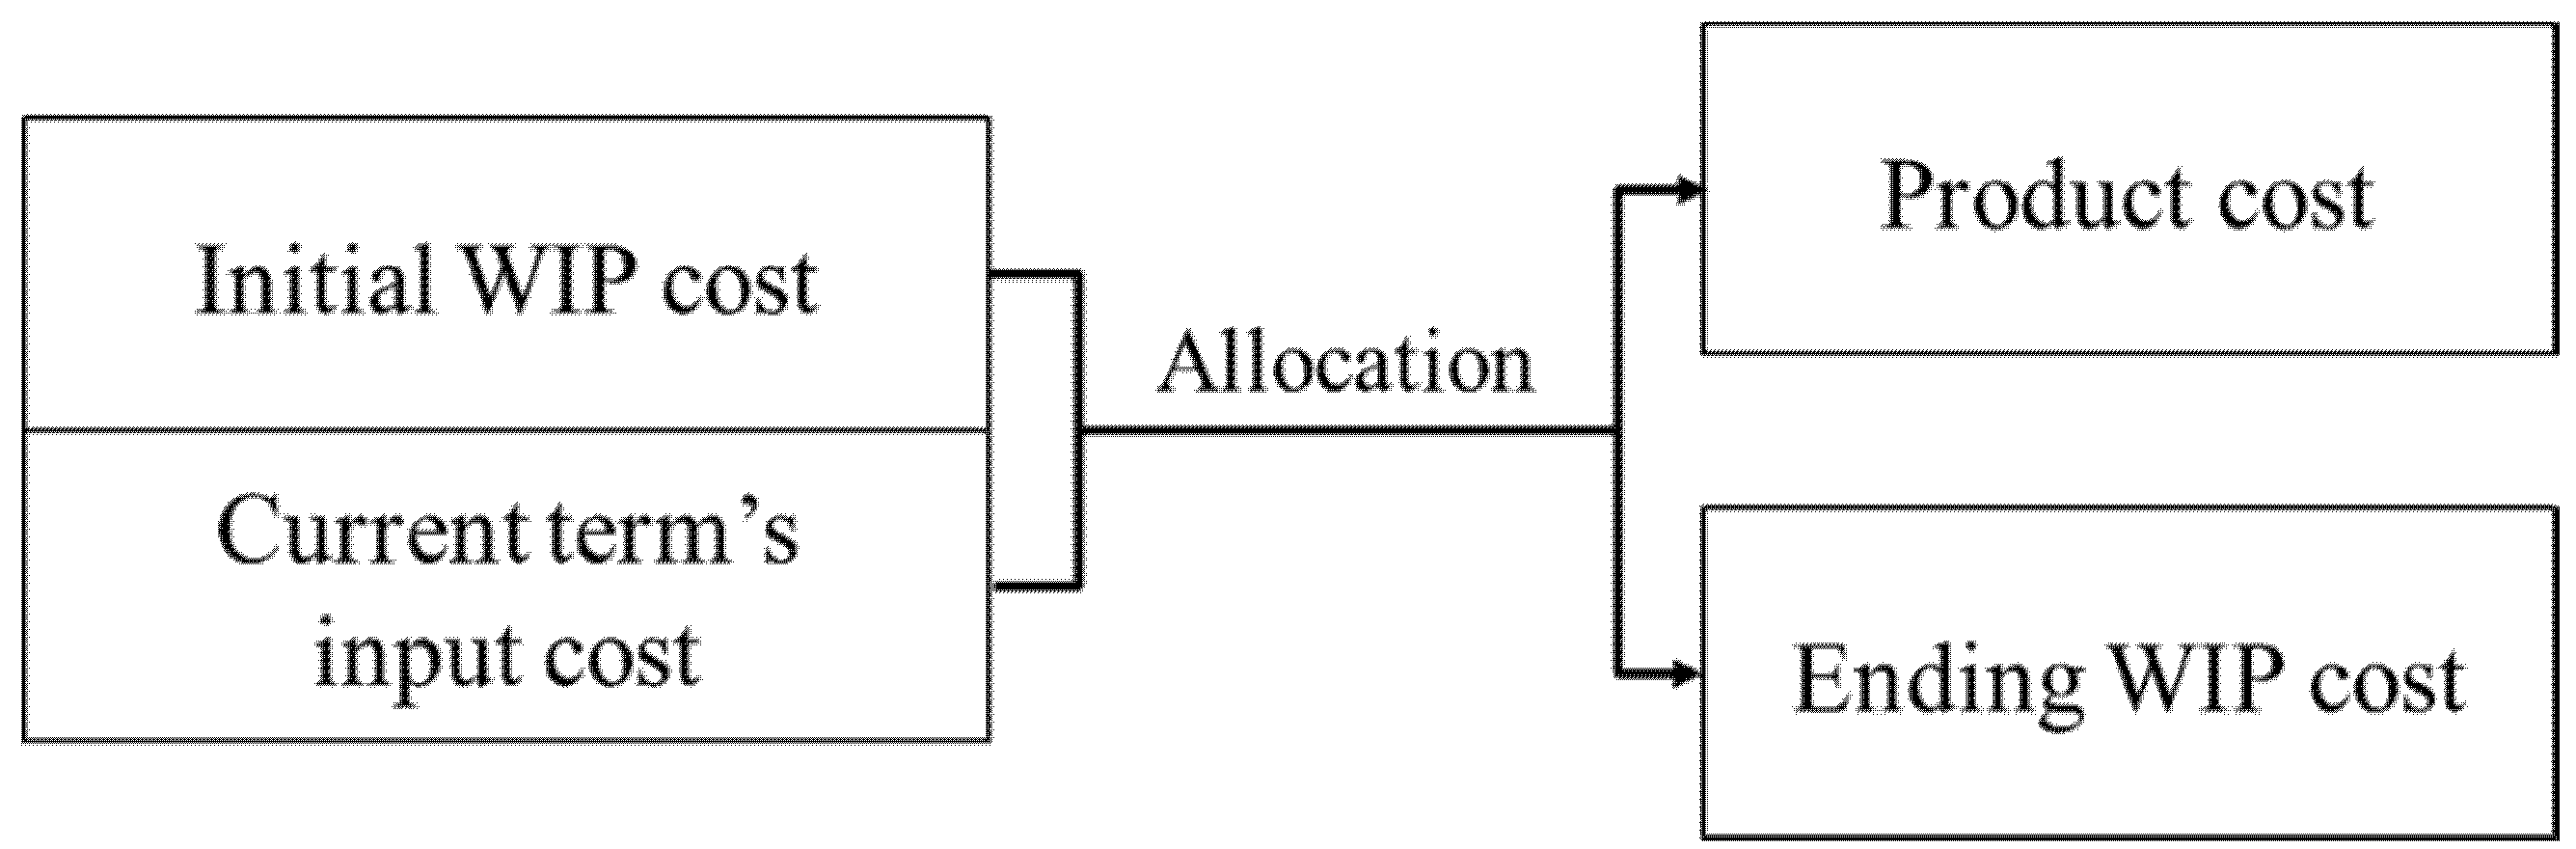
Thus, the initial WIP cost, including the raw material cost, can be calculated by using both the weighted average method and First-In First-Out method according to the process costing method. As shown
Figure 8, the foremost characteristic of the weighted average method is that it does not distinguish the initial WIP cost and current term’s input cost. In other words, the initial WIP cost and current term’s input cost are subjected to the weighted average to levy onto the debit accounts, and the finished product cost and ending WIP cost are input into the credit accounts [
19]. Accordingly, when the calculation of the material flow as the first stage to calculate the pyroprocess unit cost is expressed as the T-account, it is possible to be expressed, as shown in
Figure 7. As shown
Figure 9, meanwhile, in the First-In, First-Out method, the initial WIP cost is allocated to the finished product cost only. The cost of current term is allocated into the finished product cost and ending WIP cost.
Table 3 summarizes difference between weighed average method and First-In, First-Out method.
In the end, the First-In, First-Out method can estimate the unit process cost with the current term’s product performance. The cost calculation process is complicated compared with the weighted average method. On the other hand, the accuracy level of the cost estimation is high.
Table 4 shows the allocation ratios in each process.
Figure 8.
The cost allocation of weighted–average method.
Figure 8.
The cost allocation of weighted–average method.
Figure 9.
The cost allocation of First-In First-Out method.
Figure 9.
The cost allocation of First-In First-Out method.
Table 3.
The difference between weighted average method and First-In, First-Out method.
Table 3.
The difference between weighted average method and First-In, First-Out method.
| Weighted Average Method | First-In, First-Out Method |
|---|
| |
| |
| |
| |
Table 4.
Allocation ratios (completeness level) in each process.
Table 4.
Allocation ratios (completeness level) in each process.
| Process Name | Allocation Ratios: Completeness Level [unit: %] |
|---|
| Product Cost | Ending WIP Cost |
|---|
| Pretreatment | 93 | 7 |
| Electrochemical reduction | 94 | 6 |
| Electrorefining | 94 | 6 |
| Electrowinning | 95 | 5 |


