
Energy Efficiency Indicators for Assessing Construction Systems Storing Renewable Energy: Application to Phase Change Material-Bearing Façades


Abstract
:
1. Introduction
2. Phase Change Material (PCM)-Bearing Façade


3. Description of Indicators Proposed
3.1. Global Building Efficiency (GBE) Indicator
3.2. Global Façade Efficiency (GFE) Indicator
3.3. Partial Indicators

3.4. Supplementary Indicators
4. Estimates and Models
4.1. Estimates
4.2. Models

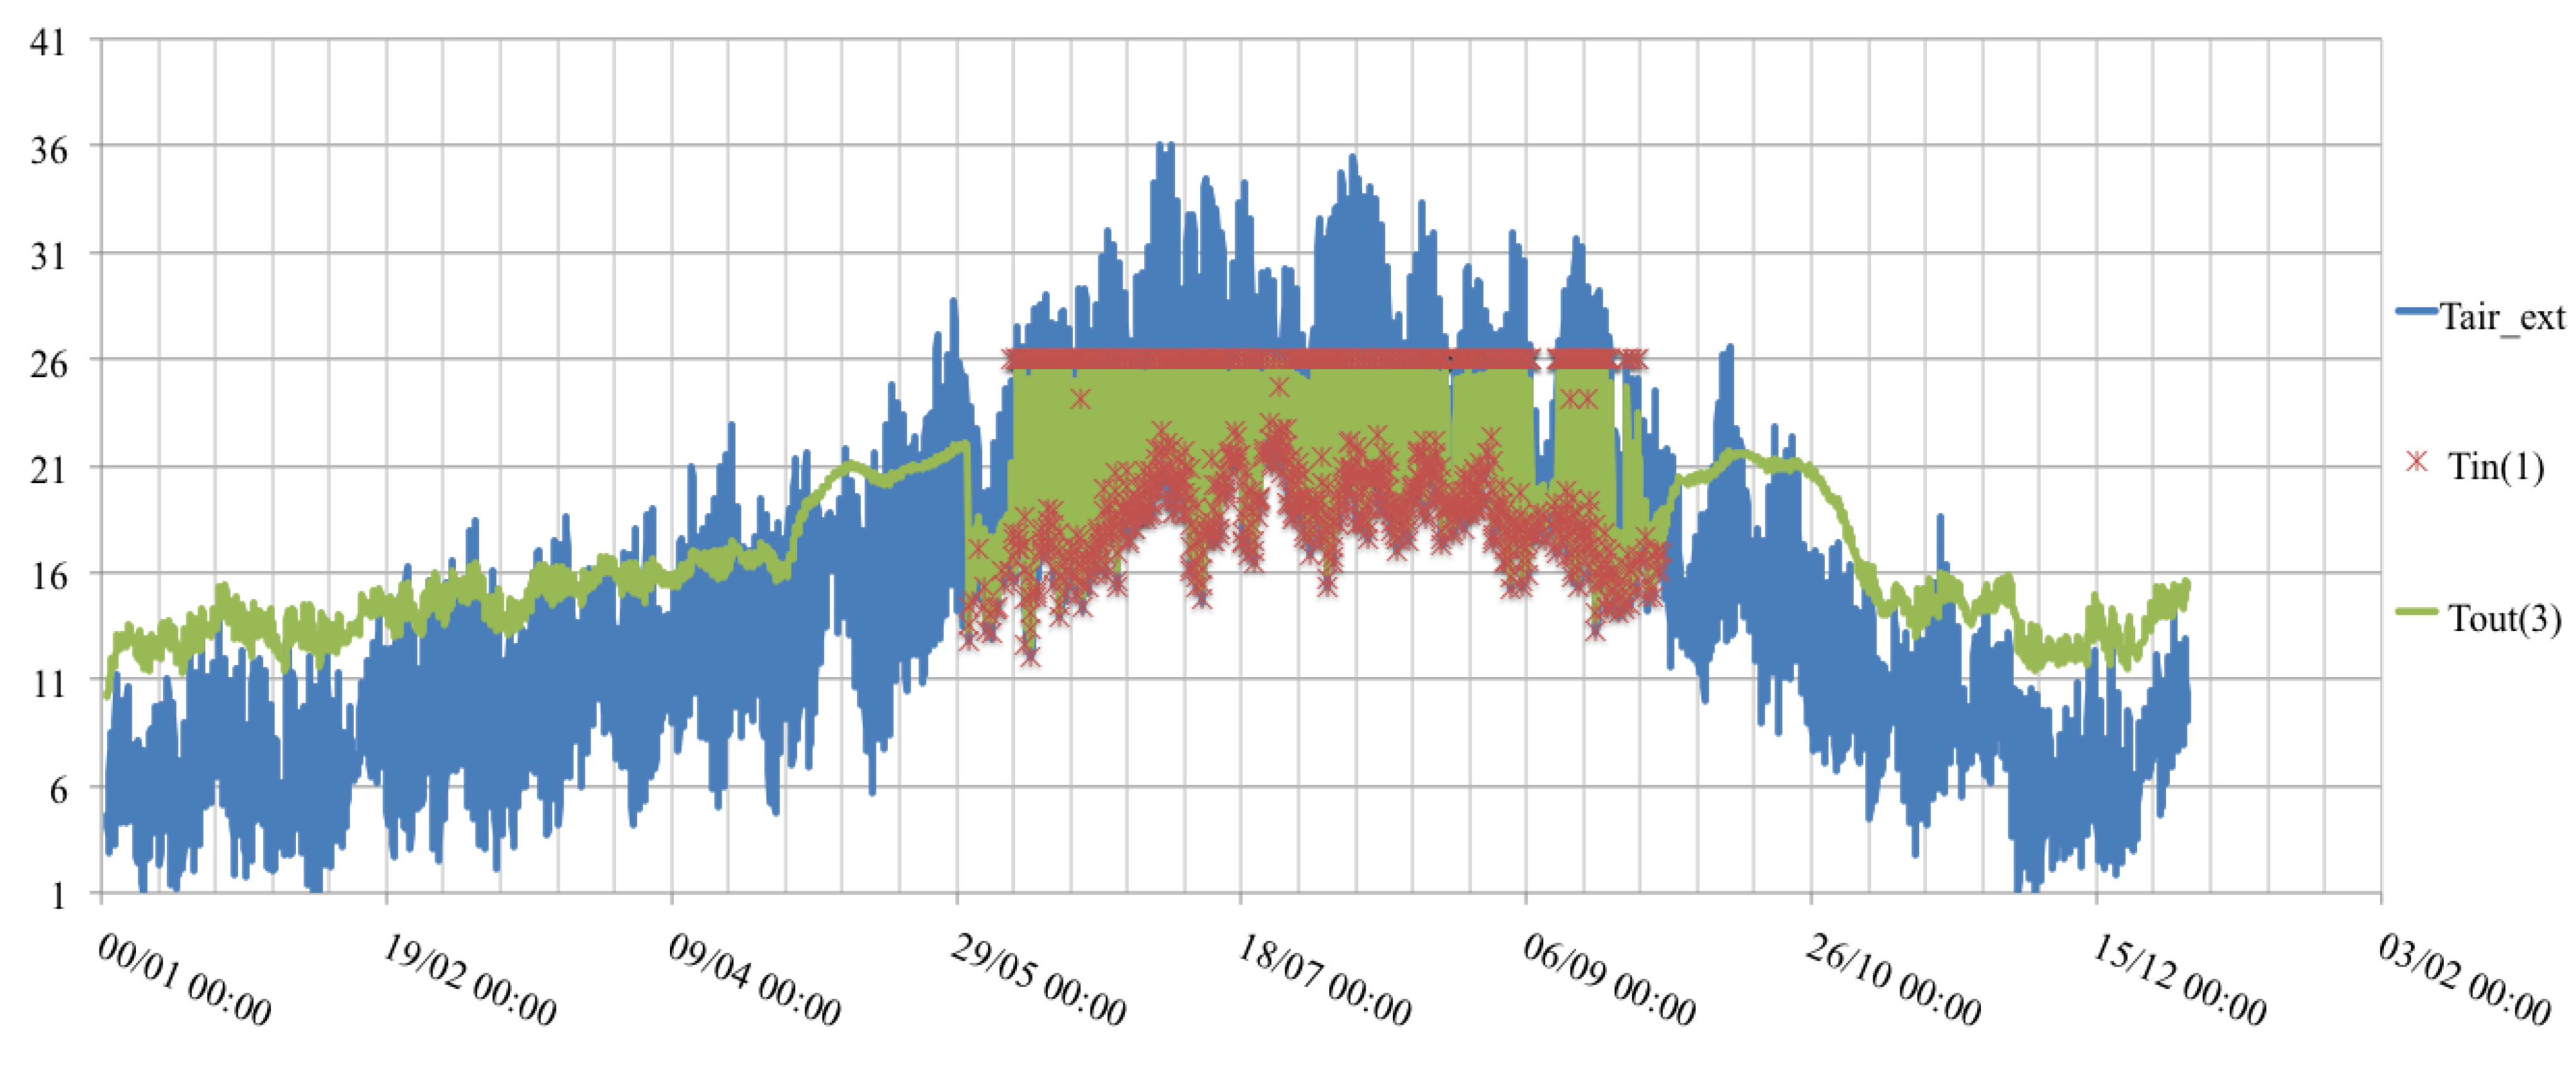
| Correlated with | Tout | TPCM (Section 1) | TPCM (Section 2) | TPCM (Section 3) |
|---|---|---|---|---|
| Experimental data | 0.987 | 0.989 | 0.977 | 0.973 |
| Detailed model | 0.988 | 0.986 | 0.970 | 0.978 |
5. Discussion
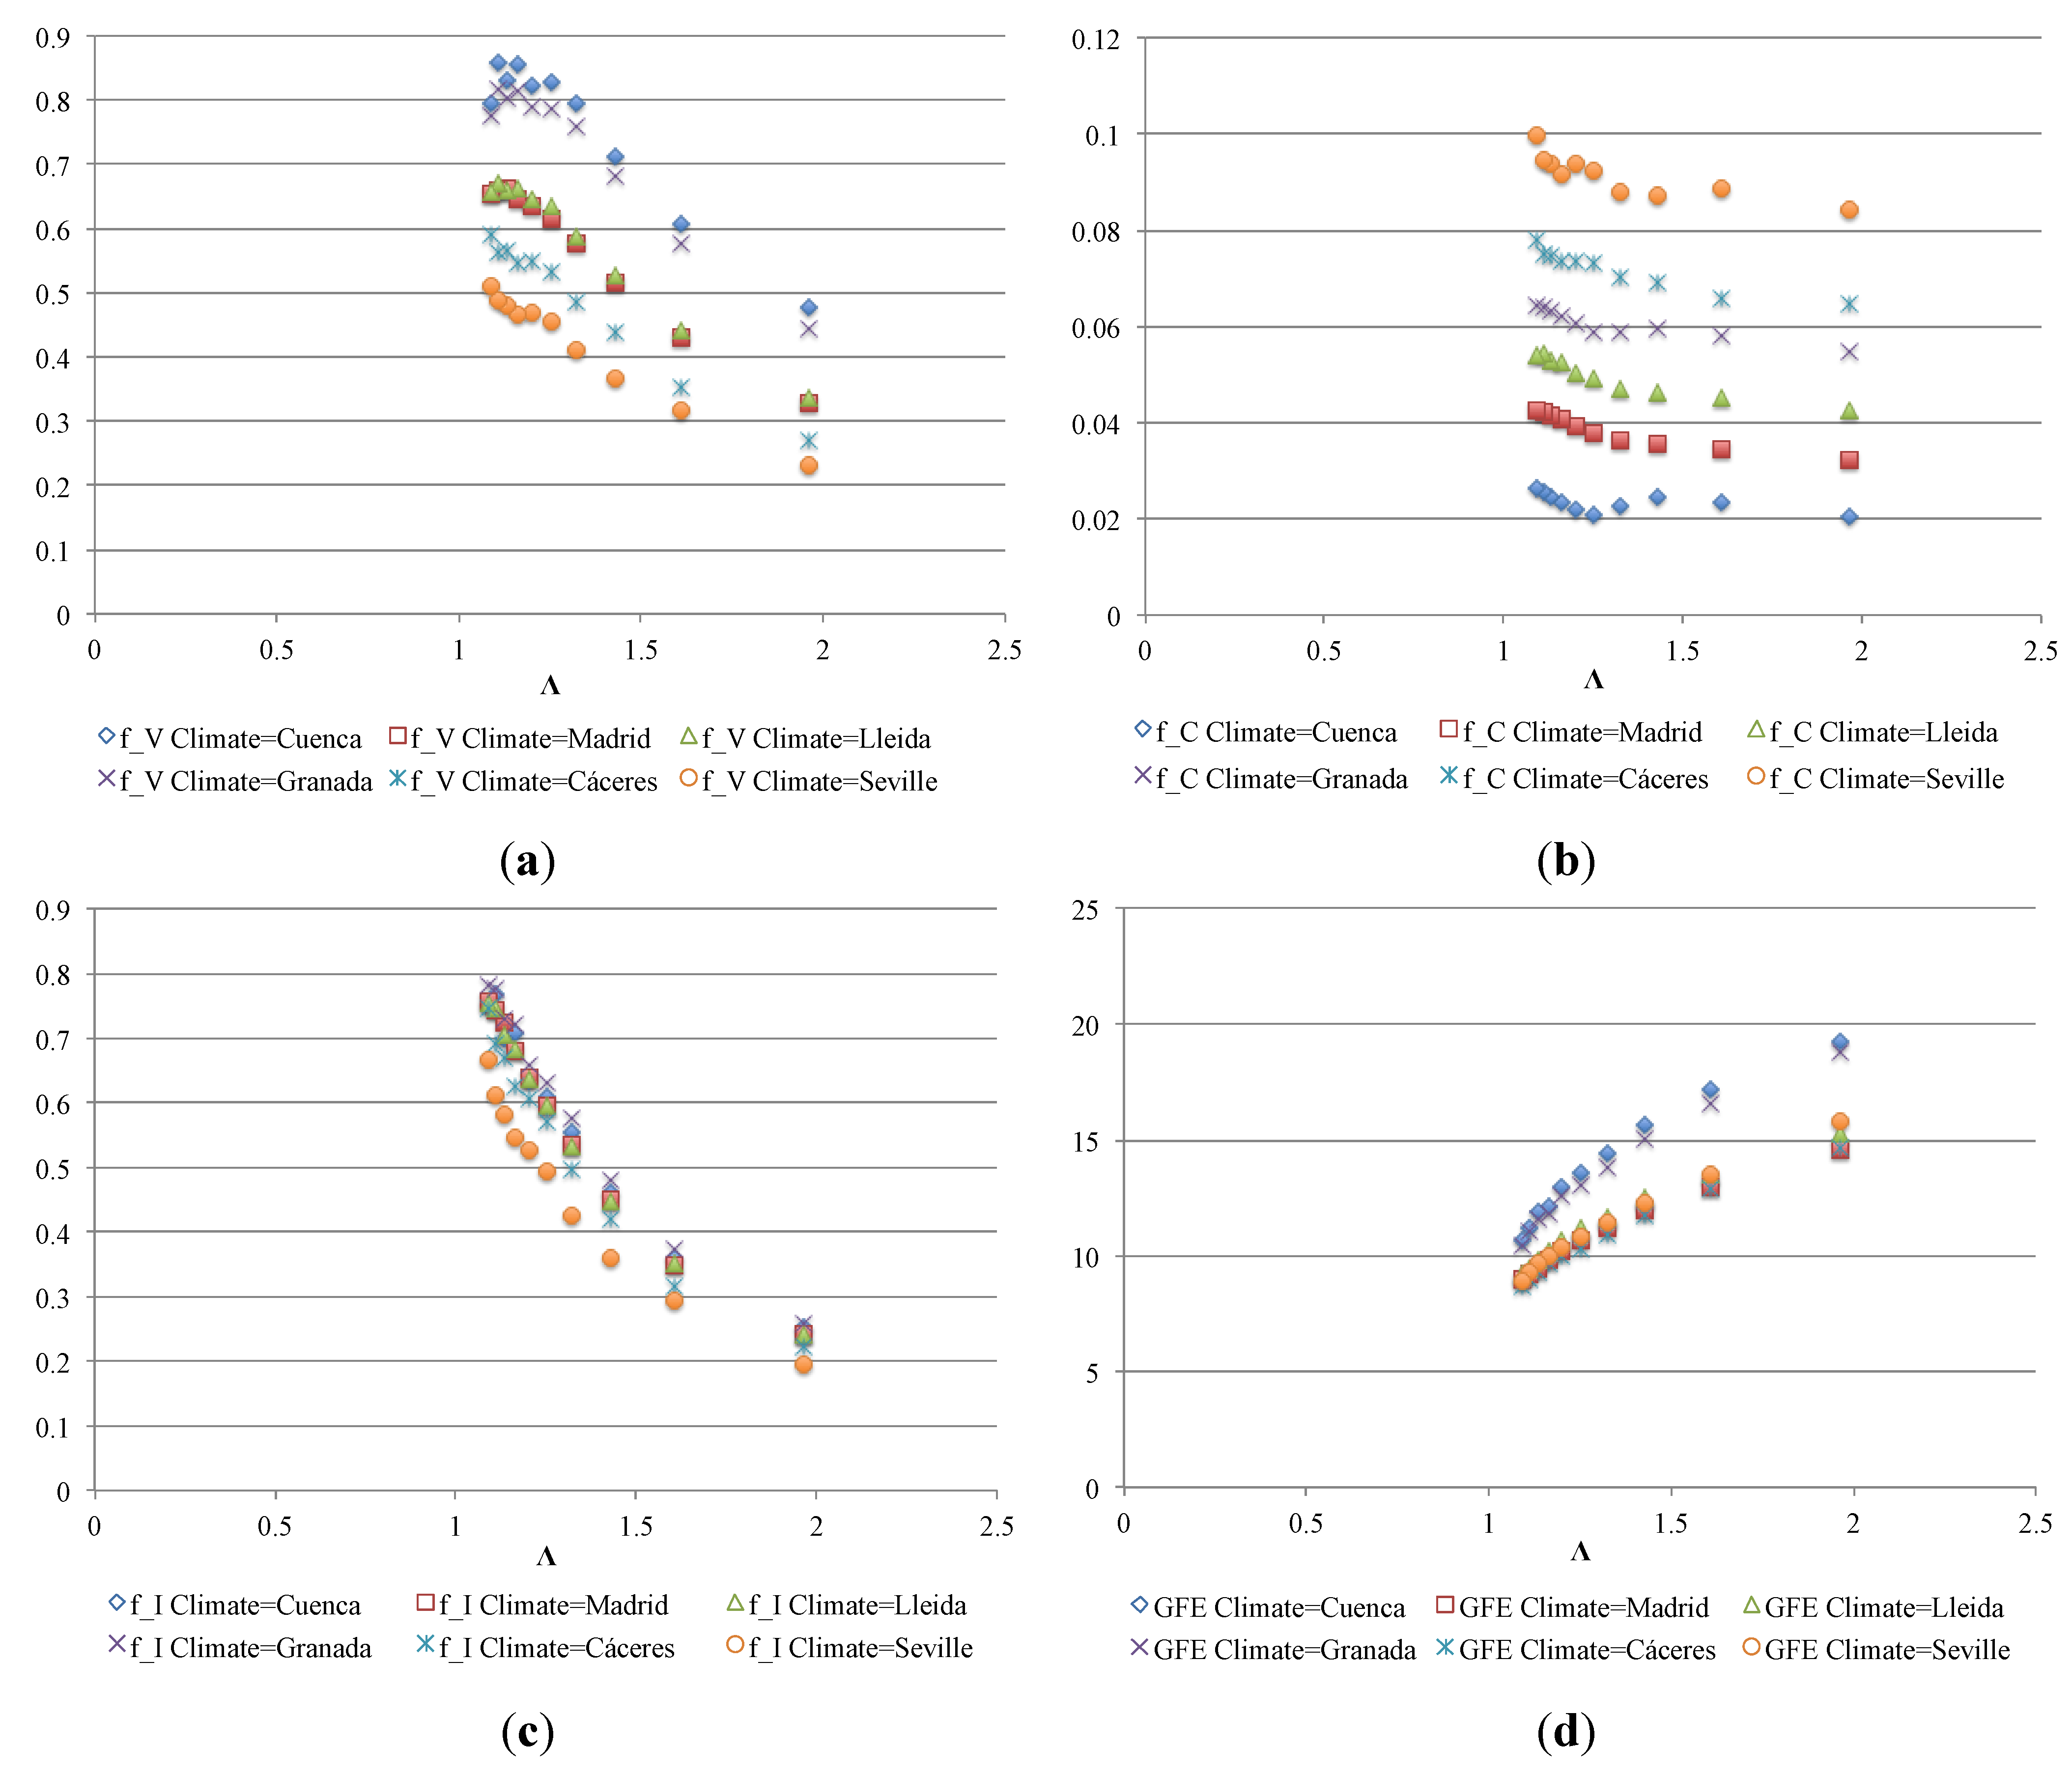


- Use factor fU provides information on the use of energy in the system and fewer losses. A high fU value means efficient release with fewer losses; efficiency can be improved with façade insulation and the speed of release.
- Balance factor fB compares release capacity to storage capacity. A high fB value implies small loss during inactivity. This factor depends (inversely) on the maximum temperatures (greatest loss) and speed of release and directly on the outer insulation.
- Real storage factor fRS reflects operation during storage. A high fRS means good storage performance. It depends directly on the maximum and minimum temperatures, but more on the high temperatures, and on speed of release and insulation.
- Design storage factor fDS provides information on cooling potential relative to climate. A high fDS is symptomatic of design suited to the climate at issue. It depends directly on minimum temperatures and storage speed, and, inversely, on the amount of PCM. It is affected slightly, likewise inversely, by inertia.
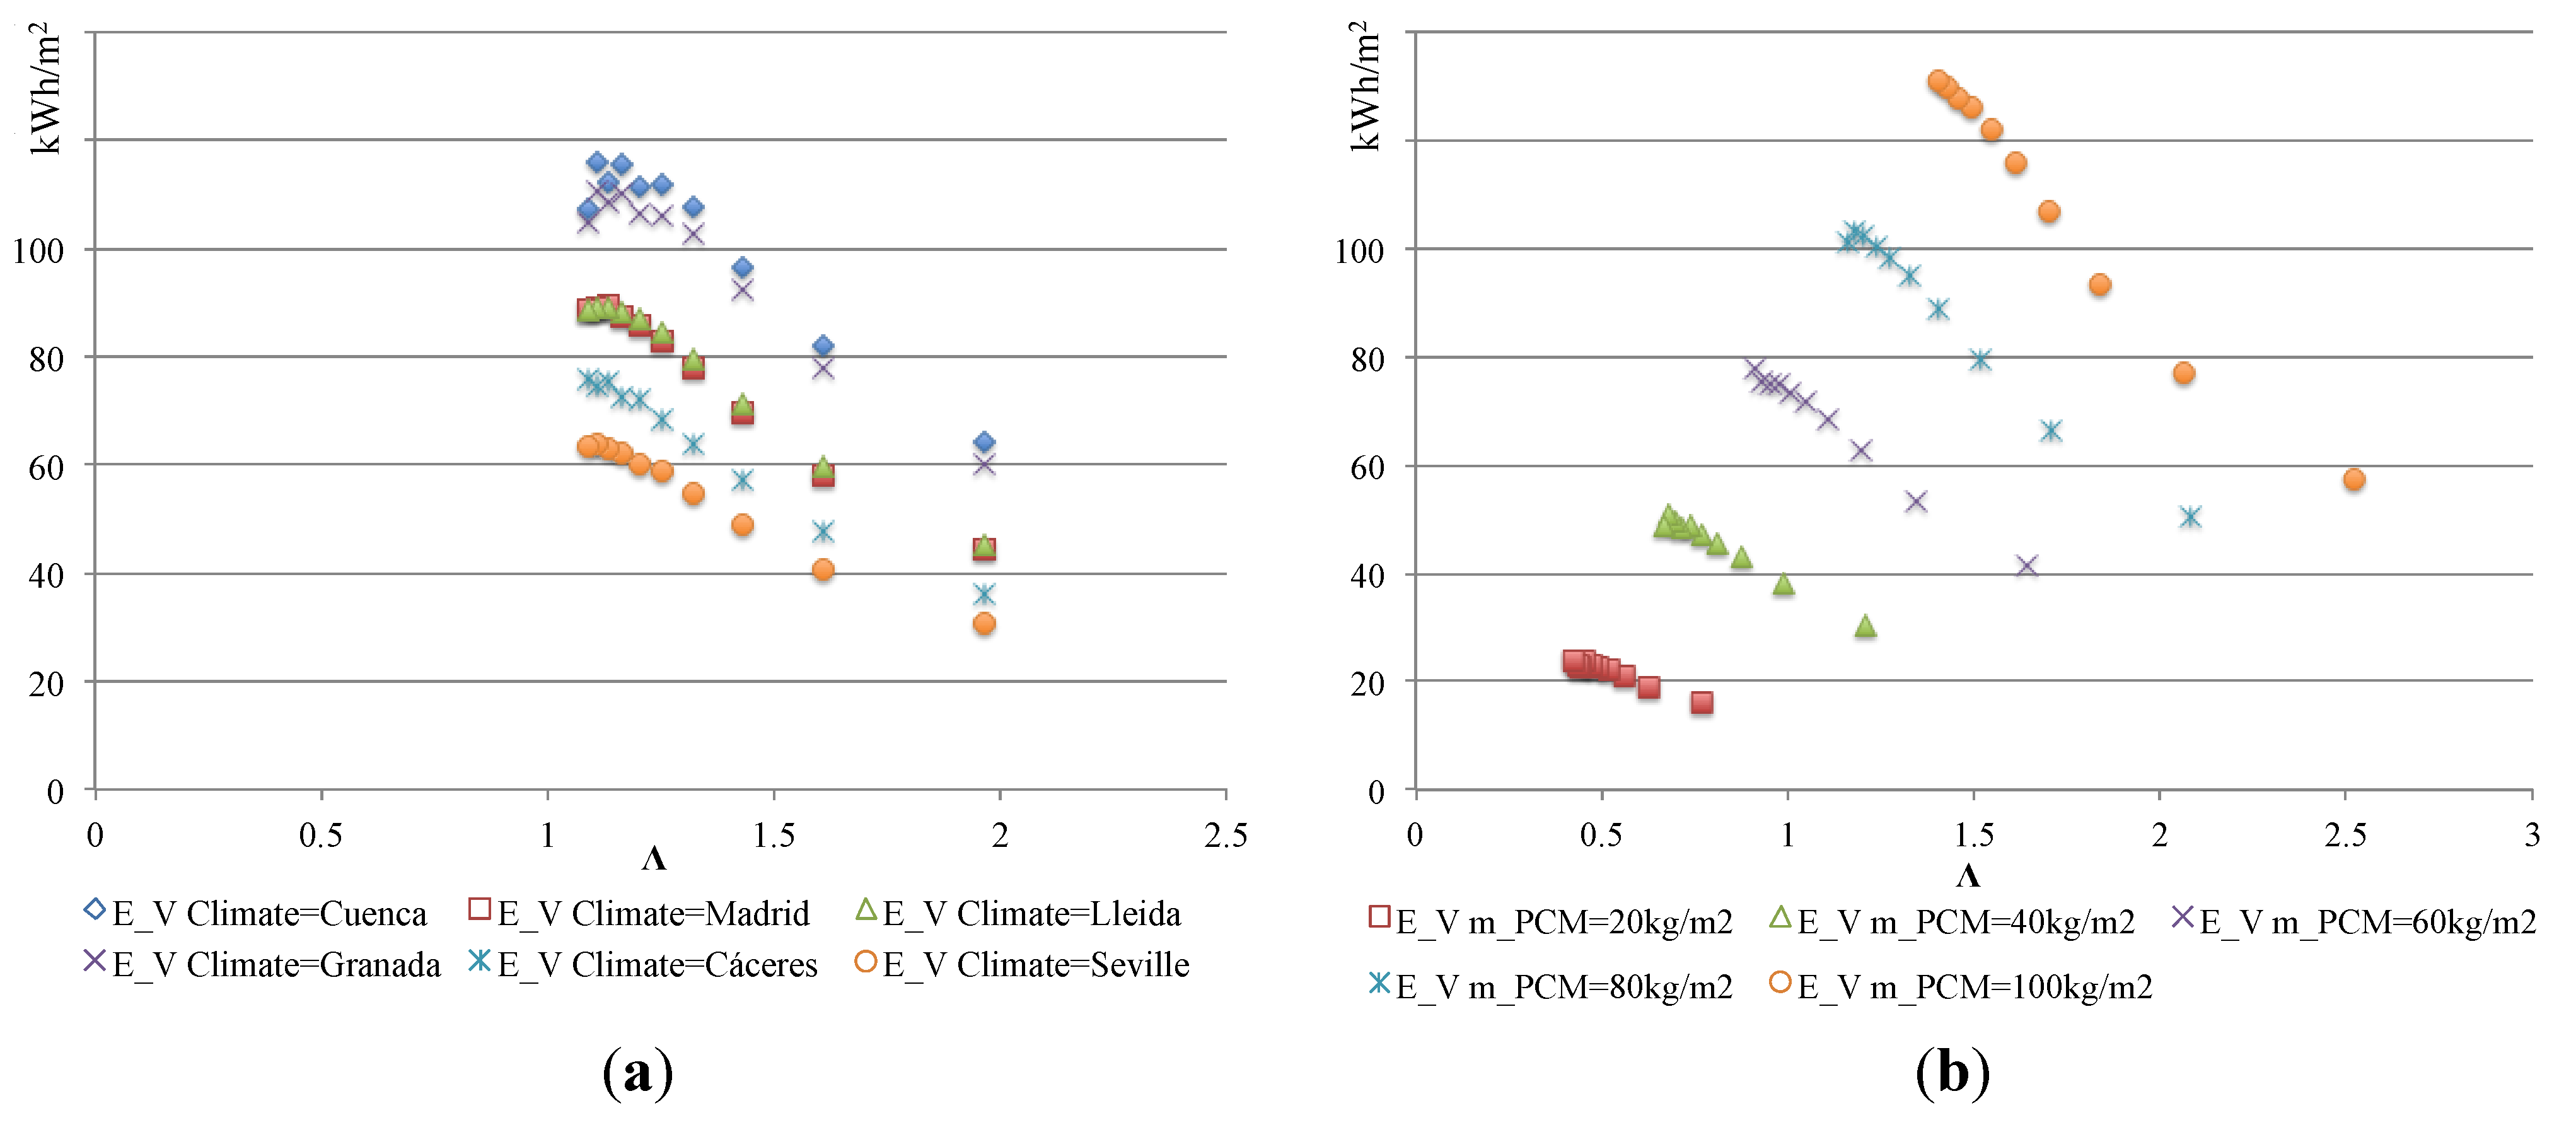
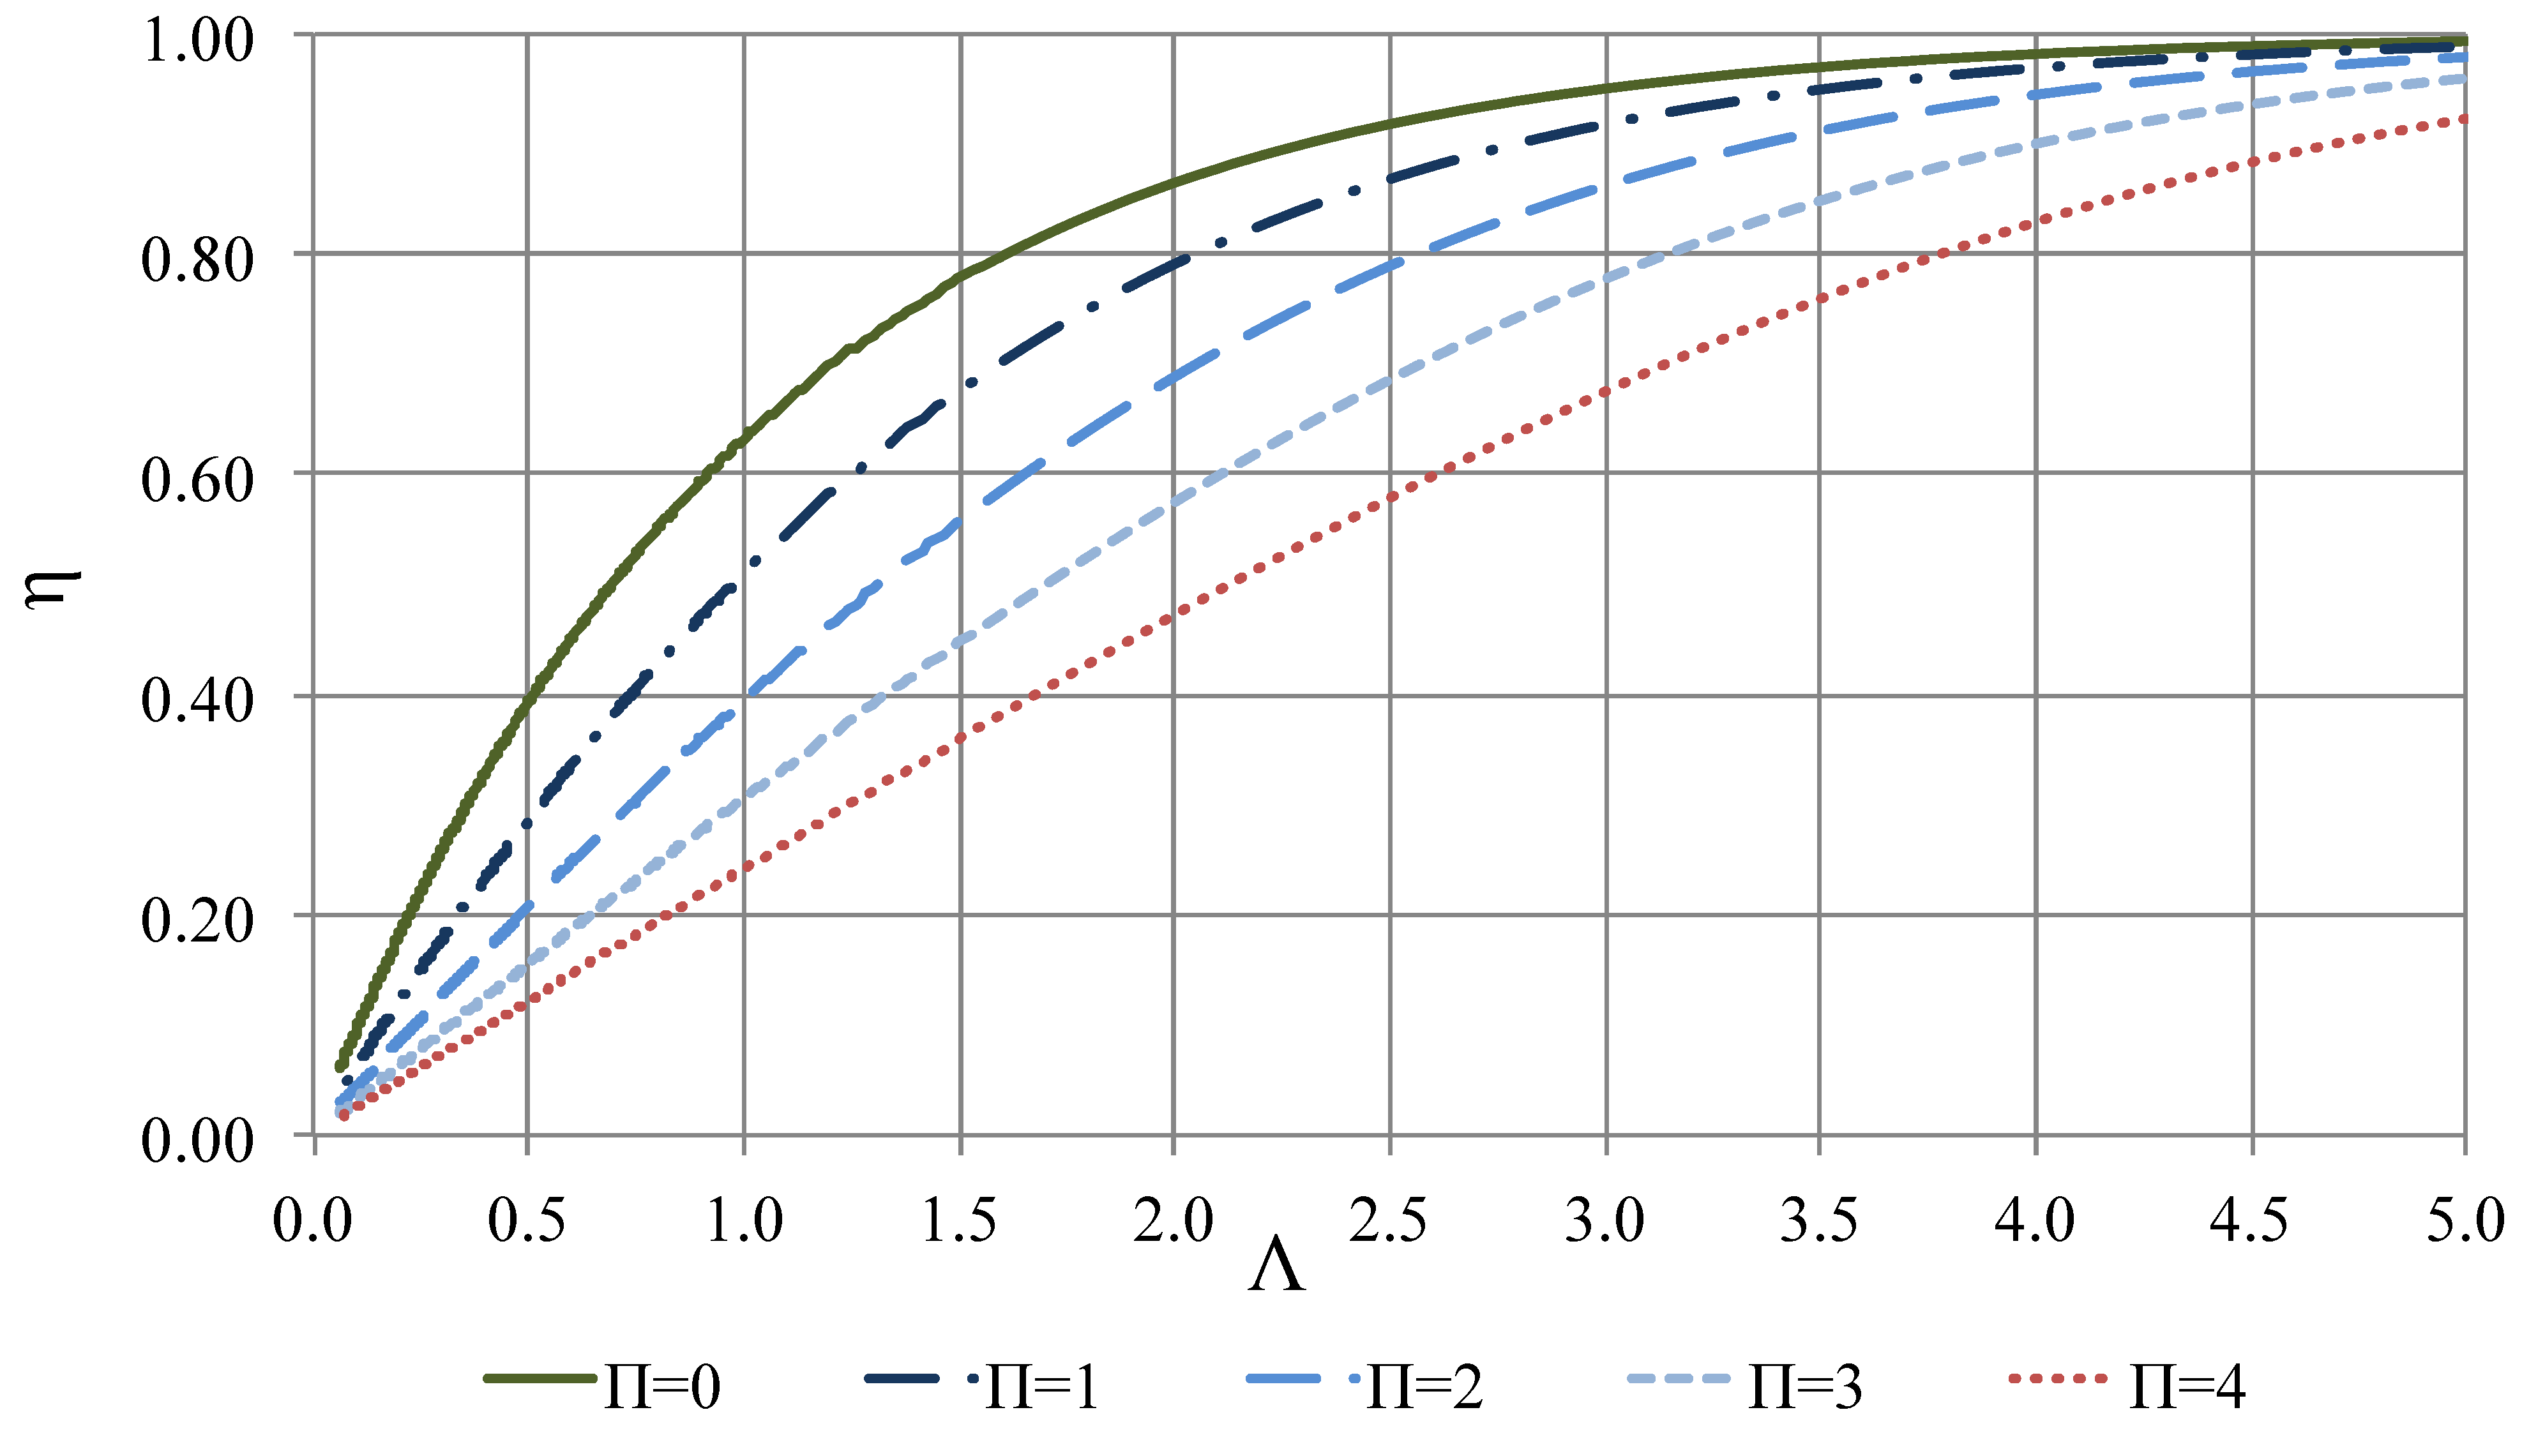
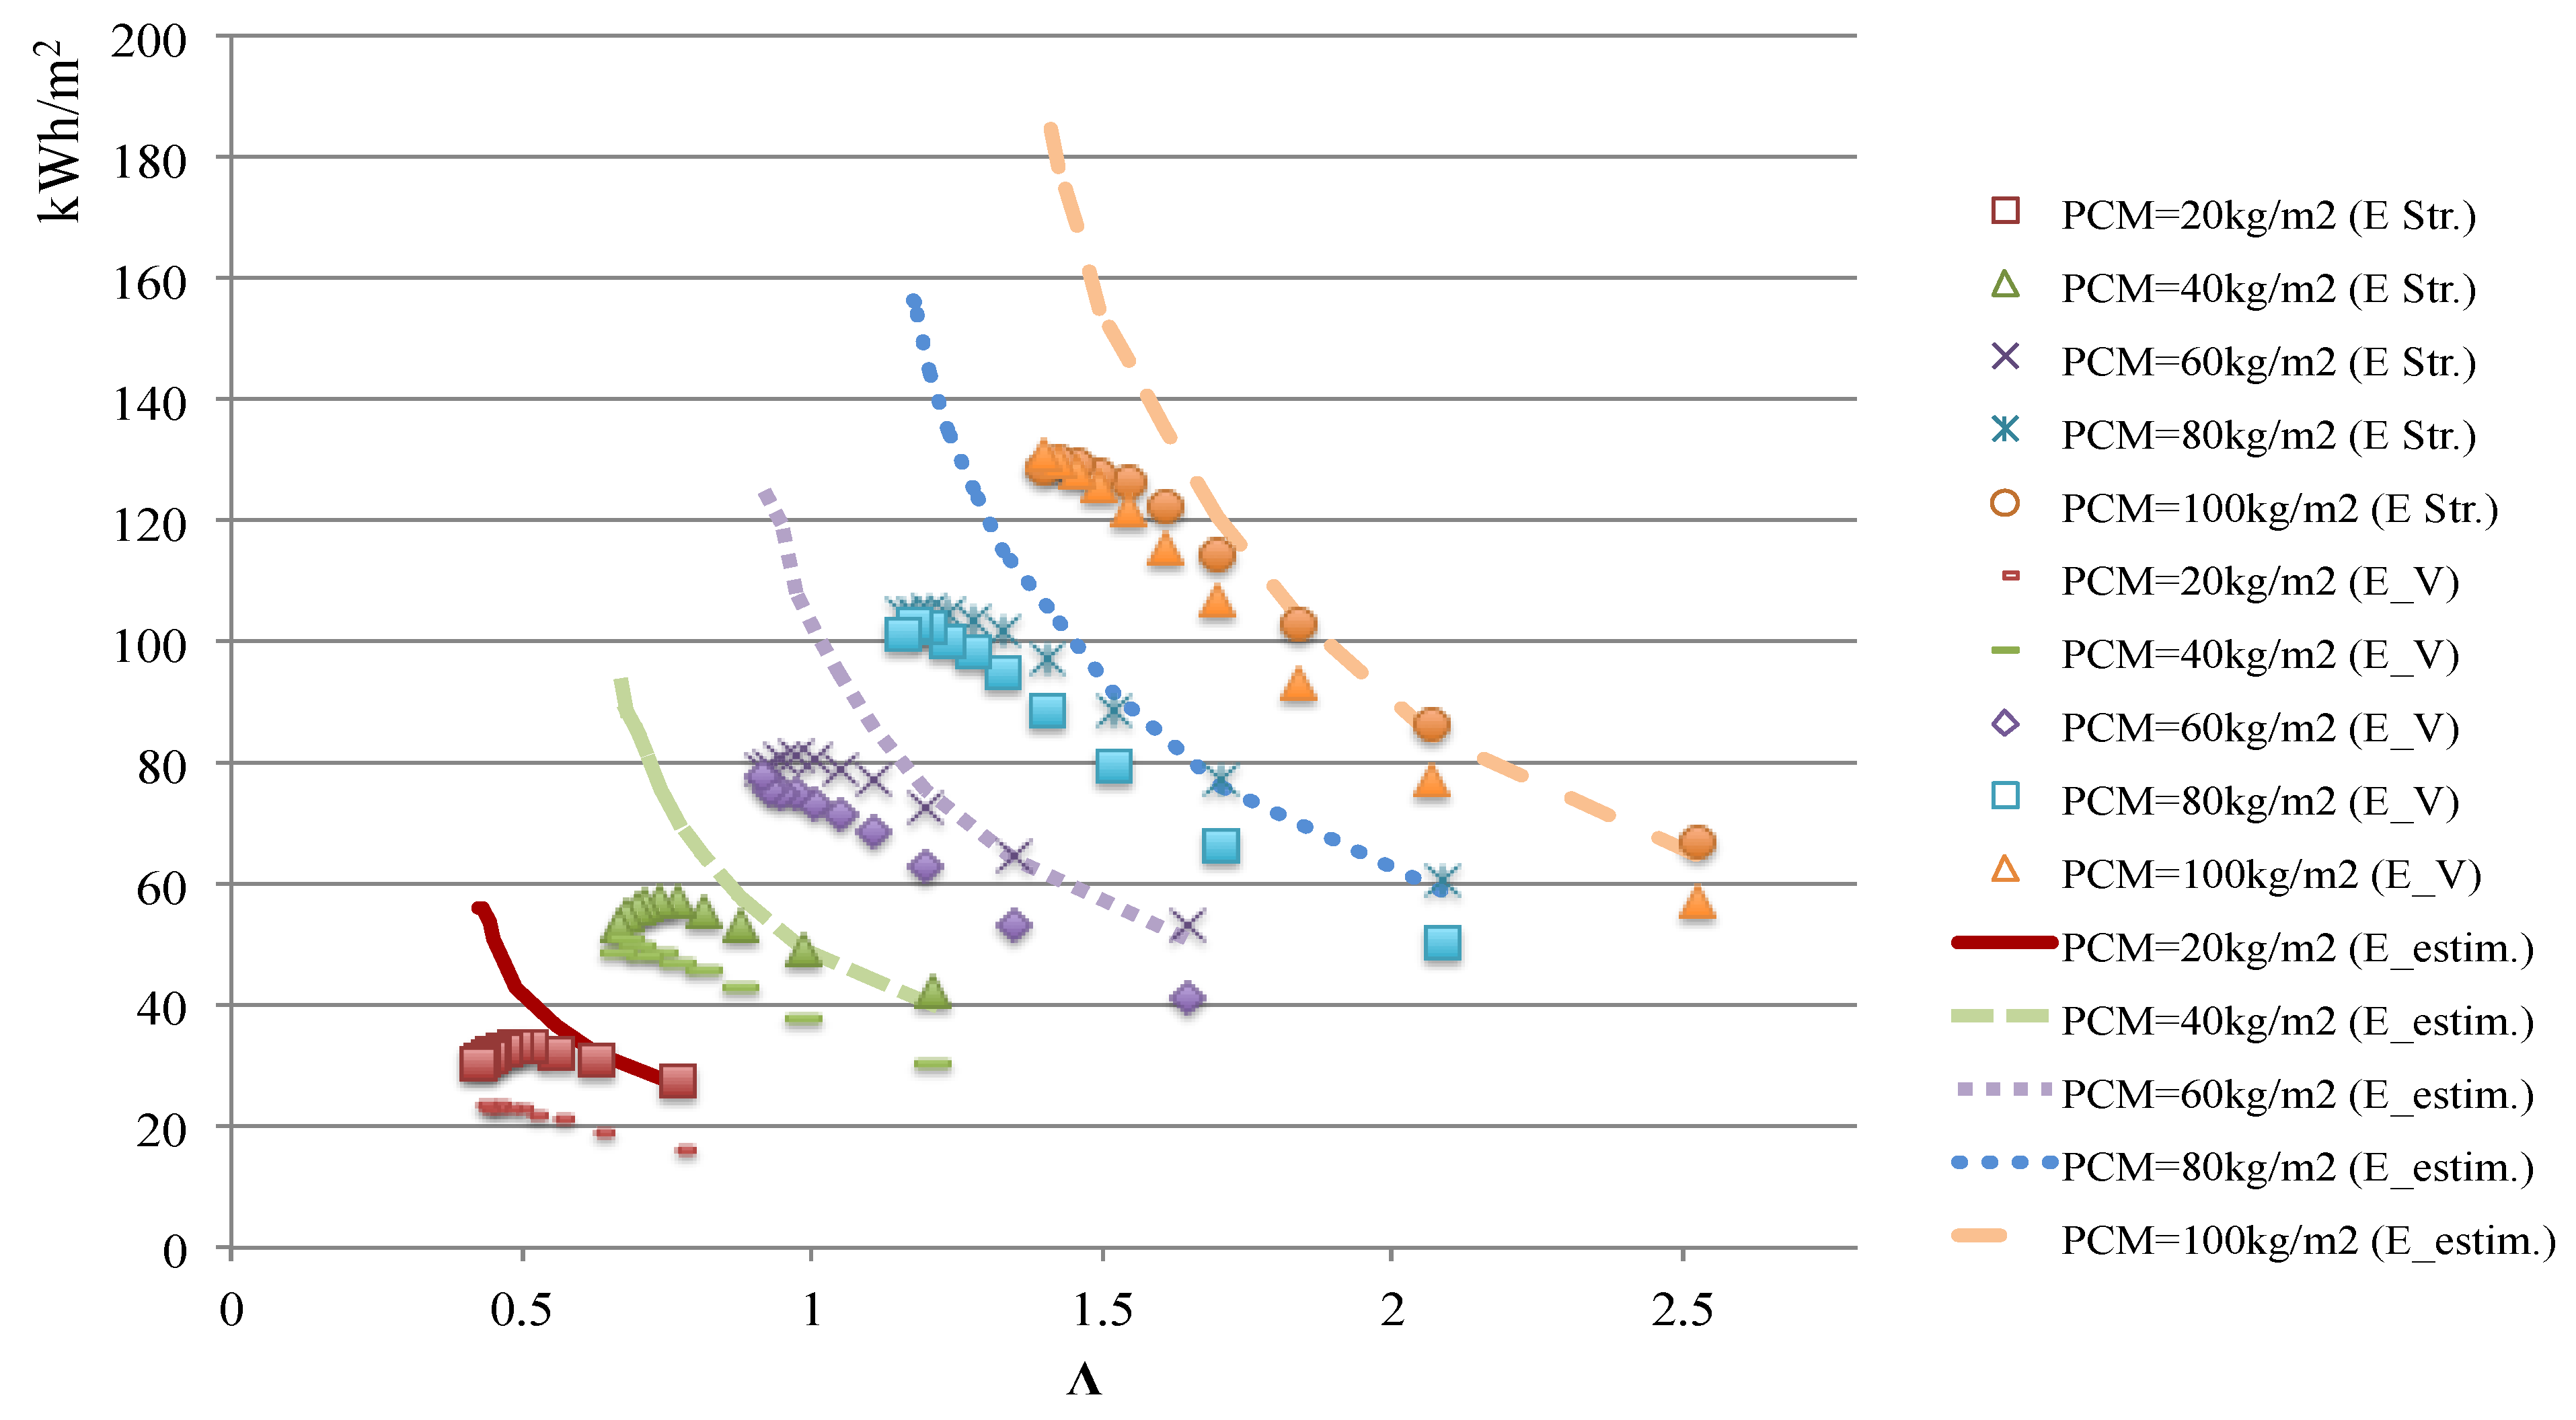
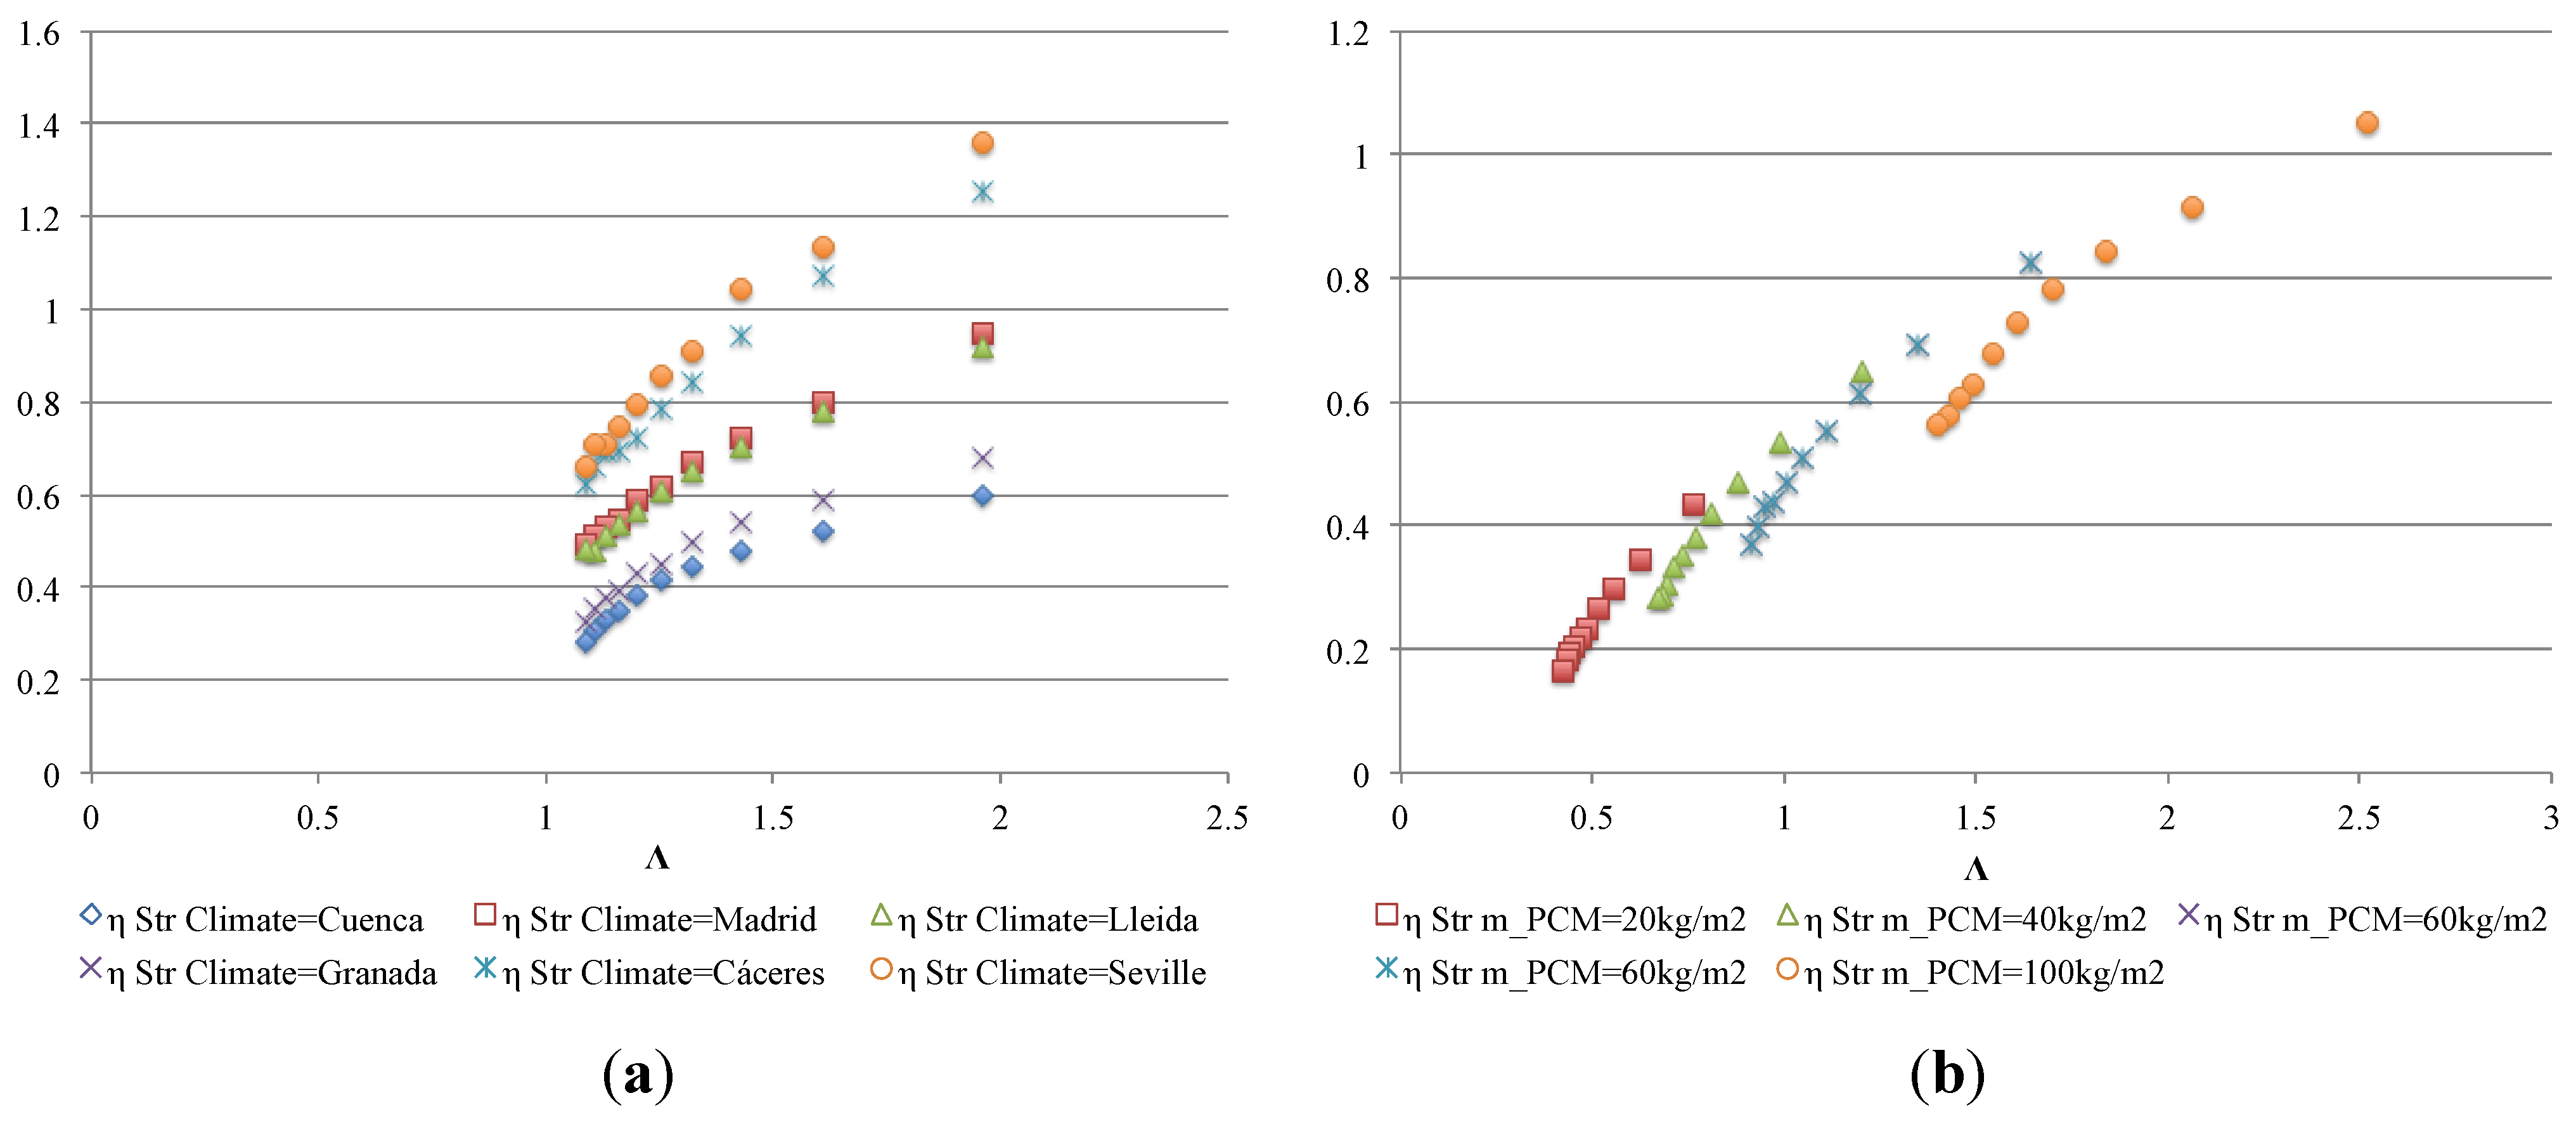
- Façade performance can also be estimated with the theoretical model (second simplified model) using non-dimensional parameters Λ and Π.
- The energy stored in an air medium can be calculated from the following expressions in Equations (22)–(24):where CCP is climate cooling potential (Kh) in degree-hours over a given night-time storage period.
| Case | Configuration |
|---|---|
| Case 1 | Lightweight outer element, lightweight inner element |
| Case 2 | Lightweight outer element, heavy inner element with insulation on the chamber side |
| Case 3 | Lightweight outer element, heavy inner wall |
| Case 4 | Heavy outer element, lightweight inner element |
| Case 5 | Heavy outer heavy element, heavy inner element with insulation on the chamber side |
| Case 6 | Heavy outer element with insulation on the chamber side, heavy inner element with insulation on the chamber side |
| Case 7 | Heavy outer element, heavy inner wall |
| Case 8 | Heavy outer element with insulation on the chamber side, heavy inner wall |
| Case | 1 | 2 | 3 | 4 | 5 | 6 | 7 | 8 |
|---|---|---|---|---|---|---|---|---|
Outer
 inner inner |  |  |  |  |  |  |  |  |
| fU Use factor | 0.91 | 0.92 | 0.92 | 0.91 | 0.91 | 0.98 | 0.9 | 0.97 |
| fB Balance factor | 0.99 | 1 | 0.97 | 1.1 | 1.1 | 1.08 | 1.03 | 1.04 |
| fRS Real storage factor | 0.82 | 0.82 | 0.82 | 0.73 | 0.73 | 0.76 | 0.76 | 0.78 |
| fDS Design storage factor | 0.84 | 0.84 | 0.83 | 0.84 | 0.84 | 0.85 | 0.83 | 0.84 |
| fV Ventilation factor | 0.62 | 0.63 | 0.61 | 0.61 | 0.61 | 0.68 | 0.59 | 0.66 |
| fC Chamber factor | 0.12 | 0.1 | 0.17 | 0.02 | 0.02 | 0.11 | 0.09 | 0.19 |
| fI Installation factor | 0.54 | 0.54 | 0.54 | 0.53 | 0.54 | 0.54 | 0.55 | 0.55 |
| fD Design factor | 7.54 | 7.54 | 7.87 | 7.95 | 7.95 | 7.54 | 8.28 | 7.87 |
| GFE Global façade efficiency indicator | 10.38 | 10.16 | 11.26 | 9.31 | 9.23 | 11 | 10.32 | 12.24 |


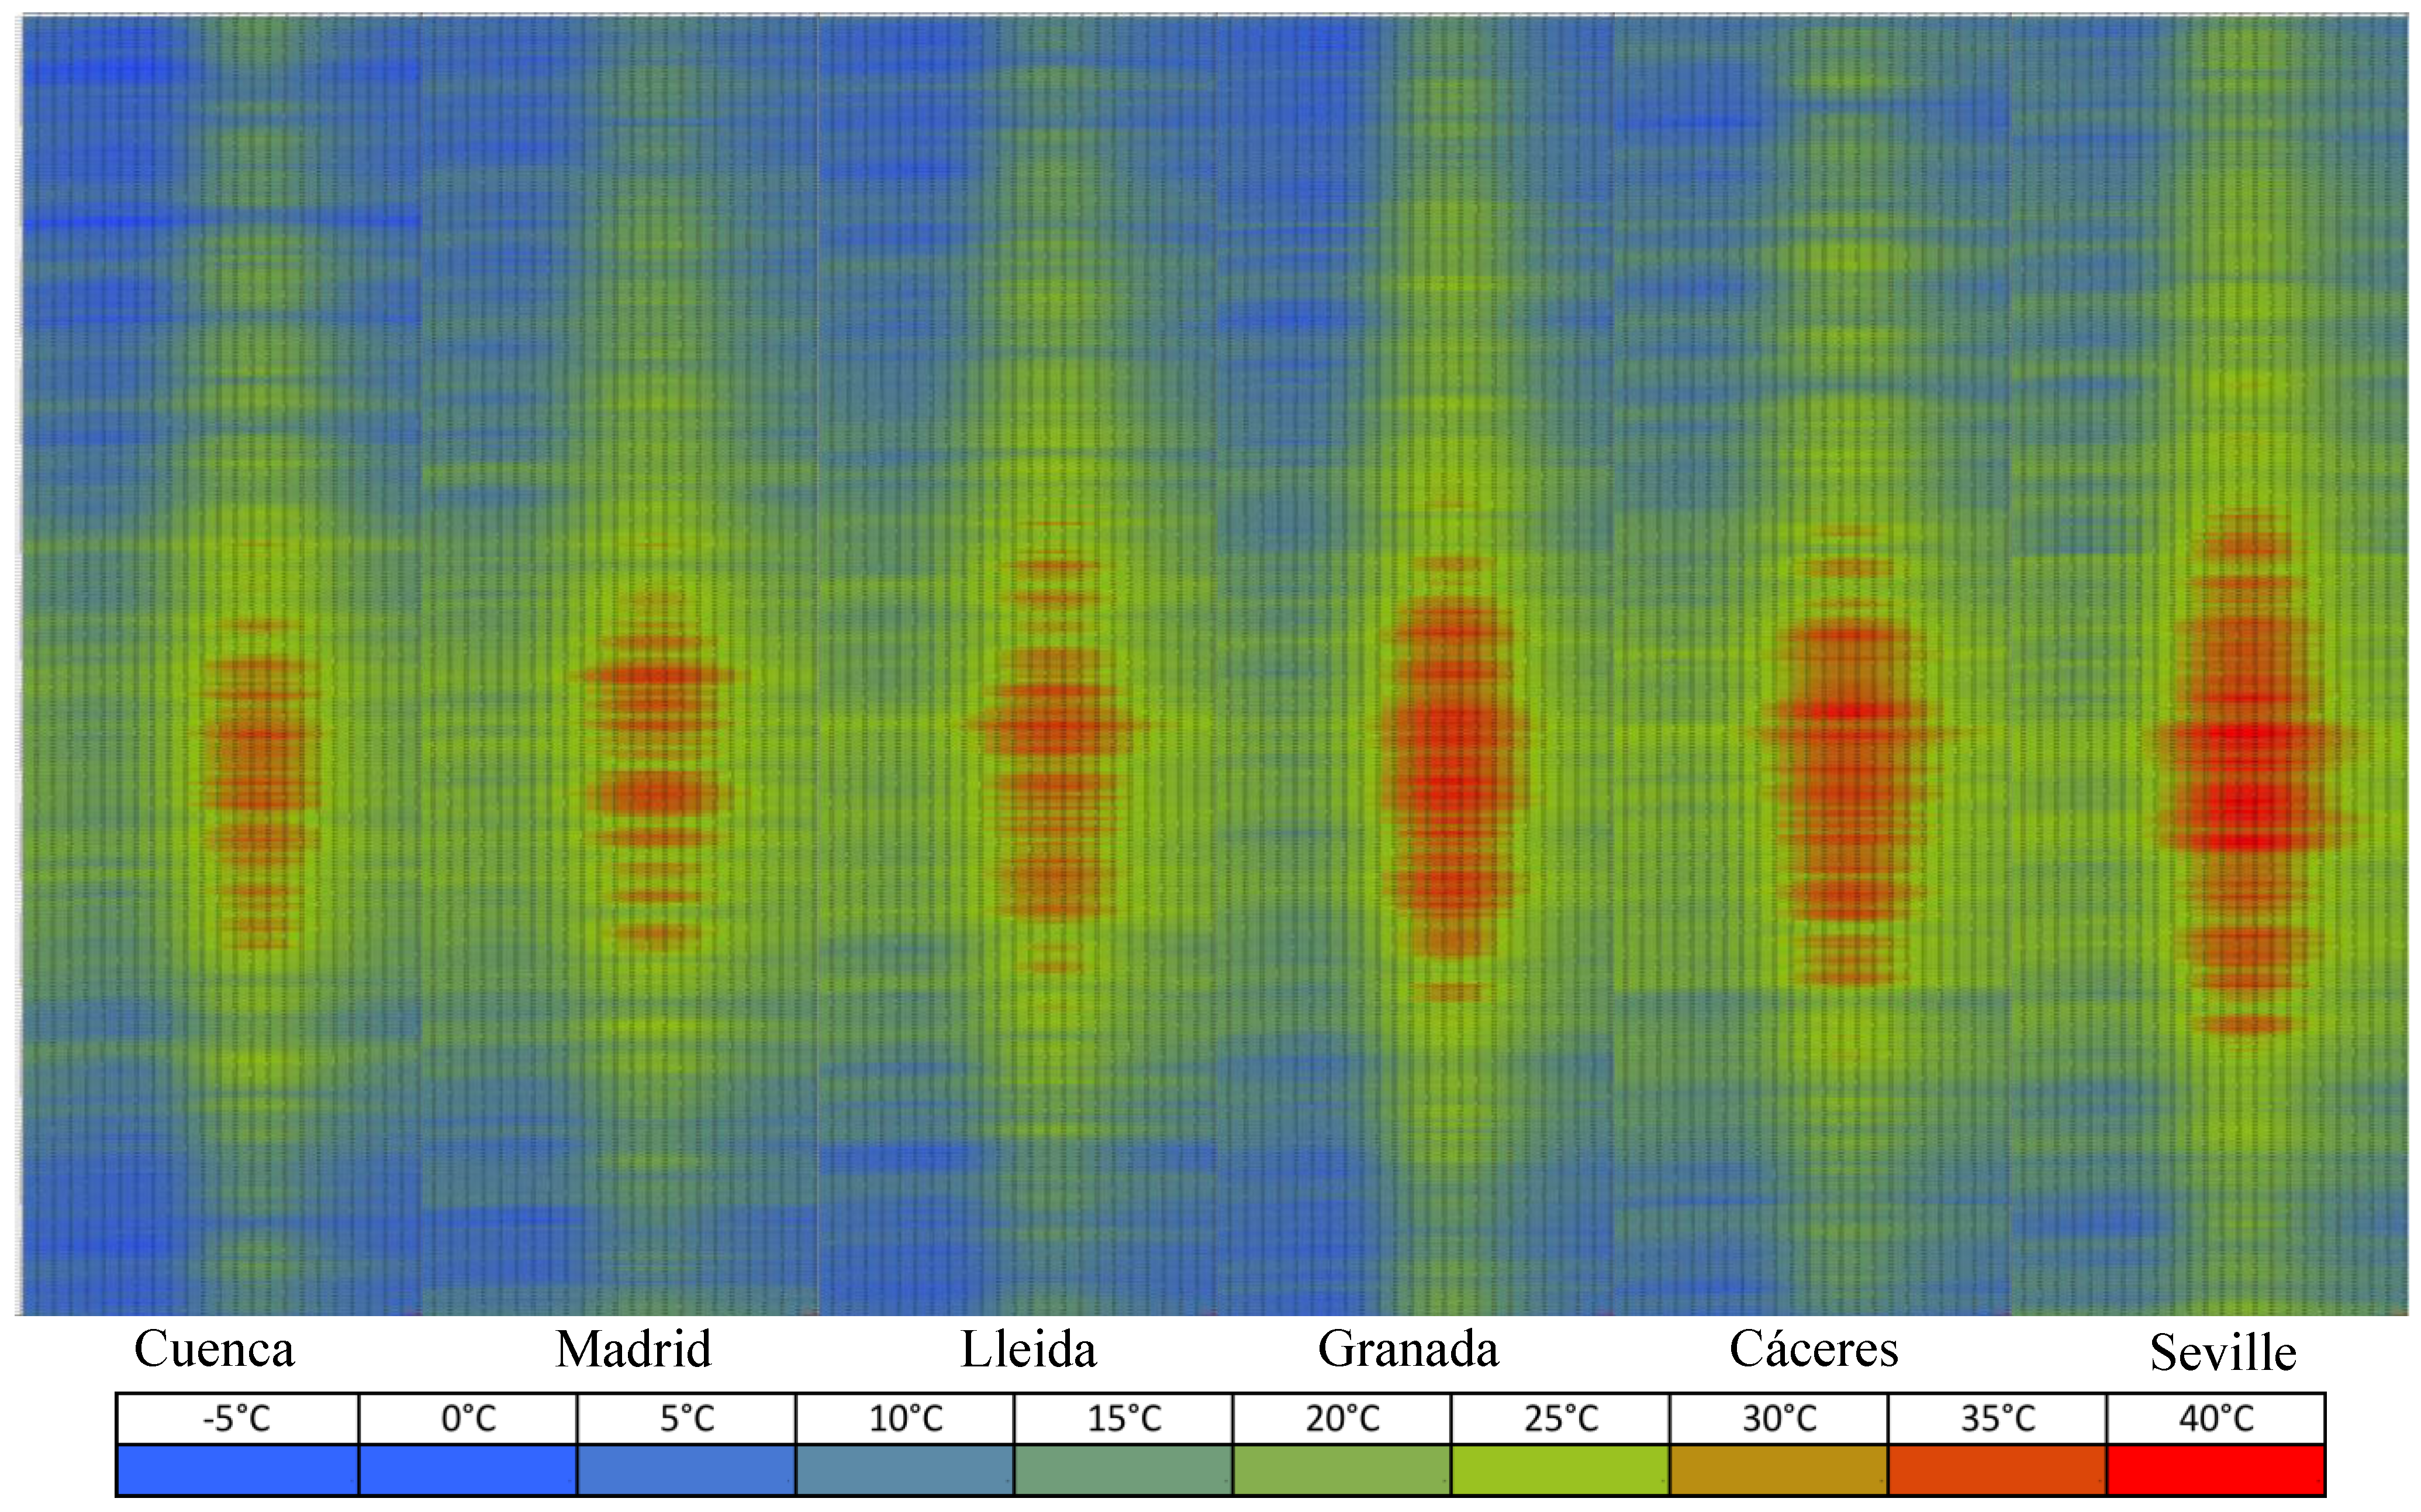
| CCP (Kh Degree-Hours) | June | July | August | September |
|---|---|---|---|---|
| Cuenca | 3324 | 1695 | 1714 | 3255 |
| Madrid | 1960 | 646 | 709 | 1909 |
| Lleida | 1757 | 746 | 714 | 1854 |
| Granada | 2311 | 1307 | 1302 | 2281 |
| Cáceres | 1520 | 427 | 432 | 801 |
| Seville | 1120 | 445 | 378 | 698 |
| Degree-hours of cooling | June | July | August | September |
|---|---|---|---|---|
| Cuenca | 84 | 827 | 707 | 222 |
| Madrid | 248 | 973 | 832 | 209 |
| Lleida | 350 | 1175 | 868 | 318 |
| Granada | 682 | 1652 | 1533 | 699 |
| Cáceres | 651 | 1712 | 1415 | 798 |
| Seville | 925 | 2201 | 2126 | 1081 |
6. Conclusions
Acknowledgments
Author Contributions
Conflicts of Interest
Abbreviations
| CCP | Climate cooling potential |
| COP | Coefficient of performance |
| C′vent | Fans energy consumption in the operation of the façade |
| Cvent | Theoretical fans energy consumption in the operation of the façade (without building) |
| Cvent.Design | Fans energy consumption assuming operation under design conditions |
| Cf | Heat capacity of the air |
| Cm | Matrix mass capacity |
| Cp | Heat capacity of the façade |
| ΔD | Theoretical energy saved in a building attributable to the installation of a PCM façade |
| EDesign | Energy stored in the façade due to increase temperature between Tmin and Tmax |
| Ev | Energy delivered for cooling in a period of time |
| EC | Energy saved attributable to the PCM façade as thermal barrier |
| EStr | Energy stored |
| fB | Balance factor |
| fC | Chamber factor |
| fD | Design factor |
| fDS | Design storage factor |
| fI | Design factor related to fans consumption |
| fU | Use factor |
| fRS | Real storage factor |
| fV | Ventilation factor |
| GBE | Global building efficiency indicator |
| GFE | Global façade efficiency indicator |
| hc | Convective heat transfer coefficient |
| L | Length (regenerative heat exchangers) |
| λ | PCM latent heat |
| Λ | Reduced length (regenerative heat exchangers) |
Mass air flow rate | |
| mfaçade | Façade mass |
| mm | PCM mass |
| mPCM | Matrix mass (regenerative heat exchangers) |
| η | Efficiency (regenerative heat exchangers) |
| P | Period (regenerative heat exchangers) |
| Π | Reduced period (regenerative heat exchangers) |
| Tin | Inlet air temperature |
| Tmin | Minimum temperature range defined in the air chamber |
| Tmax | Maximum temperature range defined in the air chamber |
| Tout | Outlet air temperature |
| TPCM | Phase change temperature |
| τ | Storage time (regenerative heat exchangers) |
| v | Air speed (regenerative heat exchangers) |
References
- Dinçery, I.; Rosen, M.A. Thermal Energy Storage: Systems and Applications; John Wiley and Sons: Chichester, UK, 2010. [Google Scholar]
- Mehlingy, H.; Cabeza, L.F. An up to date introduction into basics and applications. In Heat and Cold Storage with PCM; Springer: Berlin/Heidelberg, Germany, 2008; pp. 217–295. [Google Scholar]
- Tyagiy, V.V.; Buddhi, D. PCM thermal storage in buildings: A state of art. Renew. Sustain. Energy Rev. 2007, 11, 1146–1166. [Google Scholar] [CrossRef]
- Sharma, A.; Tyagi, V.V.; Chen, C.R.; Buddhi, Y.D. Review on thermal energy storage with phase change materials and applications. Renew. Sustain. Energy Rev. 2009, 13, 318–345. [Google Scholar] [CrossRef]
- Wang, X.; Zhang, Y.; Xiao, W.; Zeng, R.; Zhang, Q.; Di, F.H. Review on thermal performance of phase change energy storage building envelope. Chin. Sci. Bull. 2009, 54, 920–928. [Google Scholar] [CrossRef]
- Soares, N.; Costa, J.J.; Gaspar, A.R.; Santos, P. Review of passive PCM latent heat thermal energy storage systems towards buildings’ energy efficiency. Energy Build. 2013, 59, 82–103. [Google Scholar] [CrossRef]
- Cabeza, L.F.; Castell, A.; Barreneche, C.; de Gracia, A.; Fernández, A.I. Materials used as PCM in thermal energy storage in buildings: A review. Renew. Sustain. Energy Rev. 2011, 15, 1675–1695. [Google Scholar] [CrossRef]
- Crawley, D.B.; Lawrie, L.K.; Winkelmann, F.C.; Buhl, W.F.; Huang, Y.J.; Pedersen, C.O.; Strand, R.K.; Liesen, R.J.; Fisher, D.E.; Witte, M.J.; et al. EnergyPlus: Creating a new-generation building energy simulation program. Energy Build. 2001, 33, 319–331. [Google Scholar] [CrossRef]
- Ibáñez, M.; Lázaro, A.; Zalba, B.; Cabeza, L.F. An approach to the simulation of PCMs in building applications using TRNSYS. Appl. Therm. Eng. 2005, 25, 1796–1807. [Google Scholar] [CrossRef]
- Pedersen, C.O. Advanced zone simulation in Energyplus: Incorporation of variable properties and phase change material (PCM) capability. In Proceedings of the 10th International IBPSA Conference, Beijing, China, 3–9 September 2007.
- Kuznik, F.; Virgone, J.; Johannes, K. Development and validation of a new TRNSYS type for the simulation of external building walls containing PCM. Energy Build. 2010, 42, 1004–1009. [Google Scholar] [CrossRef]
- Kośny, J.; Yarbrough, D.; Miller, W.; Shrestha, S.; Kossecka, E.; Lee, E. Numerical and Experimental Analysis of Building Envelopes Containing Blown Fiberglass Insulation Thermally Enhanced with Phase Change Material (PCM). In Proceedings of the 1st Central European Symposium on Building Physics, Cracow, Poland, 13–15 September 2010; pp. 13–15.
- Tetlow, D.; Su, Y.; Riffat, S.B. Energy Plus simulation analysis of incorporating microencapsulated PCMs (Phase Change Materials) with internal wall insulation (IWI) for hard-to-treat (HTT) houses in the UK. In Proceedings of the 10th International Conference on Sustainable Energy Technologies, Istanbul, Turkey, 4–7 September 2011.
- Tabares-Velasco, P.C.; Christensen, C.; Bianchi, M. Verification and validation of EnergyPlus phase change material model for opaque wall assemblies. Build. Environ. 2012, 54, 186–196. [Google Scholar] [CrossRef]
- Mazo, J.; Delgado, M.; Marin, J.M.; Zalba, B. Modeling a radiant floor system with Phase Change Material (PCM) integrated into a building simulation tool: Analysis of a case study of a floor heating system coupled to a heat pump. Energy Build. 2012, 47, 458–466. [Google Scholar] [CrossRef]
- Willmott, J.A. Dynamics of Regenerative Heat Transfer; CRC Press: New York, NY, USA, 2001. [Google Scholar]
- Ackermann, R.A. Cryogenic Regenerative Heat Exchangers; Springer Science & Business Media: New York, NY, USA, 2013. [Google Scholar]
- Tay, N.H.S.; Belusko, M.; Bruno, F. An effectiveness-NTU technique for characterising tube-in-tank phase change thermal energy storage systems. Appl. Energy 2012, 91, 309–319. [Google Scholar] [CrossRef]
- Nellis, G.F.; Klein, S.A. Regenerative heat exchangers with significant entrained fluid heat capacity. Int. J. Heat Mass Transf. 2006, 49, 329–340. [Google Scholar] [CrossRef]
- De Gracia, A.; Navarro, L.; Castell, A.; Ruiz-Pardo, Á.; Álvarez, S.; Cabeza, L.F. Thermal analysis of a ventilated facade with PCM for cooling applications. Energy Build. 2013, 65, 508–515. [Google Scholar] [CrossRef]
- Ruiz-Pardo, A.; Sánchez, F.J.; Sánchez Ramos, J.; de Gracia, A.; Cabeza, L.F. Numerical simulation of a ventilated facade with PCM inside the air channel. In Proceedings of the 12th International Conference on Energy Storage, Lleida, Spain, 16–18 May 2012.
- De Gracia, A.; Navarro, L.; Castell, A.; Cabeza, L.F. Numerical study on the thermal performance of a ventilated facade with PCM. Appl. Therm. Eng. 2013, 61, 372–380. [Google Scholar] [CrossRef]
- Alvarez, S.; Cabeza, L.F.; Ruiz-Pardo, A.; Castell, A.; Tenorio, J.A. Building integration of PCM for natural cooling of buildings. Appl. Energy 2013, 109, 514–522. [Google Scholar] [CrossRef]
- Lamberg, P.; Lehtiniemi, R.; Henell, A.-M. Numerical and experimental investigation of melting and freezing processes in phase change material storage. Int. J. Therm. Sci. 2004, 43, 277–287. [Google Scholar] [CrossRef]
- Tenorio, J.A. Energy Saving in Buildings through Structural Storage with Phase Change Materials; Seville University: Seville, Spain, 2014. [Google Scholar]
© 2015 by the authors; licensee MDPI, Basel, Switzerland. This article is an open access article distributed under the terms and conditions of the Creative Commons Attribution license (http://creativecommons.org/licenses/by/4.0/).
Share and Cite
Tenorio, J.A.; Sánchez-Ramos, J.; Ruiz-Pardo, Á.; Álvarez, S.; Cabeza, L.F. Energy Efficiency Indicators for Assessing Construction Systems Storing Renewable Energy: Application to Phase Change Material-Bearing Façades. Energies 2015, 8, 8630-8649. https://doi.org/10.3390/en8088630
Tenorio JA, Sánchez-Ramos J, Ruiz-Pardo Á, Álvarez S, Cabeza LF. Energy Efficiency Indicators for Assessing Construction Systems Storing Renewable Energy: Application to Phase Change Material-Bearing Façades. Energies. 2015; 8(8):8630-8649. https://doi.org/10.3390/en8088630
Chicago/Turabian StyleTenorio, José A., José Sánchez-Ramos, Álvaro Ruiz-Pardo, Servando Álvarez, and Luisa F. Cabeza. 2015. "Energy Efficiency Indicators for Assessing Construction Systems Storing Renewable Energy: Application to Phase Change Material-Bearing Façades" Energies 8, no. 8: 8630-8649. https://doi.org/10.3390/en8088630
APA StyleTenorio, J. A., Sánchez-Ramos, J., Ruiz-Pardo, Á., Álvarez, S., & Cabeza, L. F. (2015). Energy Efficiency Indicators for Assessing Construction Systems Storing Renewable Energy: Application to Phase Change Material-Bearing Façades. Energies, 8(8), 8630-8649. https://doi.org/10.3390/en8088630