A computational model has been developed in this study to simulate this process by using Aspen Plus (Advanced System for Process Engineering plus) software. Aspen Plus is process-oriented software that facilitates calculation of physical, chemical and biological parameters [
20]. It can handle solid, liquid and vapour phases in the process. Small sections of the complex and integrated system can be modelled and tested here as separate modules before they are integrated with the process. This process simulator engine is equipped with a huge in-house property data bank. If a process requires a sophisticated block, then that block can be developed as FORTRAN subroutines. This software gives a complete integrated solution to processes engineering.
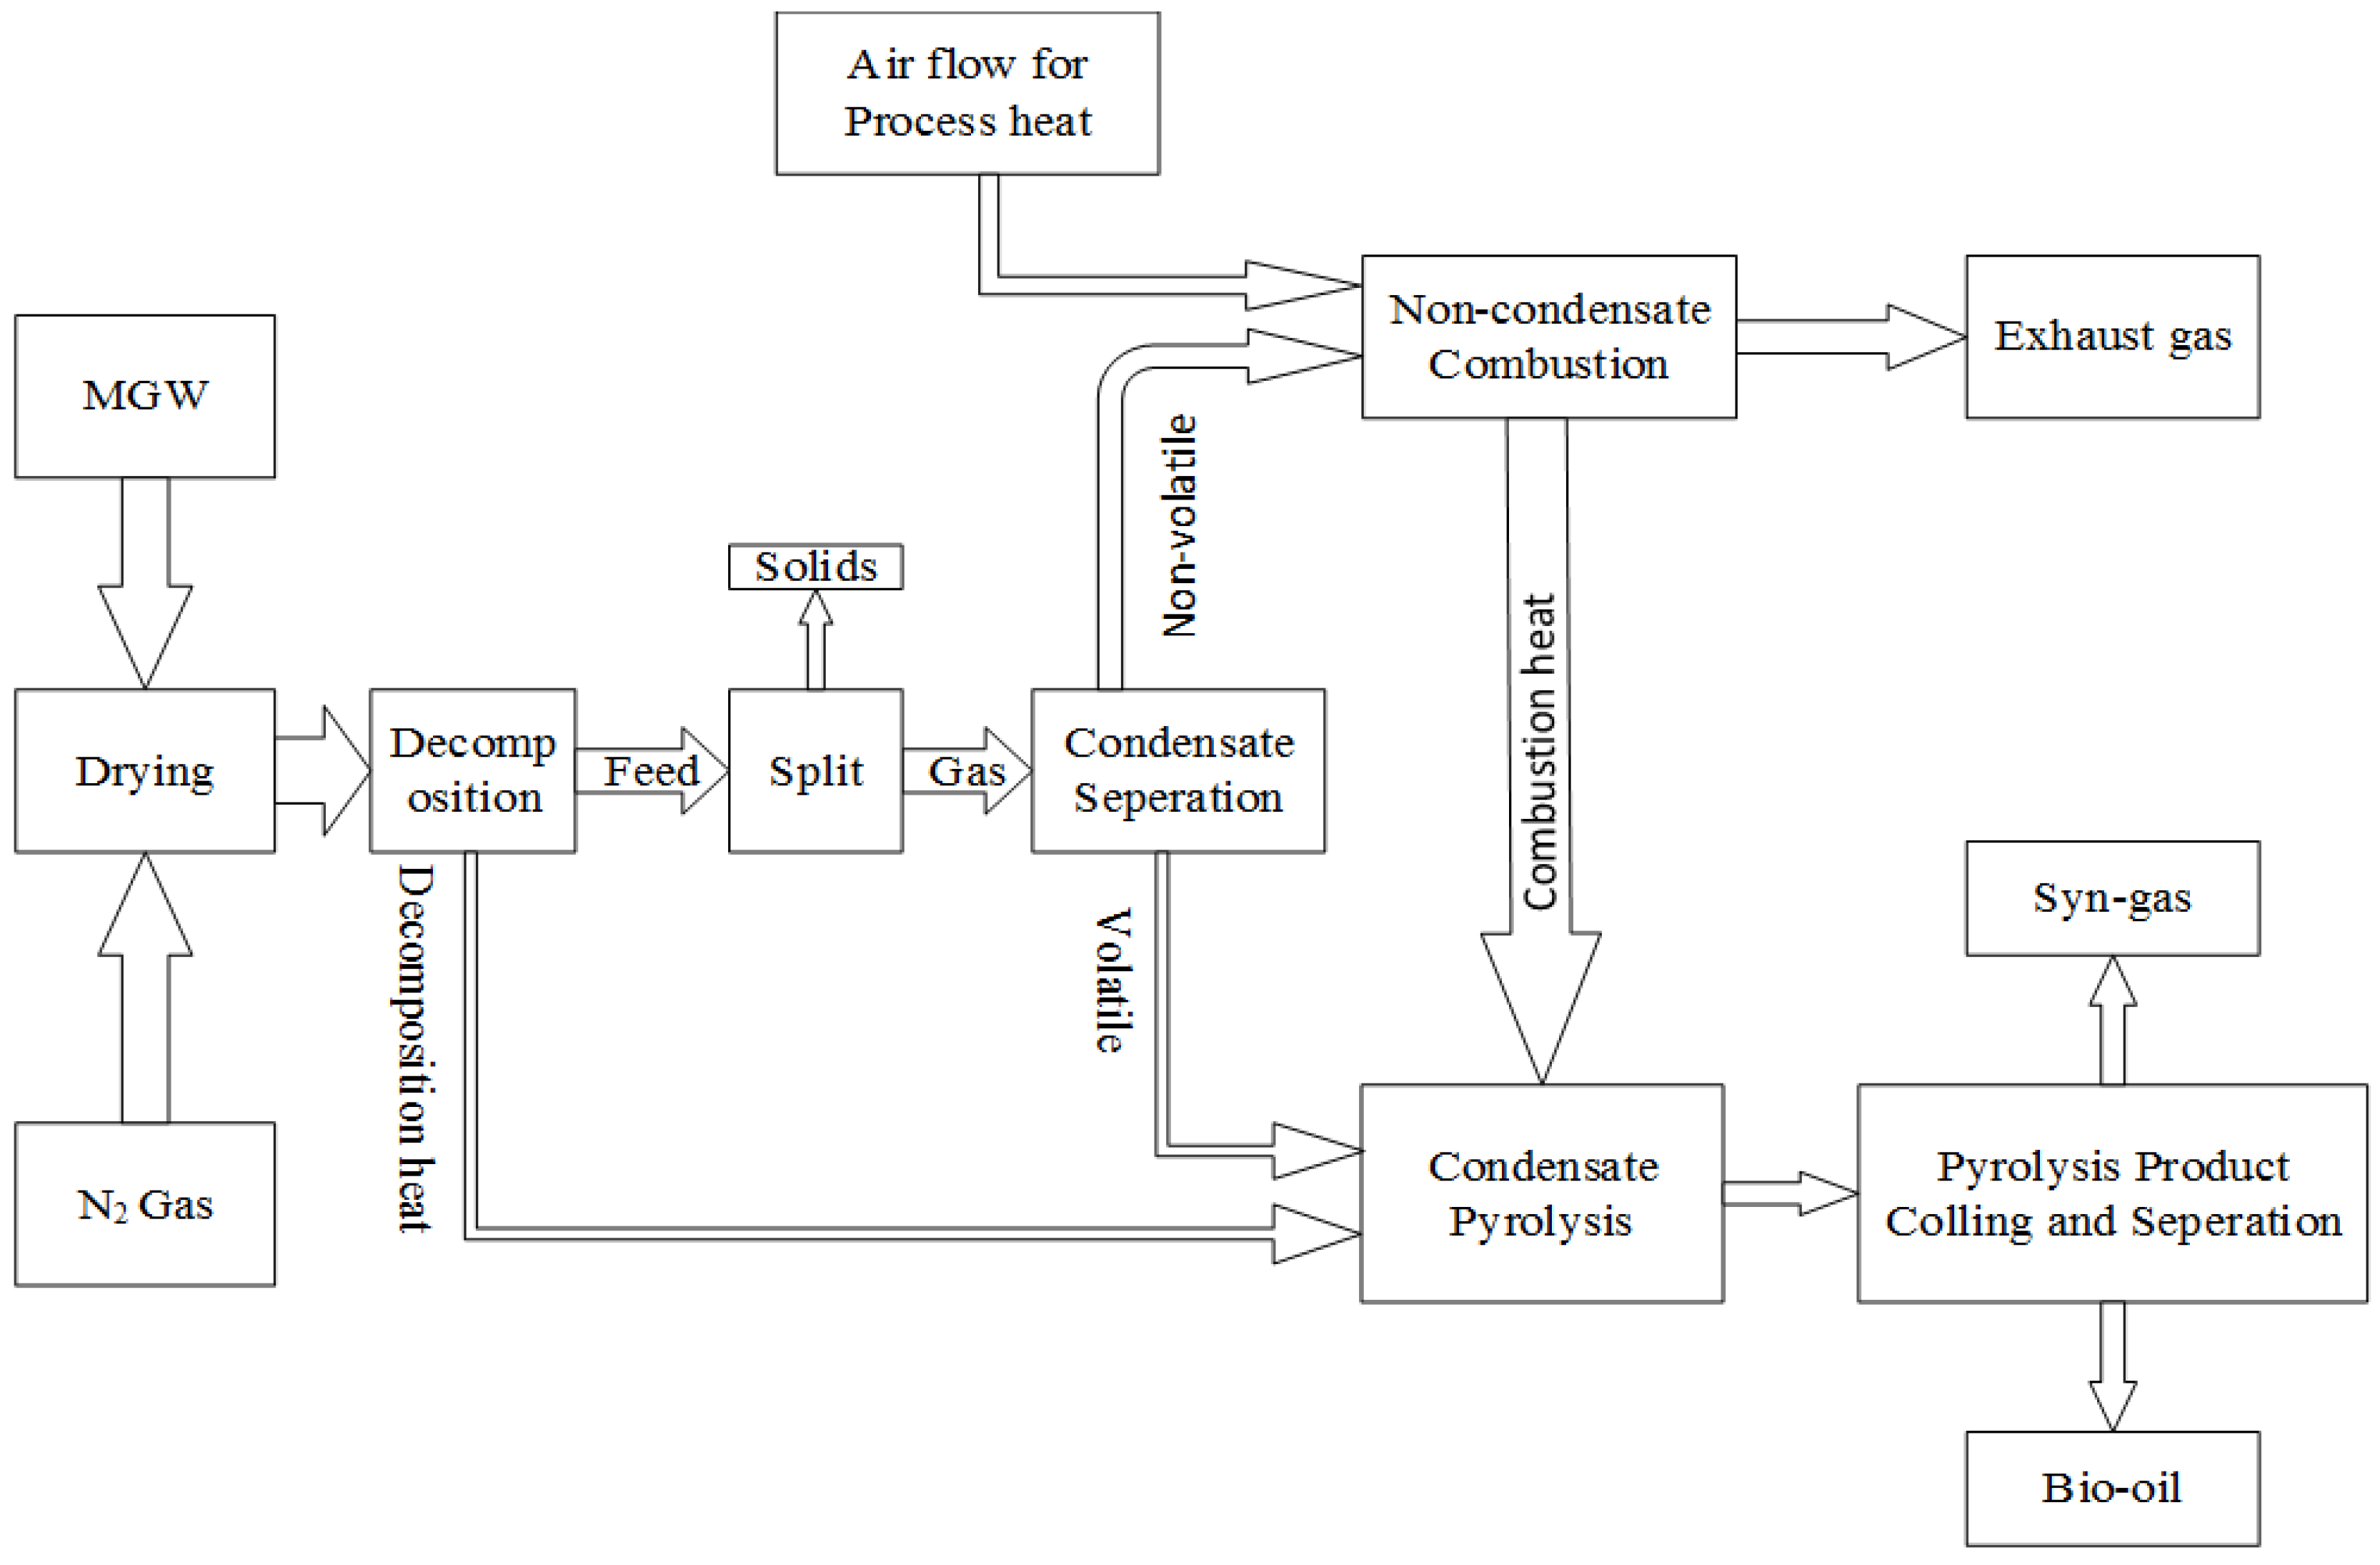
In this study, a green waste pyrolysis process was developed in four basic stages. In the first stage, the moisture content of green waste feed is reduced and, in the second stage, biomass is decomposed according to its elemental constituents. In the third stage, volatile matter and non-volatile components are separated. In the fourth stage, pyrolysis reactions are modelled using the Gibbs free energy minimisation approach [
21]. The Aspen Plus process simulator does not have a built-in pyrolysis model, so a number of reactor types were defined in Aspen Plus. A pyrolysis process diagram is presented in
Figure 4. An Aspen Plus model was developed based on this pyrolysis process flow diagram. The basic assumptions incorporated to make the model feasible are steady state kinetic free equilibrium model, isobaric process, all sulphur goes to H
2S, no oxides of nitrogen are produced, non-condensable gas is burned for pyrolysis heat, liquid (condensate) phase was considered for pyrolysis, and ash analysis is not considered.
Figure 4.
Flowsheet of MGW pyrolysis.
3.4. Simulation
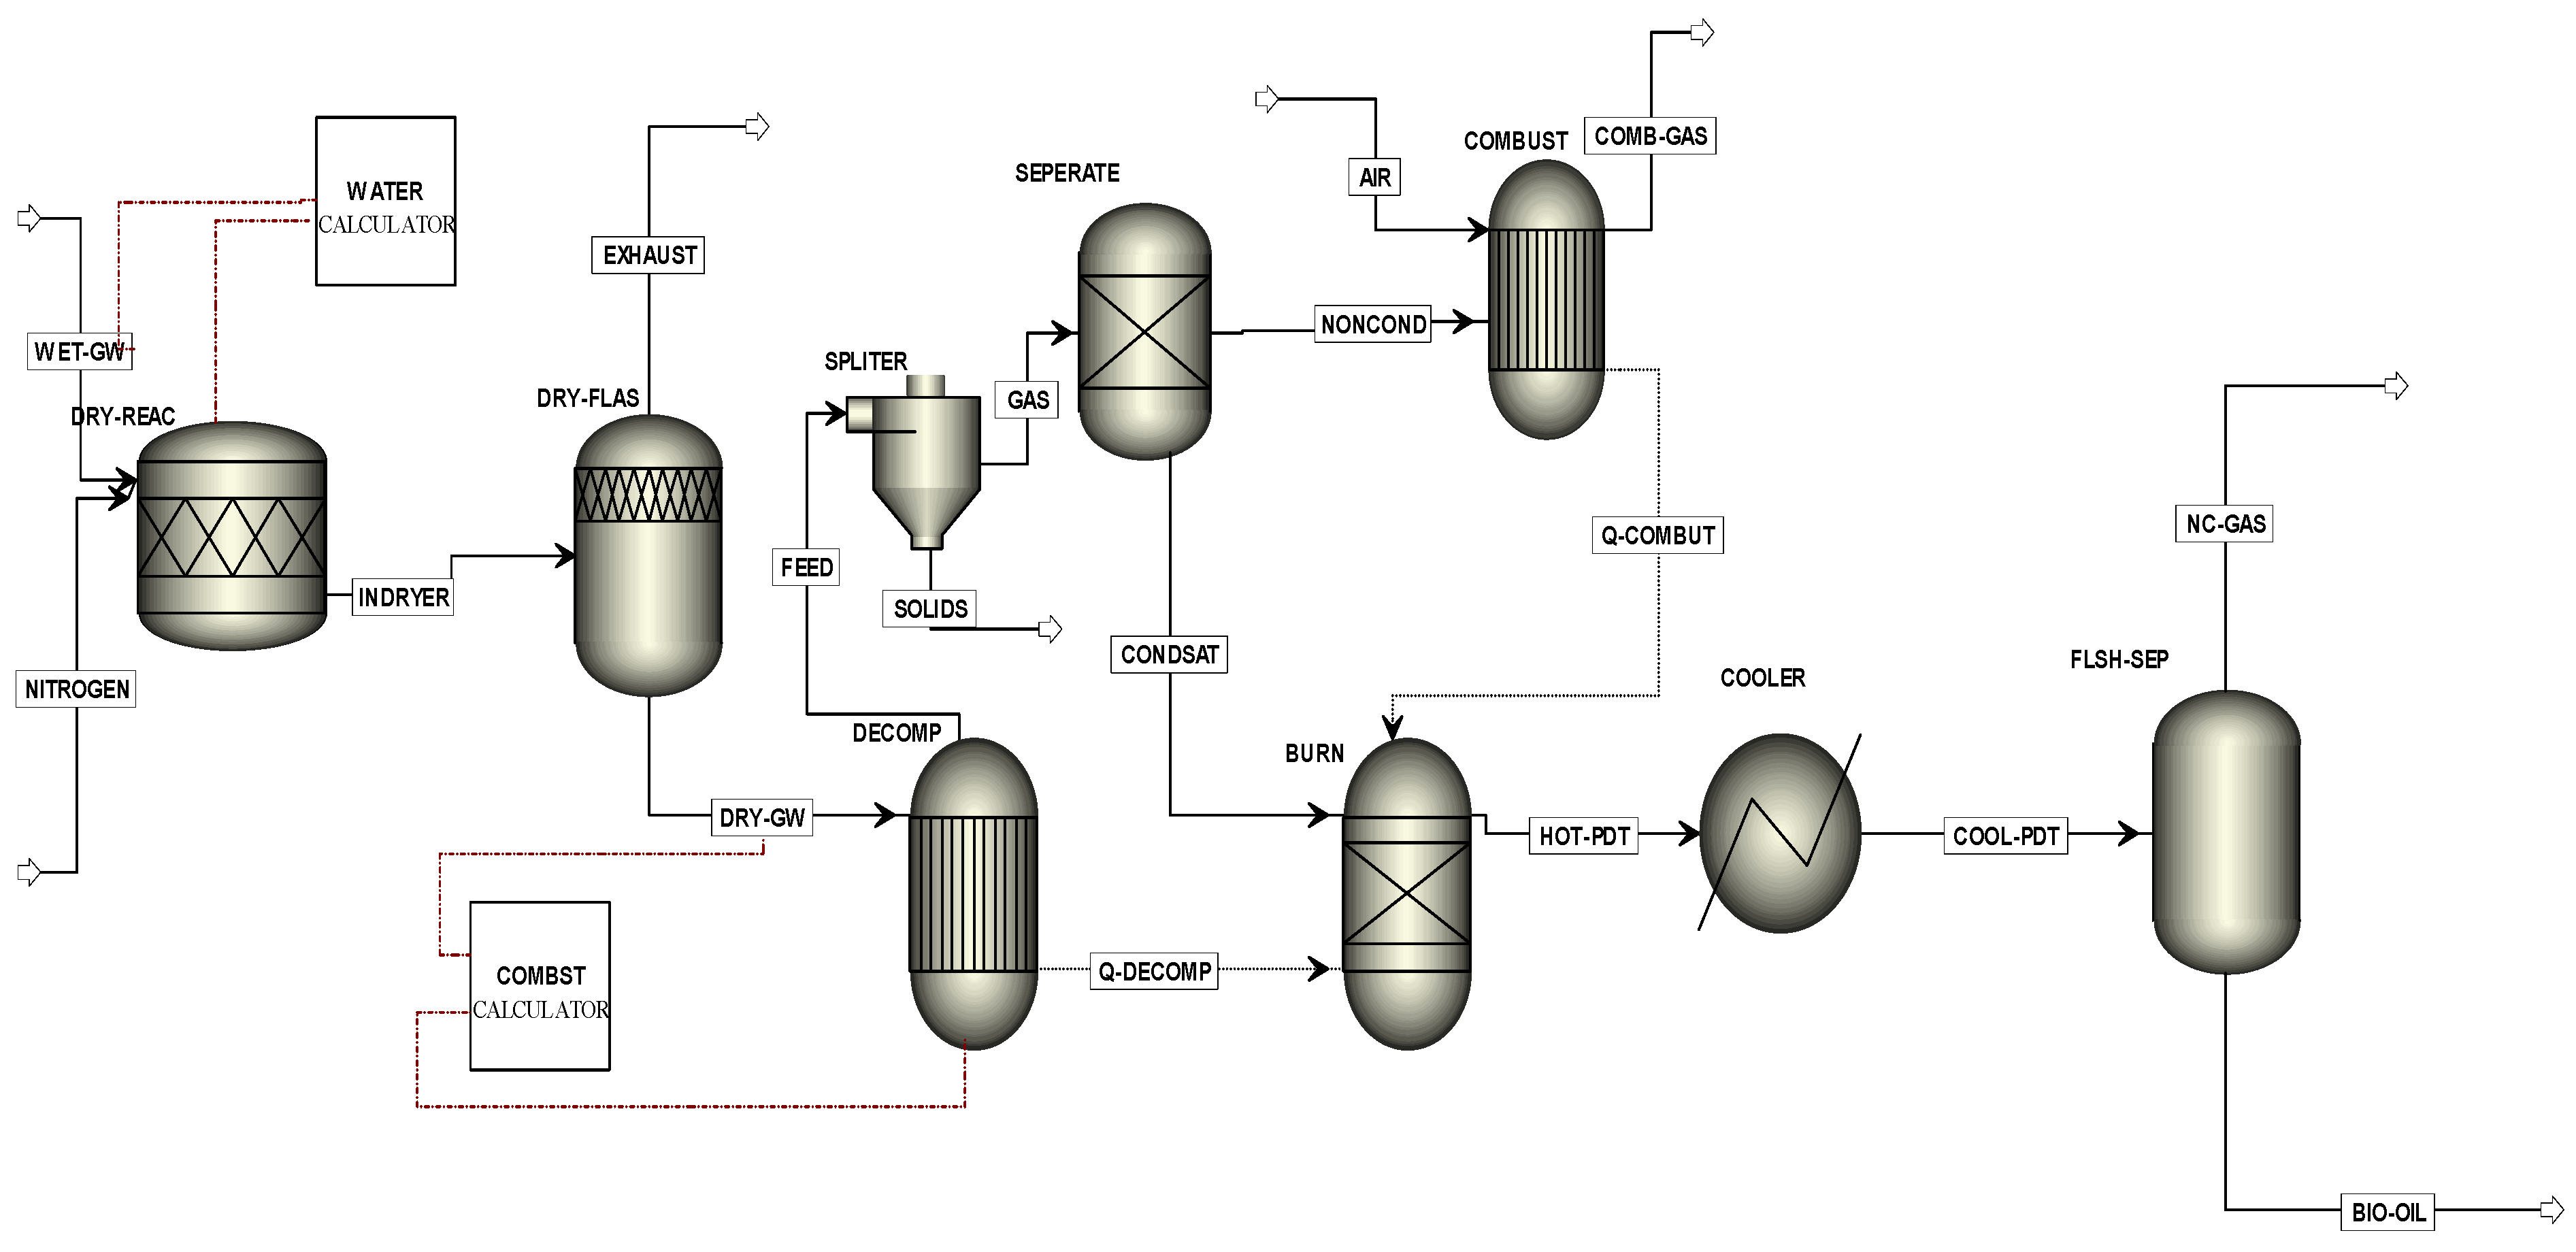
To produce the Aspen Plus model flow diagram, a series of unit operation blocks were used. The user needs to place these blocks on a flowsheet by specifying material and energy streams. The Aspen Plus computer program can quantitatively model the pyrolysis process. The process simulator does not have a built-in pyrolysis model, but it does have a number of built-in unit block models. In Aspen Plus, the blocks are chosen so that the different parts of the process can be specified as realistically as possible. The blocks are connected with proper linking streams to develop the flow diagram. The MGW pyrolysis process flow diagram is presented in
Figure 5.
Figure 5.
Aspen Plus model flowsheet of MGW pyrolysis.
Figure 5.
Aspen Plus model flowsheet of MGW pyrolysis.
In order to successfully run the graphical flow model in
Figure 5, the basic data input was required in different stages of, for instance, global data specifications, components specifications, properties, streams, blocks. Flowsheet title, run type, input and output units, valid phases (e.g., vapour–liquid or vapour–liquid–liquid), pressure and temperature are the most commonly used setup information and they were entered in the setup specifications global sheet. Components specifications were used to specify all the components required for the simulation. Enthalpy, entropy, free energy and molar volume are computed for conventional components and conventional solids. Property models in the property method specified on the global data specification were used. Global settings include run type specification, input mode, stream class, flow basis, ambient pressure, temperature (for dynamic runs only), valid phases and free water.
Property models were specified on the Properties Advanced NC-Props form. The components specification sheet is used to select possible chemical components of the model for calculation. This sheet is used to specify all types of components such as conventional, solids, non-conventional, petroleum assays, blends, petroleum components, and hypothetical liquids in the model. Property settings of each stream and block are the most vital parts of the modelling. The properties of the stream include the material fed into the system, source, destination and behaviour of the system represents how the simulation will react. Temperature, pressure, composition and particle size distributions are also included in the stream properties. The block requires data pertaining to chemical composition, chemical reaction kinetics, reaction equilibrium, reaction stoichiometry and other characteristics, depending on the model of the block.
One of the general input requirements for the Aspen Plus pyrolysis performance model is to choose a physical property data set. Within the software there are several options for such data sets. Each option uses either different data sources and/or different methods for calculating thermodynamic properties. The property method used in the simulation is the Peng–Robinson with Boston–Mathais alpha function option. This choice reflects the recommendation of the Aspen Plus user manual. The Peng–Robinson equation of state with Boston–Mathias alpha function (PR–BM) was used in this study to estimate all physical properties of the conventional components in the pyrolysis process [
23].
Nonconventional components do not participate in chemical or phase equilibrium. Therefore, enthalpy and density are calculated for nonconventional components. In this simulation, HCOALGEN and DCOALIGT use the proximate analysis, ultimate analysis, and sulphur analysis to calculate the enthalpy and density of MGW [
21]. HCOALGEN and DCOALIGT models were used for enthalpy and density calculations for both green waste and ash. The process model considers the mass balances for compounds and reactors. The property specification sheet is used to specify the global property methods and models for calculation. The Peng–Rob property method was used for hydrocarbons and light gases, such as carbon dioxide, hydrogen sulphide and hydrogen. The property methods setting sheet was used to specify the physical property models and method options for each component on the Components Specifications sheet. The model has been implemented with choices of different alpha functions and has been extended to include advanced asymmetric mixing rules for hydrocarbon processing. The HCOALGEN model includes a number of different correlations, for instance, heat of combustion, heat of formation and heat capacity. In this study heat of combustion was selected for HCOALGEN and the user input value as HCOMB was chosen for the calculation method. In
Figure 5, the stream “Wet-GW” was specified as a non-conventional stream and the ultimate and proximate analyses were entered. Thermodynamic conditions and mass flow rates were also entered. Inert nitrogen gas was used for the fluidised beds reactor. Nitrogen is used as inert gas due to its high natural abundance (about 77% in air) and low relative cost. In the first stage, heating and drying of the raw feed material were performed. The “RStoic” block was used for instantaneous drying of the green waste. A FORTRAN subroutine “water calculator” was used for reducing moisture from feed materials. Due to the presence of high quantities of dust particles in the green waste, the authors used a “Flash2” separator to remove the dust particles.
There are two general approaches to creating an equilibrium model: Stoichiometric and non-stoichiometric [
20]. The stoichiometric approach needs a clearly defined reaction mechanism. On the other hand, no particular reaction mechanisms are involved in the non-stoichiometric approach. In the non-stoichiometric approach, the only input needed to specify the feed is its elemental composition or ultimate analysis data. The non-stoichiometric equilibrium model is based on minimising Gibbs free energy in the system without specifying the possible reactions taking place. The RYIELD reactor block was used for the pyrolysis/devolatilization part of the modelling. “RYIELD” converts the feed material into its constituting elements, including carbon, hydrogen, oxygen, nitrogen, sulphur and ash, by specifying the yield distribution according to the green waste ultimate analysis [
24]. A separate column model was used to separate the condensate materials and solids in order to perform the volatile reactions. Non-stoichiometric Gibbs free energy equilibrium based splitter model was used for solid yield separation. In this study, the non-condensable gases have been used for the heat, which drives the MGW pyrolysis process. As suggested by Ramzan
et al. [
23] and Kabir
et al. [
25], the “RGIBBS” reactor model was used for condensable vapour combustion in the absence of air with the assumption that volatile reactions follow the Gibbs free energy equilibrium. It was assumed that the total yield of volatile products was equal to the volatile content of the green waste and that all the sulphur in the green waste reacts with H
2 to form H
2S. After cooling, the outlet streams of the RGibbs reactor enter into a flash separator block, which separates tar or oil from syn-gas.
3.5. Simulation Results and Model Validation
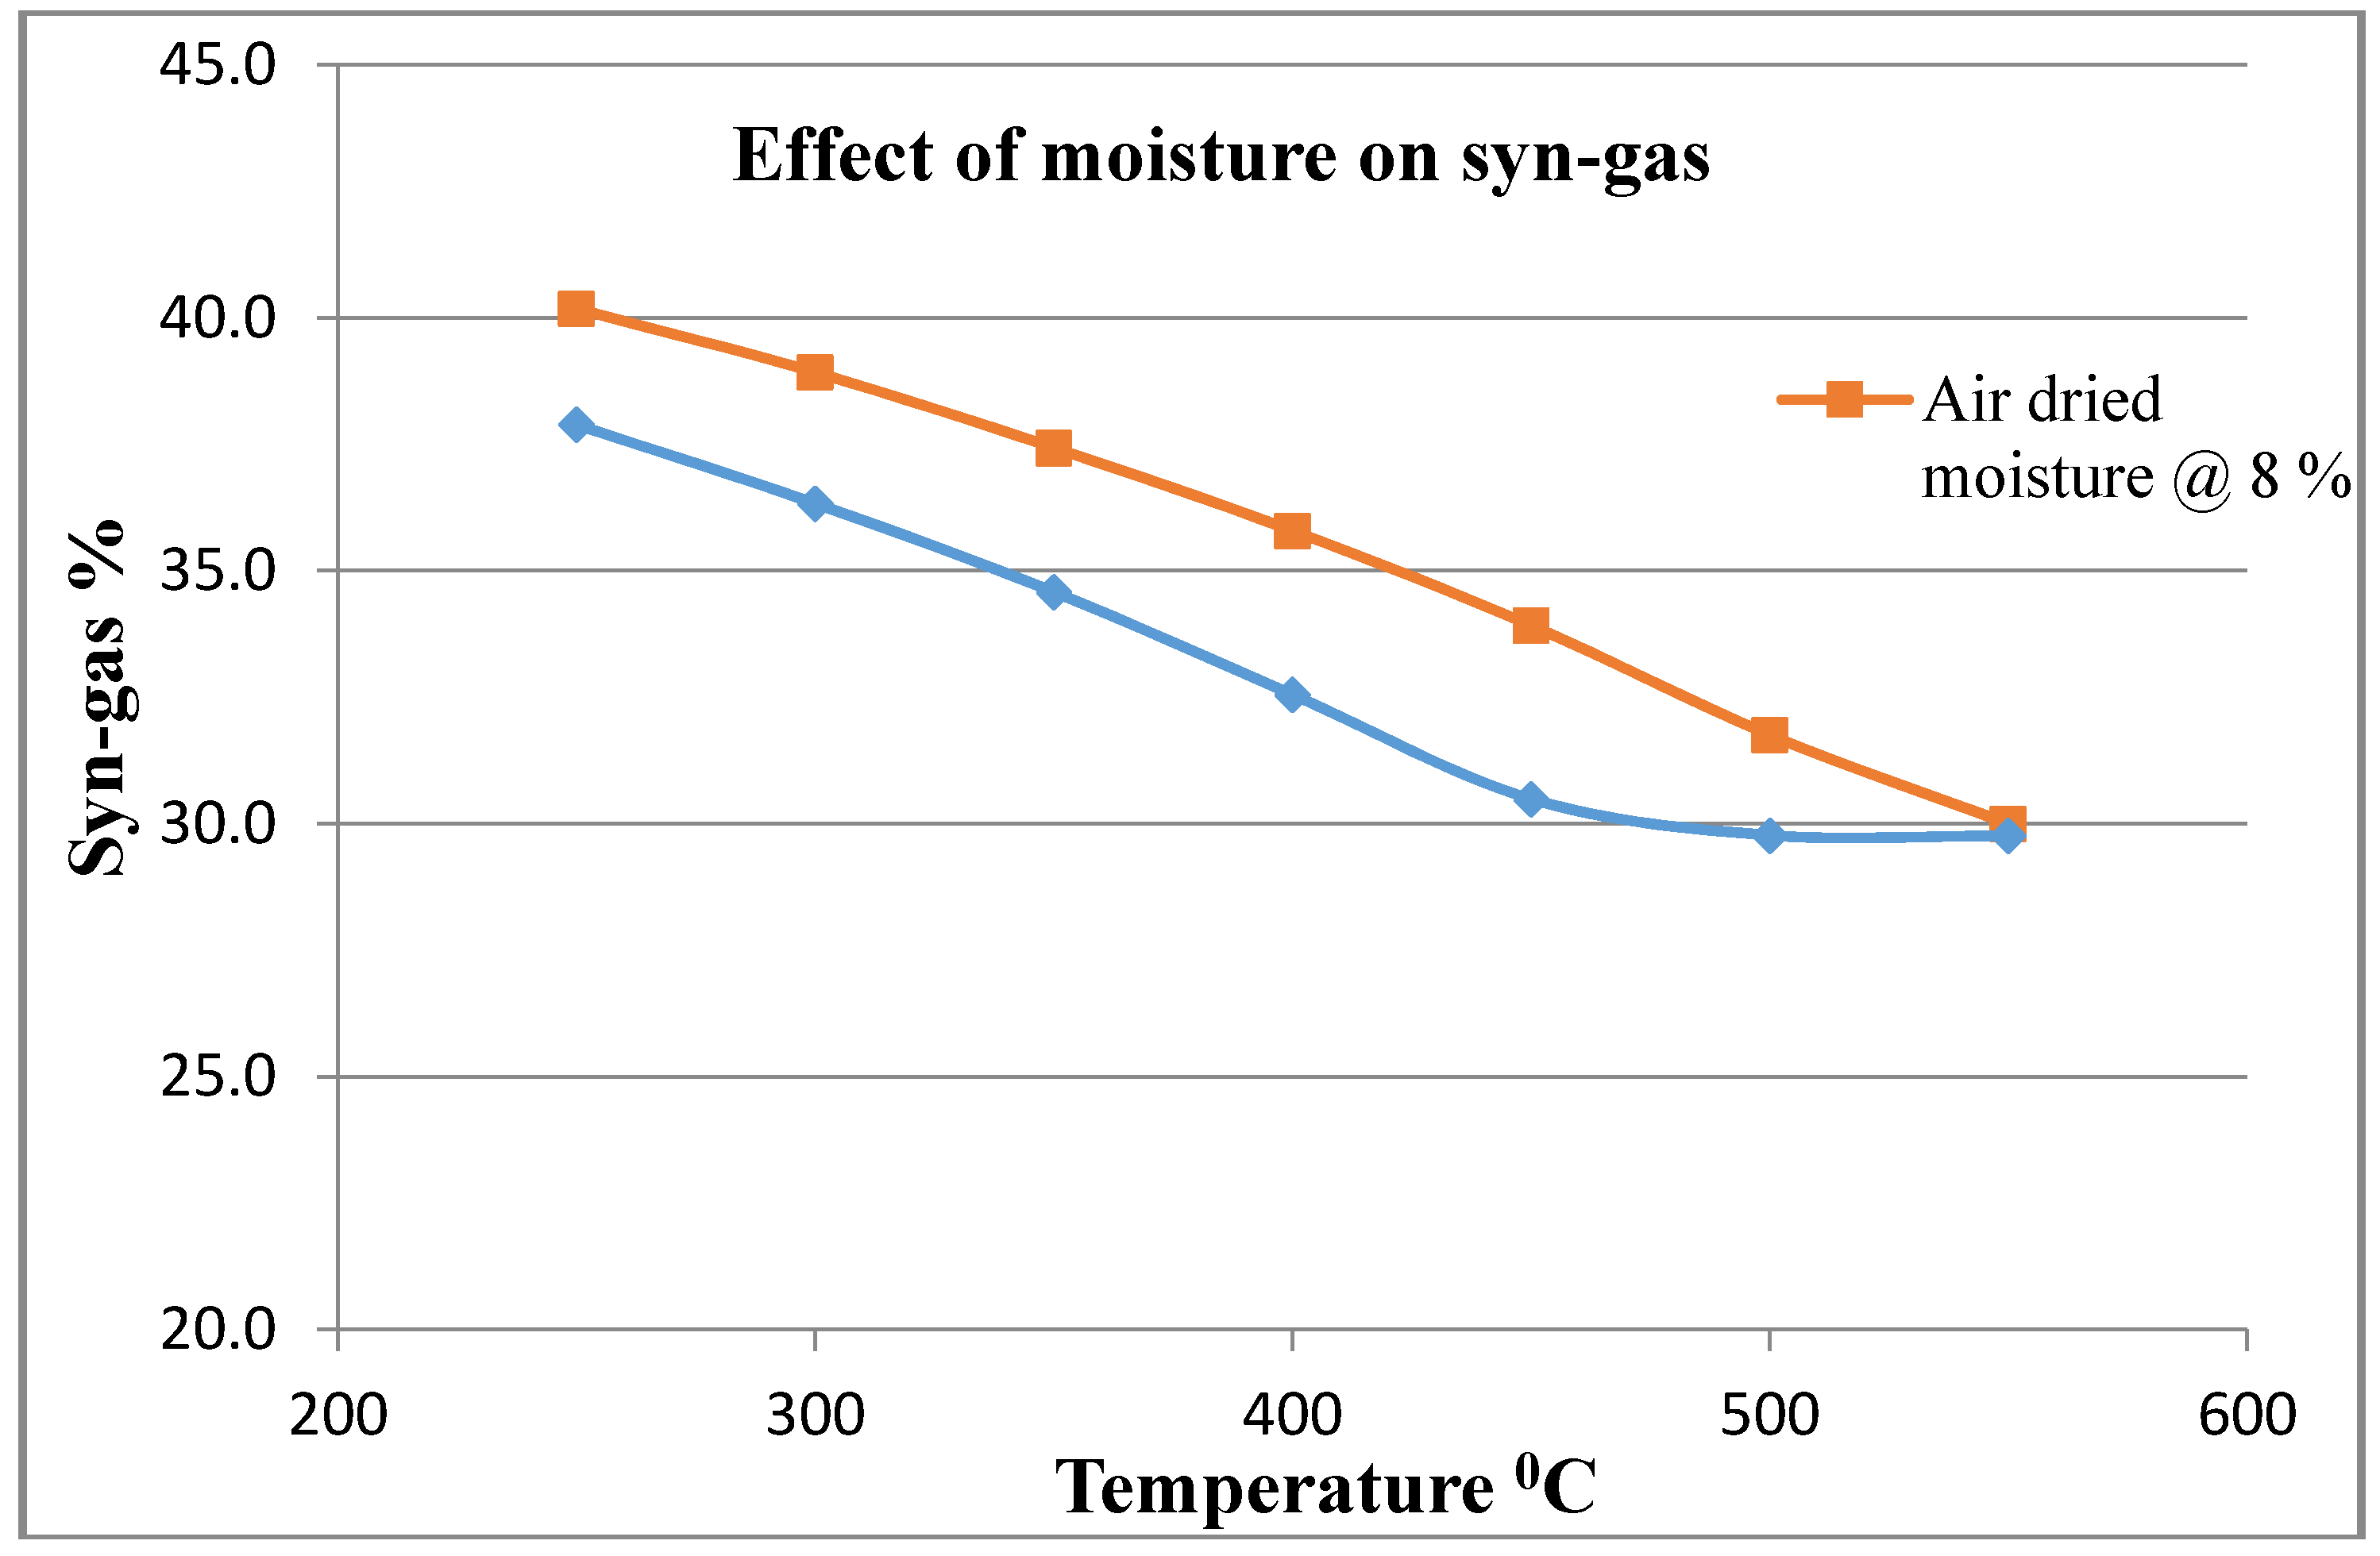
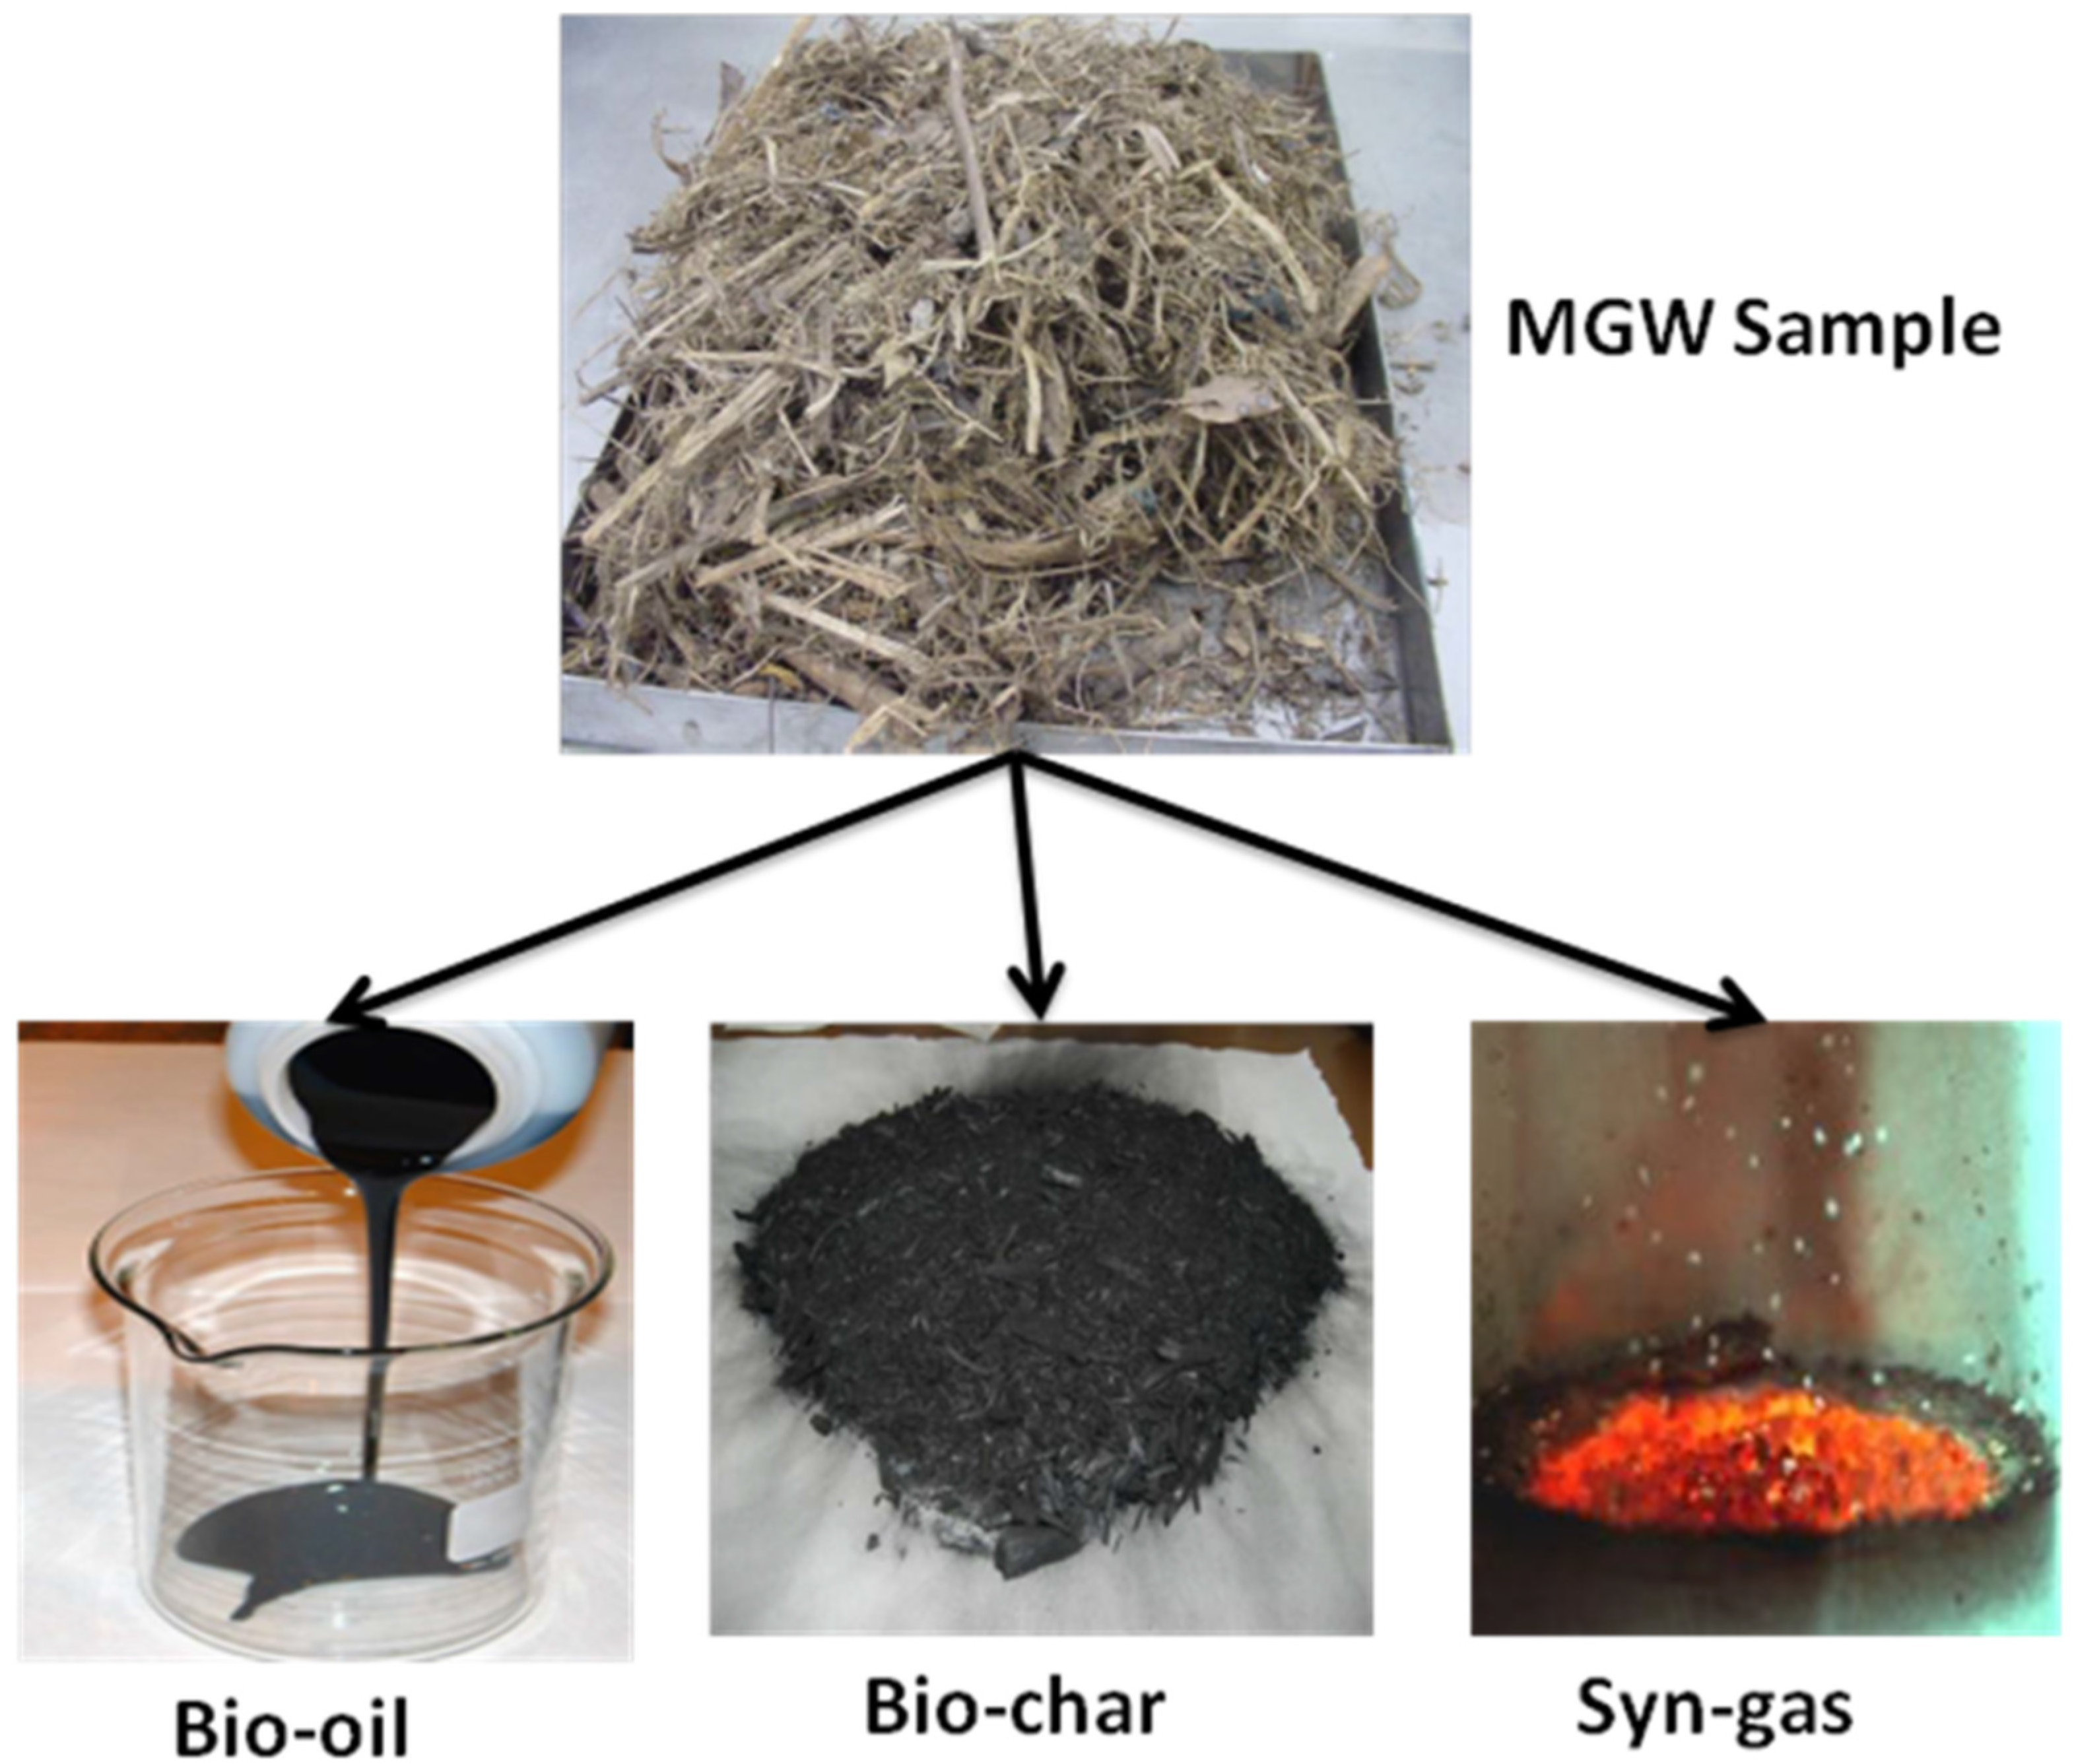
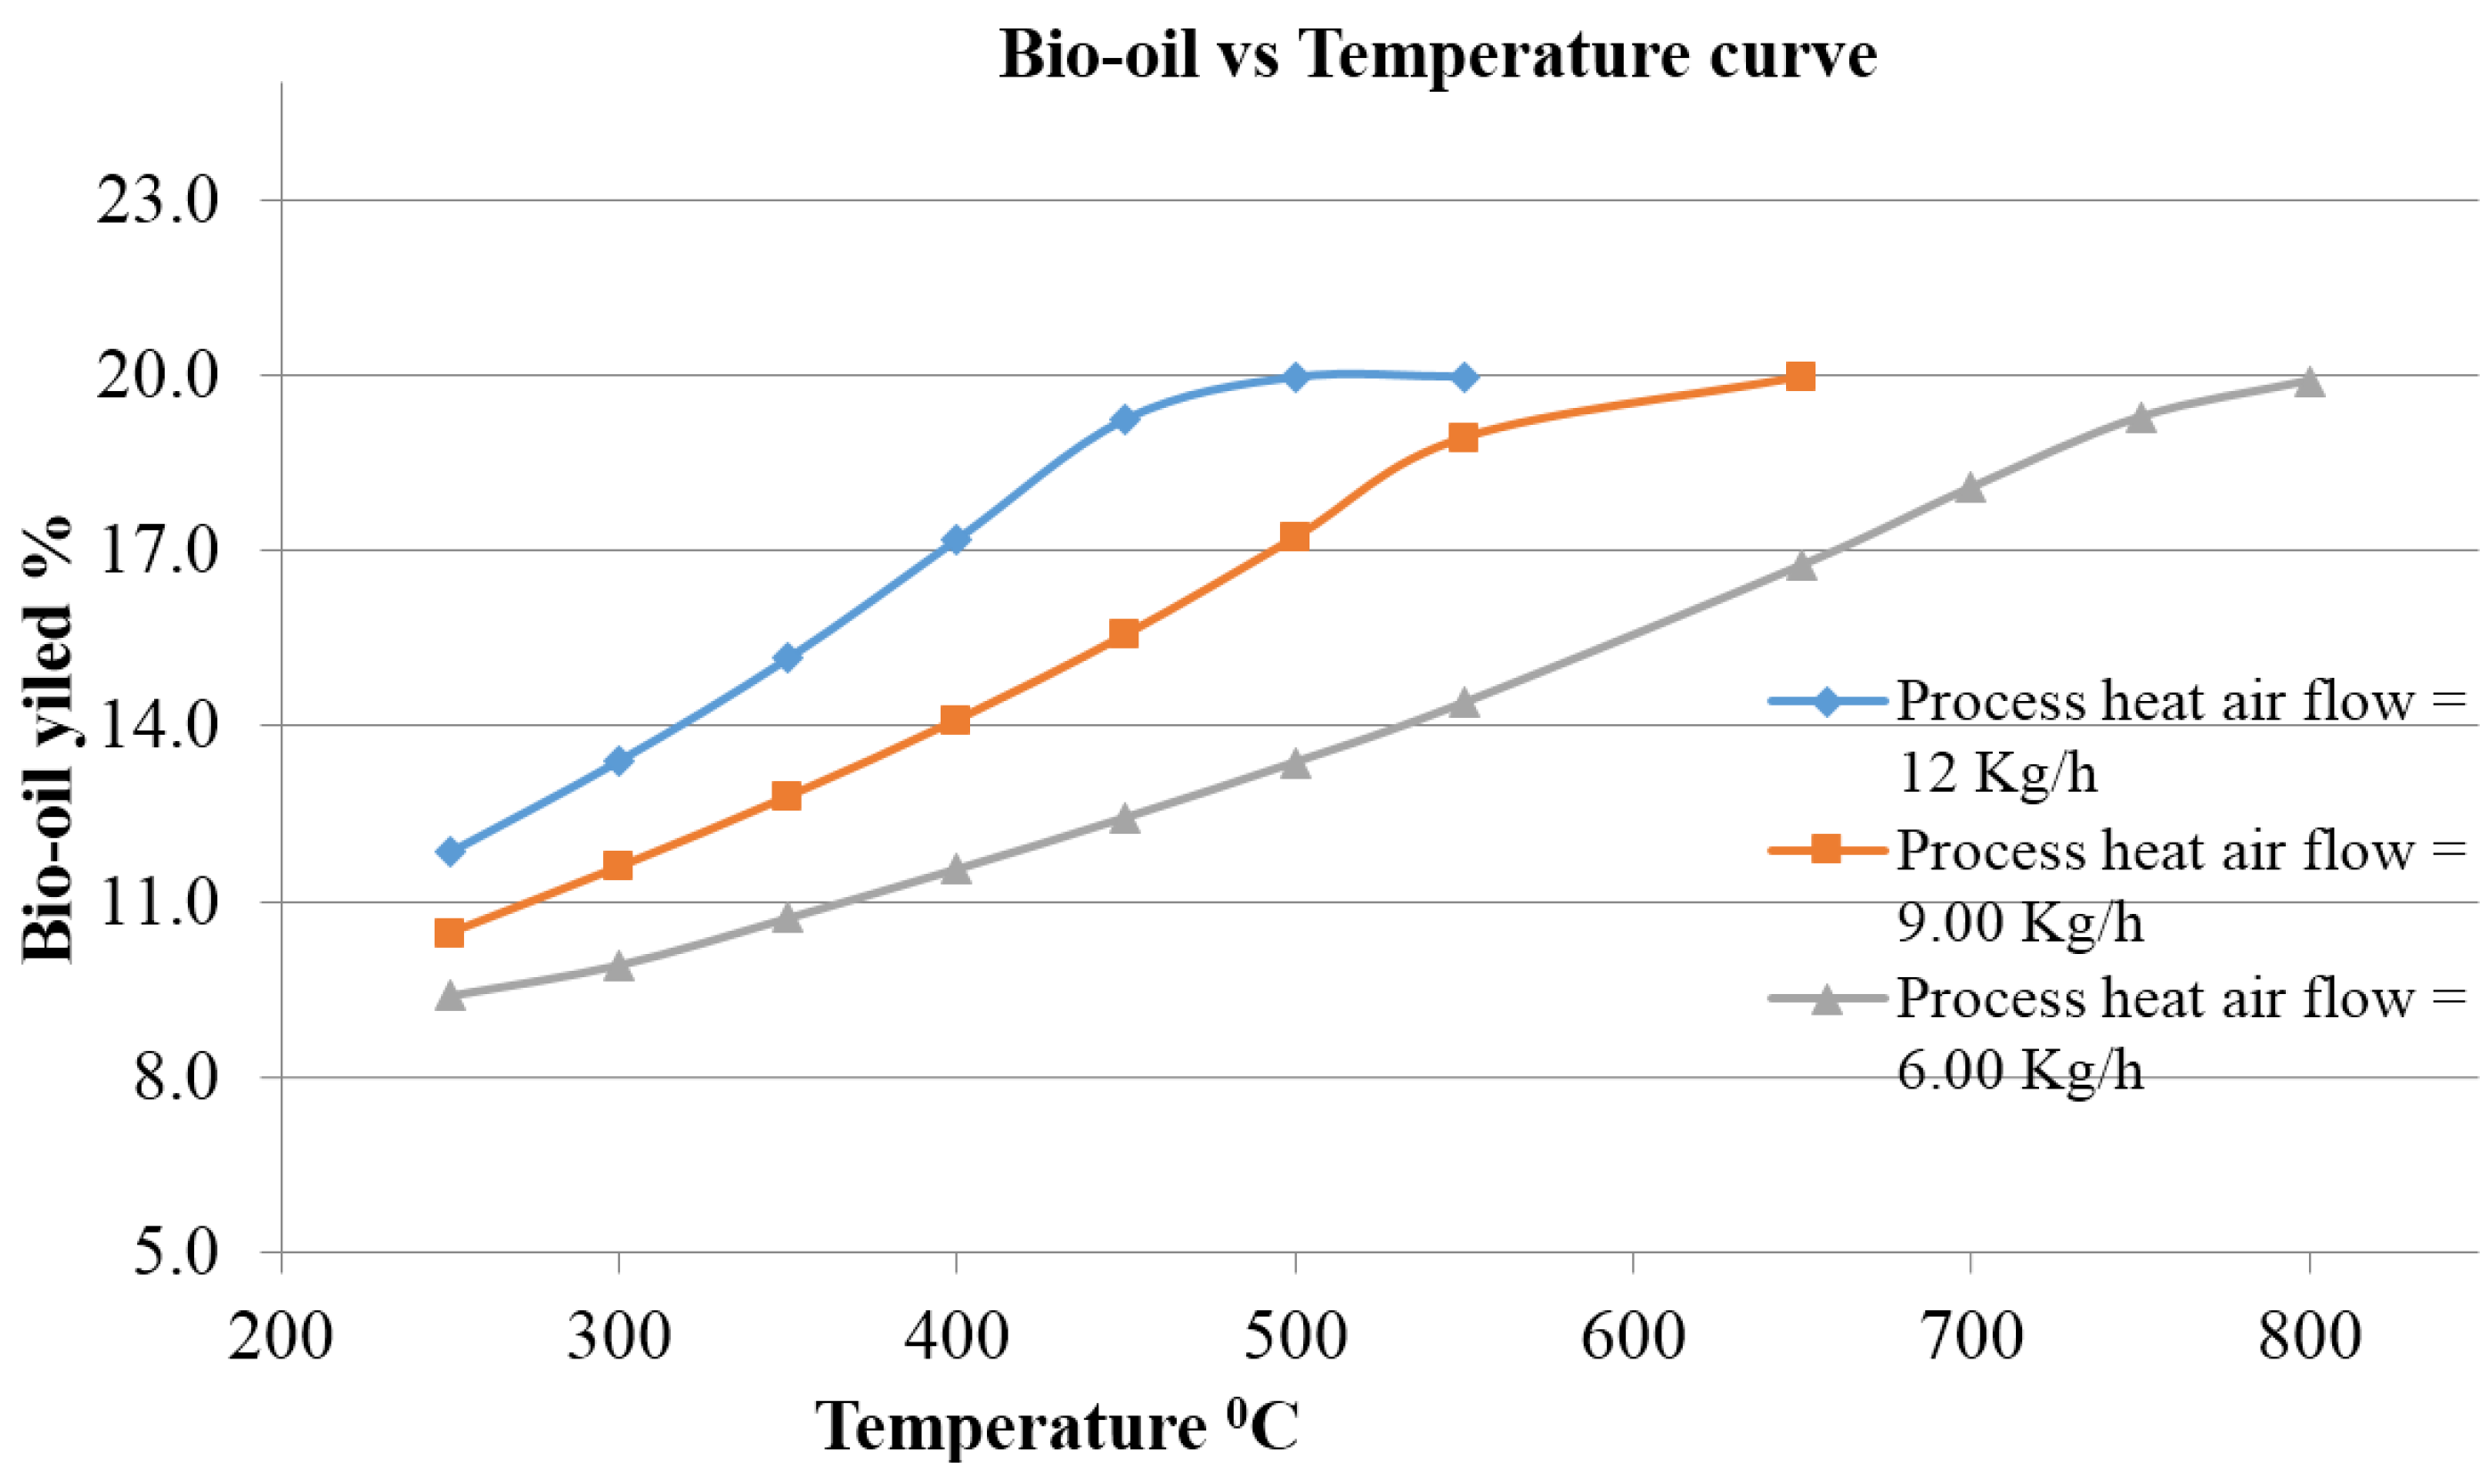
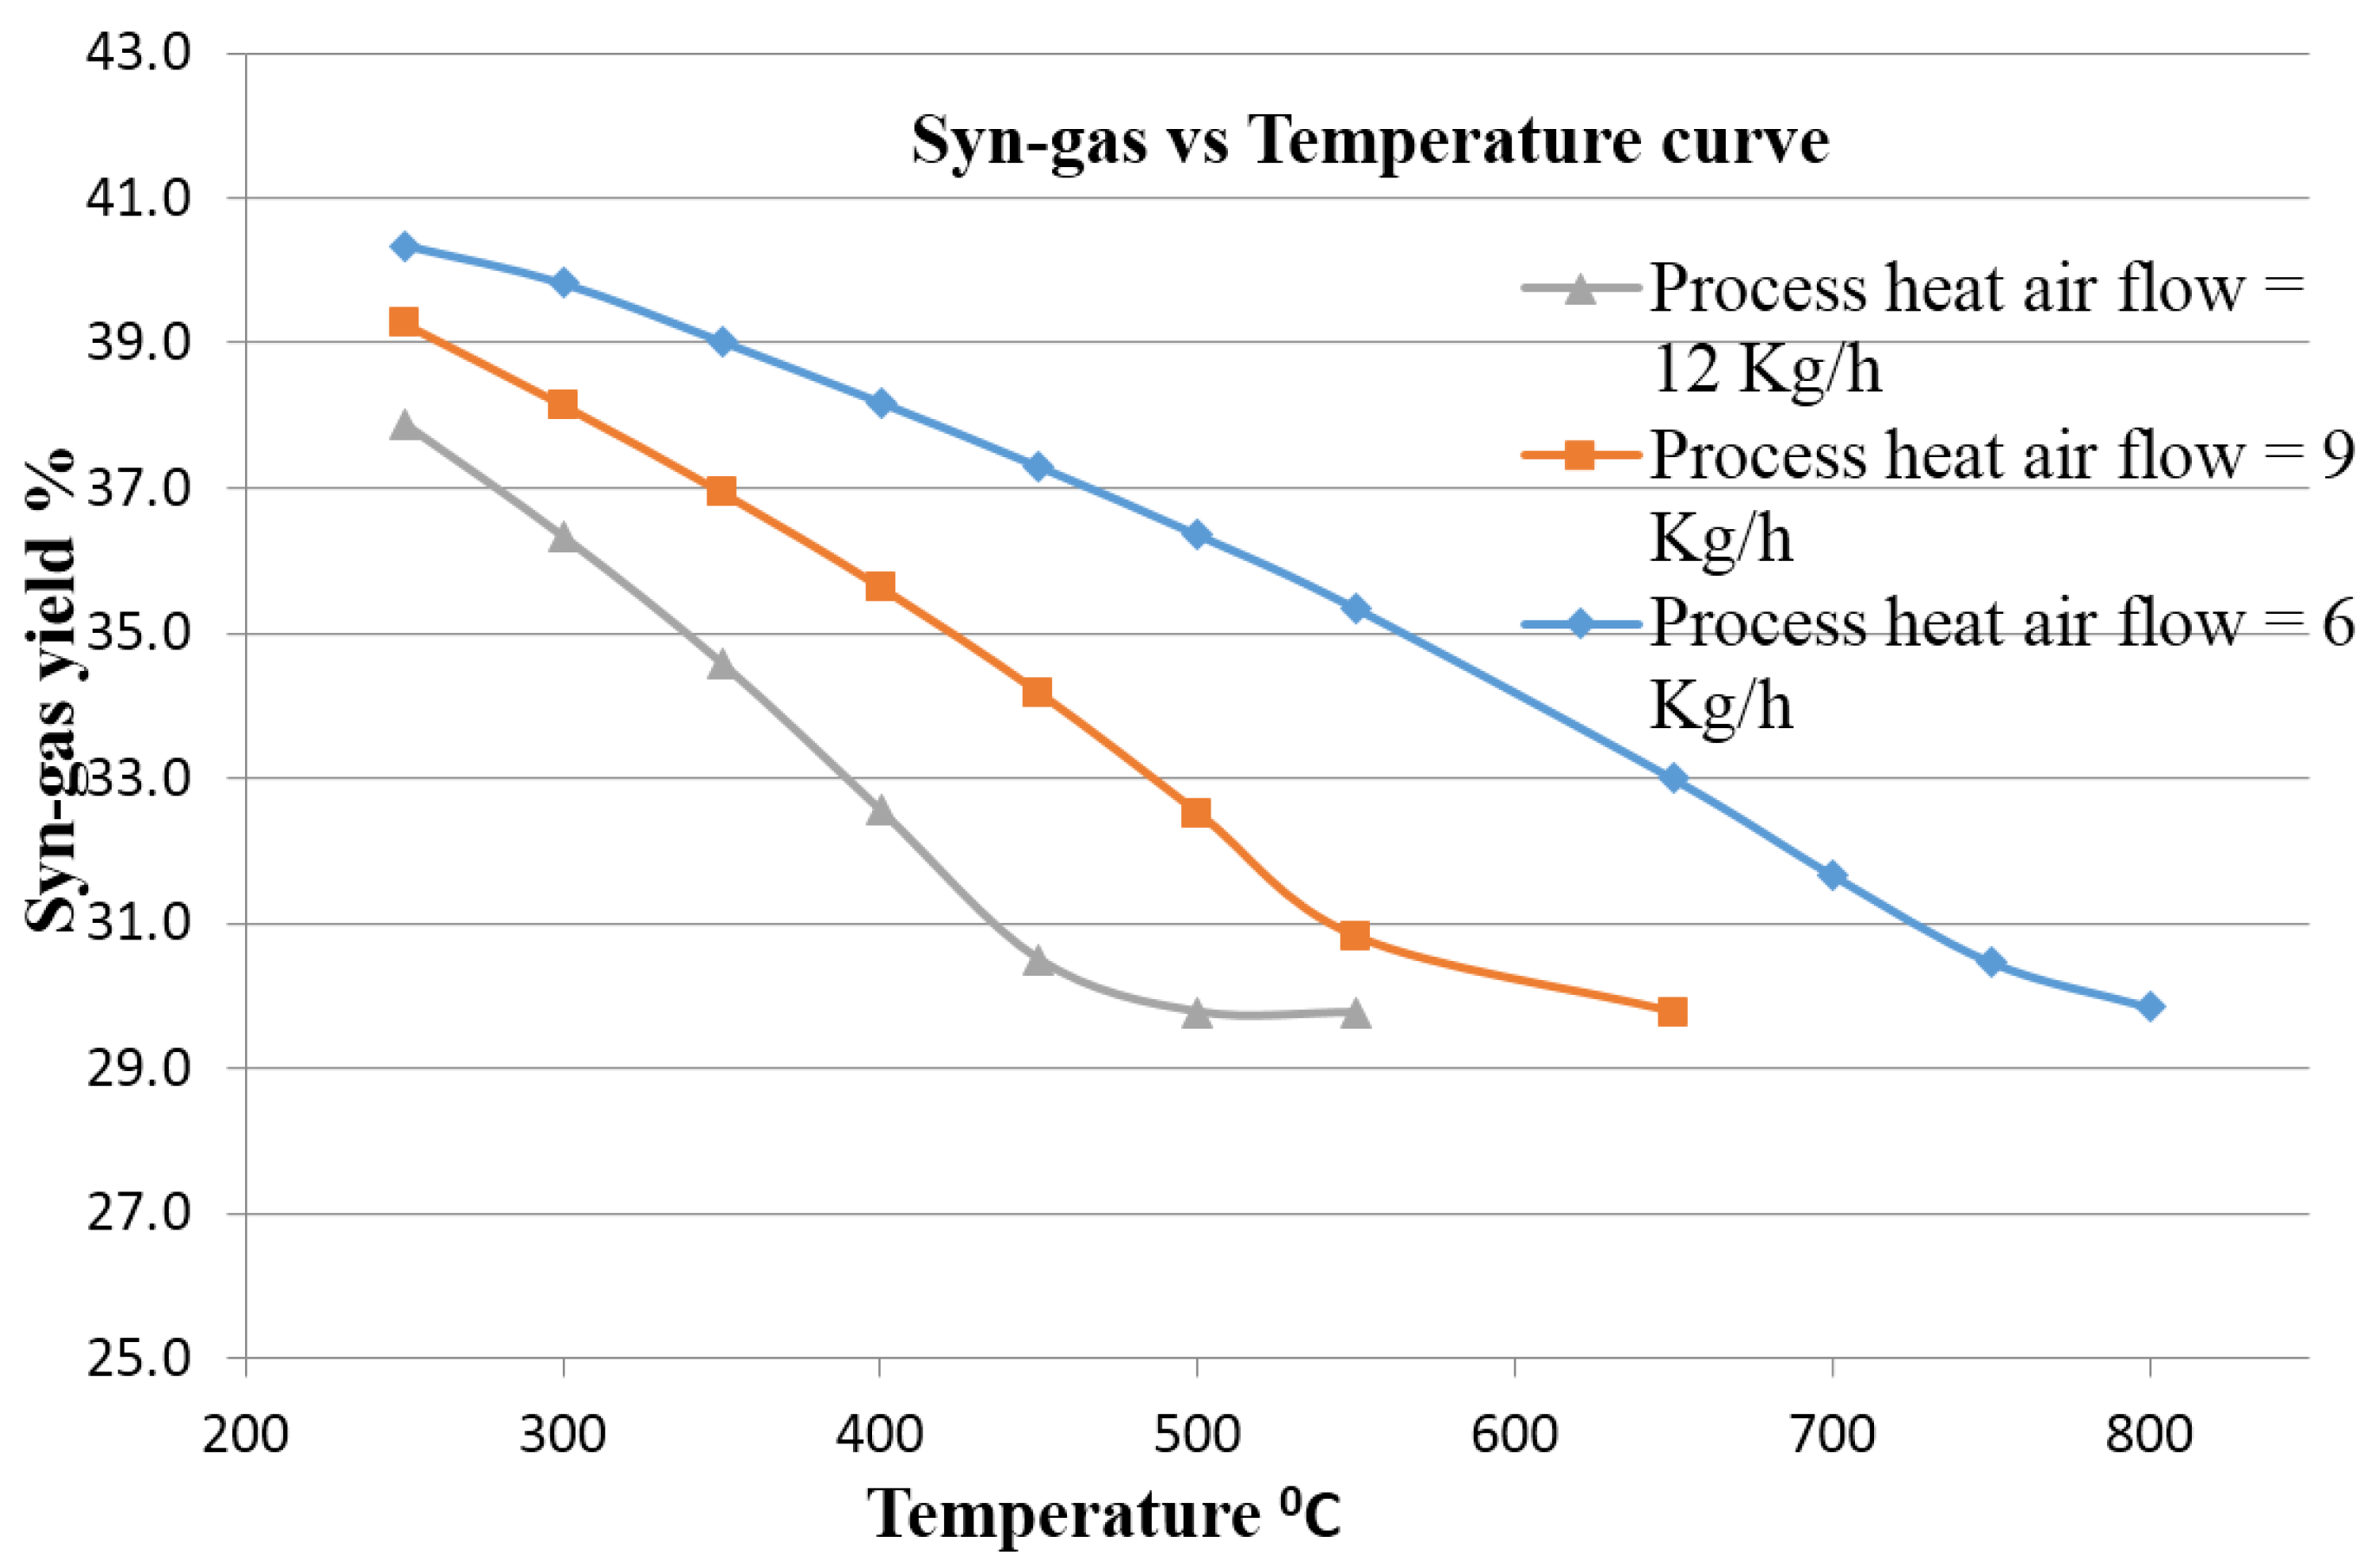
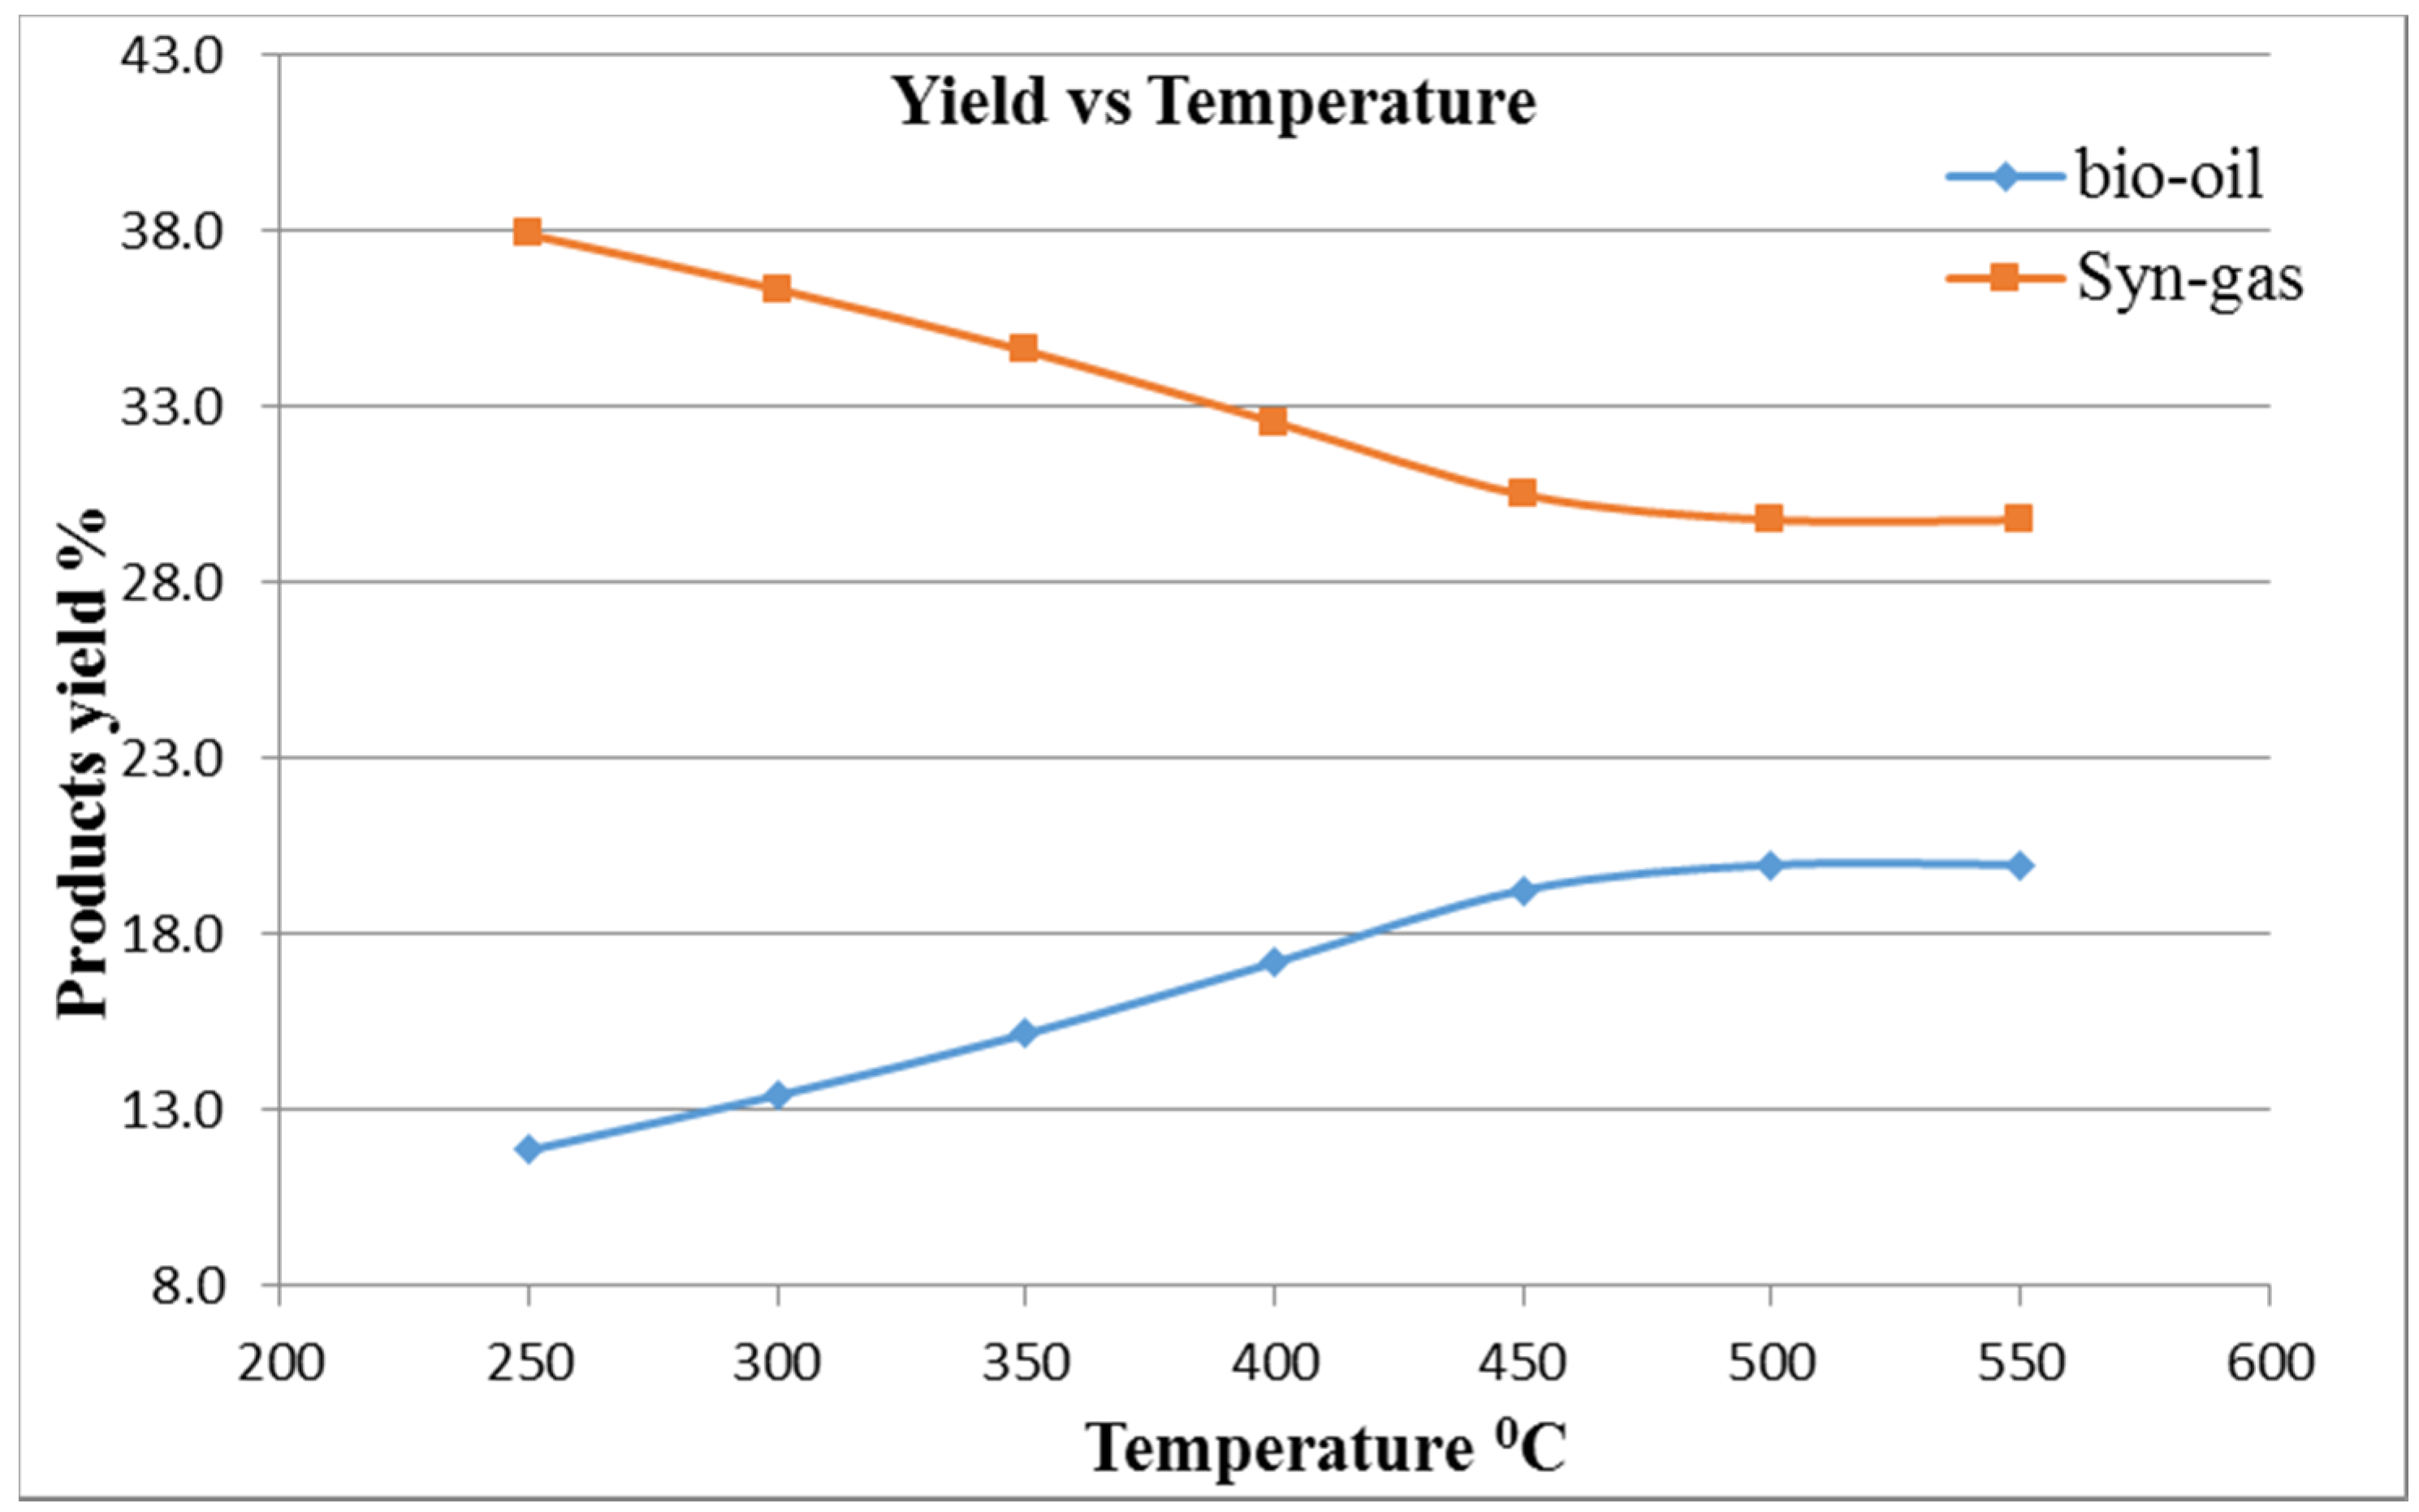
The pyrolysis of MGW was carried out in a series of trials by varying the temperature from 250 to 750 °C, particle size from 1 to 32 mm diameter, with nitrogen gas flow rate of 34.02 kg/h and initial feedstock sample flow rate at 6 kg/h. The thermal decomposition was performed at 500 °C at atmospheric pressure. The simulation process was generated by burning non-condensable gaseous products. In this simulation, maximum bio-oil was found at a reactor temperature of 500 °C at an air flow of 12 kg/h. It can also be observed that a higher temperature is needed when the air flow rate is less. The simulation model’s basic results data and a comparison between experimental results
vs. model yield distributions are shown in
Table 5 and
Table 6, respectively. The
Table 6 indicates that there are some variations between the simulated results and the experimental values. The variations are most probably due to some external and internal causes into the simulation input data. However, the differences are reasonable since the variations for carbon, hydrogen, nitrogen, and sulphur are only 7.3%, 15.82%, 7.04% and 5.56%, respectively. The presence of impurities and dust particles in the supplied feedstock may explain the discrepancies between the experimental and simulation results. Ash analysis, and the presence of impurities and dust particles were not considered in the simulation data and this may be another possible cause for the discrepancies.
Table 5.
Some MGW pyrolysis yield products data from Aspen Plus simulation at 500 °C, process heat airflow 12 kg/h and one atmospheric pressure.
Table 5.
Some MGW pyrolysis yield products data from Aspen Plus simulation at 500 °C, process heat airflow 12 kg/h and one atmospheric pressure.
| Mass Flow (kg/h) | Bio-Oil | Syn-Gas | Bio-Char |
|---|
| H2O (kg/h) | 0.3645941 | 0.0646201 | 0.1305779 |
| N2 (kg/h) | 1.10 × 10⁻¹² | 7.20 × 10⁻⁶ | 0.0117729 |
| O2 (kg/h) | 4.17 × 10⁻¹⁷ | 2.41 × 10⁻⁸ | 0.6402156 |
| C (kg/h) | 1.4 | - | 2.47 |
| S (kg/h) | 0.011337 | 2.30 × 10⁻⁸ | 2.98 × 10⁻³ |
| SO2 (kg/h) | 2.13 × 10⁻⁹ | 2.43 × 10⁻⁶ | 0 |
| H2 (kg/h) | 0 | 0 | 0.0911988 |
| Temperature K | 323.15 | 323.15 | 773.15 |
| Pressure atm | 1.000276 | 1.000276 | 1.000276 |
| Enthalpy cal/g | −3787.731 | −2180.099 | −182.3073 |
| Entropy cal/g·K | −2.138915 | 0.0208932 | 0.642707 |
| Density g/cc | 0.969511 | 1.56 × 10⁻³ | 1.89 × 10⁻⁴ |
| Total Flow kg/h | 1.198328 | 1.392286 | 2.452687 |
Table 6.
Comparison between elemental compositions of MGW experimental results and model predictions.
Table 6.
Comparison between elemental compositions of MGW experimental results and model predictions.
| Elemental Composition (Mass %) | Experiment | Model | Variation |
|---|
| C | 46.60% | 43.20% | 7.3% |
| H2 | 5.50% | 6.37% | 15.82% |
| N2 | 0.71% | 0.66% | 7.04% |
| S | 0.18% | 0.19% | 5.56% |
| O2 | 47.01% | 50.24% | 6.86% |


