1. Introduction
Thermoelectric (TE) materials, which can directly accomplish the interconversion between electric and thermal energy, have been extensively investigated for the application in a power generator to convert waste heat to electrical power or in a refrigerator to pump heat [
1,
2,
3]. The energy conversion efficiency using TE technology is mainly dominated by materials’ figure of merit (
zT). So far, lots of advanced thermoelectric materials, such as Bi
2Te
3, PbTe, skutterudites, clathrates, Cu
2X (X = S, Se), Mg
2Si, Half-heusler, have been developed to show the enhanced
zTs [
4,
5,
6,
7,
8,
9,
10,
11,
12], which has attracted increasing interest from industry. A recent report by Zhao
et al. shows a high
zT of 2.6 at 923 K in SnSe single crystal, far above the values of other state-of-the-art TE materials [
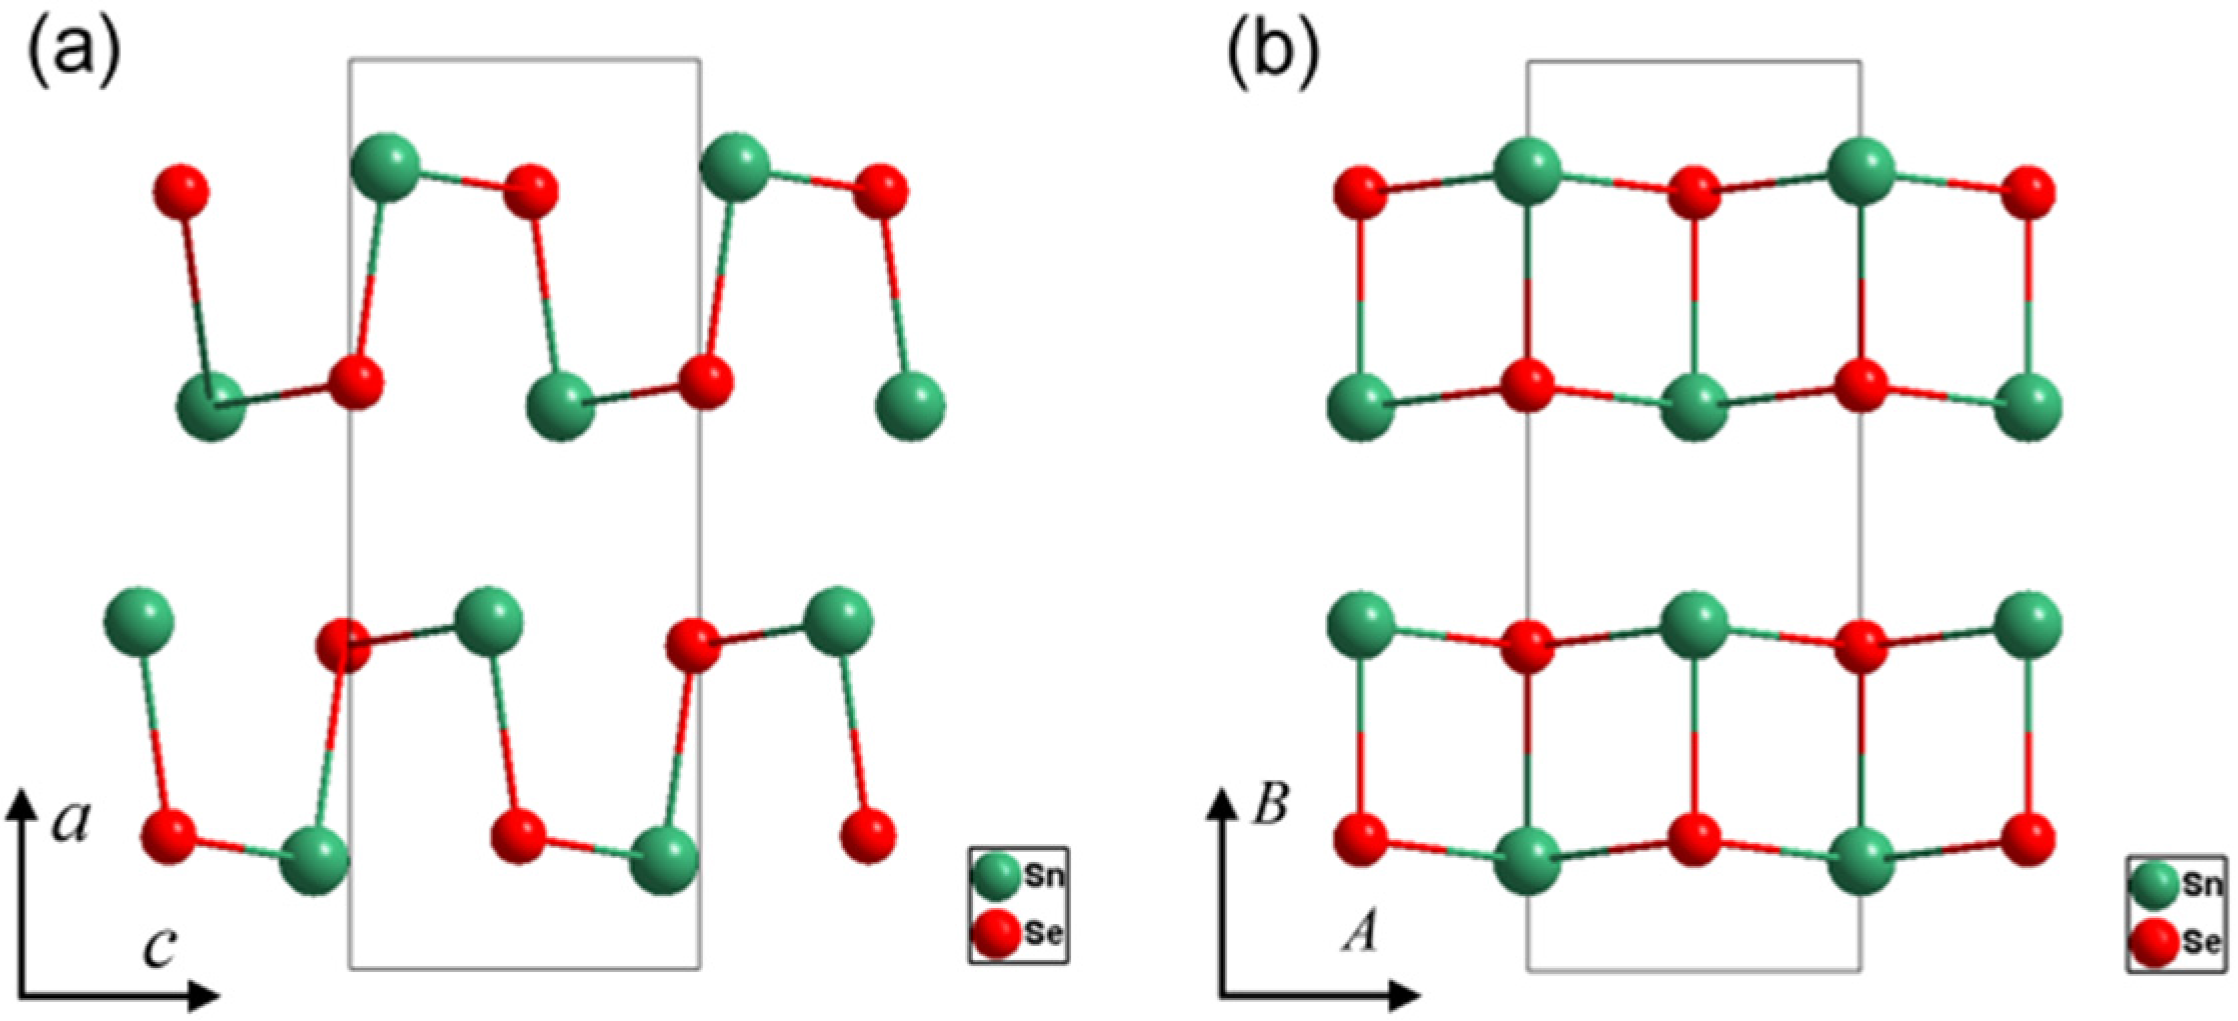
13]. SnSe is a typical narrow band gap semiconductor and belongs to
Pnma space group with orthorhombic structure (lattice parameter
a = 11.501,
b = 4.153, and
c = 4.445 Å) at room temperature [
14,
15]. It derives from the NaCl-type structure [
16]. The tin atoms are surrounded by highly distorted octahedron of selenium atoms to form a zig-zag structure. Each Sn atom has six dominant heteropolar bonds, and the Sn-Se bond lengths are 2.74 (1), 2.79 (2), 3.34 (2), and 3.47 (1) Å, where the numbers in the brackets are the number of the Sn-Se bonds in an octahedron [
14].When increasing temperature, the
Pnma space group changes to a high symmetry orthorhombic
Cmcm space group (lattice parameter
a = 4.310,
b = 11.705, and
c = 4.318 Å) around 807 K as shown in
Figure 1 [
15,
17,
18]. In the high-temperature phase, each Sn (or Se) atom has four neighboring Se (or Sn) atoms with a distance of 3.06 Å in a layered plane.
Figure 1.
Crystal structures of SnSe at room temperature with Pnma space group (a) and at high temperature with Cmcm space group (b).
Figure 1.
Crystal structures of SnSe at room temperature with Pnma space group (a) and at high temperature with Cmcm space group (b).
The typical zig-zag structure endows SnSe with anisotropic TE transports in different crystallographic directions. This has been clearly shown in the single crystal samples, where the
b and
c axes exhibit high electrical and thermal conductivity while the
a axis shows low electrical and thermal conductivity, leading to hugely deviated
zTs along the corresponded
a,
b, and
c axes. However, the recent literatures [
19,
20] show different trends in the polycrystalline SnSe samples where similar
zTs are obtained in different oriented directions. In general, the crystallographic orientations in polycrystalline samples are between the two end limits of single crystal sample. Therefore, the thermoelectric properties are expected to between the
b (or
c) and
a axes. Although the anisotropic transport properties have been reported in polycrystalline SnSe samples [
15,
19,
21], the detailed physical trend and understanding of the anisotropic structure on the electrical and thermal transport as well as thermoelectric figure of merit has not been constructed.
In this work, we report the investigation of anisotropic thermoelectric properties in oriented polycrystalline SnSe. By collecting and comparing the literature data, the effect of the structure orientation on the electrical and thermal transports will be presented and discussed.
2. Results and Discussion
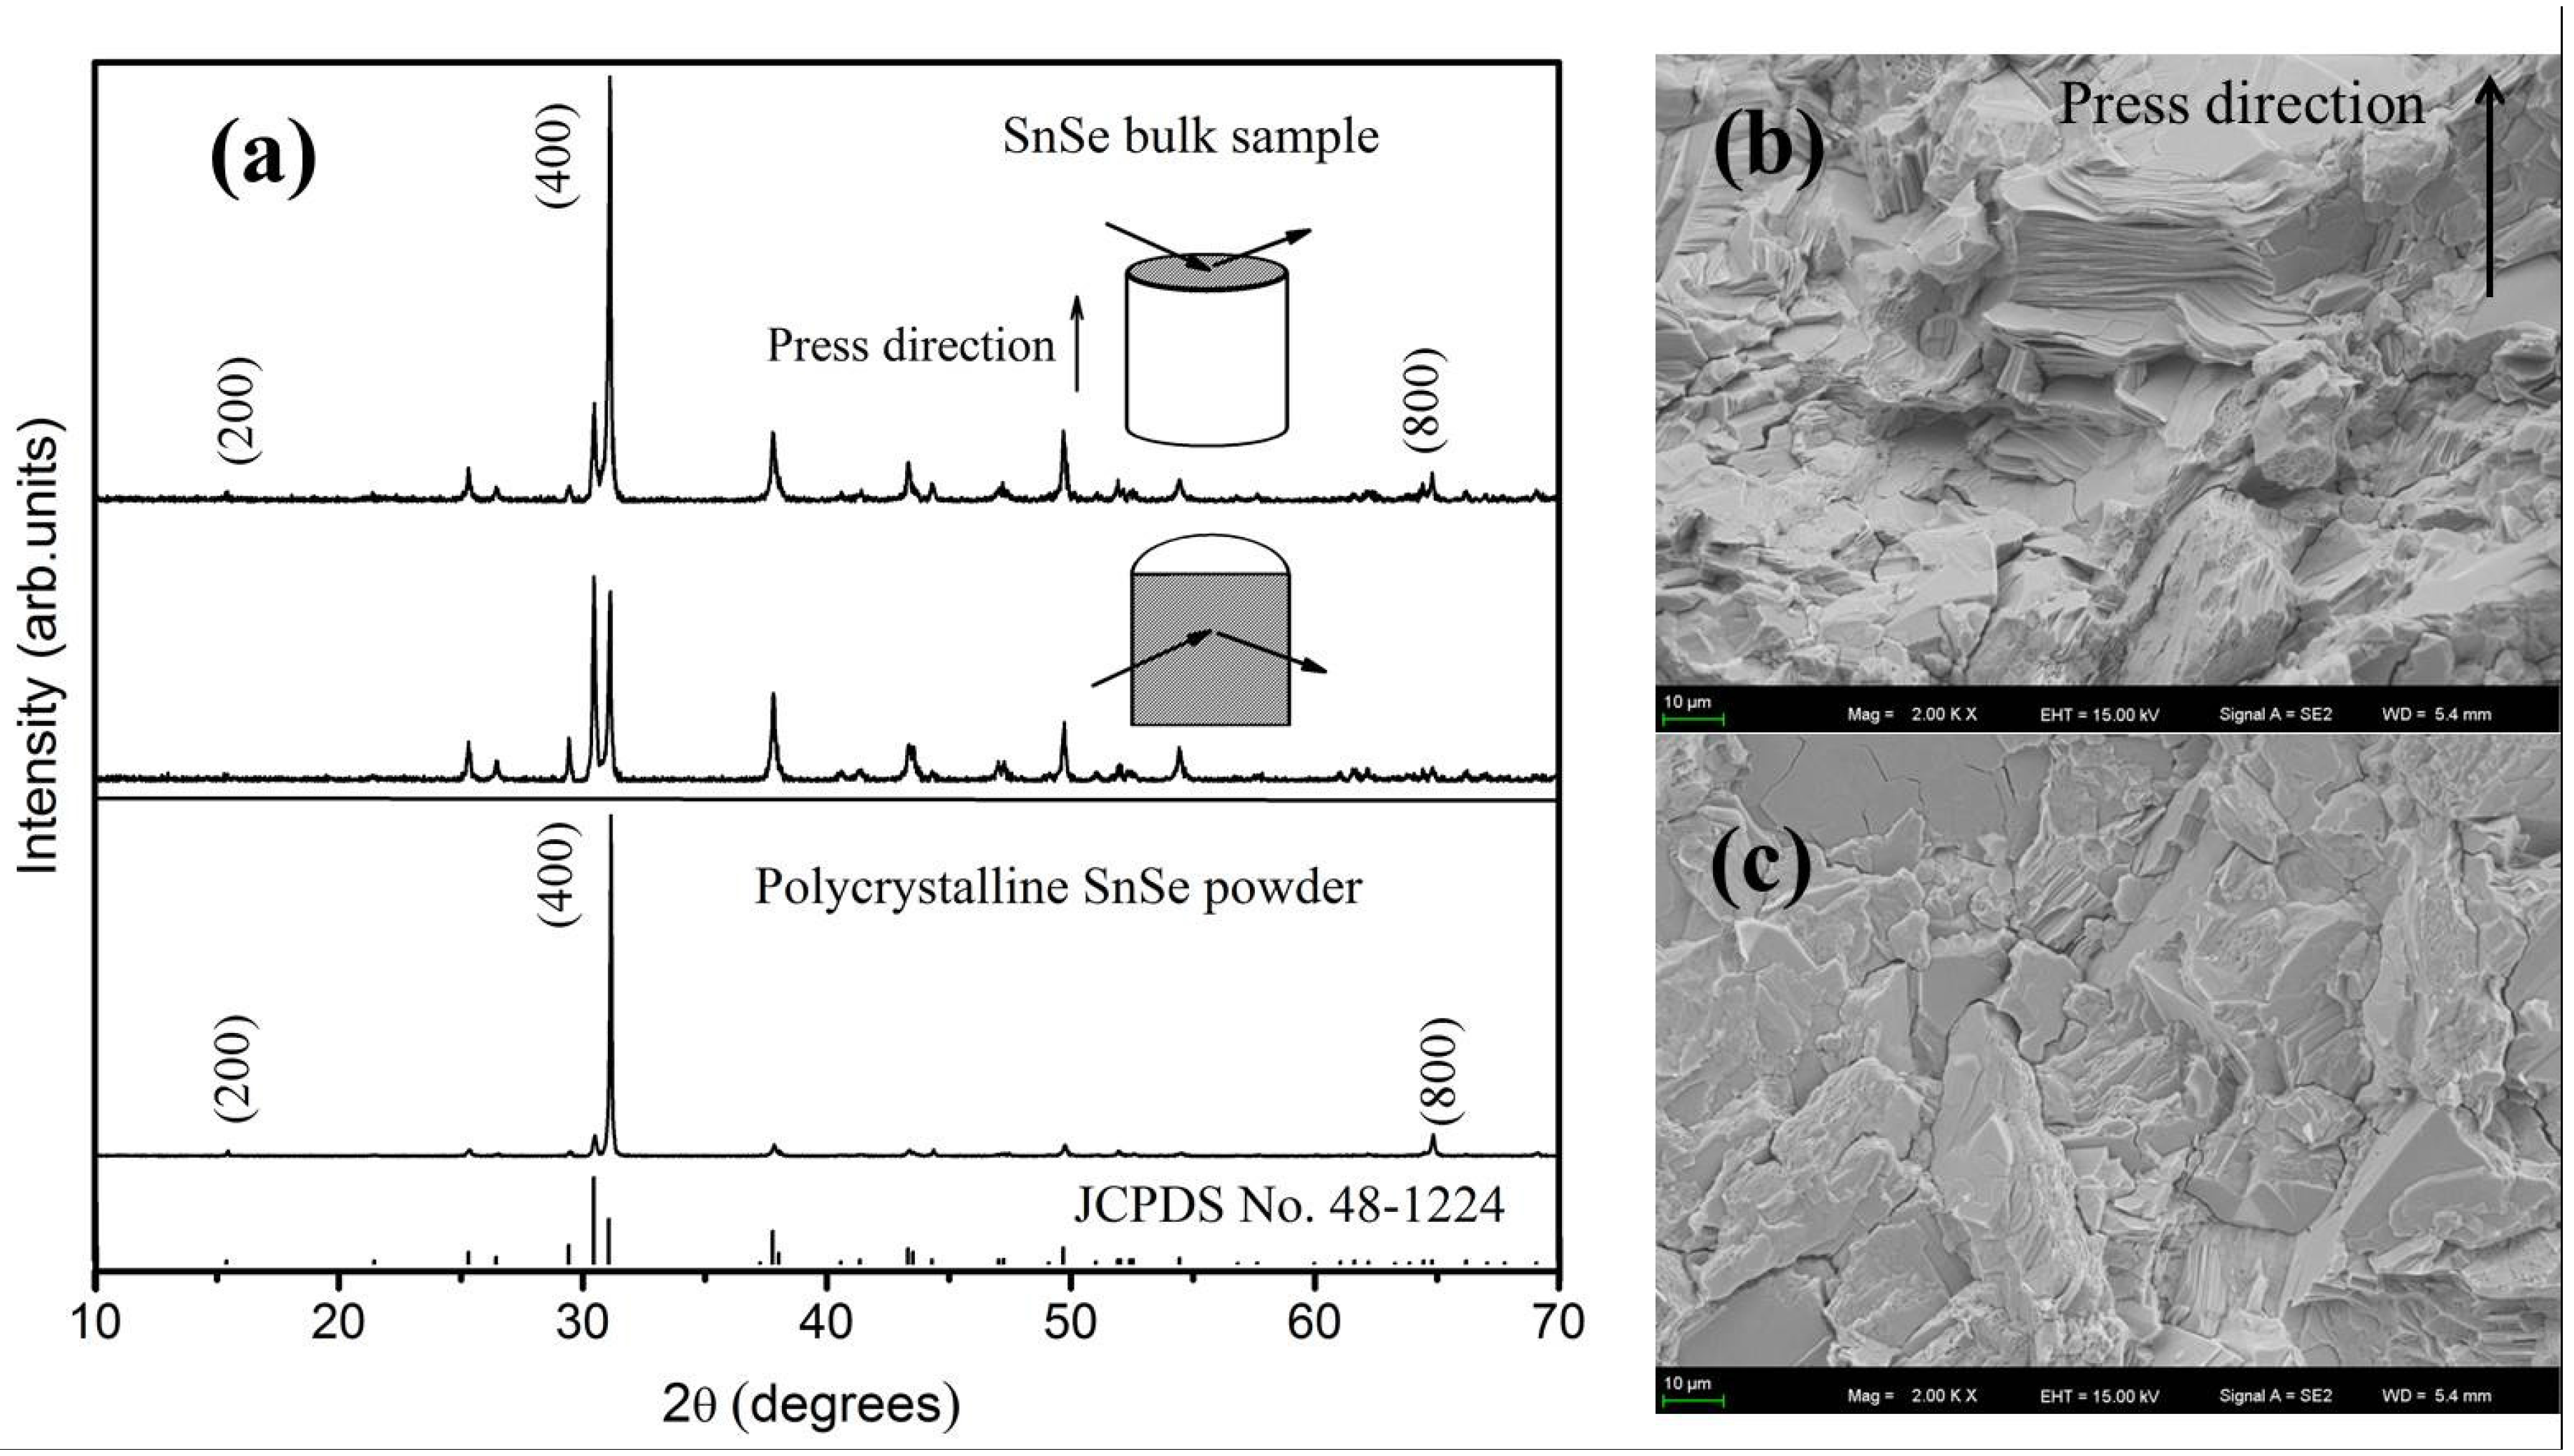
Figure 2a shows the X-ray diffraction patterns of SnSe powders and bulk SnSe polycrystalline sample in the directions parallel to the press (//) and perpendicular to the press (⊥). All the peaks are consistent with the standard pattern of SnSe (JCPDS No. 48-1224) with the space group of
Pnma, without impurity phases. These results agree well with the energy dispersive spectrometer (EDS) analysis which shows that there is no Sn- or Se-enrichment area throughout the whole bulk sample. The actual composition, SnSe
0.99, is obtained for the bulk SnSe polycrystalline sample. Interestingly, high degree of orientation along the (
h00) plane is observed in the SnSe powders. After SPS process, the (
h00) texture diffraction peaks are also maintained in both two directions due to the good crystallinity of the polycrystalline sample along the (
h00) planes. The relative intensities of (
h00) peaks are stronger along the // direction than that along the ⊥ direction. It implies that the electrical and thermal transport properties in the // direction will be close to that along
a axis direction, while the ⊥ direction will tend towards the
b or
c axes in the single crystal. The sample morphologies of the freshly fractured surfaces along the // and ⊥ directions observed by SEM are shown in
Figure 2b,c, respectively. The obvious layered structures are observed arranging along the // direction. However, the photograph in the ⊥ direction shows relatively flat planes due to the cleavage of the (100) plane. These findings are consistent with the XRD observations, indicating the oriented structures in polycrystalline SnSe sample.
Figure 2.
(a) XRD patterns for SnSe powders and bulk sample along different directions; SEM photographs of the freshly fractured surfaces along the directions (b) parallel to the press (//) and (c) perpendicular to the press (⊥).
Figure 2.
(a) XRD patterns for SnSe powders and bulk sample along different directions; SEM photographs of the freshly fractured surfaces along the directions (b) parallel to the press (//) and (c) perpendicular to the press (⊥).
The degree of the grain orientation in the samples can be described by the orientation factor (
f).
f is defined as:
where
I and
I0 are the intensities of XRD reflection peaks for oriented and non-oriented samples, respectively;
p and
p0 are the ratios of the sum of intensities of the (
h00) reflections to that of all (
hkl) reflections for oriented and non-oriented samples, respectively [
22,
23]. The standard diffraction pattern of SnSe (JCPDS No. 48-1224) is used to calculate
p0. For non-oriented polycrystalline sample,
f is 0, while
f is 1 along the [
h00] direction in single crystal. The large
f value represents high orientation degree along the [
h00] direction in polycrystalline sample. The calculated orientation factors along [
h00] directions in the // and ⊥ directions are 0.41 and 0.13, respectively (listed in
Table 1). Based on the transport data in single crystal, high
f means low electrical and thermal conductivities as well as low
zT. Small
f means high electrical and thermal conductivities as well as high
zT.
Table 1.
Orientation factor f along [h00] directions and room temperature thermal conductivity κ, electrical conductivity σ, Seebeck coefficient S, Hall carrier concentration pH, Hall mobility μH in polycrystalline SnSe.
Table 1.
Orientation factor f along [h00] directions and room temperature thermal conductivity κ, electrical conductivity σ, Seebeck coefficient S, Hall carrier concentration pH, Hall mobility μH in polycrystalline SnSe.
| SnSe Direction | f(h00) | κ (W/m·K) | σ (Ω−1cm−1) | S (μV/K) | pH (1017 cm−3) | μH (cm2/V·s) |
|---|
| // | 0.41 | 0.89 | 0.91 | 448 | 3.6 | 15.8 |
| ⊥ | 0.13 | 1.18 | 2.21 | 450 | 1.1 | 123 |
The electrical properties of the oriented SnSe polycrystalline sample are shown in
Figure 3. A drastic element-evaporation is observed when the measurement temperature is higher than 850 K. The surface composition analysis determined by EDS shows that the atomic ratio of Sn/Se changes from 1/0.99 to 1/0.60 after the measurements. A dramatic shift on Seebeck coefficient is also observed. As shown in the inset of
Figure 3b, the sign of the Seebeck coefficient even changes from positive to negative value above 900 K, further proving that the composition of the sample has been greatly changed. Therefore the other tests are performed from room temperature to 850 K. The reported data of polycrystalline and single crystalline SnSe are also plotted in
Figure 3 for comparison [
13,
20]. The electrical conductivity (
σ), Seebeck coefficient (
S), and power factors (
S2σ) of our polycrystalline sample are very similar to the literature’s data in the whole temperature range. As expected, the electrical conductivity of polycrystalline SnSe along the // direction is small and is close to that along
a axis in the single crystal due to the strong orientation along
a axis. The electrical conductivity in both the // and ⊥ directions is between those along
a axis and that along
b (or
c) axis of the single crystal. This is reasonable due to the partially oriented structures in polycrystalline sample. The difference in electrical conductivity above phase transition (around 800 K) is very weak in these two directions, indicating a small anisotropy in electrical transports in the high temperature phase. This is consistent with the observed crystal structural transformation as shown above, because the thermal dynamics tends to increase the entropy leading to isotropic lattice structures as well as electrical transports.
Figure 3.
Temperature dependence of (a) electrical conductivity σ; (b) Seebeck coefficient S; and (c) Power Factor (S2σ) for SnSe polycrystalline sample. The inset of (b) is temperature dependence of Seebeck coefficient along the // direction above 800 K.
Figure 3.
Temperature dependence of (a) electrical conductivity σ; (b) Seebeck coefficient S; and (c) Power Factor (S2σ) for SnSe polycrystalline sample. The inset of (b) is temperature dependence of Seebeck coefficient along the // direction above 800 K.
Similar with single crystal, the difference in Seebeck coefficient of polycrystalline sample along different directions is small, indicating the nearly independence between Seebeck coefficient and crystallographic directions in SnSe. This suggests that carrier concentration is the main factor to affect Seebeck coefficient if the effect by grain boundary is ignored. The room-temperature Hall carrier concentrations of our polycrystalline sample with the order of 10
17 cm
−3 along both the // and ⊥ directions (
Table 1) are consistent with those in the single crystal [
13]. That the electrical conductivities of the polycrystalline samples are between the
a axis and
b (or
c) axis in the single crystal (
Figure 3a) also supports this. Otherwise, the electrical conductivity could be easily tuned in a few orders like that observed in Ag-doped SnSe samples by Chen
et al. [
19]. This phenomenon has also been observed by S. Sassi
et al. [
20] in their polycrystalline samples.
The power factors of the polycrystalline sample are shown in
Figure 3c. The power factor along the ⊥ direction is higher than that along the // direction due to the weak orientation in the ⊥ direction. A maximum power factor of about 2 μW/cm·K
2 is obtained in our polycrystalline sample, similar to that in
a axis, but much less than those in
b or
c axis in the single crystal.
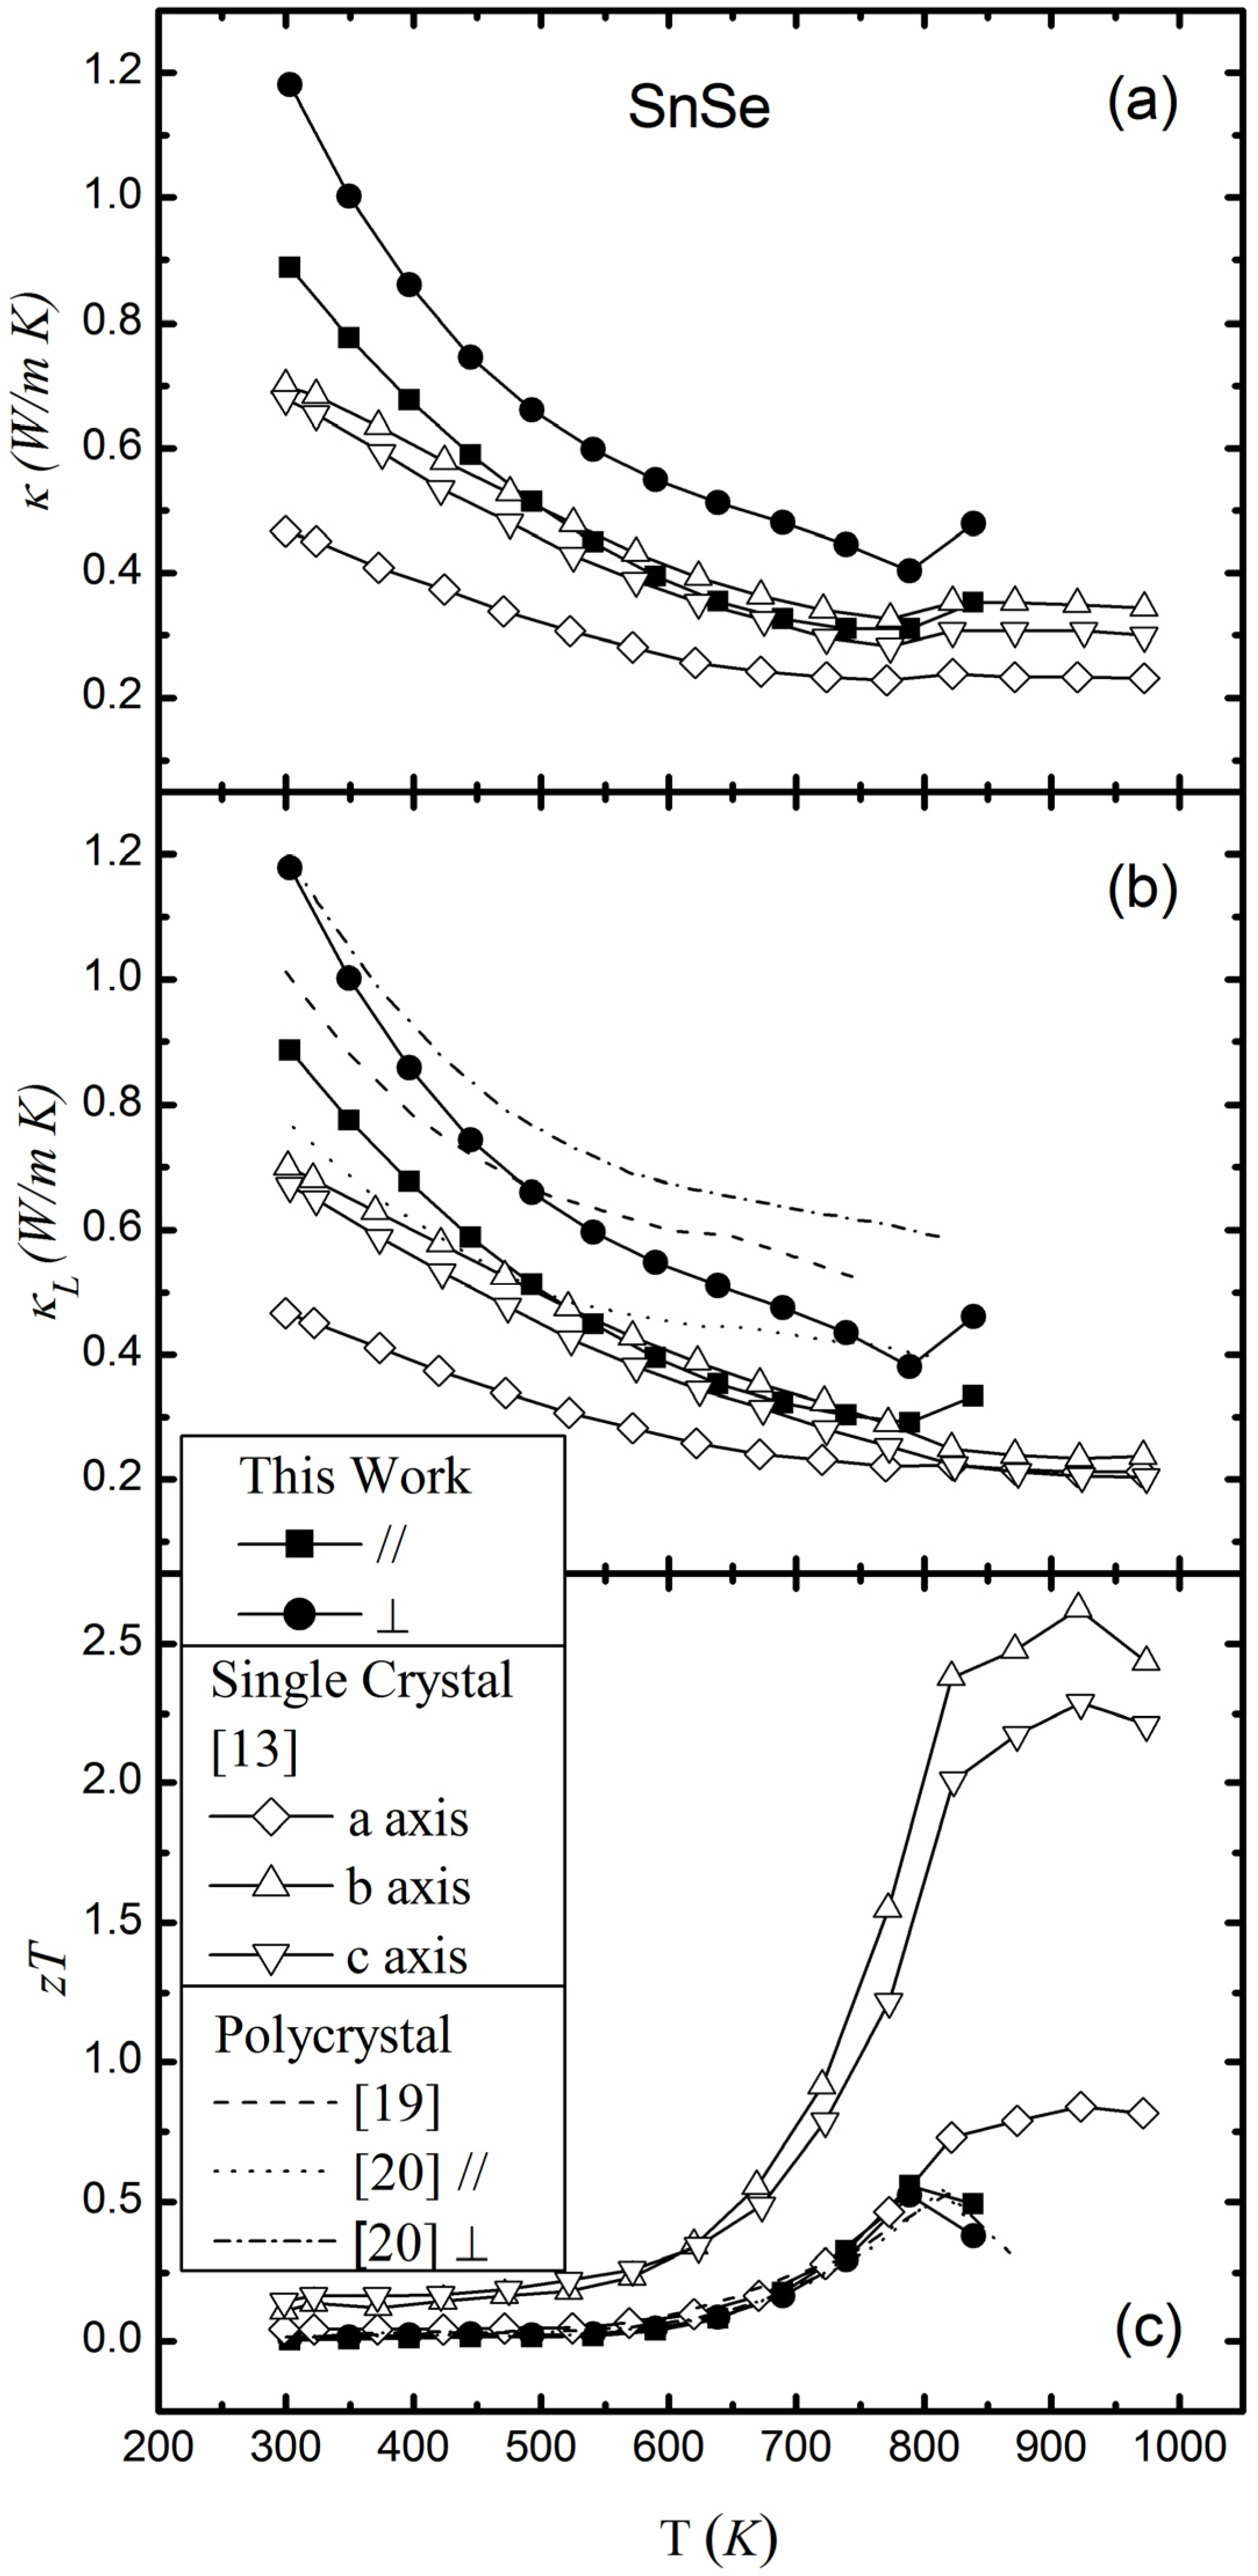
Figure 4 shows the temperature dependence of thermal conductivity (
κ), lattice thermal conductivity (
κL) and the dimensionless figure of merit
zT (=
S2σT/κ) for polycrystalline SnSe. The data from the literatures for polycrystalline and single crystalline SnSe are also plotted in
Figure 4 [
13,
19,
20]. SnSe shows relatively low thermal conductivity in comparison with other state-of-the-art TE materials throughout the whole measured temperature range. The lowest thermal conductivity about 0.31 W/m·K is obtained along the // direction at 790 K, and the maximum
zT value of 0.56 is obtained along this direction at 790 K.
The lattice thermal conductivity is calculated using the Wiedemann-Franz law with a constant Lorenz number
L0 = 1.5 × 10
−8 V
2/K
2, which is the same as that in ref. [
13]. Due to the small magnitude of electrical conductivity, the
κL values and its temperature dependence are almost the same as the total thermal conductivity. The lattice thermal conductivity along the // direction is lower than that along the ⊥ direction. As has been shown in
Figure 3a, the polycrystalline sample has small electrical conductivity along the // direction due to the strong electron scattering. Thus the lattice thermal conductivity should be also low along the // direction due to the weak atomic connections and vibrations.
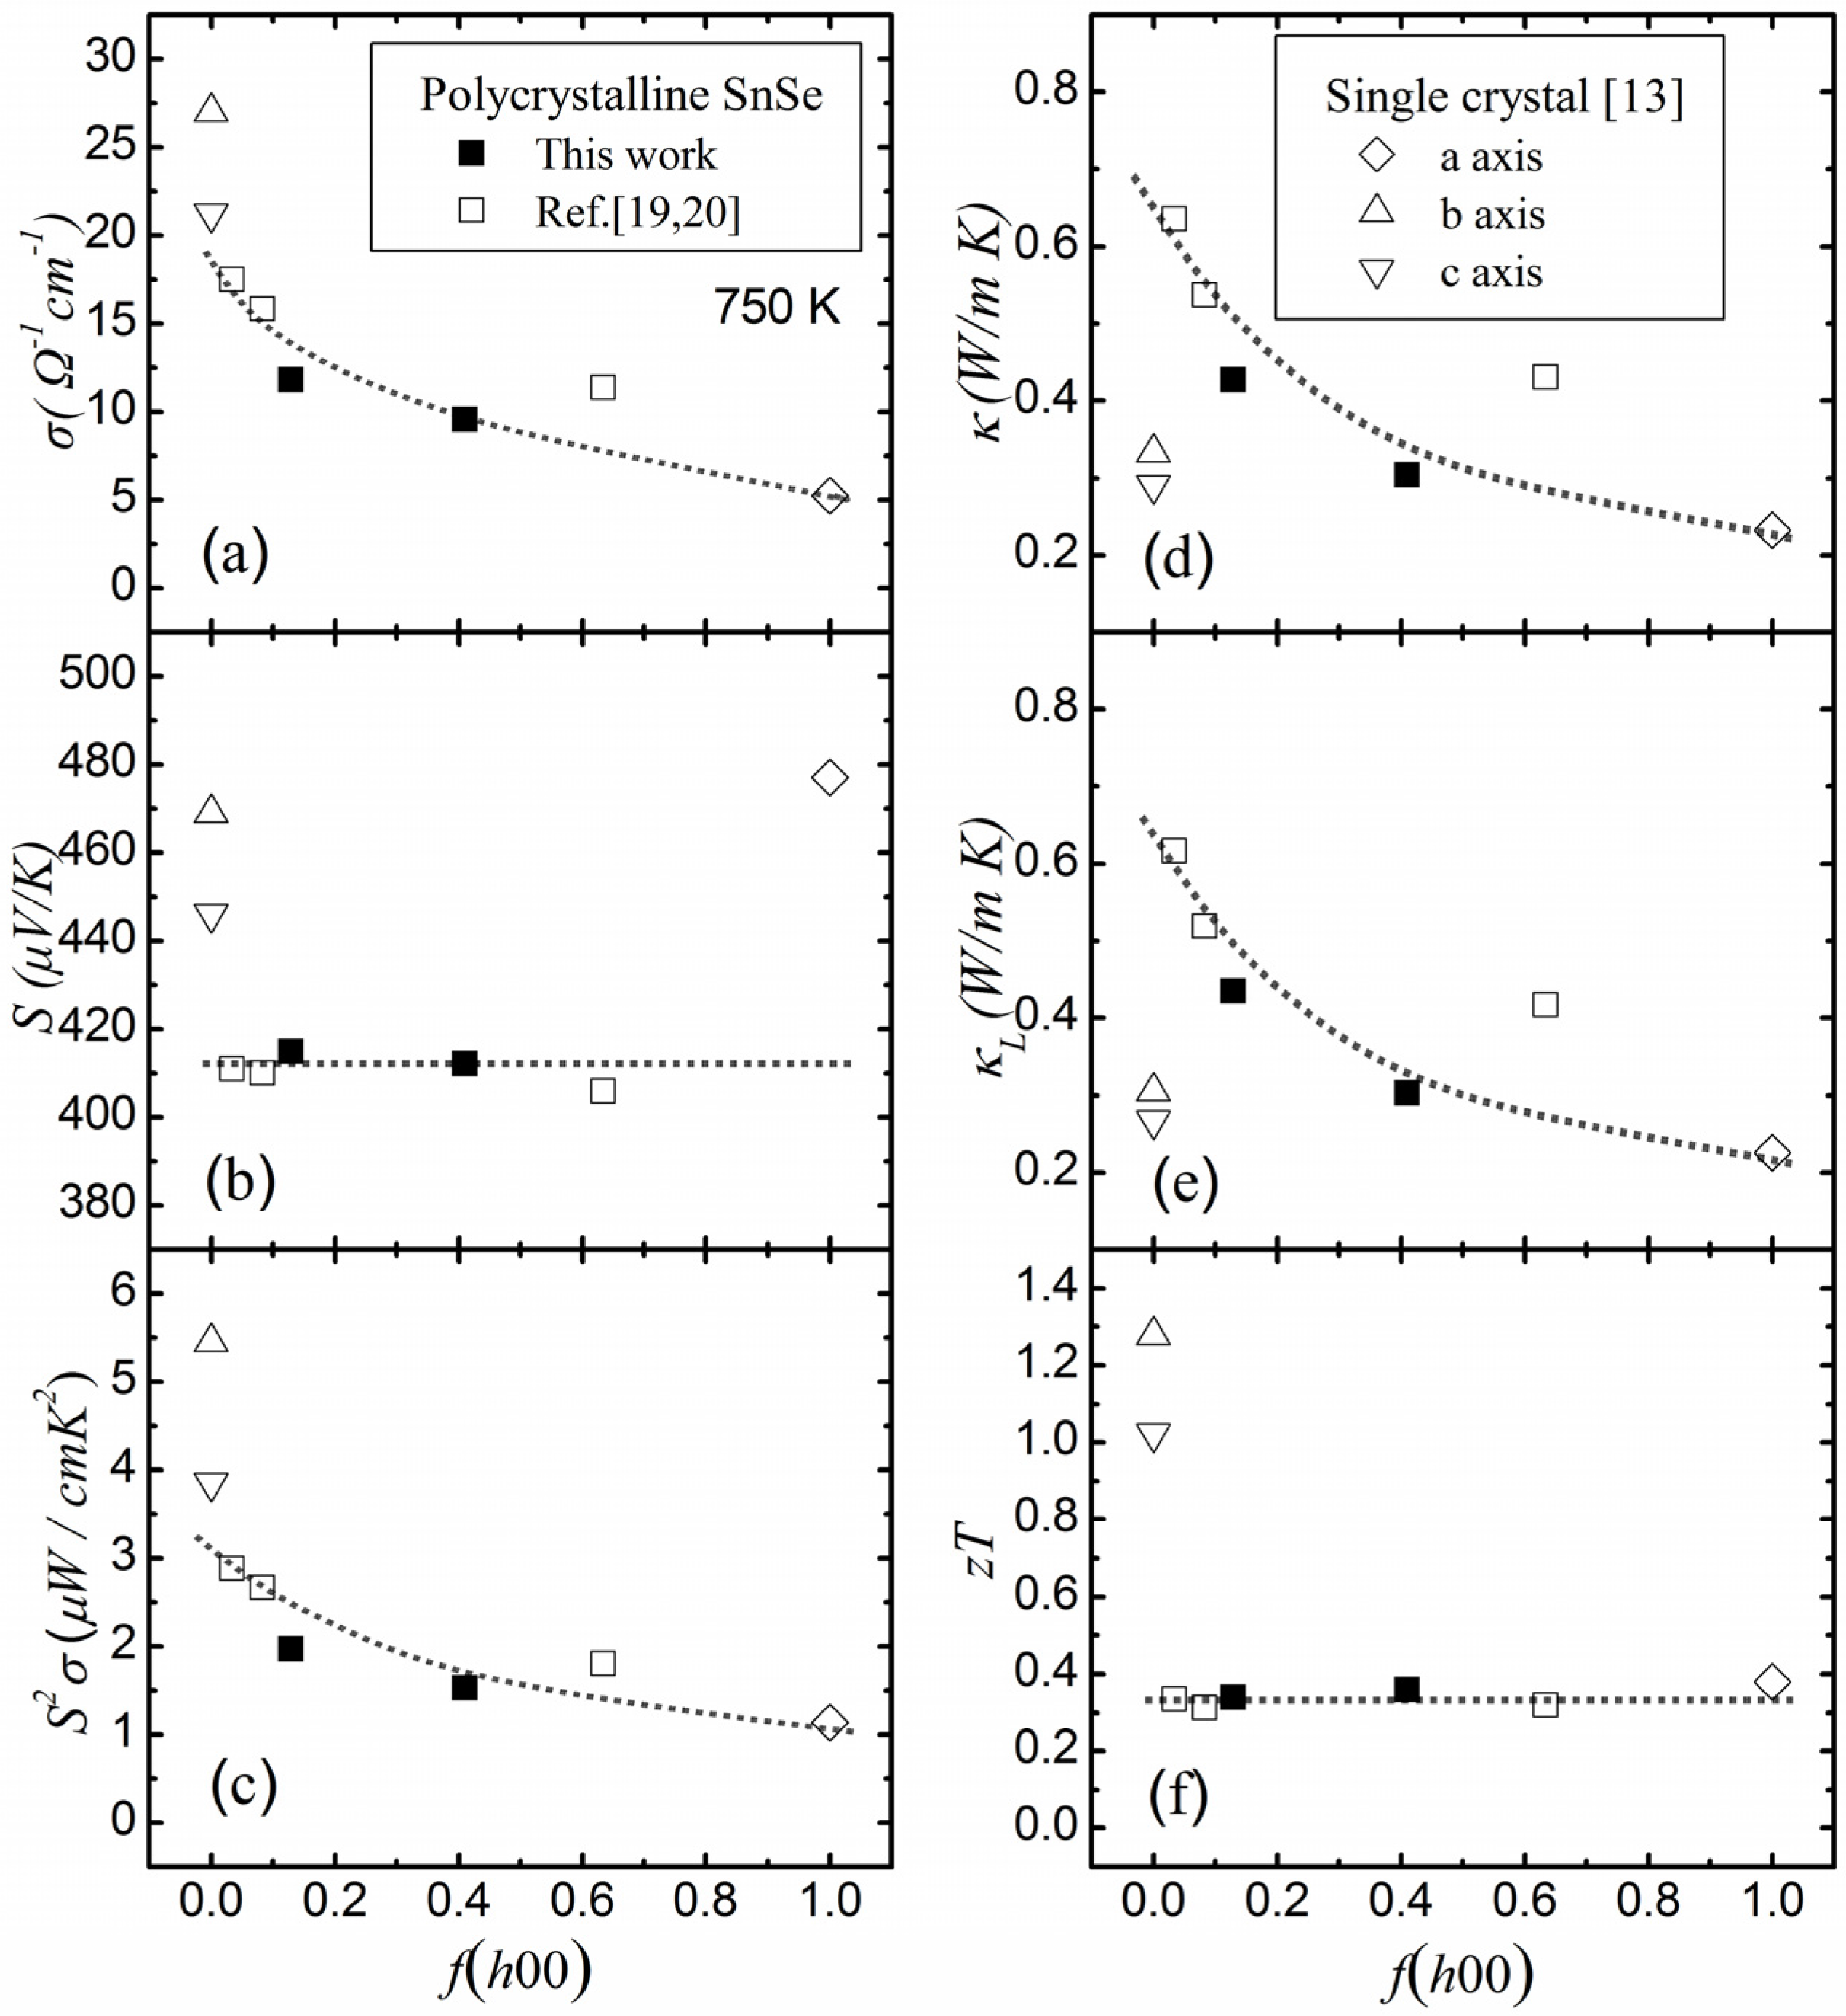
In addition, the polycrystalline SnSe along the // Press and ⊥ Press directions show similar
zT values despite large variance in the degree of orientation. In order to illustrate clearly the effect of orientation on the thermoelectric properties of SnSe, the electrical conductivity (
σ), Seebeck coefficient (
S), power factor (
S2σ), thermal conductivity (
κ), lattice thermal conductivity (
κL), and
zT value as a function of the orientation factor
f(
h00) along [
h00] directions are displayed in
Figure 5. The data from references [
13], [
19], and [
20] are collected and also plotted in
Figure 5. For the single crystal sample in reference [
13], the orientation factor along [
h00] directions is taken as 0 and 1 along
b/c axes and
a axis, respectively. For the polycrystalline sample,
f(
h00) is 0.083 for the sample of [
19] along the ⊥ direction, 0.034 for the sample of [
20] along the ⊥ direction, and 0.63 for the sample of ref. 20 along the // direction. The carrier and heat transfers are weak along the [
h00] directions, leading to the simultaneous decrease in electrical and thermal conductivities when enhancing
f(
h00). The thermopower shows independent trend when shifting the orientations, which gives an essentially unchanged Seebeck coefficient for the polycrystalline SnSe. However, in comparison with the single crystal, the polycrystalline samples show relatively low Seebeck coefficients. This difference is possibly related to the degree of crystallization or the effect of grain boundary. Consequently, the
zT of the polycrystalline SnSe shows similar values when changing orientation factors. A weak anisotropy of TE figure of merit is observed in the polycrystalline SnSe samples.
Figure 4.
Temperature dependence of (
a) thermal conductivity
κ; (
b) lattice thermal conductivity
κL and (
c)
zT for SnSe. The reported data from literatures are plotted for comparison [
13,
19,
20].
Figure 4.
Temperature dependence of (
a) thermal conductivity
κ; (
b) lattice thermal conductivity
κL and (
c)
zT for SnSe. The reported data from literatures are plotted for comparison [
13,
19,
20].
Figure 5.
(
a) Electrical conductivity
σ; (
b) Seebeck coefficient
S; (
c) Power Factor (
S2σ); (
d) thermal conductivity
κ; (
e) lattice thermal conductivity
κL; and (
f)
zT for SnSe as a function of orientation factor along (
h00) directions
f(
h00) at 750 K [
13,
19,
20].
Figure 5.
(
a) Electrical conductivity
σ; (
b) Seebeck coefficient
S; (
c) Power Factor (
S2σ); (
d) thermal conductivity
κ; (
e) lattice thermal conductivity
κL; and (
f)
zT for SnSe as a function of orientation factor along (
h00) directions
f(
h00) at 750 K [
13,
19,
20].
3. Experimental Section
Polycrystalline SnSe samples were synthesized by a melting-annealing-sintering process. High purity elements Sn (shot, 99.999%) and Se (shot, 99.999%) in the stoichiometric proportion were sealed in evacuated quartz tube. The quartz tube was heated slowly up to 1200 K and kept at this temperature for 12 h, and then slowly cooled to 900 K and kept at this temperature for 5 days. The obtained ingot was ground into powder and then sintered by spark plasma sintering at 830–850 K under a pressure of 60 MPa to obtain densified bulk sample. The density of the bulk sample is 5.92 g/cm3, which is about 96% of the theoretical density.
The densified bulk sample was cut into pellets and rectangular bars along the directions perpendicular and parallel to the pressing direction for anisotropic TE property measurement. The phase of the sample was characterized by X-ray diffraction (XRD) analysis (Rint2000, Cu
Kα, RIGAKU, Tokyo, Japan). The chemical compositions and morphology of the fractured surfaces of the sample were characterized by energy dispersive spectrometer (EDS, OXFORD, Oxford, England, UK) and Scanning Electron Microscope (SEM, SUPRA 55, ZEISS, Oberkochen, Germany), respectively. The actual compositions were obtained from the average composition of ten different locations on the sample. The measurements of electrical conductivity and Seebeck coefficient were performed in the ZEM-3 system (ULVAC-RIKO, Chigasaki, Japan). The thermal diffusivity (λ) was measured using the laser flash method in flowing argon atmosphere (LFA 457, NETZSCH, Selb, Germany). The thermal conductivity was calculated by κ
= λ
Cpρ, where the specific heat capacity (
Cp) was taken from ref. [
13] and the density (ρ) was measured using Archimedes method. The measurements of Hall coefficient
RH, was carried out in the Physical Property Measurement System (QUANTUM, San Diego, CA, USA).


