
Method and Case Study of Multiobjective Optimization-Based Energy System Design to Minimize the Primary Energy Use and Initial Investment Cost

Abstract
:1. Introduction
2. Limitations of the Conventional Energy System Design Process

3. Multiobjective Optimization Method
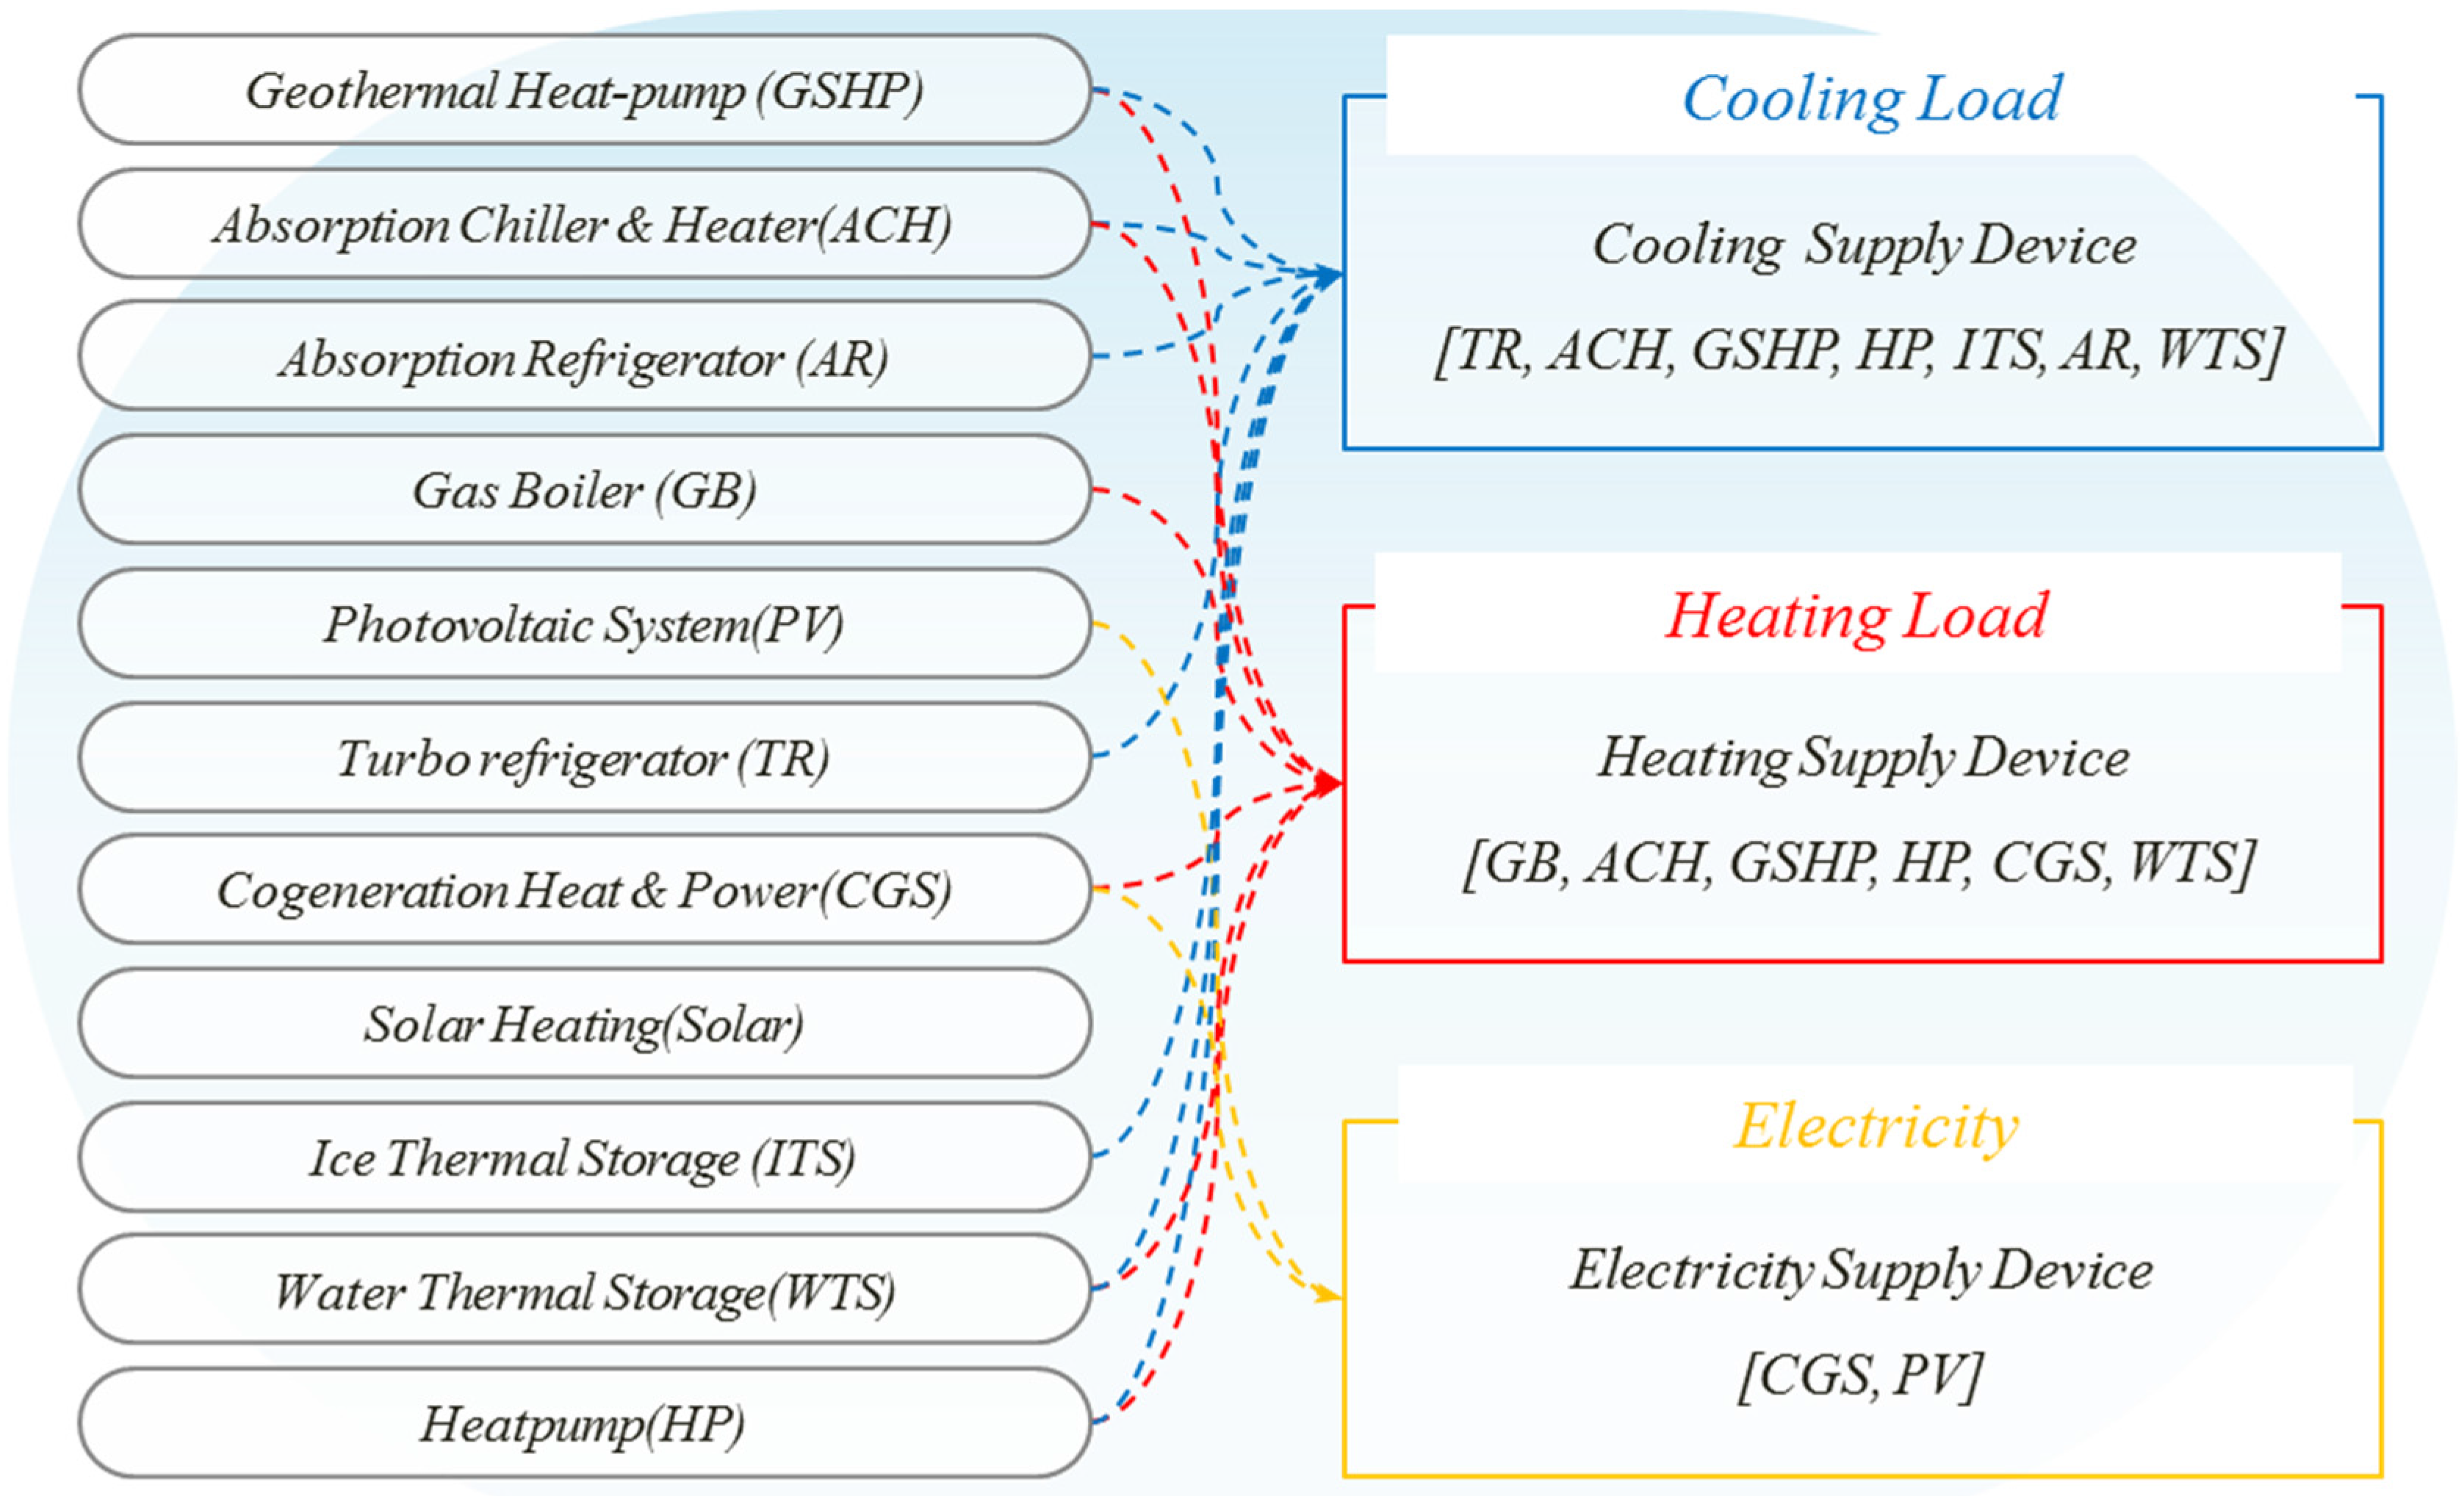
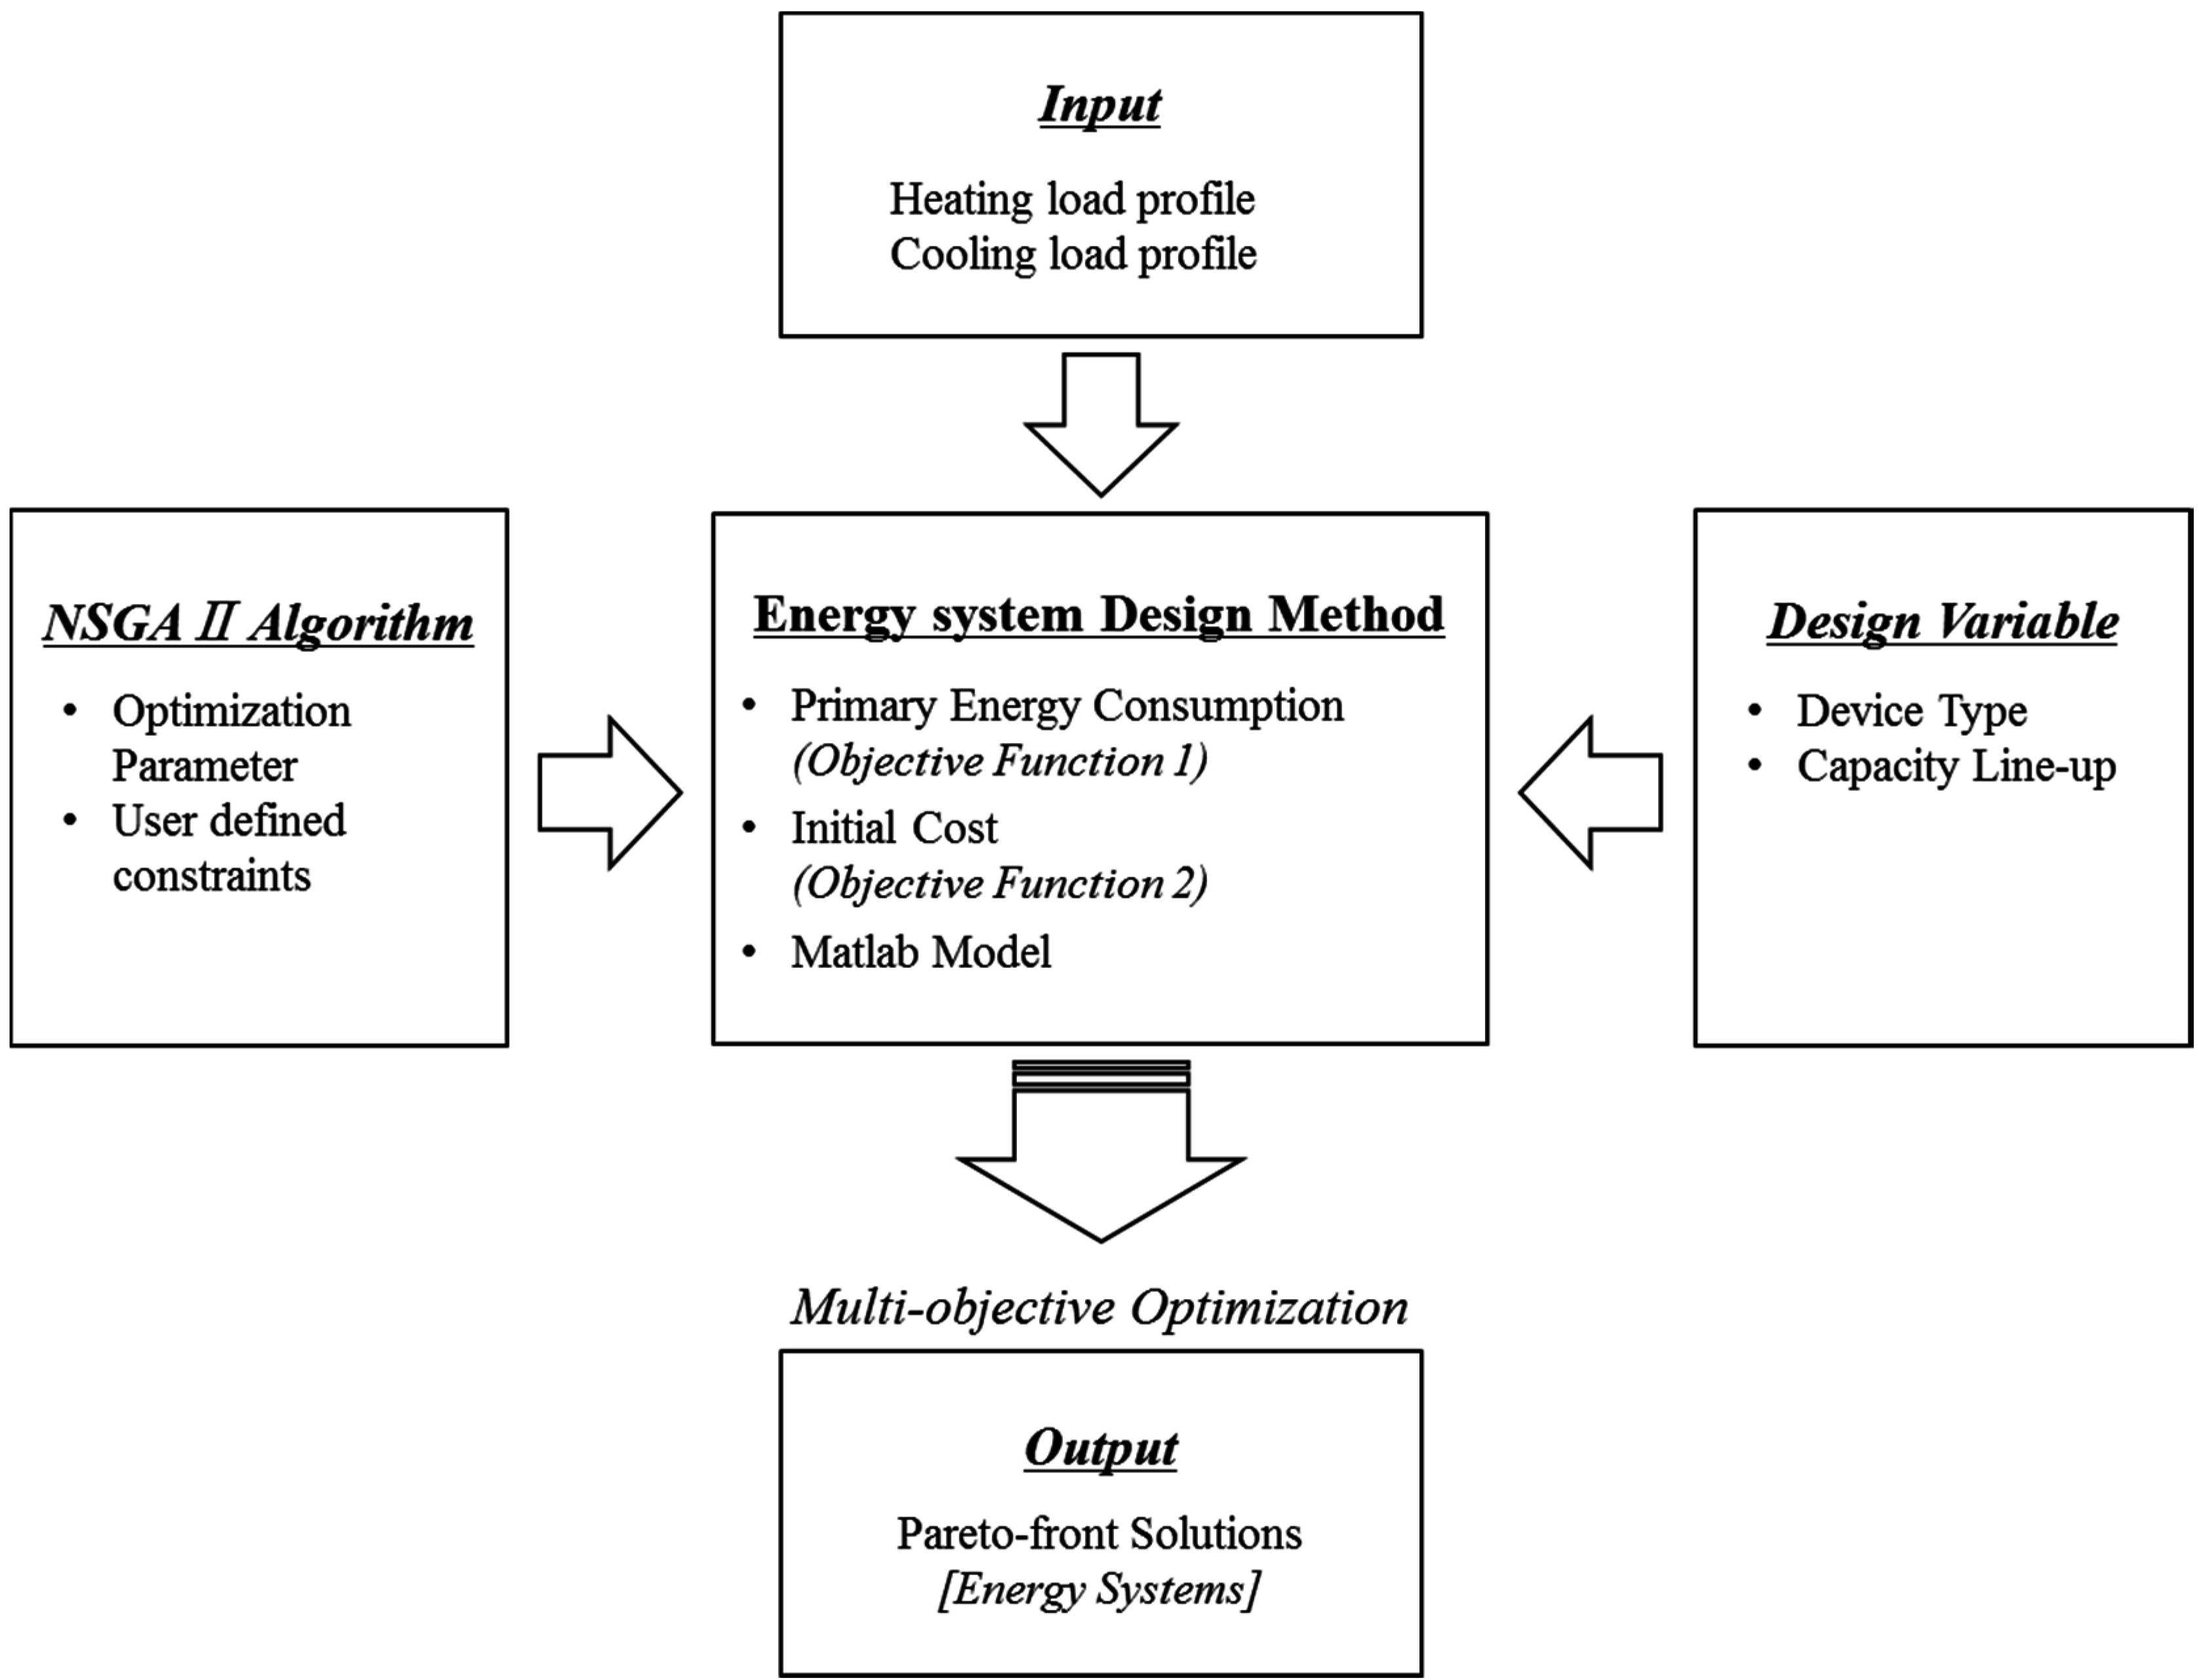
3.1. Method


| Type | Acronym | Capacity Line-Up of Device (kW)—Variable | |||||||
|---|---|---|---|---|---|---|---|---|---|
| Turbo refrigerator | TR | 0 | 390 | 470 | 630 | 680 | 780 | 945 | 1000 |
| Absorption refrigerator | AR | 0 | 95 | 125 | 160 | 320 | 380 | 560 | 630 |
| Absorption chiller & heater | ACH | 0 | 95 | 125 | 160 | 320 | 380 | 560 | 630 |
| Heat pump | HP | 0 | 25 | 30 | 40 | 50 | 63 | 78 | 100 |
| Gas boiler | GB | 0 | 60 | 85 | 115 | 150 | 185 | 290 | 350 |
| Cogeneration system | CGS | 0 | 115 | 200 | 230 | 300 | 350 | 480 | 600 |
| Ice thermal storage | ITS | TR capacity × 10 h * | |||||||
| Water thermal storage | WTS | ACH or GSHP capacity × 10 h * | |||||||
| Geothermal heat pump | GSHP | 0 | 10% | 20% | 30% | 40% | 50% | 60% | 70% |
| Photovoltaic system (m2) | PV | 0 | 20 | 50 | 100 | 150 | 200 | 250 | 300 |
| Solar heating system (m2) | Solar | 0 | 20 | 50 | 100 | 150 | 200 | 250 | 300 |
| Device Type | No. of Device | Variables |
|---|---|---|
| TR | 4 | ~x01–x04 |
| AR | 2 | ~x05–x06 |
| ACH | 1 | x07 |
| HP | 2 | ~x08–x09 |
| GB | 4 | ~x10–x13 |
| CGS | 2 | ~x14–x15 |
| ITS | 1 | x04 |
| WTS | 1 | x07 or 16 |
| GSHP | 1 | x16 |
| PV | 1 | x17 |
| Solar | 1 | x18 |
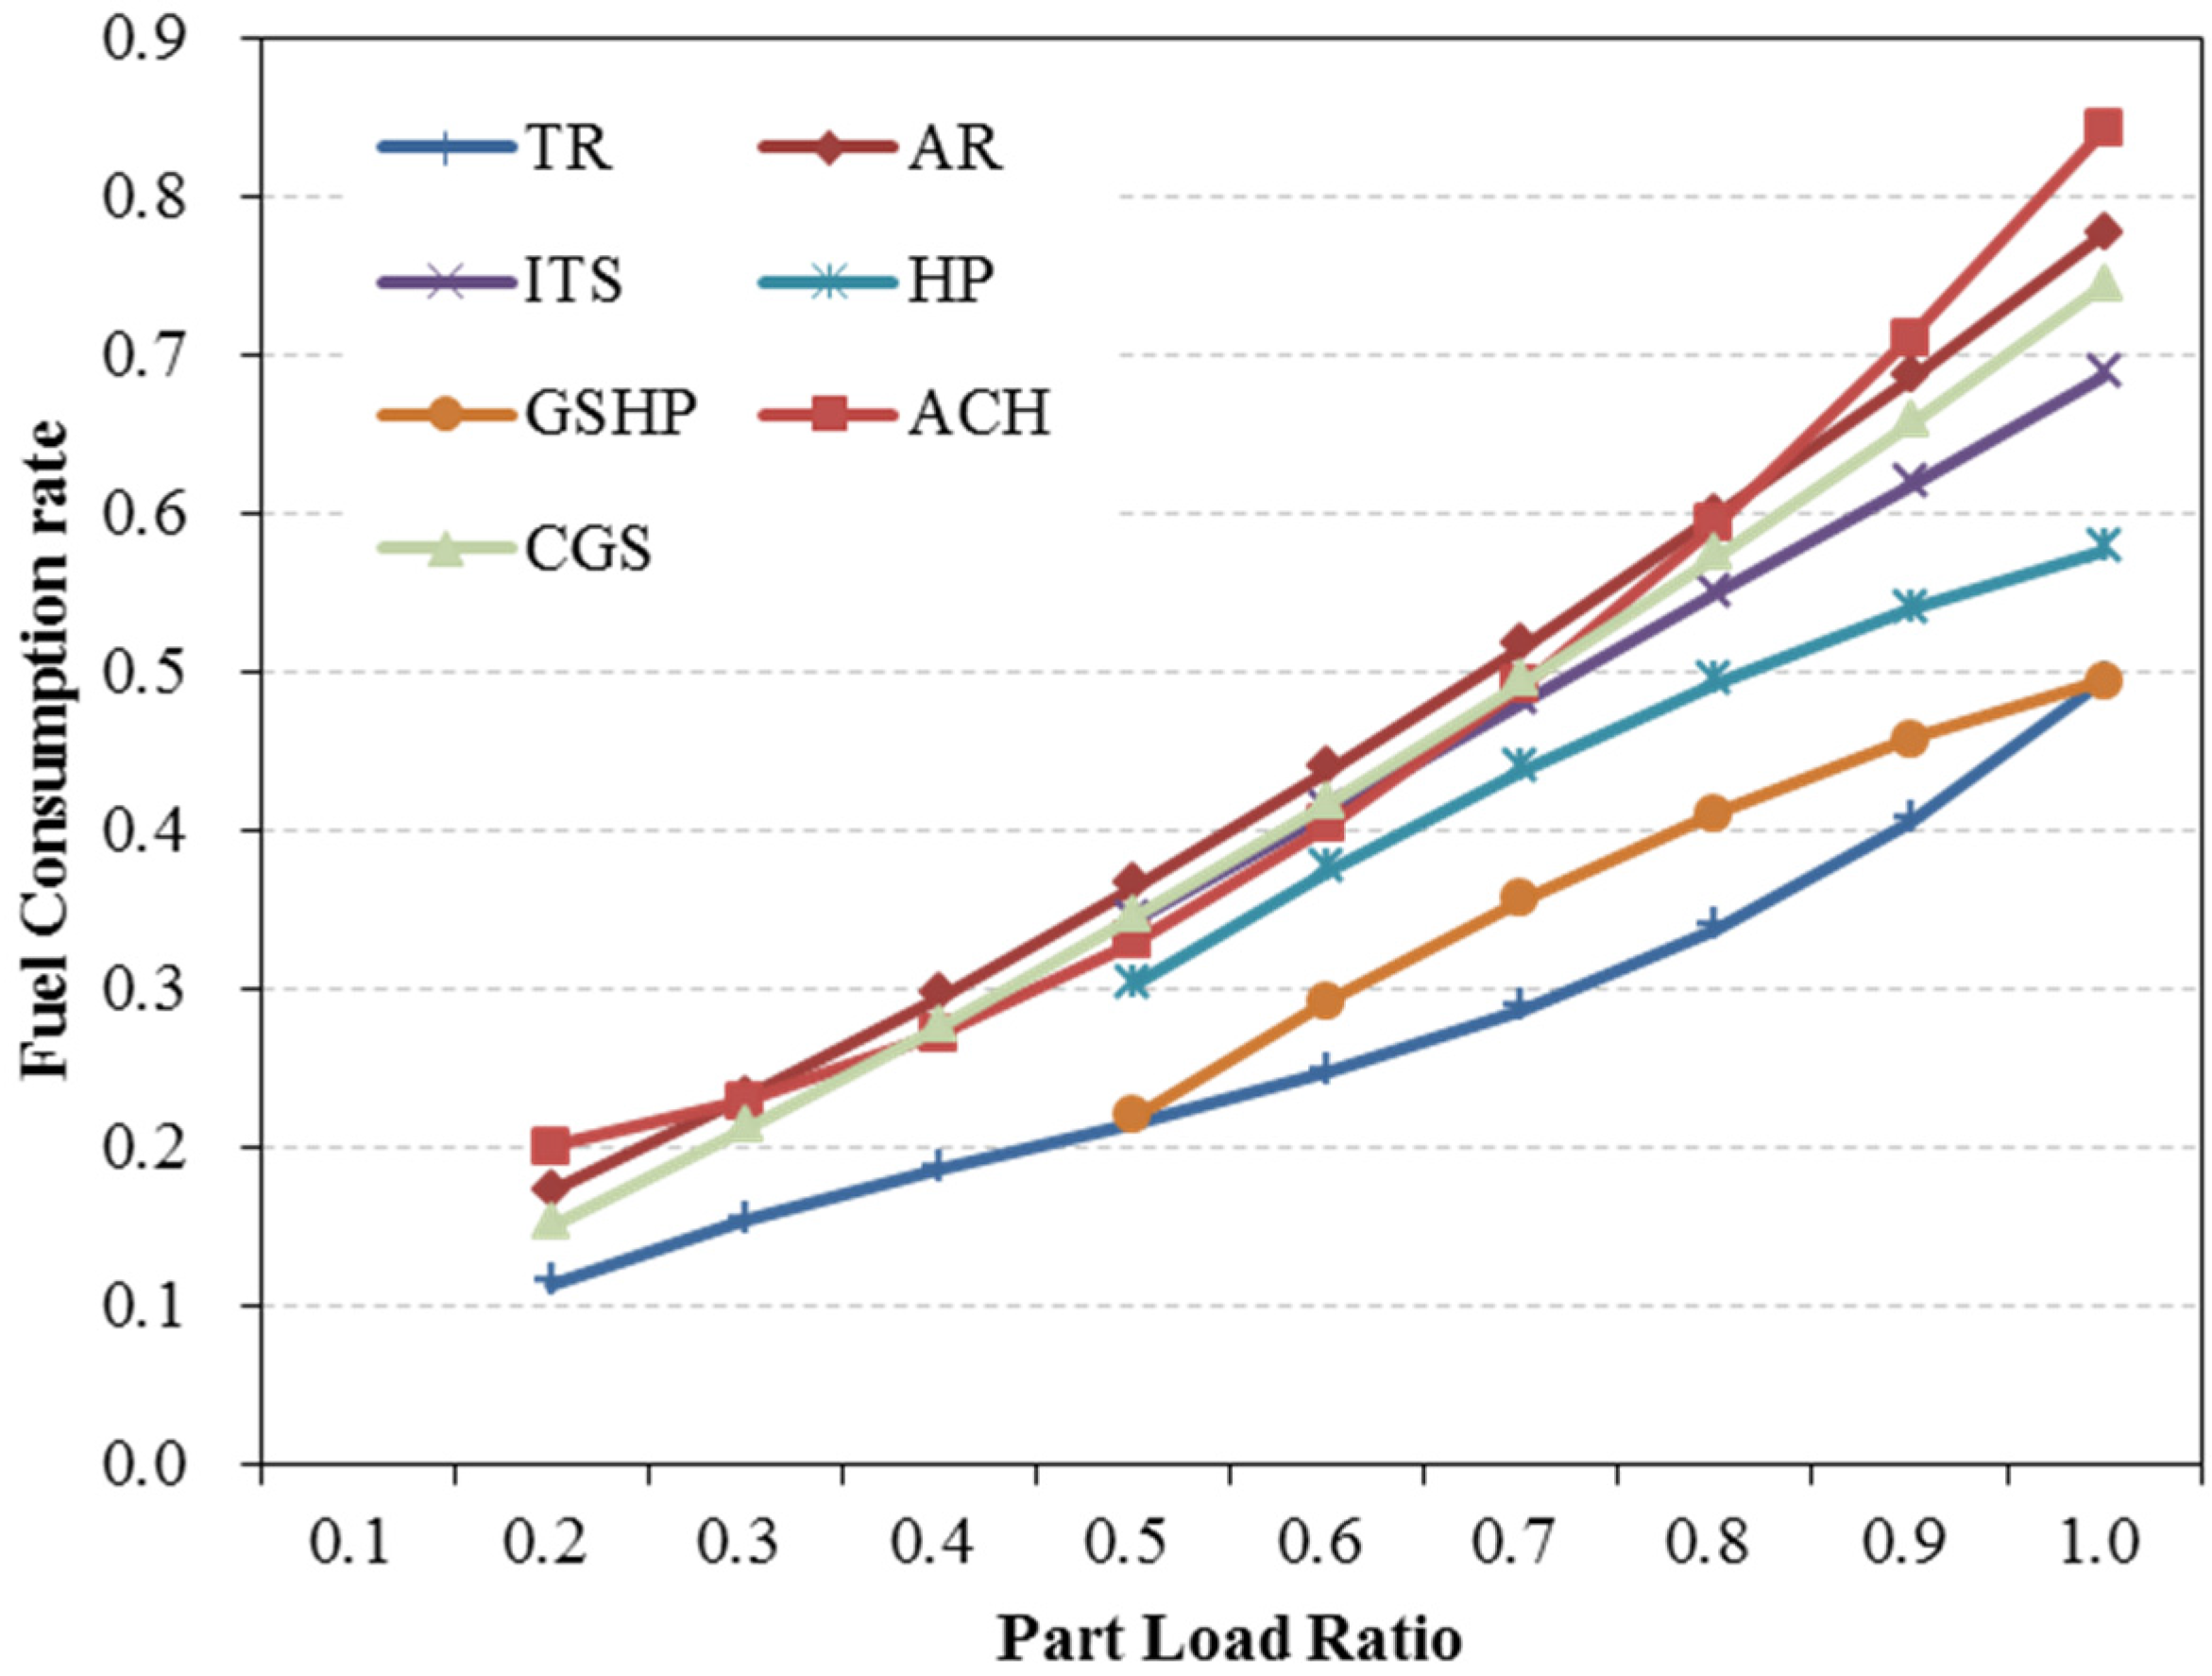
3.2. Objective Function (1): Primary Energy Use

| Energy Source | Primary Energy Factor |
|---|---|
| Gas | 1.1 |
| Electricity | 2.75 |
| District heating | 0.614 |
| District cooling | 0.937 |
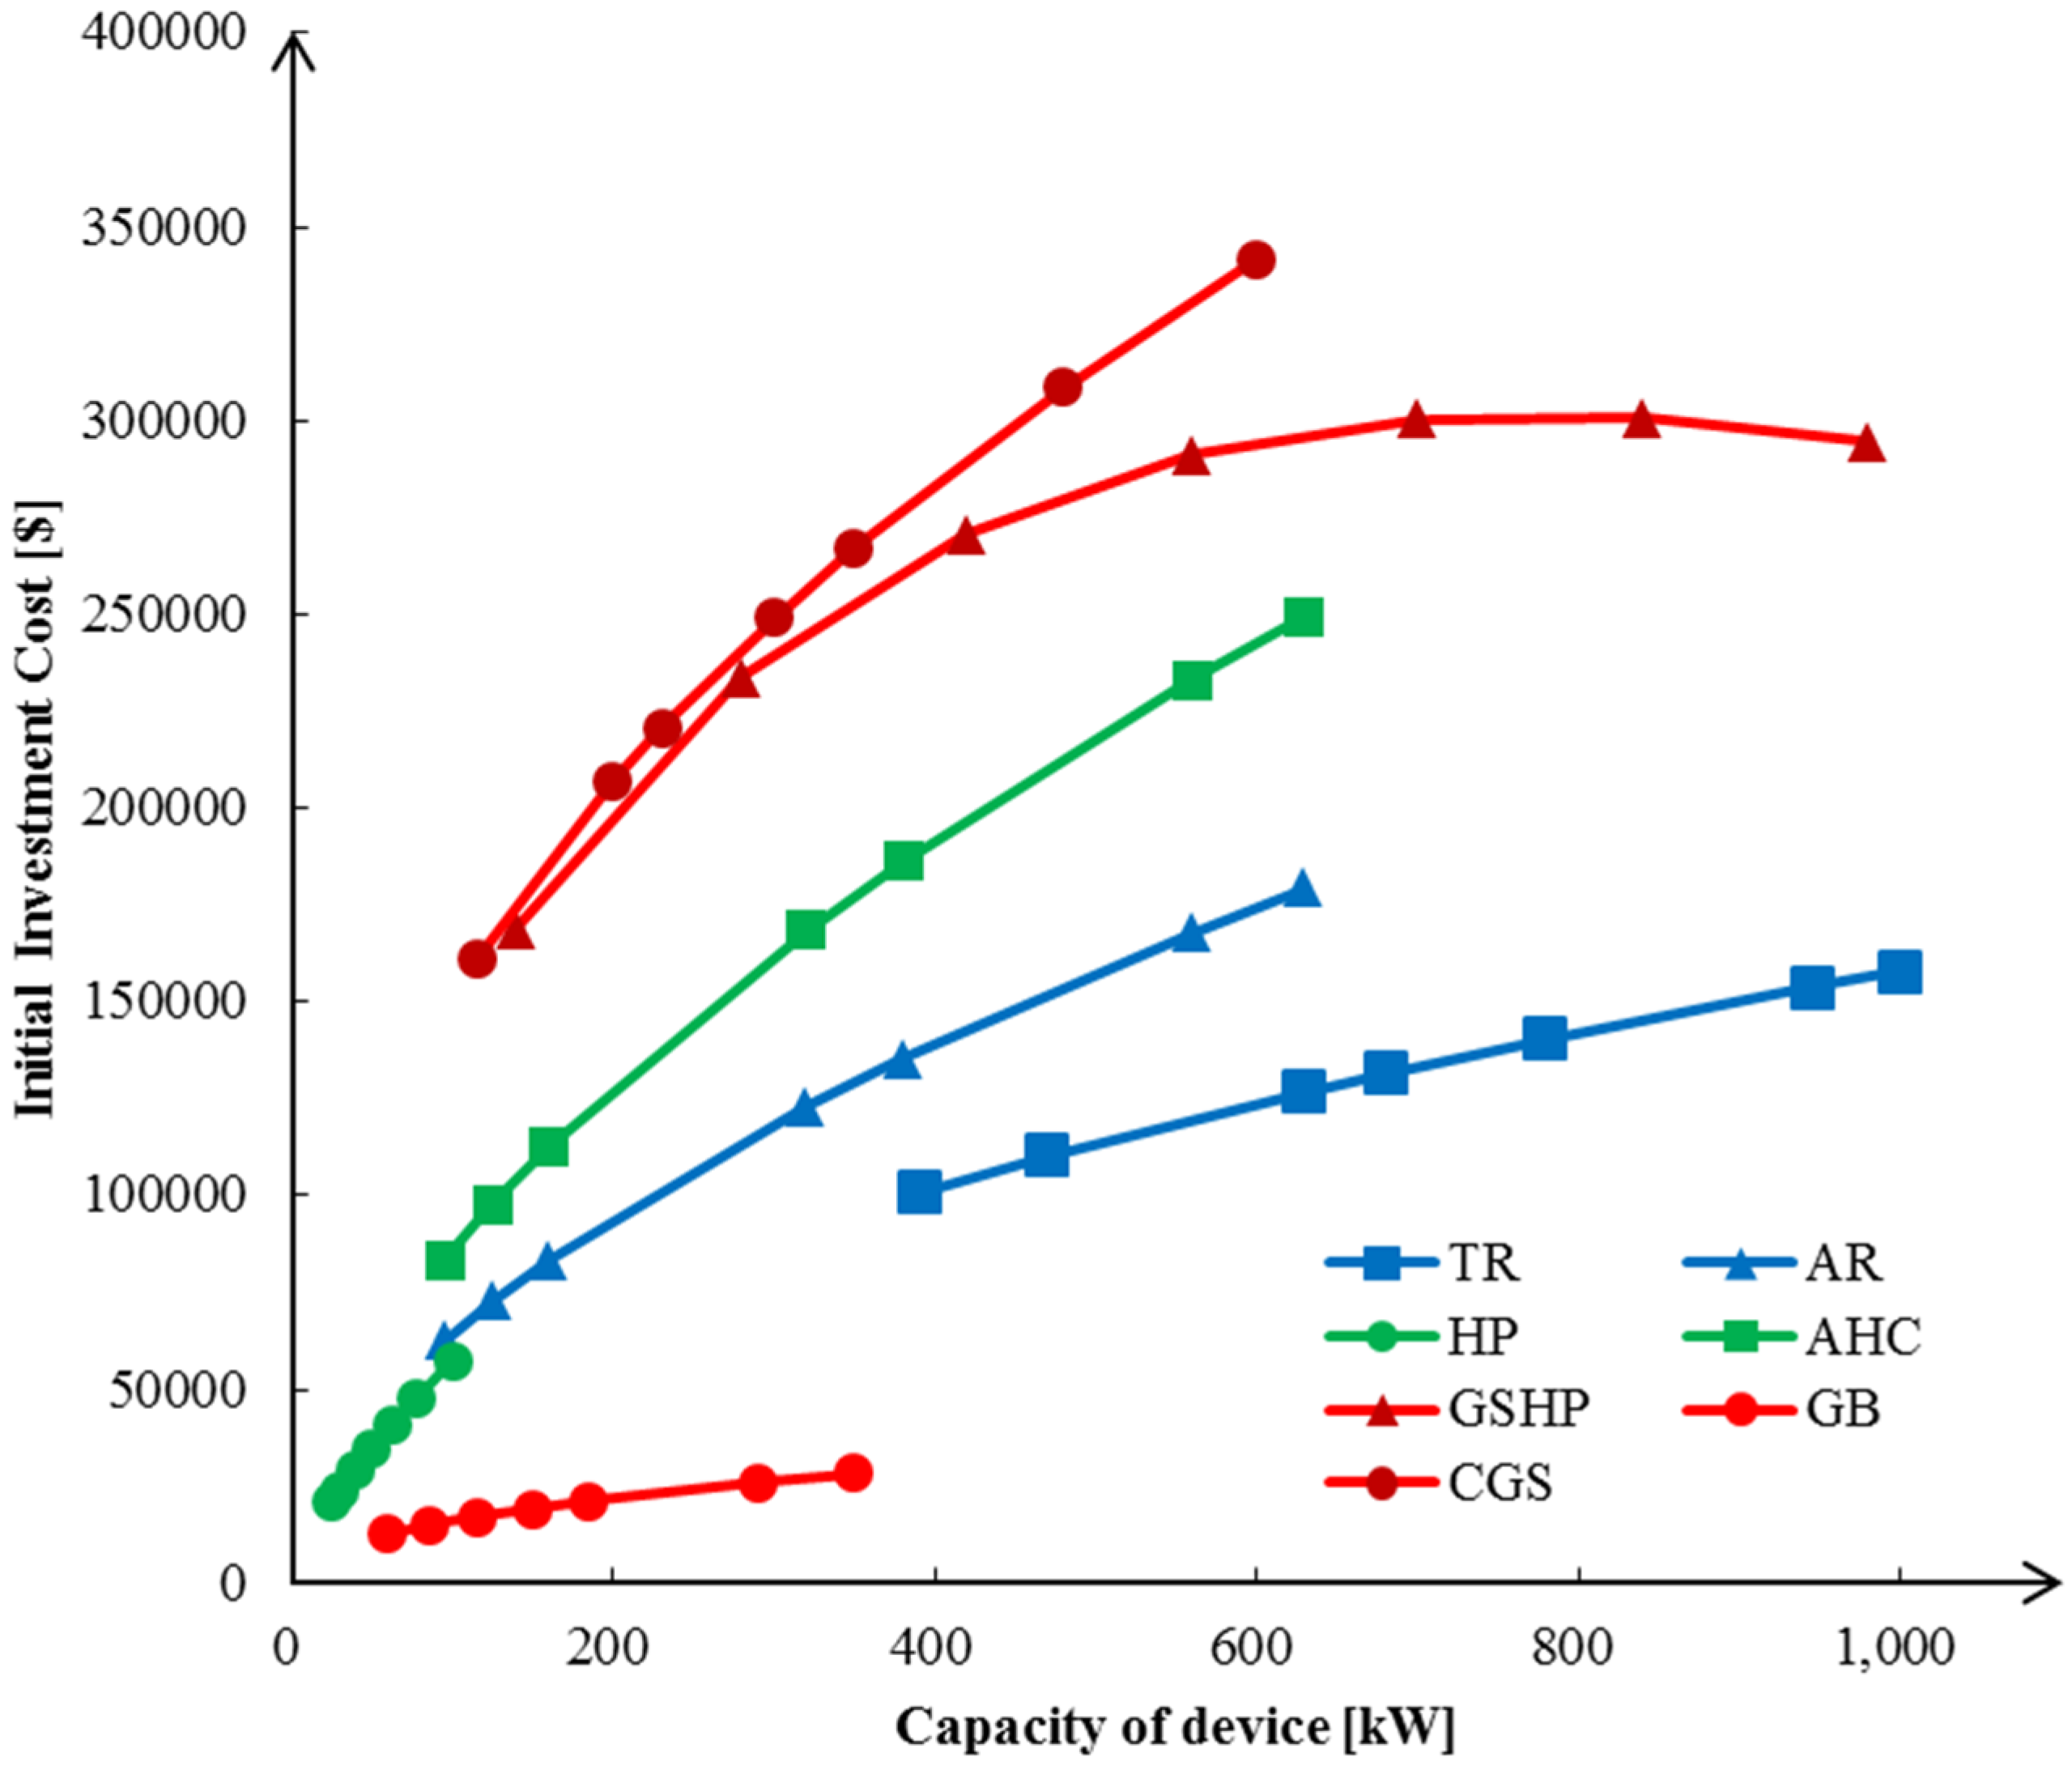
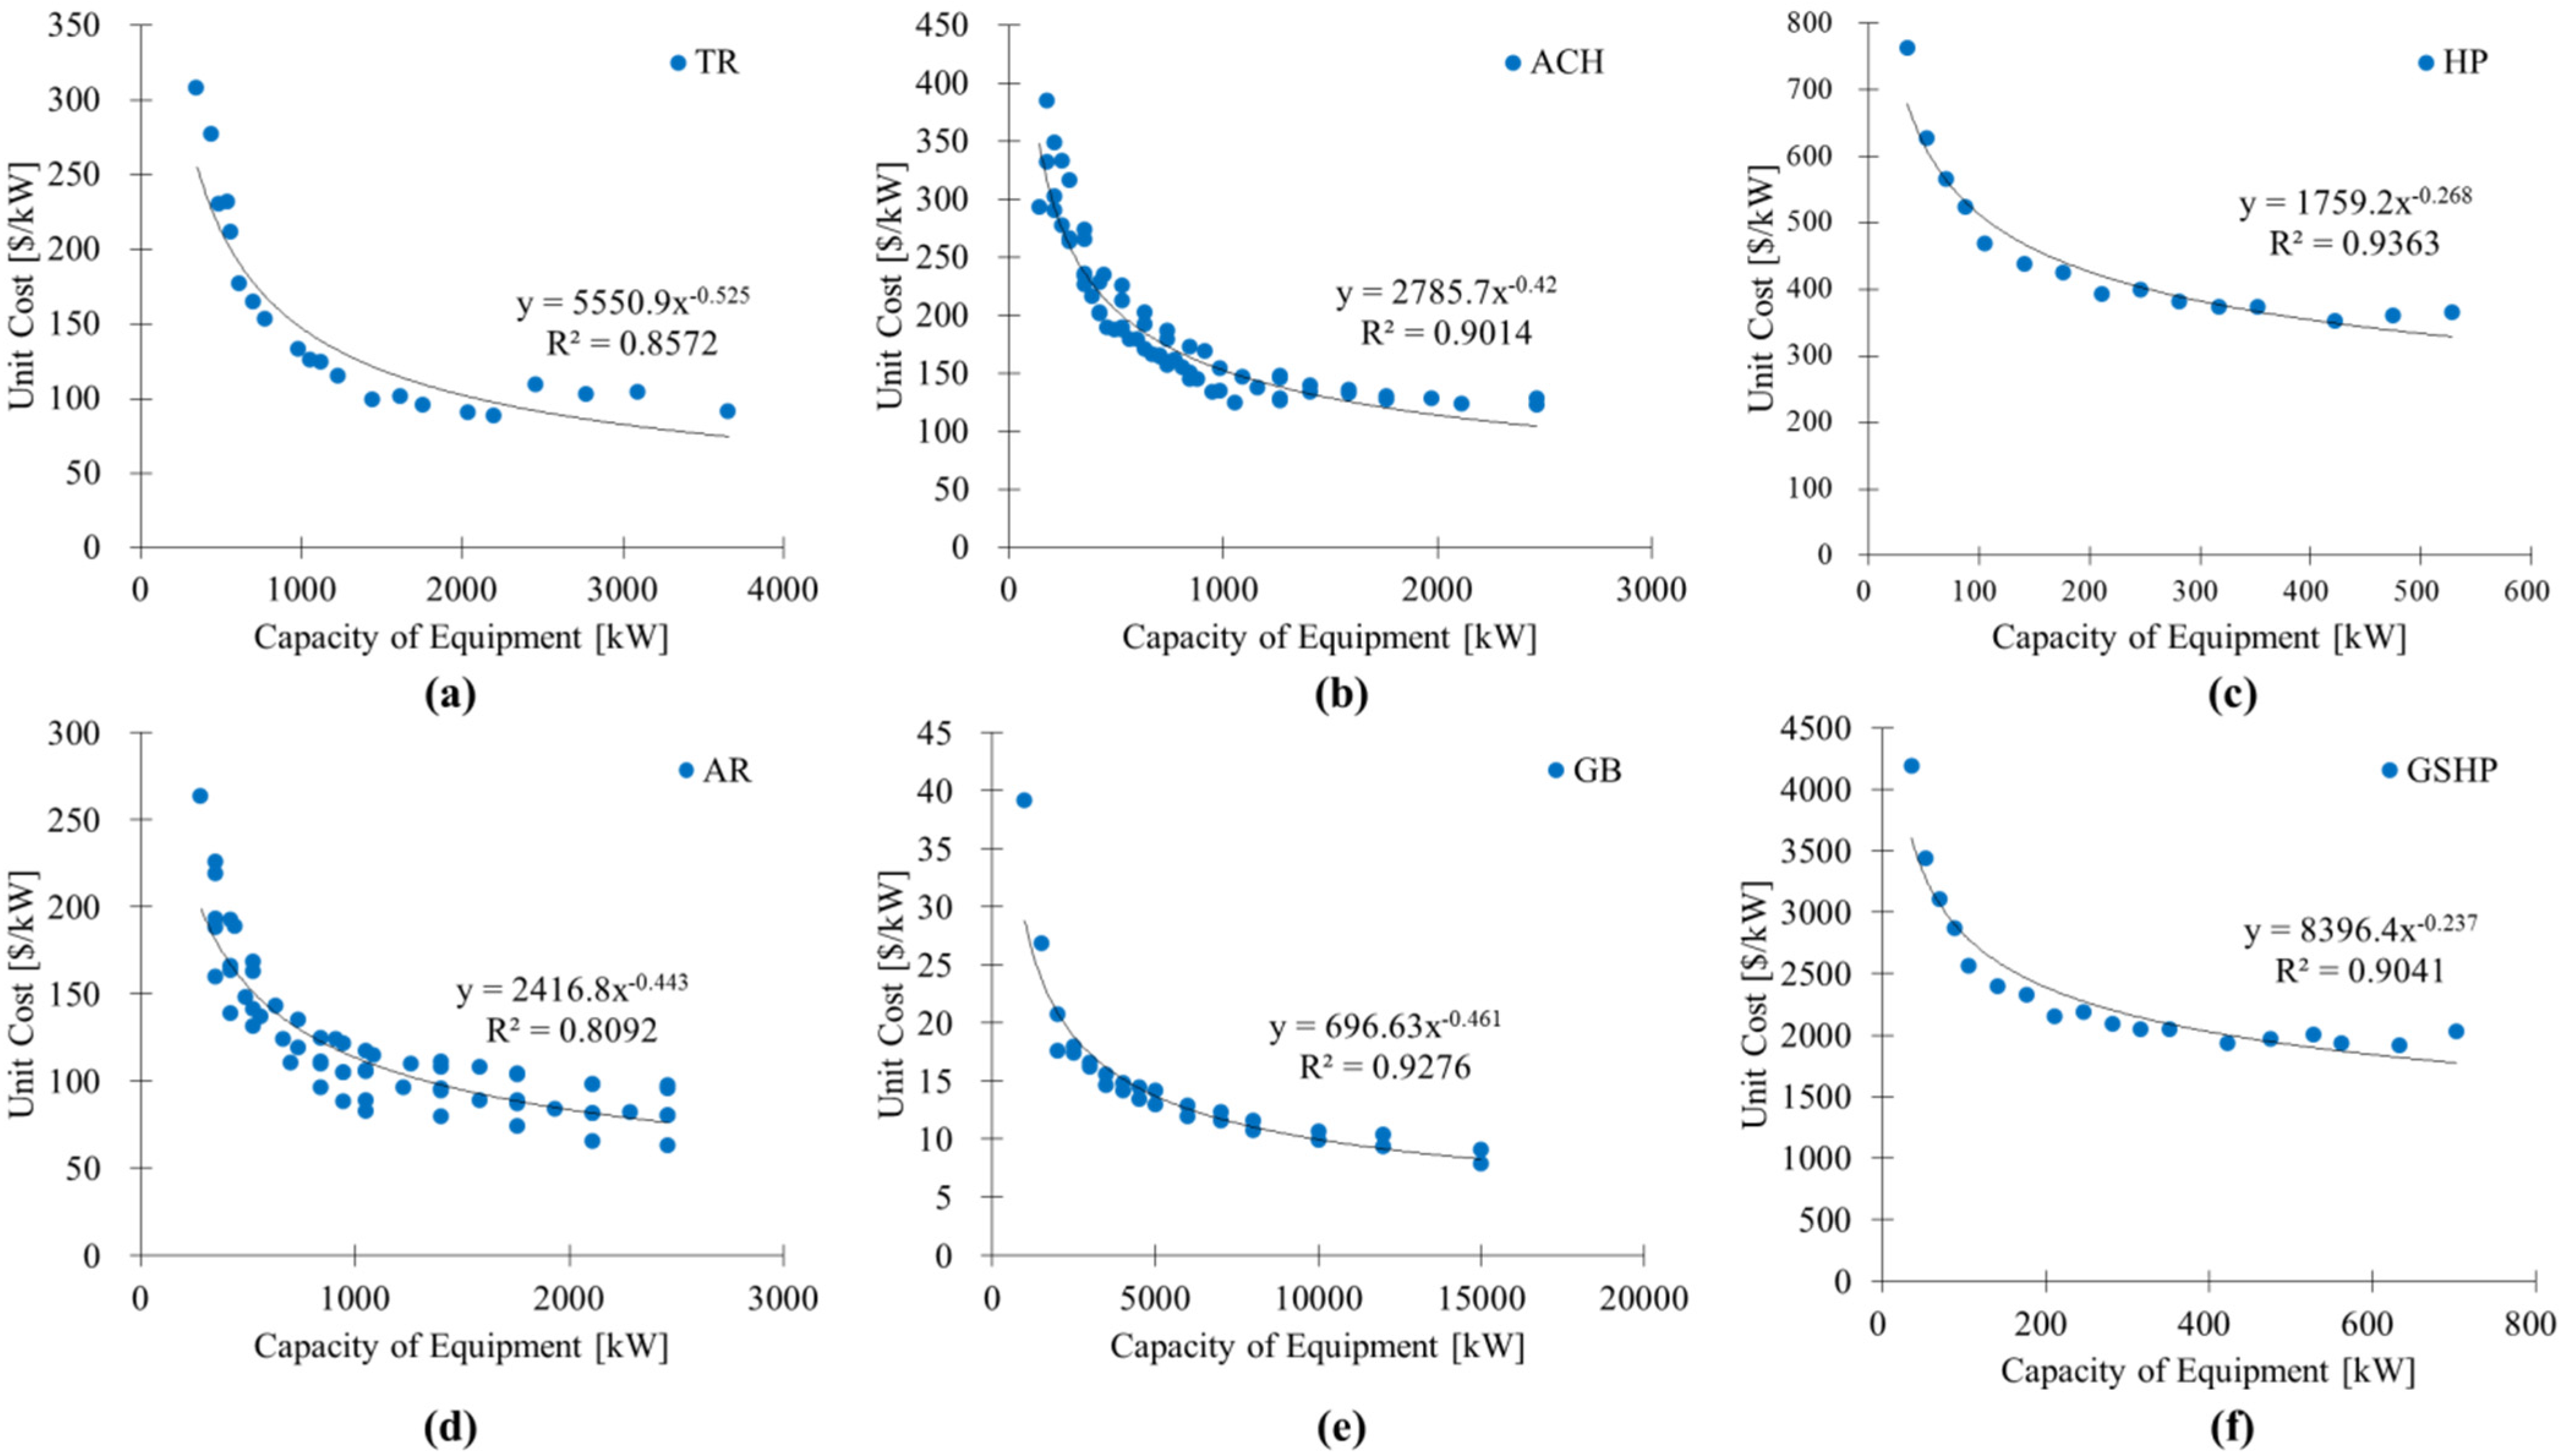
3.3. Objective Function (2): Initial Investment Cost

3.4. Constraints
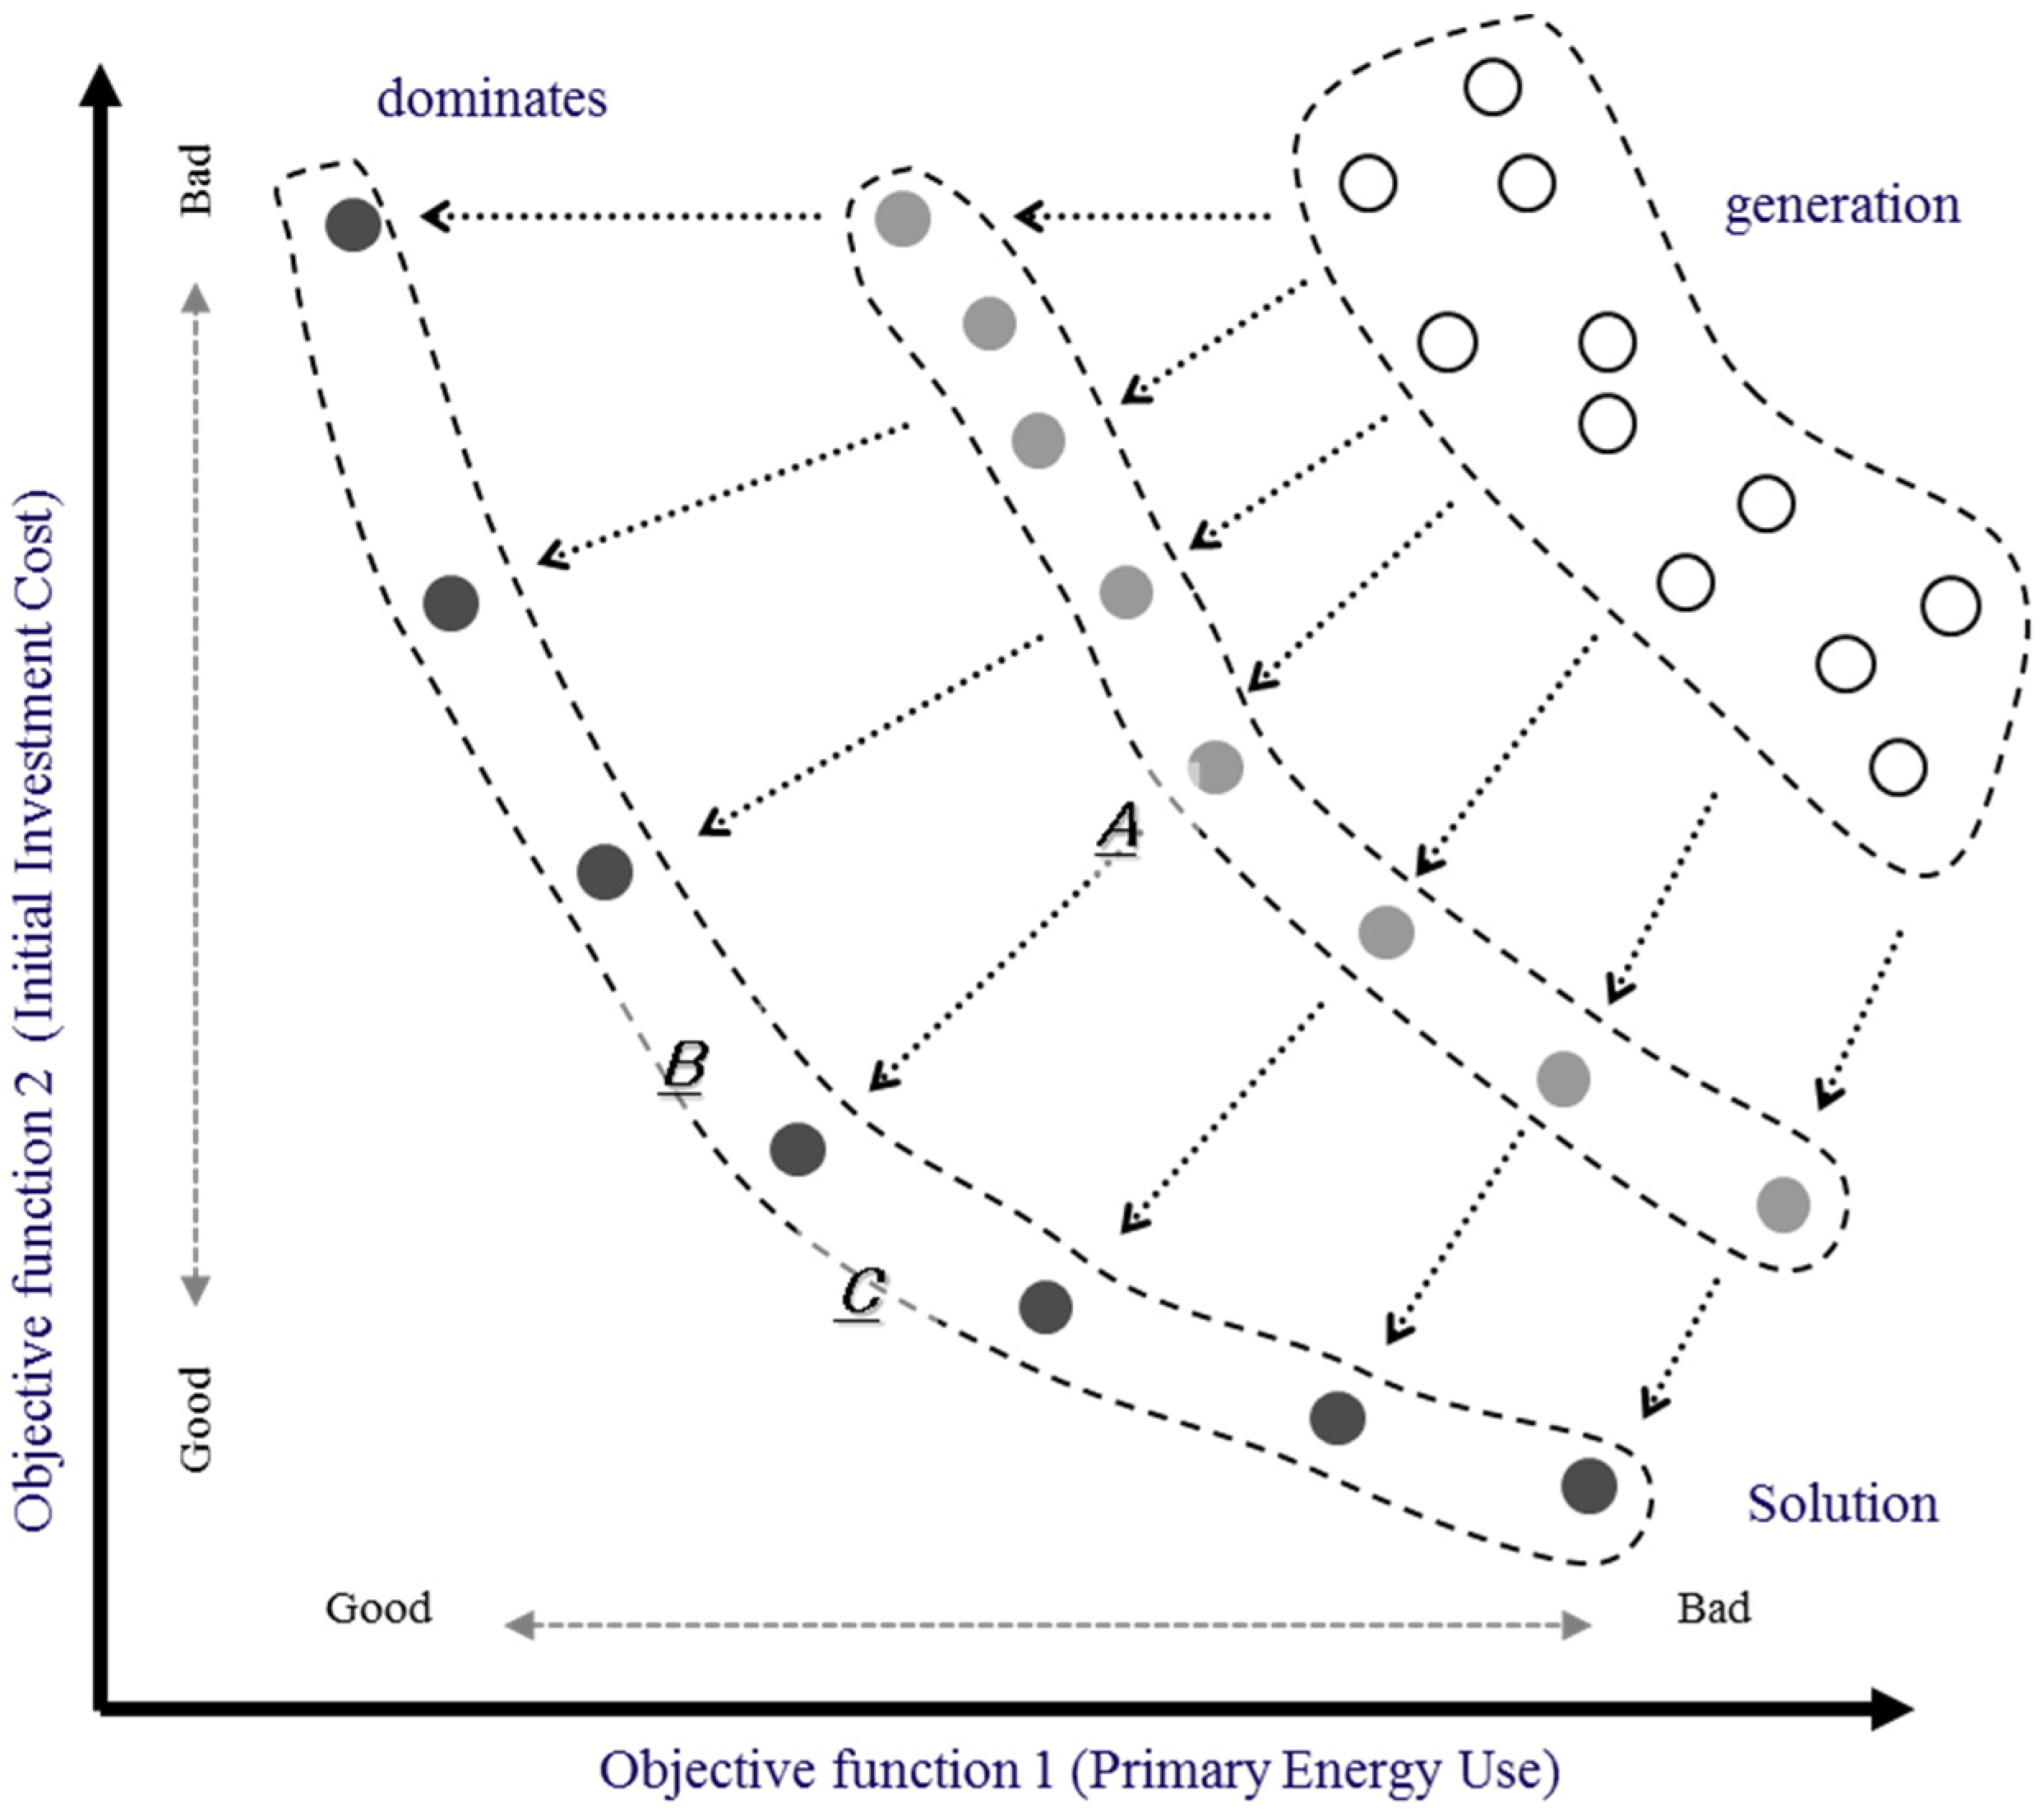
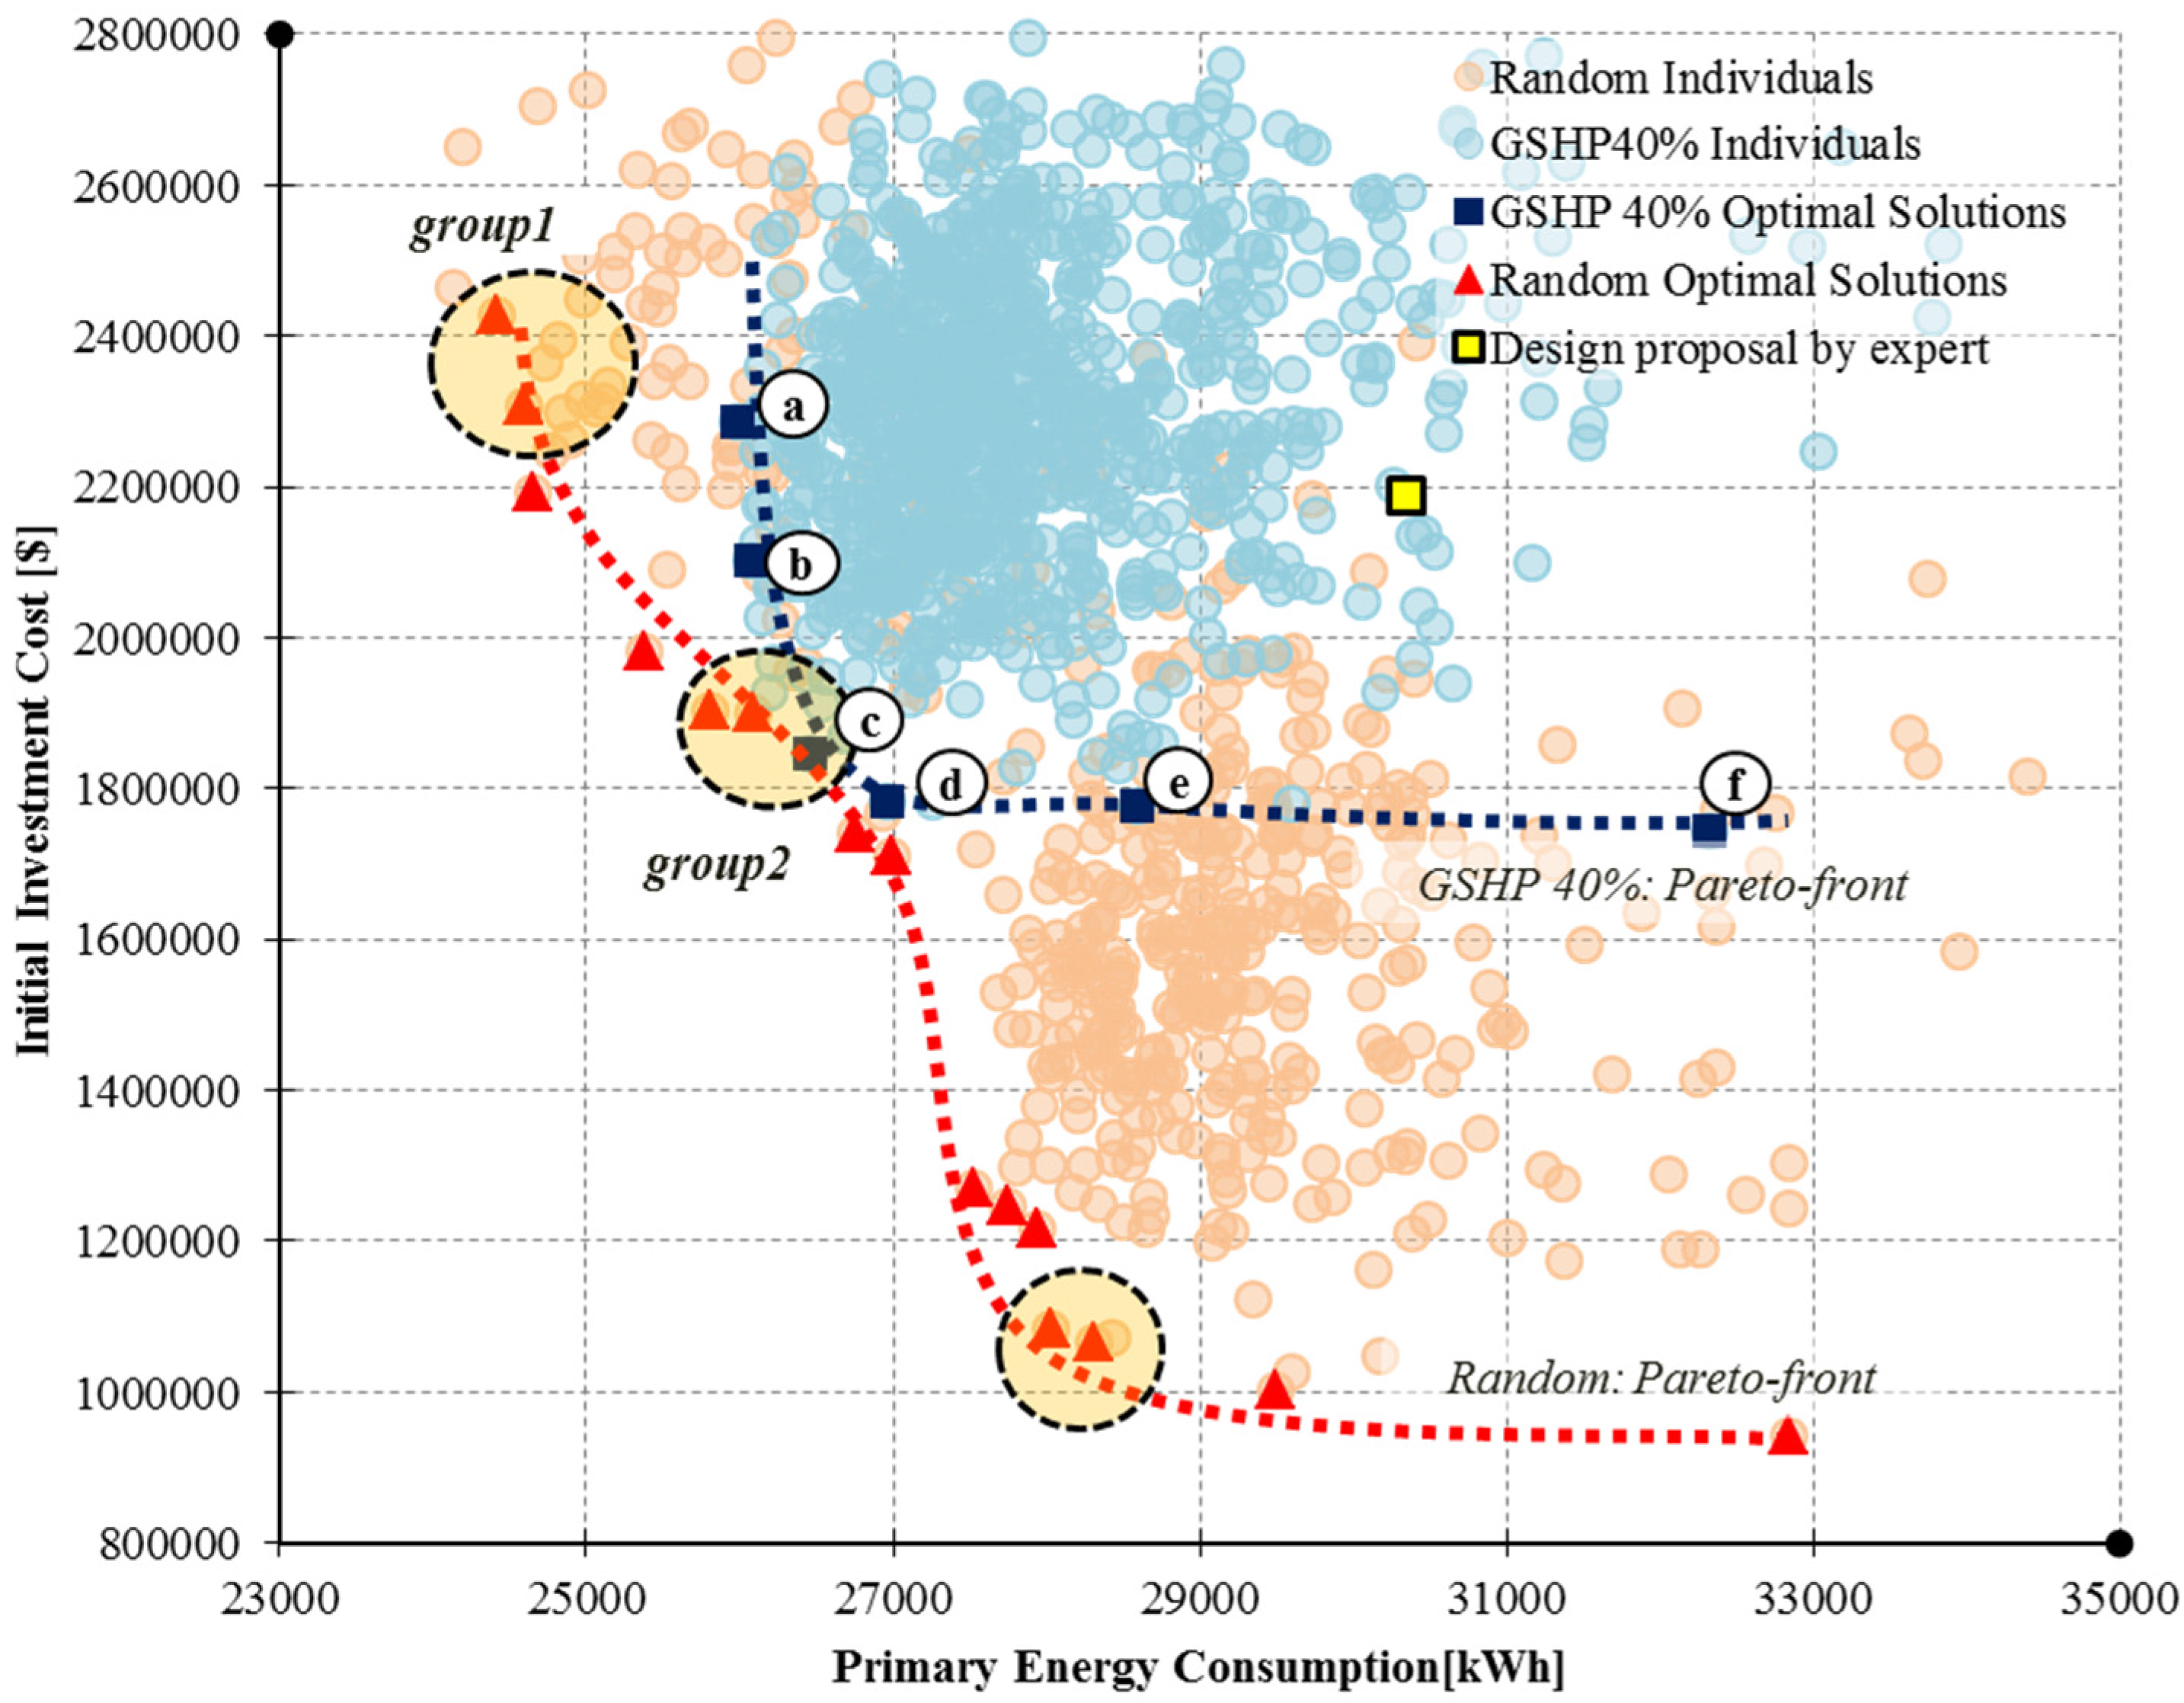
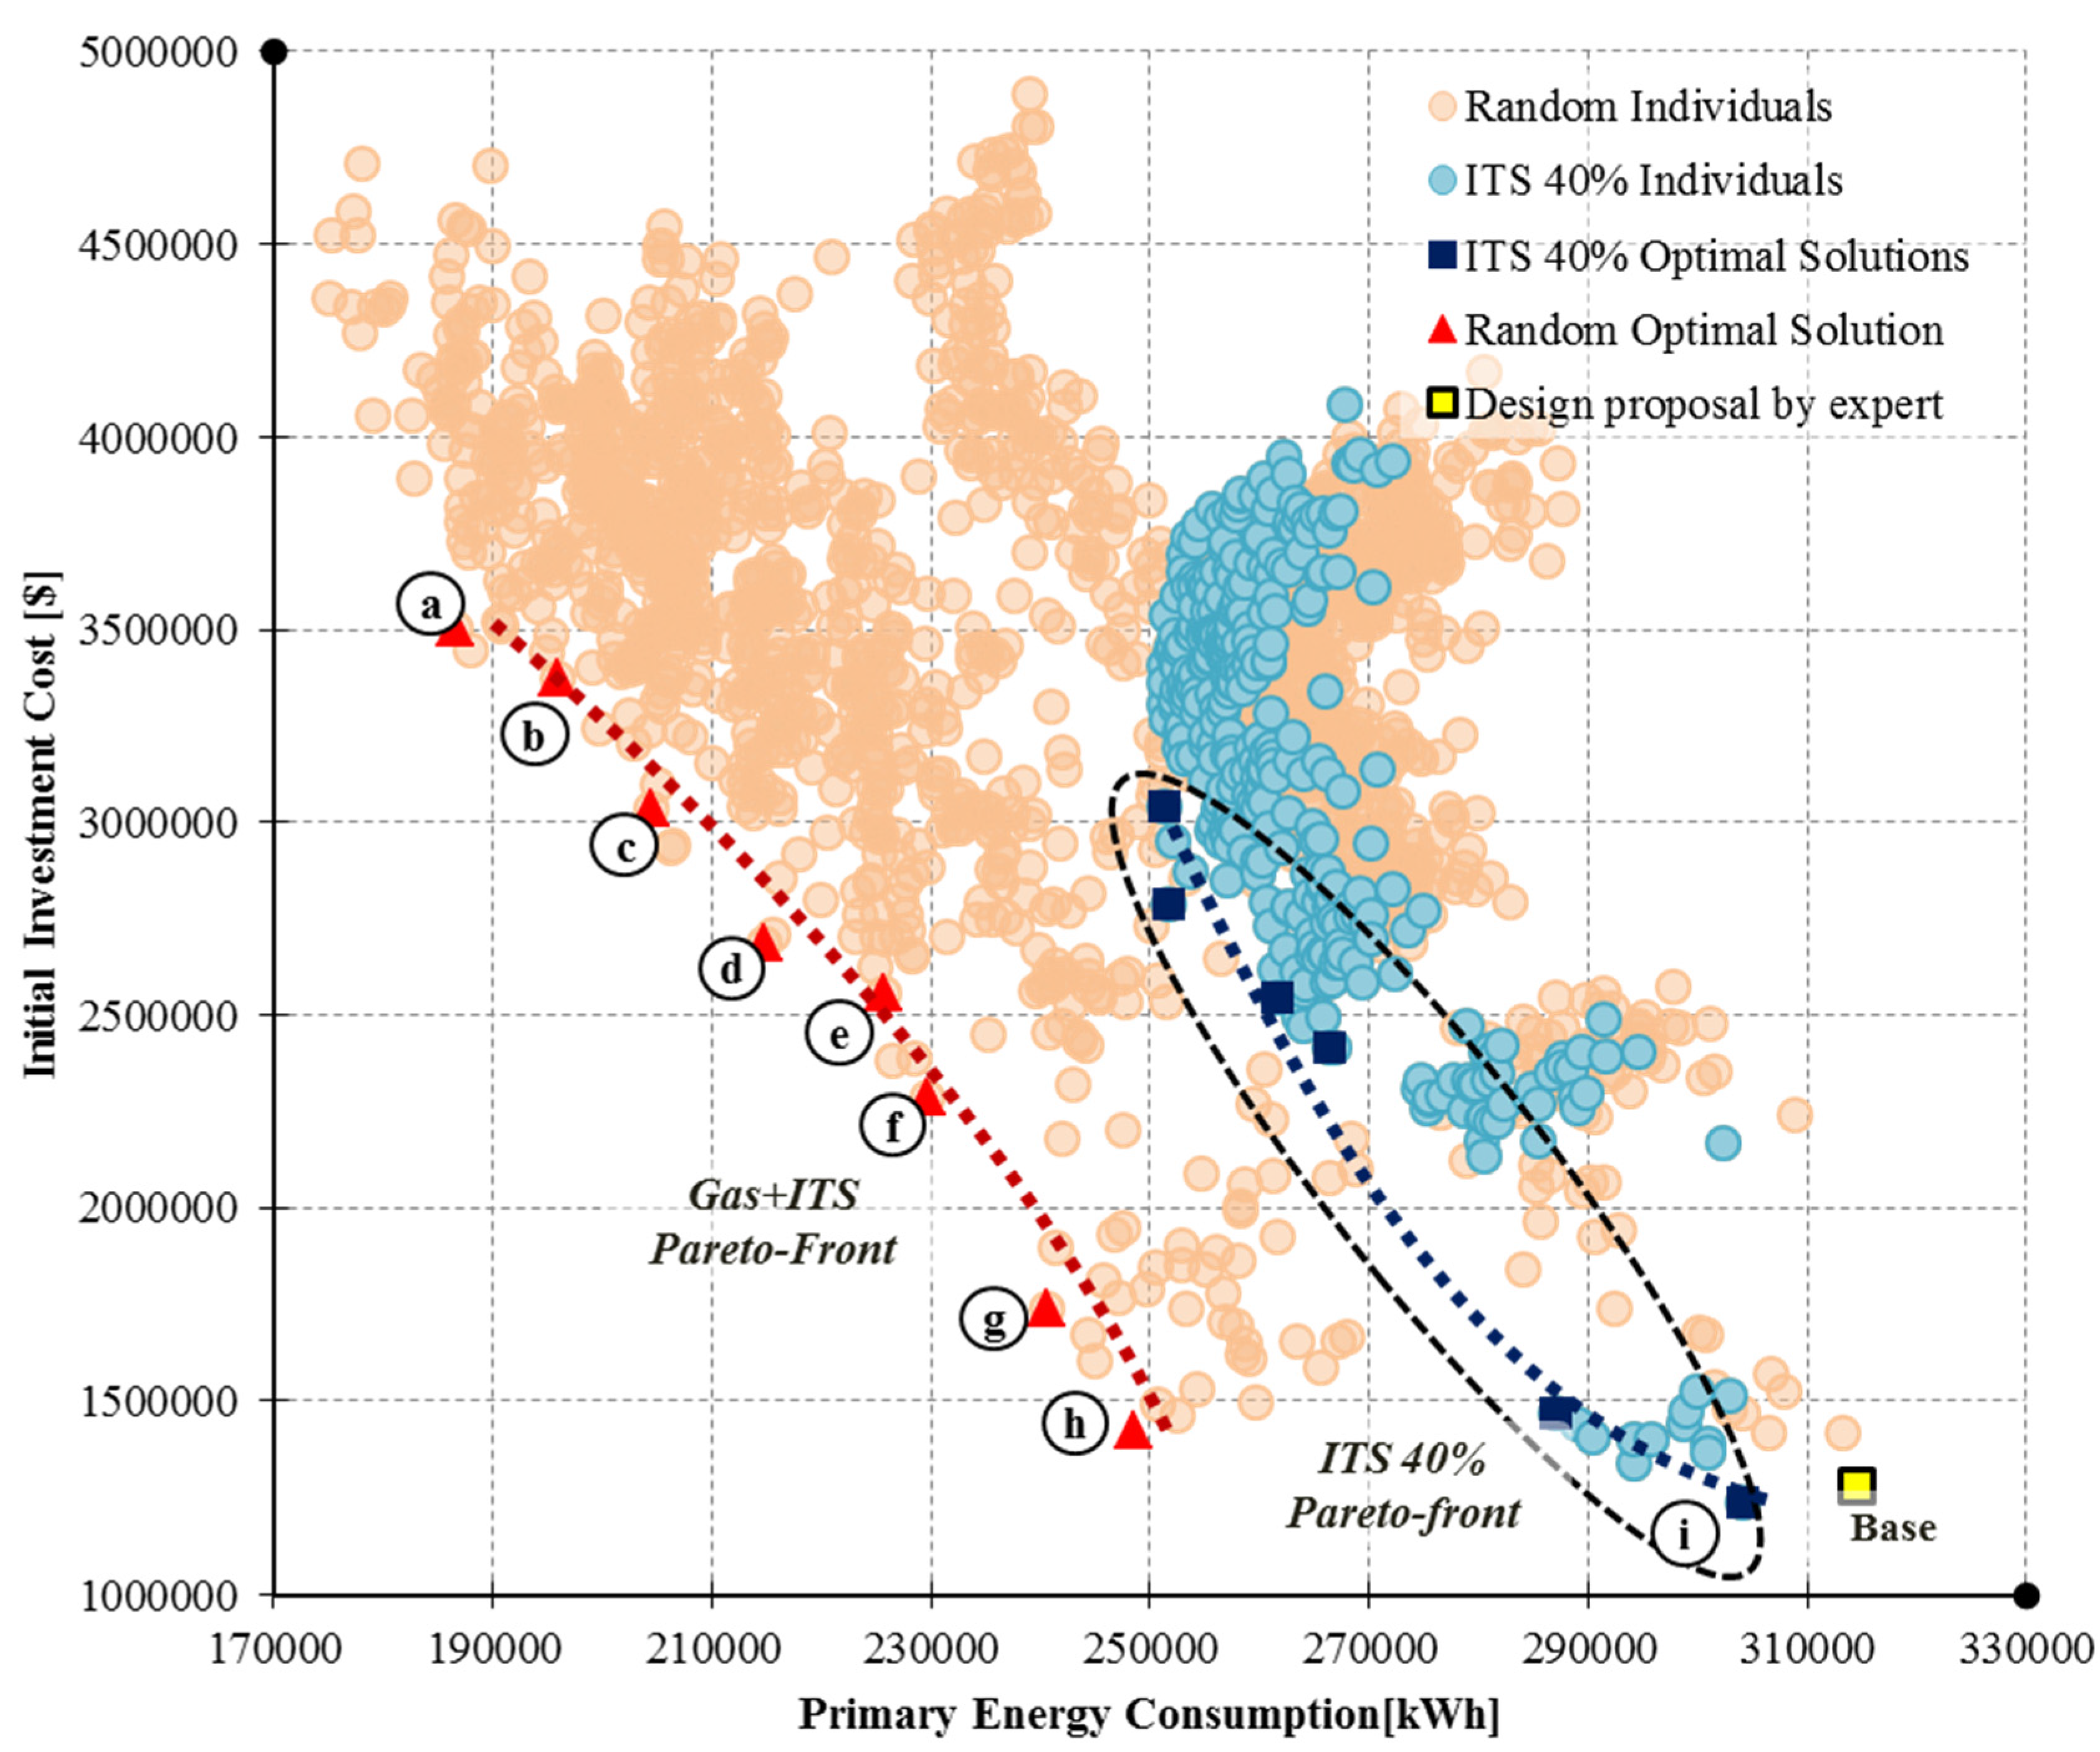
3.5. Pareto Analysis

4. Case Studies
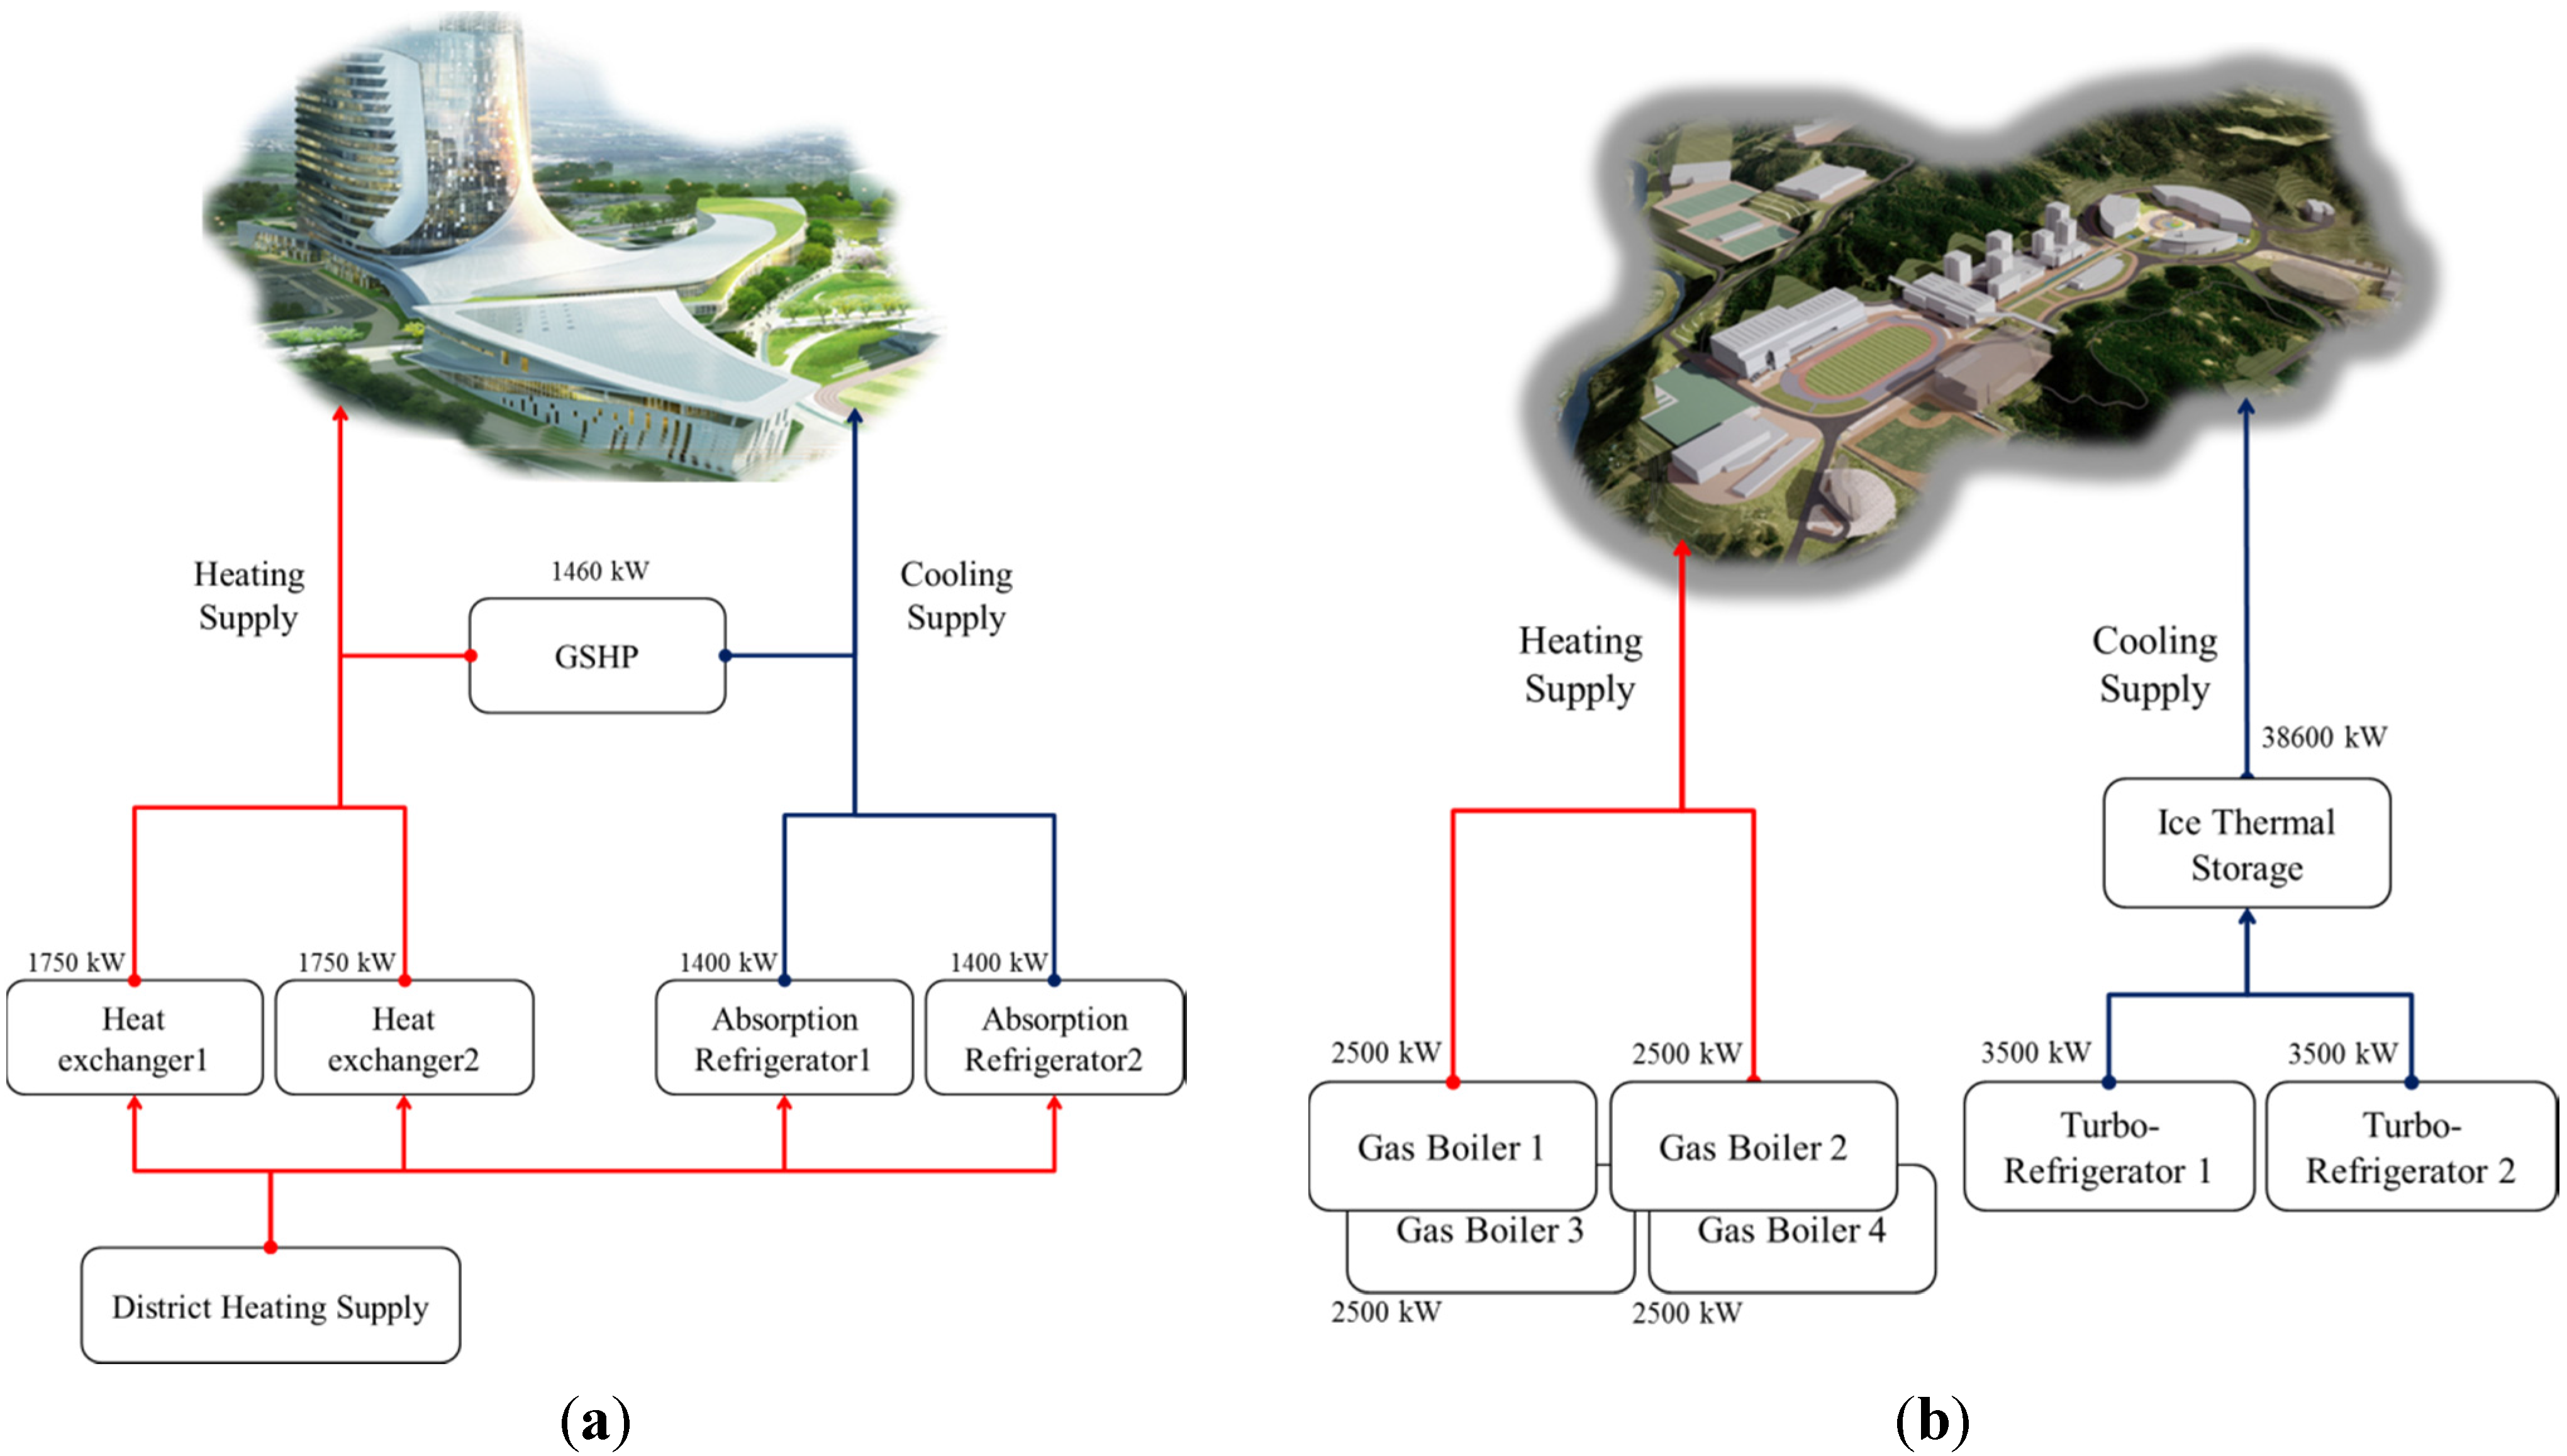
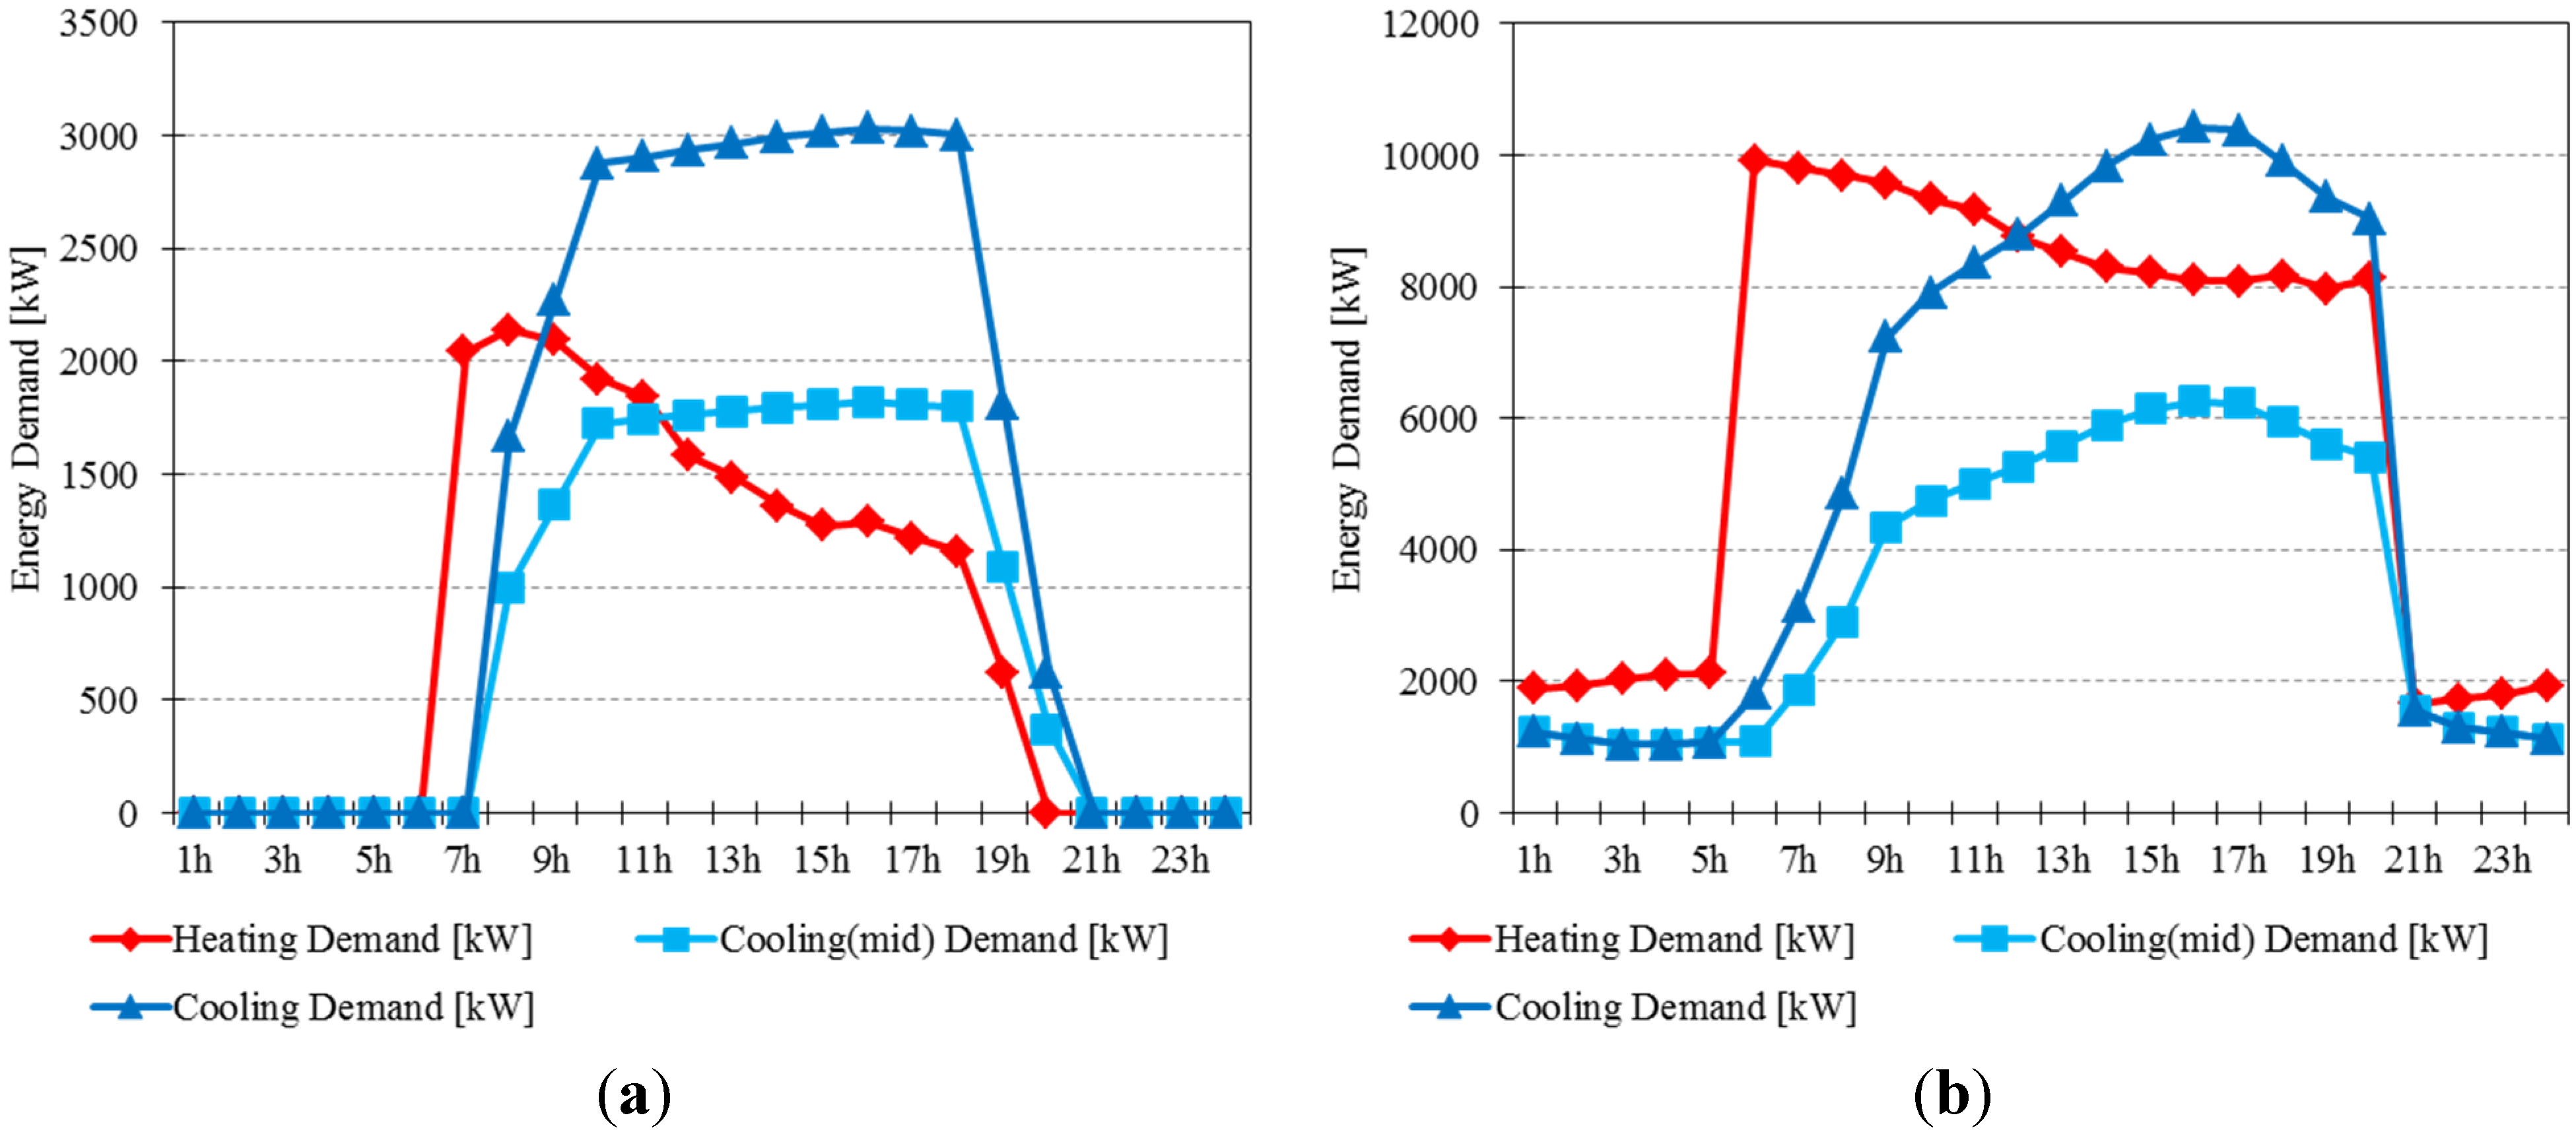
4.1. Building 1


4.2. Building 2
5. Results and Discussion

| Device | Solutions | |||||||
|---|---|---|---|---|---|---|---|---|
| Capacity(kW) | Base | ⓐ | ⓑ | ⓒ | ⓓ | ⓔ | ⓕ | |
| Type | TR1 | 0 | 700 | 0 | 0 | 700 | 1400 | 700 |
| TR2 | 0 | 1400 | 1400 | 1800 | 2700 | 0 | 1800 | |
| TR3 | 0 | 1800 | 1050 | 700 | 0 | 0 | 1400 | |
| AR1 | 1400 | 350 | 420 | 0 | 0 | 350 | 0 | |
| AR2 | 1400 | 0 | 350 | 0 | 0 | 350 | 350 | |
| GB1 | 1750 | 930 | 370 | 700 | 930 | 0 | 2250 | |
| GB2 | 1750 | 115 | 700 | 930 | 115 | 1400 | 0 | |
| CGS1 | 0 | 1750 | 1390 | 115 | 700 | 375 | 0 | |
| CGS2 | 0 | 700 | 115 | 0 | 115 | 0 | 0 | |
| GSHP | 1500 | 1200 | 1200 | 1200 | 1200 | 1200 | 1200 | |
| Initial Investment Cost ($106) | 2.21 | 2.31 | 2.12 | 1.86 | 1.80 | 1.79 | 1.76 | |
| Solution/Base (%) | - | 104 | 96 | 84 | 81 | 81 | 80 | |
| Primary Energy Consumption (kWh) | 30,332 | 25,987 | 26,076 | 26,454 | 26,916 | 28,586 | 32,320 | |
| Solution/Base (%) | - | 86 | 86 | 87 | 89 | 94 | 107 | |
| Device | Solutions | |||||||
|---|---|---|---|---|---|---|---|---|
| Capacity (kW) | Base | Group 1 | Group 2 | Group 3 | ||||
| Type | TR1 | 0 | 1055 | 1055 | 3510 | 1400 | 1400 | 3510 |
| TR2 | 0 | 2700 | 1400 | 0 | 1055 | 1800 | 0 | |
| TR3 | 0 | 0 | 1800 | 1055 | 0 | 700 | 700 | |
| AR1 | 1400 | 0 | 985 | 0 | 420 | 740 | 530 | |
| AR2 | 1400 | 350 | 0 | 420 | 350 | 350 | 350 | |
| ACH | 0 | 1410 | 0 | 350 | 0 | 0 | 420 | |
| GB1 | 1750 | 116 | 700 | 700 | 370 | 930 | 930 | |
| GB2 | 1750 | 1395 | 930 | 700 | 700 | 700 | 930 | |
| GB3 | 0 | 374 | 374 | 116 | 370 | 1395 | 2245 | |
| CGS1 | 0 | 0 | 0 | 0 | 374 | 0 | 0 | |
| CGS2 | 0 | 0 | 0 | 0 | 0 | 116 | 0 | |
| GSHP | 1500 | 1800 | 1500 | 1200 | 1200 | 0 | 0 | |
| Initial Investment Cost ($106) | 2.21 | 2.42 | 2.30 | 1.98 | 1.90 | 1.08 | 1.06 | |
| Solution/Base (%) | -- | 110 | 110 | 104 | 90 | 86 | 49 | |
| Primary Energy Consumption (kWh) | 30,332 | 24,422 | 24,594 | 25,378 | 25,801 | 28,022 | 28,305 | |
| Solution/Base (%) | -- | 81 | 81 | 84 | 85 | 92 | 93 | |
| Device | Solutions | |||||||||
|---|---|---|---|---|---|---|---|---|---|---|
| Capacity (kW) | Base | ⓐ | ⓑ | ⓒ | ⓓ | ⓔ | ⓕ | ⓖ | ⓗ | |
| Type | TR1 | 5100 | 1560 | 5100 | 3510 | 2280 | 1970 | 2780 | 2280 | 1970 |
| TR2 | 5100 | 2780 | 2780 | 2780 | 2780 | 2780 | 2780 | 2780 | 3510 | |
| ITS | 51,000 | 27,800 | 27,800 | 27,800 | 27,800 | 27,800 | 27,800 | 27,800 | 35,100 | |
| GSHP | 0 | 6259 | 4172 | 3129 | 2086 | 1043 | 1043 | 0 | 0 | |
| AR1 | 0 | 0 | 0 | 0 | 0 | 1760 | 1580 | 1970 | 0 | |
| AR2 | 0 | 1580 | 1970 | 1760 | 2460 | 1970 | 0 | 2460 | 2460 | |
| GB1 | 5000 | 5000 | 2000 | 2000 | 2000 | 3760 | 3000 | 5000 | 2000 | |
| GB2 | 5000 | 0 | 2480 | 2200 | 3000 | 3760 | 3760 | 3760 | 3760 | |
| GB3 | 5000 | 2000 | 3000 | 2000 | 0 | 2000 | 5000 | 2480 | 2000 | |
| GB4 | 5000 | 2480 | 2000 | 2480 | 4300 | 2200 | 4300 | 4300 | 4300 | |
| Initial Investment Cost ($106) | 1.28 | 3.50 | 3.37 | 3.03 | 2.68 | 2.55 | 2.28 | 1.73 | 1.42 | |
| Solution/Base (%) | - | 273 | 263 | 236 | 209 | 199 | 178 | 135 | 111 | |
| Primary Energy Consumption (kWh) | 314,448 | 186,605 | 195,830 | 204,516 | 214,818 | 225,634 | 229,608 | 240,542 | 248,603 | |
| Solution/Base (%) | - | 59 | 62 | 65 | 68 | 72 | 73 | 76 | 79 | |
| Device | Solutions | |||||||
|---|---|---|---|---|---|---|---|---|
| Capacity(kW) | Base | ⓘ | ⓙ | ⓚ | ⓛ | ⓜ | ⓝ | |
| Type | TR1 | 5100 | 1970 | 2280 | 0 | 0 | 0 | 0 |
| TR2 | 5100 | 5100 | 5100 | 5100 | 5100 | 5100 | 5100 | |
| ITS | 51,000 | 51,000 | 51,000 | 51,000 | 51,000 | 51,000 | 51,000 | |
| GSHP | 0 | 0 | 0 | 2086 | 2086 | 4172 | 3129 | |
| AR1 | 0 | 0 | 1760 | 1760 | 3510 | 2460 | 3510 | |
| AR2 | 0 | 0 | 3510 | 1580 | 1760 | 2810 | 2460 | |
| GB1 | 5000 | 4300 | 4300 | 2480 | 2000 | 2200 | 0 | |
| GB2 | 5000 | 4300 | 2000 | 2000 | 3760 | 2200 | 3760 | |
| GB3 | 5000 | 4300 | 3000 | 2000 | 2480 | 3760 | 2200 | |
| GB4 | 5000 | 2200 | 2480 | 2480 | 3760 | 2200 | 5000 | |
| Initial Investment Cost ($106) | 1.28 | 1.23 | 1.47 | 2.41 | 2.54 | 3.04 | 2.78 | |
| Solution/Base (%) | - | 96 | 115 | 188 | 198 | 238 | 217 | |
| Primary Energy Consumption (kWh) | 314,448 | 304,022 | 287,045 | 266,402 | 261,705 | 251,252 | 251,761 | |
| Solution/Base (%) | - | 97 | 91 | 85 | 83 | 80 | 80 | |
6. Conclusions and Future Directions
- (1)
- The energy system minimizing the primary energy use and initial investment cost was derived by the energy consumption according to the combination of energy systems or devices. It was calculated using the regression model created by the survey and based on the performance curve, indicating the mechanical characteristics of the device, heating and cooling load profiles by the design-day, information in the early design stage, and initial investment cost.
- (2)
- The applicability and usability of the proposed method were verified by the case studies, and various optimal design alternatives were analyzed using the Pareto-based analysis method. As a result, it was confirmed that the proposed method could provide optimal solutions for the design of a complex energy system.
- (3)
- The proposed method is capable of supporting the decision-making process by providing various design alternatives with optimal designs reflecting the intentions of the clients and engineers, and capable of maximizing the energy and cost efficiency in the long term.
Acknowledgments
Author Contributions
Conflicts of Interest
Acronyms
| TR | Turbo refrigerator |
| AR | Absorption refrigerator |
| ACH | Absorption chiller & heater |
| HP | Heat pump |
| GB | Gas boiler |
| CHP | Cogeneration heat & power system |
| ITS | Ice thermal storage system |
| WTS | Water thermal storage system |
| GSHP | Geothermal heat pump |
| PV | Photovoltaic system |
| Solar | Solar thermal system |
| PLR | Partial load ratio |
References
- Djunaedy, E.; van den Wymelenberg, K.; Acker, B.; Thimmana, H. Oversizing of HVAC system: Signatures and penalties. Energy Build. 2011, 43, 468–475. [Google Scholar] [CrossRef]
- Jacobs, P.; Henderson, H. State-of-the-Art Review Whole Building, Building Envelope, and HVAC Component and System Simulation and Design Tools; Architectural Energy Corporation: Boulder, CO, USA, 2002. [Google Scholar]
- Shahrestani, M.; Yao, R.; Cook, G.K. Characterizing the energy performance of centralized HVAC & R systems in the UK. Energy Build. 2013, 62, 239–247. [Google Scholar]
- Hafez, O.; Bhattacharya, K. Optimal planning and design of a renewable energy based supply system for microgrids. Renew. Energy 2012, 45, 7–15. [Google Scholar] [CrossRef]
- Kayo, G.; Ooka, R. Building energy system optimizations with utilization of waste heat from cogenerations by means of genetic algorithm. Energy Build. 2010, 42, 985–991. [Google Scholar] [CrossRef]
- Kayo, G.; Ooka, R. Optimal design method for distributed energy system using genetic algorithm: Examining the influence of GA parameters on the accuracy of calculation results estimated by the optimal design method and confirming the applicability of designing distributed energy system. J. Environ. Eng. Trans. Archit. Inst. Jpn. 2009, 74, 869–876. (In Japanese) [Google Scholar]
- Ooka, R.; Komamura, K. Optimal design method for building energy systems using genetic algorithms. Build. Environ. 2009, 44, 1538–1544. [Google Scholar] [CrossRef]
- Seo, J.; Ooka, R.; Kim, J.T.; Nam, Y. Optimization of the HVAC system design to minimize primary energy demand. Energy Build. 2014, 76, 102–108. [Google Scholar] [CrossRef]
- Shaneb, O.A.; Coates, G.; Taylor, P.C. Sizing of residential μCHP systems. Energy Build. 2011, 43, 1991–2001. [Google Scholar] [CrossRef]
- Harris, J.; Anderson, J.; Shafron, W. Investment in energy efficiency: A survey of Australian firms. Energy Policy 2000, 28, 867–876. [Google Scholar] [CrossRef]
- Kayo, G.; Ooka, R. Multi-objective genetic algorithm optimized for energy consumption and cost in building energy system design. J. Environ. Eng. Trans. Archit. Inst. Jpn. 2010, 75, 735–740. (In Japanese) [Google Scholar] [CrossRef]
- Malatji, E.M.; Zhang, J.; Xia, X. A multiple objective optimisation model for building energy efficiency investment decision. Energy Build. 2013, 61, 81–87. [Google Scholar] [CrossRef]
- Fazlollahi, S.; Mandel, P.; Becker, G.; Maréchal, F. Methods for multi-objective investment and operating optimization of complex energy systems. Energy 2012, 45, 12–22. [Google Scholar] [CrossRef]
- Srinivas, N.; Deb, K. Muiltiobjective optimization using nondominated sorting in genetic algorithms. Evol. Comput. 1994, 2, 221–248. [Google Scholar] [CrossRef]
- Deb, K.; Pratap, A.; Agarwal, S.; Meyarivan, T.A.M.T. A fast and elitist multiobjective genetic algorithm: NSGA-II. IEEE Trans. Evol Comput 2002, 6, 182–197. [Google Scholar] [CrossRef]
- Burdick, A. Strategy Guideline: HVAC Equipment Sizing; US Department of Energy: Washington, DC, USA, 2012. [Google Scholar]
- Pérez-Lombard, L.; Ortiz, J.; Coronel, J.F.; Maestre, I.R. A review of HVAC systems requirements in building energy regulations. Energy Build. 2011, 43, 255–268. [Google Scholar] [CrossRef]
- American Society of Heating, Refrigerating and Air-Conditioning Engineers (ASHRAE). Non-residential cooling and heating load calculations. In ASHRAE Handbook—Fundamentals; American Society of Heating, Refrigerating and Air-Conditioning Engineers: Atlanta, GA, USA, 2009; Chapter 28. [Google Scholar]
- Elkhuizen, P.A.; Peitsman, H.C.; Wienk, W.J. A new design guideline for the heating and cooling curve in AHU units of HVAC systems. Build. Serv. Eng. Res. Technol. 2003, 24, 191–202. [Google Scholar] [CrossRef]
- Attia, S.; Hamdy, M.; O’Brien, W.; Carlucci, S. Assessing gaps and needs for integrating building performance optimization tools in net zero energy buildings design. Energy Build. 2013, 60, 110–124. [Google Scholar] [CrossRef]
- Gossard, D.; Lartigue, B.; Thellier, F. Multi-objective optimization of a building envelope for thermal performance using genetic algorithms and artificial neural network. Energy Build. 2013, 67, 253–260. [Google Scholar] [CrossRef]
- Hamdy, M.; Hasan, A.; Siren, K. A multi-stage optimization method for cost-optimal and nearly-zero-energy building solutions in line with the EPBD-recast 2010. Energy Build. 2013, 56, 189–203. [Google Scholar] [CrossRef]
- United States Department of Energy (USDOE). EnergyPlus Engineering Reference—The Reference to EnergyPlus Calculations; USDOE: Washington, DC, USA, 2013. [Google Scholar]
- Korea Energy Management Corporation Home Page. Available online: http://www.kemco.or.kr (accessed on 18 May 2015).
- Korea Price Information Home Page. Available online: http://www.kpi.or.kr (accessed on 18 May 2015).
- Woradechjumroen, D.; Yu, Y.; Li, H.; Yu, D.; Yang, H. Analysis of HVAC system oversizing in commercial buildings through field measurements. Energy Build. 2014, 69, 131–143. [Google Scholar] [CrossRef]
© 2015 by the authors; licensee MDPI, Basel, Switzerland. This article is an open access article distributed under the terms and conditions of the Creative Commons Attribution license (http://creativecommons.org/licenses/by/4.0/).
Share and Cite
Kong, D.-S.; Jang, Y.-S.; Huh, J.-H. Method and Case Study of Multiobjective Optimization-Based Energy System Design to Minimize the Primary Energy Use and Initial Investment Cost. Energies 2015, 8, 6114-6134. https://doi.org/10.3390/en8066114
Kong D-S, Jang Y-S, Huh J-H. Method and Case Study of Multiobjective Optimization-Based Energy System Design to Minimize the Primary Energy Use and Initial Investment Cost. Energies. 2015; 8(6):6114-6134. https://doi.org/10.3390/en8066114
Chicago/Turabian StyleKong, Dong-Seok, Yong-Sung Jang, and Jung-Ho Huh. 2015. "Method and Case Study of Multiobjective Optimization-Based Energy System Design to Minimize the Primary Energy Use and Initial Investment Cost" Energies 8, no. 6: 6114-6134. https://doi.org/10.3390/en8066114
APA StyleKong, D.-S., Jang, Y.-S., & Huh, J.-H. (2015). Method and Case Study of Multiobjective Optimization-Based Energy System Design to Minimize the Primary Energy Use and Initial Investment Cost. Energies, 8(6), 6114-6134. https://doi.org/10.3390/en8066114