Article

Analysis of Cool Roof Coatings for Residential Demand Side Management in Tropical Australia

School of Chemistry, Physics and Mechanical Engineering, Science and Engineering Faculty, Queensland University of Technology, 2 George Street, Brisbane 4000, Australia
*
Author to whom correspondence should be addressed.
These authors contributed equally to this work.
Energies 2015, 8(6), 5303-5318; https://doi.org/10.3390/en8065303
Submission received: 3 February 2015 / Revised: 6 May 2015 / Accepted: 27 May 2015 / Published: 3 June 2015

Abstract

:
Cool roof coatings have a beneficial impact on reducing the heat load of a range of building types, resulting in reduced cooling energy loads. This study seeks to understand the extent to which cool roof coatings could be used as a residential demand side management (DSM) strategy for retrofitting existing housing in a constrained network area in tropical Australia where peak electrical demand is heavily influenced by residential cooling loads. In particular this study seeks to determine whether simulation software used for building regulation purposes can provide networks with the ‘impact certainty’ required by their DSM principles. The building simulation method is supported by a field experiment. Both numerical and experimental data confirm reductions in total consumption (kWh) and energy demand (kW). The nature of the regulated simulation software, combined with the diverse nature of residential buildings and their patterns of occupancy, however, mean that simulated results cannot be extrapolated to quantify benefits to a broader distribution network. The study suggests that building data gained from regulatory simulations could be a useful guide for potential impacts of widespread application of cool roof coatings in this region. The practical realization of these positive impacts, however, would require changes to the current business model for the evaluation of DSM strategies. The study provides seven key recommendations that encourage distribution networks to think beyond their infrastructure boundaries, recognising that the broader energy system also includes buildings, appliances and people.

1. Introduction

1.1. Residential Demand Side Management (DSM) in Heat Dominated Climates

Electricity distribution networks in Australia typically make capital works (infrastructure investment) decisions based on ensuring the network can meet system peak demand in line with security of supply standards demanded by local regulations or customs. For many networks, however, significant financial challenges arise when the system maximum demand only occurs for short periods of time. For example, in regional Queensland in 2011, approximately 10% of the network capacity was used for less than 1.5% of the year [1]. Season, climate and time of day are some of the acknowledged key variables that contribute to peak demand. Reducing peak demand through DSM programs is therefore seen as a more economical option than network augmentation, flattening the load curve to increase the utilisation rate (and hence investment return) of existing infrastructure. In Australia, residential DSM strategies fall into three categories:
(i)
network controlled tariffs (voluntary or mandatory requirement for particular appliances such as electric water heaters to be controllable by the network at specific times);
(ii)
tariff price reform (using price signals to drive changes to appliance usage times); and
(iii)
direct rebates (e.g., financial assistance to customers to replace inefficient appliances with more efficient and/or controllable appliances).
The principles which guide the development and implementation of DSM programs in distribution networks are focused on managing business risk and maximising economic return. DSM programs are required to increase the asset utilisation rate and deliver measurable and predictable reductions in demand, whilst not compromising network service standards [1]. The energy network, from the distribution company’s perspective, consists of the poles and wires that deliver the electricity from the high transmission distribution network to the end use (the residential customer). Neither the houses nor the appliances connected to the network are considered to be part of the energy system.

1.2. Cool Roofs Research

The heat load of detached residential buildings in warm and hot climates is predominantly driven by the interaction of the external environment with the building envelope. Because of its large surface area in relation to building volume and its high exposure to direct and indirect solar radiation, the roof is the key building structure that allows or limits heat flow into internal spaces of one and two storey single family houses in Australia. The energy balance of a roof is determined by incoming solar radiation, the reflectance and absorptance of the roof surface, heat transfer, roof structure and internal and external temperatures [2,3]. While light coloured roofs have long been used in many hot regions as a means of providing a cooler internal space, modern ‘cool roof coatings’ use advanced chemistry to increase both the solar reflectance and infrared emittance of the roof. For over two decades researchers have been studying, through modelling and field experiments, the impacts of reflective roof coatings on the urban environment, on occupants and on electricity networks. The improvements to the chemistry of roof coatings over time (from the 1990s to the present) needs to be considered when interpreting early field results based on white reflective paints, with current coatings representing fourth generation technologies [4]. Extensive research utilizing simulation software and a smaller number of field experiments has shown a range of positive impacts, including reductions in cooling energy (kWh/day) and peak cooling demand (kW); reductions in roof surface and attic temperature; reduction or elimination of air conditioning use in shoulder seasons; changes to air conditioner load profiles; improvements in air conditioner operation efficiency and reduced strain on electricity supply infrastructure [5,6,7,8,9]. This research encompasses residential buildings in a range of climatic and cultural contexts, including hot climates [10,11,12,13]. Beyond the benefits to individual buildings, cool roofs (and green roofs) have an important role to play in reducing the urban heat island [4].
Most, if not all, studies to date have evaluated field data and simulated data from the perspective of the building owner, presenting arguments to entice building owners of the potential comfort, economic and/or infrastructure and societal benefits of cool roofs. Indeed, the argument for the development of Standards for Cool Roofs was based on the difficulties faced by building owners in assessing cool roof impacts on lifetime heating and cooling costs [14]. Few residential field studies have been published from regions with long cooling seasons and negligible heating seasons, and, to the authors’ knowledge, the role of cool roof coatings in Demand Side Management programs (i.e., from the perspective of electricity network providers) has not previously been studied.

1.3. This Research

The specific aim of this research was to determine whether simulation software used for building regulation purposes can provide networks with the ‘impact certainty’ required by the distribution company’s Demand Side Management principles.

2. Methodology

A numerical and experimental methodology was utilized [15,16]. This section explains the selection of the simulation software and case study.

2.1. Choice of Simulation Software

The Australian Nationwide House Energy Rating Scheme (NatHERS) establishes the protocols and validates and standardises software that can be utilised by the design-construction industry for the purposes of determining design compliance with the energy efficiency regulations of the National Construction Code. All software accredited under this national scheme calculates the heat flows into and out of the building envelope on an hourly basis to determine the space heating and cooling loads for each zone of the house. All software uses Reference Meteorological Year (RMY) climate files based on at least 25 years of meteorological data (air temperature, humidity, solar radiation, wind speed and direction) for each climate zone. All software requires the input of detailed spatial and architectural data as well as construction material and components data, however the occupancy patterns, latent heat loads and heating and cooling schedules are pre-set (to enable comparison between designs) [17,18]. The particular software package selected for this study is BersPro 4.2. This software was selected rather than internationally utilized simulation software (e.g., IES VE or EnergyPlus), because the research objective was to determine whether this commonly utilised tool could also model the potential benefits of DSM programs that incorporate changes to the building envelope, reducing the need for duplication of effort. The simulations were conducted in accordance with requirements of the Australian Construction Code, with regard to the protocols that establish thermostat settings and heating and cooling schedules (Table 1).
Table 1. Summer and winter cooling and heating schedule (as per NatHERS).
Summer ComfortWinter Comfort
Cooling thermostat setting and time scheduleHeating thermostat setting and time schedule
Cooling set point 26.5 °CVariable heating set points
Living spacesLiving spaces
24:00–0700 (no cooling); 07:00–24:00 (cooling)24:00–07:00 (no heating) 07:00–24:00 (20 °C)
Sleeping spacesSleeping spaces
16:00–09:00 (cooling); 09:00–16:00 (no cooling)24:00–07:00 (15 °C); 07:00–09:00 (18 °C); 16:00–24:00 (18 °C); 09:00–16:00 (no heating)

2.2. Choice of Case Study

The case study was conducted in tropical Townsville (19.3°S) between November 2012 and February 2014. The seasonal climate statistics (Table 2) reveal a summer cooling-dominated climate extending from November through to March, with a relatively short autumn and spring. This regional city was selected for the case study as it lies within a constrained network area of Australia’s largest electricity distribution network covering an area of 1.7 million square kilometres (97% of Queensland). 91% of housing in this region (predominantly detached one or two storey single family homes), have air conditioners (AC), with an estimated 3.5 AC units per household. These air conditioners account for 30% of the overall residential load and 57% of residential peak demand (17:00–20:00). Based on current loads, residential energy consumption is expected to contribute approximately 28% to this region’s summer afternoon peak demand (13:00–17:00, at a zone substation level) in 2025 [1]. Similar to the Italian housing context [19], air conditioners have often been installed in buildings with little or no insulation. Energy efficiency requirements were not introduced into the Australian building regulations until 2003, and even now the standards are quite low by international comparison.
A recently constructed single-family house, representative of the size and style of new homes in this region, was selected for the field study (Figure 1 and Figure 2). This involved monitoring the electricity consumption and temperature of the house before and after the application of a Cool Roof acrylic coating (Thermobond HRC Rsol 0.878 tested to ASTM C1549). Sensors (Maxim iButtons DS1922/3 with 0.5 °C temperature resolution and 5% humidity error) were installed in various locations to measure, at 30 min intervals, ambient outdoor temperature, indoor temperature and relative humidity (in living rooms and bedrooms), roof cavity temperature and external roof surface temperature (east and west). Quarterly electricity bills (based on actual consumption recorded by the Class 1 revenue meters) were used to establish the baseline electrical consumption profiles (average kWh/day) on an annual and seasonal basis. The air-conditioning load is separately metered and is on a circuit that is controllable by the electricity network. Key characteristics of the house are summarised in Table 3. Simulation was used to determine baseline cooling load.
Table 2. Climate conditions and location of the case study *.
ParameterWinter (Junuary, July, August)Spring (September, October)Summer (November, December, January, February, March)Autumn (April, May)
Tmax-mean (°C)25.628.631.128.6
Tmin-mean (°C)14.319.123.719.1
RHmean 9 am (%)64.360.069.267.0
RHmean 3 pm (%)51.754.062.661.5
Solar radiation mean/daily (MJ/m2)17.224.124.017.9
Sunshine Hours mean/daily8.49.78.47.6
* Location: Townsville, Australia. Latitude (19.3°S); Longitude 146.8° E; Elevation 15 m above sea level.
Figure 1. Residential building representing the case study.
Energies 08 05303 g001
Figure 2. Case study floor plan with location of sensors.
Energies 08 05303 g002
Table 3. Field study house characteristics.
ParametersDetails
Year of construction2011
Area and VolumeLot Size 690 m2; House gross floor area 202 m2; Conditioned area 135 m2; Volume 545.4 m3; external surface/volume: 0.33 m−1
Wall constructionConcrete block (total wall U value 2.92)
Internal wall height (floor to ceiling) 2700 mm
Roof constructionSteel roof on timber rafters; hip roof; roof pitch 24°
Original surface: Rsol 0.60; TE 0.8
Cool Roof acrylic coating: Rsol 0.88%; TE 0.9
InsulationR3.5 bulk insulation batts on ceiling
No reflective foil under roof sheeting
Windows/GlazingGrey tint single glaze in aluminium frames (Total U6.55; SHGC 0.49); Glass to floor area 13.1%
Hot water serviceLiquid petroleum gas (LPG)
Electricity tariffsGeneral power (AUD 0.55/day access charge + AUD 0.29 kWh)
AC Circuit (controllable load; guaranteed supply 18 h per day; AUD 0.20 kWh)
Building thermal efficiency (simulated cooling load)88.9 MJ/m2/yr (0.4 MJ/m2/winter; 88.5 MJ/m2/summer)
Demographics2 adults (30–39 years)
University education
Occupancy ProfileGenerally unoccupied 8 am-5 pm, M-F
Air conditioning systems (heat pump)Five split systems (4 bedrooms + living room; systems in bedrooms 2–4 rarely used); Ceiling fans all rooms
AC operation/occupant behaviourTemperature set point overnight in main bedroom 22 °C; living room AC only used on very hot days
The same house plan was then used as the basis of broader simulation studies to model the impact of cool roof acrylic paints on houses with different construction material characteristics. This method was utilized also by Dabaieh [13]. Common construction materials and practices in the region were examined and applied to the building simulation model for the selected house (Table 4). Thirty-seven different combinations of construction materials were simulated (the existing house and 36 variations), enabling simulation of a representative sample of a wide variety of common construction practices in the region.
For each combination, the annual cooling load (kWh/yr) and peak demand on hot days was determined. Daily demand curves are generated by the software, based on the COP of the air conditioner, the thermal load of the building and assumed operation times. For peak demand simulation, a split-system air conditioner with a COP of 3.1 was assumed, and the kW demand was calculated for achieving the comfort levels (26.5 °C) as determined by NatHERS. As February is the peak cooling month for this climate, the cooling demand for a hot February day was calculated, differentiating between predominantly afternoon/night loads (bedrooms), day and evening loads (living room) and whole house loads (24/7 cooling).
Table 4. Common construction materials used in simulations.
Broad CategorySpecific DetailsReasoning
Construction materialsLight weight timber frame and timber claddingBoth high thermal mass and low thermal mass buildings are common in the region
Cement block
Insulation type and placementReflective foil under roof sheeting onlyInsulation only mandated since 2003. Builders tend to install minimum levels of batts or foil; seldom both
Bulk insulation on ceiling only (R2, 2.5, 3, 3.5)
Both insulation types
Glazing (in aluminium framed sliding windows)Single glazed plainPredominant window type.
Single glazed tintedLess common glazing type.
Roof materialsIron sheetsGalvanised iron/‘Colourbond’ roofs
Cement tilesSecond most common roof material
Roof solar reflectance0.15; 0.5; 0.7 (indicative of typical roof colours in the region)Most new homes have light coloured roofs (Rsol 0.5–0.7); Some dark roofs.
0.9* (Cool roof acrylic paint product)Easily available product for retrofit
* The Rsol of the product used for this field study was rounded up (0.878 to 0.9) for the purposes of simulation (a limitation of the tool). In practice, 0.8 may be a more realistic Rsol of readily available products and accounting for a slight loss in reflectance due to aging and weathering. The predicted long term savings and DSM impacts may be overestimated.

3. Results

3.1. Seasonal Cooling and Occupancy of Field Study House

The seasonal baseline electricity consumption (average kWh/day) was calculated from historic billing information, showing a significant summer cooling load (Table 5). The five ACs are connected to a meter that enables network implemented control between 07:00–08:30 and 18:30–20:00. Temperature data from this house reveals frequent conditioning of the main bedroom overnight (22:00–07:00) and the early morning (07:00–08:30), infrequent use of AC systems in the hours adjacent to the evening controlled time and infrequent daytime use of the AC. Understanding how occupancy and occupant behaviour impacts on AC operation is essential in designing effective DSM strategies, as discussed later.
Table 5. Seasonal household electricity consumption *.
Breakdown of Electricity Consumption (kWh/day)
General PowerAC Load OnlyTotal Electricity *
Winter7.10.98.0
Spring7.50.78.2
Summer8.13.711.8
Autumn6.14.911.0
Average kWh/day/year9.8 (summer daily load 121% of annual average daily load)
* Represents all household stationary energy services except hot water.

3.2. Simulated and Actual Cooling Load of Field Study House

Prior to any intervention to the house, the actual “cooling energy” and the simulated “cooling energy” were compared, showing a significant difference between the two loads (Table 6). As there were no significant differences between Bureau of Meteorology measured temperature for the experimental period and the RMY data used in the simulation software, the lower than expected energy consumption is likely explained by different occupancy and operational practices than the regulatory assumptions built into the simulation tool. For example, the simulated thermal load assumes that all four bedrooms and the living room will be cooled according to Table 1 (i.e., simulations are based on number of potentially occupied rooms, not on number of occupants). The residents of this house, however, report that they typically cool only the main bedroom overnight during summer and use the air conditioner in the living room only on very hot days. This highlights the difficulty in using the simulation software as a guide to actual energy consumption, an issue that is discussed in more detail later.
Table 6. Simulated and actual cooling loads.
Simulated Cooling Demand MJ/m2/yrSimulated Cooling Load (kWh)Actual Cooling Load (kWh)
100.83789930

3.3. Roof Cavity Temperatures

Roof cavity temperatures were measured in the case study house before and after the application of the cool roof acrylic paint (Rsol 0.89) on the already light coloured roof (Rsol 0.6). The effect of the cool roof coating on the roof cavity temperature was analysed by graphing the relative reduction in roof cavity temperature to outdoor ambient temperature (Figure 3), showing a greater impact at higher ambient temperatures. This is consistent with findings of Pisello [9].
Figure 3. Roof cavity temperature reduction.
Energies 08 05303 g003
The simulation tool (BersPro) was then used to simulate roof cavity temperatures of this house plan with and without reflective foil under the roof, and with solar reflectance values of 0.5 and 0.9. Results of these simulations are shown in Table 7.
Table 7. Effect of roof insulation and roof reflectance on roof cavity temperature.
Temperature Bands<10 °C10–19 °C20–30 °C31–36 °C>36 °C
Outdoor Ambient Temperatures: % of Annual Hours in Each Band (RMY)1158220
Ceiling insulation (bulk)Under roof insulationRoof Solar Reflectance% of year the roof cavity temperature is in each temperature band
R2.5Nil50%219441025
R2.5foil50%01361206
R2.5Nil90%2207070
R2.5foil90%0148420
Key findings from this numerical analysis are:
  • Only 2% of annual hours of RMY outdoor ambient temperatures are >35 °C (row 2);
  • A typical roof cavity for this region experiences 35% of annual hours >35 °C (row 4);
  • Adding reflective foil under the roof (row 5), or a high reflectivity roof coating (row 6), reduce these temperatures;
  • Combining the two (row 7) provides a roof cavity temperature profile very closely aligned to ambient temperature conditions (row 2).

3.4. Simulated Peak Demand with House Construction Variables

The case study house design was simulated with thirty-six variations in building construction characteristics representing typical regional construction variables for wall and roof materials, roof and ceiling insulation values and glazing. The simulations for this house design consistently show that cool roof coatings (SR 0.9), regardless of the selected construction detail, delivered a reduction in peak demand (Figure 4). The houses with the greatest demand reduction potential have dark roofs (SR 0.15), whilst those with the least demand reduction potential have a high level of ceiling insulation (e.g., R 3.5) combined with other energy efficiency design measures that restrict solar gain through the building façade (e.g., tinted windows). Simulated reductions in peak demand were higher for concrete block houses (high thermal mass) than for light weight houses, although both types of houses benefit unless they already have a very high level (for this climate) of ceiling insulation. Comparing dark roofs (SR 0.15) with cool roofs (SR 0.9), this figure shows peak demand reduction on a hot day ranging from 10%–40%. The cooling load profiles for the cool roof model also revealed a significantly different load profile (shorter AC running times for Cool Roofs). The simulations reveal a few anomalies for light coloured roofing which require further investigation.
Figure 4. Simulated peak demand (kw) for 36 variations of the whole house on hot summer day.
Energies 08 05303 g004

4. Discussion of the Results

The results clearly show that Cool Roof coatings could be broadly applied to a wide range of housing types in this climate zone, reducing energy consumption for cooling (kWh) and peak demand (kW) in individual residences. Does this automatically mean that electricity networks could include Cool Roofs into their DSM programs, perhaps through offering rebates? In this section we will discuss the results in light of this region’s DSM principles that have an overarching focus on risk management for the network. The five principles discussed in this section include (i) certainty of load reduction at times of network peak demand; (ii) visible and measurable results; (iii) improvement in asset utilisation; (iv) ability to reward customer participation; and (v) informed stakeholders [1]. This discussion will highlight seven key conclusions for electricity distribution companies.

4.1. Certainty of Load Reduction at Peak Demand

There is little doubt that for many buildings, the application of cool roof coatings has the potential to reduce overall cooling energy demand (kWh) and peak demand (kW): a reduced thermal load can impact both the hours air conditioning is required to maintain comfort standards and the efficiency and operation of air conditioners. In this sense, cool roofs are an example of an intervention that could simultaneously address energy efficiency and demand management. What is unclear, however, is how to quantify this for multiple residences in specific constrained networks. Unlike commercial buildings, the residential sector has greater diversity of building characteristics (e.g., size, age, design and construction variables), occupancy profile (occupants per house, use of different spaces, time of use, and range of occupant behaviours) and cooling technologies and expectations (type and efficiency of air conditioner; set point). Can the simulation tools used to provide energy rating compliance certificates for houses as designed, also be used to provide network certainty?
NatHERS establishes the protocols which accredited simulation tools must incorporate to model the energy performance of house designs as evidence of the design meeting the energy efficiency requirements of the Australian Construction Code. NatHERS has four main assumptions: (i) occupants will adopt a three staged approach to the achievement of comfort in summer (natural ventilation, mechanical air movement then extraction of heat); (ii) bedrooms and living rooms will be occupied at different times; (iii) when cooling is activated, it is applied to all rooms of the same type (e.g., living or bedrooms); and (iv) the cooling set point when AC is activated, will be 26.5 °C (for this climate zone). This research has shown, unsurprisingly, a mismatch between occupancy patterns in houses and assumptions made by the building regulations. NatHERS tools were not meant to be reflective of actual occupancy patterns, but to enable comparison of potential energy consumption between buildings, removing the uncertainties of occupancy. For example, the peak load simulations displayed a peak load at 4–5 pm, a reflection of simulation assumptions of bedrooms being conditioned from 4 pm. The timing of actual peak load, at an individual house level, would be impacted by actual occupancy (time of day, specific occupied rooms, and thermal comfort preferences) as well as the thermal efficiency of the occupied rooms. These inconsistencies between reality and simulations, combined with the large number of variations in construction and design, make it difficult to use current simulation tools to extrapolate the effect of cool roof coatings on residential demand within a specific network at a specific time of day. This does not mean that useful information cannot be gained.
Conclusion #1: Networks can use the simulation tools to provide evidence of the types of houses that would most likely deliver demand reductions with the application of cool roofs.
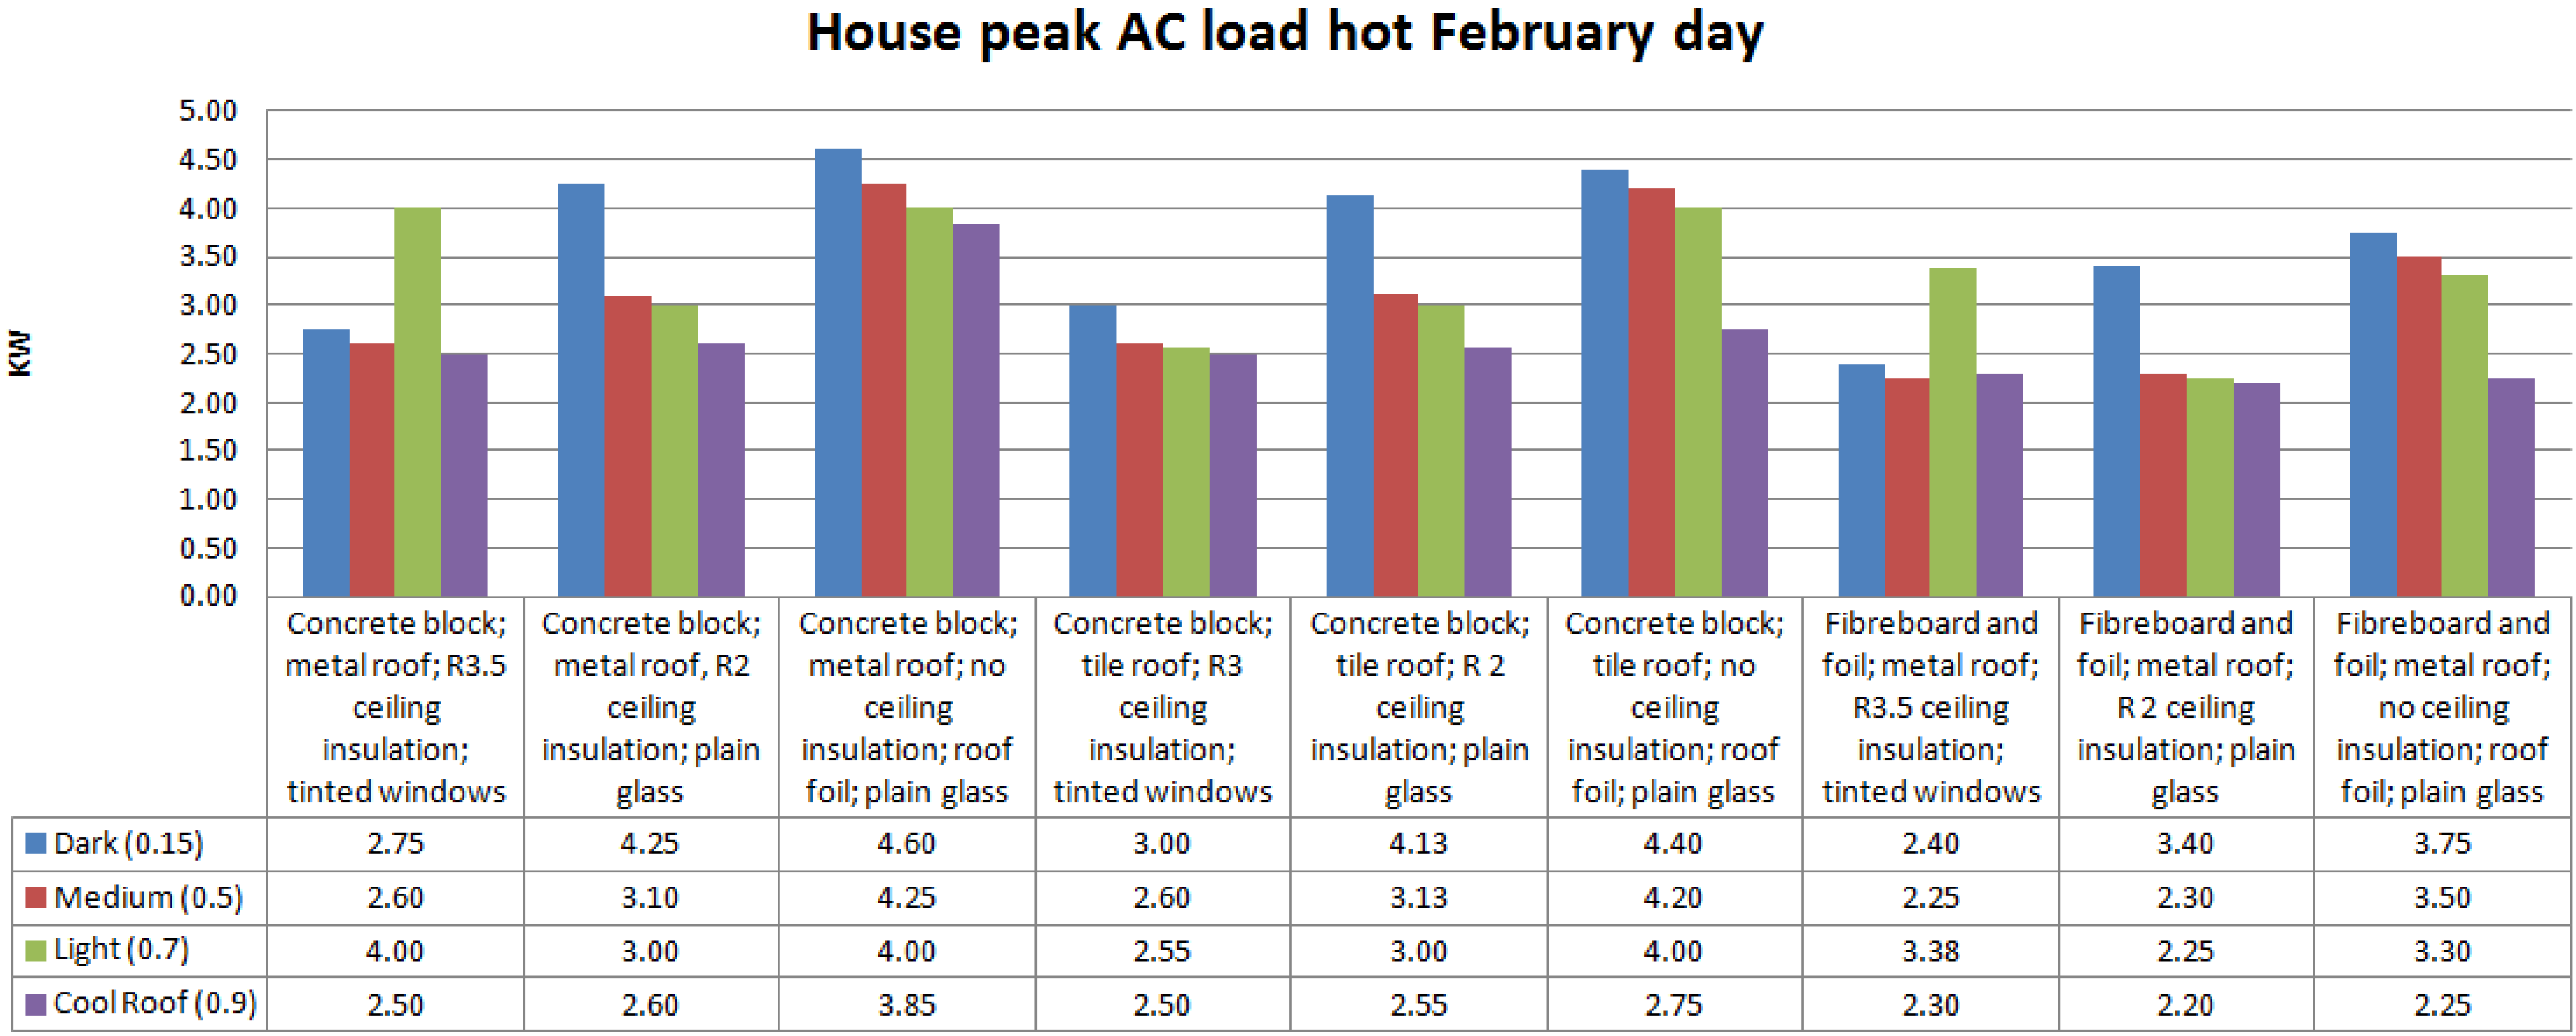
The evidence from this study would suggest the electricity network might benefit from targeting the following dwelling types for cool roof retrofitting:
(i)
houses with dark or medium coloured roofs (solar reflectance <0.7), unless they have roof reflective foil, R3.5 ceiling insulation and other characteristics that limit solar gain (e.g., wide eaves, tinted glazing);
(ii)
houses with no ceiling insulation (e.g., roof foil only) or with bulk ceiling insulation (under R3) and no reflective foil insulation; and
(iii)
houses with high electricity bills (i.e., high AC usage in terms of number of systems, hours of use, or low temperature set points).
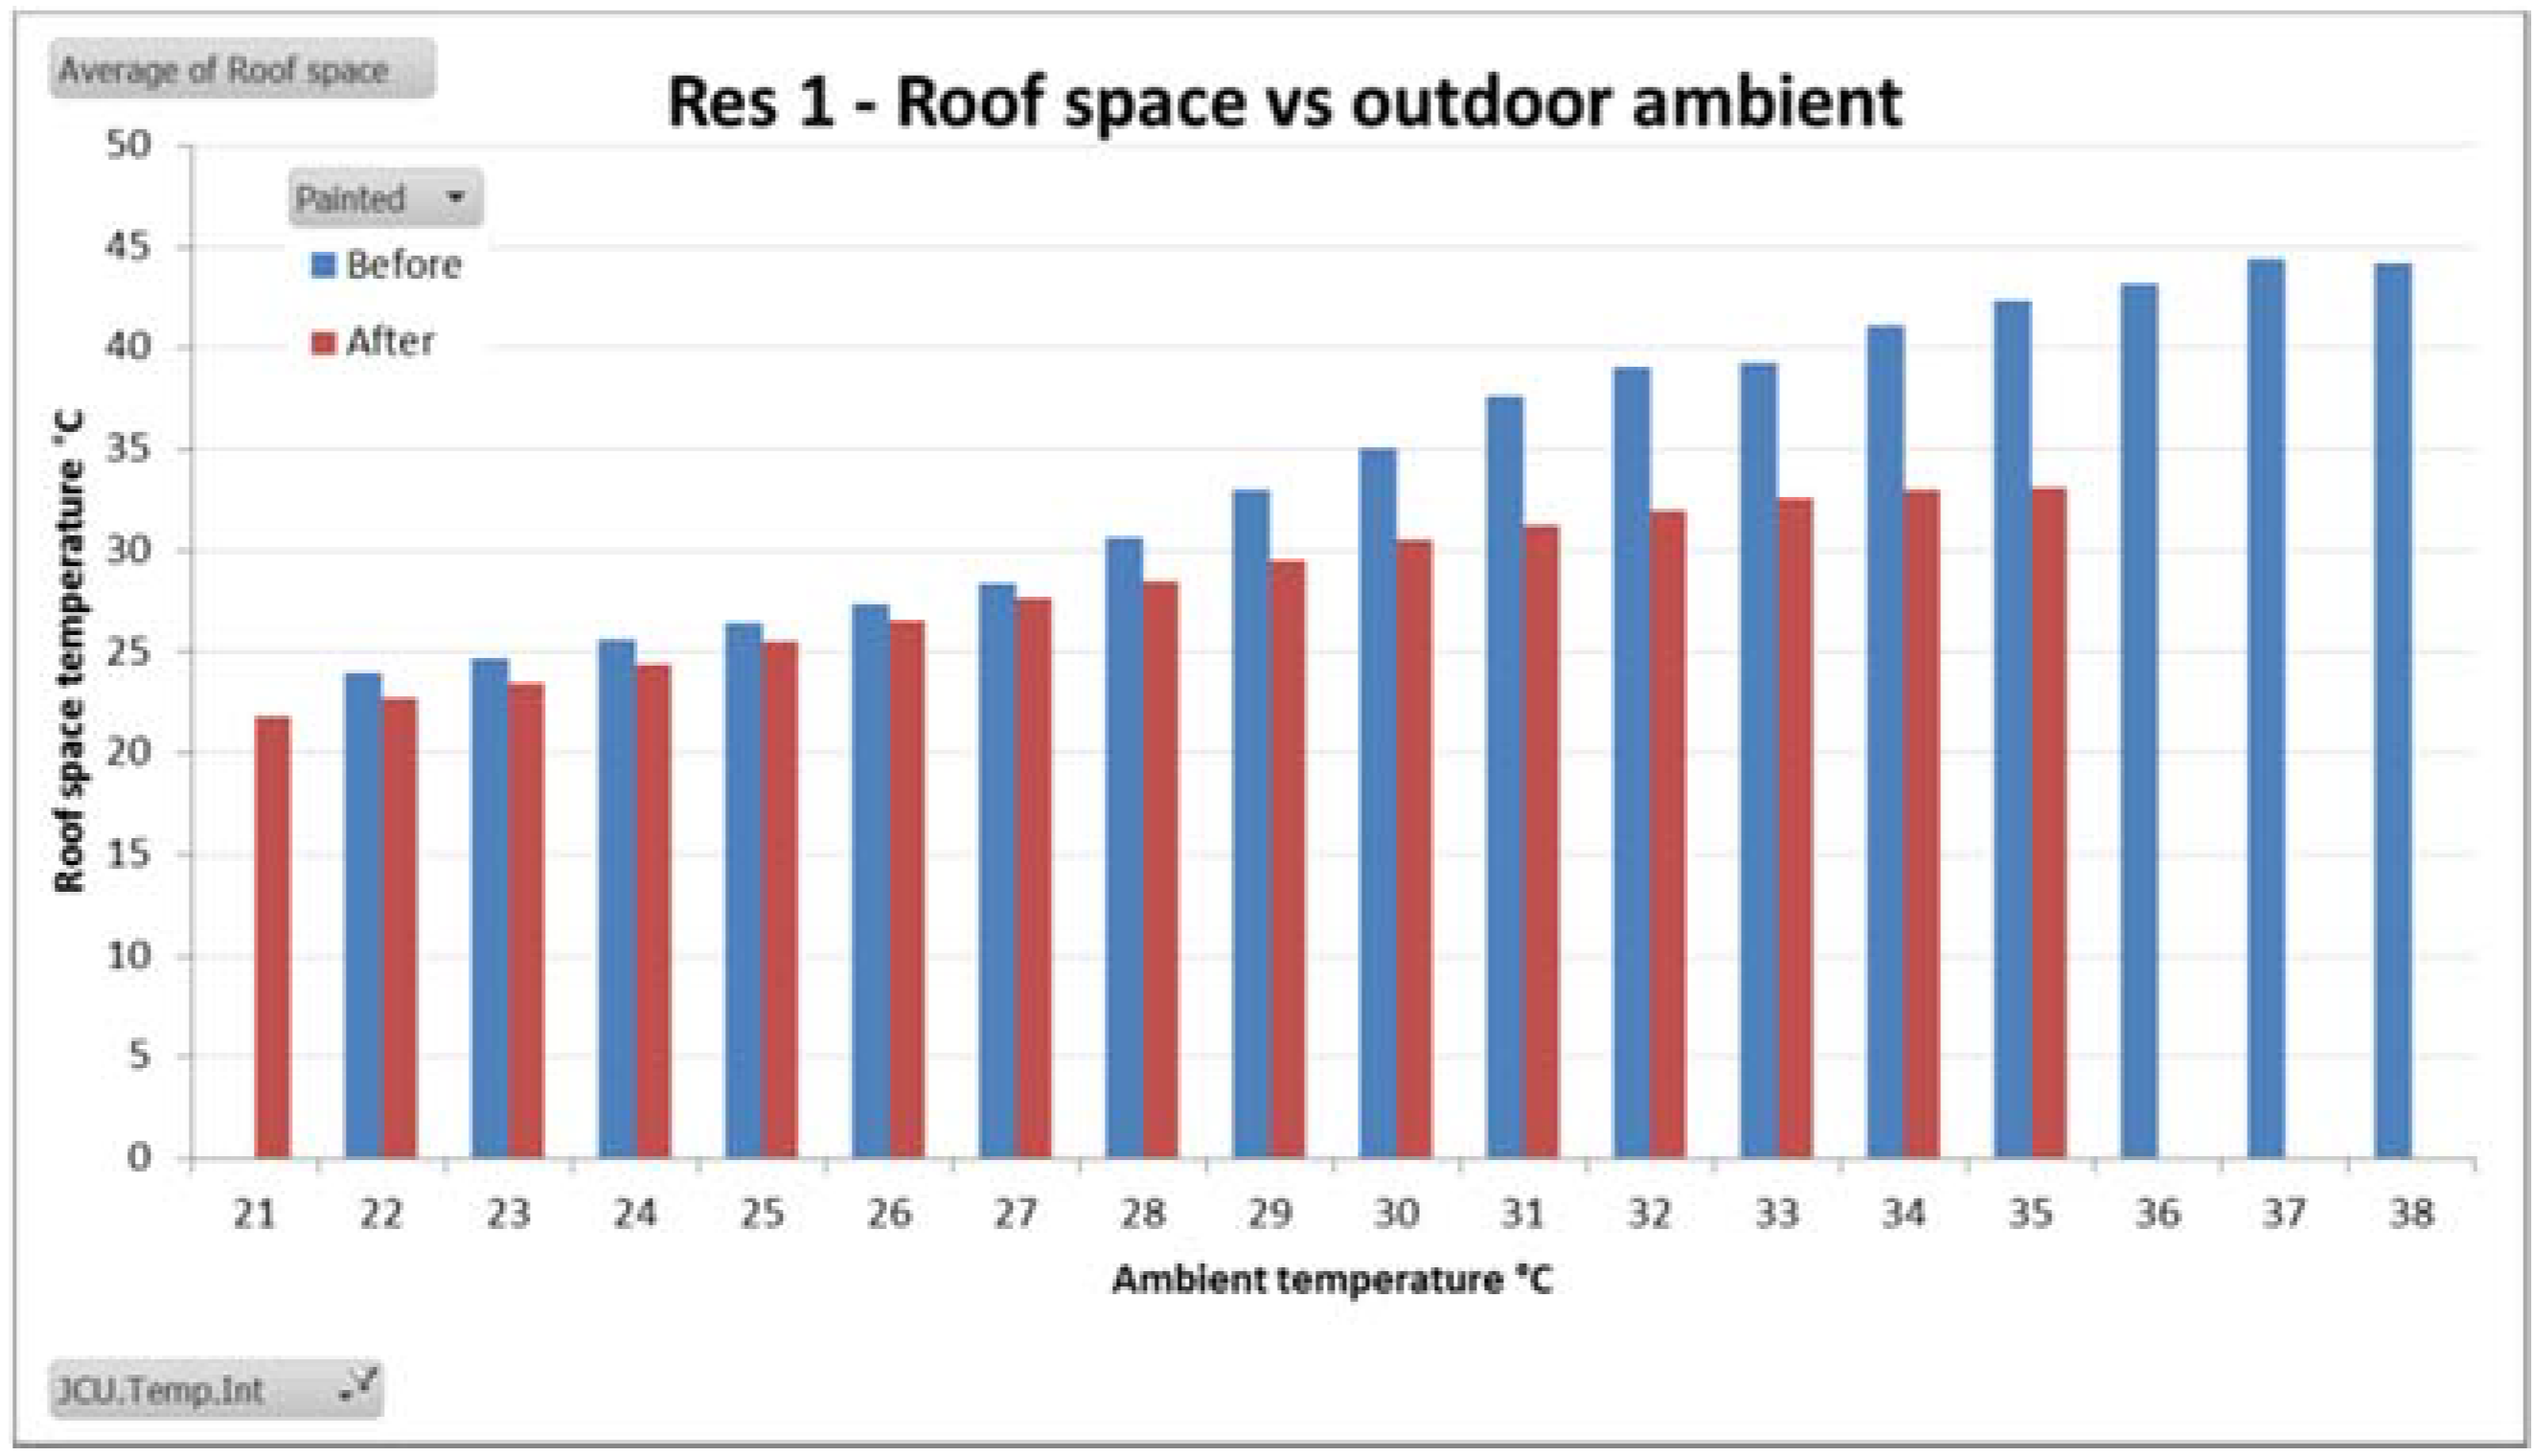
The results of the simulation of roof cavity temperatures (Section 3.2) are also significant for several reasons and impact indirectly on the electricity networks. First, under Australian Standards, insulation values (the R rating) are determined based on an ambient temperature of 24 °C and for temperature differences of 18, 12 and 6 K [20]. In an air conditioned house in a hot climate, however, the temperature difference between the internal room and the roof cavity during summer may be over 20 K [21]. This means that it is likely that the typically low levels of insulation installed in houses in this region are not providing the expected thermal barrier. Second, the relationship between cool roofs, roof cavity temperatures, insulation placement and insulation effectiveness has not previously been reported. Other studies have only shown how insulation level is significant in determining the impact of cool roofs [11,12]. Third, because it is easier to apply a coating to a roof surface rather than retrofit reflective foil under the roof sheeting, cool roof coatings present an effective method of improving the energy efficiency of existing homes. With this in mind, the networks arguably need access to regional level building information, something which does not exist in the Australian context.
Conclusion #2: Networks may benefit from participating in the development of detailed and accurate regional building files [22] utilizing existing simulated data, and Agent Based Models that enable simulation of different scenarios and tailored solutions for subareas of the network [23,24]. This work is in its infancy and its full potential has yet to be explored.

4.2. Visible and Measurable Benefits

Following on from the difficulty of quantifying demand reductions prior to implementing a cool roof DSM project is the challenge of measuring benefits. Arguably the only reliable measurement option from a network’s perspective would be to ensure that residential air conditioners are separately metered from other household loads, allowing for the tracking of energy consumption and demand before and after intervention with cool roof coatings or other energy efficiency measures (such as insulation) that would reduce the heat load of the building. In Queensland air-conditioners are not required to be separately metered, resulting in lack of robust data about current air conditioner loads at household level. Some recently introduced DSM programs offer financial incentives to households to connect air conditioners to a separately controlled meter.
Conclusion #3: Networks could consider the mandatory metering of all air conditioning loads.
In addition to measurement and verification data, such metering could also provide a means of network control of the device, and provide information back to occupants to assist them in understanding and managing their cooling behavior. This would require, however, a robust technical, economic and social analysis about the type of metering infrastructure and their respective costs and benefits [25,26], development of data management and utilisation strategies [27], and data security and privacy concerns relating to advanced metering infrastructure [28,29].

4.3. Improvement in Asset Utilisation through Incorporation of DSM in Asset and Network Planning

The best return on investment for distribution networks is arguably increasing the utilisation rate of existing assets through smoothing the peaks, limiting the need to increase investment in more infrastructure. Without a means of measuring the benefit there is also then no evidence to show that the application of cool roof coatings would improve the asset utilisation rate. Whilst it is understandable, from a corporate perspective, that distribution companies focus on their asset and network planning and return on investment, there is arguably a need for a broader systems perspective. Electricity generation, delivery and consumption are not just the business of energy companies: it is also the business of energy policy makers, building regulators, housing development and construction companies, and home owners and occupiers. Each of these parties has assets that they wish to optimise or have a ‘return-on-investment’ or ‘cost-benefit’ expectation. What if the ‘asset utilisation’ criterion was reframed to “How could energy efficiency and demand management strategies be better integrated to maximise value to all stakeholders?
Conclusion #4: Networks should take a broader view of what defines the ‘energy assets’ and more closely align their business practices to building regulations and practices. Perhaps a starting point for the distribution companies would be to more closely align their marketing activities to building regulations, such as ensuring that the air conditioning operation guidelines for their customers (promoting a set point of 25 °C) are consistent with the regulatory simulation software (which utilises a cooling set point of 26.5 °C) for this region.

4.4. Encourage and Reward Customer Participation

This study has shown that there are energy and power benefits from the application of cool roof technologies to a range of housing typologies in this region, but that these benefits are difficult to measure and quantify from a network perspective. Whilst electricity metering and billing continues to only consider total accumulated kWh over a period of time (typically 3 monthly for residential accounts), there is little incentive for households to invest in any demand reduction strategies. Energy efficient houses that require no or little air conditioning do not get any benefit from the extra investment they have made in good design and construction to achieve occupant comfort. Air conditioners are not regulated appliances: they can be installed at the sole discretion of building owners regardless of the thermal efficiency of the building envelope and regardless of their impact on the network—yet the cost of the network asset investment required to support these appliances is spread across all customers. Queensland is moving towards ‘cost reflective’ pricing for residential customers, with recent (2013–2014) and near future (2015) changes to how the costs of delivering energy can be equitably recovered. This approach raises other equity issues.
Conclusion #5: Networks should consider implementing network conditions for the installation and operation of air conditioners, in a similar manner to the connection controls and conditions (in Australia) on the installation of solar power systems at residential premises. New connection and metering practices, reflecting the environmental, technical and economic benefits and limitations of all embedded technologies need to be developed, considering the needs of all stakeholders.
Conclusion #6: The impacts of different combinations of pricing strategies and direct load control options on different customer types in different parts of a network need to be explored. This work would require examination of a broad suite of pricing strategies (e.g., service charges, kWh charges, KW charges, critical peak pricing, real time pricing, time of use pricing, inclining block tariffs) and curtailment strategies (e.g., direct load control and aggregated curtailable loads), as well as the profiling of different residential customer types (e.g., retirees, pensioners, single person households, large families etc.).

4.5. Educate and Inform Customers and Stakeholders

Do networks still have “customers”? The birth of the “prosumer”, the rapid uptake of household solar power in Queensland, the arguably imminent commoditisation of battery storage systems and electric vehicles, the advanced functionality of metering and energy information systems, and the growing acknowledgement of the value and usefulness of big data, collectively create a very different market place than that which existed even ten years ago. While some research has examined the re-classification of customers as co-producers, peers and partners [30], much more research is needed.
Conclusion #7: Electricity networks need to reconceptualise the relationships between traditional electricity generators, distributors and retailers, and ‘end-users’, and develop business models and relationship structures that are built on mutual trust and respect.

5. Conclusions

It is well known that demand side management is often the most appropriate (i.e., cost effective) response on constrained electricity networks, especially when combined with energy efficiency. This study sought to understand whether building simulation tools used for regulatory purposes could assist in determining the feasibility of cool roof coatings for a residential DSM strategy in a constrained network area where peak electrical demand is heavily influenced by residential cooling loads. This study has confirmed previous research that cool roof coatings can reduce electricity consumption and demand in residential buildings in tropical Australia: this was supported by both measured and simulated data. However, in analysing these results according to the DSM principles of distribution companies, it is clear that the simulation tools used for regulatory purposes in Australia could not provide networks with the required visible and measurable reductions, at an individual building level, that would guarantee peak demand reduction and an increase in network utilisation rates. The numerical and experimental data does raise important issues for network consideration.
The paper has presented seven conclusions relevant to networks. These recommendations incorporate the need for distribution networks to think beyond their infrastructure boundaries, recognising that the broader energy system also includes buildings, appliances and people. With a view to win:win solutions, these companies could arguably play a more proactive role in promoting and encouraging cool roof technologies (and other energy efficiency measures) that impact on demand and consumption, such as more active engagement with energy and building regulators, the development and construction industries and with home owners/occupants.

Acknowledgments

This study was funded by Ergon Energy, an Australian Distributed Network Service Provider.

Author Contributions

All authors were involved in the field study and in the writing of this paper.

Conflicts of Interest

The authors declare no conflict of interest.

References

  1. Ergon Energy. Demand Management Plan 2013/14; Ergon Energy Corporation Limited: Brisbane, Australia, 2013. [Google Scholar]
  2. Bell, J.M.; Smith, G.B.; Lehman, R. Advanced Roof Coatings: Materials and Their Applications, Proceedings of the CIB 2003 International Conference on Smart and Sustainable Built Environment, Brisbane, Australia, 19–21 November 2003; Yang, J., Ed.;
  3. Gentle, A.; Aguilar, J.; Smith, G. Optimized cool roofs: Integrating albedo and thermal emittance with R-value. Sol. Energy Mater. Sol. Cells 2011, 95, 3207–3215. [Google Scholar] [CrossRef]
  4. Santamouris, M. Cooling the cities—A review of reflective and green roof mitigation technologies to fight heat island and improve comfort in urban environments. Sol. Energy 2014, 103, 682–703. [Google Scholar] [CrossRef]
  5. Akbari, H.; Bretz, S.; Kurn, D.; Hanford, J. Peak power and cooling energy savings of high-albedo roofs. Energy Build. 1997, 25, 117–126. [Google Scholar] [CrossRef]
  6. Parker, D.; Barkaszi, S. Roof solar reflectance and cooling energy use: Field research results from florida. Energy Build. 1997, 25, 105–115. [Google Scholar] [CrossRef]
  7. Akbari, H. Measured energy savings from the application of reflective roofs in two small non-residentail buildings. Energy 2003, 28, 953–967. [Google Scholar] [CrossRef]
  8. Synnefa, A.; Santamouris, M.; Akbari, H. Estimating the effect of using cool coatings on energy leads and thermal comfort in residential buildings in various climatic conditions. Energy Build. 2007, 39, 1167–1174. [Google Scholar] [CrossRef]
  9. Pisello, A.L.; Santamouris, M.; Cotano, F. Active cool roof effect: Impact of cool roofs on cooling system efficiency. Adv. Build. Energy Res. 2013, 7, 209–221. [Google Scholar] [CrossRef]
  10. Zinzi, M.; Agnoli, S. Cool and green roofs. An energy and comfort comparison between passive cooling and mitigation urban heat island techniques for residential buildings in the mediterranean region. Energy Build. 2012, 55, 66–76. [Google Scholar] [CrossRef]
  11. Costanzo, V.; Evola, G.; Marletta, L. Cool roofs for passive cooling: Performance in different climate and for different insulation levels in italy. Adv. Build. Energy Res. 2013, 7, 155–169. [Google Scholar] [CrossRef]
  12. Rosado, P.J.; Faulkner, D.; Sullivan, D.P.; Levinson, R. Measured temperature reductions and energy savings from a cool tile roof on a central california home. Energy Build. 2014, 80, 57–71. [Google Scholar] [CrossRef]
  13. Dabaieh, M.; Wanas, O.; Hebazy, M.A.; Johansson, E. Reducing cooling demands in a hot dry climate: A simulation study for non-insulated passive cool roof thermal performance in residential buildings. Energy Build. 2015, 89, 142–152. [Google Scholar] [CrossRef]
  14. Akbari, H.; Levinson, R. Evolution of cool-roof standards in the us. Adv. Build. Energy Res. 2008, 2, 1–32. [Google Scholar] [CrossRef]
  15. Kolokitsa, D.; Diakaki, C.; Papantoniou, S.; Vlissidis, A. Numerical and experimental analysis of cool roofs application on a laboratory building in ikaklion, crete, greece. Energy Build. 2012, 55, 85–93. [Google Scholar] [CrossRef]
  16. Revel, G.M.; Marterelli, M.; Emiliani, M.; Celotti, L.; Nadalini, R.; de Ferrari, A.; Hermanns, S.; Beckers, E. Cool products for building envelope—Part II: Experimental and numerical evaluation of thermal performances. Sol. Energy 2014, 105, 780–791. [Google Scholar] [CrossRef]
  17. NatHERS National Administrator. Nationwide House Energy Rating Scheme (Nathers)—Software Accreditation Protocol; Commonwealth of Australia: Canberra, Australia, 2012.
  18. NatHERS. Nationwide Home Energy Rating Scheme. Available online: http://www.nathers.gov.au (accessed on 3 September 2013).
  19. Pisello, A.L.; Rossi, F.; Cotana, F. Summer and winter effect of innovative cool roof tiles on the dynamic thermal behaviour of buildings. Energies 2014, 7, 2343–2361. [Google Scholar] [CrossRef]
  20. As/nz4859.1:2002 Materials for the Thermal Insulation of Buildings—General Criteria and Technical Provisions; Standards Australia: Sydney, Australia, 2002.
  21. Su, B.; Aynsley, R. A case study of roof thermal performance in naturally ventilated houses in hot-humid climates under summer conditions. Archit. Sci. Rev. 2006, 49, 399–407. [Google Scholar] [CrossRef]
  22. Anagnos, T.; Comerio, M.C.; Toulet, B.; May, P.J.; Greene, M.; McCormick, D.L.; Bonowitz, D. Developing regional building inventories: Lessons from the field. Earthq. Spectra 2012, 28, 1301–1329. [Google Scholar] [CrossRef]
  23. Boulaire, F. Building Adaptable Agent-Based Models—Application to the Electricity Distribution Network, Proceedings of the 20th International Congress on Modelling and Simulation (MODSUM2013), Adelaide, Australia, 1–6 December 2013; Piantadosi, J., Anderssen, R.S., Boland, J., Eds.;
  24. Boulaire, F.; Utting, M.; Drogemuller, R. Modelling for the Electricity Distribution Network, Proceedings of the 20th International Congress on Modelling and Simulation (MODSIM2013), Adelaide, Australia, 1–6 December 2013.
  25. Littman, A.; Lyon, G.; Shah, A.; Vogler, J. Exploring advanced metering infrastructure deployments for commercial and industrial sites. In Proceedings of the ASME 2012 6th International Conference on Energy Sustainability; and ASME 2012 10th International Conference on Fuel Cell Science, Engineering and Technology; ASME: San Diego, CA, USA, 2012. [Google Scholar]
  26. Your Network, Your Choices: Network Tariffs for the Modern Customer; Energex Limited: Brisbane, Australia, 2014.
  27. Rusitschka, S.; Eger, K.; Gerdes, C. Smart Grid Data Cloud: A Model for Utilizing Cloud Computing in the Smart Grid Domain, Proceedings of the First IEEE International Conference on Smart Grid Communications, Gaithersburg, MD, USA, 4–6 October 2010; IEEE: Gaithersburg, MD, USA; pp. 483–488.
  28. Grochocki, D.; Huh, J.H.; Berthier, R.; Bobba, T.; Sanders, W.H.; Cardenas, A.A.; Jetcheva, J.G. Ami Threats, Intrusion Detection Requirements and Deployment Recommendations, Proceedings of the Third International Conference on Smart Grid Communications, Tainan, Taiwan, 5–8 November 2012; IEEE: Tainan, Taiwan; pp. 395–400.
  29. Go, W.; Kawk, J. Two-dimensional key table-based group key distribution in advanced metering infrastructure. J. Appl. Math. 2014, 2014, 149649–149657. [Google Scholar] [CrossRef]
  30. Morris, P.; Buys, L.; Vine, D. Moving from outsider to insider: Peer status and partnerships between electricity utilities and residential consumers. PLoS ONE 2014, 9, 1–8. [Google Scholar] [CrossRef] [PubMed]

