Article

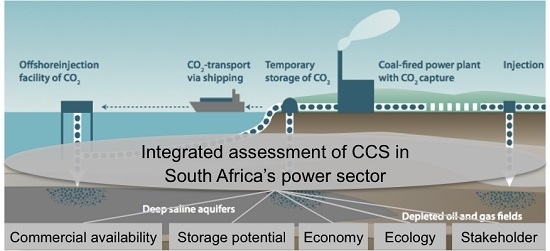
Integrated Assessment of Carbon Capture and Storage (CCS) in South Africa’s Power Sector

Wuppertal Institute for Climate, Environment and Energy, Döppersberg 19, Wuppertal 42103, Germany
*
Author to whom correspondence should be addressed.
Current address: German Federal Environment Agency, Bismarckplatz 1, Berlin 14193, Germany
Energies 2015, 8(12), 14380-14406; https://doi.org/10.3390/en81212432
Submission received: 17 October 2015 / Revised: 29 November 2015 / Accepted: 7 December 2015 / Published: 18 December 2015
(This article belongs to the Special Issue Multi-Disciplinary Perspectives on Energy and Sustainable Development)

Abstract

:
This article presents an integrated assessment conducted in order to explore whether carbon capture and storage (CCS) could be a viable technological option for significantly reducing future CO2 emissions in South Africa. The methodological approach covers a commercial availability analysis, an analysis of the long-term usable CO2 storage potential (based on storage capacity assessment, energy scenario analysis and source-sink matching), an economic and ecological assessment and a stakeholder analysis. The findings show, that a reliable storage capacity assessment is needed, since only rough figures concerning the effective capacity currently exist. Further constraints on the fast deployment of CCS may be the delayed commercial availability of CCS, significant barriers to increasing the economic viability of CCS, an expected net maximum reduction rate of the power plant’s greenhouse gas emissions of 67%–72%, an increase in other environmental and social impacts, and low public awareness of CCS. One precondition for opting for CCS would be to find robust solutions to these constraints, taking into account that CCS could potentially conflict with other important policy objectives, such as affordable electricity rates to give the whole population access to electricity.

Graphical Abstract

1. Introduction

Carbon capture and storage (CCS) for reducing carbon dioxide emissions from fossil fuel-fired power plants and industrial sources is the subject of intensive global debate [1,2]. CCS is considered one technology option that could contribute significantly to achieving the objective of decreasing greenhouse gas (GHG) emissions by between 50% and 85% by 2050 [3]. This radical reduction is imperative to prevent a rise in the global average temperature from exceeding a threshold of 2° C above preindustrial times by 2100 [4]. For the time being, however, unabated use of coal is on the rise [5]. This development is mainly driven by coal-consuming emerging economies, which are experiencing a rapidly growing demand for energy [1,2]. Key countries in this respect are China, India and South Africa. Even for China, where coal consumption seems to have flattened since 2014 [6], most experts expect to continue to see a notable dominance of coal-fired power generation.
At first glance, it seems obvious to implement CCS, particularly in these countries. CCS would enable them to continue to use their main domestic energy source, preventing them from rushing to transform their economies to renewable or nuclear energy-based systems. However, if the current state of global CCS development is compared with the deployment pathways suggested, say, by the International Energy Agency (IEA) [7,8], it becomes apparent that these expectations have not yet been met. The European Commission recently analyzed the barriers that are preventing CCS from developing successfully in the European Union (EU) [9]; however, no such analysis has been conducted for South Africa. The intention of this article is, therefore, to close this gap by exploring whether CCS could be a viable low-carbon option for South Africa in the power sector–as previously analyzed for India and China [1,2]. This implies identifying potential barriers and presenting ways of overcoming these barriers at both national and the global level.
In order to do this, an estimate must first be made of how much CO2 can potentially be stored securely in geological formations in South Africa in the long term. Based on source-sink matching, this CO2 storage potential is compared with the quantity of CO2 that could potentially be separated from power plants according to a long-term analysis up to 2050. This analysis is framed by an evaluation of levelized costs of electricity (LCOEs), environmental implications and stakeholder positions. The research includes the results of ten interviews conducted with CCS and energy experts from industry, science, consultancies, think tanks and societal organizations at the end of 2011. The interviews were guided by a questionnaire containing open questions, giving interviewees the opportunity to elaborate on their positions freely and to identify parameters affecting the prospects of CCS in South Africa. The interviewees were anonymized; citations are from the interview transcripts (see Table S1 in the supplementary information for a list of the organizations interviewed and the detailed questionnaire).
To the authors’ knowledge, no assessment with a comparable comprehensive scope has been published for South Africa before. According to an analysis of peer-reviewed literature performed in October 2015 using Scopus, the first articles that mentioned CCS in South Africa as a possible mitigation measure in coal-consuming countries were published in 2007. In 2011, [10,11] explored the challenges of CCS with a direct focus on South Africa; [12] provided a comprehensive policy analysis of CCS in South Africa, India and Brazil from an environmental, economic and social perspective. In 2013, [13] provided insights into the proposed CO2 test injection project. [14] evaluated the costs and GHG emissions of selected coal-based power plants and fuel production facilities. This publication was followed by articles focusing more generally on the need for CCS in South Africa as well as the first studies on the more detailed assessment of storage potentials in selected basins [15,16,17]. Although both [12] and [14] applied a more holistic view to CCS in South Africa, they were unable to fully shed light on the storage capacities implicitly assumed as a basis for their assessment; they also did not consider a variety of long-term coal development options.
This paper starts by describing the methodologies applied in the individual assessment parts (Section 2). The outcome of each assessment step is given in Section 3. This is followed by combining these assessment dimensions to discuss the overall results from an integrative perspective (Section 4). The paper gives some final conclusions and closes with an outlook on the need for further research (Section 5).

2. Methodology

This paper pursues an integrated approach covering five assessment dimensions, whereby each dimension is investigated using specific methods. In order to be able to compare the results of this article with former analyses for India and China, the same methods and general assumptions are used as described in [1,2], but applied to the individual situation in South Africa.
(1) The assessment of the commercial availability of CCS technology in South Africa is based on screening publications and presentations of international CCS experts and the knowledge of experts interviewed. The term “commercial availability” refers to the time when the complete CCS chain could be in commercial operation. This incorporates large-scale CCS-based power plants, transportation and storage, which cannot be considered independently [18]. Their implementation depends on both technology development at the international level and appropriate national policy targets.
(2) The derivation of South Africa’s long-term usable CO2 storage potential consists of three different steps:
(A)
The aim of the storage capacity assessment is to systematically analyze and compare existing capacity estimates for South Africa using the methodology linked to the “techno-economic resource-reserve pyramid for CO2 storage capacity” [19]. The resulting storage scenarios (S1–S3) represent the range between a high and a low estimate of the country’s storage potential.
(B)
An energy scenario analysis is used to estimate the amount of CO2 emissions that could potentially be captured from power plants by 2050. Based on existing long-term energy scenarios for South Africa, three long-term coal development pathways for power plants (E1–E3) are developed. They indicate a development between a “high carbon” and a “low carbon” strategy. The next step lays out hypotheses on how many of these power plants could be built or retrofitted with CO2 capture technologies. Finally, the quantity of CO2 that could be separated is calculated for the pathways assuming different parameters, such as the CO2 capture rate and the efficiency penalty. CO2 emissions are cumulated over the lifetime of all power plants newly built up to 2050. It should be noted that these pathways differ from energy scenarios: while energy scenarios provide a consistent framework for the analysis of long-term energy strategies, the pathways applied here are taken from different existing scenario studies. They are only used to illustrate different CCS development pathways to obtain an understanding of the level of separated CO2 emissions that could be available for storage.
(C)
In order to achieve a source-sink match, the storage scenarios are combined with the coal development pathways to obtain a total matched capacity for each combination of S1–S3 and E1–E3. The result is the matched capacity, which is the next step up in the storage pyramid concept. Due to missing data and the consequential heuristic approach, matching is performed manually without using a geographic information system.
(3) The aim of the economic assessment is to conduct a comparative analysis of the long-term development of the levelized cost of electricity (LCOE) of coal-fired power plants with and without CCS in South Africa. The analysis is built upon three main methodological principles: firstly, cost calculations are based on the capacity development of power plants up to 2050 given in E1–E3. Secondly, data from existing studies and the knowledge of experts interviewed are used to define and quantify important cost parameters, such as capital costs and operation and maintenance (O&M) costs. Whenever possible, country-specific conditions and data are taken into account. This is particularly true for plant capital costs and fuel costs. Third, the assessment uses learning rates to project a long-term cost development. All cost data and parameters are fed into the general equation to calculate the development of LCOE.
L C O E = ( C C a p + C O & M ) × a f c a p a c i t y + C T S + C f u e l
where
a f = I × ( 1 + I ) n ( 1 + I ) n 1
and:
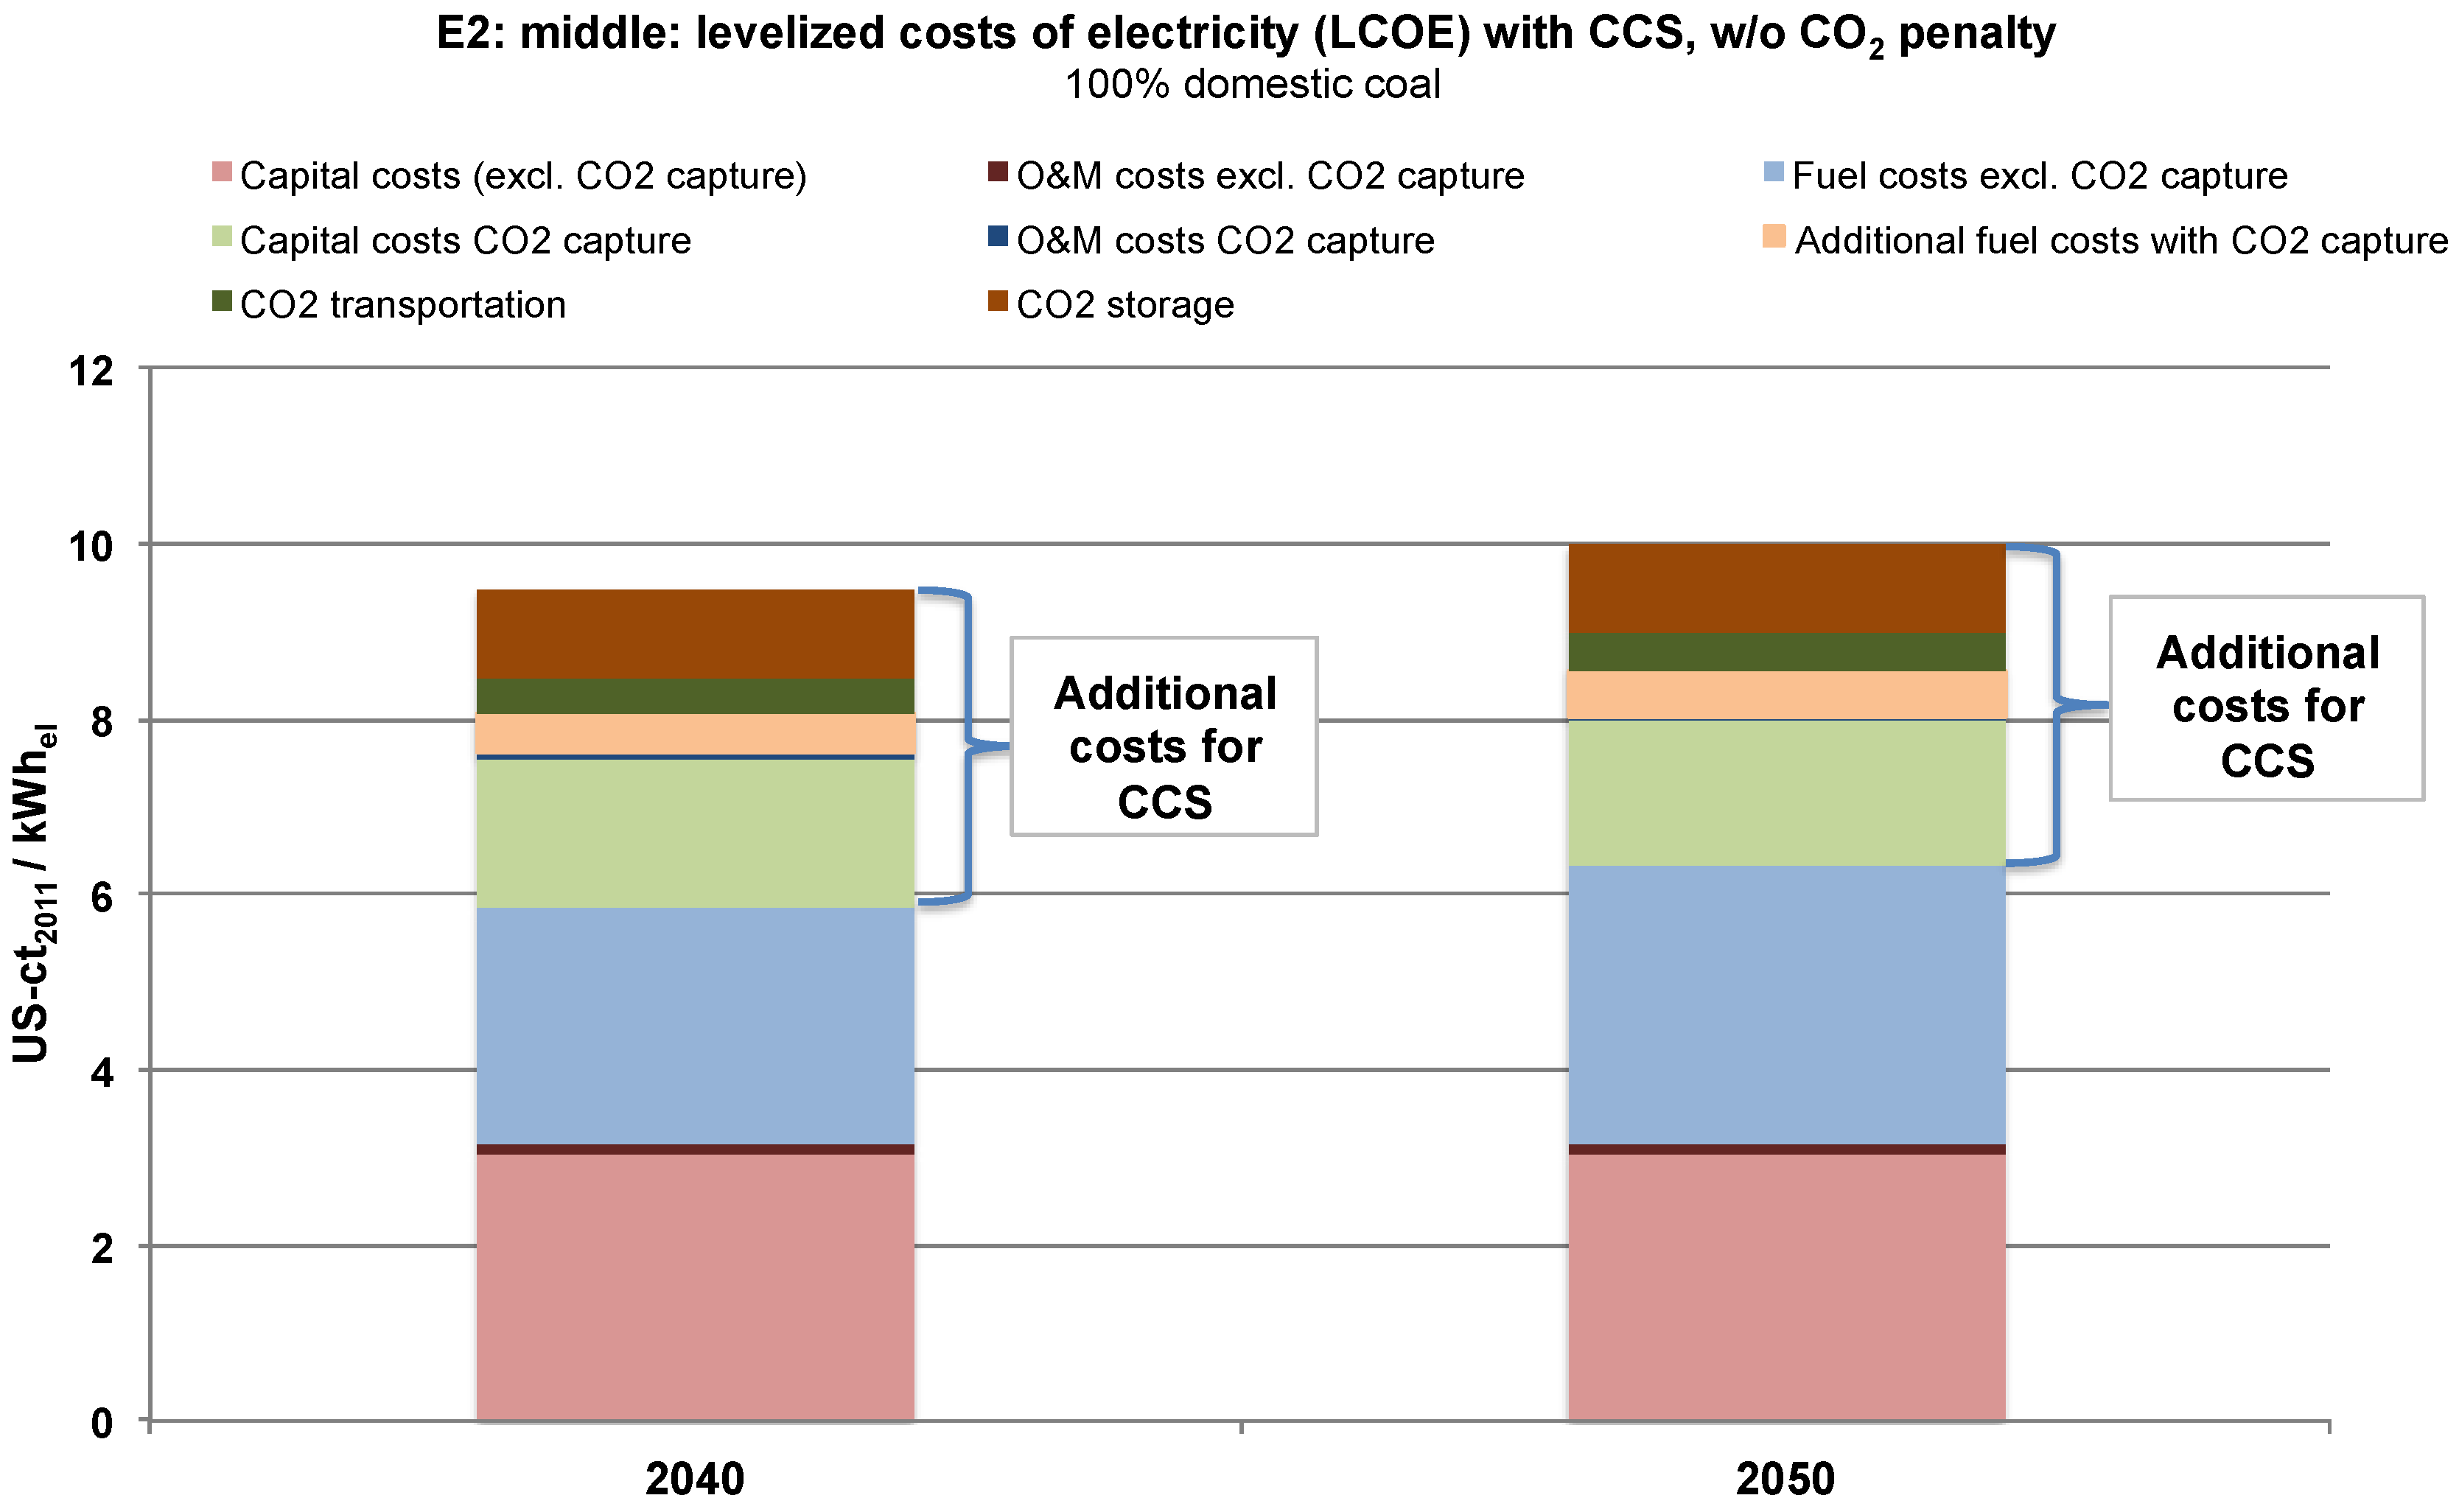
  • LCOE = levelized costs of electricity generation (LCOE) = USD/kWhel
  • CCap = specific capital expenditure (CCap) = USD/kWel
  • CO&M = specific operating and maintenance costs (CO&M) = USD/kWel
  • af = annuity factor (af) = %/a
  • I = real interest rate (I) = %
  • n = depreciation period (n) = a
  • CTS = specific cost of CO2 transportation and storage (CTS) = USD/kWhel
  • Cfuel = specific fuel costs (including CO2 penalty) (Cfuel) = USD/kWhel
  • Capacity = full load hours (capacity) = h/a
(4) In order to assess the possible environmental impacts of CCS, a prospective LCA of potential future CCS-based coal-fired power plants in South Africa is performed and the environmental impacts are compared with power plants without CCS. The LCA is performed according to the ISO 14 040/44 international standard. The life cycle impact assessment (LCIA) is based on the CML 2001 method [20]. The life cycle approach includes both upstream and downstream processes, such as the provision of additional fuels or the transportation and storage of CO2.
(5) Stakeholders are key players in implementing and deploying new and innovative technologies. Hence, an important assessment instrument is to analyze their positions regarding the prospects of CCS and its classification into the overall country’s development targets. The overall aim of the analysis is to reflect the state of the CCS debate in South Africa and to draw up a map of key stakeholders and their respective positions. Their positions on the map are derived from publications and presentations in which they have described their positions towards CCS, in some cases supplemented by statements given in the respective research interviews.

3. Results

3.1. The Commercial Availability of CCS Technology

Considering the development of CCS in South Africa and at the international level, it seems unlikely that CCS will be commercially available in South Africa before 2030. Internationally, experts expect a later large-scale availability than previously assumed due to the low carbon pricing level, delayed demonstration projects, a lack of commercial cases, uncertainties in climate change policy and a lack of public acceptance in potential storage regions [1,2,9,21,22,23,24]. Although the South African government recognizes the potential of CCS to become an important CO2 mitigation technology and activities for promoting CCS have been initiated, the country has competing policy targets, such as electrification, an affordable electricity supply and resilience to the impacts of climate change [12,25]. The government’s Integrated Resource Plan for Electricity 2010–2030 (IRP), which outlines South Africa’s strategy for the power sector up to 2030, does not include CCS, but envisages an expansion of renewable and nuclear energy to meet South Africa’s commitments to a low-carbon economy [26]. The South African Centre for Carbon Capture and Storage (SACCS) has developed a roadmap for a rollout of CCS. According to this roadmap, a CO2 test injection site should be available by 2017 and a CCS demonstration plant by 2020, followed by the implementation of commercial CCS deployment after 2025 [27]. The year 2030 was therefore chosen as the start of operation of large-scale CCS projects in the “base case”. In order to consider further possible delays, 2035 and 2040 are regarded as sensitivity cases AV1 and AV2 [2].

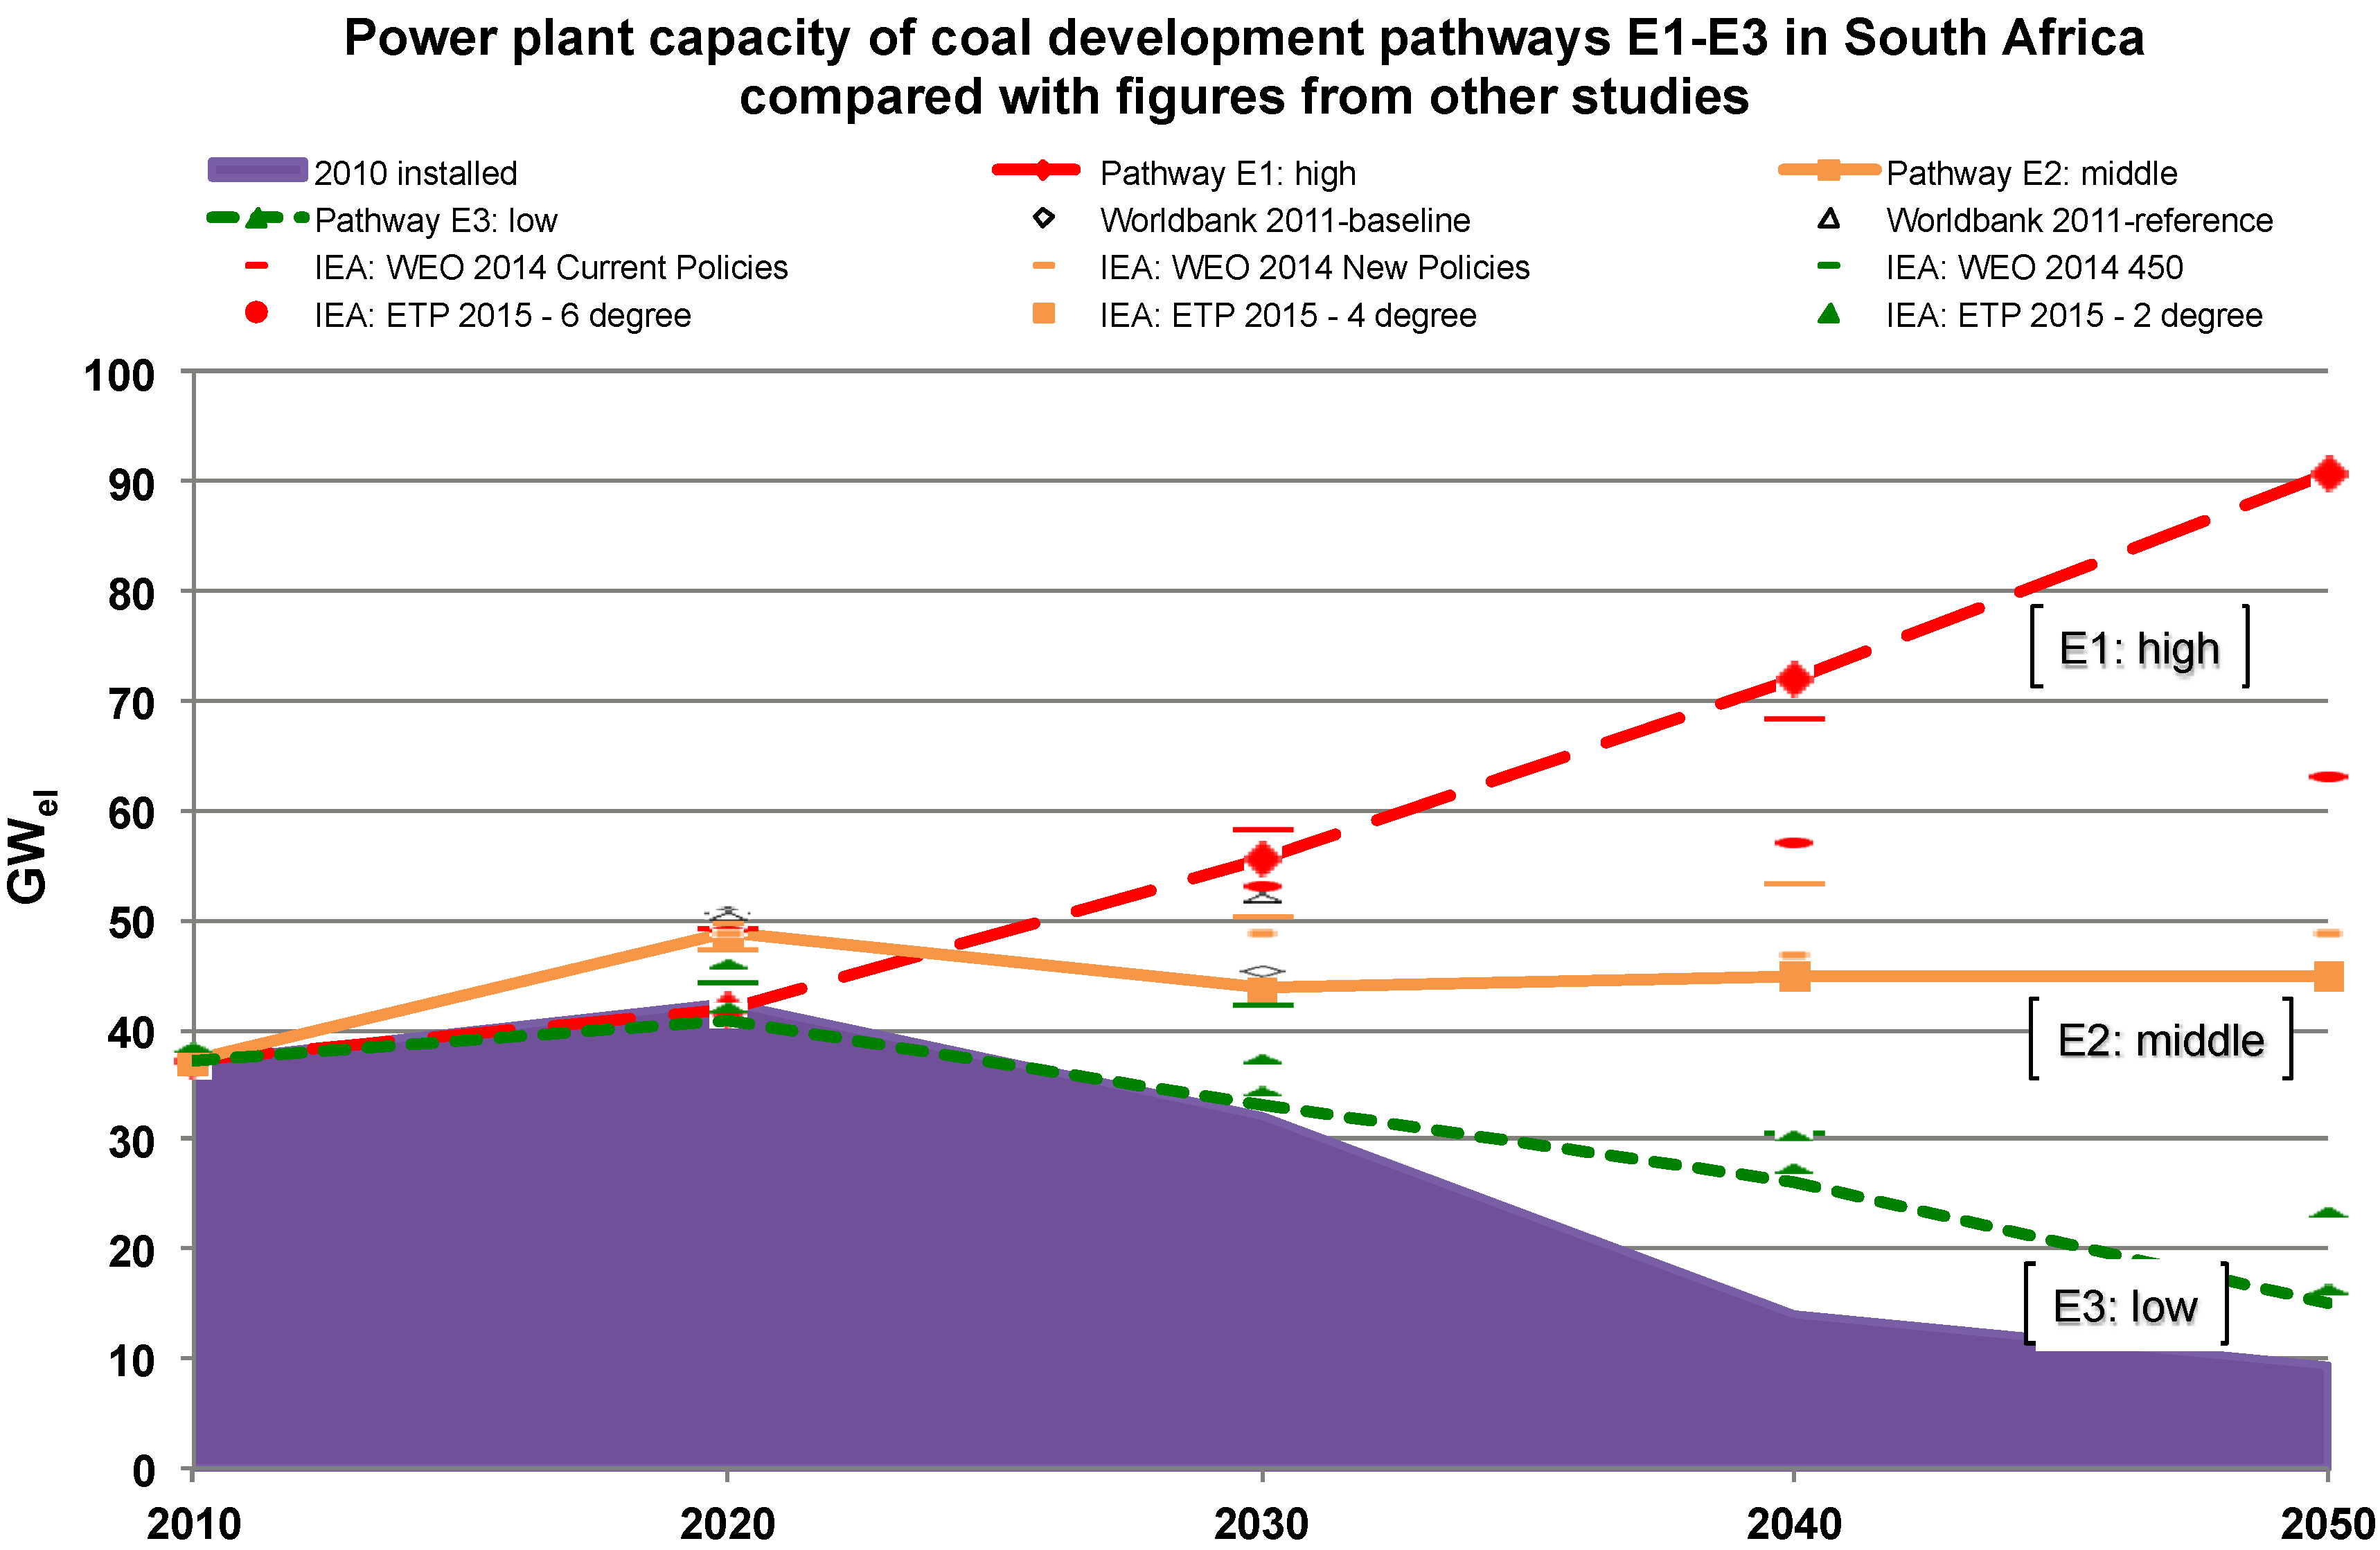
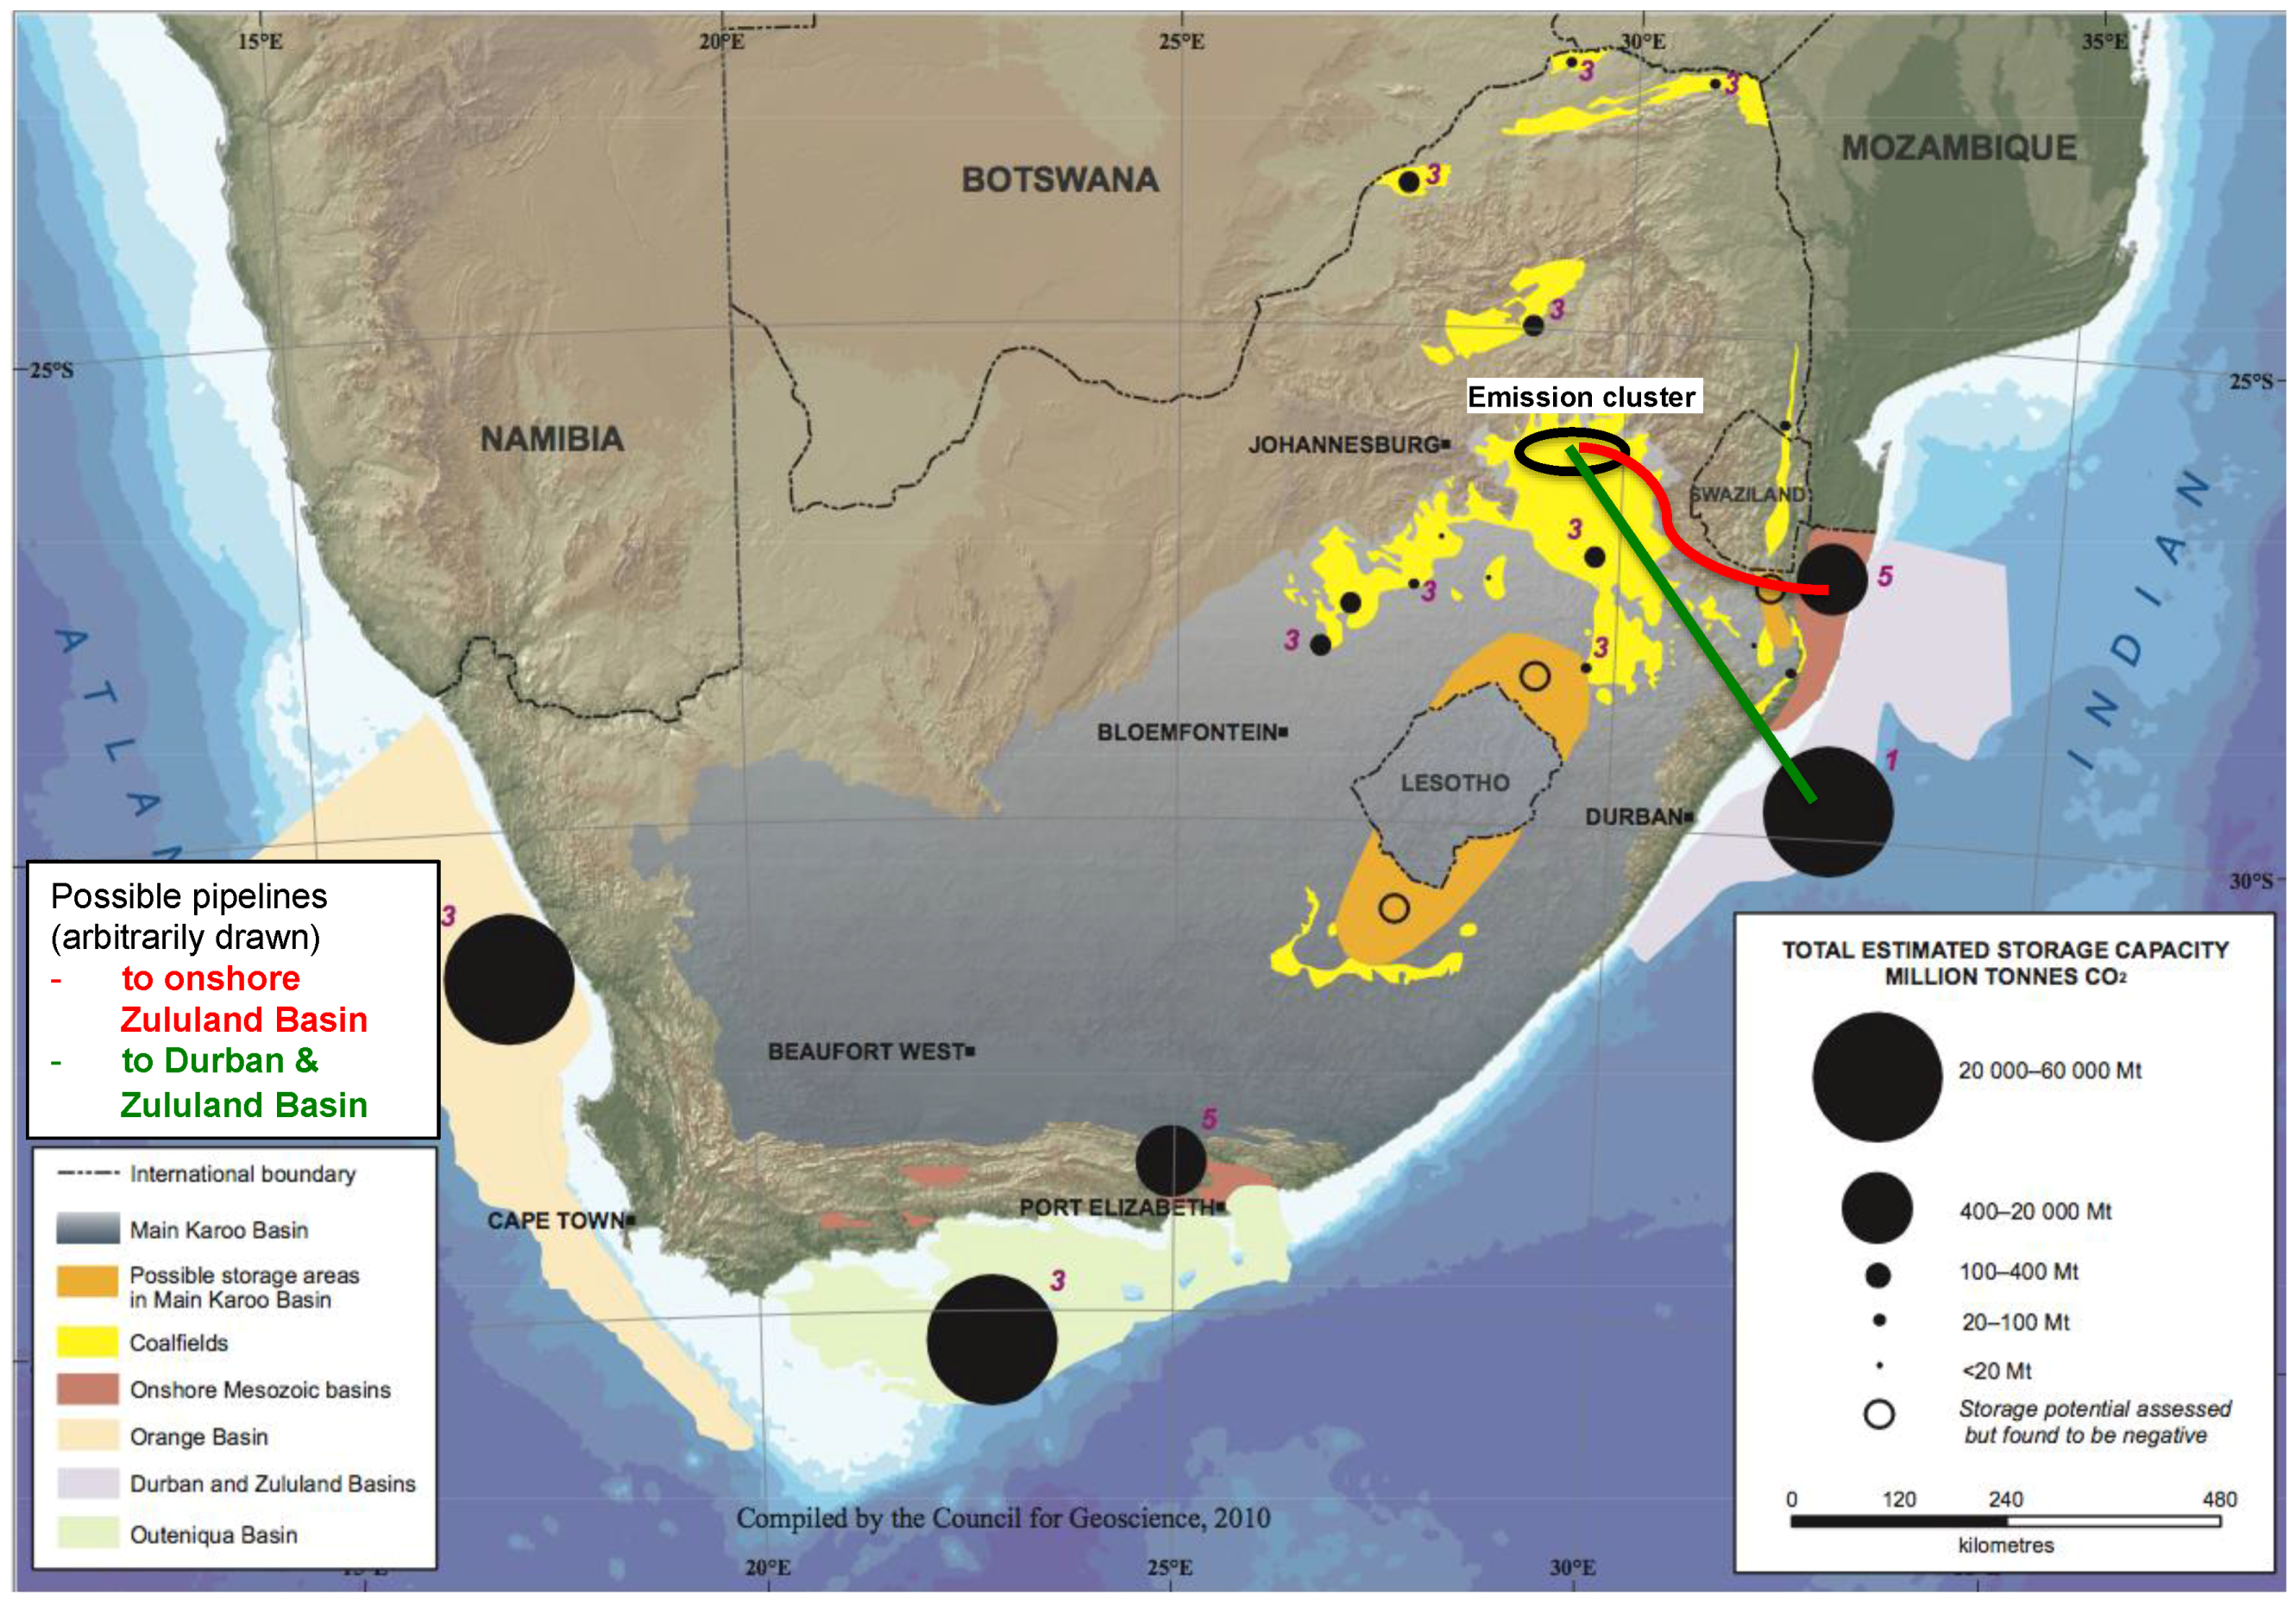
3.2. The Long-Term Usable CO2 Storage Potential for South Africa’s Power Sector

3.2.1. An Analysis of Storage Potential for South Africa

The storage atlas of the Council for Geoscience [28,29] is the main study on South Africa’s CO2 storage potential. In total, a storage capacity of 149.9 Gt is estimated for the country (Table 1), about 98.5% of which is in offshore aquifers. The five most promising basins are the three offshore basins of Outeniqua, Durban & Zululand, and Orange, and the two onshore basins of Algoa and Zululand (Figure 3).
Capacity is calculated using efficiency factors, which show the fraction of total pore volume that can effectively be used. It therefore has to qualify as effective on the techno-economic resource-reserve pyramid [19]. However, due to large uncertainties [30,31], this paper applies an “if … then” approach. Such an approach is important for demonstrating the implications of different storage capacity prospects to potential investors and policymakers, providing them with guidance in the decision-making process [21]. To this end, the text outlines three storage scenarios S1: high; S2: intermediate; and S3: low (Table 2). These scenarios mainly differ in the efficiency factors they use for the saline aquifer assessment. In addition to the originally applied efficiency factor of 10%, calculations also include efficiency factors of 4% and 1% as recommended by [30,31] and moreover already in use for the scheduled CO2 test injection field [13]. The choice of efficiencies expresses different levels of uncertainty—the smaller the value, the more cautious and conservative the estimate is.
Table 1. Overview of existing effective storage capacity estimates for South Africa [29].
FormationStorage capacity
Gt CO2
Oil fields0.0
Gas fields0.1
Onshore aquifers*0.8
Offshore aquifers*147.7
Coal seams1.3
Total149.9
*The capacities of aquifers are based on an average efficiency factor of 10%.
S1, the high scenario, includes the results of the storage atlas (excluding coalfields) with a total estimate of 148.7 Gt of CO2. The intermediate estimate, S2, amounts to 59.4 Gt of CO2 with storage potential in aquifers only. The calculation applies an efficiency factor of 4%. Consistent with a more cautious approach, when considering gas fields, only proven reserves (depleted and near-depleted fields) have been factored in. These gas fields result in 62 Mt of CO2 storage, which seems to be too small for large-scale CCS.
The conservative storage scenario S3 applies an efficiency factor of 1%. In this scenario, only offshore aquifers provide sufficient storage capacity, totaling 14.8 Gt. Onshore aquifers are excluded due to the high uncertainties surrounding the two basins of Algoa and Zululand that remain even if 1% is selected (very low compressibility and the risk of over-pressurizing the reservoir). Due to the high level of technical uncertainties and challenges [32,33] and highly dispersed sinks, CO2 storage in coal seams is excluded in all scenarios.
Table 2. Three scenarios of effective CO2 storage capacity in South Africa, based on [29].
FormationBasinS1*: highS2*: intermediateS3*: lowDistance from
emission cluster
Gt CO2km
Oil - - -
Gas 0.2 - -> 1,000
Onshore aquifers Algoa Zululand0.4
0.4
0.80.2
0.2
0.4 -
-
900
300–500
Offshore aquifers Outeniqua
Orange
Durban & Zululand
48.4
57.1
42.3
147.819.3
22.8
16.9
59.04.8
5.7
4.2
14.7> 1,000
> 1,200
450–600
Total 148.8 59.4 14.7> 1,000
*The efficiency factors selected for aquifers are 10% (S1), 4% (S2) and 1% (S3).
In addition, Table 2 includes the approximate distances from the sinks listed to South Africa’s large emission cluster, located in Mpumalanga and Limpopo provinces. At present, 90% of all power plants are operated in this cluster, which will also be the case in the future (Figure 3). The closest distance from the sinks is about 400 km to Zululand onshore basin on the east coast.

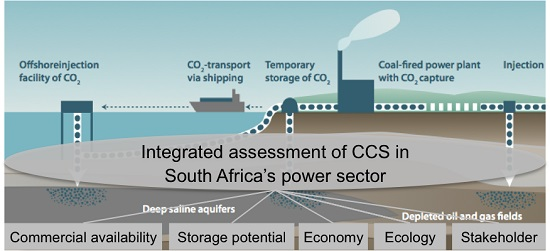
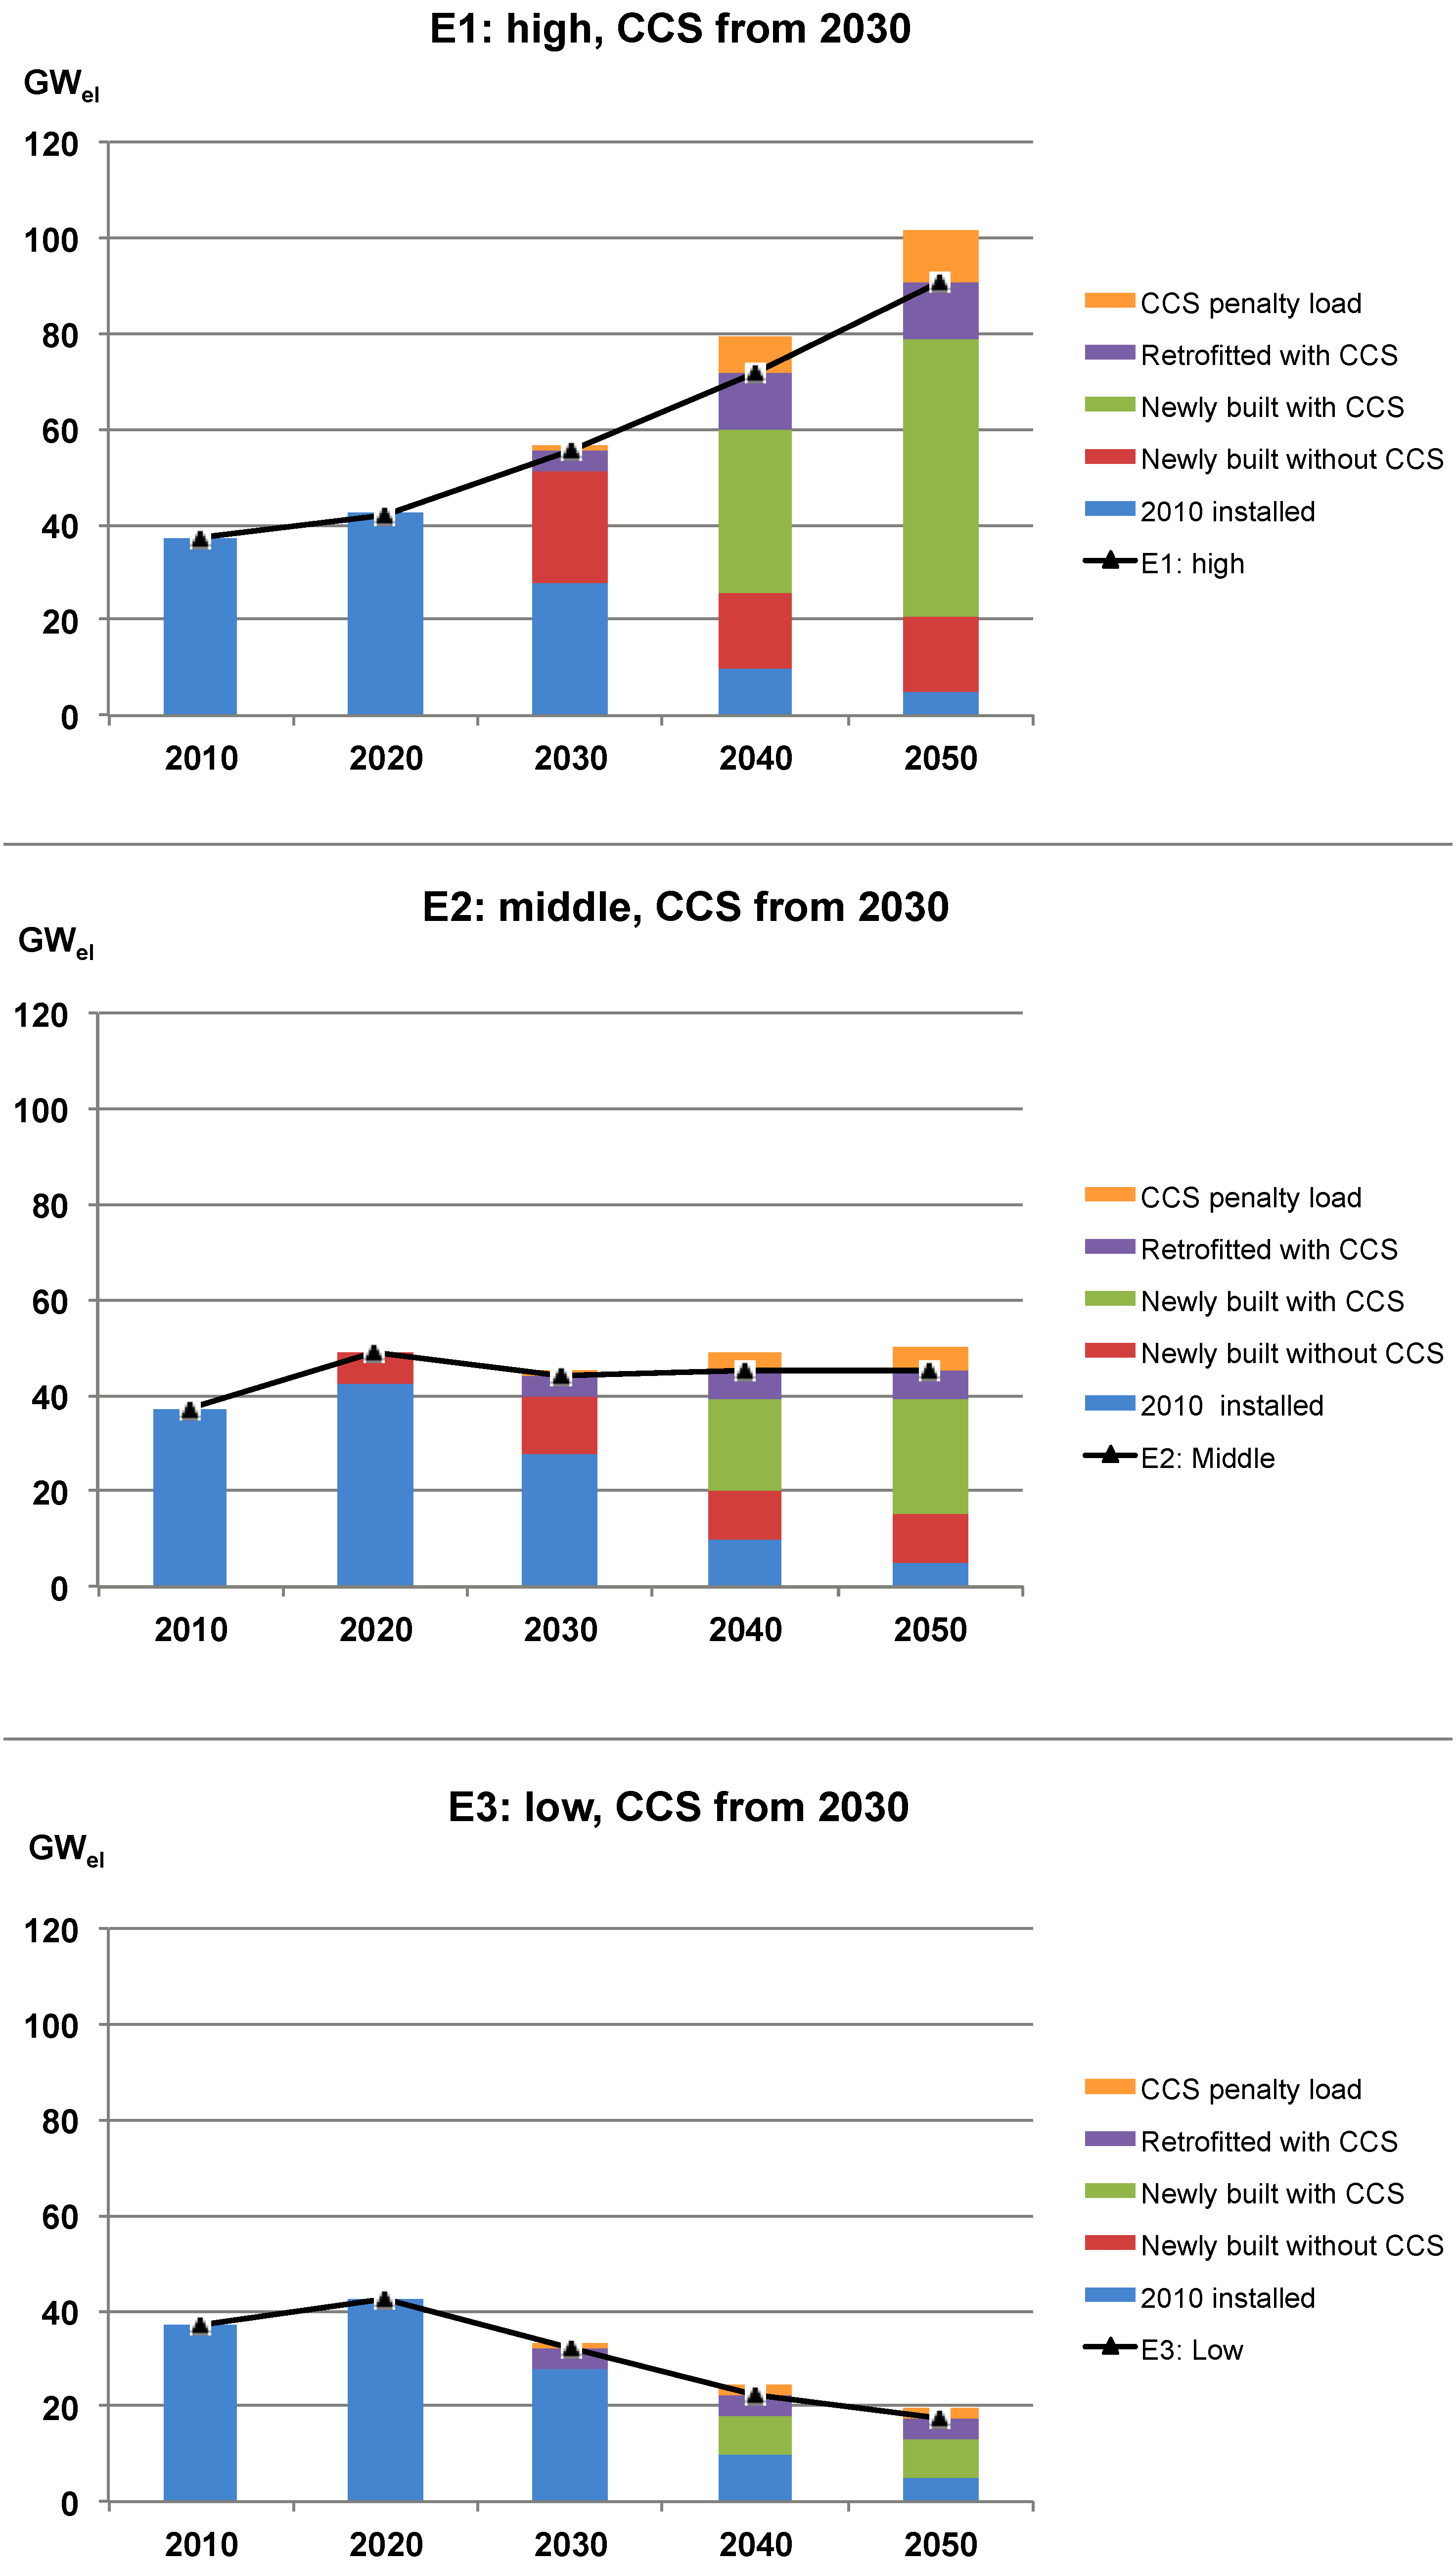
3.2.2. Deriving the Amount of CO2 That May Be Captured in South Africa’S Power Sector

Both the literature review and the interviews conducted in South Africa have revealed that no suitable long-term energy scenario work including CCS exists for South Africa (see Table S2 in the supplementary information for a systematic assessment of existing energy scenarios [34,35,36,37]). The preconditions for selecting a study were that (a) scenarios must cover a period up to 2050, (b) the installed capacity of coal-fired power plants must be provided at least in decadal resolution, and (c) the power plant capacity given for 2010 should not differ too significantly from the real situation. Since the scope of the study did not enable new energy scenarios including CCS to be developed from scratch, the capacity of coal-fired power plants that could theoretically be operated with carbon capture is derived from coal development pathways E1–E3, as previously done for India and China [1,2]:
1
Pathway E1: high is based on the Long-Term Mitigation Scenario (LTMS) No. 1 “Growth Without Constraints” [37,38], which involves neither a change from current trends nor the implementation of existing policies. It assumes an increase in installed power plant capacity from the current level of 37 GW to 120 GW by 2050, with a decreasing share of coal (91 GW by 2050) and an increasing share of nuclear energy (17 GW by 2050).
2
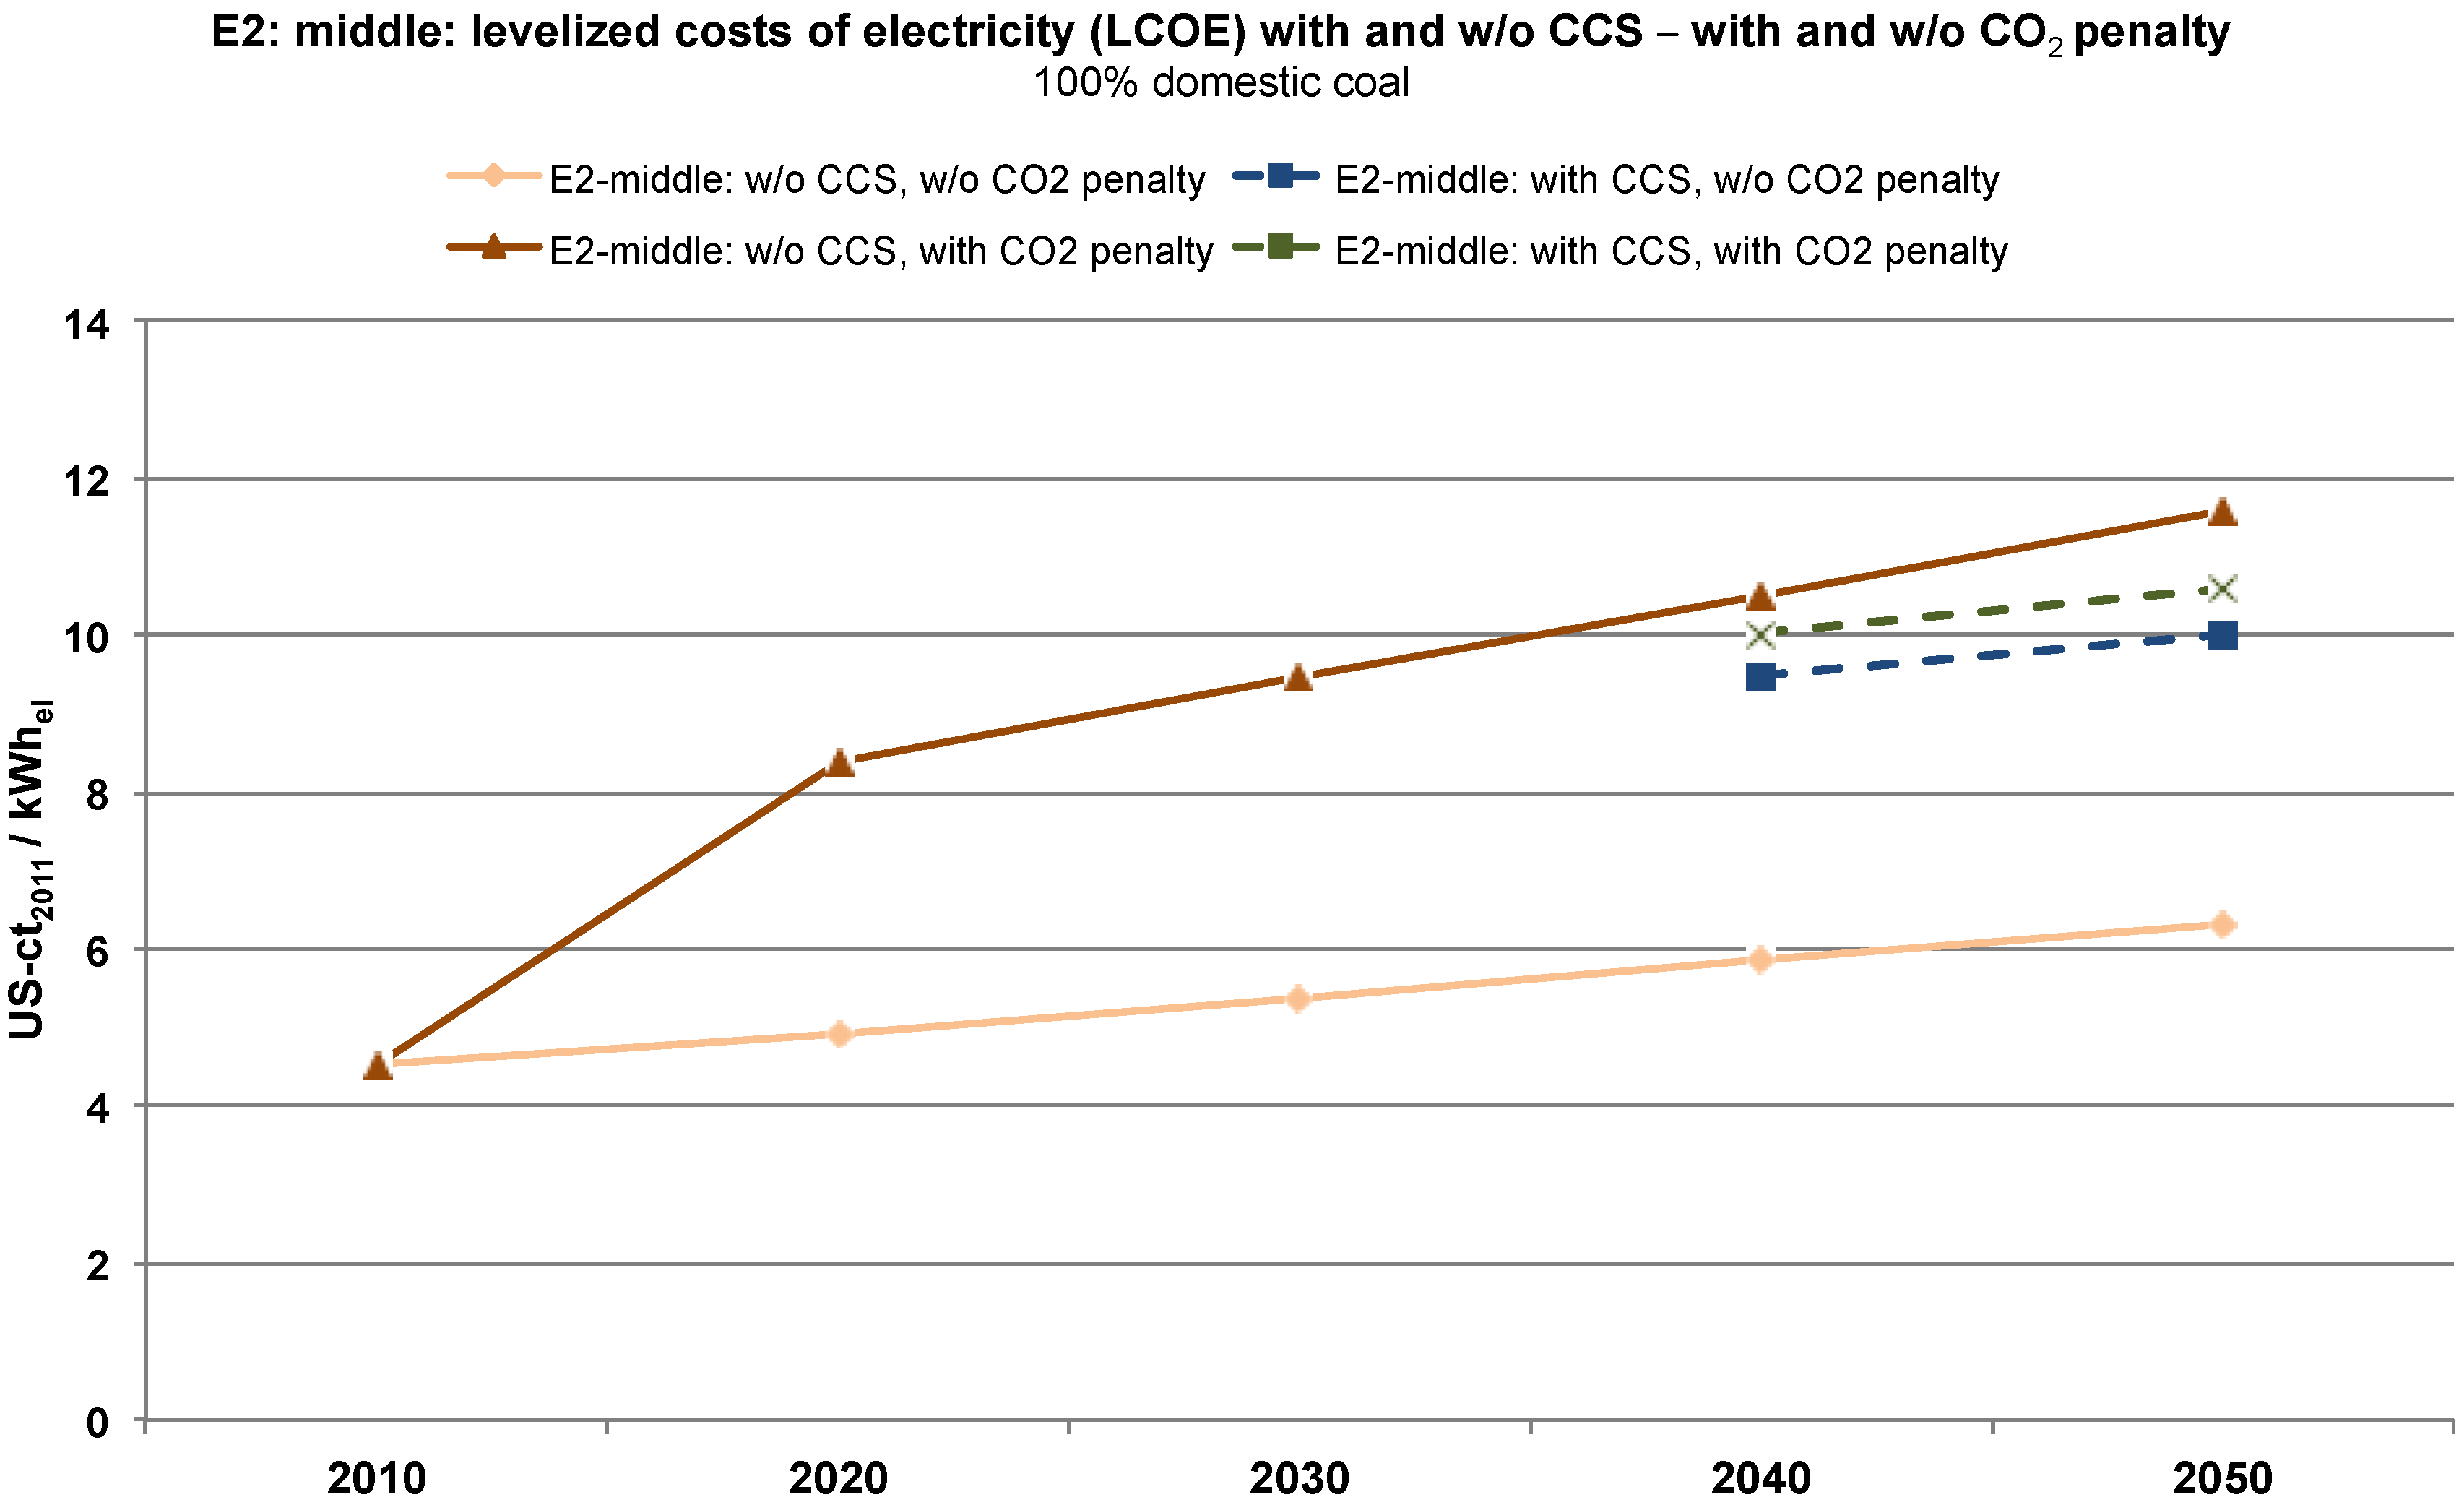
Pathway E2: middle is based on the “Reference Scenario” as developed in the Sustainable Energy Outlook for South Africa ([35], see description of pathway E3: low). Originally based on the World Energy Outlook 2008 Reference Scenario [39], which takes into account existing international energy and environmental policies, this has been updated with governmental power plant planning according to the Policy Adjusted Scenario of the IRP [26]. It was then extrapolated from 2035 to 2050. The scenario envisages a peak of coal power plant capacity of 45 GW in 2030, an increase in nuclear power (12 GW in 2050) and a strong increase in renewable capacity (37 GW in 2050).
3
Pathway E3: low is based on the Sustainable Energy Outlook for South Africa [35]. The South African scenario is part of the global Energy [R]evolution Scenario framework, the target of which is to reduce worldwide CO2 emissions to 50% below 1990 levels by 2050. While the scenario is based on renewable energy sources, efficient decentralized cogeneration and energy-saving technologies, both CCS power plants and nuclear power plants are excluded. In contrast to the Reference Scenario outlined above, this scenario considers only committed coal power plants as given in the IRP, and does not envisage any further new coal-fired power stations from 2020 on.
Figure 1 shows that all pathways meet the 2010 installed capacity. While they all assume a continuous increase in installed coal-fired power plants by 2020, in the long term they develop according to their specific characteristics. In comparison, the World Bank scenarios Reference and Baseline [34,40], which refer to 2030 only, follow the Policy Adjusted Scenario of the IRP up to 2020. Up to 2030, they develop similarly to pathway E2: middle and a pathway between E1: high and E2: middle, respectively. Since the basic scenarios were published between 2007 and 2011, it is important to compare their figures with those from current scenarios that explicitly provide capacity development figures. In this way, it is possible to corroborate the figures from the pathways. The IEA follows a similar approach in its scenarios described in Energy Technology Perspectives (ETP) 2015 [3] and in World Energy Outlook (WEO) 2014 [41], which refers to 2040 only; WEO’s current policies scenario and ETP’s 6 degree scenario represent the highest coal capacity development. From 2020 to 2040, WEO shows nearly the same development as pathway E1, while ETP develops similarly to a pathway between E1: high and E2: middle. WEO’s new policies scenario and ETP’s 4 degree scenario are virtually identical to pathway E2. WEO’s 450 scenario and ETP’s 2 degree scenario closely follow pathway E3.
Figure 1. Coal-fired power plant capacity in South Africa (2010 installed, decommissioning curve, envisaged according to coal development pathways E1–E3, and values from other scenarios).
Energies 08 12432 g001
The assumptions behind the application of CCS in the pathways are as follows [1,2]:
  • In E1: high the deployment of CCS would have to be as high as possible in the future to decrease the CO2 emissions resulting from this pathway in accordance with the long-term climate protection target of the international community to which South Africa is increasingly committing itself [25].
  • In both E2: middle and E3: low the deployment of CCS could be a “fall back” option which may have to be used if other measures to reduce power sector CO2 emissions cannot be realized as envisaged in the respective scenarios (usually the considerable use of nuclear energy and renewable energies in E2: middle and energy efficiency improvements and renewable energy deployment in E3: low).
In order to calculate the possible capacity of CCS-based power plants, the following assumptions are made for all three pathways: only supercritical (SC) and integrated gasification combined cycle (IGCC) power plants will be built [1,2]. Since none of the analyzed documents and statistics or interviews conducted within this study contain any information on lignite reserves or plans on lignite fueled power plants, only hard coal fueling is assumed. Ultra supercritical technology (USC) will not be used in South Africa [42] and is also not considered as an option for future power plants in the LTMS scenarios [43]. The share of SC power plants develops from 100% (2020) to 60% (2050), that of IGCC from 10% (2030) to 40% (2050) (see supplementary information). The assumptions for IGCC are lower than outlined in LTMS Scenario No 1, taken as pathway E1: high [37] (36 GW instead of 68 GW in 2050). However, since this technology is still at the demonstration stage and, even in China, the uptake of the technology is addressed rather cautiously due to the higher capital costs incurred compared to advanced pulverized coal (PC) plants [44], the share of IGCC is adapted to the development assumed for China [2].
New plants are distributed proportionately to currently operating power plants, since no plans for any future regional allocation are known. From 2030, all new plants are assumed to be built as CCS-based power plants [1,2]. Power plants built earlier are only retrofitted if they are less than 12 years old [45]. One-third of the power plants built between 2020 and 2030 will be retrofitted from 2030 in the base case of the three pathways (CCS available from 2030). In sensitivity case AV2 (CCS available only from 2040), 50% of power plants built between 2030 and 2040 and 10% of those built between 2020 and 2030 are retrofitted [1,2]. Of the two large power plants currently being built, only Kusile (4.3 GW) will be worth considering for a retrofit since it was designed “capture-ready” in 2008. The five blocks are scheduled to come into operation between 2017 and 2020, enabling them to be retrofitted if CCS is introduced in 2030. Figure 2 and Table S3 in the supplementary information show the resulting CCS-based power plant capacity in the base case. This figure also illustrates the penalty load caused by efficiency losses introduced by the use of carbon capture technology [1,2]. The penalty load has to be installed in addition to the load given in the coal development pathways (black line), and will increase the total load of coal-fired power plants in 2050 by between 3% (E3: low) and 17% (E1: high).
Further assumptions are required to calculate the quantity of CO2 that could be separated (Table 3 and Table S4 in the supplementary information) [1,2]: the maximum efficiency for newly-built non-CCS power plants in 2050 is set at 42% for SC and 47% for IGCC power plants. For CO2 capture and compression, an efficiency loss declining over time from 8.5 to 5 percentage points for the period from 2020 to 2050 is assumed for post-combustion, while loss due to pre-combustion ranges from 6.5 to 6 percentage points [8,46,47,48,49]. Retrofitting power plants with CCS technology would cause an additional efficiency loss of 1.5 percentage points [21].
Figure 2. Conventional and CCS-based coal-fired power plant capacity installed in South Africa in the three pathways E1–E3 for the base case (CCS from 2030).
Energies 08 12432 g002
Table 3. Efficiencies and efficiency losses through CCS assumed for future newly built coal-fired power plants in South Africa.
Parameter 20102020203020402050
Efficiency of newly built supercritical coal fired power plant%383941.54242
Efficiency of newly built IGCC% 4446.547
Efficiency penalty post-combustion%-pt128.5765
Efficiency penalty pre-combustion%-pt86.5666
Additional efficiency penalty for retrofitting%-pt1.51.51.51.51.5
The technical lifetime is assumed to be 50 years [26,40,50,51]. A CO2 capture rate of 90% has been chosen [1,2], and an average net calorific value of the domestically produced coal feedstock of 19.6 MJ/kg [43] has been applied. A plant load factor (PLF) of 80% (7,000 full load hours) has been chosen. Although [34,43,52] assume figures ranging from 85% to 88%, this seems too optimistic for the base case. In order to consider a potential future increase in competition from nuclear and renewable energy plants, both of which produce electricity at a lower marginal cost than coal, a PLF of 69% (6,000 full load hours) has been considered as sensitivity case PLF [2].
The cumulated amount of CO2 separated per power plant has been calculated by adding the annual CO2 emissions captured by each power plant over its lifetime. For power plants built in 2050, for example, this means that their annual emissions up to 2100 are included [1,2]. In the base case, between 4 and 22 Gt of CO2 could be available for sequestration in total (Table 4). Considering only the annual figures, between 87 and 455 Mt/a would have to be sequestered in 2050.
The study identifies the year of commercial availability and the PLF as the most relevant parameters for estimating separated CO2 emissions as it was already the case for China [2]. Considering sensitivity case AV1, the CO2 emissions provided for storage will be 22%, 29% and 38% lower in pathways E1, E2 and E3, respectively. Regarding sensitivity case AV2, the amount is reduced by 28%, 41% and 62%, respectively, compared to the base case. The lower the expected additional deployment from 2030, the greater the influence of later availability. Varying the operation time by 1,000 full load hours (sensitivity case PLF) decreases the amount of CO2 captured by 14%, compared to the base case [2]. Further parameters influencing the amount of separated CO2 emissions include the CO2 emissions per unit of electricity produced (which means the efficiency of the power plants, since the source of coal and therefore the net calorific value is not assumed to change) and the CO2 capture rate. However, both parameters may only slightly vary and are therefore of minor importance compared to availability and PLF.
Table 4. Separated CO2 emissions in South Africa according to coal development pathways E1–E3, cumulated over the lifetime of all power plants newly built until 2050.
Availability of CCS7,000 full load hours
(base case)
6,000 full load hours (sensitivity case PLF)
E1: highE2: middleE3: lowE1: highE2: middleE3: low
Gt CO2Gt CO2
CCS from 2030 (base case)22.09.34.018.88.03.5
CCS from 2035 (sensitivity case AV1)17.16.62.514.75.72.1
CCS from 2040 (sensitivity case AV2) 12.33.91.010.53.40.8

3.2.3. Deriving South Africa’s CCS Potential As a Result of Matching Sources and Sinks

Finally, the range of CO2 storage capacity is compared with the cumulated quantity of CO2 emissions. The source-sink match is based on South Africa’s large emission cluster identified in Figure 3. Only the onshore Zululand basin and the offshore Durban & Zululand basin have been selected for the match due to very long transportation distances and the high costs that would be involved for the other basins ([53] estimated a maximum distance of 500 km to be economically viable).
Figure 3. Sedimentary basins in South Africa, potential storage capacity and possible pipelines between CO2 sources and storage sites (modified from [29]).
Energies 08 12432 g003
The distance between the emission cluster and the selected sinks is between 300 and 600 km (see pipelines in Figure 3, which are drawn arbitrarily and are not based on any current plans). In order to consider solely these two basins, the available storage capacity within the three storage scenarios is reduced and the scenarios are renamed as S1600km: high, S2600km: intermediate and S3600km: low (Table 5).
Table 5. Three scenarios of effective CO2 storage capacity in South Africa considering only basins with a maximum distance of 600 km from the main emission cluster.
FormationBasinS1*600km: highS2*600km: intermediateS3*600km: lowDistance from emission cluster
Gt CO2km
Onshore aquifersZululand0.40.2-300–500
Offshore aquifersDurban & Zululand42.316.94.2450–600
Total 42.717.14.2300–600
* The efficiency factors selected for aquifers are 10% (S1), 4% (S2) and 1% (S3).
No potential storage capacity in neighboring countries such as Botswana and Mozambique has been considered. Sasol, the operator of South Africa’s coal-to-liquid (CTL) plants, analyzed potential storage capacities in Mozambique, which would be about 600 km from Sasol’s CTL plants [54]. This is no closer than storing CO2 on South Africa’s coast, and would require a legal framework that is not yet in place, as discussions on CCS have not even started there [31].
The match is carried out in two steps: first, the onshore Zululand basin would be filled with 0.4 Gt of CO2 in each coal development pathway (only possible in scenarios S1 and S2). The offshore Durban & Zululand basin would then be filled until all emissions have been stored or—if the estimated emissions captured exceed the storage space available – until its capacity is reached (see Tables S5–S7 in the supplementary information for details). The matched capacity ranges from 4 to 22 Gt of CO2, as shown in the upper third of Table 6. The central third indicates that the storage potential is exploited entirely in four cases and less than 50% in only three out of nine cases. The lower third shows the share of emissions that can be stored in the respective scenario combination. In five out of nine scenario combinations, 100% of these emissions can be stored. The low storage scenario is the only one where—for coal development pathways E1 and E2—less than 46% of emissions could be stored, when considering the selected basins only.
As it was the case in China, the matched capacities of sensitivity cases AV1 and AV2 have not been analyzed in detail [2]. However, since only 71%–78% or 59%–72% of the power plant emissions of the base case are available in pathways E1 and E2, respectively (Table 4), a higher share of these emissions could be sequestered than in the base case, while the storage potential may be exploited to a lesser extent than in the base case. In sensitivity case PLF, the available emissions are reduced by (a further) 14%, which reinforces the implications derived [2].
Table 6. Matched capacities for South Africa and their share in total storage capacity and supply in the base case (CCS from 2030).
Power plant emissions from coal development pathways
Effective storage capacity scenarios * for matchingE1: high (22.0 Gt CO2)E2: middle (9.3 Gt CO2)E3: low (4.0 Gt CO2)
Matched capacity (Gt of CO2)
S1600km: high (43 Gt CO2)22.09.34.0
S2600km: intermediate (17 Gt CO2)17.19.34.0
S3600km: low (4 Gt CO2)4.24.24.0
Share of effective storage capacity used (%)
S1600km: high (43 Gt CO2)51229
S2600km: intermediate (17 Gt CO2)1005524
S3600km: low (4 Gt CO2)100100100
Share of emissions that can be stored (%)
S1600km: high (43 Gt CO2)100100100
S2600km: intermediate (17 Gt CO2)78100100
S3600km: low (4 Gt CO2)1945100
*The maximum transportation distance is assumed to be 600 km. Storage scenarios are based on capacity of onshore Zululand and offshore Durban & Zululand basin.

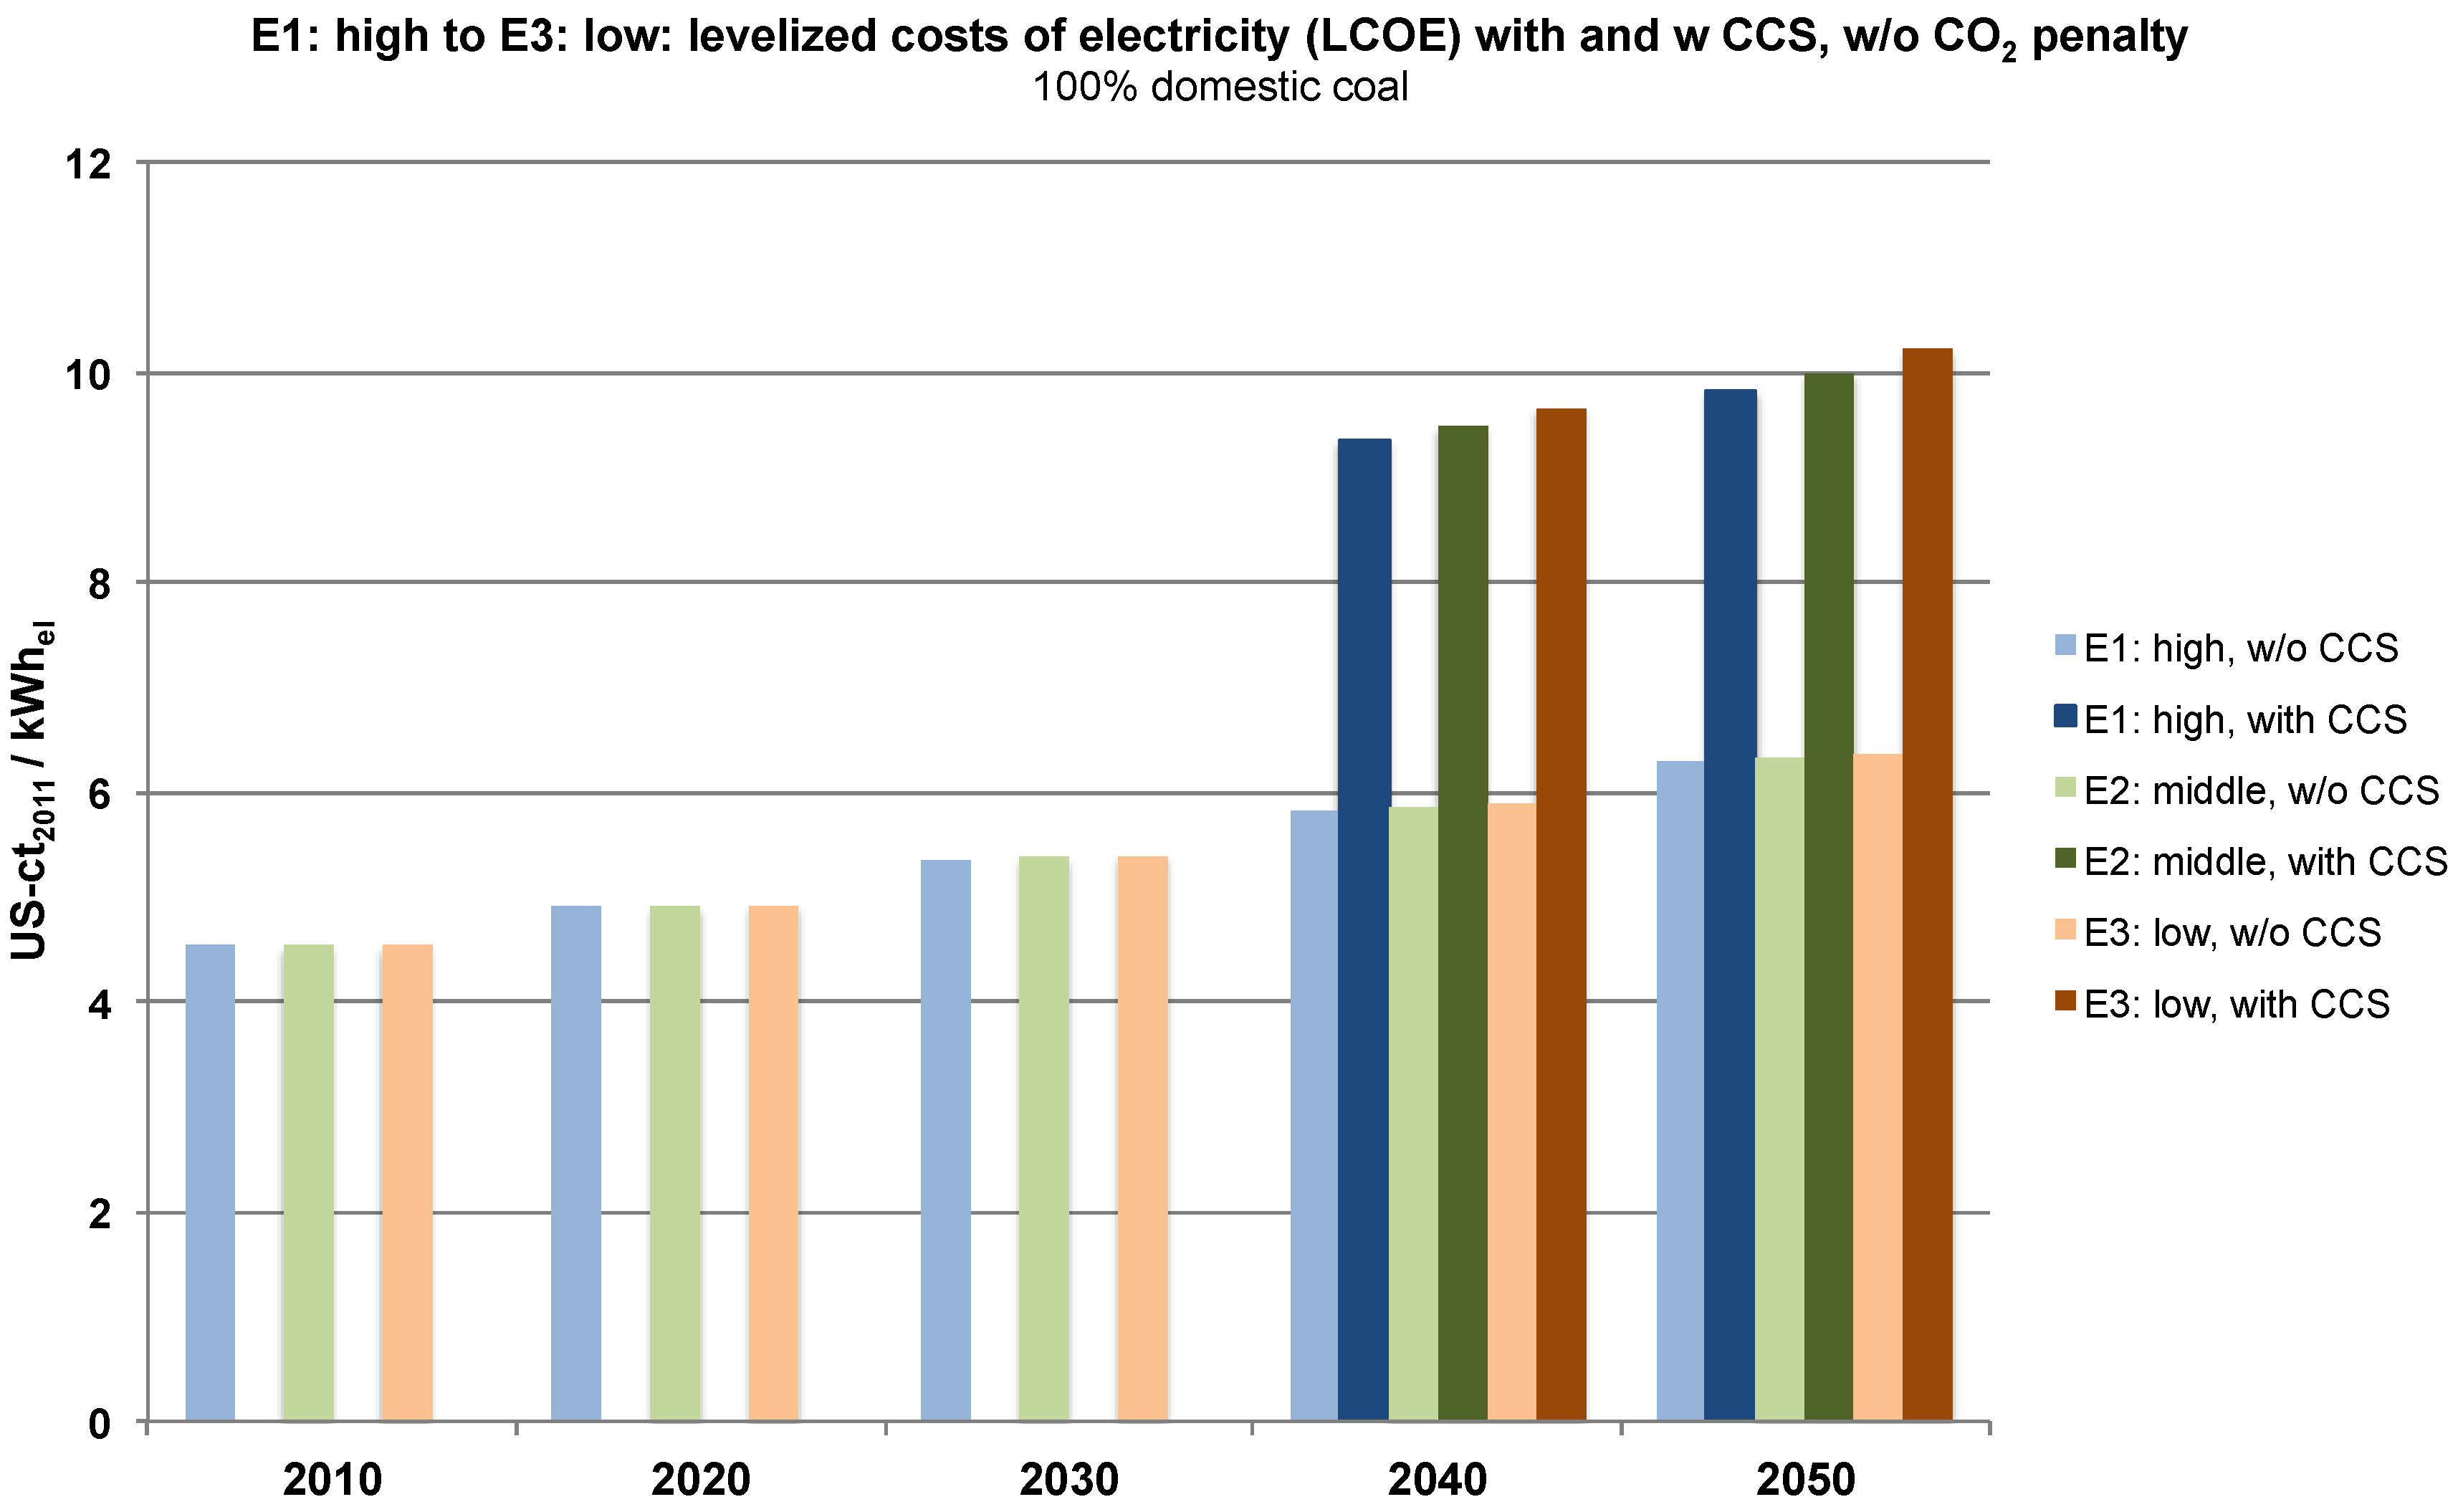
3.3. An Economic Assessment of CCS in South Africa’s Power Sector

The assessment of the LCOE of coal-fired power plants is based on a comprehensive set of assumptions for the base case. It focuses on SC plants, since this plant type is technically mature and widely deployed, meaning that existing cost data are relatively reliable. CO2 capture is only taken into account for new power plants, while retrofitting is not included. IGCC technology is not considered here due to the rather high level of technical and economic uncertainties outlined above. Hence a share of only 10% in newly built power plants in 2030 was assumed (Section 3.2.2). The basic plant parameters for SC plants with and without CCS are largely consistent with those presented for the base case in Section 3.2.2 (see also supplementary information) [1,2]. For newly built SC plants without CCS, an average net thermal efficiency of 39% is assumed for the pre-2020 period and 41.5% for post-2020 as the mean of expected development from 2030 to 2050. An efficiency loss of 6 percentage points is chosen as the mean of the efficiency penalties from 2030 to 2050. Since in the base case CCS starts no earlier than 2030, with capacities gradually being installed in the ensuing years, the cost assessment provides figures for CCS plants for 2040 and 2050 only [1,2].
The figures for current plant capital costs represent the mean value of figures given in several studies and reports [40,55,56]. All cost data take into account local circumstances in South Africa. Capacities of the reference plants under study range from 510 to 794 MWel. Plant capital costs without CCS vary between 1,984 and 2,858 USD2011/kWel (with a mean value of 2,297 USD2011/kWel). The variation is due to economies of scale and different basic assumptions, such as plant design and financing conditions. O&M costs are given as a percentage rate of plant capital costs and are assumed to be 4% [57].
Capital costs of post-combustion equipment are estimated to be equivalent to 75% of non-CCS plant capital costs; O&M costs are assumed to increase by 83% (both figures represent an average value of figures from [58,59,60]). The total capital costs for the power plants considered here are allocated to individual years on an annuity basis [1,2] (see equation 1). An interest rate of 8% and a depreciation period of 25 years according to [40] yield an annuity factor of approximately 9% per annum.
As in the analysis previously performed for India and China [1,2], the cost development of future power plants is derived by applying learning rates, taking into account newly installed capacities of SC units with and without CCS on the global level. As projected in the IEA’s Blue Map scenario [7], the study assumes that a total of 663 GW CCS-based coal-fired power plants will be installed globally by 2050. Based on [61], the learning rates for power plants with and without CCS are derived as 3.9% and 1.7% for capital costs and 5.8% and 2.5% for O&M costs, respectively. For CCS-based power plants, these are lower than one might expect because, in the case of CCS, only the additional expenditure for CO2 capture follows the learning curve, while the current SC plant is a mature and widely deployed technology. The learning rates are then applied to the capacity additions projected in coal development pathways E1–E3.
Very few long-term scenarios are available for dynamic price development for domestic hard coal in South Africa. For example, [40] assumes domestic fuel prices will remain constant in the planning horizon from 2010 to 2030. However, many assessments of the LCOE of coal-fired power plants, especially in emerging countries, suffer from a far too conservative estimate of coal prices, which are often based on coal prices strongly controlled and regulated by national governments. In the decades ahead, an increasing liberalization of the energy sector, leading to a strong impact on market forces and coal prices, may be expected to occur in emerging countries, such as South Africa. [56], for example, expects the price of South Africa’s coal to steadily increase in the future.
Coal price assumptions in the cost assessment here are based on the historic development of the domestic sale price of hard coal in South Africa from 1985 to 2010. Starting at a price of about USD 1.50/t in 1985, the price of hard coal rose to about USD 28.30/t in 2010. This implies an average annual price increase of approximately USD 1.1/t, or USD 10.7/t per decade. Extrapolating this trend to the end of the period considered in the coal development pathway in this study implies a projection of South Africa’s domestic hard coal price to be approximately USD 71.1/t by 2050. The potential cost impact of coal imports has not been taken into consideration, due to the fact that South Africa is one of the world’s largest coal exporting countries. South Africa’s coal production has grown by nearly 50% since the early 1990s. Thus it reasonable to assume that South Africa’s power generation will continue to be based on domestically produced coal in the decades ahead. The quality of coal mainly used for power generation is expected to be sub-bituminous coal, with an average heating value of 19.59 GJ/t [62]; high-quality coal is expected to be used primarily for export.
For South Africa, [40] estimates average pipeline transportation costs of CO2 over a distance of 100 km to be about 1 USD2011/t. This estimate is significantly below international figures [58,59,63] due to the lower cost of labor and equipment in South Africa. Assuming an average transport distance of about 550 km based on source-sink matching in Section 3.2.3, CO2 transportation costs total approximately 5.5 USD2011/t of CO2.
Costs of CO2 storage are based on country-specific and site-specific assessments by [40]. Taking into account the basins selected for source-sink matching, the mean costs of CO2 storage in these two potential aquifer formations are calculated to be about 13 USD2011/t of CO2. By comparison, international cost figures for onshore and offshore saline aquifer storage range from 4 USD2011/t of CO2 [64] to USD201111/t of CO2 [59]. However, existing cost data for South Africa’s storage sites suggest a high impact of specific conditions as well as significant uncertainties, which is why they were used for this assessment.
Figure 4 illustrates the LCOE with and without CCS in three coal development pathways E1–E3. Without CCS, the LCOE increases from 4.53 US-ct2011/kWh in 2010 to 6.34 US-ct2011/kWh in 2050 across the different pathways. This increase of about 40% is due to the fact that minor technology cost reductions resulting from low learning rates of SC plants are overcompensated by increasing fuel costs. Starting from 2030, CCS can be expected to lead to a significantly higher LCOE up to 10.21 US-ct2011/kWh or up to 61% more than non-CCS plants. Despite the higher learning potential of CCS plants compared to SC plants without CCS, reductions in capital and O&M costs are also overcompensated by increasing fuel costs. Pathway E3: low features the highest LCOE of CCS plants because it envisages a significantly lower overall capacity of CCS plants and, thus, lower cost reductions.
Figure 4. LCOE in South Africa with and without CCS in coal development pathways E1: high–E3: low without CO2 costs.
Energies 08 12432 g004
Figure 5 illustrates the significant cost barriers to the deployment of CCS plants for pathway E2, specified by cost category. It is evident that high capital costs incurred by the capture unit constitute the largest portion (45%) of additional costs stemming from CCS.
Figure 5. Additions to LCOE in South Africa resulting from CCS by cost category in coal development pathway E2: middle without CO2 costs.
Energies 08 12432 g005
The results shown here suggest that there are substantial barriers to economic viability of CCS in South Africa, making policy incentives a crucial precondition for the technology’s commercialization [65]. Since introducing a carbon price could significantly improve the competitiveness of CCS plants over non-CCS plants, an investigation was made into how a CO2 price pathway up to 2050 would outweigh the technology’s cost penalty. This assumption is particularly relevant in the case of South Africa, as the country aims to introduce a carbon tax as of January 2016 [66]. The debate on establishing a national CO2 pricing mechanism was initiated by the National Treasury in 2010 and continued in the 2011 National Climate Change Response White Paper [67]. In the assessment presented here, CO2 costs start at 42 USD2011/t of CO2 in 2020, and increase to 56 USD2011/t and 63 USD2011/t of CO2 in 2040 and 2050, respectively, as assumed for the EU in energy scenarios of the German government [68].
Figure 6 illustrates a comparison of the LCOE for pathway E2, both with and without a CO2 cost. The results indicate that, in the absence of a CO2 penalty, the LCOE of SC plants with CCS clearly exceed those of the same plant type without CCS. When adding a CO2 penalty following the price path outlined above, the LCOE of CCS plants (10.61 USD2011/kWh) would be somewhat more competitive than those of plants without CCS (11.56 USD2011/kWh) in 2050. However, the slight cost advantage of CCS plants in 2040 and 2050 may not suffice to compensate for the higher risks associated with investing in CCS power plants.
Figure 6. LCOE in South Africa for coal-fired supercritical power plants with and without CCS and with and without CO2 costs in coal development pathway E2: middle.
Energies 08 12432 g006

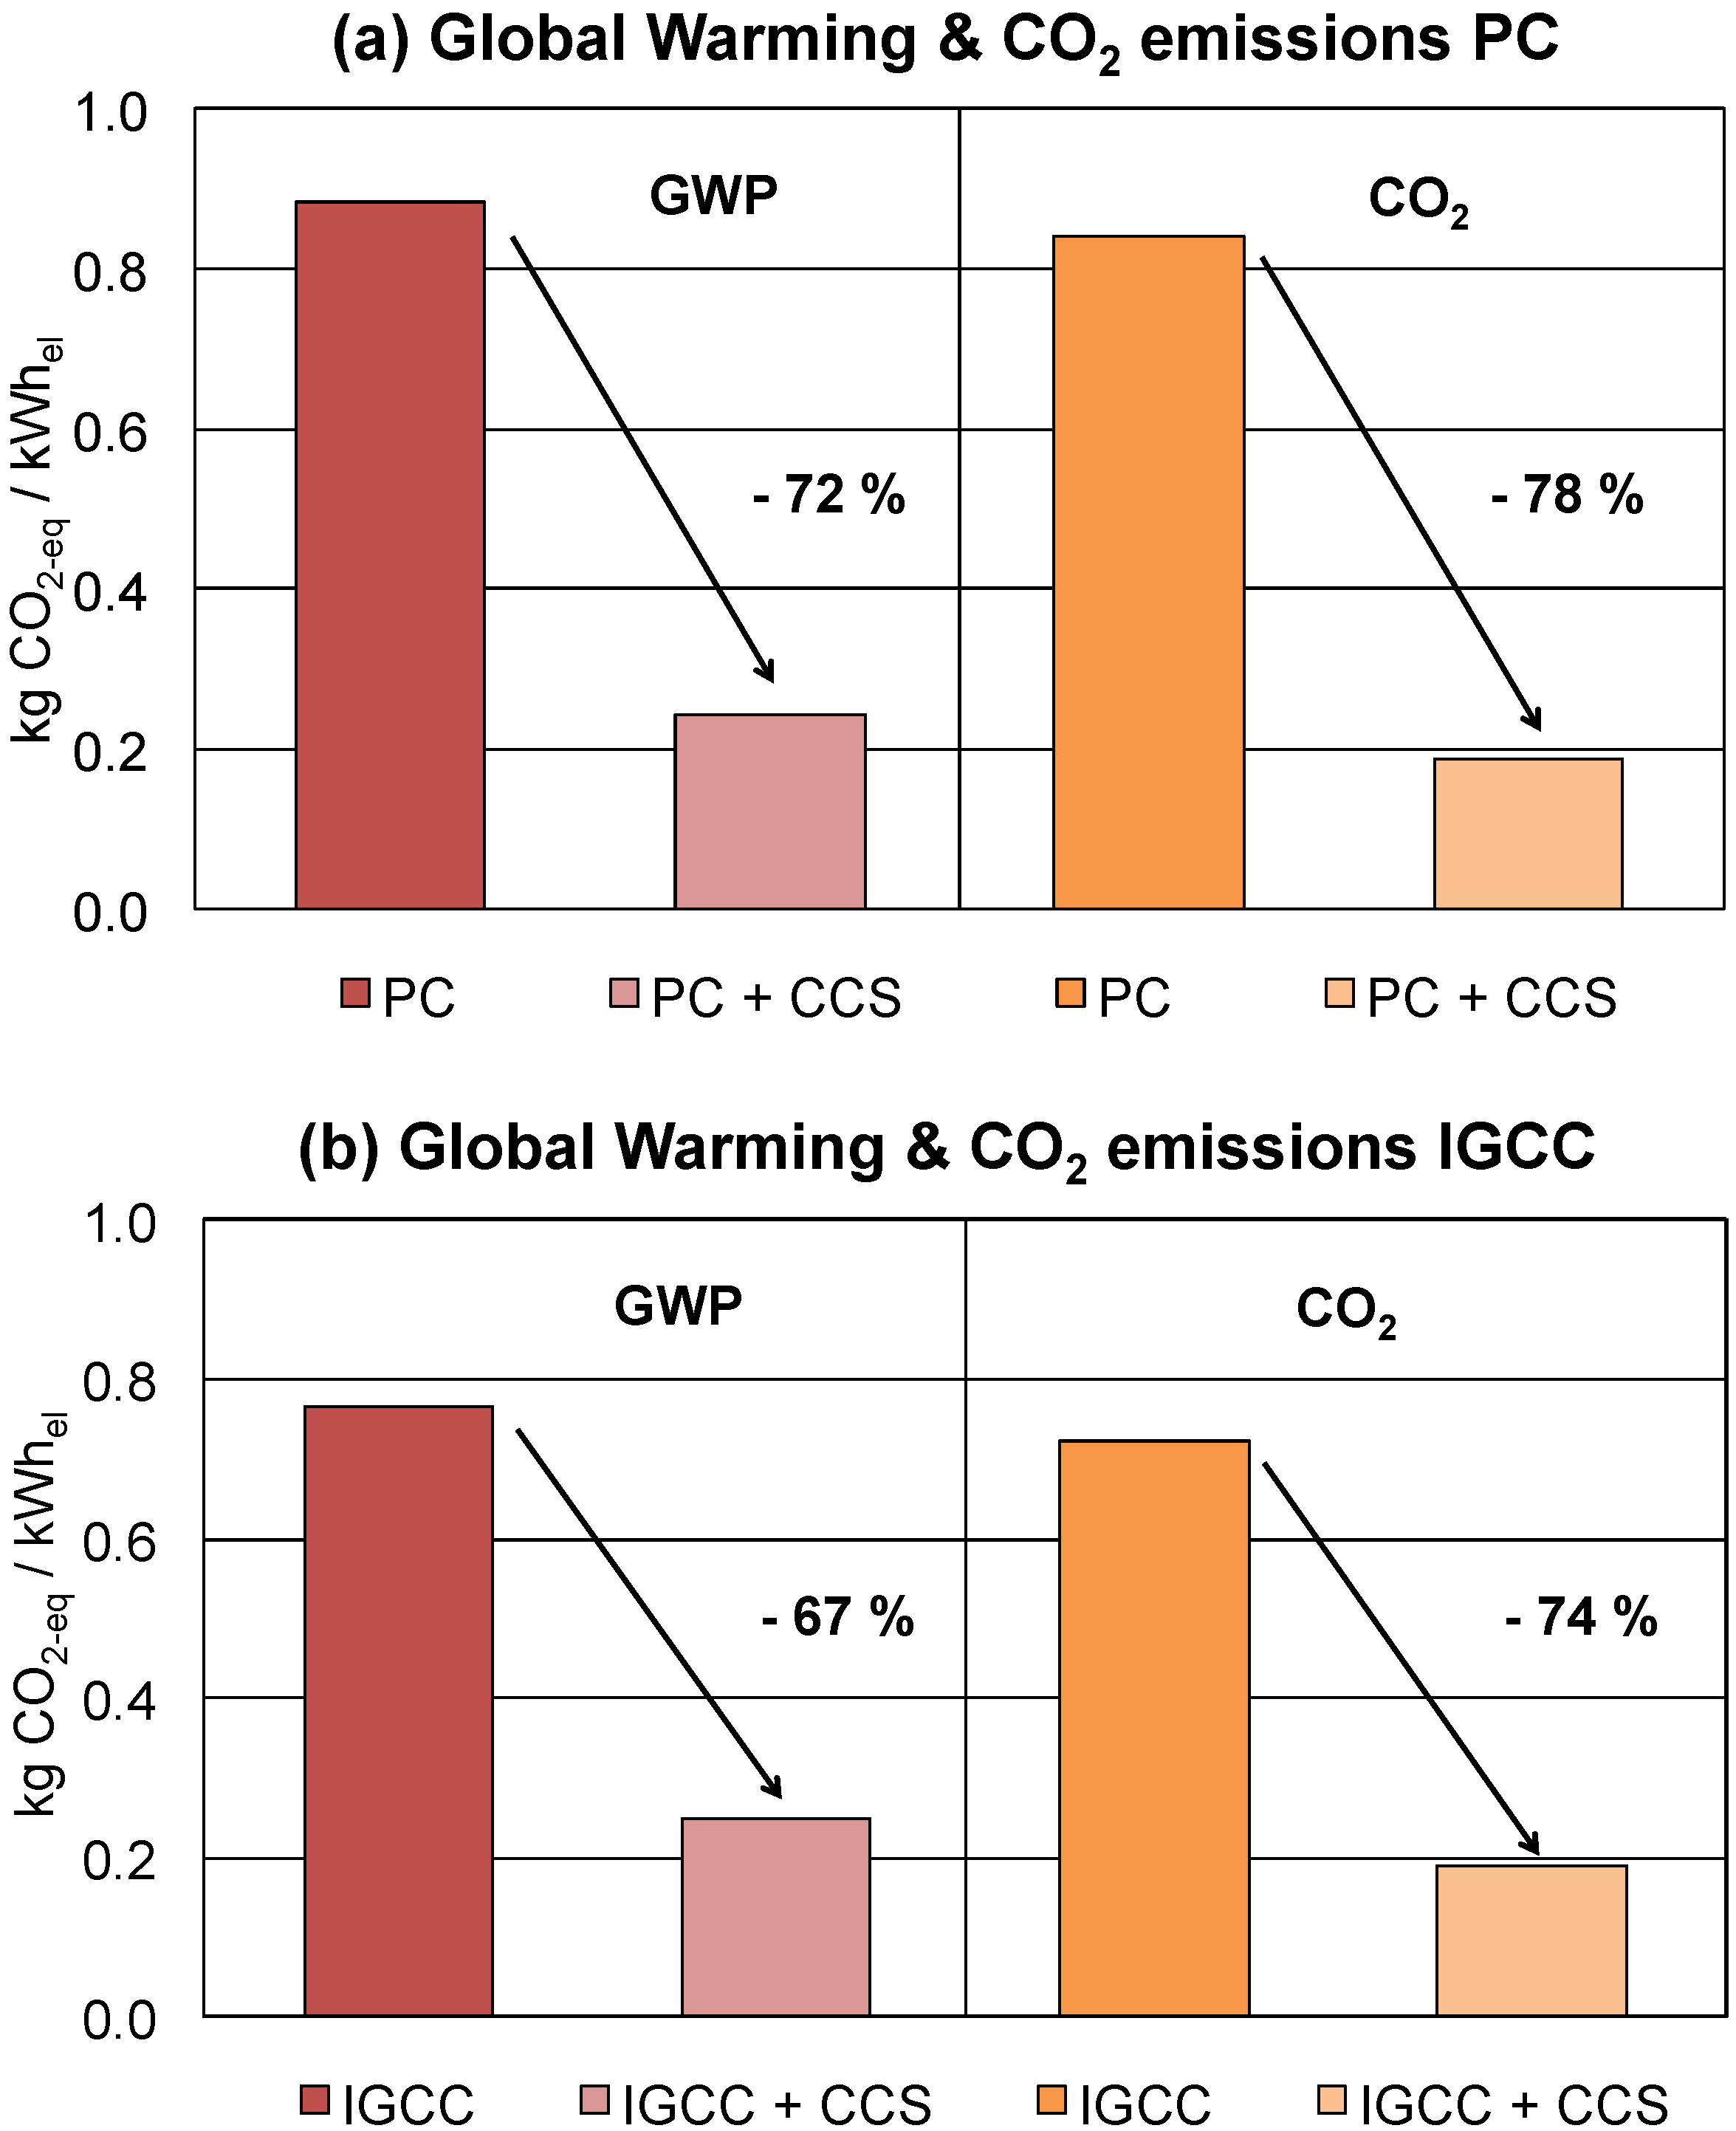
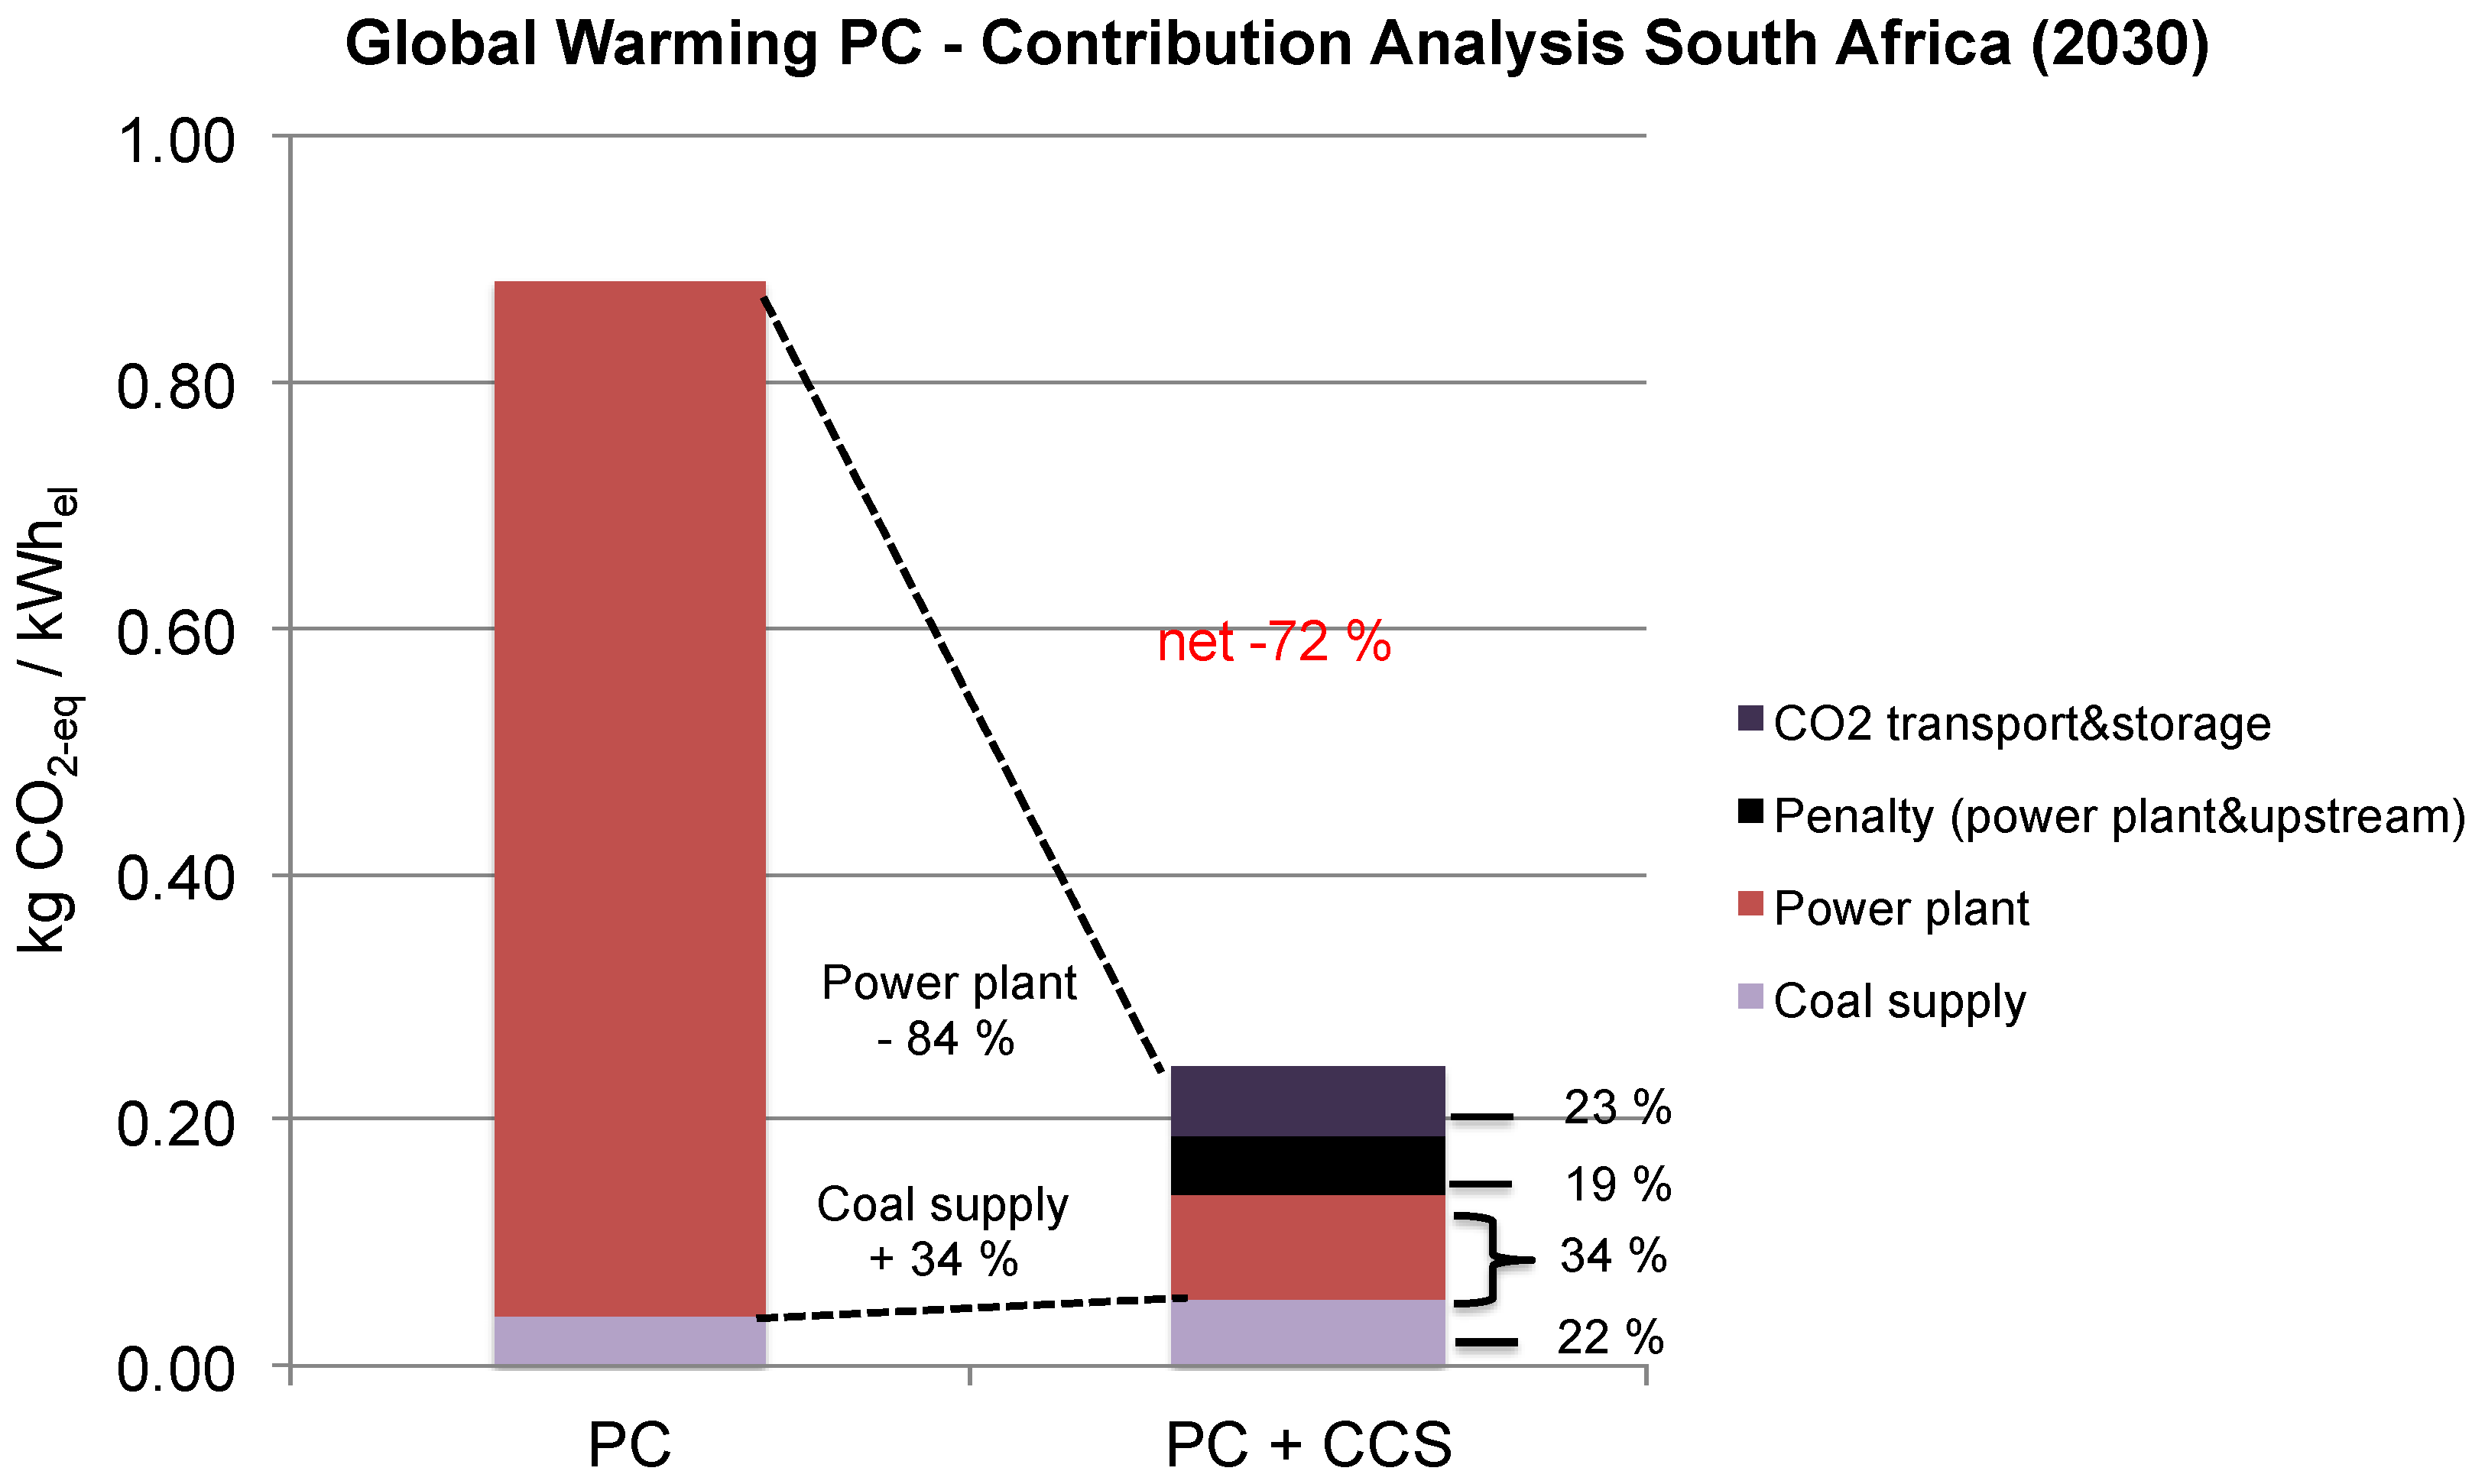
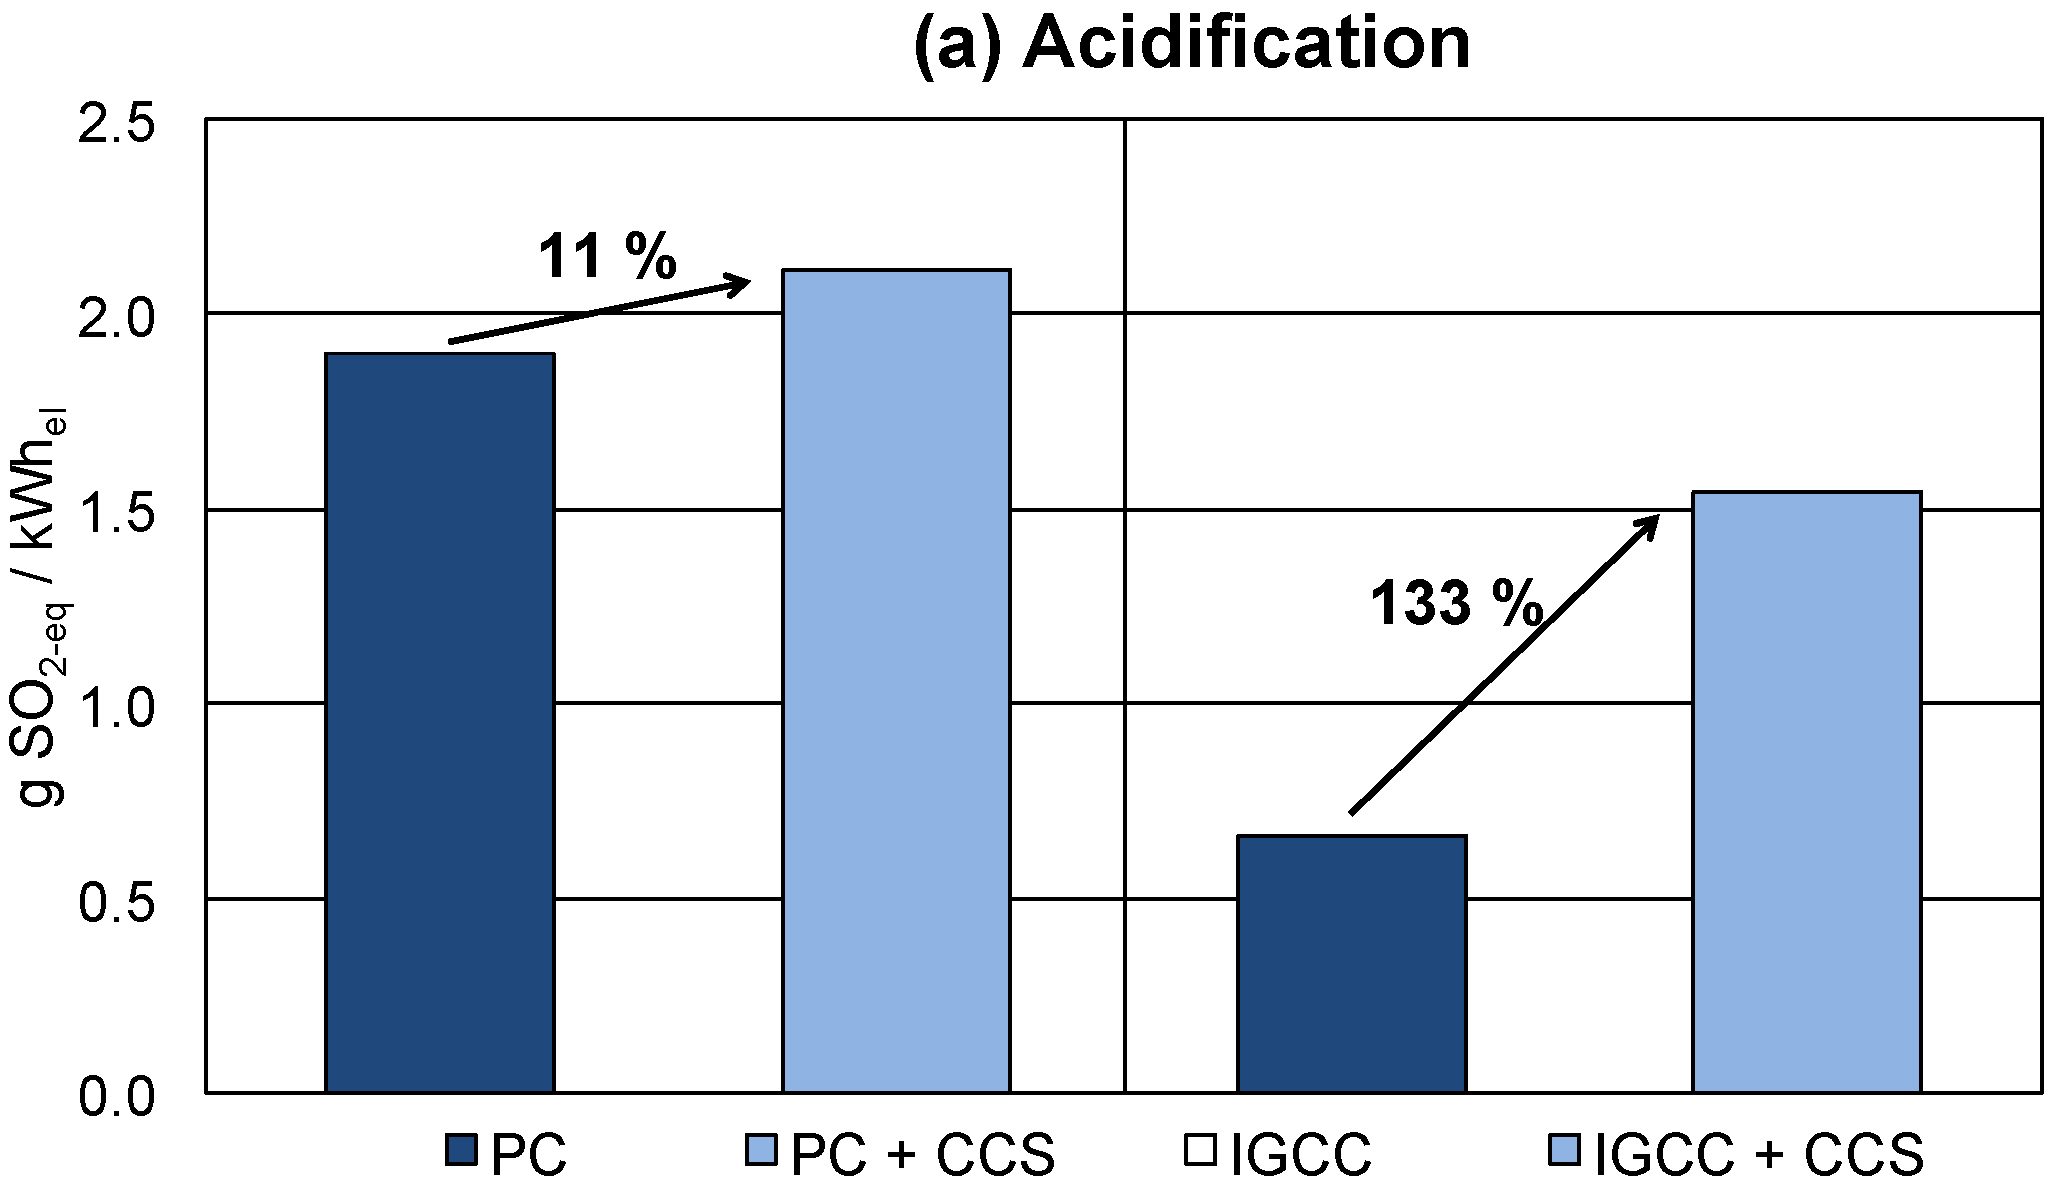
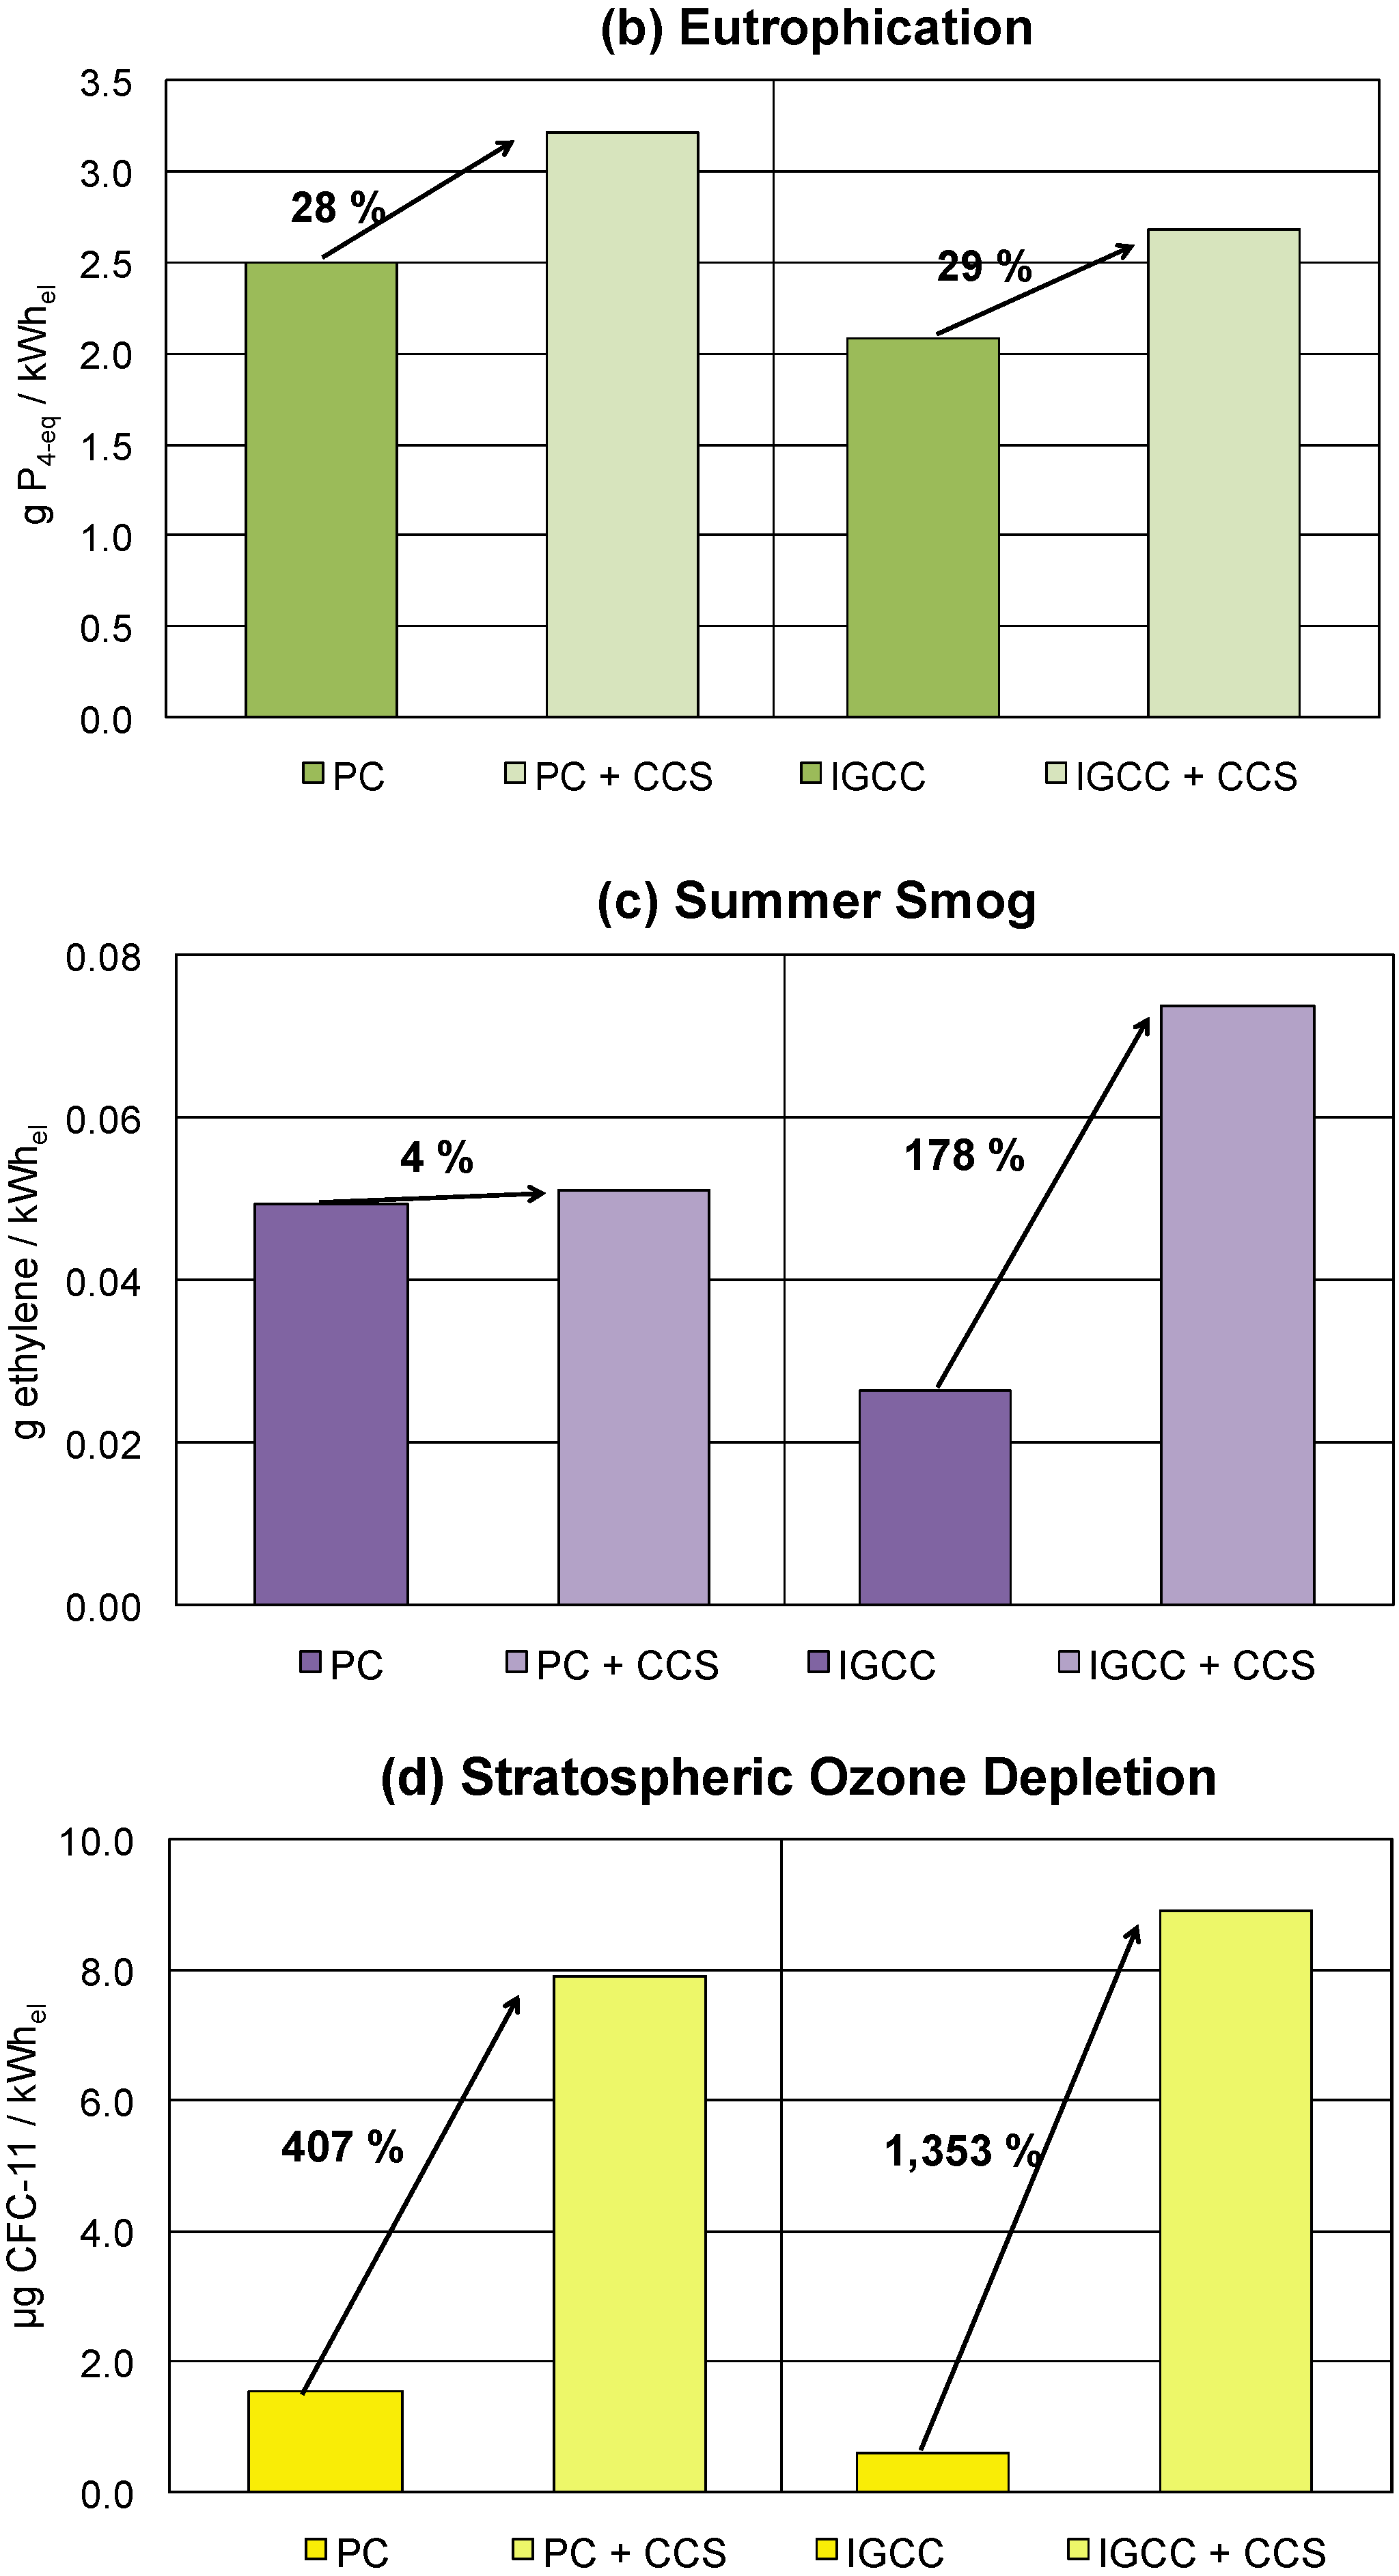
3.4. Environmental Impacts of CCS-Based Power Plants From a Life Cycle Assessment Perspective

The LCA presented here (based on [69]) refers to the year 2030 and has been performed for supercritical PC power plants (post-combustion capture using the solvent monoethanolamine, MEA) as well as for IGCC power plants (pre-combustion capture using the solvent methyl diethanolamine, MDEA). It is assumed that the plants will use 100% indigenous coal. Saline aquifers without any leakage of CO2 are assumed to be the storage medium; the average transportation distance has been set to 550 km, requiring two pipeline recompression stations. As in the analysis previously performed for India and China [1,2], most of the basic LCA datasets (mining, transport, generation, etc.) are taken from the ecoinvent 2.2 international LCA database and adapted to the conditions under study (for example, the transportation distance of CO2, the calorific value of coal, etc.). Efficiencies and efficiency losses in the year 2030 are taken from Table 3. A CO2 separation rate of 90% has been assumed. Referring to the special situation in South Africa, coal mine methane (CMM) emissions have been included at 0.0012 kg CH4/kg coal, as given in the ecoinvent “Hard coal, at mine [ZA]” dataset. Depending on the calorific value and the power plant’s efficiency, CMM therefore cause additional GHG emissions of 12 to 15 g CO2-eq/kWhel (for all details see Table S8 in the supplementary information).
The GHG emissions (impact category “global-warming potential”, GWP) of PC and IGCC in the year 2030 result in 883 and 770 g CO2-eq/kWhel, respectively. Including CCS, they decrease to 240 and 250 g CO2-eq/kWhel, respectively (Figure 7). The resulting reduction rates of both CO2 (74% and 78%) and GHG (67% and 72%) emissions are lower than one would expect, when focusing on the CO2 separation rate of 90% only. This is due to the life cycle perspective. Focusing solely on the CO2 capture rate excludes [1,2]:
  • The excess consumption of fuels (energy penalty) required by the use of CCS technology. It causes more CO2 emissions, with the consequence that separated CO2 emissions are higher than avoided CO2 emissions;
  • The CO2 emissions released into the upstream and downstream parts of the system, which are the provision of additional fuel and further processes such as the production of solvents or the transportation and storage of CO2;
Other GHG emissions that are released in upstream and downstream processes, the most relevant of which is CMM.
Figure 7. Specific GWP and CO2 emissions (a) for supercritical PC and (b) for IGCC power plants with and without CCS in South Africa in 2030 from a life cycle perspective.
Energies 08 12432 g007
Figure 8 illustrates the contribution of individual life cycle phases to the net GHG reduction in the case of CCS.
Figure 8. Contribution of individual life cycle phases to the global warming potential for supercritical PC with and without CCS in South Africa in 2030.
Energies 08 12432 g008
In contrast to GHG emissions, all other environmental impact factors increase per kilowatt hour of electricity for both PC and IGCC (from the impact categories given in the CML 2001 applied method consideration was given here to acidification, eutrophication, stratospheric ozone depletion, summer smog, human toxicity, terrestrial ecotoxicity, and freshwater and marine aquatic ecotoxicity. Particulate matter formation is not provided by CML 2001). Figure 9 illustrates the results for the most commonly discussed categories.
Similar to the case of GHG emissions, two issues are responsible for these results [1,2]: first, the energy penalty leads to higher emissions per unit of electricity generation at the power plant itself. Only CO2, NOx, SO2, HCl and PM (particulates) can be removed during the CO2 scrubbing process. Second, upstream and downstream processes cause an increase in several emissions. The net result depends on the extent to which the decrease in emissions at the power plant’s stack is outweighed by an increase in upstream and downstream processes.
With regard to the CCS-induced relative change in performance of emissions, in most cases PC power plants outperform IGCC power plants, as already observed in the previous analyses for India and China [1,2]. The larger increase in the case of IGCC plants depends on the emissions released during upstream and downstream processes, which cannot be balanced by decreasing direct emissions. However, the absolute values also need to be considered, which are usually lower or equal in IGCC power plants than in PC power plants. This is due to the greater efficiency of IGCC and the lower energy penalty for capture processes.
Figure 9. Results of selected non-GHG impact categories for PC and IGCC power plants with and without CCS in South Africa in 2030 from a life cycle perspective (a) Acidification; (b) Eutrophication; (c) Summer smog; (d) Stratospheric ozone depletion.
Energies 08 12432 g009aEnergies 08 12432 g009b

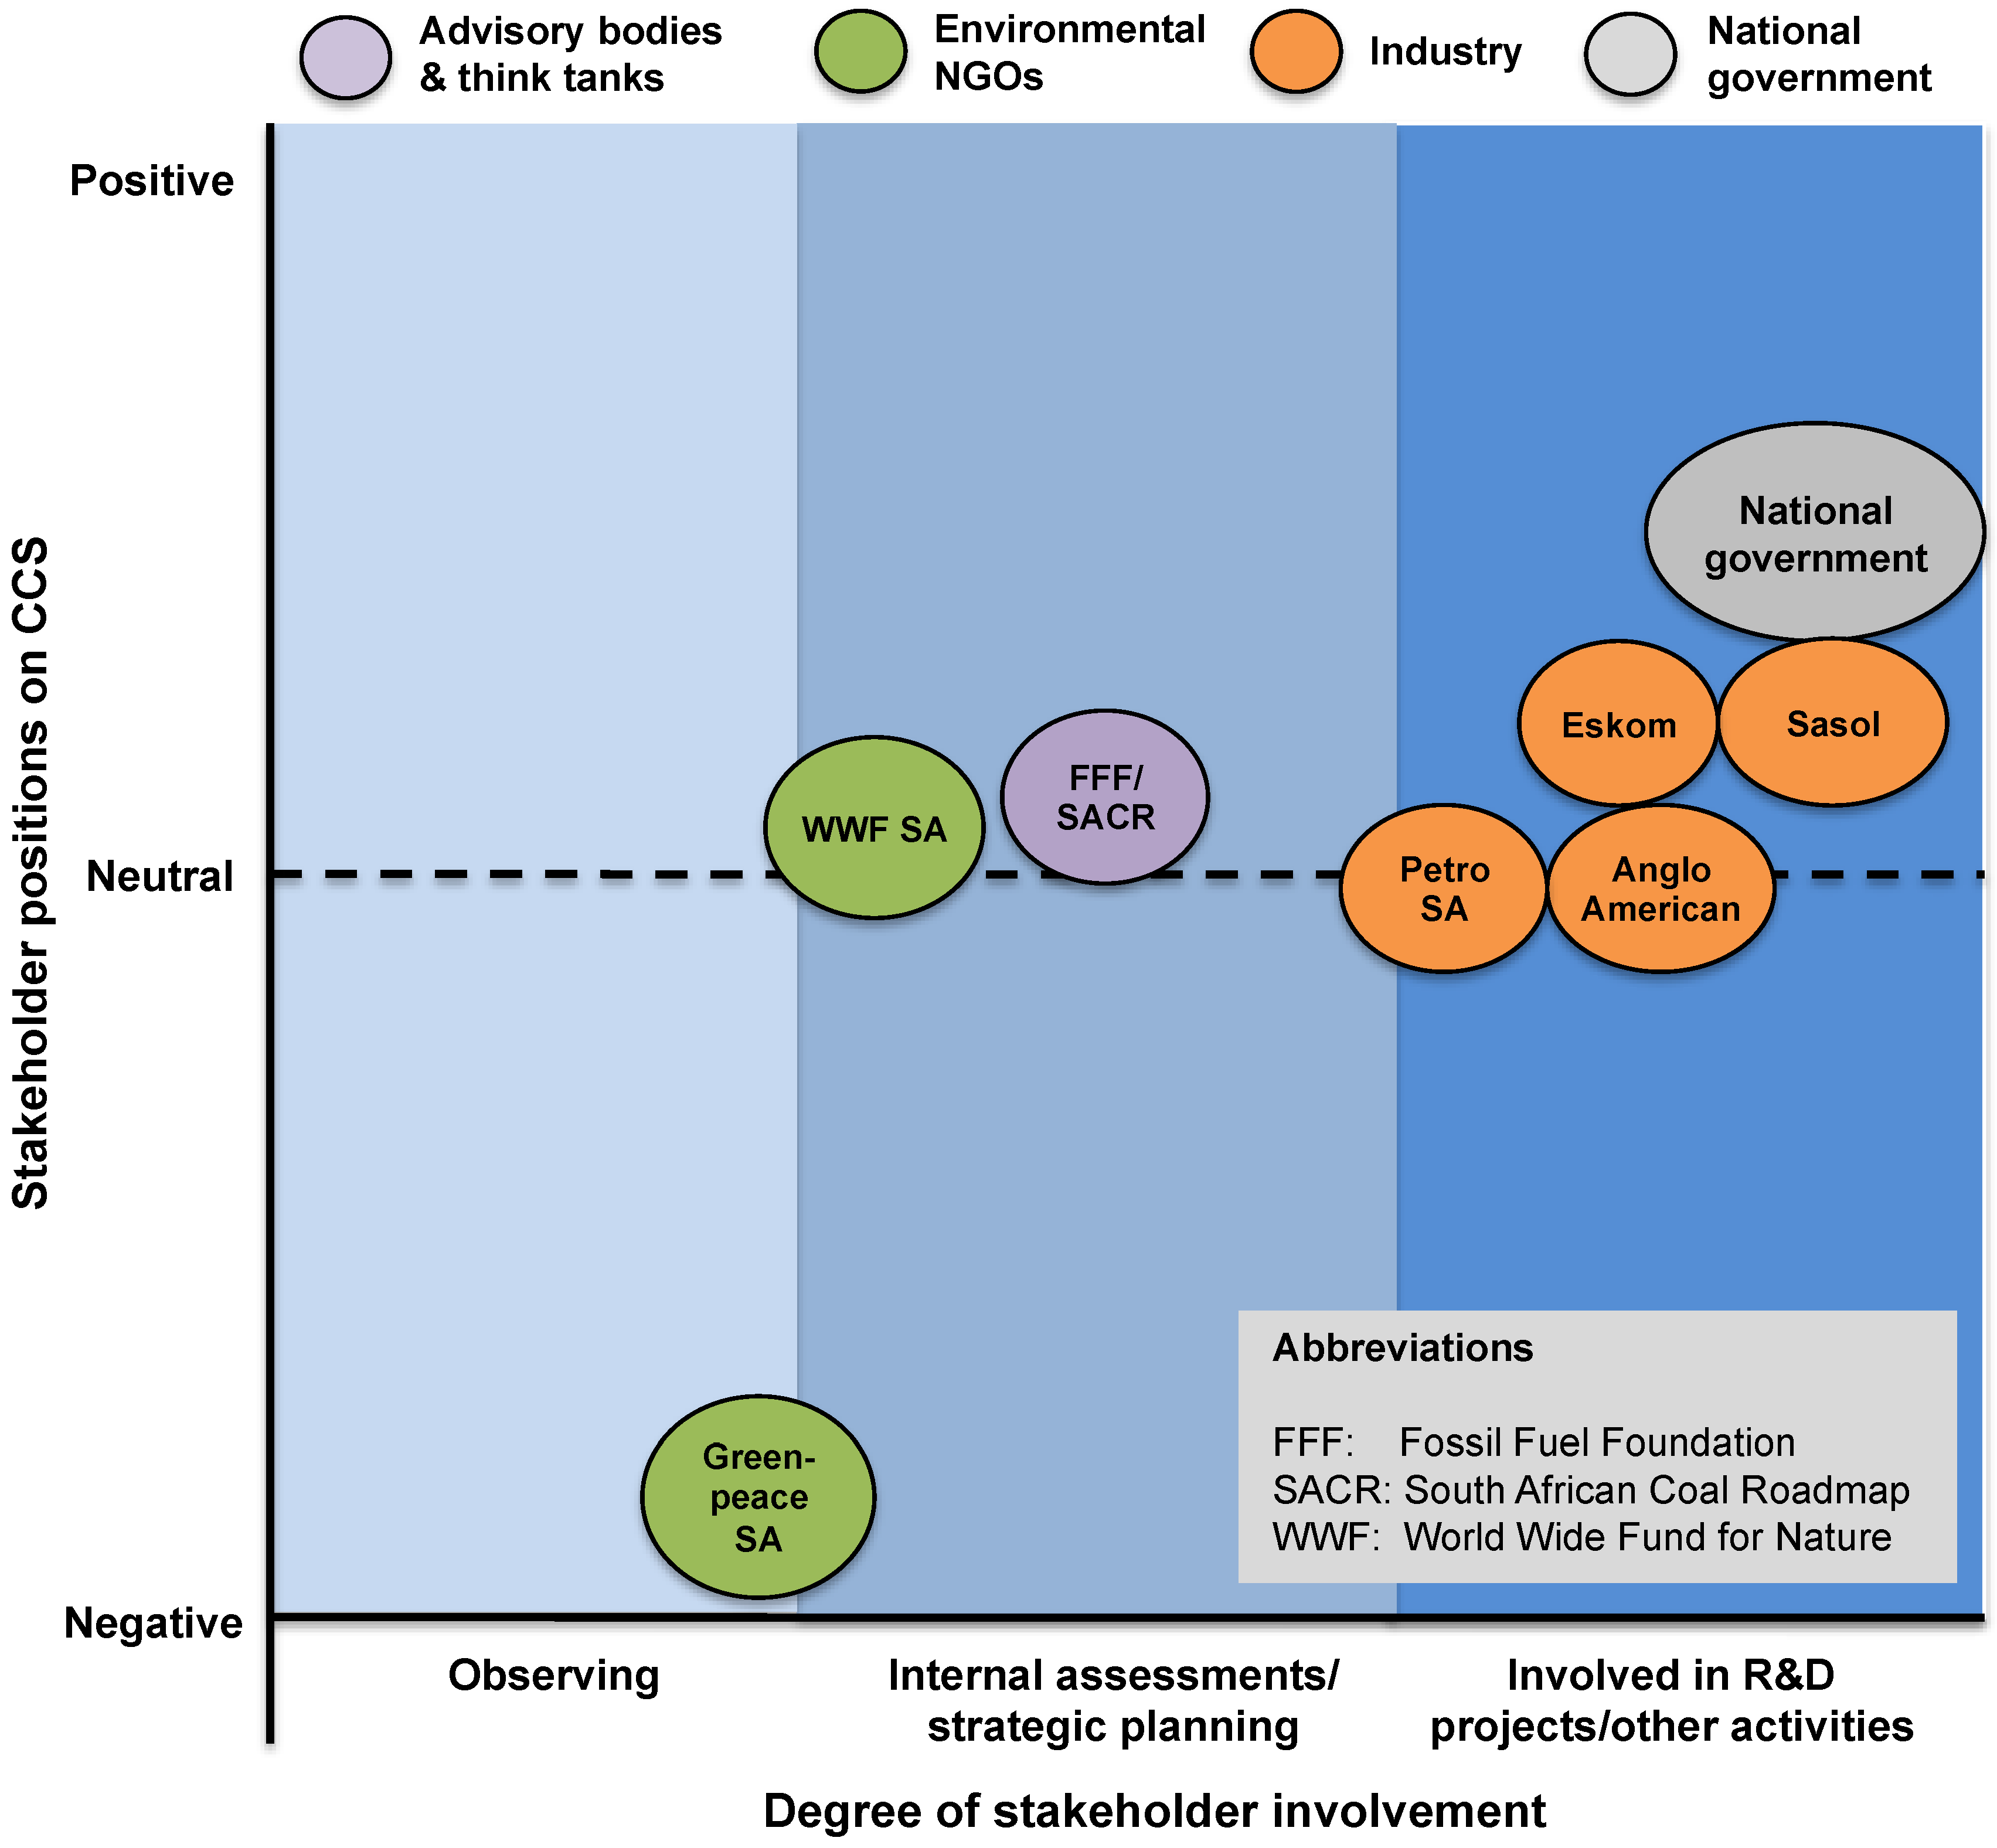
3.5. An Analysis of Stakeholder Positions

During the interviews conducted within this study, it became apparent that key stakeholders have taken important steps to develop and deploy CCS in South Africa. The South African government has published its Atlas on Geological Storage of CO2 in South Africa and established the SACCCS center. This means that South Africa possesses an institutional body that coordinates and oversees CCS-related research, development and public outreach activities [27]. SACCCS has developed a medium-term roadmap for large-scale implementation of the technology, which constitutes an important milestone towards a well-organized and structured technology development and deployment strategy. This body has a mandate to conduct the first CO2 underground storage project in South Africa—“The Test Injection Project”, which is scheduled to start operation in 2017 [70].
Furthermore, the South African government has chosen a proactive and ambitious strategy for fighting climate change and reducing carbon emissions. Its role as the host of the COP 17 in Durban in December 2011 functioned as a catalyst for this development, triggering the publication of the National Climate Change Response White Paper. In this paper, the government recognizes the potential that CCS has to become an important CO2 mitigation technology in South Africa for a short- to medium-term period. A CCS Flagship program was also announced in this White Paper [67]. However, the government also recognizes that CCS could potentially conflict with other policy objectives, such as affordable electricity, water conservation and efficiency improvements in electricity generation [12].
Besides these political framework conditions, South Africa’s coal-fired synthetic fuel industry is widely considered “low-hanging fruit” that could facilitate CCS implementation, as it regularly produces large streams of nearly pure CO2. Since CO2 capture is an integrated process component of CTL processes, Sasol, the operator of South Africa’s CTL plants, possesses expertise and experience in many elements of the CCS technology chain. Furthermore, Sasol has adopted an internal target of reducing its CO2 per tonne of product by 20% (compared to the 2005 baseline) by 2020 [30]. CCS is envisaged as one element of a broader GHG mitigation strategy of Sasol, which comes into play when energy efficiency potentials have been fully exploited [32]. Hence, several of the experts interviewed see Sasol’s CTL plants as the primary testing field for CCS technology [31,42,71], although the plants may be at the end of their lifetime or too old for retrofitting when CCS becomes available for large-scale use.
With regard to CO2 mitigation in the power sector, the General Director of the Department of Energy has also acknowledged the potential role of CCS in South Africa and the need to intensify CCS-related research and development efforts [72]. However, the IRP [26], as the government’s major strategic document for the future development of the power sector, implies that the mitigation of GHG emissions in this sector will mainly be achieved by expanding renewable and nuclear energy, while reducing the share of coal. South Africa’s national electricity utility, Eskom, also mentions CCS as one element of a larger portfolio of mitigation options, especially nuclear energy, renewables and energy efficiency [42]. However, CCS is perceived as a high-risk investment, which is partly due to the lack of proven storage solutions in South Africa as well as a lack of political and financial incentives [73]. Nonetheless, Eskom has gradually been building expertise and experience in designing power stations to be “capture-ready” [42].
Anglo American, South Africa’s largest coal producer and one of the world’s largest diversified mining groups, expects to be strongly exposed to potential future international and national climate policies. For this reason, it has developed a climate strategy itself. In addition, the company is involved in consortia and initiatives that foster the development and demonstration of CCS, such as SACCCS, the U.S.-based FutureGen alliance and the IEA Clean Coal Centre. Nonetheless, Anglo American expects the national CO2 mitigation of CCS to be limited, making up no more than 10% of South Africa’s total emission reduction in total [74].
South Africa’s national oil company, PetroSA, has not been as vocal as Eskom or Sasol about CCS. However, it did provide funding for the South African CO2 Storage Atlas to be compiled. It also supports SACCCS, implying that the company generally backs efforts to develop and demonstrate CCS. PetroSA could potentially play an important role for the technology’s deployment, as it possesses profound knowledge about South Africa’s oil and natural gas fields, which constitute potential storage sites. Furthermore, it operates a gas-to-liquid (GTL) plant at Mossel Bay, which could be equipped with carbon capture technology, although the concentration of the CO2 stream is lower than in Sasol’s CTL plants.
South African environmental NGOs tend to oppose CCS because it could lead to continuous coal combustion. Greenpeace Africa has clearly expressed its opposition to CCS, and promotes green energy initiatives instead [75]. WWF (World Wide Fund for Nature) South Africa believes that CCS, combined with biomass energy production, could be a long-term mitigation option, but generally opposes the further use of coal in South Africa for both power generation and fuel production [76].
However, the public debate on CCS is at a very early stage in South Africa. CCS is therefore not one of the top priorities of African environmental NGOs. This may, however, change in the course of executing the test injection project for underground CO2 storage. For example, a National and Local Stakeholder Engagement Plan (NatLoc-Plan) has been initiated to involve a broader range of stakeholders in the CCS debate, which involves a number of unique challenges due to South Africa’s multicultural population [27,77]. Figure 10 illustrates the constellation of actors in South Africa’s CCS discourse.
Figure 10. Constellation of key CCS stakeholders in South Africa.
Energies 08 12432 g010

4. Discussion

The previous sections indicated that—similar to the case of India and China [1,2]—successful implementation of CCS in South Africa is affected by a wide variety of aspects, even if CCS is only considered without assuming competition from other low-carbon technology options. Contemplating the findings from the five assessment dimensions, this paper draws the overall conclusion that several preconditions must be met if CCS is to play a future role in reducing CO2 emissions in South Africa.
First, the time of commercial availability of CCS in South Africa depends strongly on the successful implementation of CCS technology in industrialized countries. Previous studies do not seem to indicate that CCS in South Africa has been modeled in global studies up to this point. However, current global modeling studies do not expect CCS to be applied even in rapidly developing countries such as India or China before 2030 [78], which ties in with the findings of previous country analyses [1,2] undertaken by the authors of this study.
Next, one key requirement for the ability to develop a long-term CCS strategy for South Africa is the existence of a reliable storage capacity assessment for the country—this is a similar challenge for India and China [1,2]. The few existing publications on CCS in South Africa refer to literature sources that suggest a large effective storage capacity. In contrast, the analysis in this study reveals the high degree of uncertainty inherent in the existing storage capacity assessment. If very optimistic assumptions (efficiency factor of 10%) are applied, 22 Gt of CO2 could effectively be stored as a result of matching emissions with suitable sinks. If a cautious approach is taken (efficiency factor of 1%), this amount is reduced to 4 Gt of CO2. Both figures are based on a maximum CO2 transport distance of 600 km, because longer distances would significantly affect the cost balance and create infrastructural barriers. Even for storage efficiencies of 4 or 1%, however, the level of uncertainty would still be very high [31,54]. In practice, this potential will decrease further if technical, legal, economic, risk and acceptance barriers are included [1,2]. However, these issues cannot be included in this assessment until specific projects are launched.
Hence, in the future, more in-depth assessments of the country’s effective and matched storage potentials are required, as is already being undertaken for selected basins [13,15,16,17]. Based on such assessments, an optimization model could be applied [1,2] to identify cost-optimal sites for CCS power plants, taking into account the transportation costs of electricity, coal, the separated CO2 emissions and even cooling water. Since CCS is a water-intensive technology, it would put South Africa’s already scarce water resources under additional pressure and conflicts with the government’s target to save water [43,67]. A similar analysis could extend the perspective from power plants to CTL plants for which only a few analyses exist (for example [79]).
Independent from calculating the exact amount of storage potential, the question arises whether South Africa is adequately placed to deal with CO2 storage from a regulatory point of view, both for the pilot CO2 storage project [25] and in the long term. Various analyses [11,25] came to the conclusion that basin exploration and site characterization may be done under existing legislation. The injection itself would not be covered under the conditions of the current legal framework. SACCS is therefore cooperating with governmental bodies to set up adequate amendments or new legislation and regulation processes for the pilot project [25]. [80] came to similar conclusions and recommended putting in place “a dedicated CCS legal and regulatory regime” for future deployment of CCS.
A third point is that the economic assessment reveals significant barriers to reaching a sufficient level for the economic viability of CCS in South Africa under current conditions, even under the assumed CO2 price development. Although the latter would compensate for the cost penalty of CCS, it would be unlikely to suffice on its own in providing a strong and clear cost advantage of CCS plants over supercritical PC plants without CCS. Hence, a higher carbon price would be required in order to function as a clear economic driver for CCS deployment. Compared to India and China, India has the highest level of LCOE for coal-fired power generation with CCS, as it combines rather high capital costs with high fuel prices, whereas the LCOE in China is significantly lower than in India and South Africa, mainly due to cheaper labor and equipment costs [1,2]. South Africa’s capital costs are also comparatively high, but fuel prices are low. Nevertheless, since the proven recoverable coal reserves in South Africa were revised downwards by more than 50% in the early 2000s due to a reassessment [81,82], a high coal development pathway could lead to significant constraints and rising coal prices in the medium term, exacerbated by the increased consumption of coal in the event of CCS.
Fourth, the findings of the prospective LCA comply with results of earlier European studies by [1,2,83,84,85]. LCAs for USC and IGCC power plants in South Africa have been explored recently [14]. When their results for IGCCs are compared with the study presented here, taking into account the different time horizons (2040 versus 2030), their figures yield lower specific GHG emissions in the case of CCS (107 g CO2-eq/kWhel in 2040 compared to 250 g CO2-eq/kWhel in 2030) and a higher GHG reduction rate (84% in 2040 compared to 67.5% in 2030). The former can mainly be explained by the lower efficiencies assumed in this study; only air-cooled technology is used for new power plants in South Africa, which decreases the efficiency by 3 percentage points [42]. The latter is mainly caused by the assumption in this study that electricity for recompression and storage is generated by the same coal-fired power plants as modeled in this LCA, while [14] assume a high share of renewables in the 2040 electricity mix. As a result, the calculations in this study reveal considerably higher emissions released by the provision of coal.
Next, due to the additional primary energy demands of CCS, further environmental and social problems that were not included in the LCA would also be exacerbated [1,2]. In order to study the effects of coal mining—such as water consumption and water pollution, loss of agricultural and other ecosystem goods and services, and human health impacts—[50] assessed the external effects using the example of Kusile, one of two large power plants currently being built in South Africa. Such environmental impacts indicate a significant economic impact, leading to external costs ranging from between ZAR2010 31 billion and 61 billion (USD2011 4.2‒8.3 billion) per year, without considering the energy penalty of CCS. Compared to previous analyses of China and India undertaken by the same authors of this study [1,2], the net reduction rates of CO2 (78% and 74% for PC and IGCC, respectively) are virtually identical (77% and 75% in India and 75% and 75% in China), whereas the net reduction rates of total GHG emissions (72% and 67%) are close to those for India (74% and 71%) and considerably higher than those for China (60% and 59%). This is because CMM emissions are much higher in China than in India and South Africa.
Furthermore, there is little public awareness of CCS in South Africa. In fact, in contrast to Europe, public debate has not yet even started in South Africa. In order to involve different stakeholders, a National and Local Stakeholder Engagement Plan (NatLoc Plan) was implemented for the planned pilot CO2 storage project [27,77]. Key players have already taken important steps in terms of the research, development and policy of CCS. The South African government recognizes that CCS could become an important CO2 mitigation technology in South Africa, helping to resolve the conflict of seeking to meet rather ambitious climate targets while coal-based power generation continues to play a major role, as projected. However, the government considers CCS as one option out of a portfolio of mitigation technologies, and recognizes that CCS could potentially conflict with other important policy objectives, such as affordable electricity rates, reducing water usage and improving the efficiency of electricity generation in order to give the whole population access to electricity. According to [12], “the extent to which the use of CCS will promote or impede multiple interacting policy objectives” will decide whether CCS could become a viable low-carbon option, especially for South Africa.
Last but not least, similar to the case of China, a long-term roadmap for CCS in South Africa’s industry could refine the source-sink match presented in this analysis by including CO2 emissions from industry, at least from synthetic fuel production. However, it is not clear at present whether CTL plants or power plants would be the preferred “candidates” for a rollout of CCS. From an economic perspective, GHG abatement costs of CTL plants are considerably higher than those for power plants [14]. Most South African experts consider CTL to be an ideal opportunity for applying CCS, because carbon capture is an integrated process component delivering a highly concentrated CO2 stream. The annual capture of 22 Mt of CO2 from the large CTL Secunda plant is also the only CCS option considered in the LTMS scenarios [37]. In contrast, CTL has not yet been included in the CCS roadmap. Instead, Eskom was requested by the World Bank to design Kusile power plant to be “capture-ready”. Once it has been retrofitted with carbon capture, it will provide between 20 and 24 Mt of CO2 annually, which is in the same dimension as Secunda’s CO2 stream. Since Secunda may be decommissioned around 2030, CTL will only be an option for CCS if new CTL plants are erected. One example is retrofitting the Mafutha plant, which has been under discussion for many years and which would have half of Secunda’s capacity, providing 11 Mt of CO2. It could therefore make sense to combine the ideal opportunity of building a new CTL plant with setting up a CCS strategy for power plants to start rolling out CCS with Mafutha and Kusile, together delivering between 31 and 35 Mt of CO2 per year.

5. Conclusions

The results show that it is not currently possible to answer the research question fully, based on the data and expertise available at this time. One precondition for opting for CCS would be finding robust solutions to the hurdles highlighted above—this is a similar challenge for India and China [1,2]. In order to overcome the aforementioned barriers, experts and decision-makers from South Africa made it very clear in the interviews conducted during the course of this study that the industrialized world would need to make a stronger commitment in terms of technology demonstration, cooperation and transfer to developing countries and emerging economies. Currently, this is also emphasized by the South African government in its Intended Nationally Determined Contribution (INDC) submitted to the UNFCC secretary in the lead-up to the 2015 climate conference COP 21 [86].
Furthermore, it should be pointed out that major uncertainties remain concerning the results of the study at hand, especially the amount of coal-based CO2 emissions, the storage potential and the cost assessment. While the general variation of the level of separated CO2 emissions and of the storage potential is covered by considering energy scenarios, coal development pathways and storage scenarios, variation in some individual parameters may have a considerable impact on the final cost of CCS deployment. Insofar as this study identified the year of commercial availability and the PLF as the most relevant parameters for estimating separated CO2 emissions, it became reasonable to vary them by way of a sensitivity analysis. If the assumption that large-scale CCS projects may be possible from 2030 would turn out to be too optimistic, a later availability (2035 or 2040) would result in between 22% and 62% lower amounts of CO2 emissions being available for storage within the different coal-development pathways. Considering a PLF of 69% instead of a more optimistically posited 80% would decrease this range further to a reduction of CO2 emissions of between 33% and 67%. While fewer separated CO2 emissions would—on the one hand—mean lower pressure to find suitable storage sites, it would—on the other hand—increase the pressure for the government to enhance the efforts for CO2 reduction measures in other sectors. However, a considerably lower deployment of CCS technology would impact the rate of learning and therefore the assumed cost reduction; this in turn would result in higher LCOEs. Lower operation time would additionally directly increase LCOE according to Equation (1) and may strengthen the first effect. Therefore, one conclusion is that if CCS is envisaged as having a strong role in reducing carbon emissions in South Africa, all possible efforts should be made to ensure its rapid implementation.
However, it needs to be taken into account that CCS plants will face strong competition from other low-carbon technologies, especially renewable energy technologies [2], most of which have much higher learning rates than supercritical PC plants with CCS, and which perform better from an environmental perspective [21]. Therefore, the analysis presented here should be further expanded by including a similar integrated assessment of all possible technology options.
Such a comprehensive approach would also have to take into account that CCS could potentially conflict with meeting development targets such as reducing poverty and inequality, providing enabling electrification and increasing resilience to the impacts of climate change. The aim of pursuing multiple goals up to 2050 was explicitly stated by the South African government when it submitted its INDC to the UNFCC [86]. In this document, “economic and social development and poverty eradication” are stated as the “first and overriding priorities”, while “new accessible and affordable technologies” are requested for mitigation policy. Accordingly, in the INDC (which generally gives only vague hints on South Africa’s long-term GHG mitigation targets), CCS is explicitly considered only with regard to CTL. While USD 0.45 billion are requested to equip the CTL Secunda plant (see Section 4) with CCS, USD 3 billion per year are calculated for the Renewable Energy Independent Power Producer Procurement Program and USD 349 billion for “decarbonized electricity by 2050” [87]. This correlates with the limited role of CCS outlined in the LTMS scenarios [37]. How the future implementation of these measures is to be reached will depend on the implementation of policy instruments also announced in the INDC: a carbon tax, sector emission reduction targets and regulatory standards.
Another indication of South Africa’s future decarbonization policy may be seen in the recently published “deep decarbonization pathways” [87] that set a target of a “14 Gt CO2-eq cumulative energy sector carbon constraint” in 2050, while pursuing “credible and acceptable socio-economic development trajectories” in South Africa. According to this study, the main contribution will be provided by the power sector through completely phasing out coal-fueled power generation and setting up a renewables-based electricity market. If the concept proves to be feasible (which would have to be demonstrated by a detailed transformation roadmap), it would raise the bar for CCS considerably.

Supplementary Materials

The following are available online at www.mdpi.com/1996-1073/8/12/12432/s1.

Acknowledgments

This paper is based on the CCS global report [82], which was supported financially by the German Federal Ministry for the Environment, Nature Conservation and Nuclear Safety (grant no. 09.9022.6-001). We thank Prof. Rosemary Falcon (University of the Witwatersrand, South Africa) for her critical review of the underlying South Africa study as part of this report. Updated information has been included in this article. Furthermore, we thank Teresa Gehrs and Matthew Rees (LinguaConnect) for proofreading the manuscript and the anonymous reviewers for their valuable comments and suggestions. Finally, we acknowledge financial support by Wuppertal Institute for Climate, Environment and Energy within the funding program “Open Access Publishing”.

Author Contributions

The authors contributed to the article in the same way they performed the research in the underlying study. Peter Viebahn managed the overall writing process and wrote the introduction, the sub-sections on the commercial availability of CCS, the energy scenario analysis, the environmental impact assessment, and the conclusions. Samuel Höller wrote the sub-sections on the storage potential analysis and the source-sink matching. Daniel Vallentin wrote the economic assessment and the stakeholder analysis. All authors contributed to the methodological section and the discussion.

Conflicts of Interest

The authors declare no conflict of interest.

References

  1. Viebahn, P.; Vallentin, D.; Höller, S. Prospects of carbon capture and storage (CCS) in India’s power sector—An integrated assessment. Appl. Energy 2014, 117, 62–75. [Google Scholar] [CrossRef]
  2. Viebahn, P.; Vallentin, D.; Höller, S. Prospects of carbon capture and storage (CCS) in China’s Power Sector—An integrated assessment. Appl. Energy 2015, 157, 229–244. [Google Scholar] [CrossRef]
  3. International Energy Agency (IEA). Energy Technology Perspectives 2015: Mobilising Innovation to Accelerate Climate Action; International Energy Agency: Paris, France, 2015. [Google Scholar]
  4. Intergovernmental Panel on Climate Change (IPCC). Climate Change 2014. IPCC Fifth Assessment Report (AR5); Intergovernmental Panel on Climate Change: Geneva, Switzerland, 2014. [Google Scholar]
  5. Beyond Petroleum (BP). BP Statistical Review of World Energy; Beyond Petroleum: London, UK, 2014. [Google Scholar]
  6. City Research. The Unimaginable: Peak Coal in China; Citygroup Global Markets Inc.: New York, NY, USA, 2013. [Google Scholar]
  7. International Energy Agency (IEA). Energy Technology Perspectives 2010: Scenarios and Strategies to 2050; International Energy Agency: Paris, France, 2010. [Google Scholar]
  8. International Energy Agency (IEA). Power Generation from Coal: Ongoing Developments and Outlook; Information Paper; International Energy Agency: Paris, France, 2011. [Google Scholar]
  9. European Commission. Consultative Communication on The Future of Carbon Capture and Storage in Europe; COM(2013) 180 final; European Commission: Brussels, Belgium, 2013. [Google Scholar]
  10. Beck, B.; Surridge, T.; Liebenberg, J.; Gilder, A. The current status of CCS development in South Africa. Energy Procedia 2011, 4, 6157–6162. [Google Scholar] [CrossRef]
  11. Condor, J.; Unatrakarna, D.; Asghari, K.; Wilson, M. Current status of CCS Initiatives in the major emerging economies. Energy Procedia 2011, 4, 6125–6132. [Google Scholar] [CrossRef]
  12. Román, M. Carbon capture and storage in developing countries: A comparison of Brazil, South Africa and India. Global Environ Change 2011, 21, 391–401. [Google Scholar] [CrossRef]
  13. Vincent, C.J.; Hicks, N.; Arenstein, G.; Tippmann, R.; van der Spuy, D.; Viljoen, J.; Davids, S.; Roos, M.; Cloete, M.; Beck, B.; et al. The proposed CO2 test injection project in South Africa. Energy Procedia 2013, 37, 6489–6501. [Google Scholar] [CrossRef]
  14. Telsnig, T.; Tomaschek, J.; Özdemir, E.D.; Bruchof, D.; Fahl, U.; Eltrop, L. Assessment of selected CCS technologies in electricity and synthetic fuel production for CO2 mitigation in South Africa. Energy Policy 2013, 63, 168–180. [Google Scholar] [CrossRef]
  15. Hicks, N.; Davids, S.; Beck, B.; Green, A. Investigation of CO2 storage potential of the Durban Basin in South Africa. Energy Procedia 2014, 63, 5200–5210. [Google Scholar] [CrossRef]
  16. Chabangu, N.; Beck, B.; Hicks, N.; Viljoen, J.; Davids, S.; Cloete, M. The investigation of CO2 storage potential in the Algoa Basin in South Africa. Energy Procedia 2014, 63, 2800–2810. [Google Scholar] [CrossRef]
  17. Chabangu, N.; Beck, B.; Hicks, N.; Botha, G.; Viljoen, J.; Davids, S.; Cloete, M. The investigation of CO2 storage potential in the Zululand Basin in South Africa. Energy Procedia 2014, 63, 2789–2799. [Google Scholar] [CrossRef]
  18. Middleton, R.S.; Eccles, J.K. The complex future of CO2 capture and storage: Variable electricity generation and fossil fuel power. Appl. Energy 2013, 108, 66–73. [Google Scholar] [CrossRef]
  19. Bachu, S. Carbon dioxide storage capacity in uneconomic coal beds in Alberta, Canada: Methodology, potential and site identification. Int. J. Greenh. Gas Control 2007, 1, 374–385. [Google Scholar] [CrossRef]
  20. Guinée, J.B.; Gorrée, M.; Heijungs, R.; Huppes, G.; Kleijn, R.; de Koning, A.; van Oers, L.; Sleeswijk, A.; Suh, S.; de Haes, H.A.U.; et al. Handbook on Life Cycle Assessment: Operational Guide to the ISO Standards; Kluwer: Dordrecht, The Netherlands, 2002. [Google Scholar]
  21. Viebahn, P.; Vallentin, D.; Höller, S. Integrated assessment of carbon capture and storage (CCS) in the German power sector and comparison with the deployment of renewable energies. Appl. Energ. 2012, 97, 238–248. [Google Scholar] [CrossRef]
  22. von Hirschhausen, C.; Herold, J.; Oei, P.-Y. How a “low carbon” innovation can fail: Tales from a “lost decade” for carbon capture, transport, and sequestration (CCTS). Econ. Eenergy Environ. Policy 2012, 1, 115–123. [Google Scholar] [CrossRef]
  23. Chen, Q.; Rennings, K. Low carbon scenarios vs. clean coal scenarios in China: How to close the carbon gap? Appl. Mech. Mater. 2014, 556–562, 841–848. [Google Scholar] [CrossRef]
  24. Zhu, L.; Fan, Y. A real options—Based CCS investment evaluation model: Case study of China’s power generation sector. Appl. Energy 2011, 88, 4320–4333. [Google Scholar] [CrossRef]
  25. Government SA. National Development Plan 2030; Government of the Republic of South Africa: Pretoria, South Africa, 2014.
  26. Department of Energy. Electriciy Regulation Act No. 4 of 2006: Electricity regulations on the integrated resource plan 2010–2030; Ministry of Energy, Government of South Africa: Pretoria, South Africa, 2011.
  27. Beck, B. An update on the South African pilot CO2 storage project. Energy Procedia 2014, 63, 6188–6193. [Google Scholar] [CrossRef]
  28. Cloete, M. Atlas on Geological Storage of Carbon Dioxide in South Africa; Council for Geoscience South Africa: Pretoria, South Africa, 2010. [Google Scholar]
  29. Viljoen, J.H.A.; Stapelberg, F.D.J.; Cloete, M. Technical Report on the Geological Storage of Carbon Dioxide in South Africa; Council for Geoscience South Africa: Pretoria, South Africa, 2010. [Google Scholar]
  30. Viljoen, J.; Stapelberg, F.D.J.; Cloete, M. The atlas on geological storage of CO2 in South Africa. In Proceedings of the 2nd South African CCS Week, Johannesburg, South Africa, 2011.
  31. South African Centre for Carbon Capture and Storage (SACCCS). Transcript of two interviews with representatives. In Proceedings of The South African Centre for Carbon Capture and Storage, Johannesburg, South Africa, 24–25 October 2011.
  32. Sasol. Transcript of an interview with Two Representatives of Sasol; Sasol: Johannesburg, South Africa, 24 October 2011. [Google Scholar]
  33. Li, X.; Fang, Z. Current status and technical challenges of CO2 storage in coal seams and enhanced coal bed methane recovery: An overview. Int J. Coal Sci. Technol. 2014, 1, 93–102. [Google Scholar] [CrossRef]
  34. Kulichenko, N.; Ereira, E. Carbon Capture and Storage in Developing Countries: A Perspective on Barriers to Development; Energy and Mining Sector Board Discussion Paper, Report 25; The World Bank: Washington, DC, USA, 2011. [Google Scholar]
  35. European Renewable Energy Council, Greenpeace International. Advanced Energy [R]evolution: A Sustainable Energy Outlook for South Africa; European Renewable Energy Council, Greenpeace International: Amsterdam, The Netherlands, 2011; p. 108. [Google Scholar]
  36. World Wide Fund for Nature (WWF). 50% by 2030. In Renewable Energy in a Just Transition to Sustainable Electricity Supply; WWF South Africa: Rosebank, South Africa, 2010. [Google Scholar]
  37. Scenario Building Team. Long-Term Mitigation Scenarios: Strategic Options for South Africa; Department of Environment Affairs and Tourism South Africa: Pretoria, South Africa, 2007. [Google Scholar]
  38. Energy Research Centre. Long-Term Mitigation Scenarios: Technical Appendix; Department of Environment Affairs and Tourism: Pretoria, South Africa, 2007.
  39. International Energy Agency (IEA). World Energy Outlook 2008; International Energy Agency: Paris, France, 2008. [Google Scholar]
  40. Tot, M.; Pesut, D.; Hudges, A.; Fedorski, C.; Merven, B.; Trikam, A.; Duerinck, J.; Ferket, H.; Lust, A. Techno-Economic Assessment of Carbon Capture and Storage Deployment in Power Stations in the Southern African and Balkan Regions; vito, Energelski institut Hrvoje Pozar, University of Cape Town: Cape Town, South Africa, 2011. [Google Scholar]
  41. International Energy Agency (IEA). World Energy Outlook 2014; International Energy Agency: Paris, France, 2014. [Google Scholar]
  42. Eskom. Transcript of an interview with a Representative of Eskom; Eskom: Johannesburg, South Africa, 27 October 2011. [Google Scholar]
  43. Hughes, A.; Haw, M.; Winkler, H.; Marquard, A.; Merven, B. Energy Emissions: A Modelling Input Into the Long Term Mitigation Scenarios Process; LTMS Input Report, Report 1; Energy Research Centre: Cape Town, South Africa, 2007. [Google Scholar]
  44. Minchener, A. Developments in China’s Coal-Fired Power Sector; CCC, Report 163; IEA Clean Coal Centre: London, UK, 2010. [Google Scholar]
  45. McKinsey. Carbon Capture and Storage: Assessing the Economics; McKinsey & Company: Summit, NJ, USA, 2008. [Google Scholar]
  46. Alstom. Zukunftsdialog: Kostenabschätzung Fossiler Kraftwerke Mit Und Ohne CCS-Ausrüstung (Alstom Future Dialog: Cost Estimation of Fossil Fired Power Plants with and without CCS); Alstom: Saint-Ouen, France, 2011. [Google Scholar]
  47. Rochedo, P.R.R.; Szklo, A. Designing learning curves for carbon capture based on chemical absorption according to the minimum work of separation. Appl. Energy 2013, 108, 383–391. [Google Scholar] [CrossRef]
  48. Kunze, C.; Spliethoff, H. Assessment of oxy-fuel, pre- and post-combustion-based carbon capture for future IGCC plants. Appl. Energy 2012, 94, 109–116. [Google Scholar] [CrossRef]
  49. Martelli, E.; Kreutz, T.; Carbo, M.; Consonni, S.; Jansen, D. Shell coal IGCCS with carbon capture: conventional gas quench vs. innovative configurations. Appl. Energy 2011, 88, 3978–3989. [Google Scholar] [CrossRef]
  50. Blignaut, J.; Koch, S.; Riekert, J.; Inglesi-Lotz, R.; Nkambule, N. The External Cost of Coal-Fired Power Generation: The Case of Kusile; Business Enterprises University of Pretoria: Hatfield, South Africa, 2011. [Google Scholar]
  51. Eskom. Fact Sheet Medupi Power Station; Eskom: Johannesburg, South Africa, 2012. [Google Scholar]
  52. Eskom. Status Report on Capacity Expansion Projects—New Build Programme; Eskom: Johannesburg, South Africa, 2011. [Google Scholar]
  53. Intergovernmental Panel on Climate Change (IPCC). Special report on carbon dioxide capture and storage. In Prepared by Working Group III of the Intergovernmental Panel on Climate Change; Metz, B., Davidson, O., de Coninck, H., Loos, M., Meyer, L., Eds.; Cambridge University Press: Cambridge, NY, USA, 2005. [Google Scholar]
  54. Council for Geoscience. Transcript of an interview with a Representative of the Council for Geoscience; Council for Geoscience: Johannesburg, South Africa, 28 October 2011. [Google Scholar]
  55. International Energy Agency, OECD Nuclear Energy Agency. Projected Costs of Generating Electricity; International Energy Agency, OECD Nuclear Energy Agency: Paris, France, 2010. [Google Scholar]
  56. Newbery, P.; Eberhard, A. South African Network Infrastructure Review: Electricity; University of Cape Town: Cambridge, Cape Town, South Africa, 2008. [Google Scholar]
  57. Finkenrath, M. Cost and Performance of Carbon Dioxide Capture from Power Generation; International Energy Agency: Paris, France, 2011. [Google Scholar]
  58. Massachusetts Institute of Technology. The Future of Coal: Options for a Carbon-Constrained World; Massachusetts Institute of Technology: Boston, MA, USA, 2007. [Google Scholar]
  59. Global CCS (Carbon Capture and Storage) Institute. Economic Assessment of Carbon Capture and Storage Technologies. Strategic Analysis of the Global Status of Carbon Capture and Storage; Global CCS Institute: Canberra, Australia, 2009. [Google Scholar]
  60. Viebahn, P.; Esken, A.; Höller, S.; Luhmann, H.-J.; Pietzner, K.; Vallentin, D. RECCS plus: Comparison of Renewable Energy Technologies (RE) with Carbon Dioxide Capture and Storage (CCS): German Federal Ministry for the Environment, Nature Conservation and Nuclear Safety; Wuppertal Inst. for Climate, Environment and Energy: Wuppertal, Germany, 2010; p. 306. [Google Scholar]
  61. IEAGHG. Estimating the Future Trends in the Cost of CO2 Capture Technologies; Report 6; International Energy Agency Greenhouse Gas R&D Programme: Cheltenham, UK, 2006. [Google Scholar]
  62. Eberhard, A. The Future of South African Coal: Market, Investment and Policy Challenges; Stanford University: Stanford, CA, USA, 2011. [Google Scholar]
  63. McCoy, S.T. The Economics of CO2 Transport by Pipeline and Storage in Saline Aquifers and Oil Reservoirs. Ph.D. Thesis, Carnegie Mellon University, Pittsburgh, PA, USA, 2008. [Google Scholar]
  64. Vidas, H.; Hugman, R.; Clapp, C. Analysis of geologic sequestration costs for the United States and implications for climate change mitigation. Energy Procedia 2009, 1, 4281–4288. [Google Scholar] [CrossRef]
  65. Zheng, B.; Xu, J. Carbon capture and storage development trends from a techno-paradigm perspective. Energies 2014, 7, 5221–5250. [Google Scholar] [CrossRef]
  66. The Carbon Report. The proposed South African carbon tax. How will the proposed carbon tax policy affect your business? Available online: http://www.thecarbonreport.co.za/the-proposed-south-african-carbon-tax/ (accessed on 17 July 2015).
  67. Government SA. National Climate Change Response White Paper; Government of the Republic of South Africa: Pretoria, South Africa, 2011.
  68. (Bundesministerium für Umwelt) BMU. Langfristszenarien Und Strategien Für Den Ausbau Erneuerbarer Energien in Deutschland: Leitszenario 2009 (Long-Term Scenarios and Strategies for the Deployment of Renewable Energies in Germany: Lead Scenario 2009); Umweltpolitik; Bundesministerium für Umwelt, Naturschutz und Reaktorsicherheit: Berlin, Germany, 2009; p. 105. [Google Scholar]
  69. Deibl, C. Life Cycle Assessment (LCA) of Future Coal-Fired Power Plants Based on Carbon Capture and Storage (CCS)—the Case of China, India and South Africa. Master Thesis, Technical University of Munich and Wuppertal, Wuppertal, Germany, November 2011. [Google Scholar]
  70. Munyai, N.; Beck, B.; Surridge, T.; van den Berg, T.; Motloung, D. On potential showstoppers for carbon capture and storage (CCS) in South Africa. Energy Procedia 2013, 37, 6458–6463. [Google Scholar] [CrossRef]
  71. Fossil Fuel Foundation. Transcript of an interview with a Representative of the Fossil Fuel Foundation; Fossil Fuel Foundation: Johannesburg, South Africa, 26 October 2011. [Google Scholar]
  72. Department of Energy (DOE). Speech of the General Director of the Department of Energy of the Republic of South Africa at the 2nd South African CCS Week; Department of Energy: Johannesburg, South Africa, 2011.
  73. MacColl, B. Carbon capture and storage: Strategic considerations for Eskom. In Proceedings of the 2nd South African CCS Week, Johannesburg, South Africa, 24–28 October 2011.
  74. Anglo American. Climate Change: A Real Strategy for a Real Future; Anglo American: Johannesburg, South Africa, 2011. [Google Scholar]
  75. Greenpeace. Greenpeace Africa Submission on the Draft National Climate Change Response Paper—February 2011; Greenpeace Africa: Johannesburg, South Africa, 2011. [Google Scholar]
  76. WWF South Africa. Carbon Budget. In An NGO Perspective on Carbon Capture and Storage by Richard Worthington; WWF South Africa: Johannesburg, South Africa, 2011. [Google Scholar]
  77. Modiko, P.; Ngcobo, W.; Tshivhase, T.; Raselavhe, R.; Surridge, T.; Beck, B. The unique challenges for CCS public engagement in South Africa. Energy Procedia 2014, 63, 7047–7052. [Google Scholar] [CrossRef]
  78. Ricci, O.; Selosse, S. Global and regional potential for bioelectricity with carbon capture and storage. Energy Policy 2013, 52, 689–698. [Google Scholar] [CrossRef]
  79. Kong, Y.; Dong, X.; Xu, B.; Li, R.; Yin, Q.; Song, C. EROI analysis for direct coal liquefaction without and with CCS: The case of the Shenhua DCL project in China. Energies 2015, 8, 786–807. [Google Scholar] [CrossRef]
  80. Glazewski, J.; Gilder, A.; Swanepoel, E. Carbon Capture and Storage (CCS): Towards a regulatory and legal regime in South Africa; Institute of Marine and Environmental Law (IMEL) and African Climate and Development Initiative (ACDI), University of Cape Town: Cape Town, South Africa, 2012. [Google Scholar]
  81. Beyond Petroleum (BP). BP Statistical Review of World Energy; Summary of Energy Statistics, Beyond Petroleum: London, UK, 2010. [Google Scholar]
  82. Viebahn, P.; Esken, A.; Höller, S.; Vallentin, D. CCS Global—Prospects of Carbon Capture and Storage Technologies (CCS) in Emerging Economies; Wuppertal Inst. for Climate, Environment and Energy: Wuppertal, Germany, 2012; p. 550. [Google Scholar]
  83. Viebahn, P. Life cycle assessment for power plants with CCS. In Efficient Carbon Capture for Coal Power Plants; Stolten, D., Scherer, V., Eds.; Wiley-VCH: Weinheim, Germany, 2011; pp. 83–109. [Google Scholar]
  84. Singh, B.; Strømman, A.H.; Hertwich, E.G. Comparative life cycle environmental assessment of CCS technologies. Int. J. Greenh. Gas Control 2011, 5, 911–921. [Google Scholar] [CrossRef]
  85. Schreiber, A.; Zapp, P.; Marx, J. Meta-analysis of life cycle assessment studies on electricity generation with carbon capture and storage. J. Ind. Ecol. 2012, 16, S155–S168. [Google Scholar] [CrossRef]
  86. United Nations Framework Convention on Climate Change (UNFCC). South Africa’s Intended Nationally Determined Contribution (INDC); United Nations Framework Convention on Climate Change: Bonn, Germany, 2015. [Google Scholar]
  87. Altieri, K.; Trollip, H.; Caetano, T.; Hughes, A.; Merven, B.; Winkler, H. Pathways to Deep Decarbonization in South Africa; Sustainable Solutions Network (SDSN), Institute for Sustainable Development and International Relations (IDDRI): Paris, France, 2015. [Google Scholar]

