1. Introduction
Heat pumps used to control temperature are generally driven by electricity (electric heat pump; EHP). Electricity used as the power source of an EHP is generated by an electric power station using fossil fuels or other energy sources, and the EHP converts the electricity to mechanical energy to drive the compressor. This process of fossil fuels to the heat pump has two major energy conversion losses and areas of low efficiency, especially in the heating process. Instead of electricity, a gas engine-driven heat pump (GHP) uses natural gas to operate the heat pump and drive the compressor. Generally, GHPs exhibit high energy conversion efficiency by directly converting the chemical energy of gaseous fuel into mechanical energy [
1,
2]. Furthermore, GHPs utilize heat from the cylinder jacket, used for space heating or water heating, and from the exhaust gas, along with the power from the natural-gas engine. [
2,
3] Unlike EHPs, which increase electricity usage significantly during the summer season due to air conditioning, GHPs use gaseous fuel to operate air conditioning systems and provide better energy savings [
4].
The gas engine for a GHP is fueled by liquefied natural gas (LNG) and power from a natural gas engine-driven compressor, which operates the air conditioning and heating system via liquefaction and evaporation of refrigerant. Since gas fuel is directly converted into mechanical power in a gas engine, the efficiency of a GHP is significantly affected by the efficiency of the natural gas engine. Thus, research on natural gas engines is important to GHP research.
Gas engine research is actively studied in the automobile field [
5,
6]. Unlike gas engines used for vehicles, operating condition of gas engine used for GHP is stable and has a transient zone due to change of environment [
4]. To operate engines in an economic zone, hybrid power and gas heat pumps are studied so that other energies are used to support gas engines and make engine operating condition constant [
7].
Since GHP uses an internal combustion engine, the emission from the gas engine is also important. An EGR system and a boost system are usually applied to diesel engines, especially for reduction of NOx. Normally, fuel is directly injected into the combustion chamber in a diesel engine boost system to increase the total mass of the intake air by increasing the intake pressure [
8,
9]. Such an increase in the total mass of the intake air would increase the thermal capacity of the gas in the cylinder. An EGR system increases the thermal capacity due to the exhaust gas, including carbon dioxide and ambient air. In the constant-fuel condition, the high thermal capacity keeps increases in the temperature in the cylinder low. These two strategies were applied in a natural gas engine to reduce NOx emission and study the effects of an EGR system and a boost system on engine performance and other emissions. The aim of the present research is to numerically study the combustion characteristics and the effects of an EGR system and a boost system on performance and NOx emission in a premixed natural gas engine.
2. Numerical Approach
In this research, the spark ignition model and combustion model are used to determine the flame surface in KIVA3V-Release2. CHEMKIN is coupled with KIVA3V-Release2 to calculate the chemical reaction. To calculate the composition of the EGR gas and the equivalence ratio for various intake pressures in the boost system, a pre-analysis was conducted using an EGR gas calculation and a boost system calculation. In a GHP engine, fuel and air are mixed at the mixer. We assumed that fuel and air mix homogeneously in the mixer and so a homogeneous mixture of air and fuel flow in the cylinder through the intake port. The gas mixture composition is determined based on the equivalence ratio, and the fuel in the cylinder at the IVC is affected by the equivalence ratio and the intake pressure. In the analysis process, the intake port was filled with a gas mixture, which then entered the intake port through the inlet boundary.
2.1. Chemical Mechanism
The GHP engine is fueled with LNG, which contains over 90% methane. The surrogate fuel was methane, and the methane reaction mechanism was used to calculate the chemical equilibrium in each cell by using CHEMKIN. The methane reaction mechanism is composed of a natural gas flame and the ignition mechanism of the Gas Research Institute (GRI), which consists of 52 species and 323 chemical reactions.
2.2. Spark Ignition Model—DPIK Model
The LNG engine is a spark ignition engine and flames of the spark ignition propagate from the spark plug position to an unburned region. To model a spark ignition engine, a combustion model that simulates flame propagation is needed. Fan and Reitz [
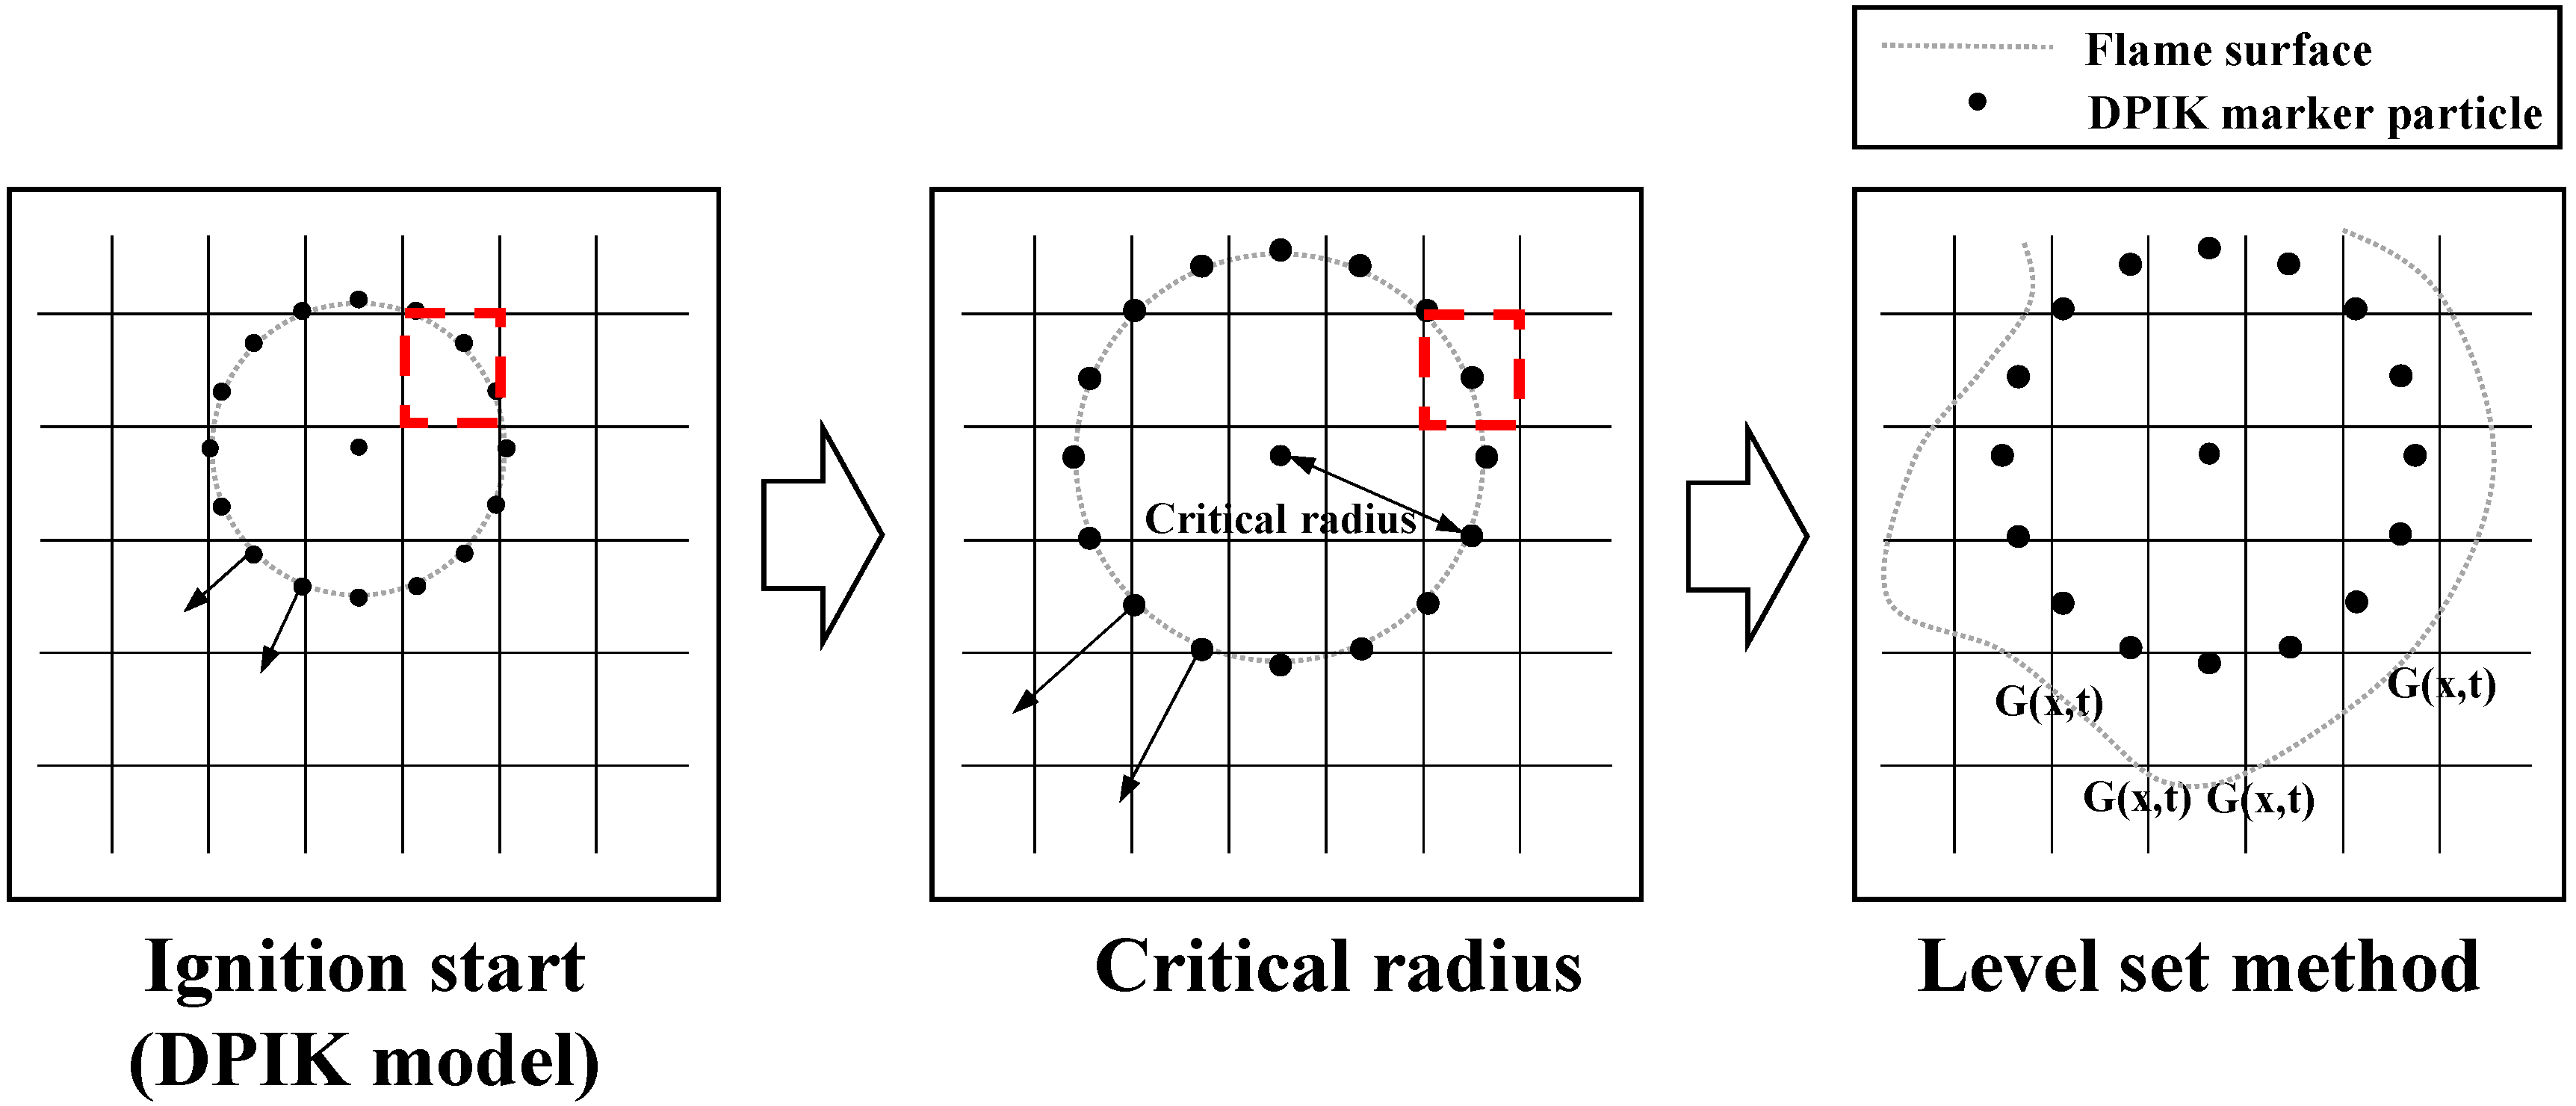
10] developed a spark ignition model using the DPIK model and the G-equation model to simulate spark ignition and combustion. The initial flame surface, called the kernel, is much smaller than the average grid size, which is approximately 3 mm, so the DPIK model was used as the spark ignition model. The DPIK model describes kernels as small particles. Particles are generated at the start of combustion and move in the normal direction of the initial flame surface in
Figure 1. Particle speed is the same speed as the kernel growth in Equation (1) [
11]. In the equation,
is the burned gas density and
is the local unburned gas density.
is the turbulent burning velocity and
is the velocity related to the ignition energy. The density of the particles in each cell represents the density of the flame surface. The velocity of the particles is determined by the laminar flame speed and the turbulence kinetic energy, and when particles reach a critical radius in Equation (2), which is proportional to the integral length scale from the initial position, the analysis model changes from the spark ignition model to the combustion model. In this model, owing to particles that determine the initial flame propagation, we can significantly reduce the grid dependency.
Figure 1.
Concept of DPIK model and level set method.
Figure 1.
Concept of DPIK model and level set method.
2.3. Combustion Model—Level Set Method
In a spark ignition engine, flame propagation is predicted by the combustion model, which is the level set method in this research [
12,
13]. The level set method finds the flame front based on the G(t,x) value, which is determined by solving Equation (3). The cells whose G values are 0 include the flame front and the region behind the frame front in the burnt region. The burnt region has a G value greater than 0, and we assume that all species in each cell reach chemical equilibrium in the burnt region. After the flame front is determined by using the G-equation, CHEMKIN calculates the chemical reaction in the cells that are inside the flame front. The level set method has the advantage that it decouples chemical reaction and turbulence flow.
2.4. EGR Gas Calculation
For reduction of the NOx emission, an exhaust gas recirculation (EGR) system is applied in which a gas mixture, including ambient air and exhaust gas from the exhaust port, enters the cylinder during the intake stroke. Because exhaust gas contains less oxygen, more carbon dioxide, and more water vapor than ambient air, the oxygen concentration decreases and the carbon dioxide concentration increases in the intake flow. Because the intake air is the initial input for the analysis, the changed intake air fraction due to the EGR needs to be calculated. The intake air mole fraction is determined by the intake port equivalence ratio and the EGR rate. In the cylinder at the IVC, a gas mixture, including EGR gas, fuel, ambient air and residual gas, exists in the combustion chamber, causing the user to assume the fuel is completely burned up.
Because other emission gas components, such as NOx and other hydrocarbons, are very small portions of the emission gas, the emission is considered to be a gas mixture of fuel, oxygen, nitrogen, carbon dioxide, and water vapor.
The amount of inflow mass is determined by the difference between the mole at the TDC and the mole at the IVC because the intake valve opens before the TDC and closes after the BDC. To find the mole at the TDC and the IVC, fluid was analysed until the intake valve closed, and the mole fraction and the total amount of moles at the IVC and the TDC were determined. The intake air mole is constant at constant intake pressure, and the mole fraction after the IVC is determined by the gas mixture composition in the intake port. This mole fraction calculation method was verified by applying it to several cases with different values of the equivalence ratio and EGR rate.
The initial residual gas and EGR gas are ambient air, and the total mass trapped inside the cylinder at the IVC is the sum of the masses of the residual gas, EGR gas, fuel, and ambient air:
The emission gas at the EVO is composed of carbon dioxide, water vapor, nitrogen, and oxygen. The carbon dioxide and water vapor increase because the product of combustion and oxygen decrease as represented in Equation (5), and nitrogen is the same quantity when IVC.
In Equation (5), and are the total oxygen and fuel masses, respectively, in the cylinder at the IVC, and is the oxygen and fuel mass ratio in the stoichiometric reaction. The mole fraction of the exhaust gas calculated for the first cycle would be the mole fraction of the residual gas and the EGR gas for the second cycle, and the second emission gas would be the residual gas and EGR gas at the next circulation cycle. If the emission gas has a margin of error below 0.1% of the previous emission gas, the value of the emission gas converges, and it is used as the residual gas and the EGR gas in the analysis process.
2.5. Boost System Calculation—Equivalence Ratio
In the boost system, compressed air enters the cylinder through the mixer where the fuel and compressed air mix. Air density in the intake port increases with the addition of the compressed air and, accordingly, the intake pressure, which is the pressure inside the intake port, increases. We assume the fuel mass flow rate is constant and the intake pressure is increased from 100 kPa to 125 kPa by the boost system. The amount of fuel in the cylinder at the IVC is controlled by the equivalence ratio in the intake port and the intake pressure. The boost system makes the intake pressure and the amount of fuel in the cylinder large when the equivalence ratio in the intake port is constant. Thus, to maintain a constant intake fuel mass for all of the cases, the equivalence ratio in the intake port should vary with changing intake pressure.
The first step is to determine the reference amount of fuel at an intake pressure of 100 kPa and an equivalence ratio of 0.9 in the intake port. Then, by performing pre-analysis during the intake process, the residual mole and intake mole are determined for each intake pressure. We assume that the reference amount of fuel inflows into the cylinder during the intake process, and the ambient air mole is determined from the intake mole and the fuel mole. The equivalence ratio in the intake port is calculated based on the reference fuel mole and the oxygen mole calculated from the ambient air mole.
3. Results and Discussion
3.1. Model Validation
GHP gas engine experimental data was used to validate the engine pressure of the natural gas engine analysis model for the motoring case and for the combustion case.
A schematic diagram of the experimental set up is in
Figure 2.
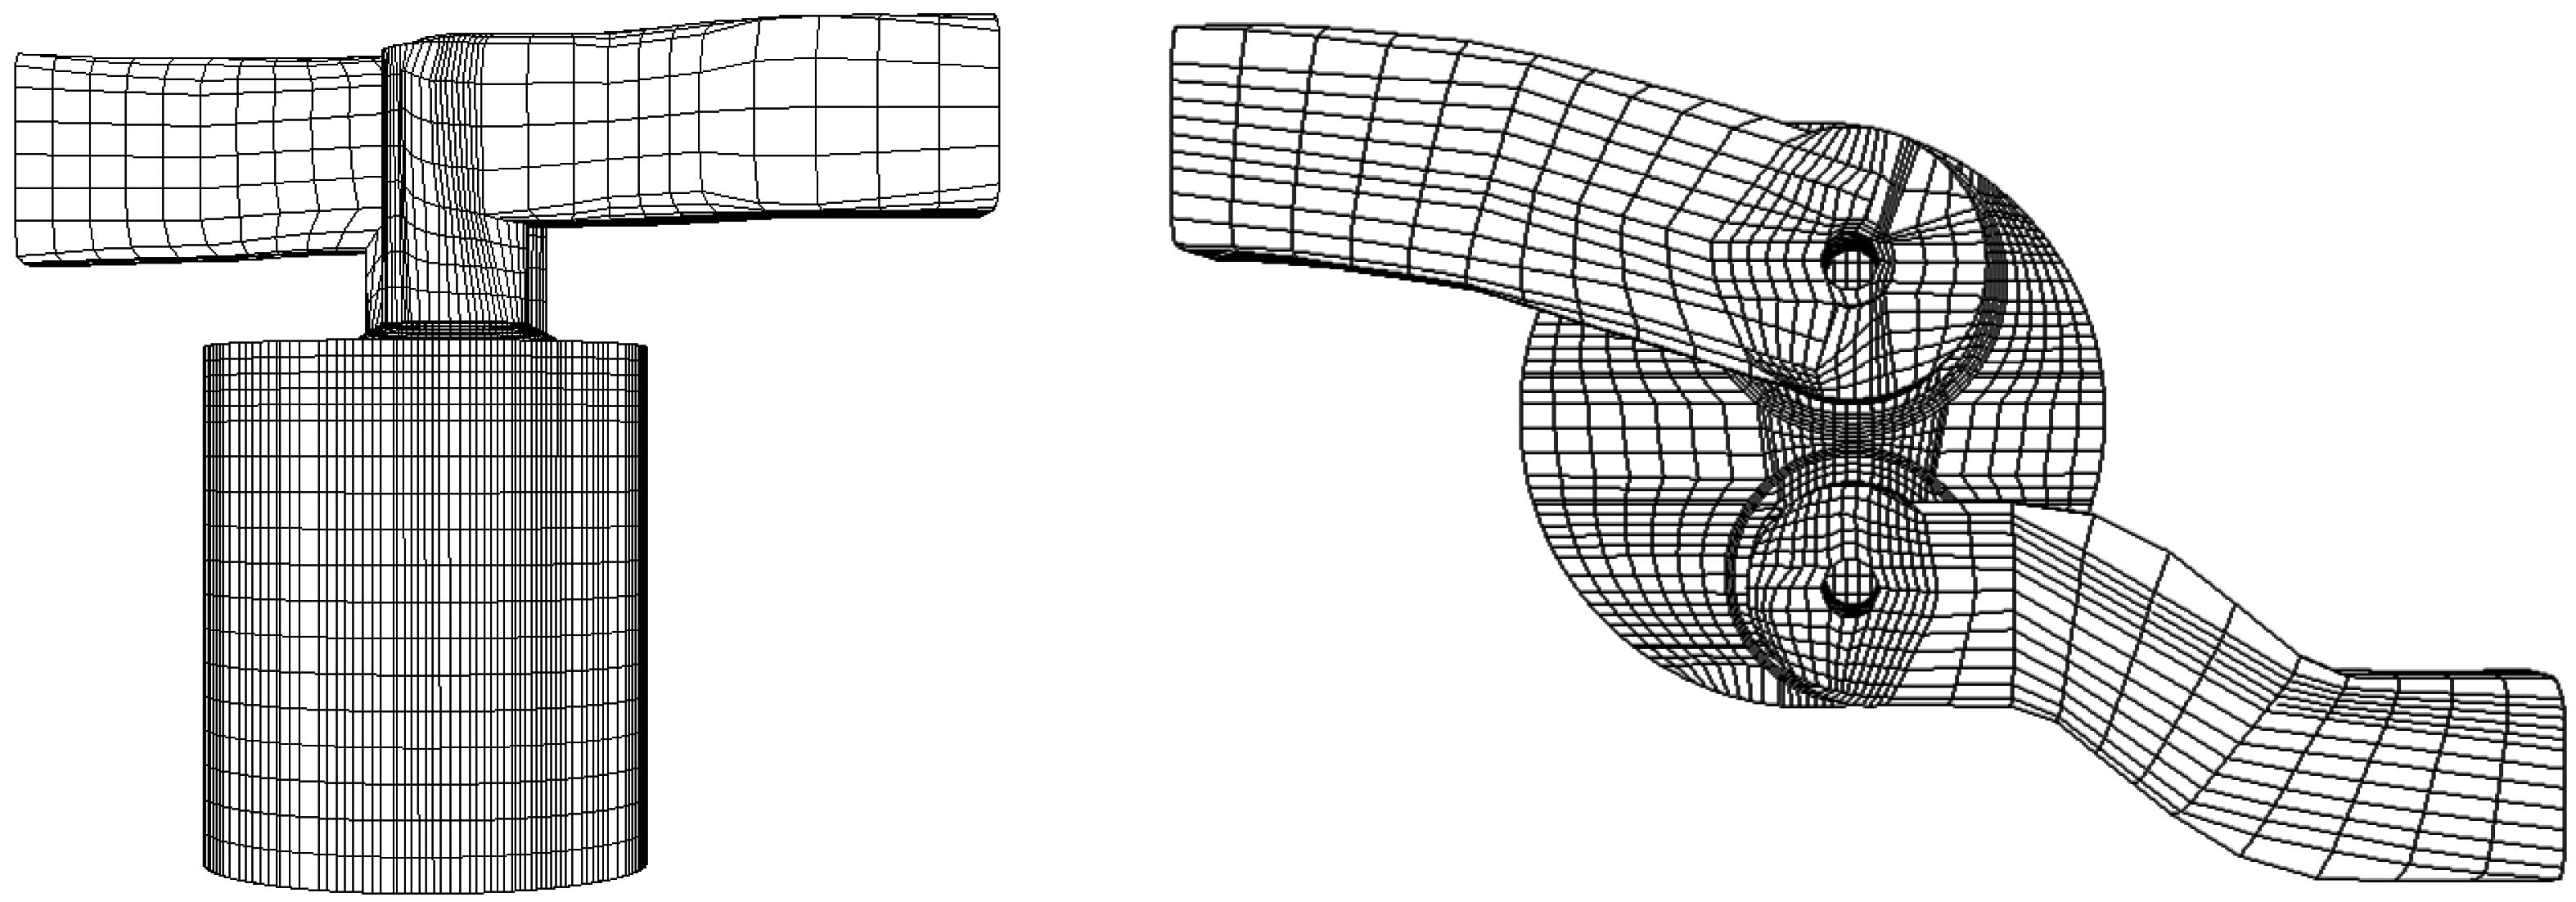
Figure 3 shows a computational grid that includes the intake and exhaust ports, using a bore of 88 mm and a stroke of 95 mm for the gas engine analysis.
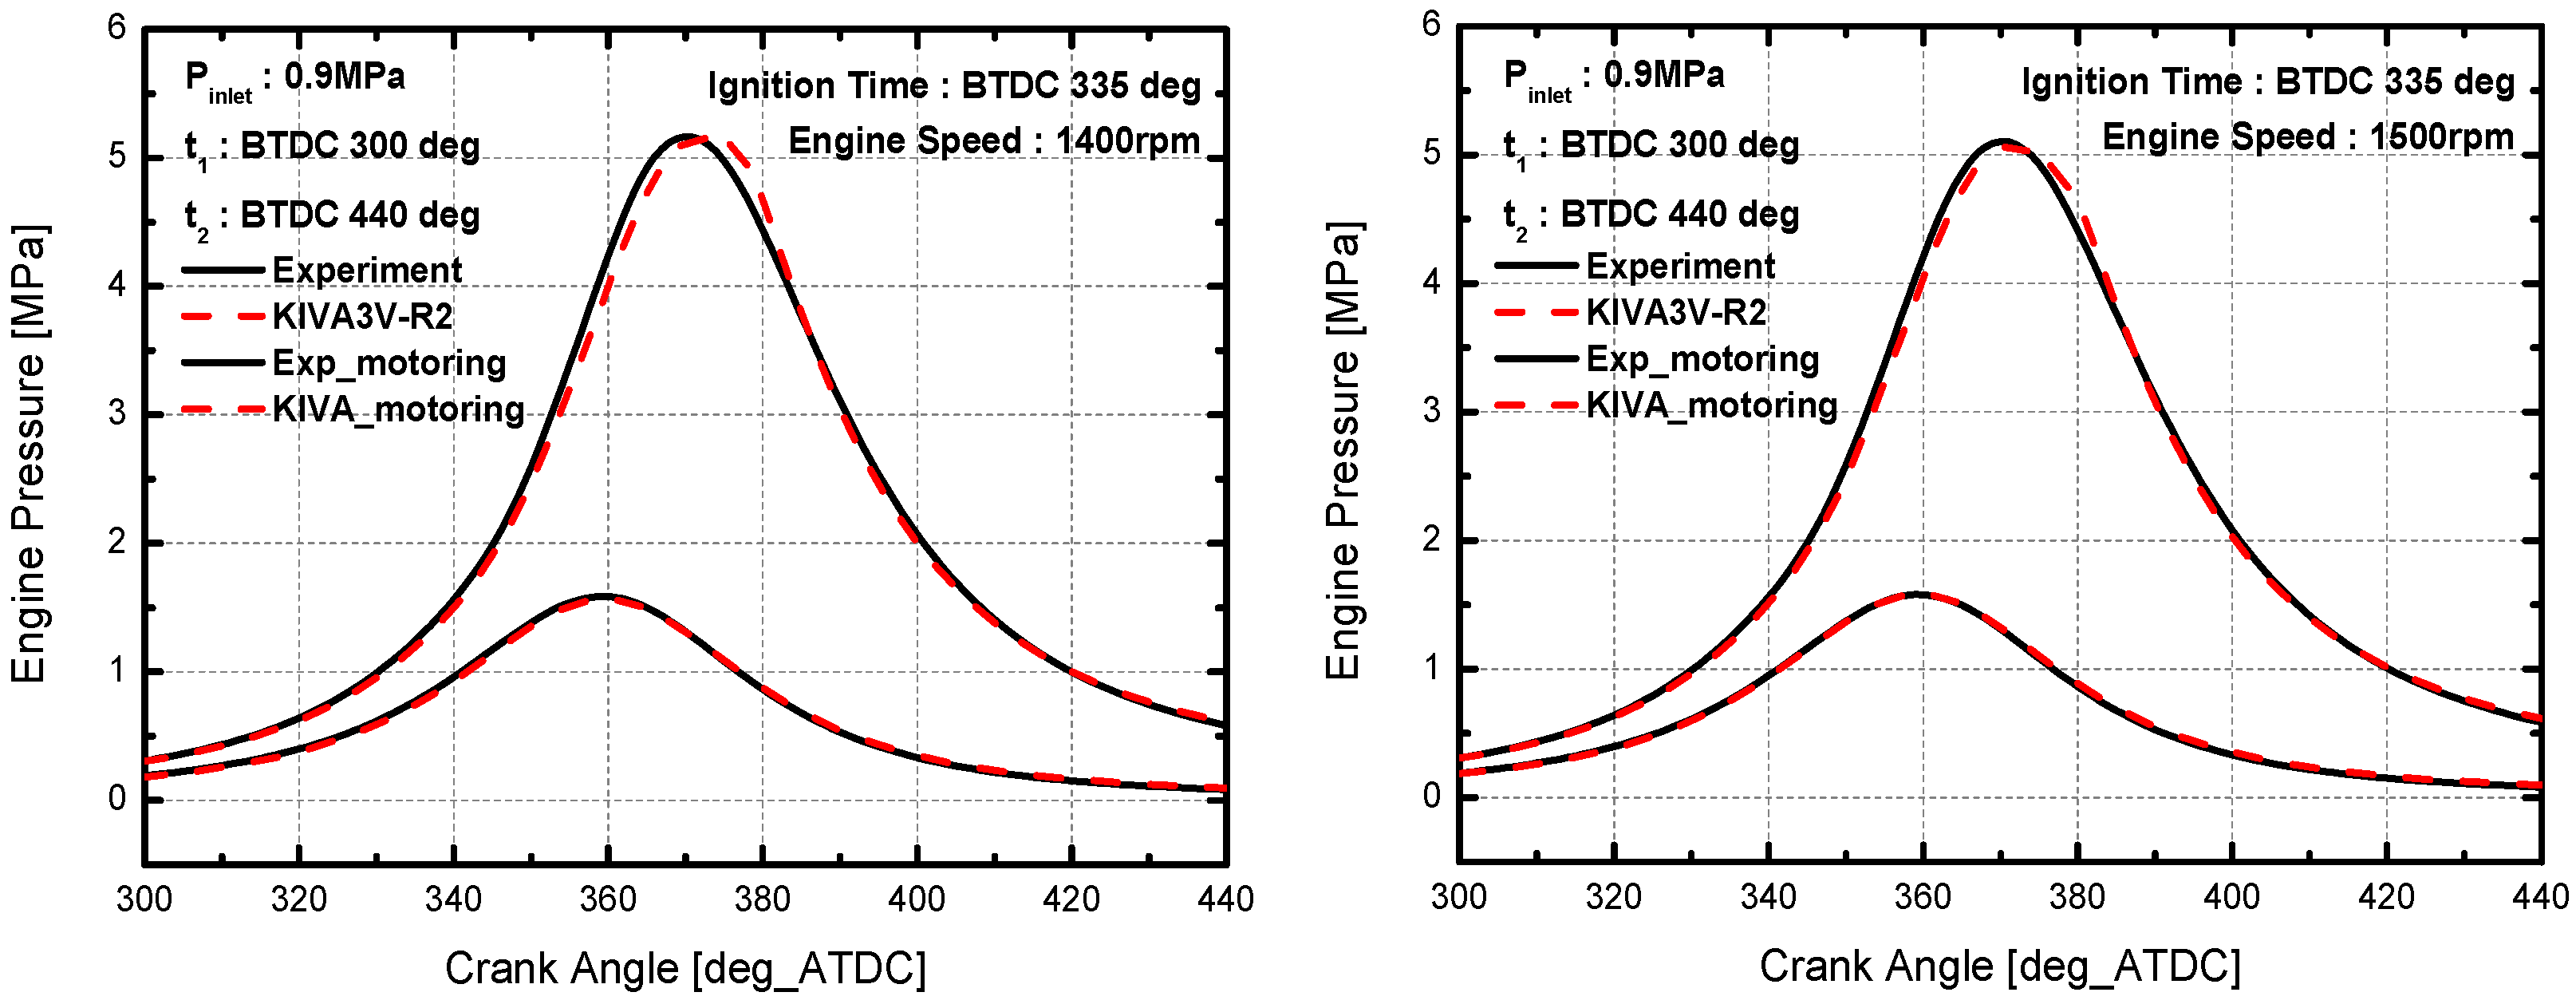
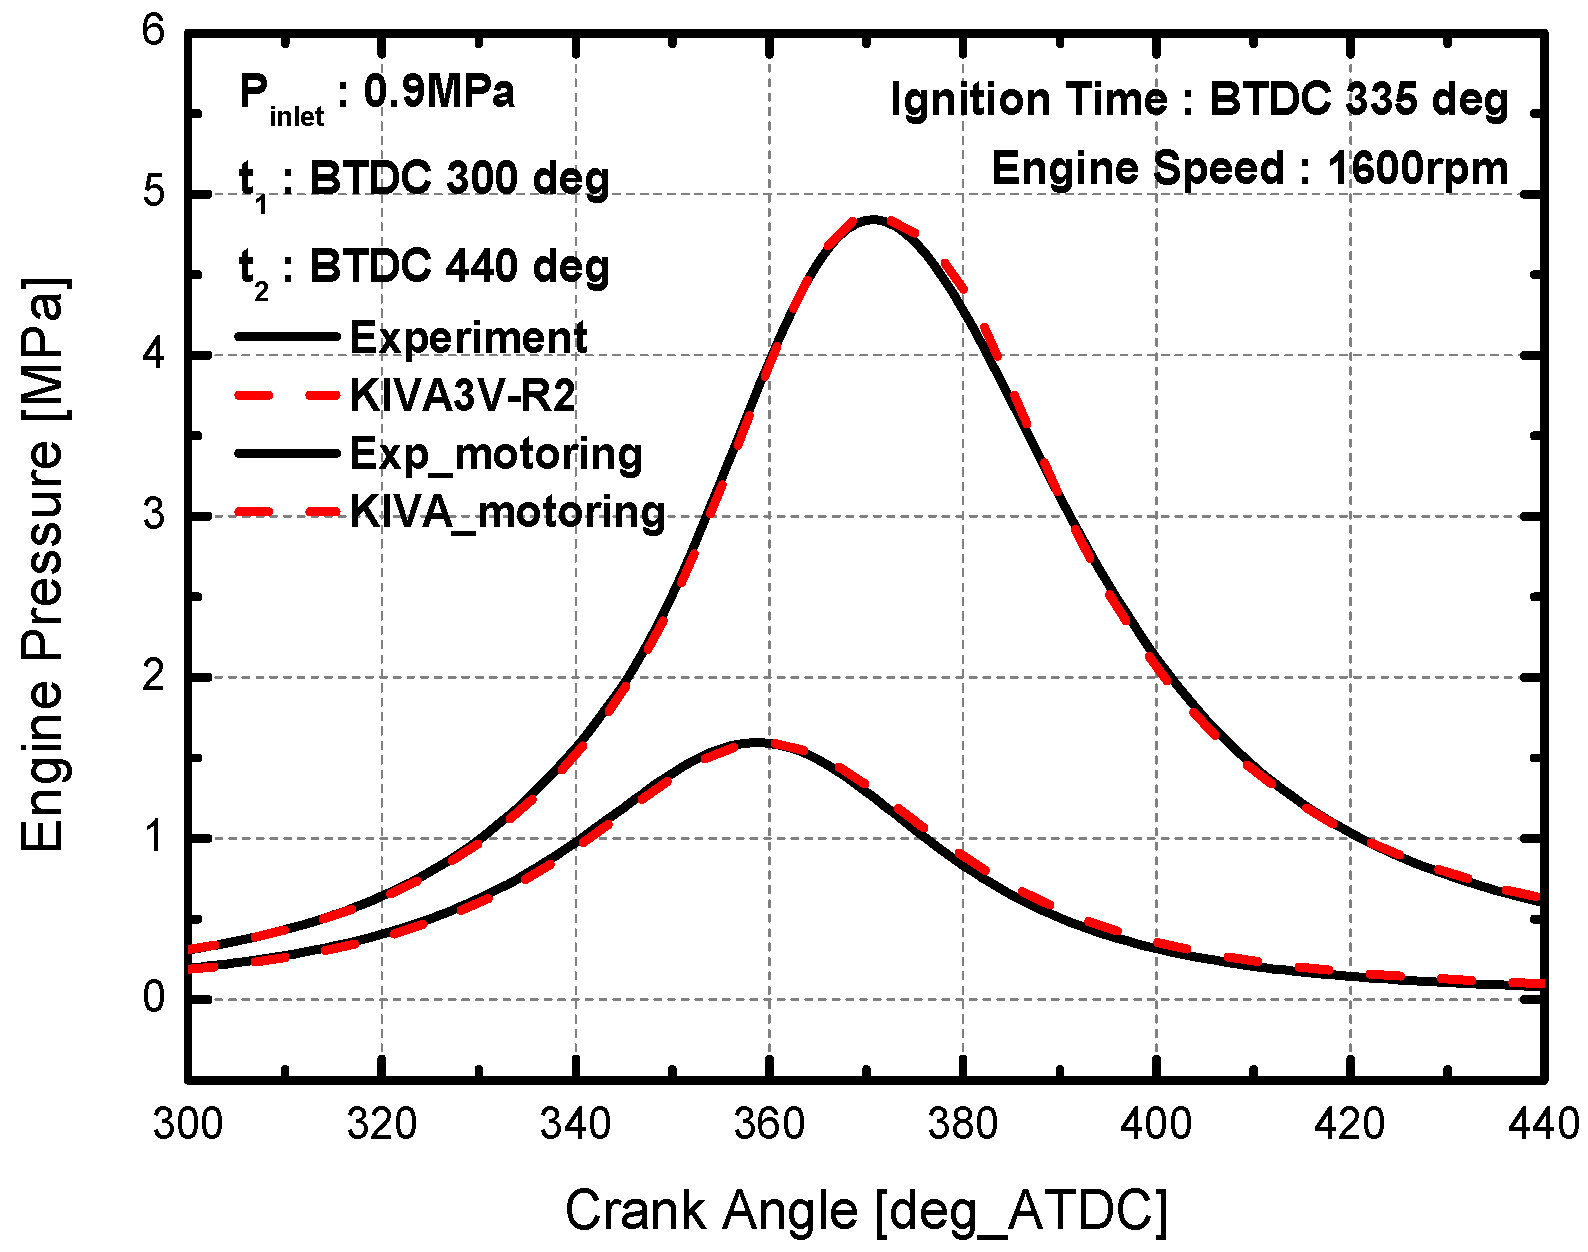
Figure 4 shows the validation results for the motoring case and the combustion case from 1400 rpm to 1600 rpm. The spark timing was ATDC −25 deg, and the intake pressure was 90 kPa. The engine pressures from the experiment and the simulation match well.
Figure 2.
Computational grid for analysis.
Figure 2.
Computational grid for analysis.
Figure 3.
Computational grid for analysis.
Figure 3.
Computational grid for analysis.
Figure 4.
Engine pressure validation results in combustion and motoring case.
Figure 4.
Engine pressure validation results in combustion and motoring case.
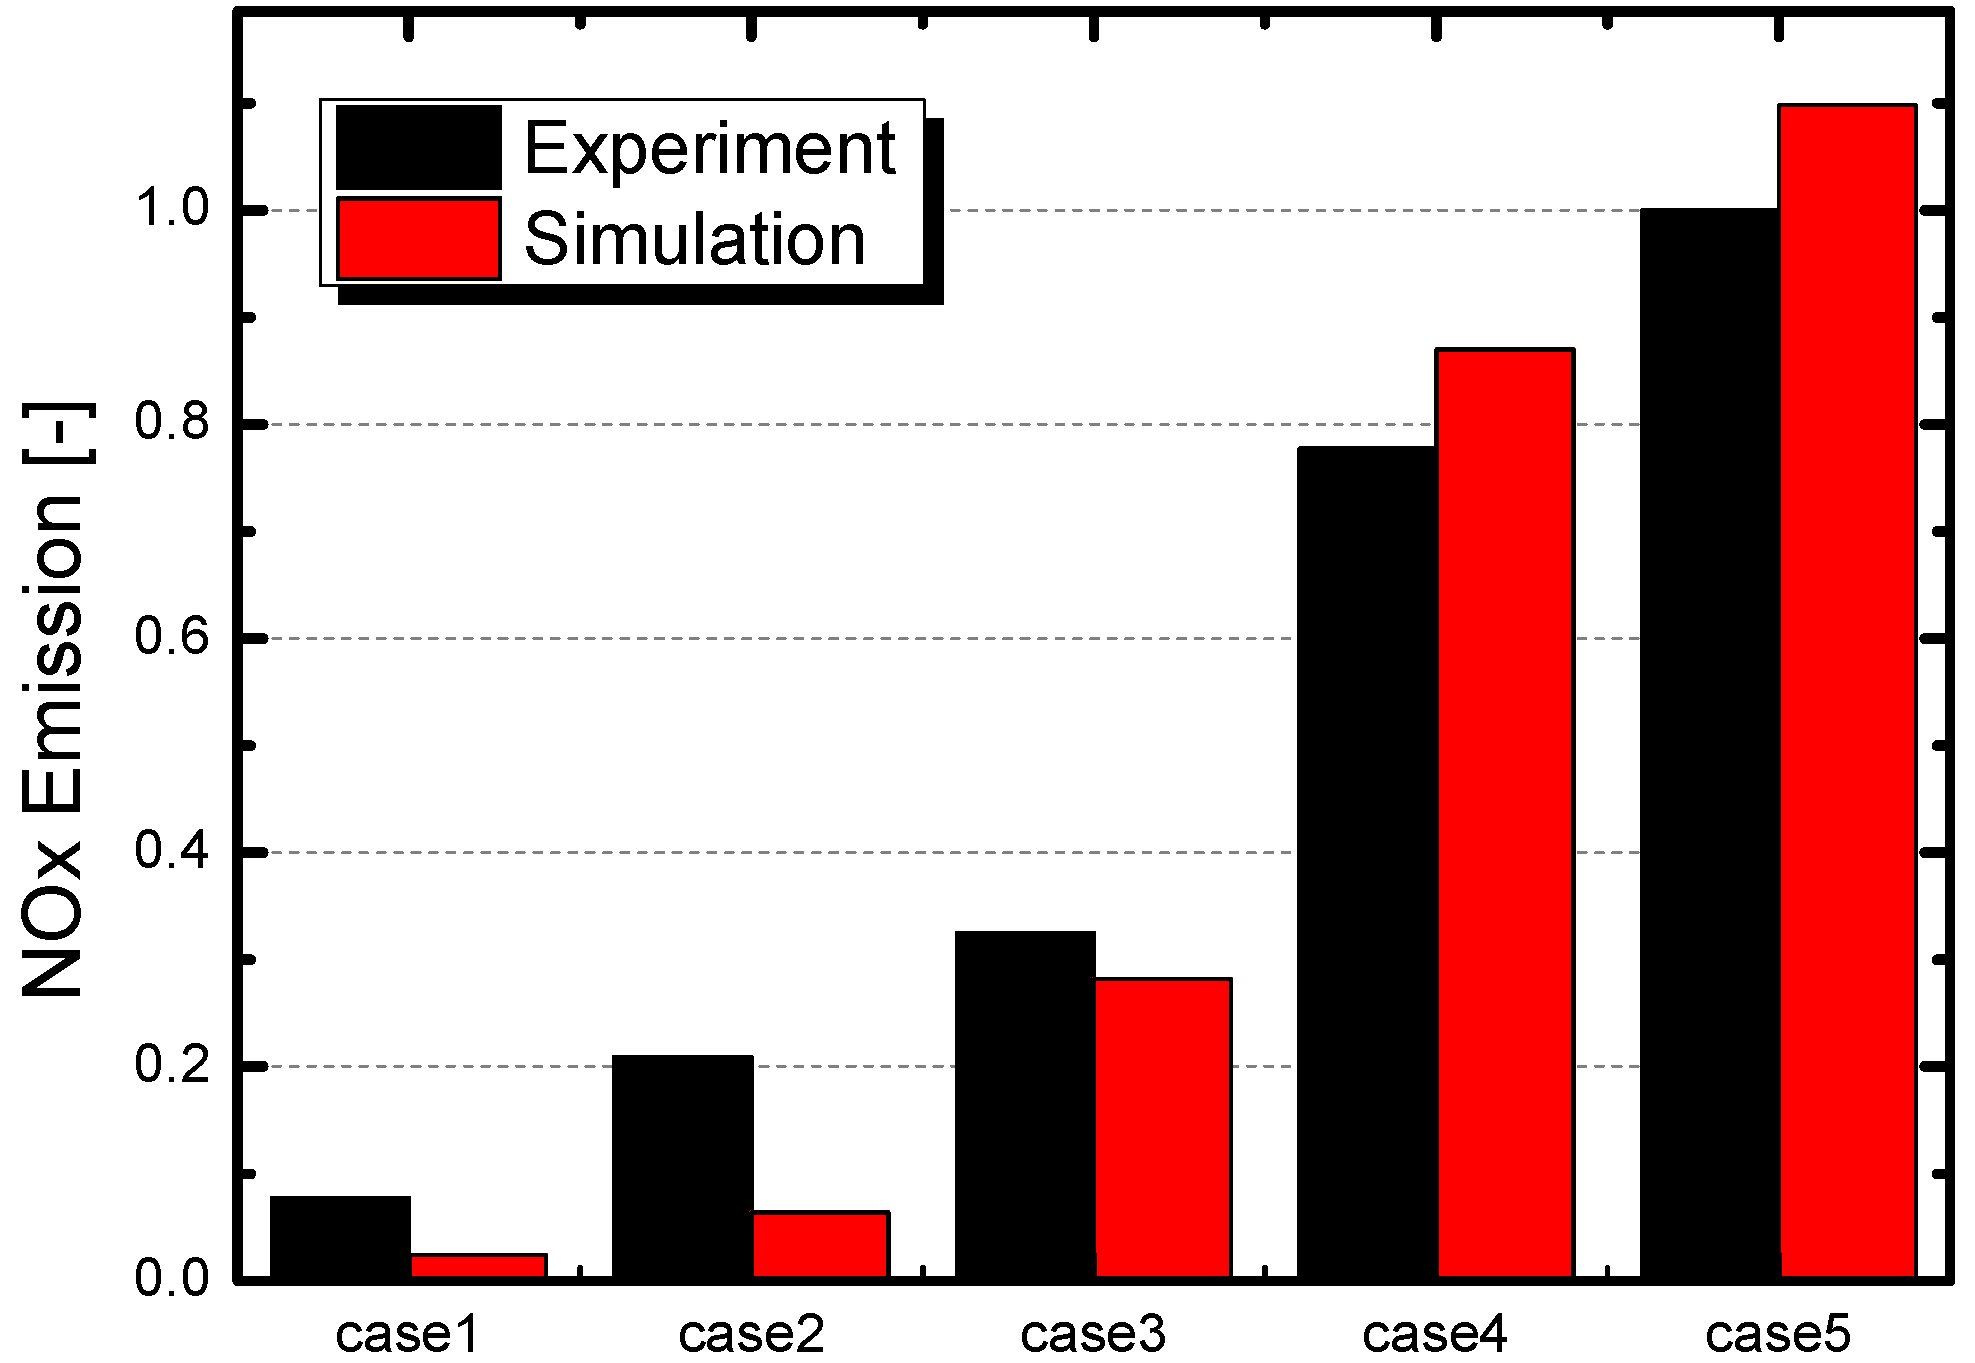
NOx emission validation of the natural gas engine was performed using emission data according to the intake mass flow and the equivalence ratio. The intake mass flow in the numerical analysis was calculated by multiplying the average velocity, density, and area at the inlet boundary. The equivalence ratio matches that of the experiment while changing the fuel mole fraction in the intake port.
Figure 5 shows the normalized NOx emissions of the experiment and the numerical analysis for five cases, according to the intake mass flow and the equivalence ratio at 1500 rpm. The calculated NOx emission fits well with the experimental NOx emission, as shown in
Figure 5.
Figure 5.
NOx Validation Results.
Figure 5.
NOx Validation Results.
3.2. Performance and Emission Map
The performance and emission map is generated based on several cases that have equivalence ratios from 0.6 to 1.2 and spark timings from ATDC−34 deg to −20 deg_ATDC. The equivalence ratio in the performance and emission map is the equivalence ratio in the intake port. Under the given conditions, with a constant engine speed of 1500 rpm and constant intake pressure of 90 kPa, the total intake gas volume is constant. Because of the premixed gas in the engine, an increase of equivalence ratio leads to an increase of fuel mole fraction and decrease of other gas components.
3.2.1. IMEP and ISFC Map
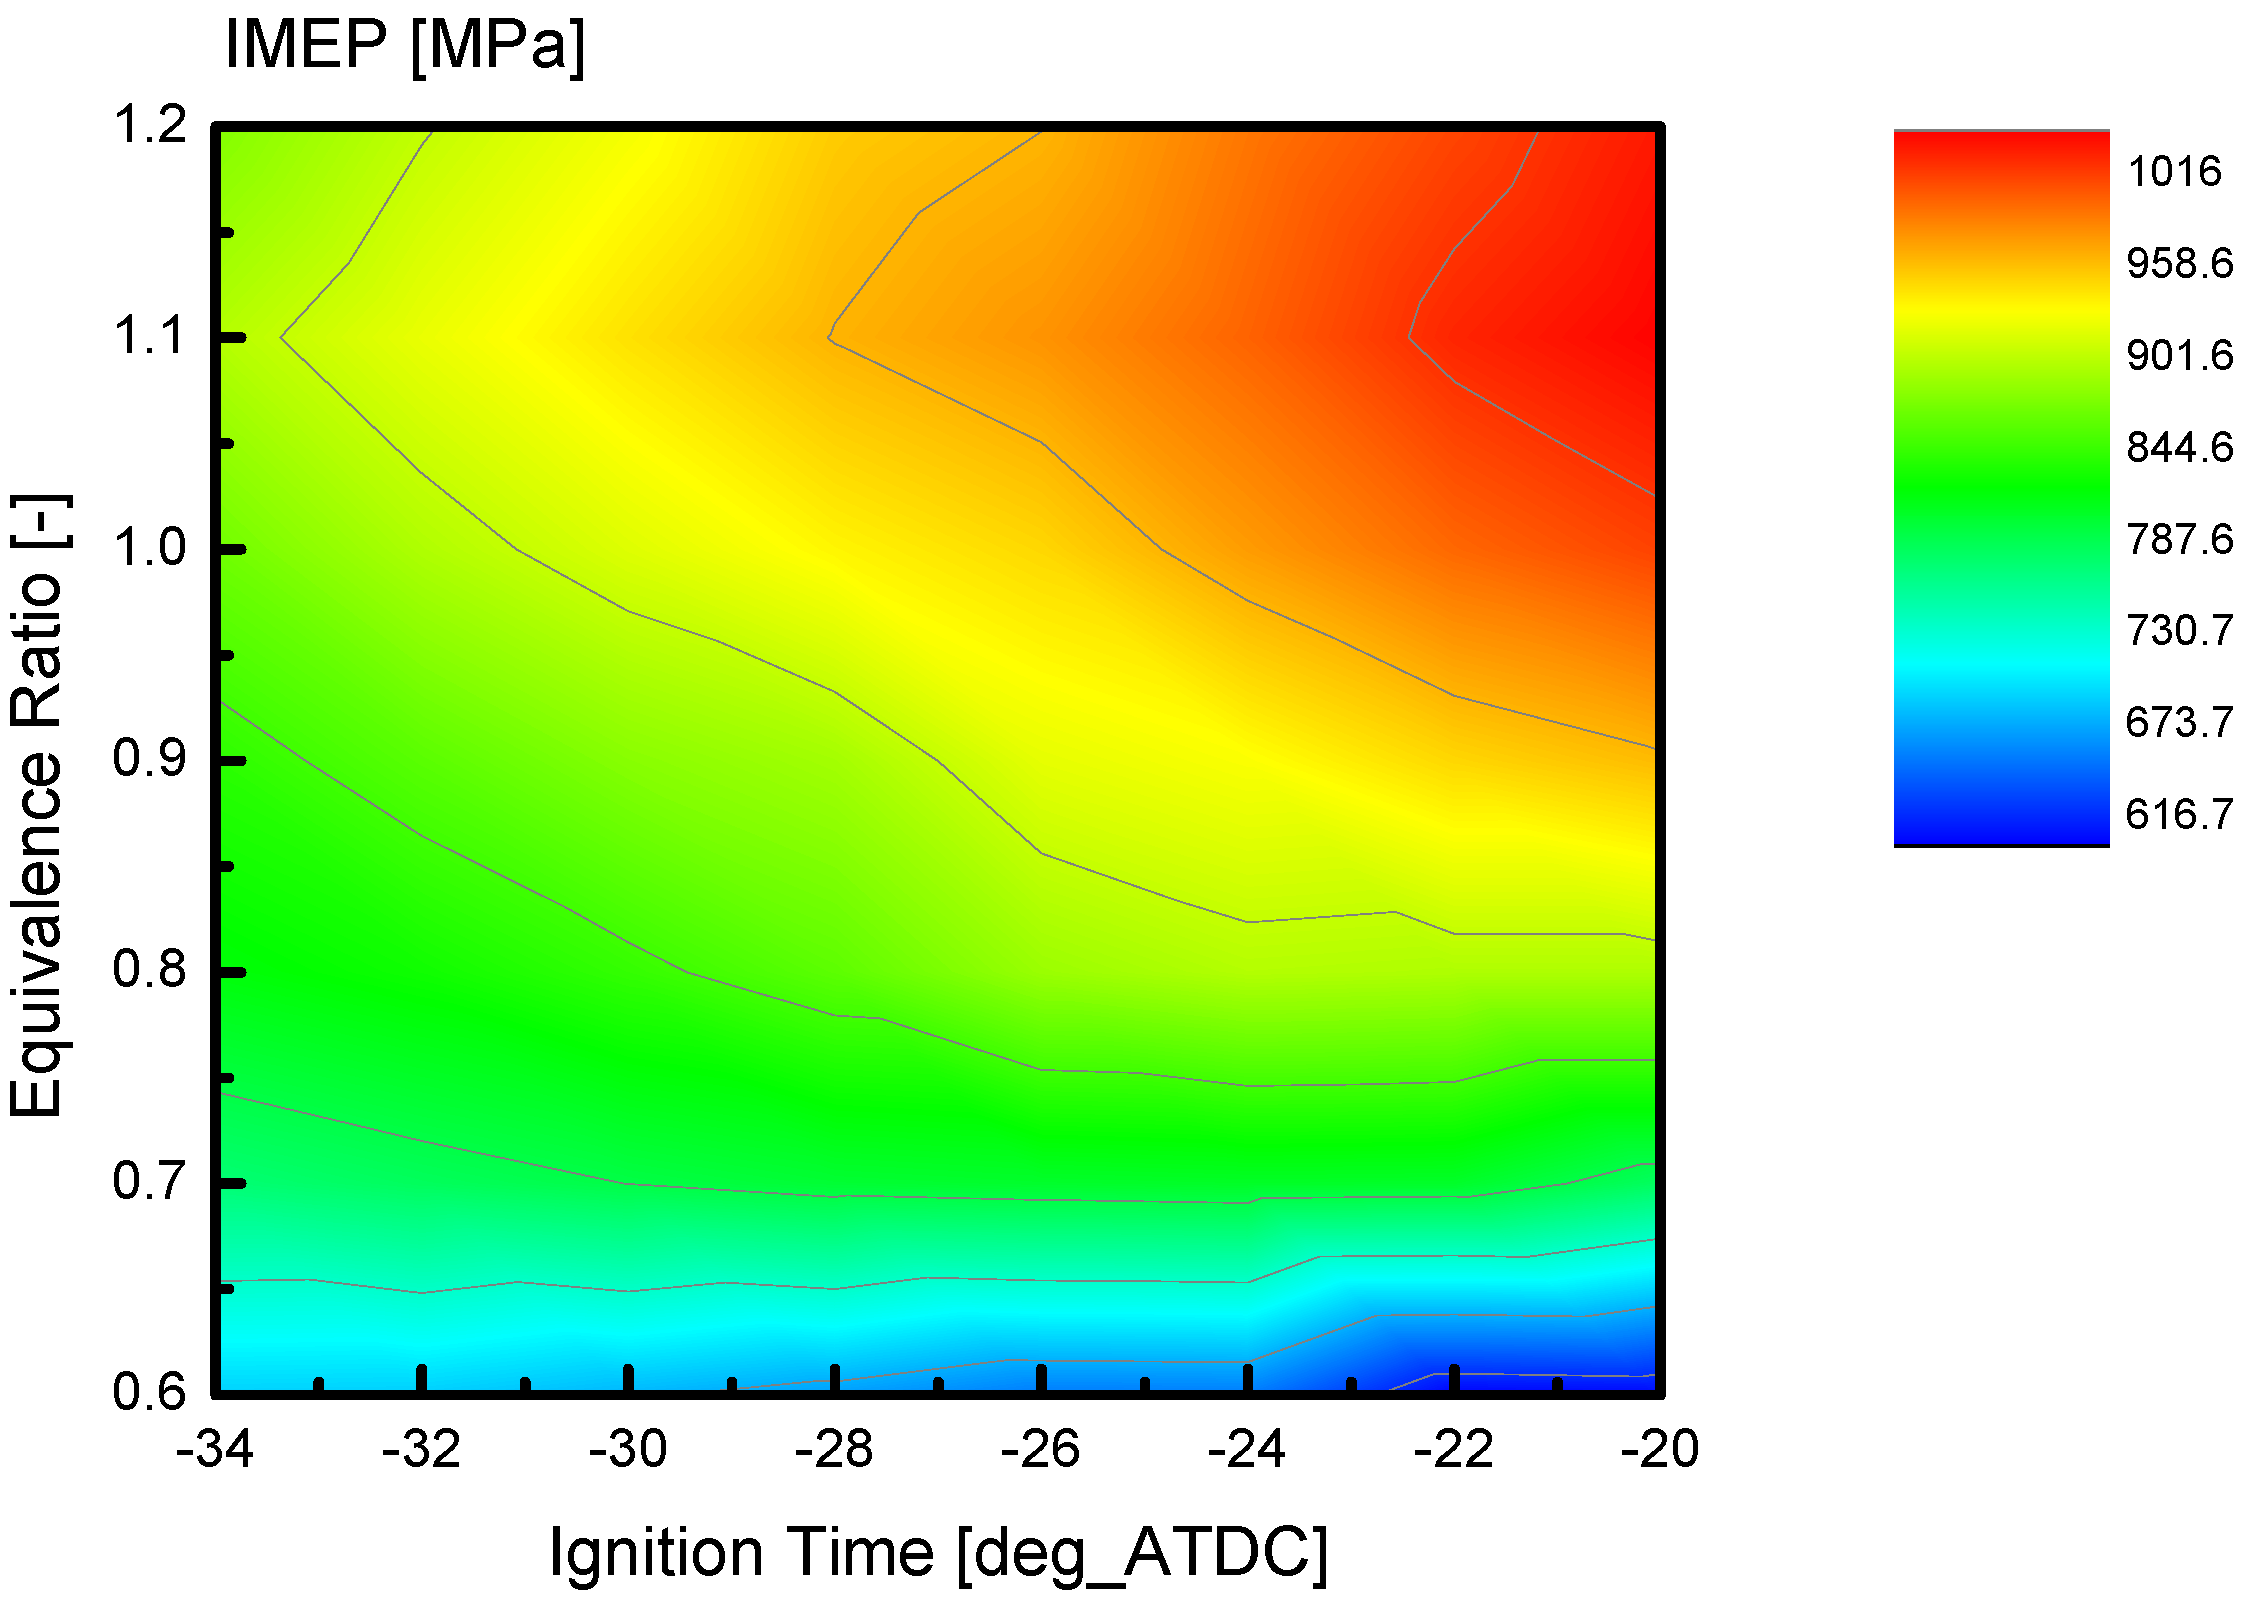
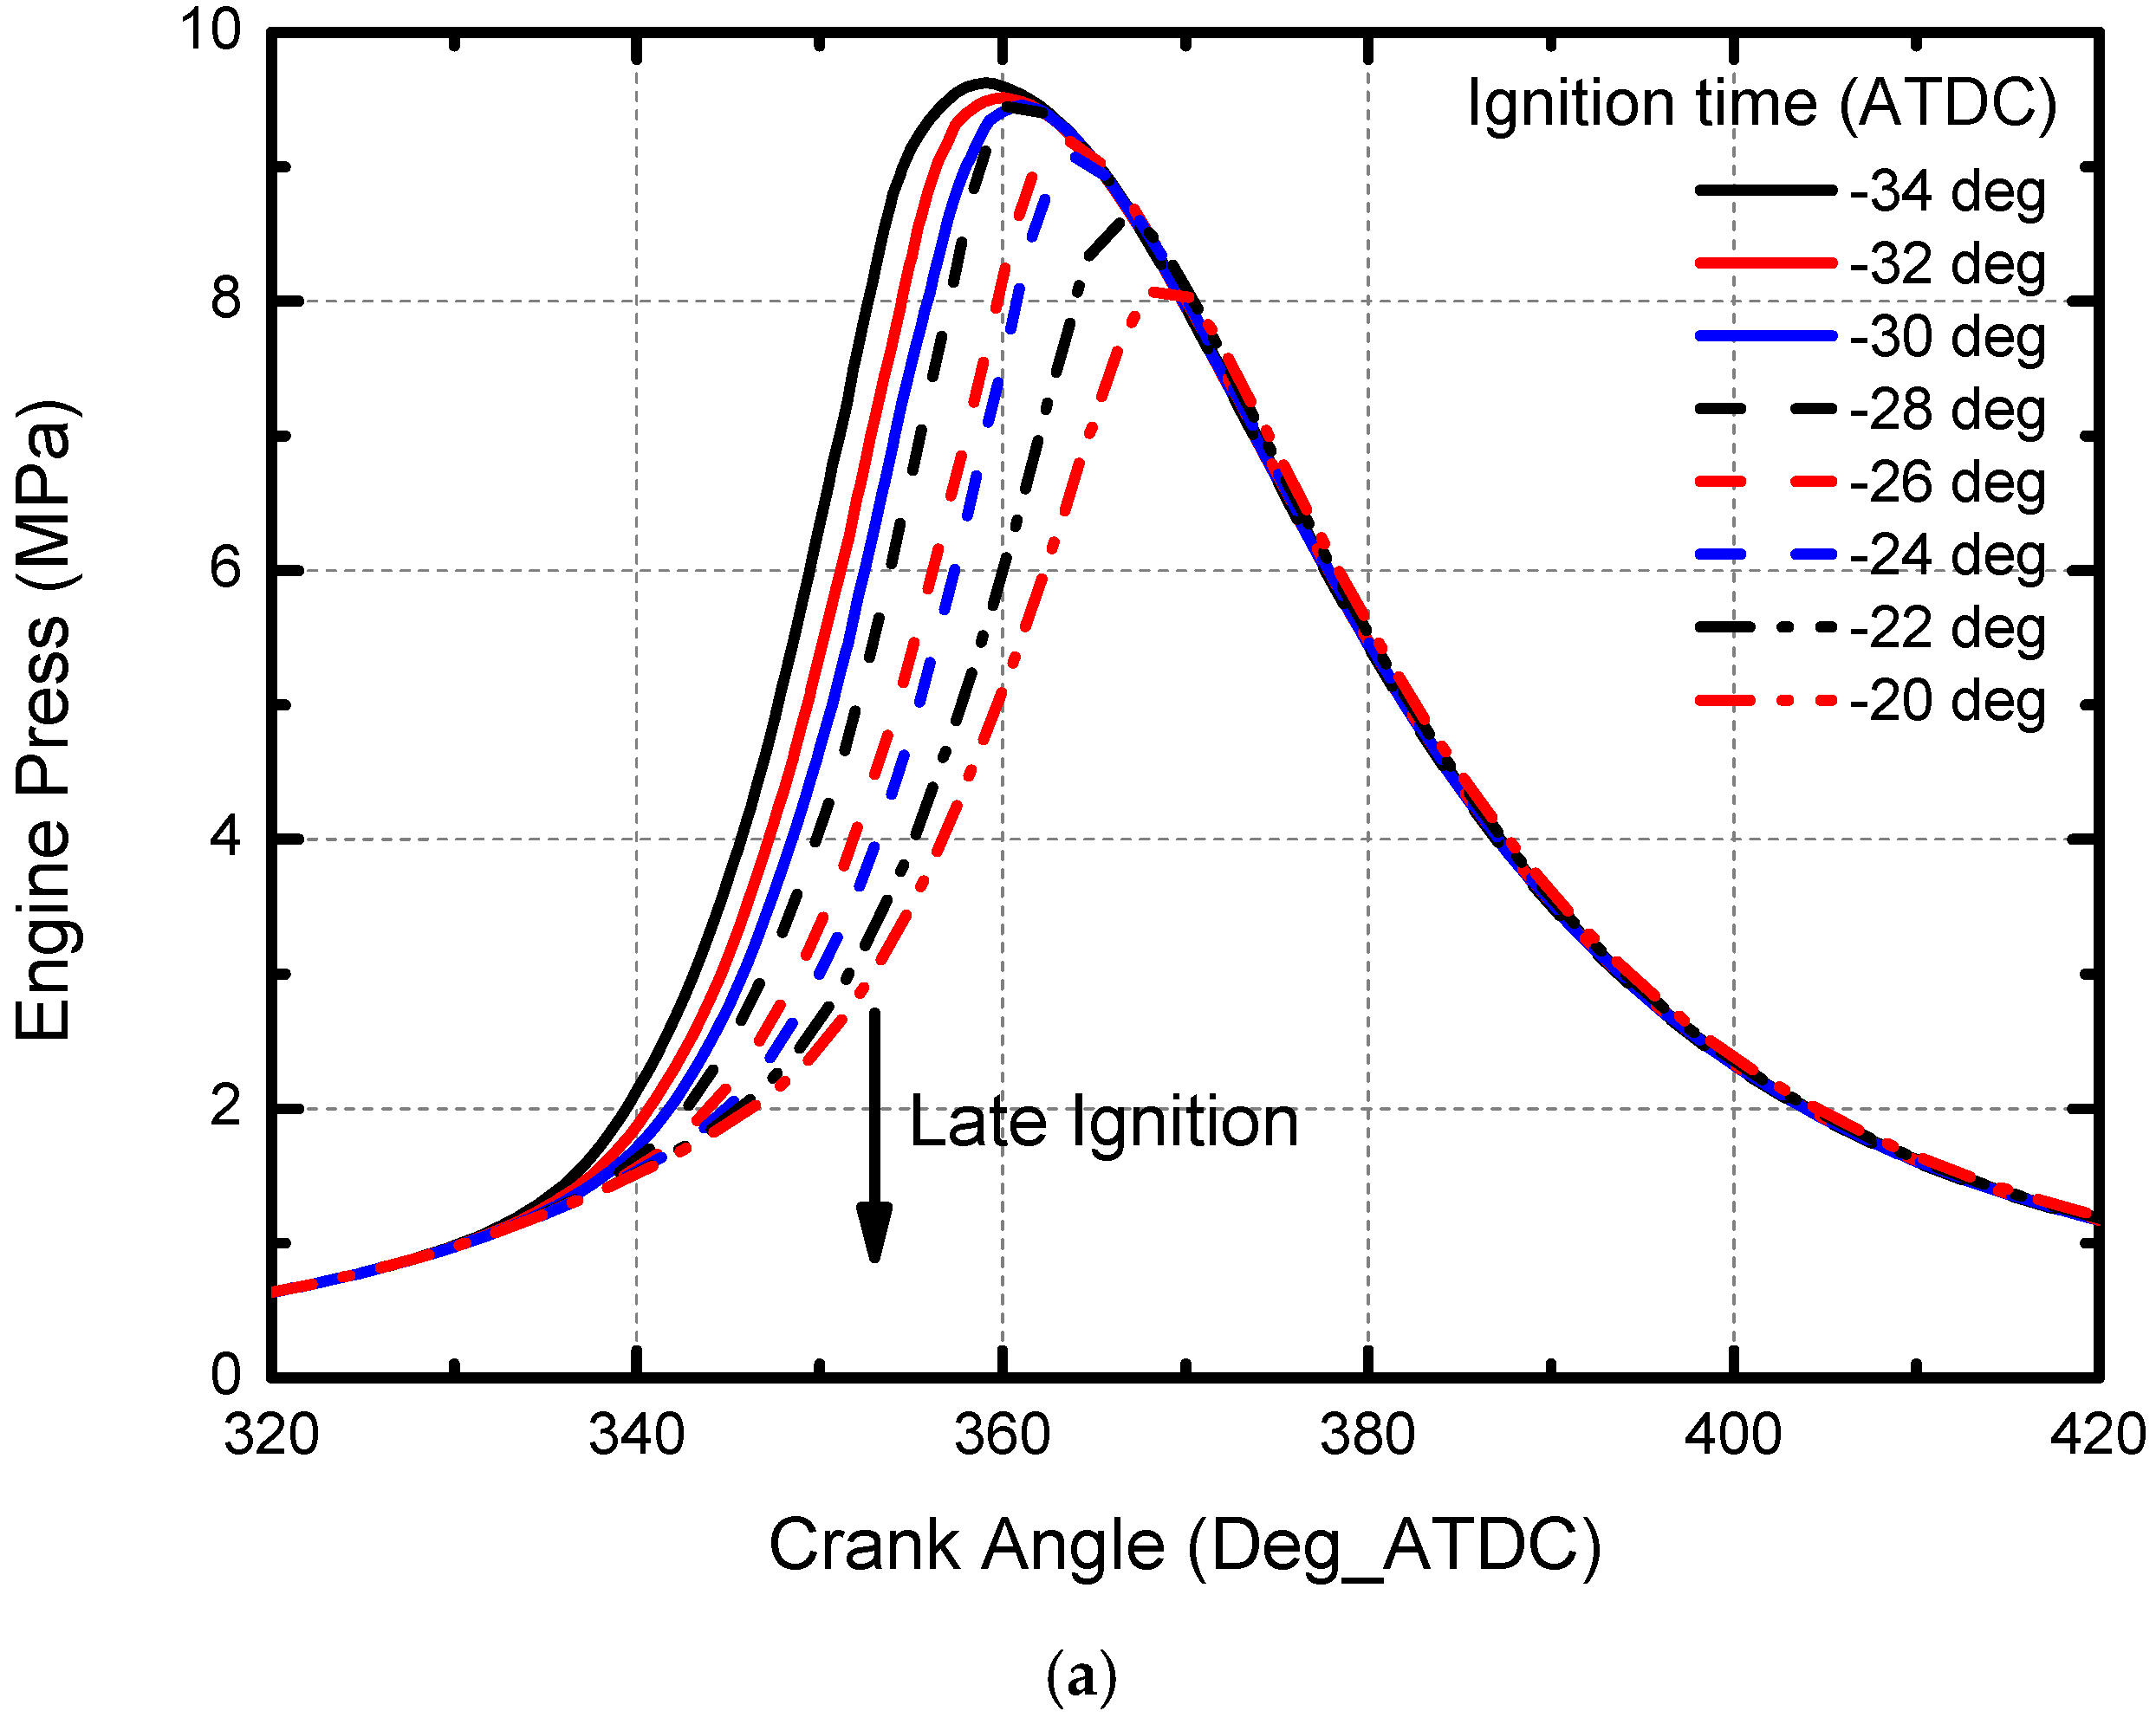
Figure 6 shows the IMEP for the various equivalence ratios and spark timings at an engine speed of 1500 rpm and an intake pressure of 90 kPa. The IMEP increases with later spark timing at a constant equivalence ratio, and it decreases with decreasing equivalence ratio at a constant spark timing. In the constant equivalence-ratio condition, the total amount of fuel is constant, and the amount of heat released decreases and the increment of pressure before the TDC decreases with earlier spark timings. The maximum pressure increase with early spark timing is shown in
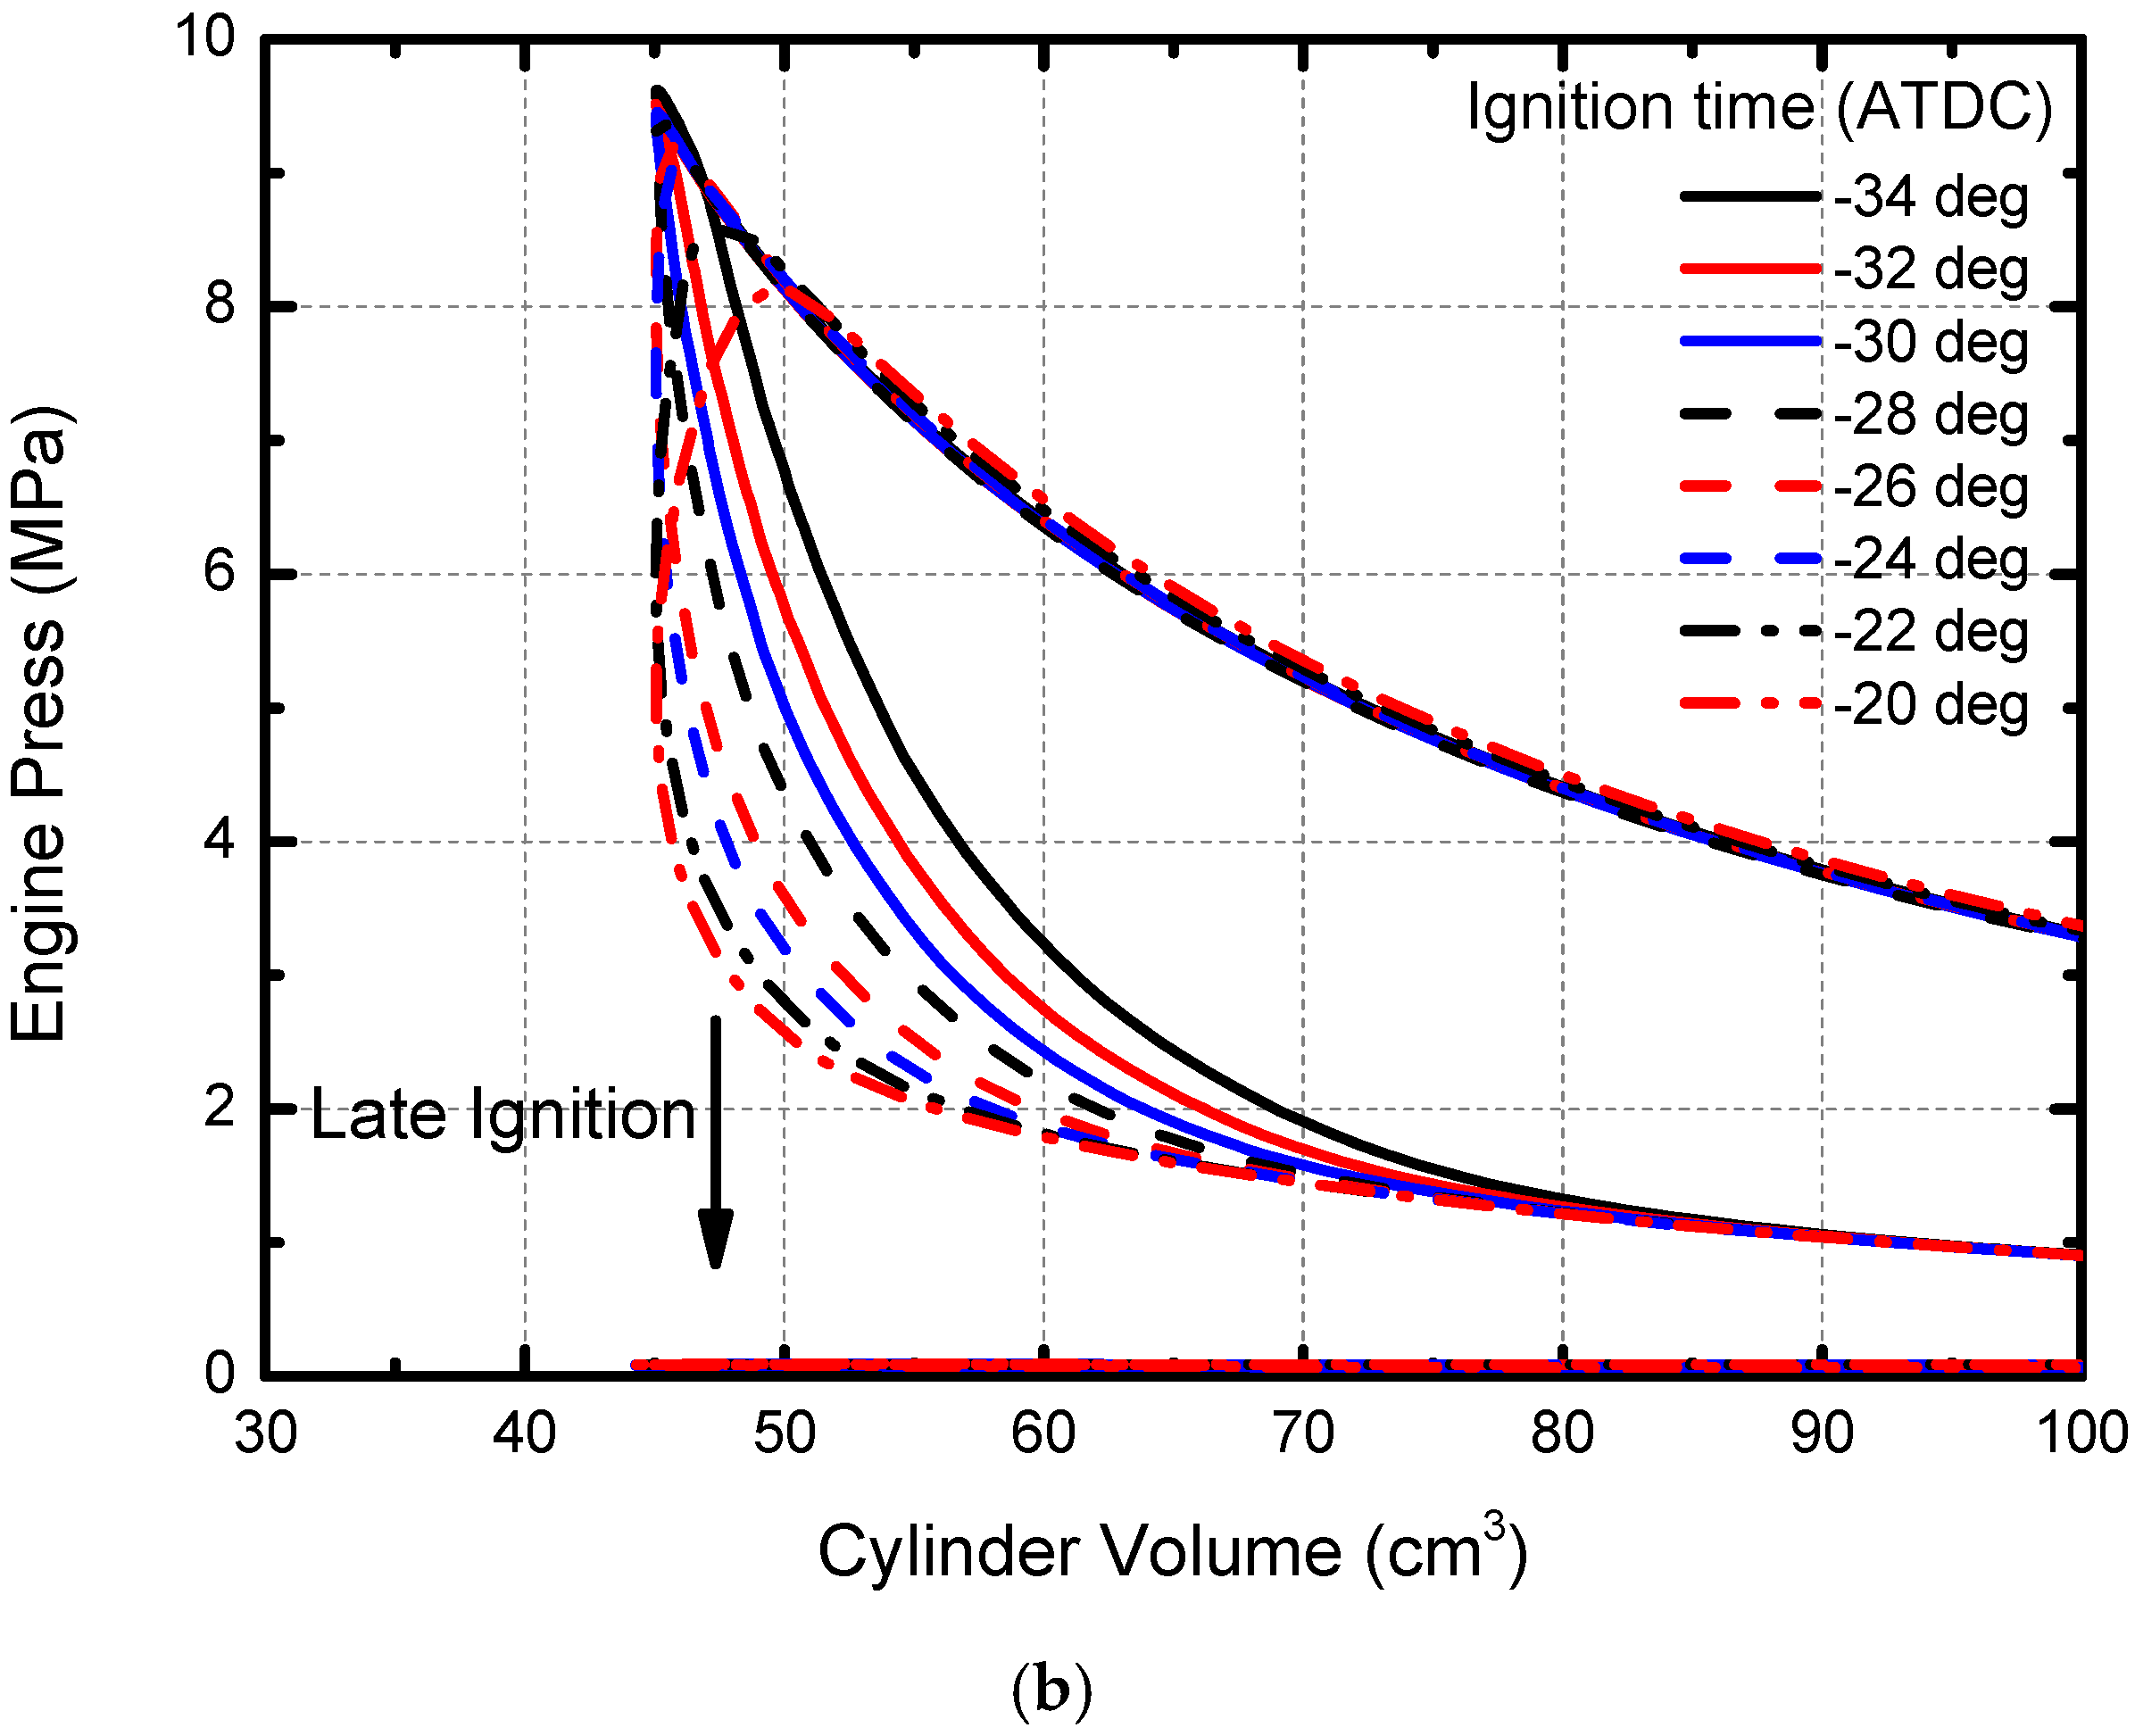
Figure 7a. However, based on the P-V diagram in
Figure 7b, the cylinder pressure before the TDC works in the reverse direction of the piston, and it would be minus work to total performance called compression loss. A higher maximum pressure before the TDC leads to higher pumping loss and lower IMEP. Thus, the IMEP increases with later spark timing at a constant equivalence ratio.
Figure 6 shows that the IMEP increases with the equivalence ratio, with constant spark timing. The total amount of fuel in the cylinder at the IVC increases with the equivalence ratio in the intake port. An increase in total fuel leads to an increase in heat release. For equivalence ratios higher than 1.1, the amount of air is not sufficient to combust all of the fuel, so the IMEP at an equivalence ratio of 1.2 is lower than the IMEP at an equivalence ratio of 1.1, even though an equivalence ratio of 1.2 has more fuel.
Figure 6.
IMEP variation according to equivalence ratio and spark timing.
Figure 6.
IMEP variation according to equivalence ratio and spark timing.
Figure 7.
(a) Engine pressure variation according to spark timing; (b) P-V diagram variation according to spark timing.
Figure 7.
(a) Engine pressure variation according to spark timing; (b) P-V diagram variation according to spark timing.
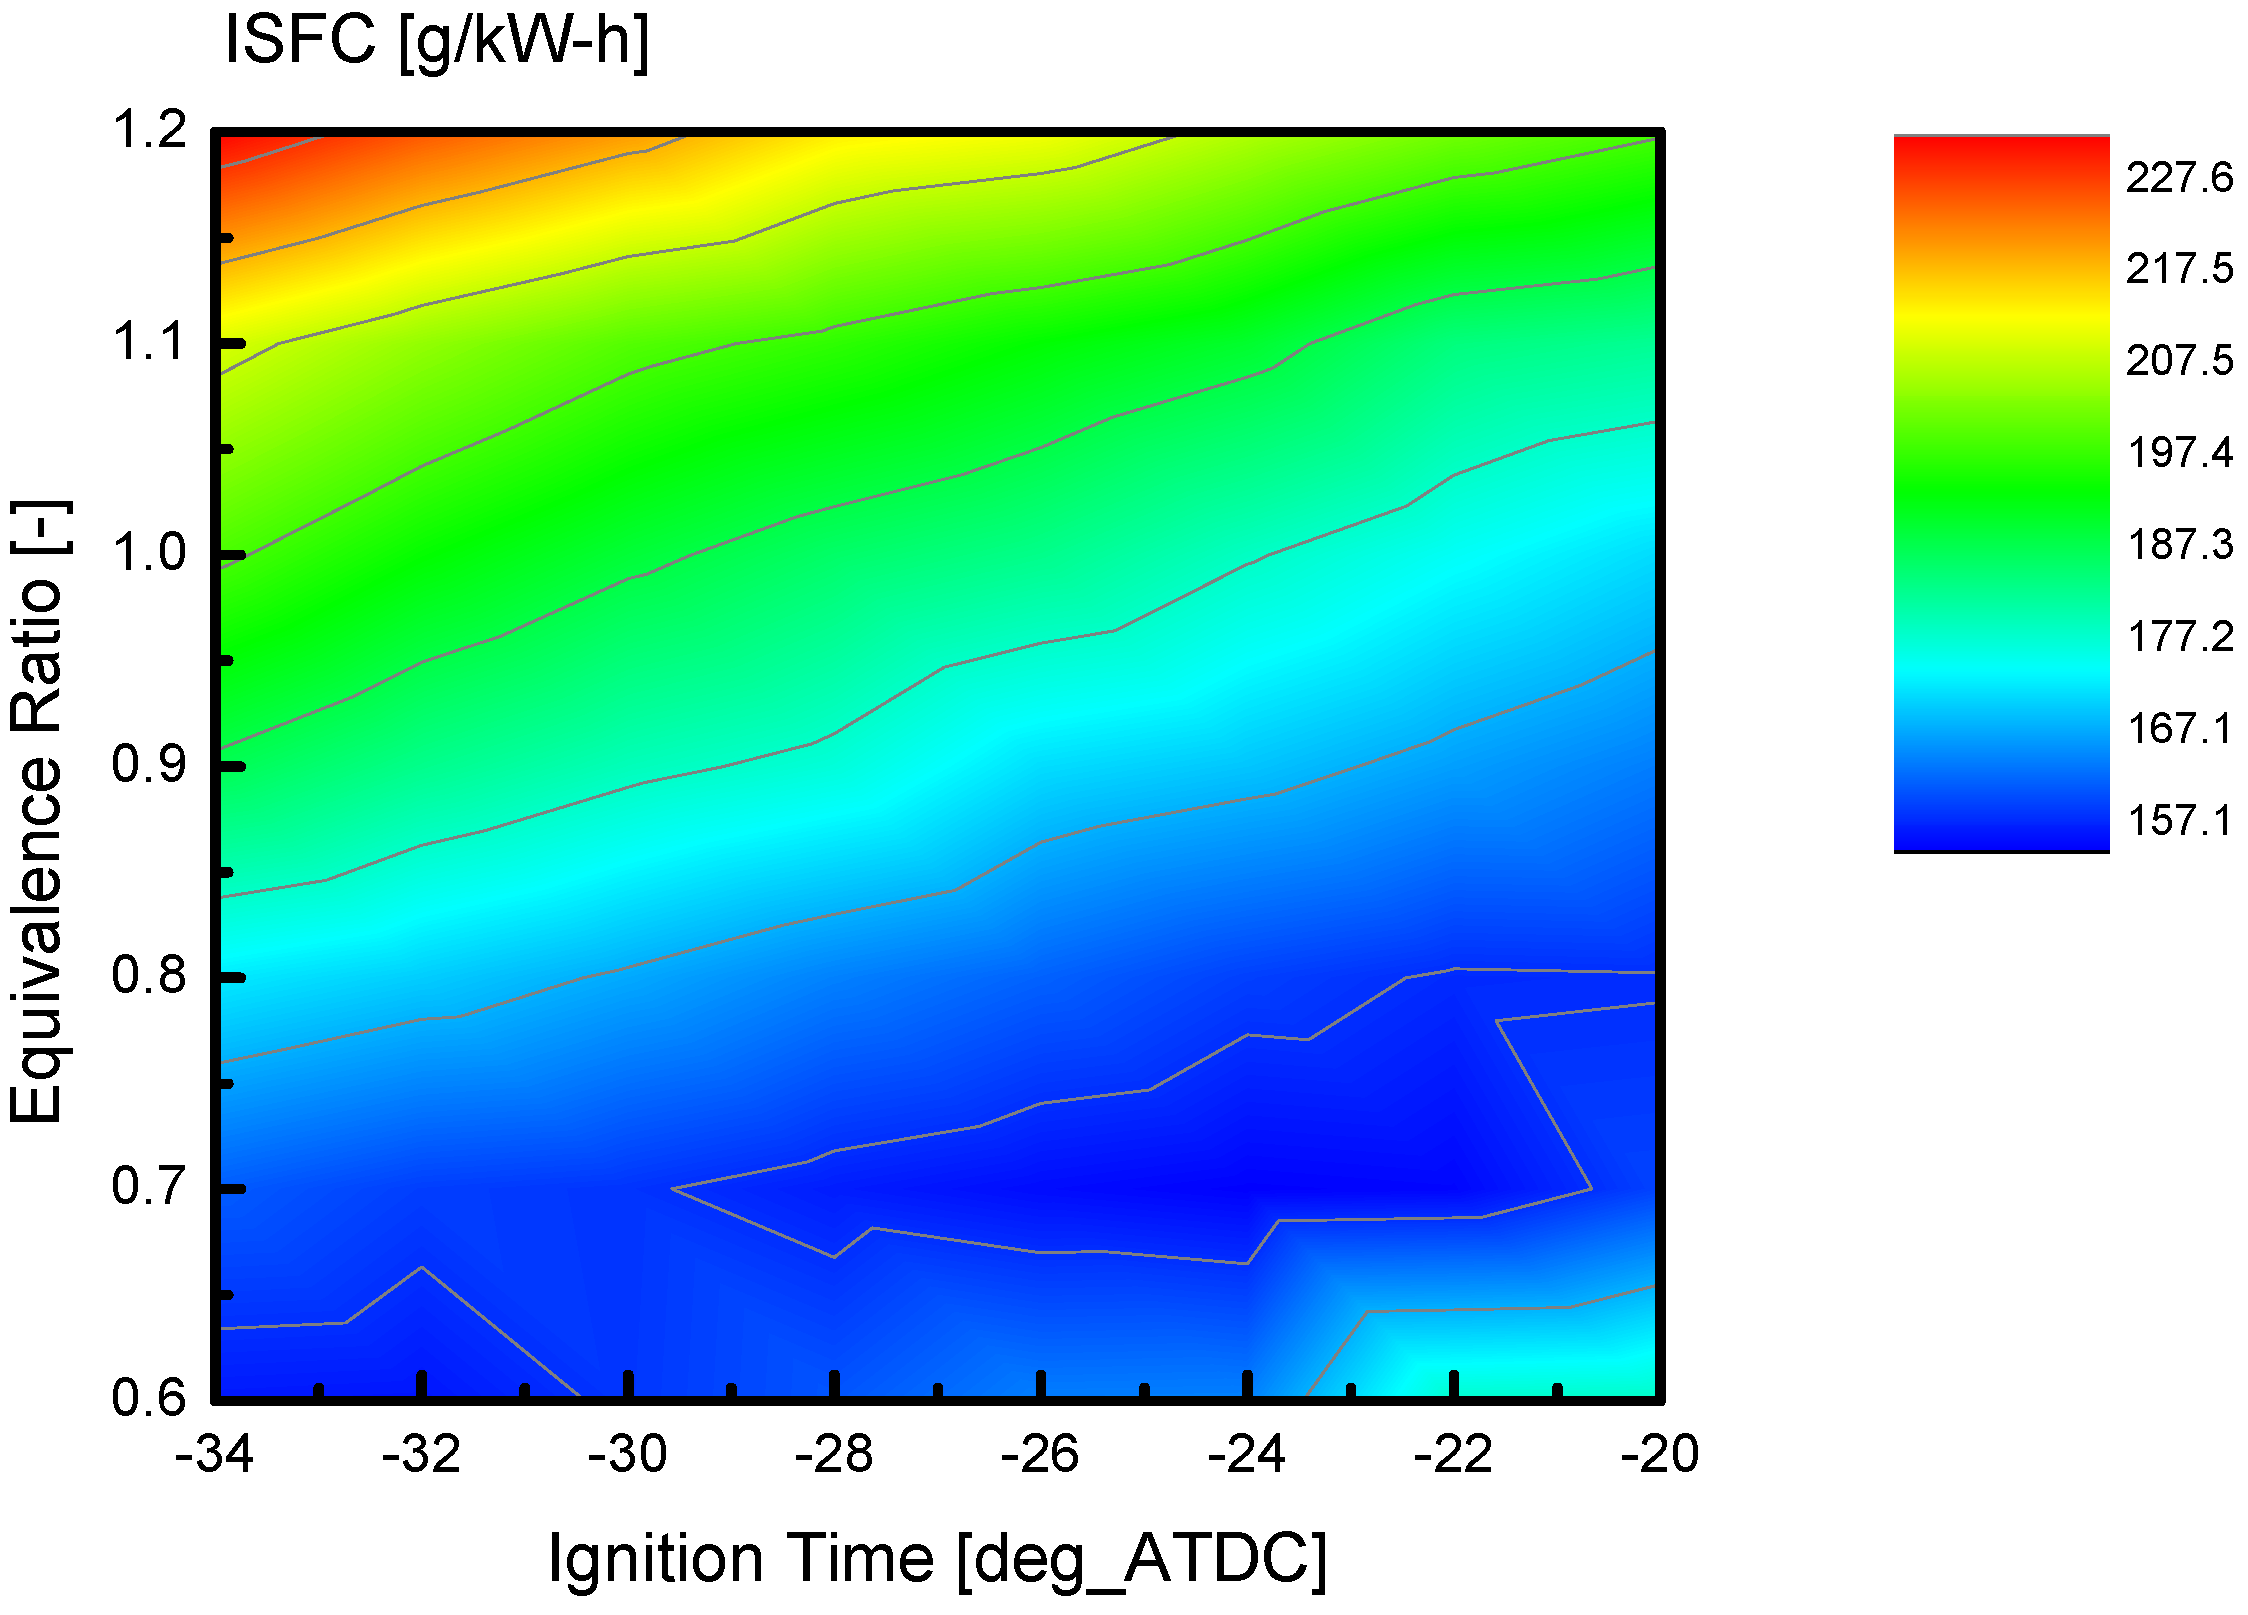
Figure 8 shows the effects of the equivalence ratio and the spark timing on the indicated specific fuel consumption (ISFC). The fuel consumption (ISFC) at an early spark timing increases with the equivalence ratio. At a constant equivalence ratio, because the ISFC is inversely proportional to the IMEP, the ISFC decreases with later spark timing. For constant spark timing, the ISFC increases as the equivalence ratio increases.
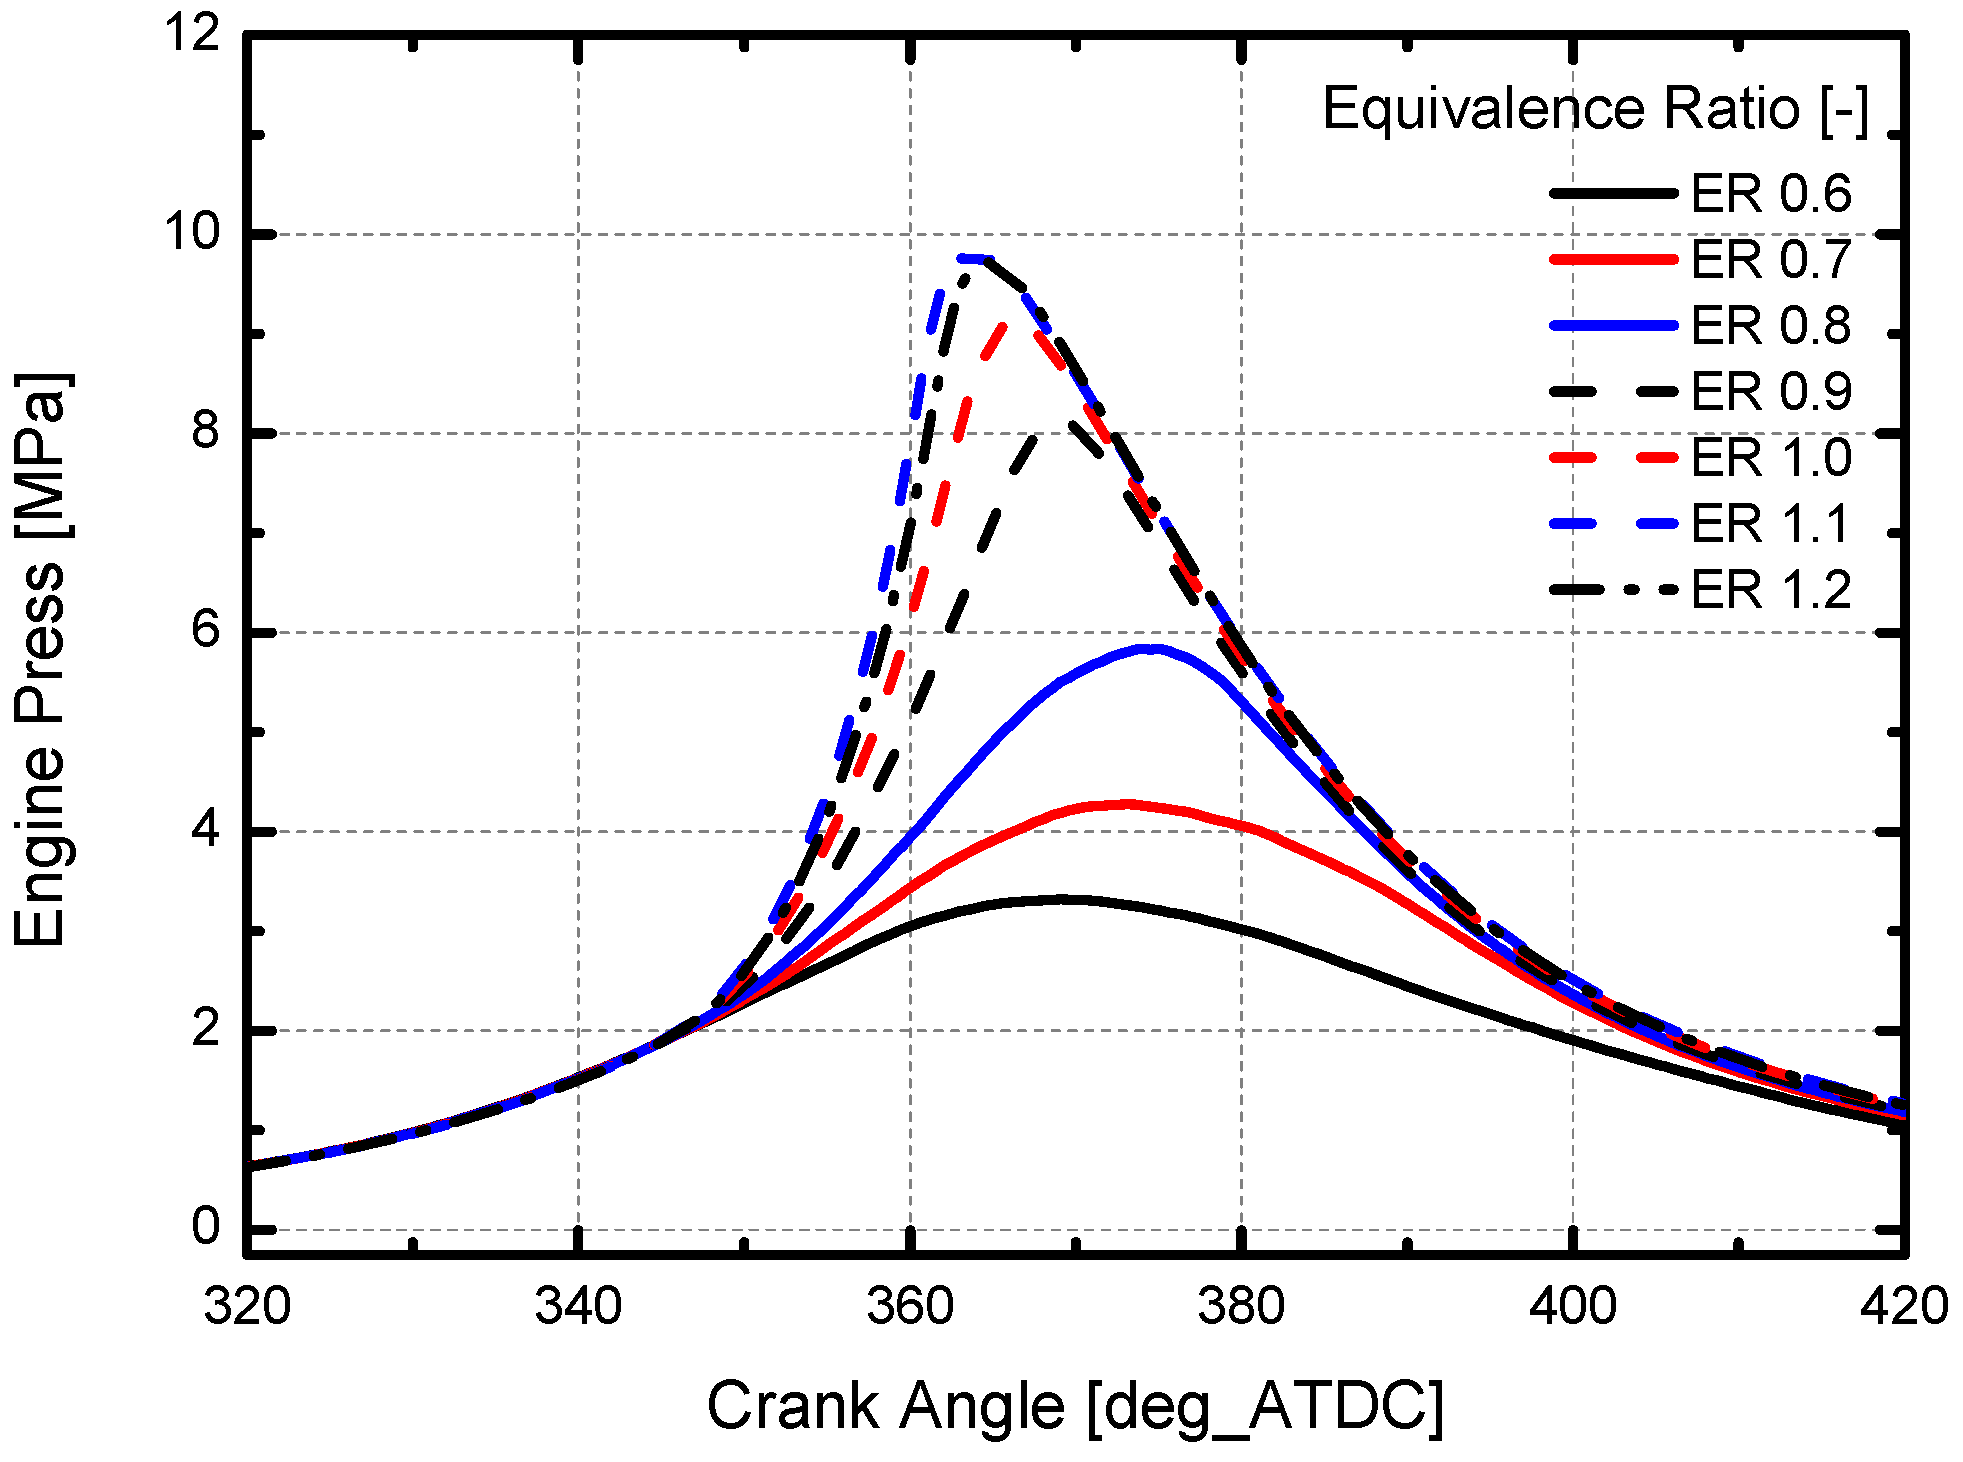
Figure 9 shows the engine pressure variation with increasing equivalence ratio. The total heat released increases, and the flame speed increases with increases in the equivalence ratio [
14,
15], so the engine pressure increases rapidly around the TDC at high equivalence ratios. The flame speed at a high equivalence ratio is large as well as the rate of pressure increase. Accordingly, for a high equivalence ratio, a greater portion of the fuel burns before the TDC and work on compression loss. The increment of work due to an increase in the equivalence ratio becomes smaller as compression loss increases, so the fuel consumption per work increases with higher equivalence ratio.
Figure 8.
ISFC variation according to equivalence ratio and spark timing.
Figure 8.
ISFC variation according to equivalence ratio and spark timing.
Figure 9.
Engine pressure according to equivalence ratio variation.
Figure 9.
Engine pressure according to equivalence ratio variation.
3.2.2. NOx Emission Map
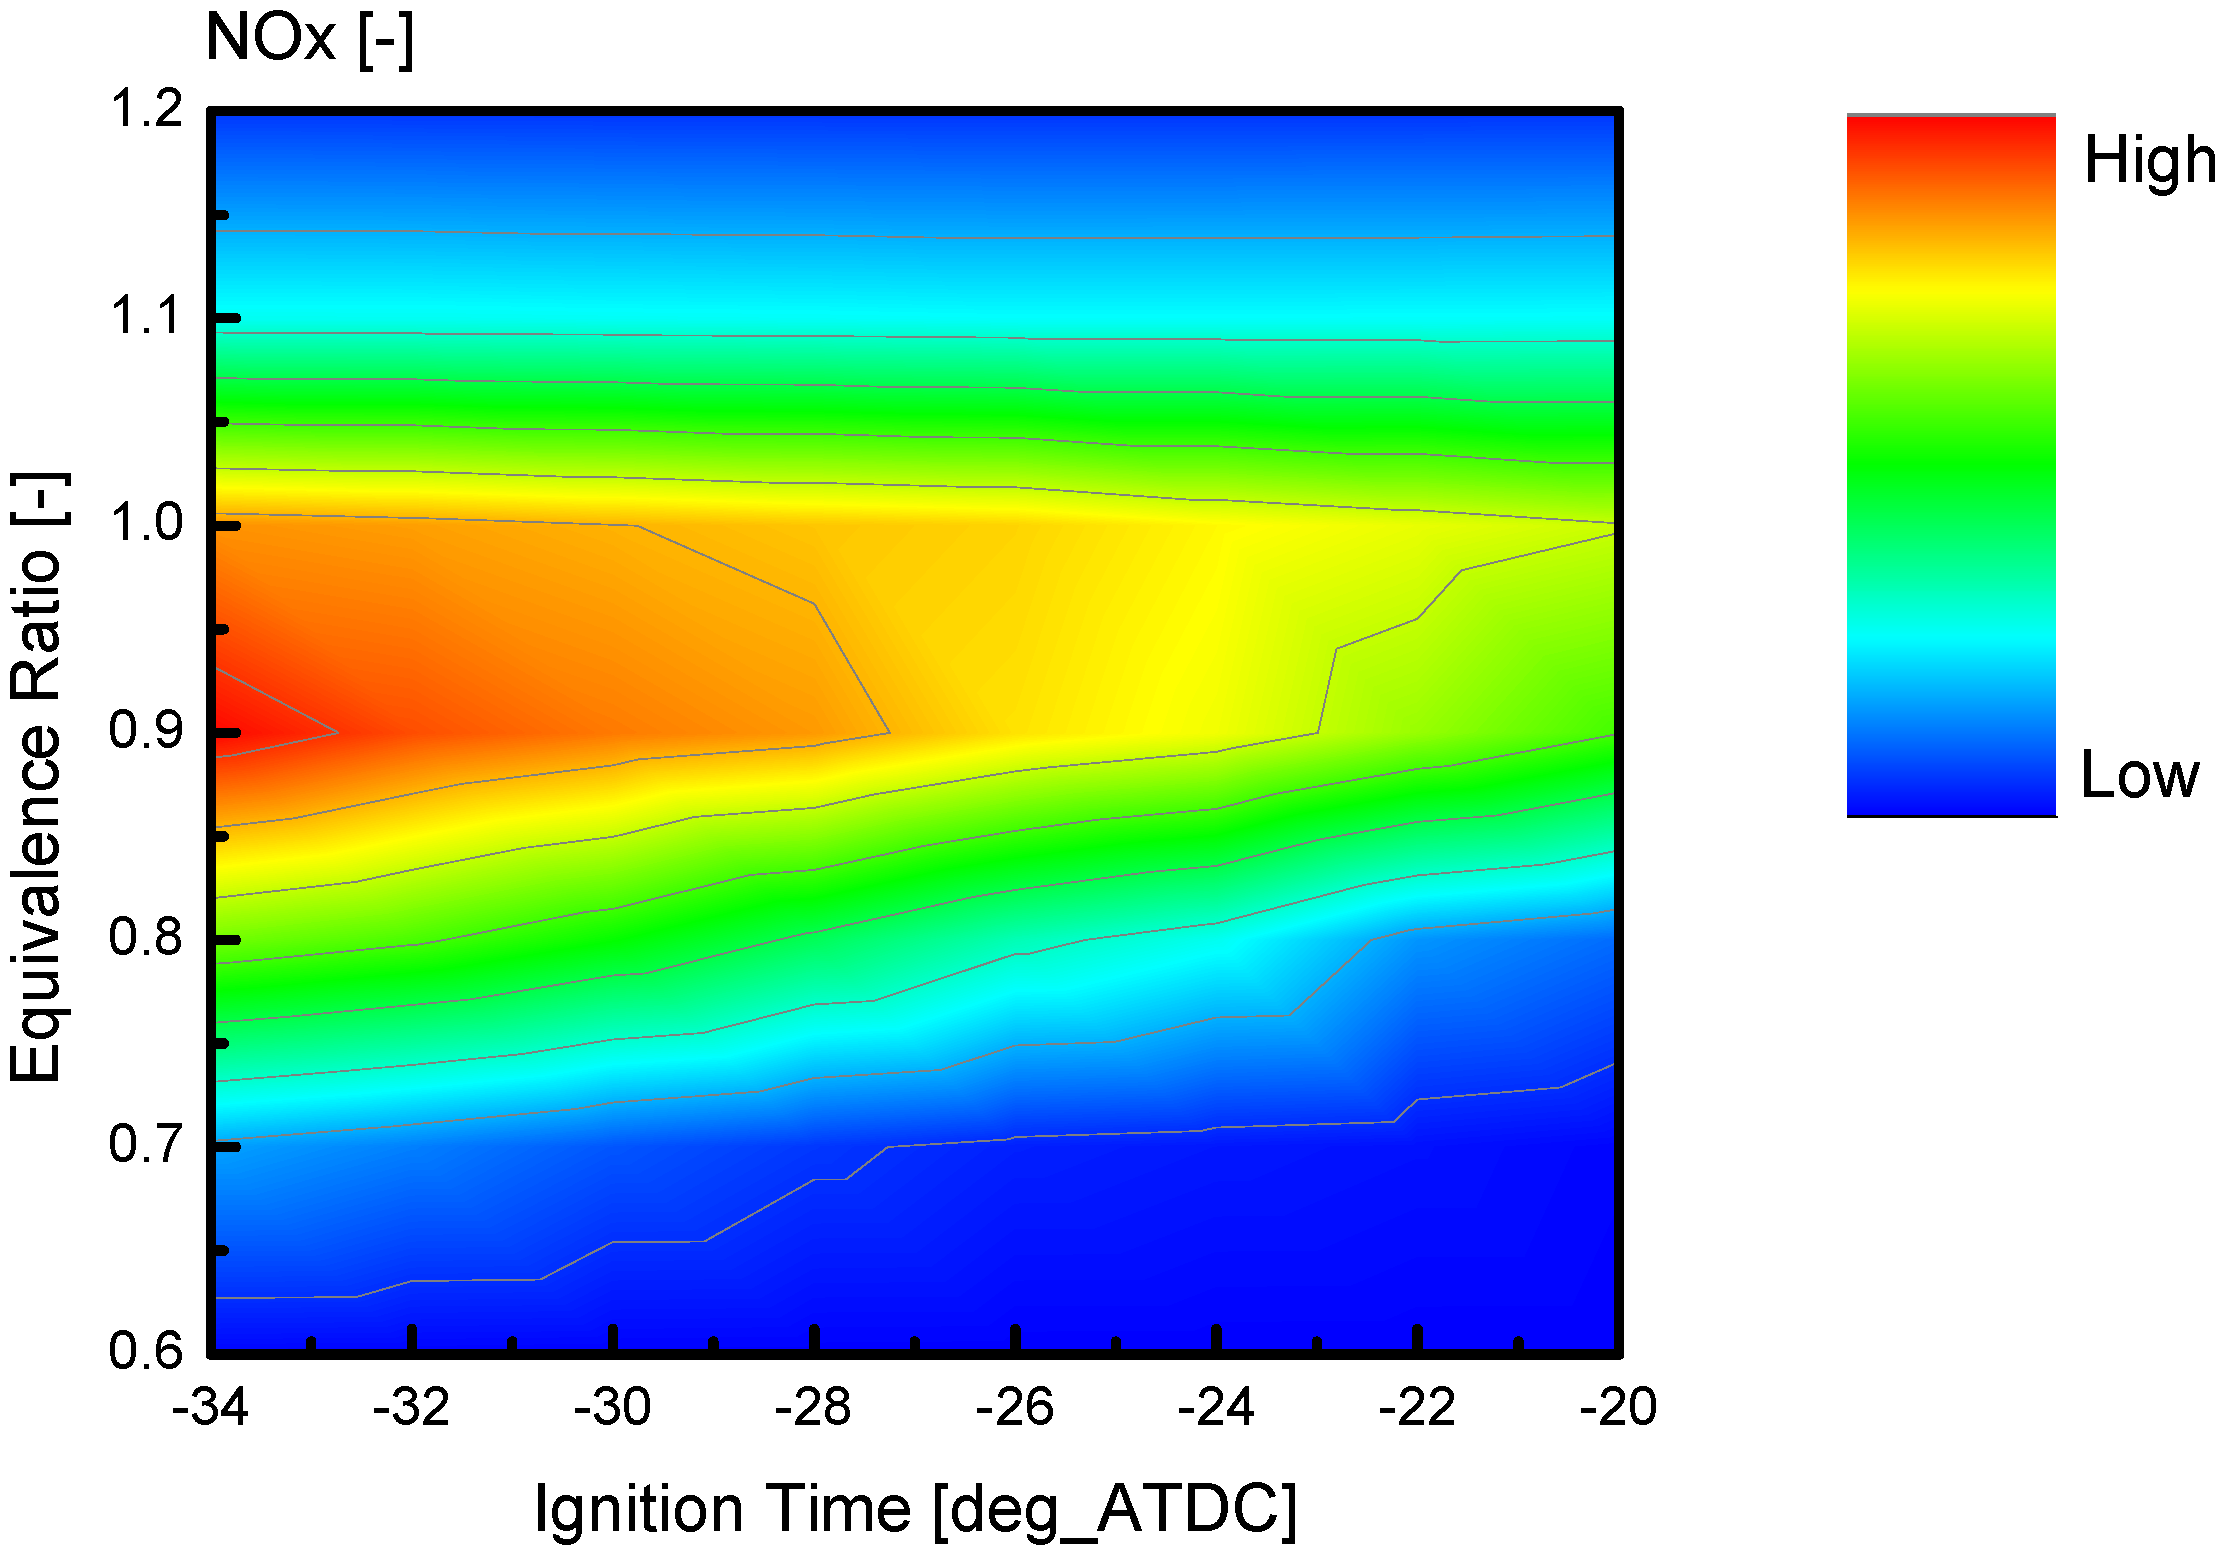
Figure 10 shows the normalized NOx emission for various equivalence ratios and spark timing at an engine speed of 1500 rpm and an intake port pressure of 90 kPa. The NOx emission is at its maximum at an equivalence ratio of 0.9 and early spark timing. NOx emission decreases with later spark timing. NOx formation is determined by the oxygen concentration and the cylinder temperature. In cases of low equivalence ratios under 0.9, the total heat released is small, and the temperature in the cylinder decreases as the equivalence ratio decreases. NOx formation is slow at low temperatures, so the amount of NOx emission for a low equivalence ratio is small. A decrease in NOx emission for equivalence ratios over 0.9 is the result of insufficiency of oxygen, which slows down the rate of NOx formation. When the spark timing is late, the NOx emission decreases for all equivalence ratios. As stated in the IMEP analysis, the engine pressure decreases with later spark timing, and, accordingly, the temperature in the cylinder is also lower. The rate of NOx formation, which is a function of temperature, gets slower, and the NOx emission decreases with a later spark timing.
Figure 10.
Normalized NOx emission variation according to equivalence ratio and spark timing.
Figure 10.
Normalized NOx emission variation according to equivalence ratio and spark timing.
3.3. Effect of EGR Rate on Performance and Emission Characteristics
The effect of the EGR rate is predicted based on the assumption that the total fuel mixed with intake air is constant, and the intake air is calculated using the EGR calculation, explained for the numerical approach. The maximum analysis condition EGR rate is 20% when the equivalence ratio is 0.8 because the equivalence ratio at the IVC is greater than 1, and a great deal of HC is generated by the unburned fuel when the EGR rate is larger than 20%.
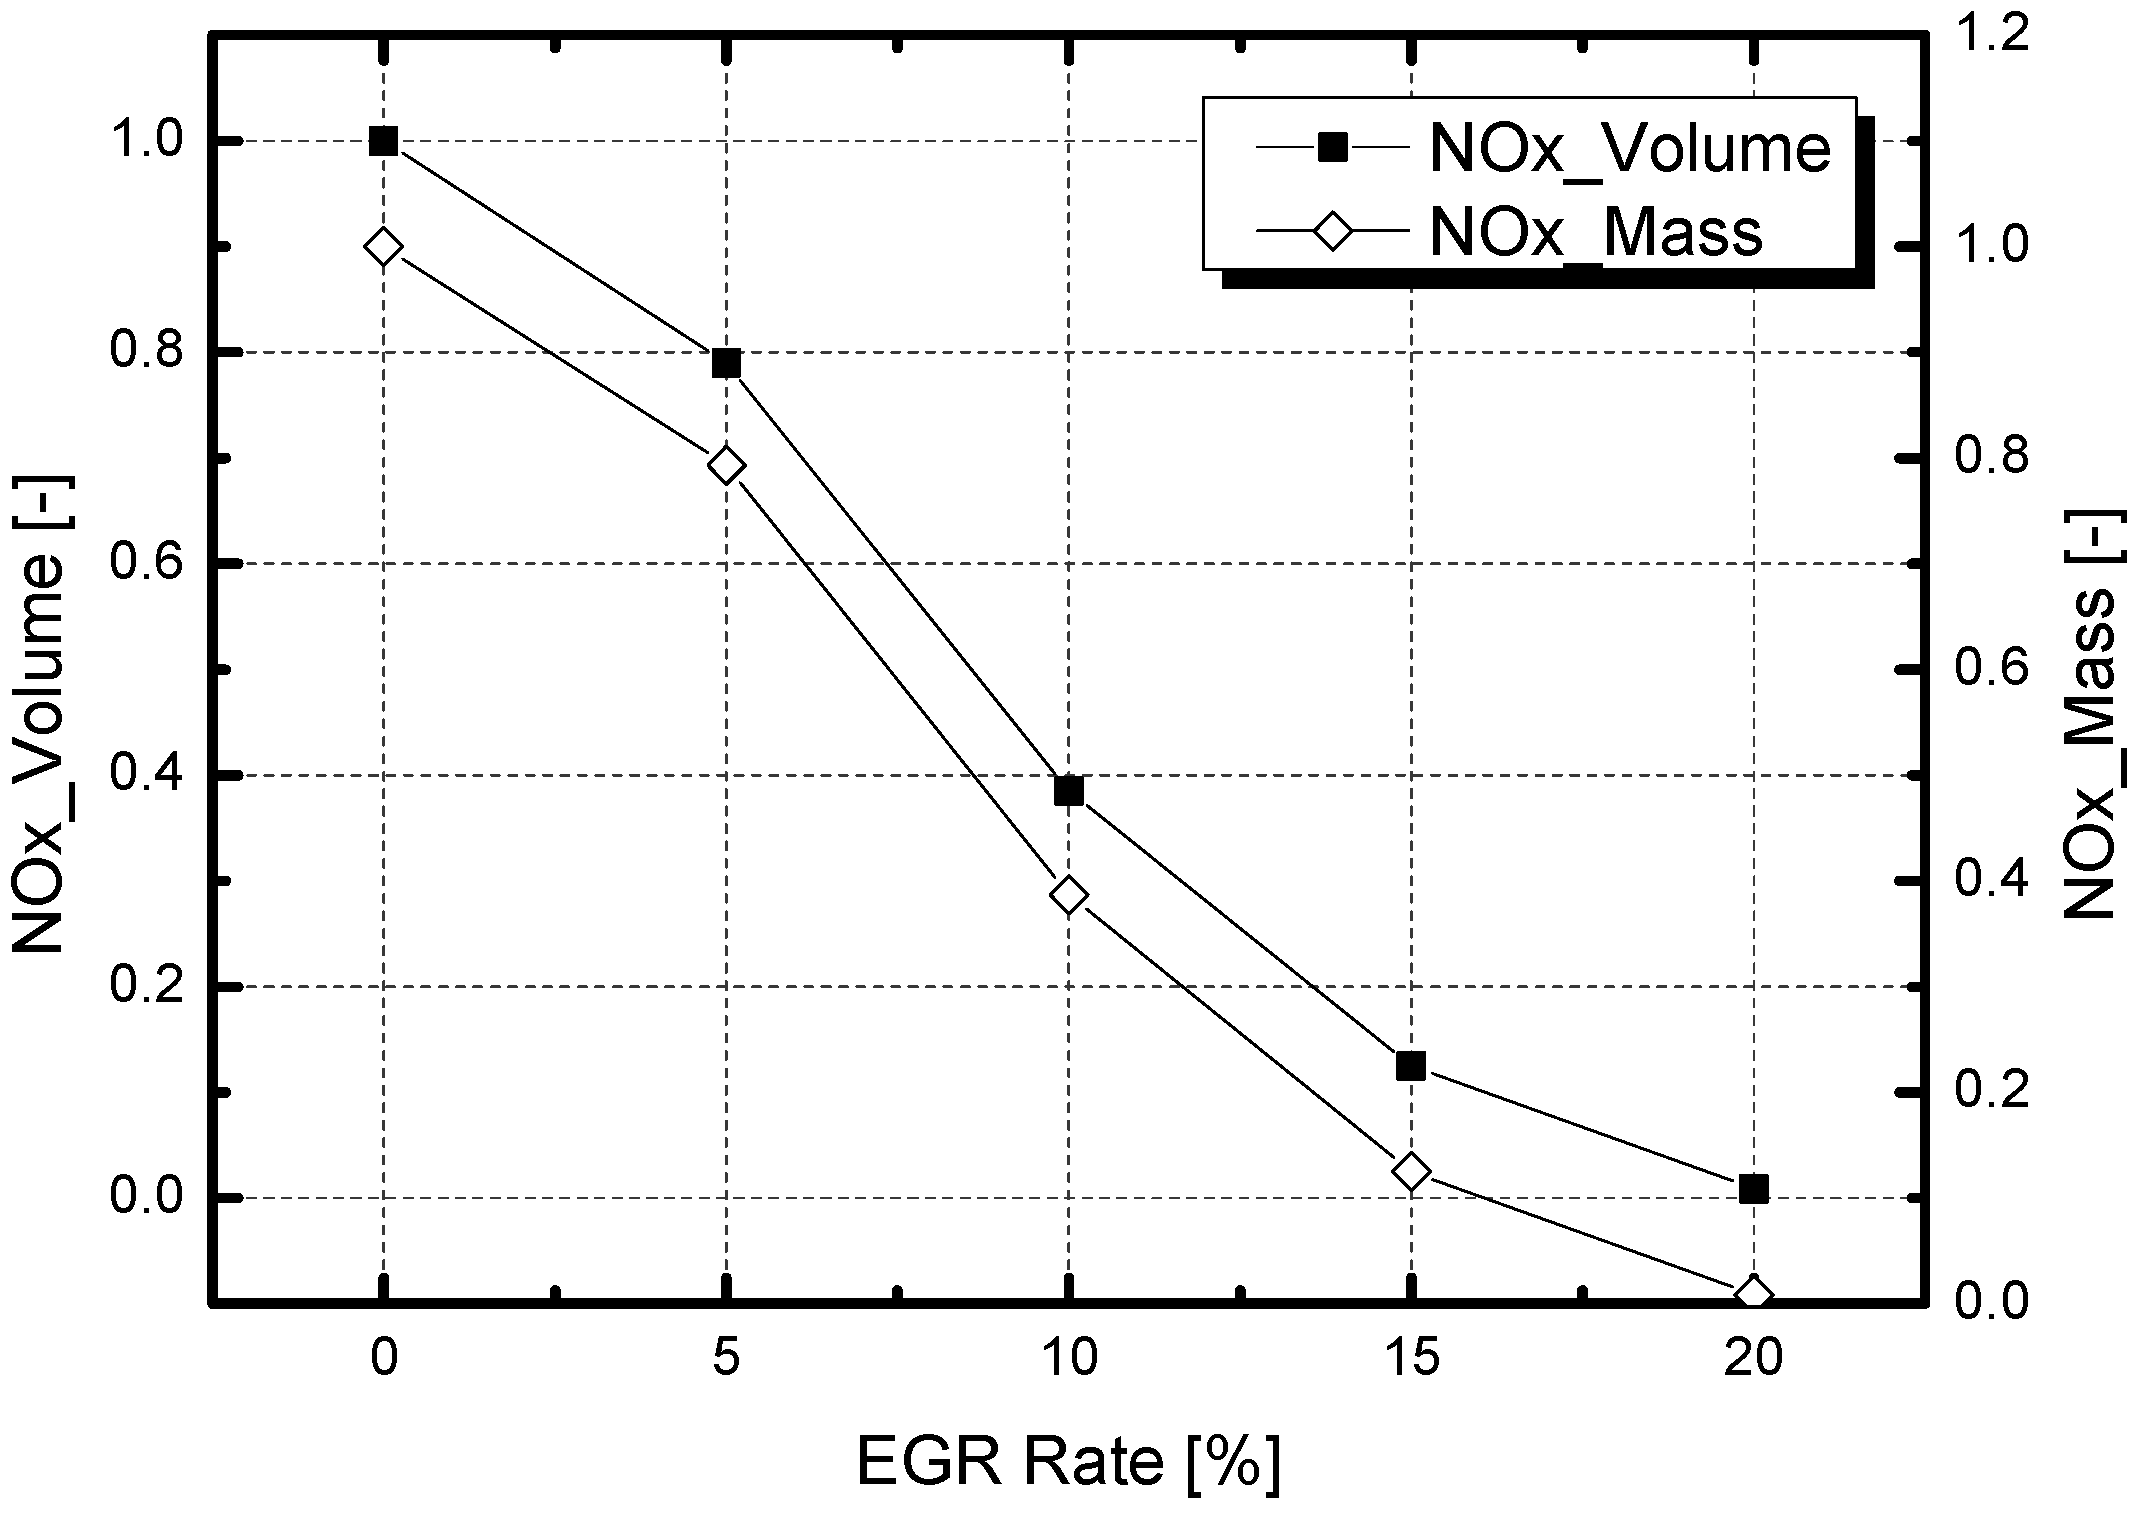
The NOx emission reduces with an increase of the EGR rate, as shown in
Figure 11, which shows the normalized NOx emission in the volume concentration and mass flow according to the EGR rate. Trends of NOx emission in the volume concentration and mass flow is the same because total moles are constant according to the EGR rate. The EGR rate decreases the oxygen concentration and increases the carbon dioxide and water vapor concentrations in the intake air. Carbon dioxide and water vapor, which have larger specific heats, replace oxygen in the intake air, and the total specific heat increases due to the mixing of the EGR gas with ambient air. Gas with higher specific heat requires more energy to raise the temperature a certain amount. Accordingly, high specific heat at high EGR rate makes the maximum temperature in the cylinder low for constant total heat release at all EGR rates. Since the formation of NOx is a function of oxygen density and temperature in the cylinder, a low maximum temperature and a high EGR rate leads to reduction of NOx emission.
Figure 11.
Normalized NOx emission variation according to EGR rate.
Figure 11.
Normalized NOx emission variation according to EGR rate.
In the normalized NOx emission map discussed in the preceding section, an increment of the equivalence ratio leads to an increment of NOx emission when the equivalence ratio is less than 0.9. However, the equivalence ratio changes due to the EGR gas decreasing the NOx emission. The difference between the emission analysis and the EGR system is the cause of the increment in the equivalence ratio. The total fuel amount change leads to an increase of the equivalence ratio in the emission analysis, and the oxygen concentration changes for constant fuel amount leads to an increase of the equivalence ratio in an EGR system. Equivalence ratio changes due to increases of fuel amount, and then increases the total heat release and the maximum temperature, whereas an EGR system replaces the increase in specific heat and decrease in cylinder temperature with a constant total heat release. Differences in the temperature trend cause differences in the NOx emission trend.
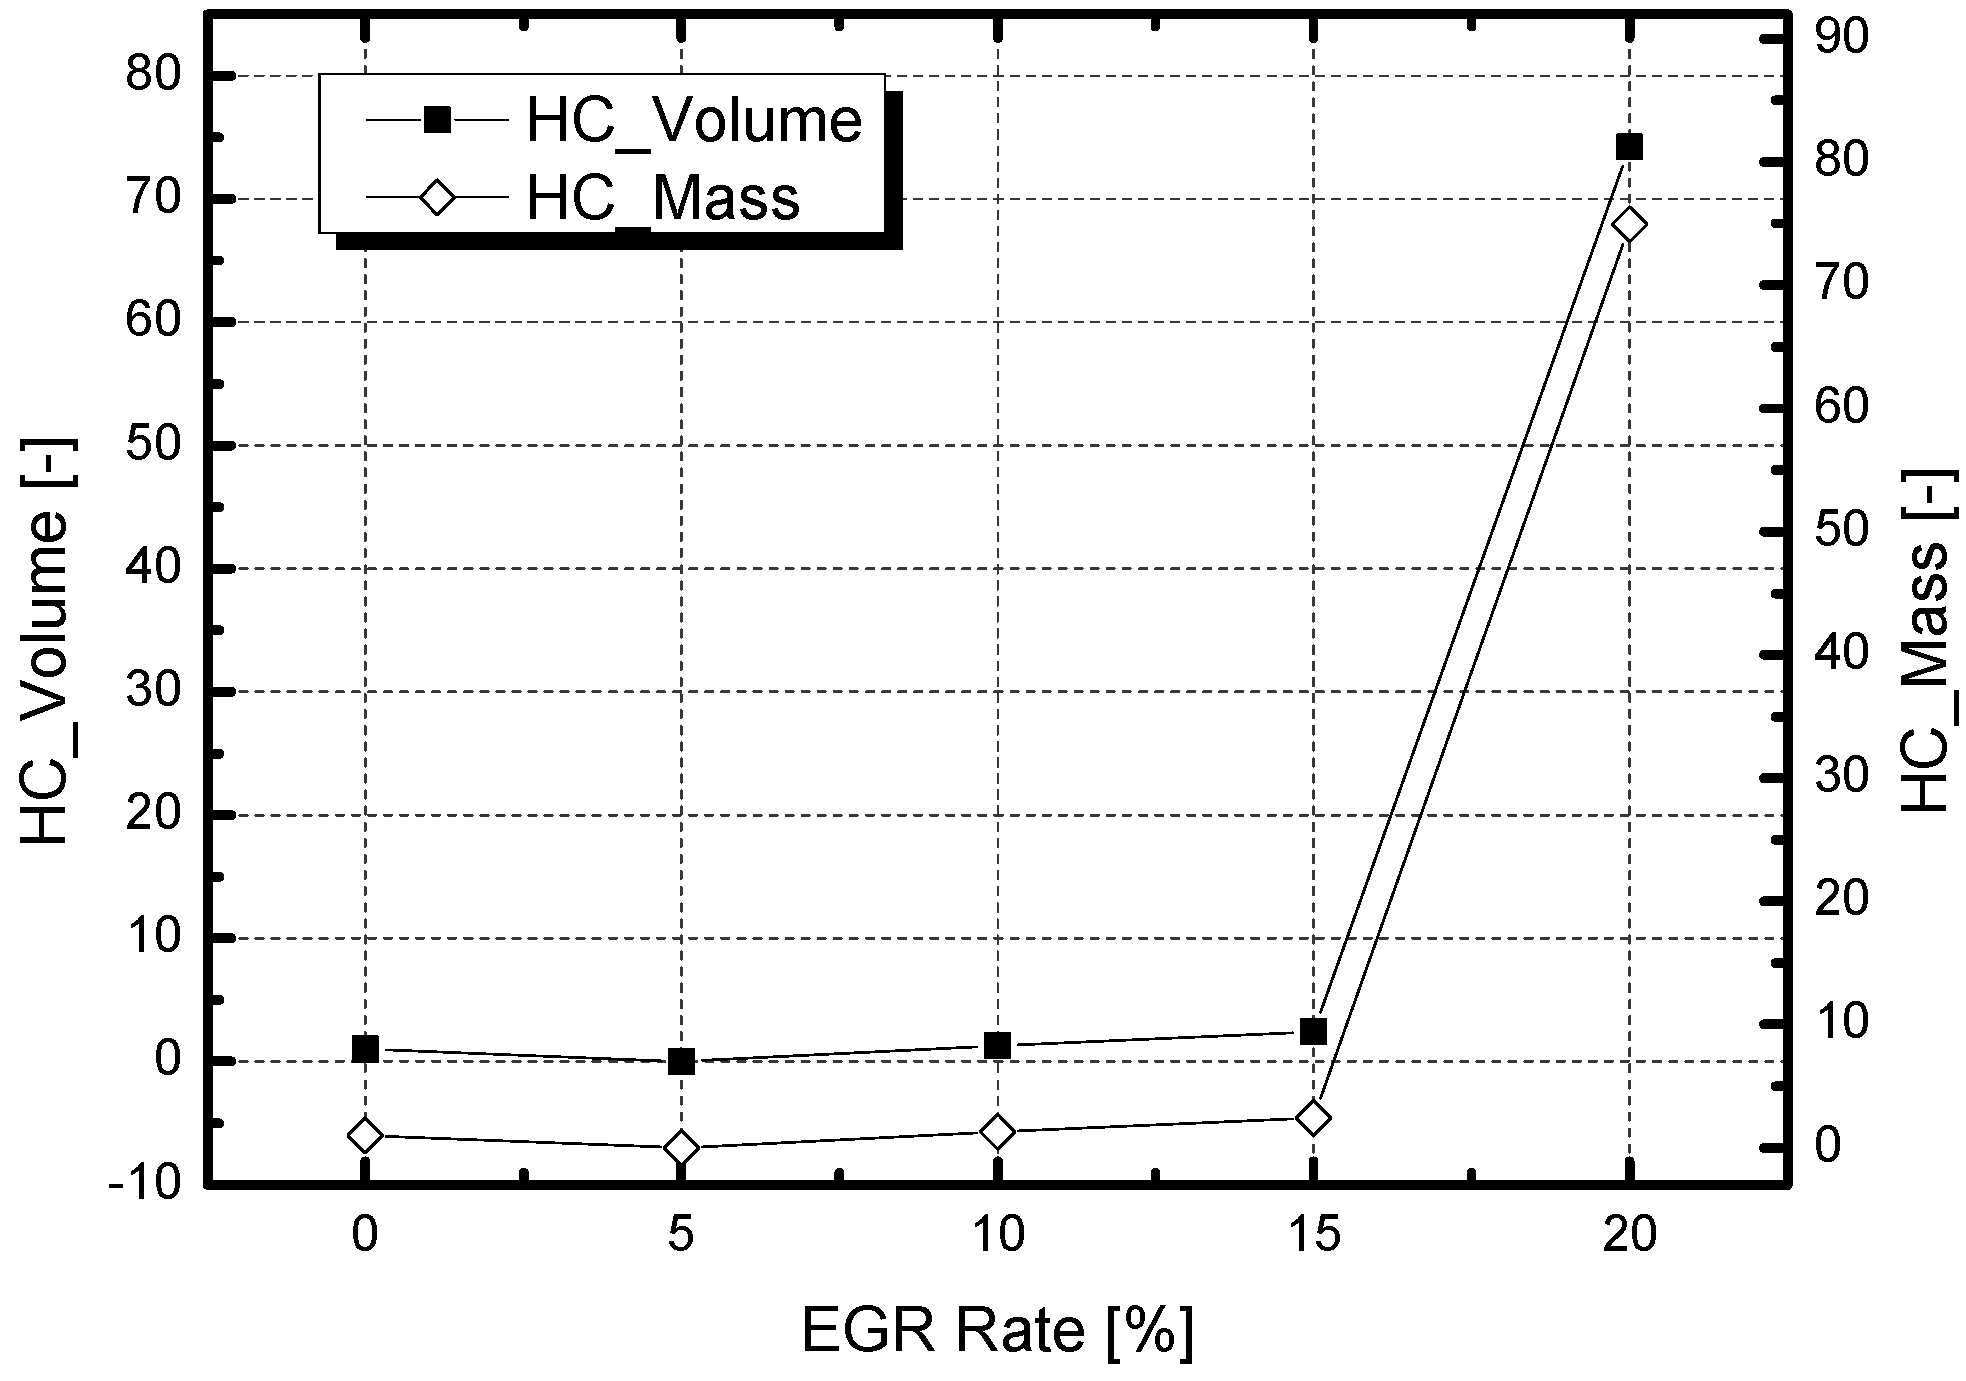
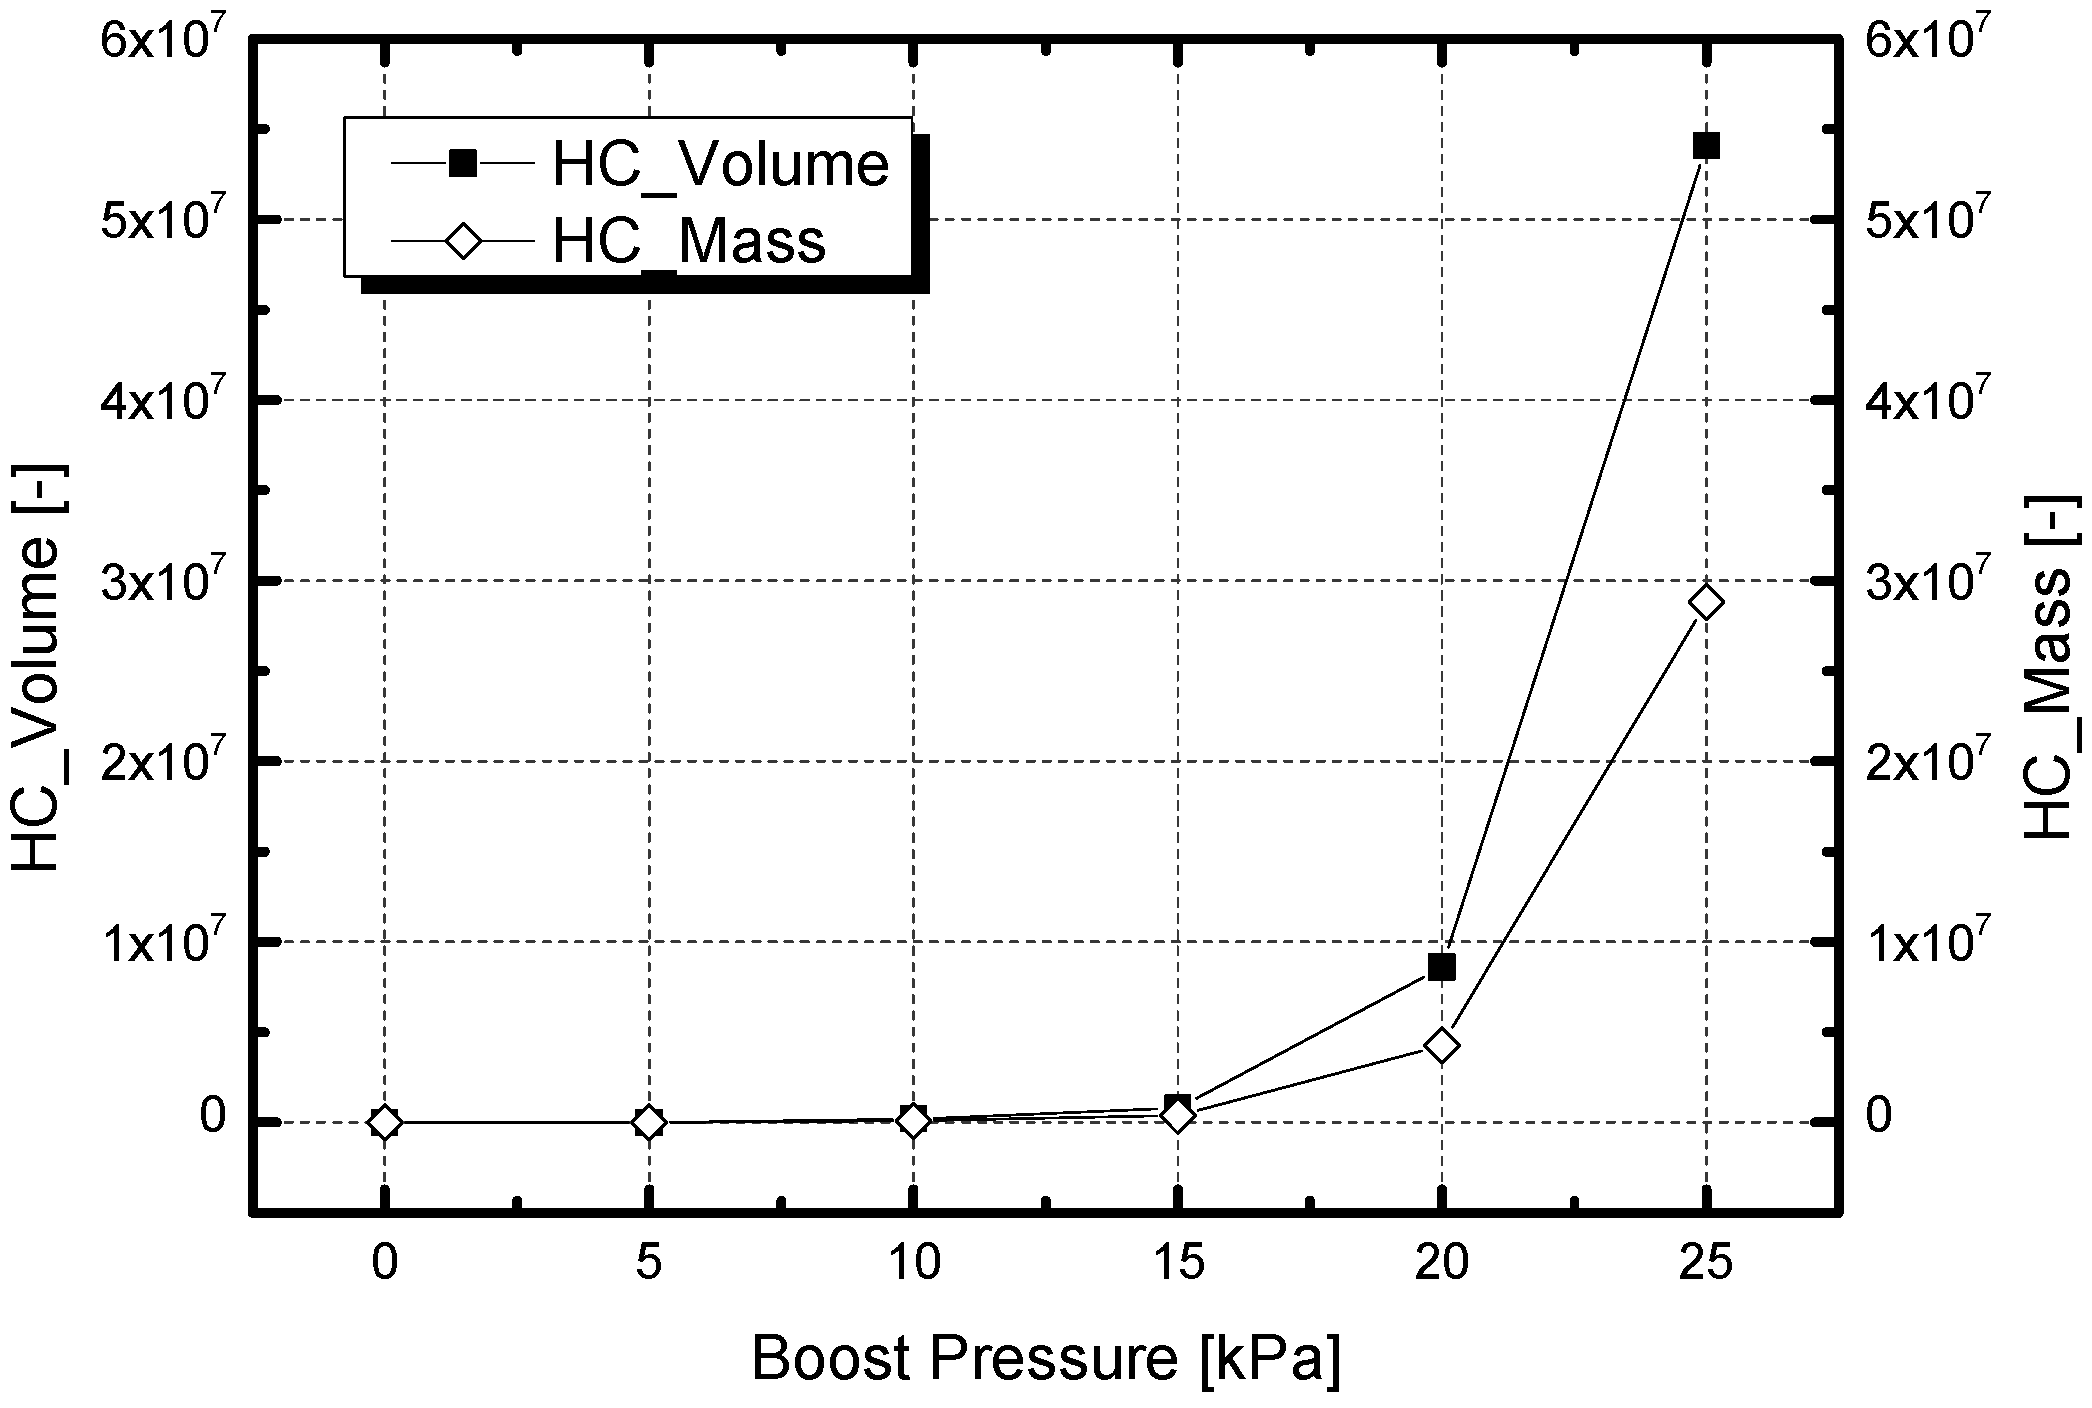
HC emission is also affected by EGR rate change, as shown in
Figure 12, which shows the normalized HC emission in the volume concentration and mass flow according to the EGR rate. Trend of HC emission both unit are same for the same reason mentioned in trend of NOx emission according to EGR rate. For EGR rates of 0% to 15%, HC emission has similar values. When the EGR rate is over 15%, the HC emission significantly increases, by about 30 times. The EGR gas including carbon dioxide and water vapor slows down the flame speed [
16,
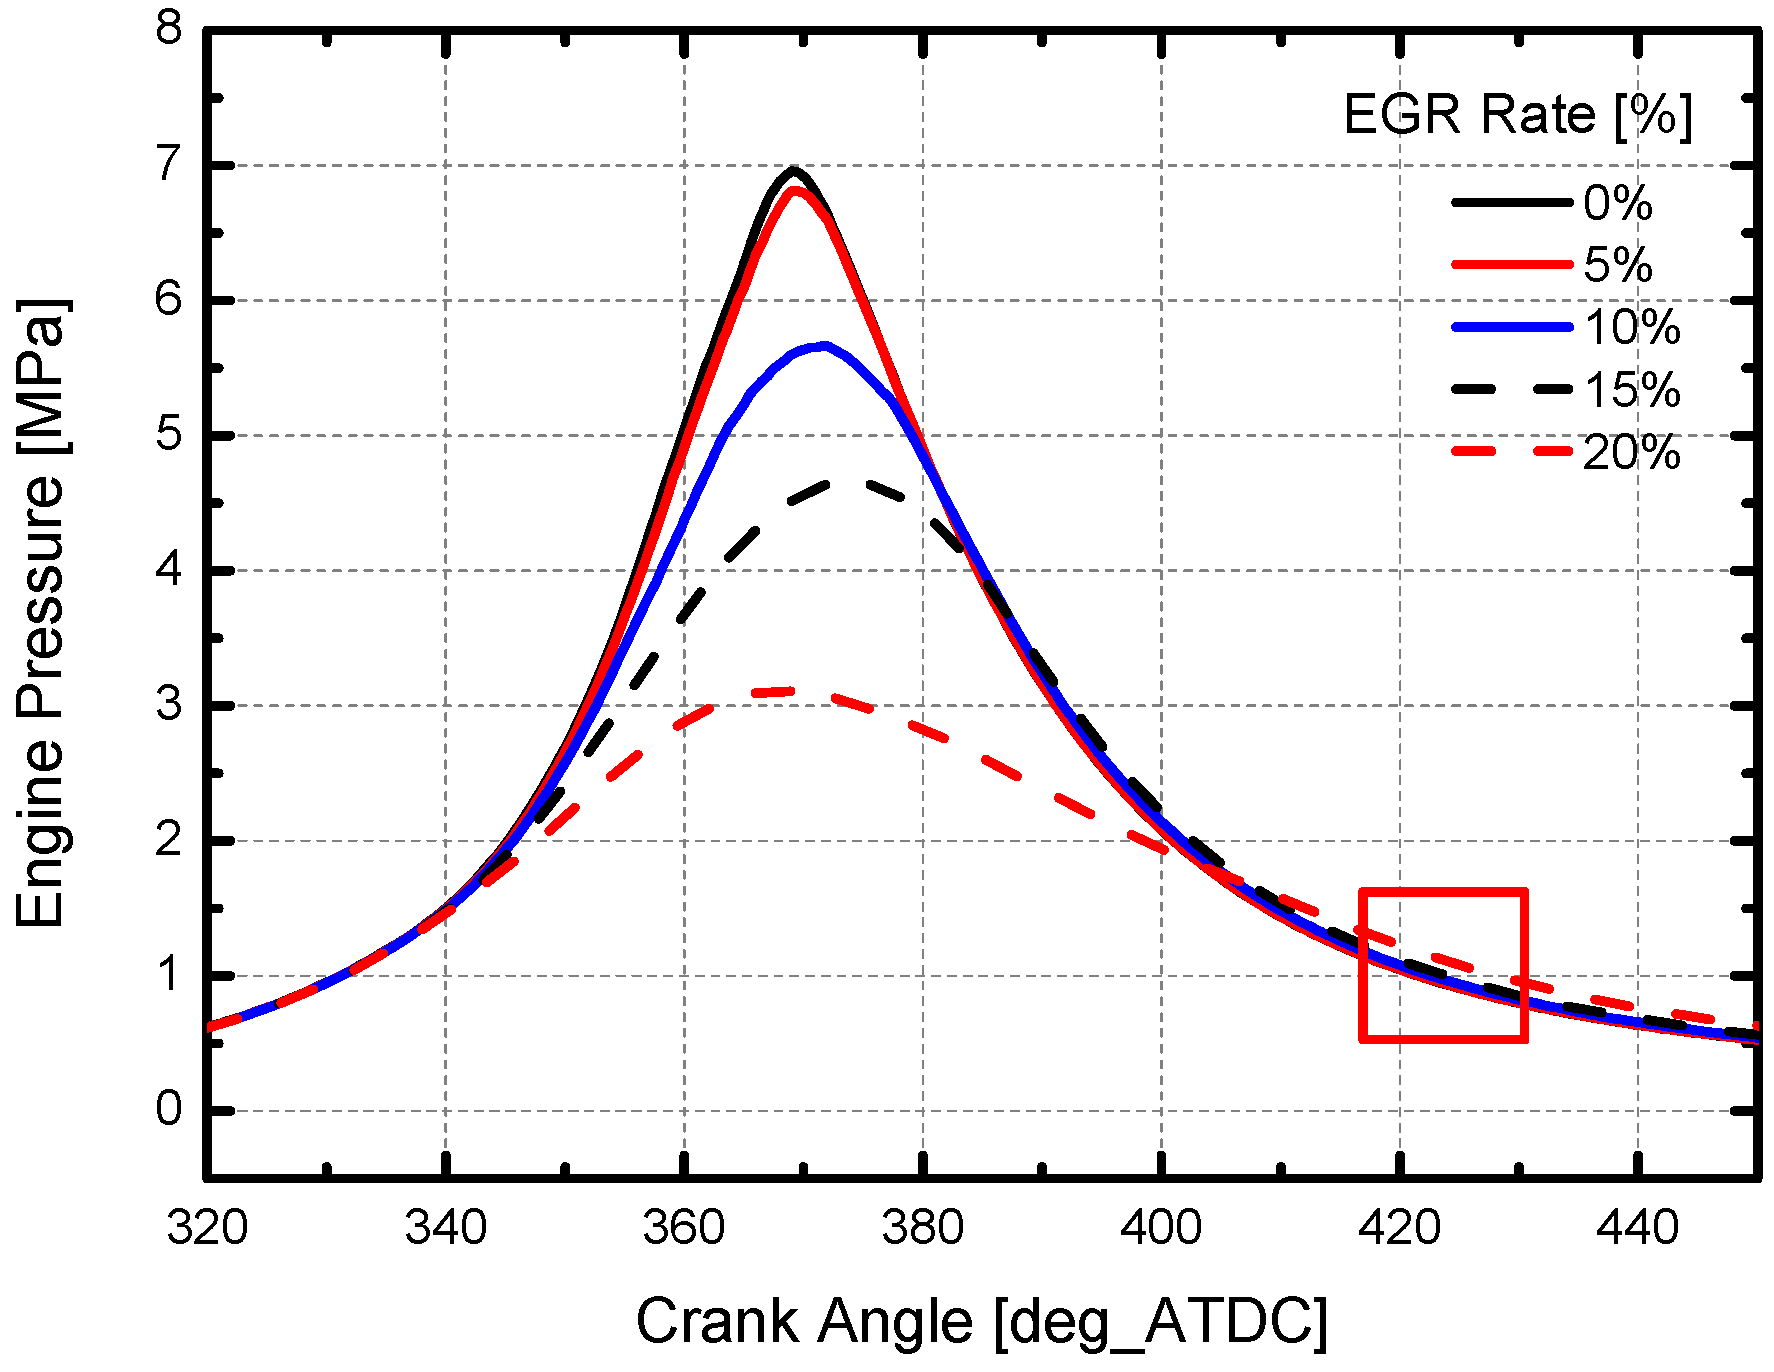
17]. Accordingly, the slowed flame speed makes the combustion duration longer. In the case of an EGR rate of 20%, the red square in
Figure 13 shows that combustion proceeds after the end of the combustion of other cases. Peak engine pressure decreases with increase of EGR rate because recirculated exhaust gas slows down flame speed and combustion duration gets longer. [
18,
19] Since the fuel at the end of the combustion at the 20% EGR rate burns in cylinder conditions of low temperature and pressure, combustion becomes unstable, and unburned fuel is emitted as HC.
Figure 12.
Normalized HC emission variation according to EGR rate.
Figure 12.
Normalized HC emission variation according to EGR rate.
Figure 13.
Engine pressure variation according to EGR rate.
Figure 13.
Engine pressure variation according to EGR rate.
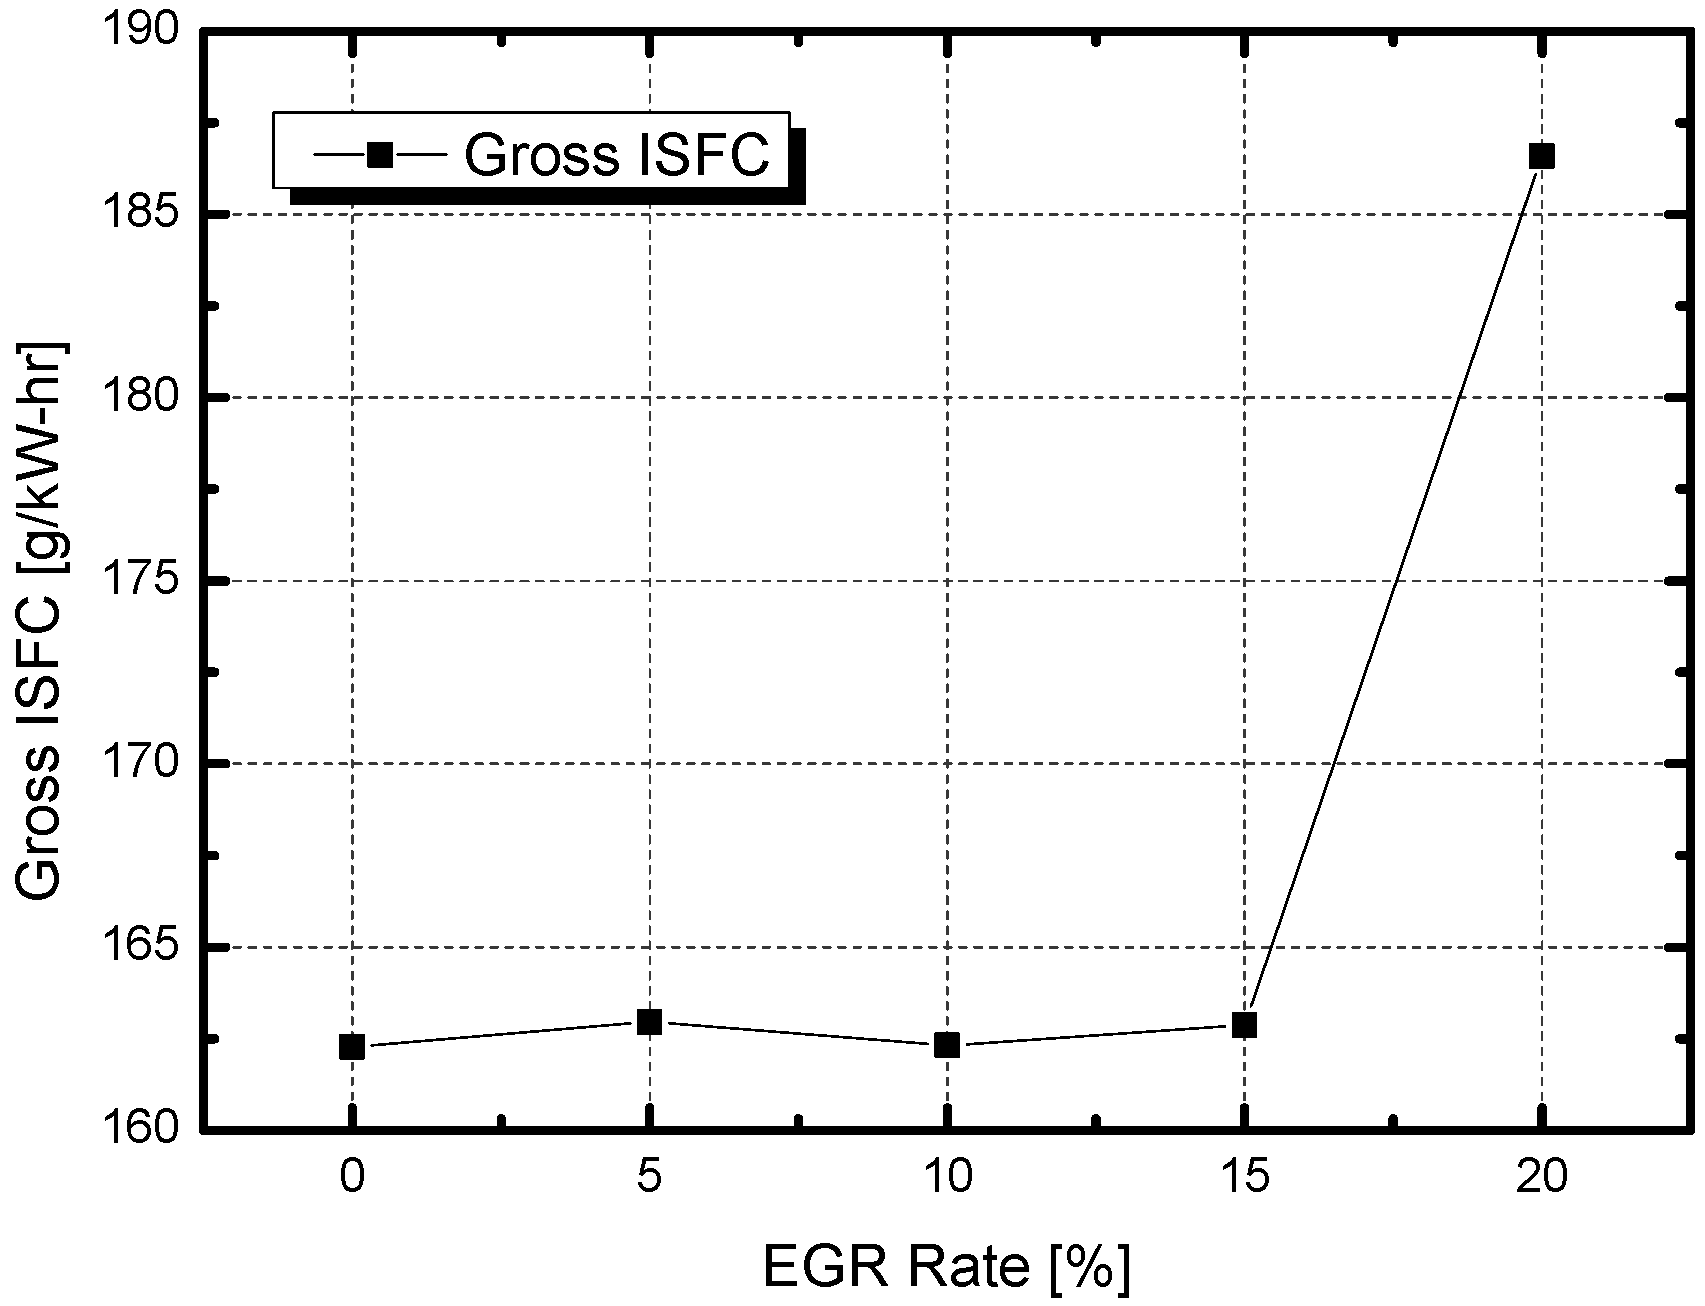
ISFC variation rapidly increases as the EGR rate increases from 15% to 20%, as shown in in
Figure 14, while ISFC values are similar at low EGR rates. Since ISFC is an index related to thermal efficiency, ISFC has smaller values when less fuel is consumed at constant power output. For constant fuel mass, ISFC has a large value when the power output is small. Flame speed for an EGR rate of 20% is so slow that fuel does not burn fully, and unburned fuel is emitted as HC. Accordingly, the burnt fuel amount during combustion is smaller than in other cases, and the generated power output is also smallest when the EGR rate is 20%. The low power output when the EGR rate is 20% leads to rapid increases of ISFC.
Figure 14.
ISFC variation according to EGR rate.
Figure 14.
ISFC variation according to EGR rate.
3.4. Effect of Boost Pressure on Performance and Emission Characteristics
The reference intake pressure is 100 kPa, and the intake pressure is determined by the boost pressure that is added to the reference pressure. The equivalence ratio for the reference case is 0.9.
Table 1 shows the decrement of equivalence ratio due to increases of intake air by the boost system because fuel mass in cylinder at IVC is constant according to boost pressure.
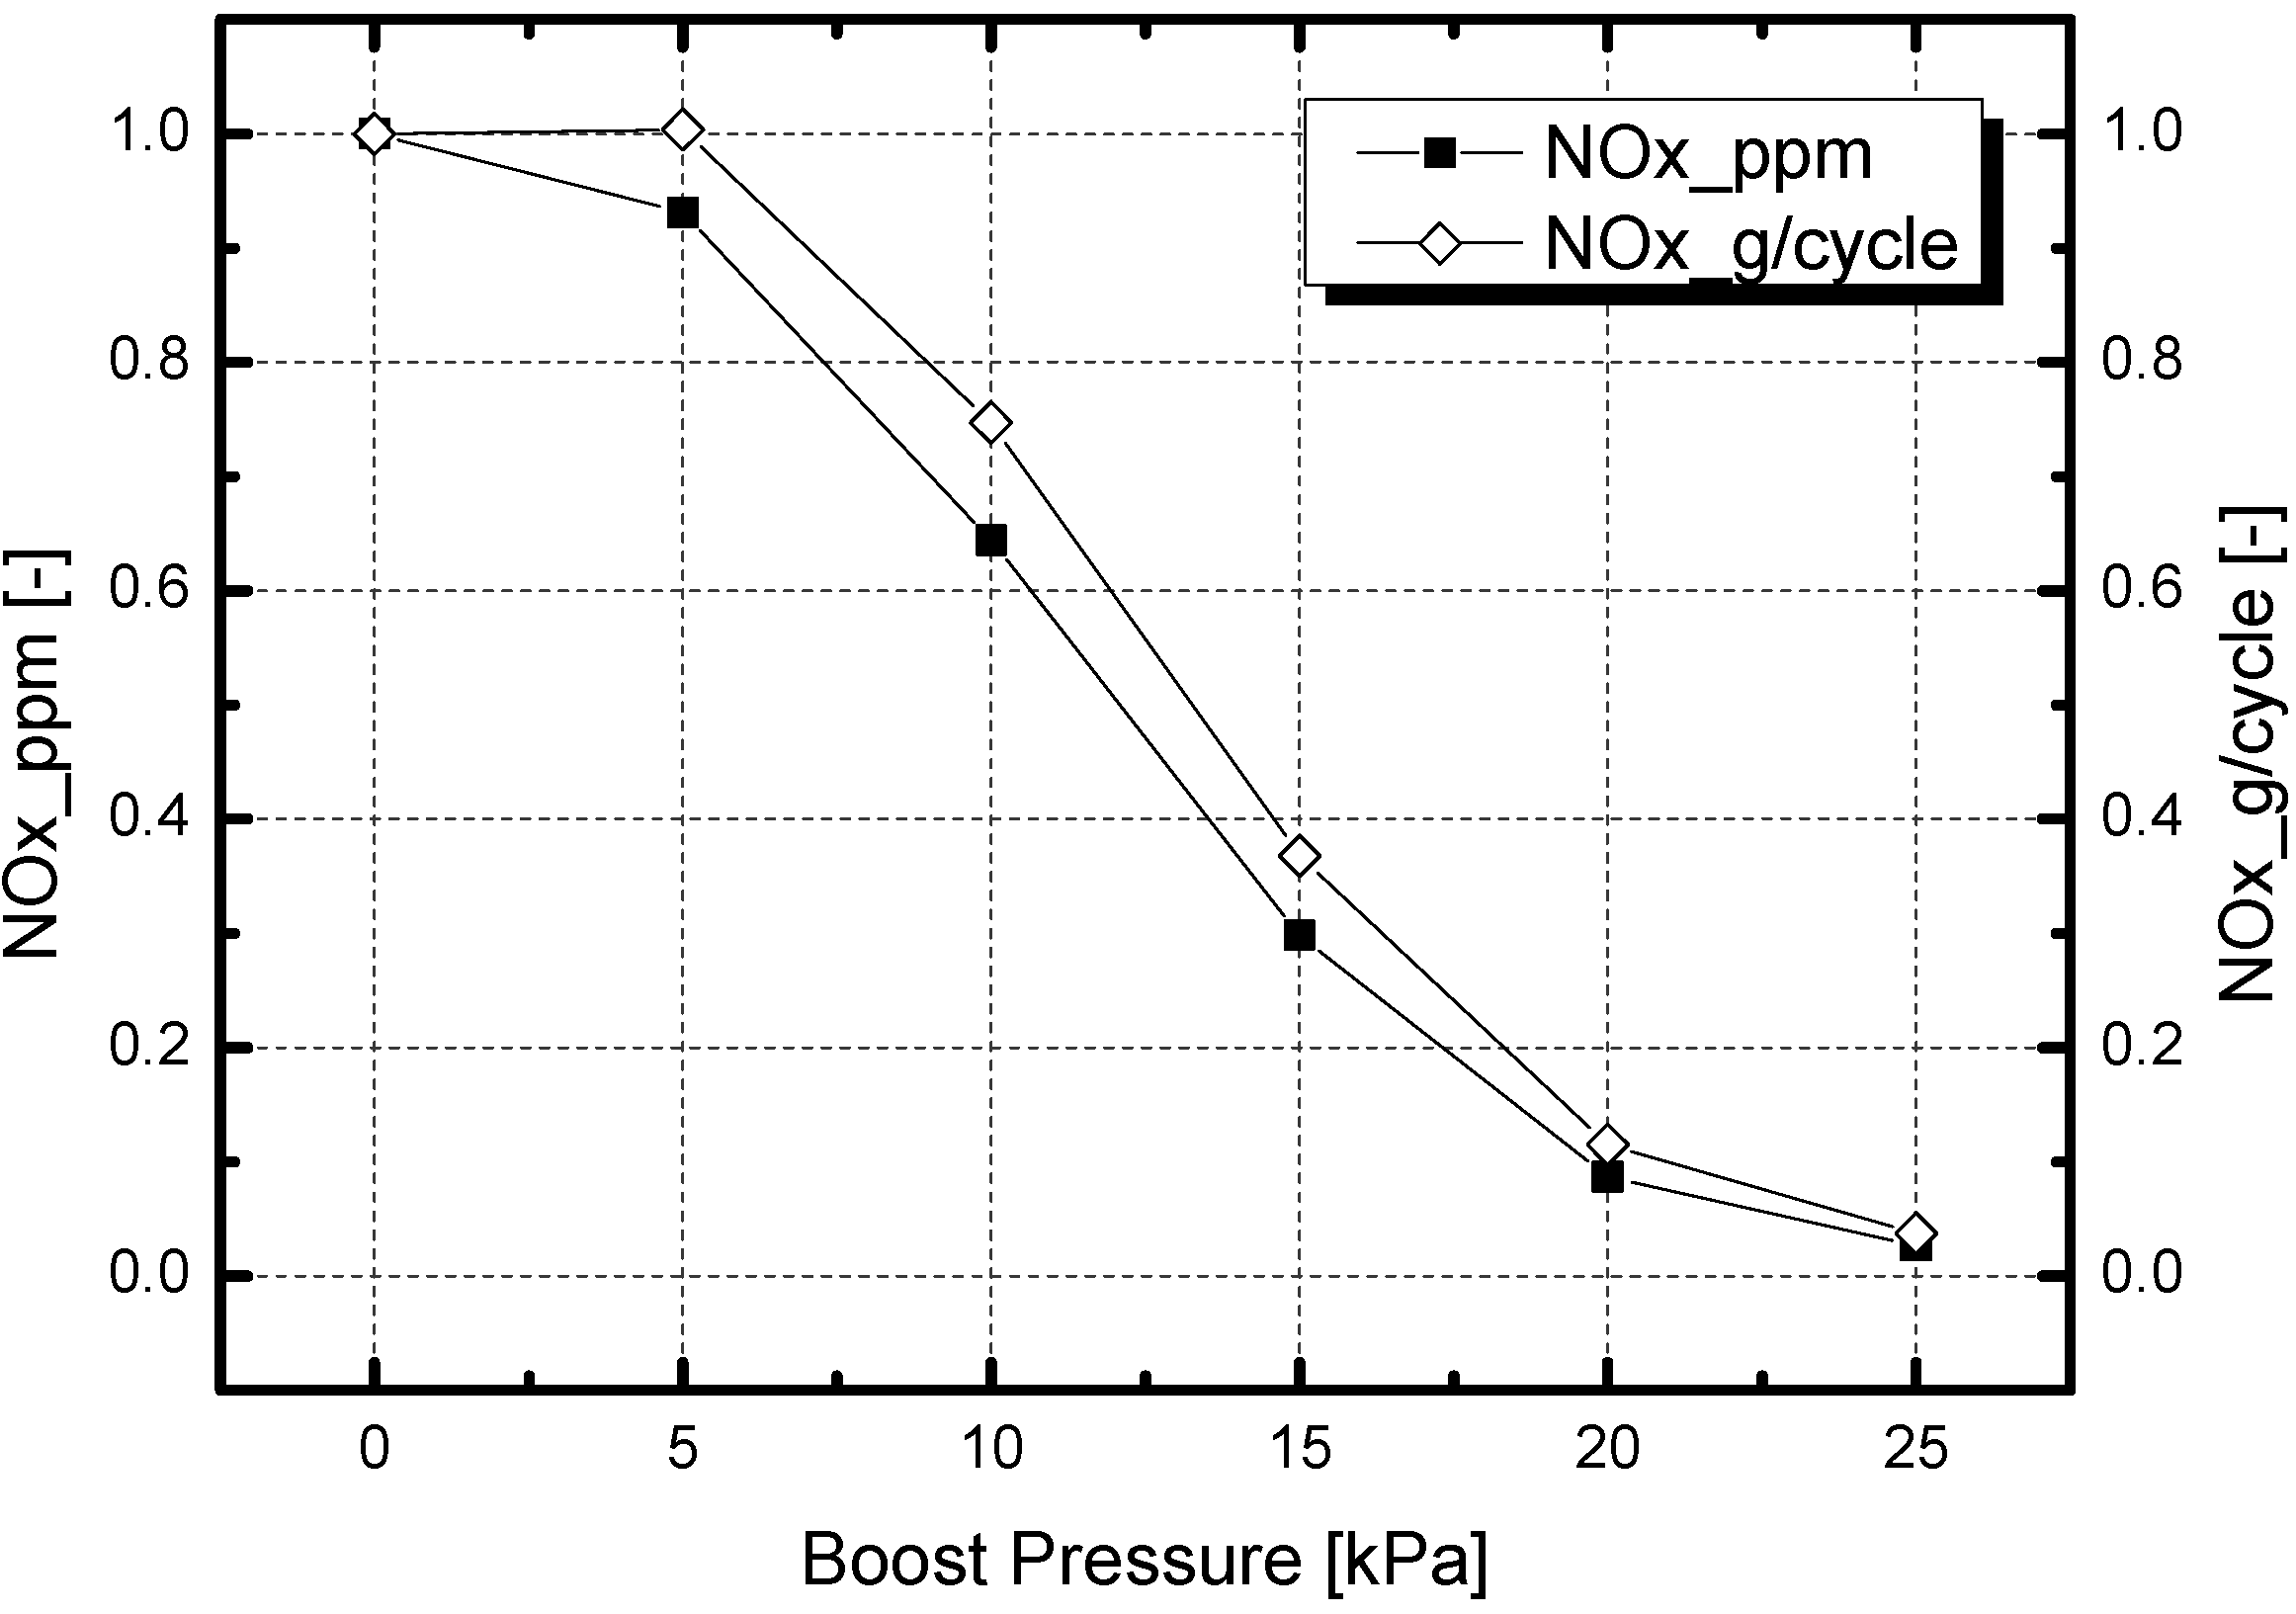
Figure 15 shows the normalized NOx emission in the volume concentration and mass flow for various boost pressures at a constant engine speed of 1500 rpm and an initial equivalence ratio of 0.9. NOx emission in the volume concentration decreases with an increase of boost pressure. With increased boost pressure, the total mass in the cylinder increases, and the thermal capacity increases. Because the total heat released is the same for all values of boost pressure, the maximum temperature decreases with an increase in boost pressure, due to a high thermal capacity. NOx formation is a function of temperature, where NOx emission decreases result from low temperature and high boost pressure. The decrement of NOx emission in the volume concentration is larger than the decrement in gram units because NOx emission in the volume concentration is calculated based on the total mass in the cylinder increasing with boost pressure.
Table 1.
Equivalence ratio according to boost pressure.
Table 1.
Equivalence ratio according to boost pressure.
| Boost pressure [kPa] | Equivalence ratio |
|---|
| 0 | 0.9 |
| 5 | 0.824439 |
| 10 | 0.763347 |
| 15 | 0.706864 |
| 20 | 0.657936 |
| 25 | 0.613594 |
Figure 15.
Normalized NOx emission according to boost pressure.
Figure 15.
Normalized NOx emission according to boost pressure.
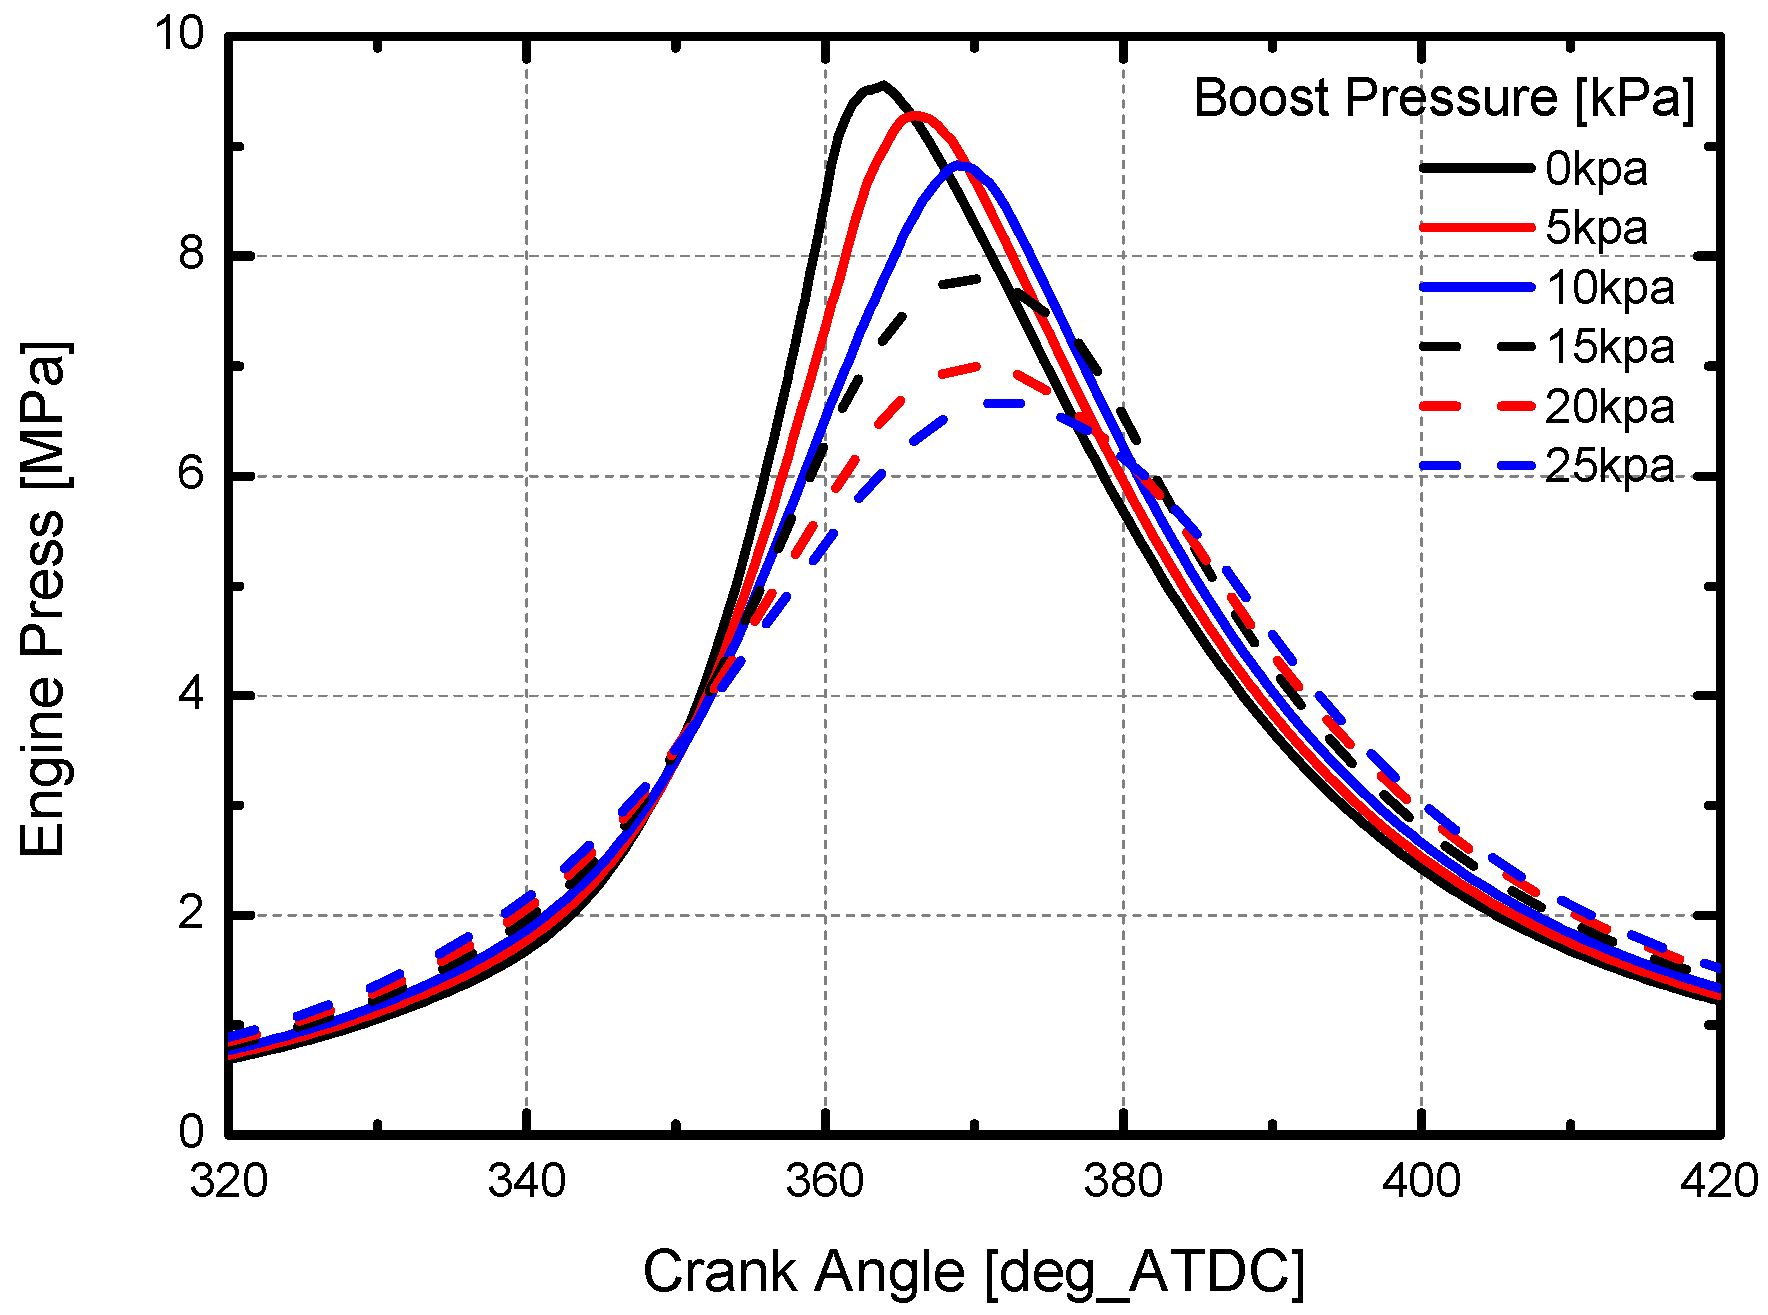
Normalized HC emission increases rapidly for boost pressures over 15 kPa, as shown in
Figure 16. The equivalence ratio decreases due to boost pressure, which makes the flame speed slower and combustion duration longer.
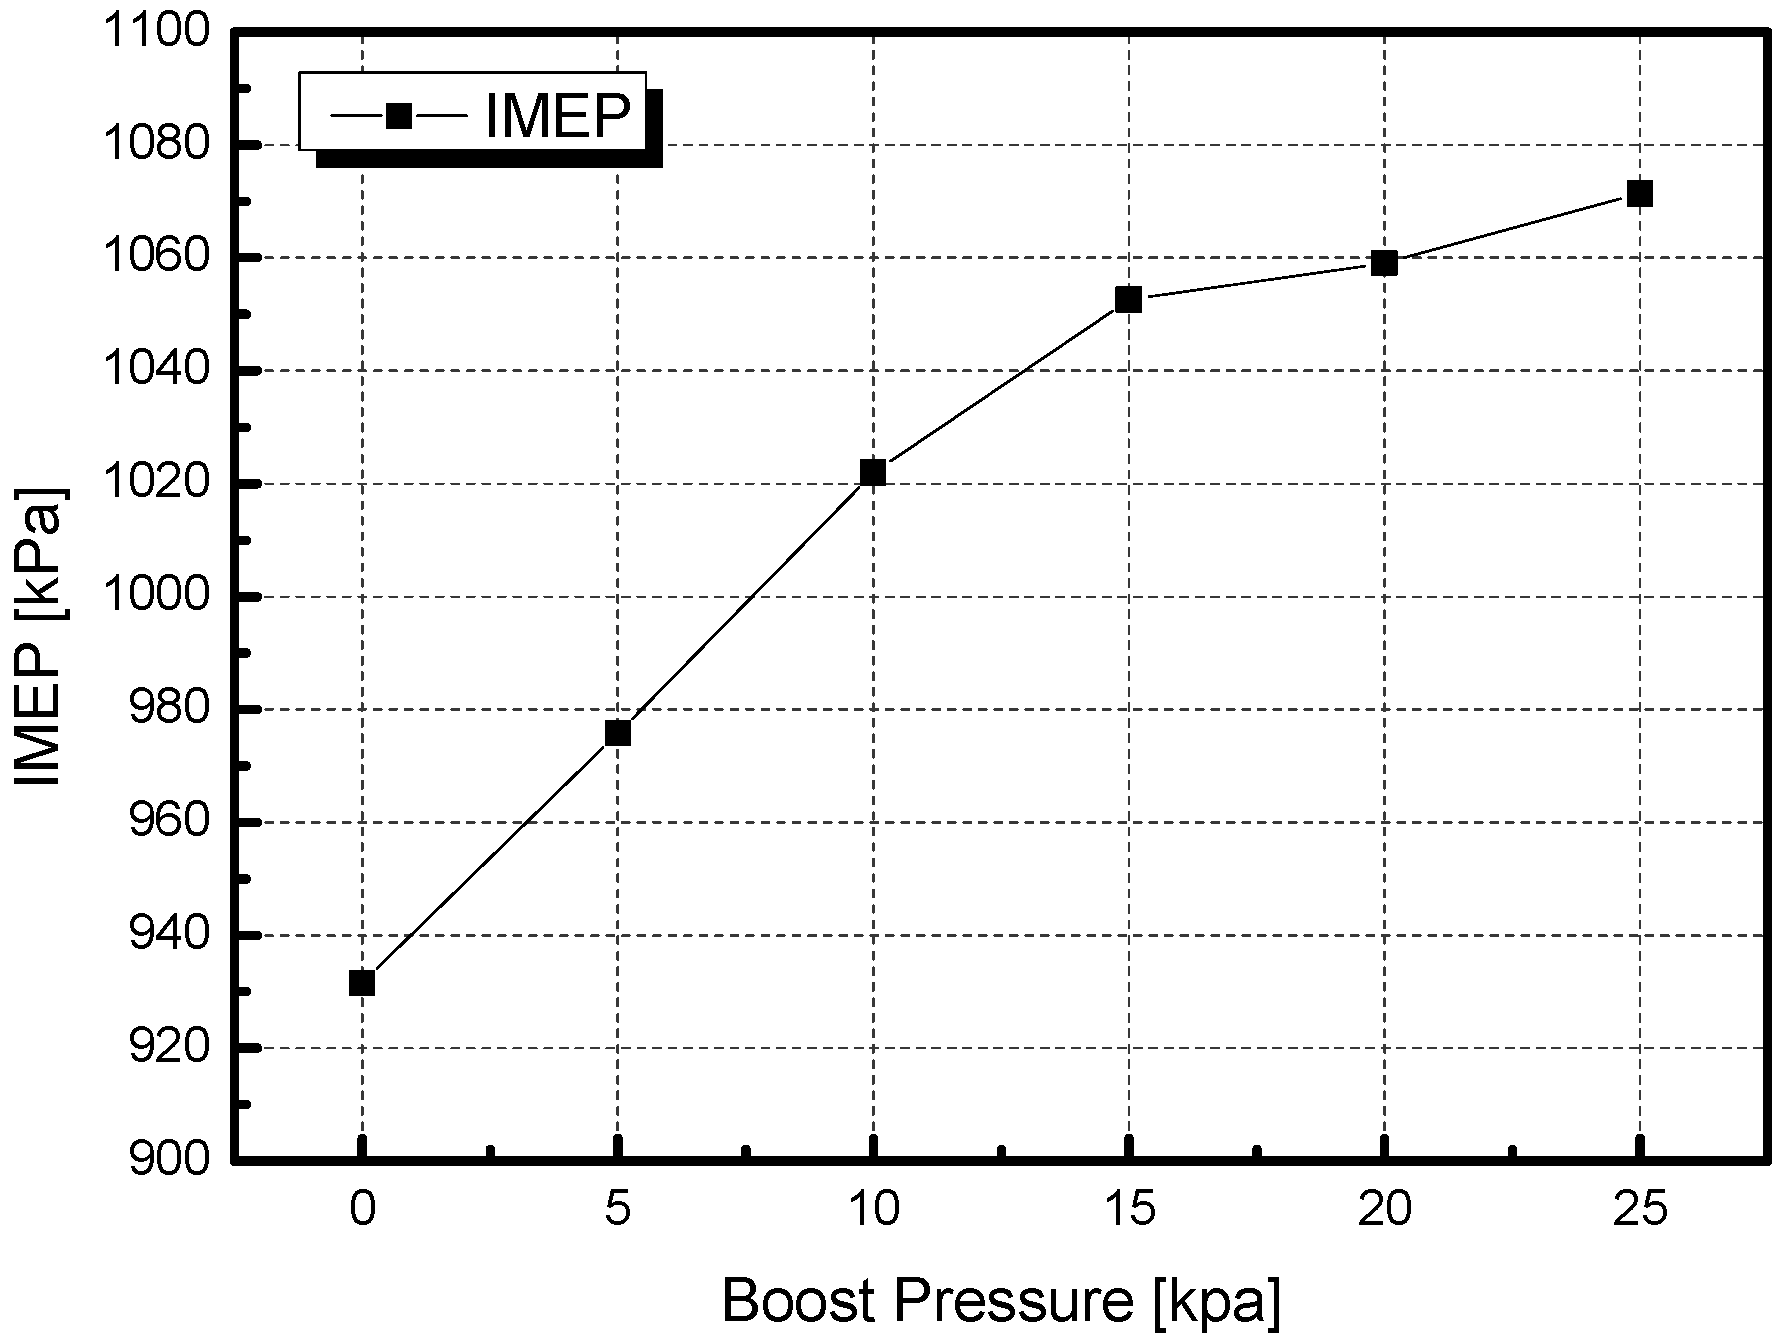
Figure 17 shows a low pressure rise rate in high boost pressure and combustion continues until the temperature and pressure in the cylinder are low. Unburned fuel at the end of the combustion due to low temperature and pressure is emitted as HC at high boost pressure. When flame speed is fast, more fuel burns before the TDC. Because pressure before the TDC works on compression loss, a fast flame speed would decrease the total work. In other words, a decrease of flame speed at high boost pressure leads to an increase of IMEP due to low compression work. Because fuel mass is constant, the ISFC is low at high boost pressure in
Figure 18.
Figure 16.
Normalized HC emission according to boost pressure.
Figure 16.
Normalized HC emission according to boost pressure.
Figure 17.
Engine pressure variation according to boost pressure.
Figure 17.
Engine pressure variation according to boost pressure.
Figure 18.
IMEP variation according to boost pressure.
Figure 18.
IMEP variation according to boost pressure.
4. Conclusions
In this study, to determine the combustion and emission characteristics, we investigated performance and NOx emission variation for equivalence ratios from 0.6 to 1.2 and spark timing from −34 to −20 deg_ATDC, using a validated analysis model. EGR and boost systems were applied. The following conclusions arose from this study.
(1) At a constant equivalence ratio, the IMEP decreases and the ISFC increases with greater compression loss. The maximum pressure increases with early spark timing, making the maximum temperature and the NOx emission increase. A high equivalence ratio increases the IMEP and the NOx emission due to the high pressure and temperature in constant spark timing. However, the NOx emission is low for equivalence ratios over 0.9 because the oxygen concentration is insufficient for NOx formation. Operating area of gas engines for GHP is early spark timing for high fuel efficiency in low load and late spark timing for fuel efficiency and exhaust emission in high load.
(2) The NOx formation is a function of temperature and oxygen concentration, so an EGR system is applied to reduce the oxygen concentration and temperature by increasing the specific heat with increasing carbon dioxide and water vapor concentration. The reduction of NOx emission is about 96% due to the increase of the EGR rate from 0% to 20%. However, an increment of the EGR rate has a negative effect on the HC emission and the ISFC for EGR rates over 15%. Significant increase of HC emission means incomplete combustion of fuel and it leads to negative effect on efficiency. Considering NOx reduction and fuel efficiency, maximum EGR rate is 15% and 88% of NOx is reduced with retaining engine performance.
(3) At constant fuel mass, boost pressure makes more air enter the cylinder, resulting in a low equivalence ratio. The equivalence ratio decreases with increases of boost pressure, and the flame speed slows down. A slow flame speed and increase of mass flow make the peak pressure and temperature in the cylinder low and the NOx emission decrease. Over 15 kPa of boost pressure, HC emissions significantly increase and that means fuel combustion is incomplete and unburnt fuel is emitted as HC, while boost pressure improves the IMEP and the ISFC in entire region. Maximum boost pressure is 15 kPa and NOx emission is reduced 70% at maximum boost pressure.
(4) Gas engine for GHP can be operated in economic zone by engine performance and emission map at entire load. NOx emission is reduced by the operating engine in minimum emission area and applying EGR and Boost systems. Decrement of NOx emission is large in EGR system, but boost systems decrease NOx emission with improving fuel efficiency. Improvement of engine performance and emission can be achieved by late spark timing and boost systems.


