1. Introduction
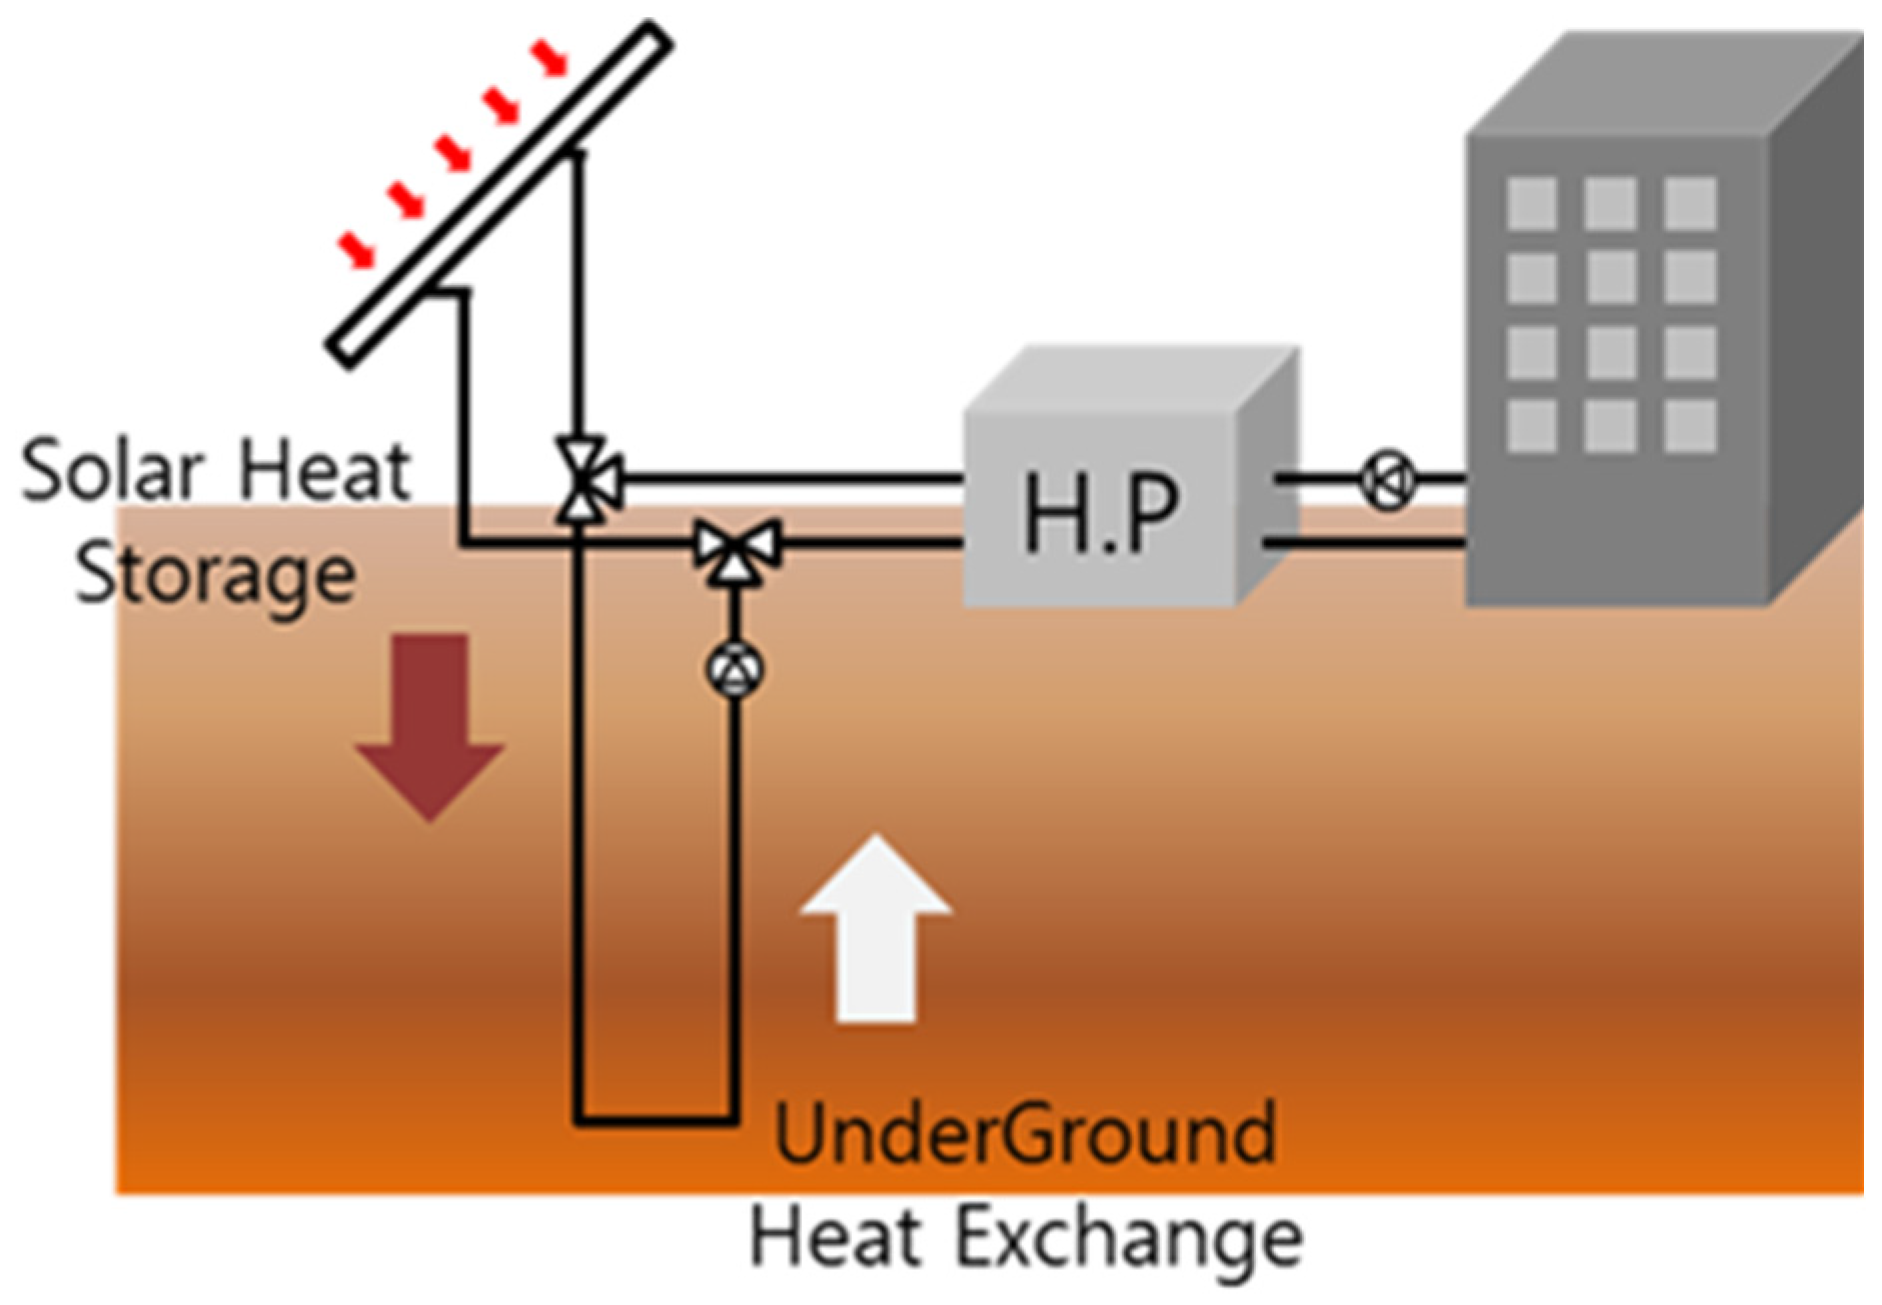
Recently, technologies for saving energy and greenhouse gas reduction have attracted attention from people to prevent global warming. Issues of environmentally friendly architecture and energy saving techniques have also been raised. Currently there are various regulations on energy consumption in different countries all over the world. There are still difficulties in dealing with problems associated with increasing energy demand, especially those during peak electricity demand periods. To solve these problems, technologies enabling the application of new renewable energy have emerged. Of them, geothermal heat pumping systems, has been expected to realize an effective saving in heating and cooling energy because it can exploit the geothermal power that is stable all year round. However, the comparatively high cost associated with the installation of such facilities and limited sites suitable for such installation have slowed the propagation of such facilities. To avoid these obstacles, technology that increases system performance by integrating geothermal source with another heat source system or reduces the capacity of equipment to be installed has emerged as an alternative way to exploit geothermal energy. Besides, heat (thermal energy) storage systems can resolve the issues of temporal discrepancy between the demand and the supply of thermal energy. Ground heat pump systems have the merit of utilizing the relatively stable underground temperatures, however, during long-term heating operation, the underground temperature will gradually go down due to heat extraction from the ground and, as a result, the system performance also decreases. As the solution against this problem, hybrid systems with other heat source systems are suggested and used in the system building field. The use of solar heat could be good choice for heating dominant buildings. Generally, solar heat collection systems consist of a solar heat collector, thermal storage tank, and circulation pump. The solar heat collector is the essential equipment for the system, but a thermal storage tank is additionally required when there is the discrepancy between the energy collection time and use time. Although thermal storage tanks have the advantage of easy application, they require additional space and installation costs, which sometimes are not small. Therefore, in this research, an underground heat storage system using solar heat was developed without the thermal storage tank.
Recently, many researchers have studied systems for underground heat storage [
1,
2]. Wang and Qi [
3] have conducted performance analysis of a heat pump system using underground heat storage of solar energy in residential buildings based on experimental data. The results found that the efficiency of the heat storage was over 70%. They studied on suitable ratio between the tank volume and the area of solar collectors, which was found as 20–40 L/m range. Seo
et al. [
4] conducted an analytical assessment of the performance factor of heat storage systems using solar heat collectors. It was found that the effect of the collector efficiency and heat loss factor on system performance was significant. Park and Kim [
5] have identified the applicability of horizontal geothermal systems using heat storage in a greenhouse. Benli and Durmus [
6] have used the heat storage system of a greenhouse and performed an analysis during the coldest month of a year. Their results revealed the diameter of pipe at over 1 inch (25.4 mm) with coefficient of performance (COP) of a ground source heat pump (GSHP) system ranging from 2.3 to 3.8. Jeong [
7] have examined the static heat storage time of a slab heat storage air conditioning system by analyzing surveyed data and found that the optimal duration of heat storage should be about 7 h.
In addition, research on the media of heat storage systems has been conducted. Vanhoudt
et al. [
8] have applied an aquifer heat storage system (ATES) in a hospital with a high energy demand level. They conducted an economic analysis based on experimental data obtained from 3 years of monitoring. They found a reduction of 71% in energy consumption compared to a gas boiler installation with a payback period of 8.4 years without any subsidy. The amount of annual cost savings was € 54,000. Hesaraki
et al. [
9] have compared and reviewed the efficiency of each heat storage systems by examining the seasonal heat storage system literature. They found that seasonal thermal energy storage systems were more efficient for collective regional development than for single dwelling residences with a corresponding level of investment within 20%–30% per square meter of single dwelling residence. Bony and Citherlet [
10] have developed a numerical model for analyzing heat storage sets in which phase change material (PCM) is used. After comparing their analysis results to data obtained from monitoring, they verified the feasibility of heat storage using PCM through an analytical and experimental approach. Miro
et al. [
11] showed that by-products from the potash industry are suitable for thermal energy storage materials through verification experiments. Tiari
et al. [
12] developed a finned heat pipe-assisted latent heat thermal storage system and analyzed the performance of the system through numerical modeling. As a result, it was confirmed that the natural convection could accelerate the charging and reduce the total charging time of approximately 30%. Furthermore, Shabgard
et al. [
13] developed a thermal network model in order to examine the performance of a latent heat thermal energy storage system combined with heat pipes. The model used the phase change process, the heat transfer process and the melting-solidification process.
However, few studies have examined the application of geothermal energy for underground heat storage systems. In this study, in order to analyze the performance of an underground storage system with solar heat, numerical simulation was conducted using a ground heat transfer model, a heat exchanger model and a surface heat flux model. This paper is focused on the effect of heat storage rate on the ground heat exchange rate.
3. Results and Discussion
Results of the analysis on heat collection performance of each case with or without the operation of underground heat storage are shown in
Figure 4,
Figure 5,
Figure 6 and
Figure 7. Case 1 was operated with underground heat collection only. For Case 2, a 20 m
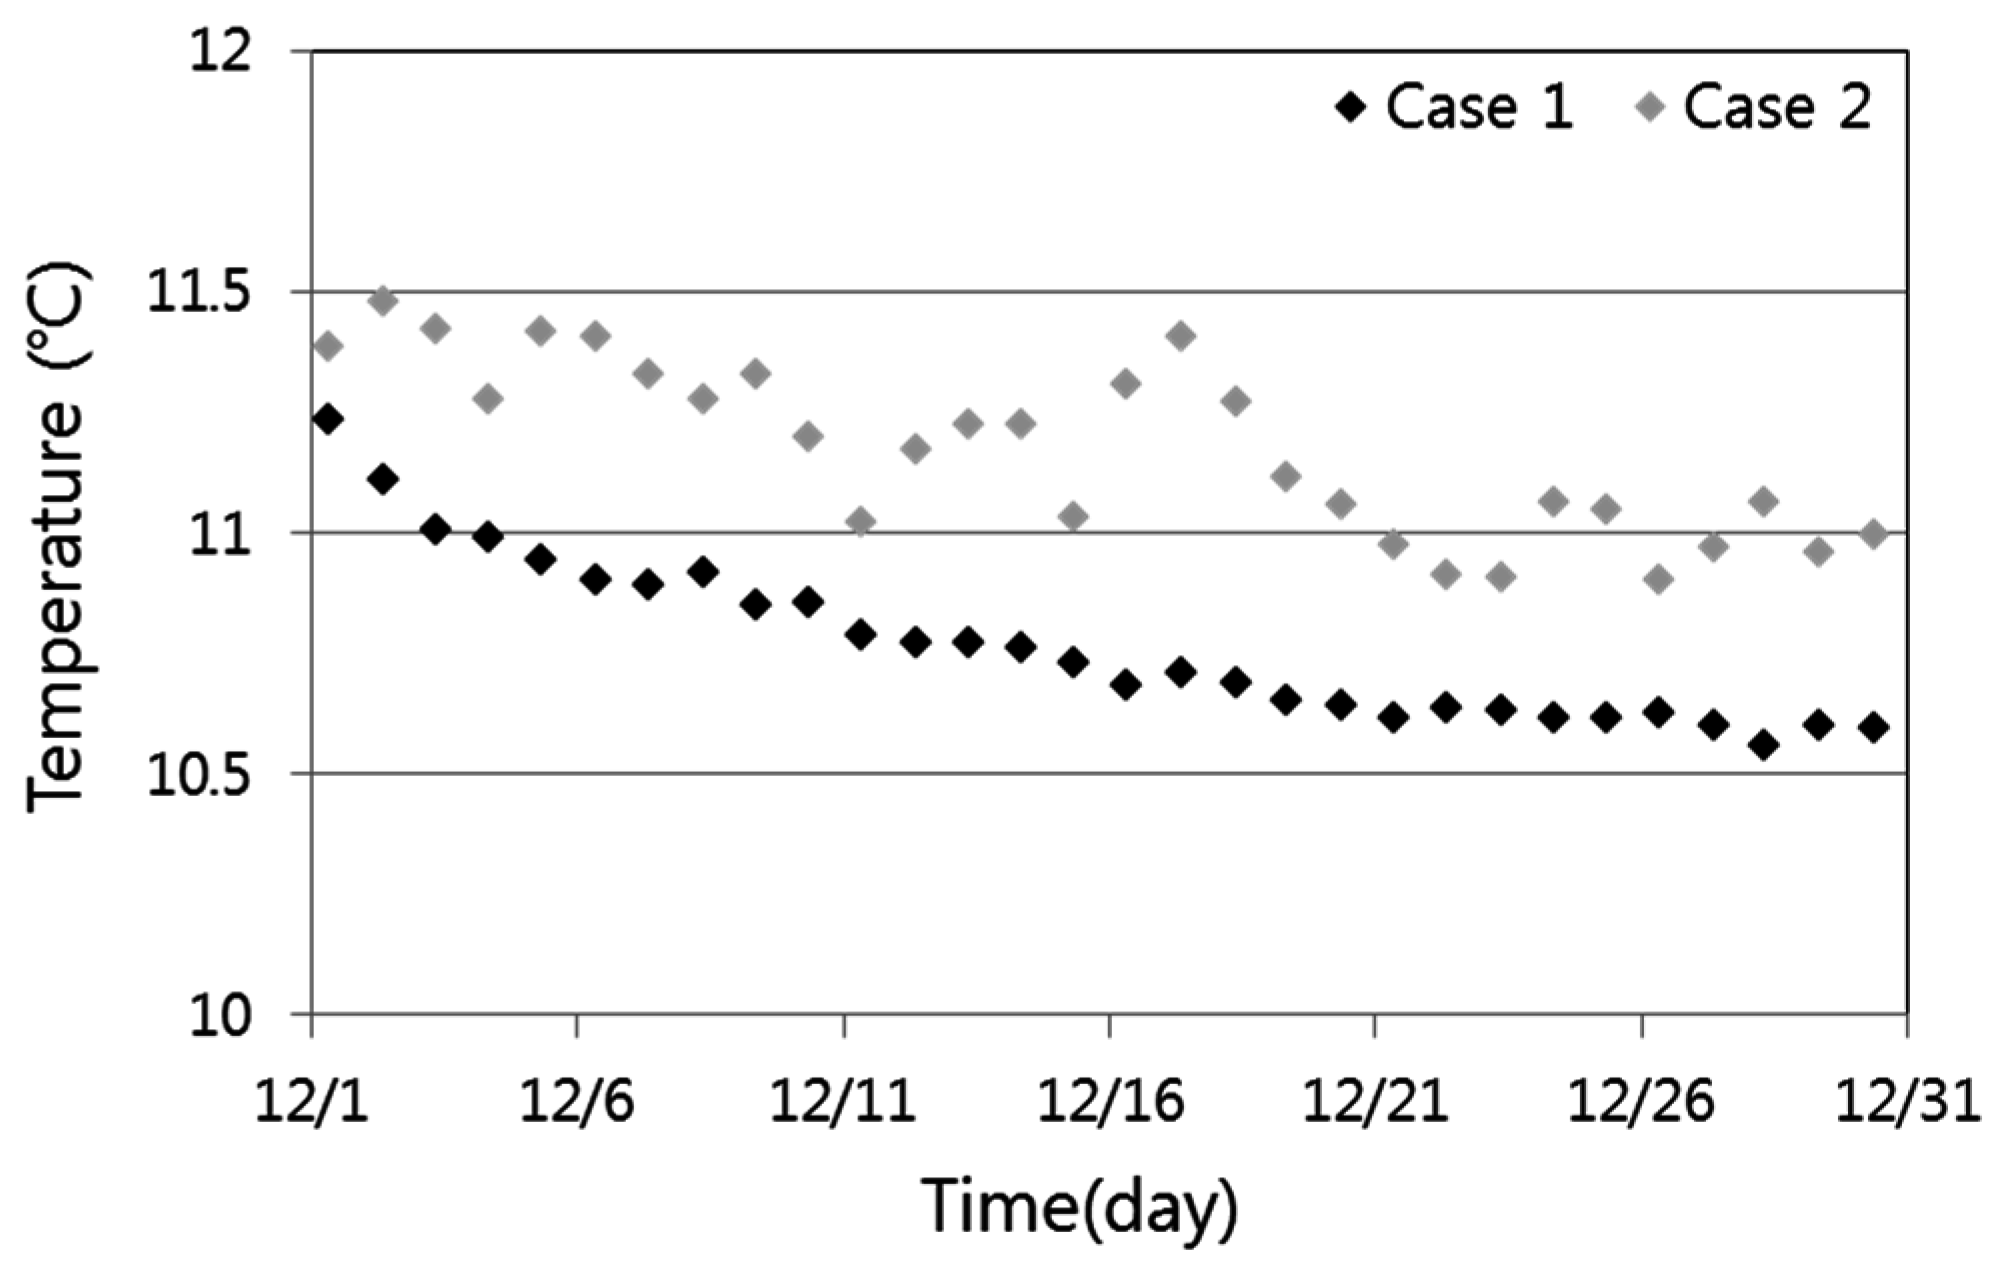
2 solar collector was installed. In addition, the operation of heat accumulation and heat collection were conducted simultaneously for 3 h. Daily average outlet temperature of circulation water during heat collection is shown in
Figure 4.
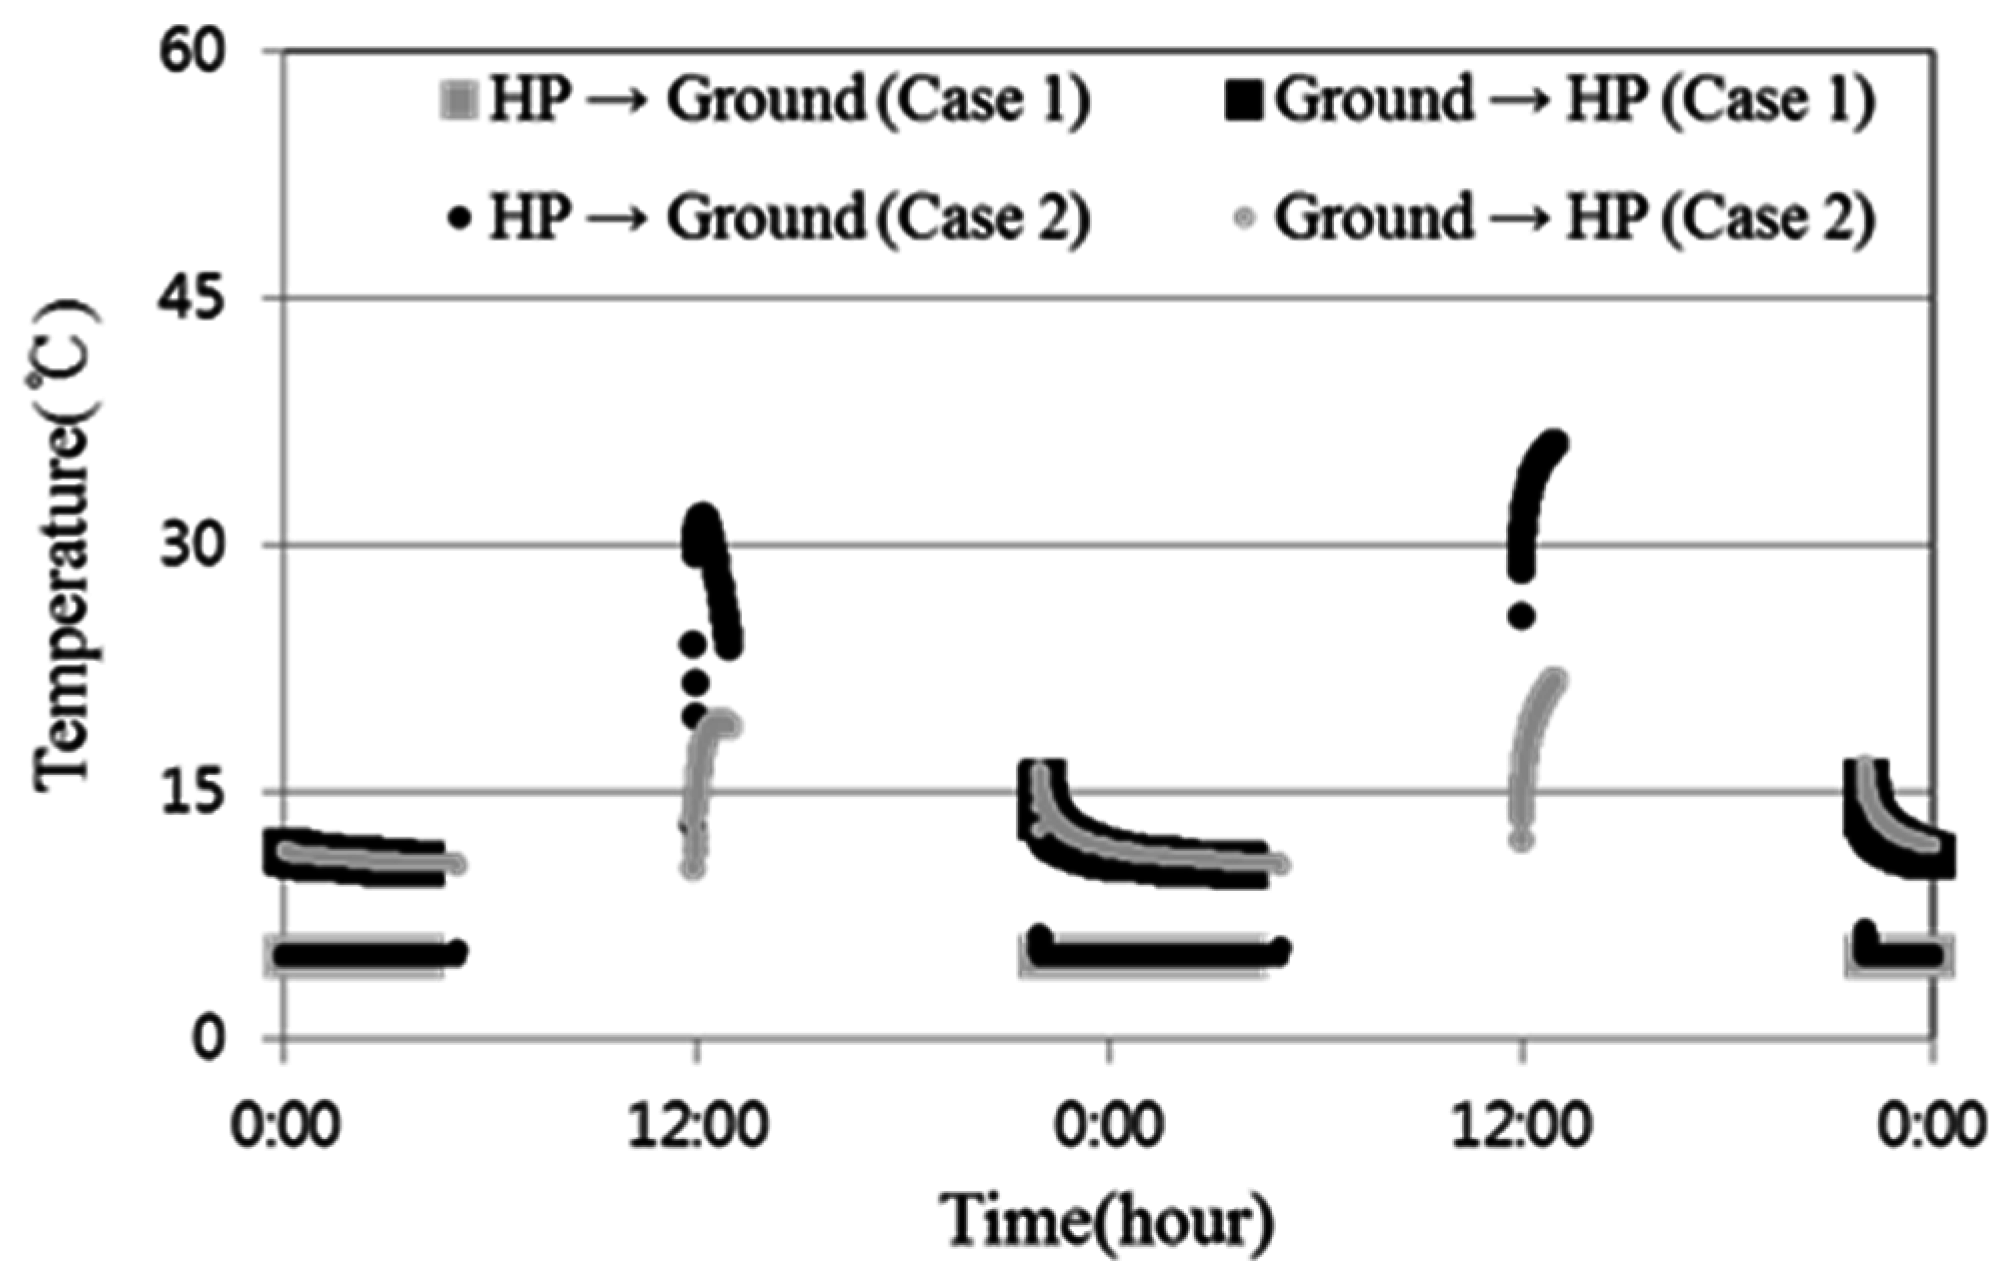
Figure 4 shows the daily average outlet temperature of circulation water during heating operation in Cases 1 and 2. In Case 1, the ground temperature decreases during the heating operation, because only the heat extraction operation was conducted in this case. Therefore, the circulation water temperature seems to decrease gradually due to the drop of underground temperature. However, in Case 2, the operations of heat extraction and heat storage were conducted simultaneously, so the ground temperature increased with the underground heat storage with solar heat. Therefore, the circulation water temperature also increased with the increased underground temperature. Through this result, it is found that the underground heat storage using solar energy could improve the performance of the GSHP system.
Figure 4.
Daily average of heat source temperature (Cases 1 and 2).
Figure 4.
Daily average of heat source temperature (Cases 1 and 2).
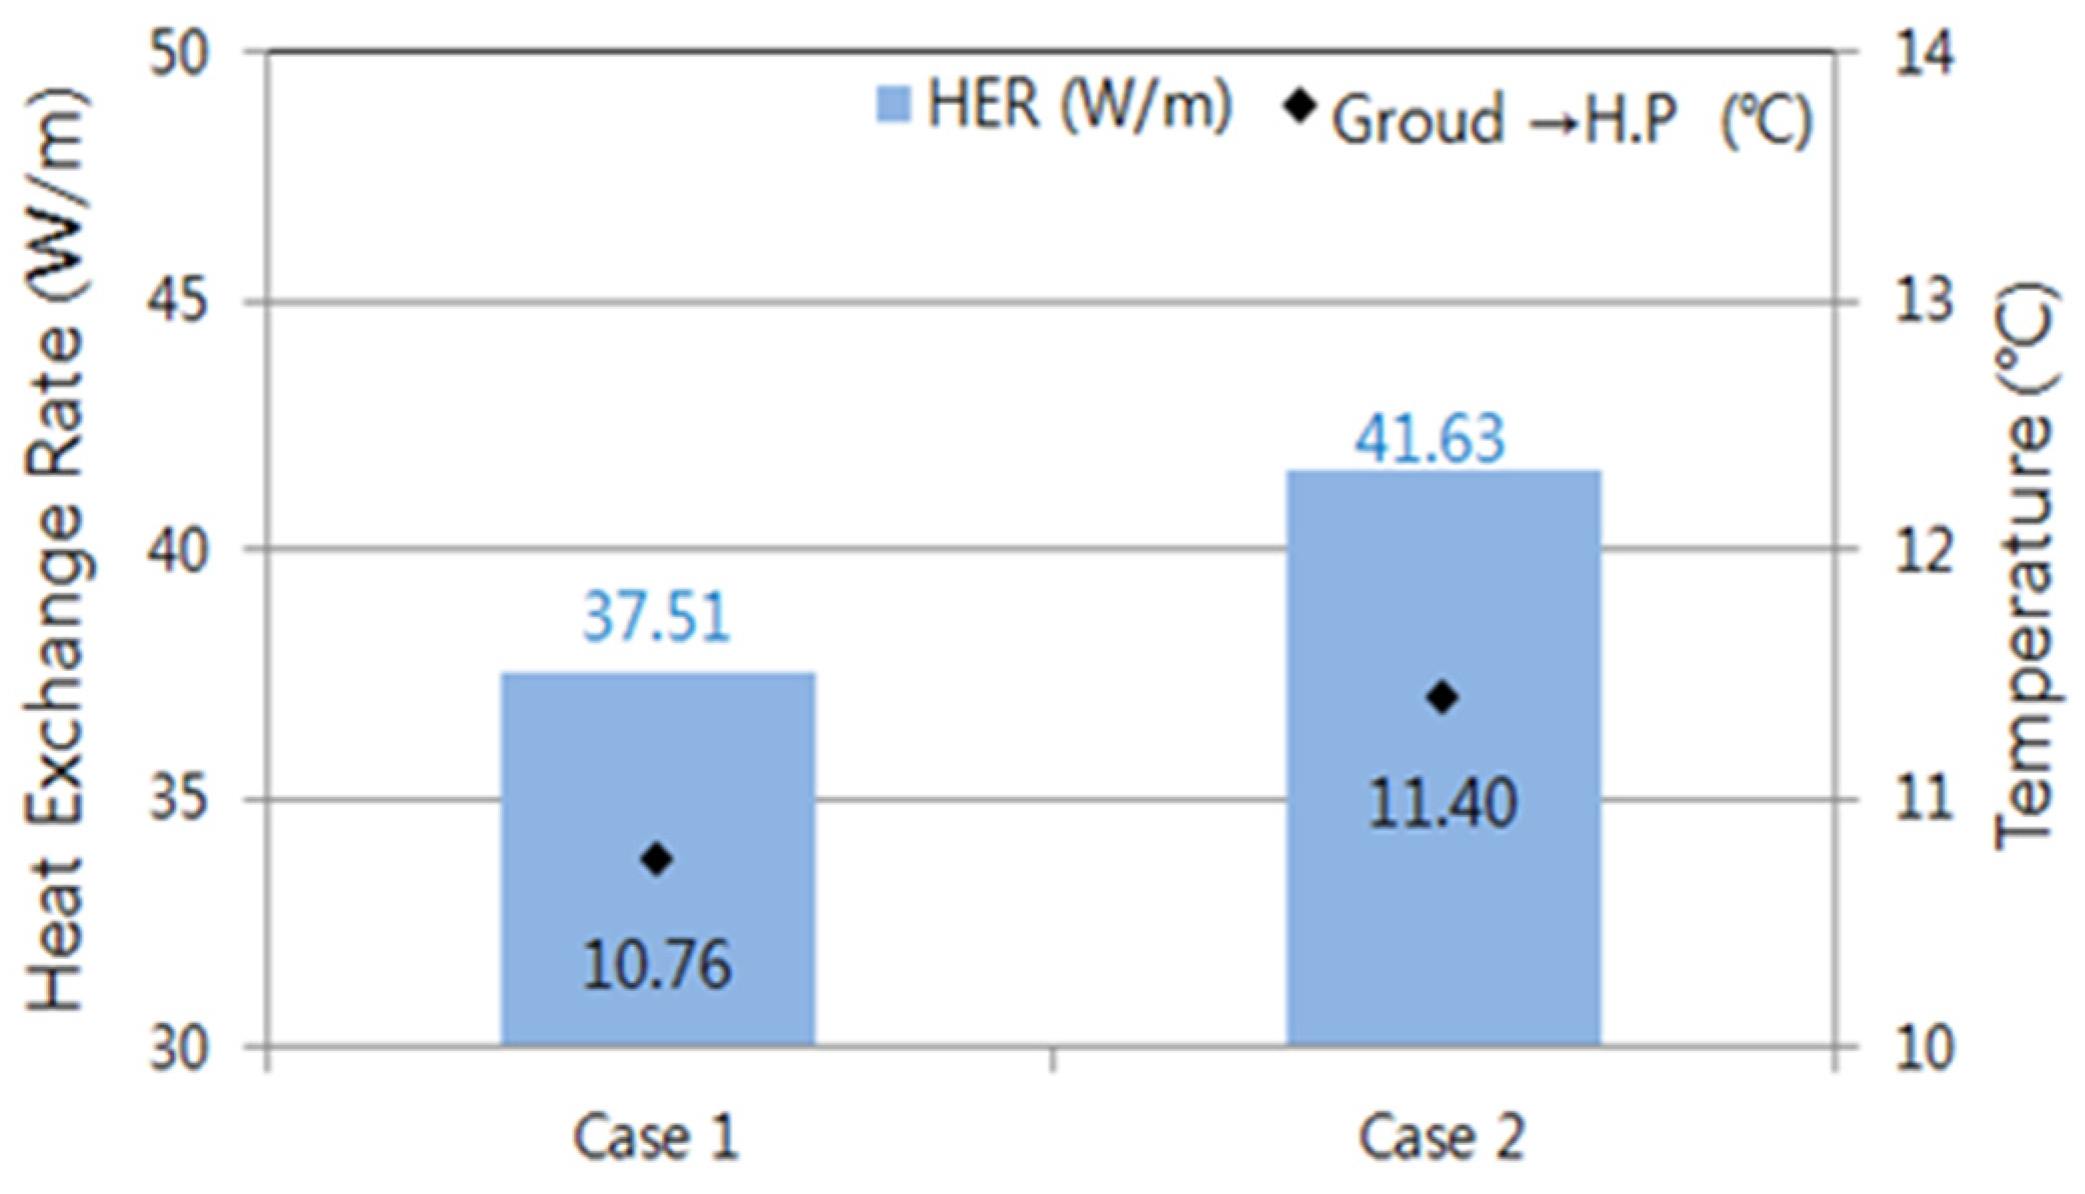
The average outlet temperatures of the circulation water calculated at each unit length and heat exchange rate in heat collection are shown in
Figure 5. The temperature of circulation water from the heat exchanger in Case 2 appeared to be higher than that in Case 1, proportional to the amount of solar radiation due to the effect of the heat storage operation. Case 2 stored solar energy through underground heat storage. It exhibited a heat collection performance approximately 11% higher than that in Case 1. The changes of heat exchange rate and circulation water temperature from the operation of heat collection are shown in
Figure 6 and
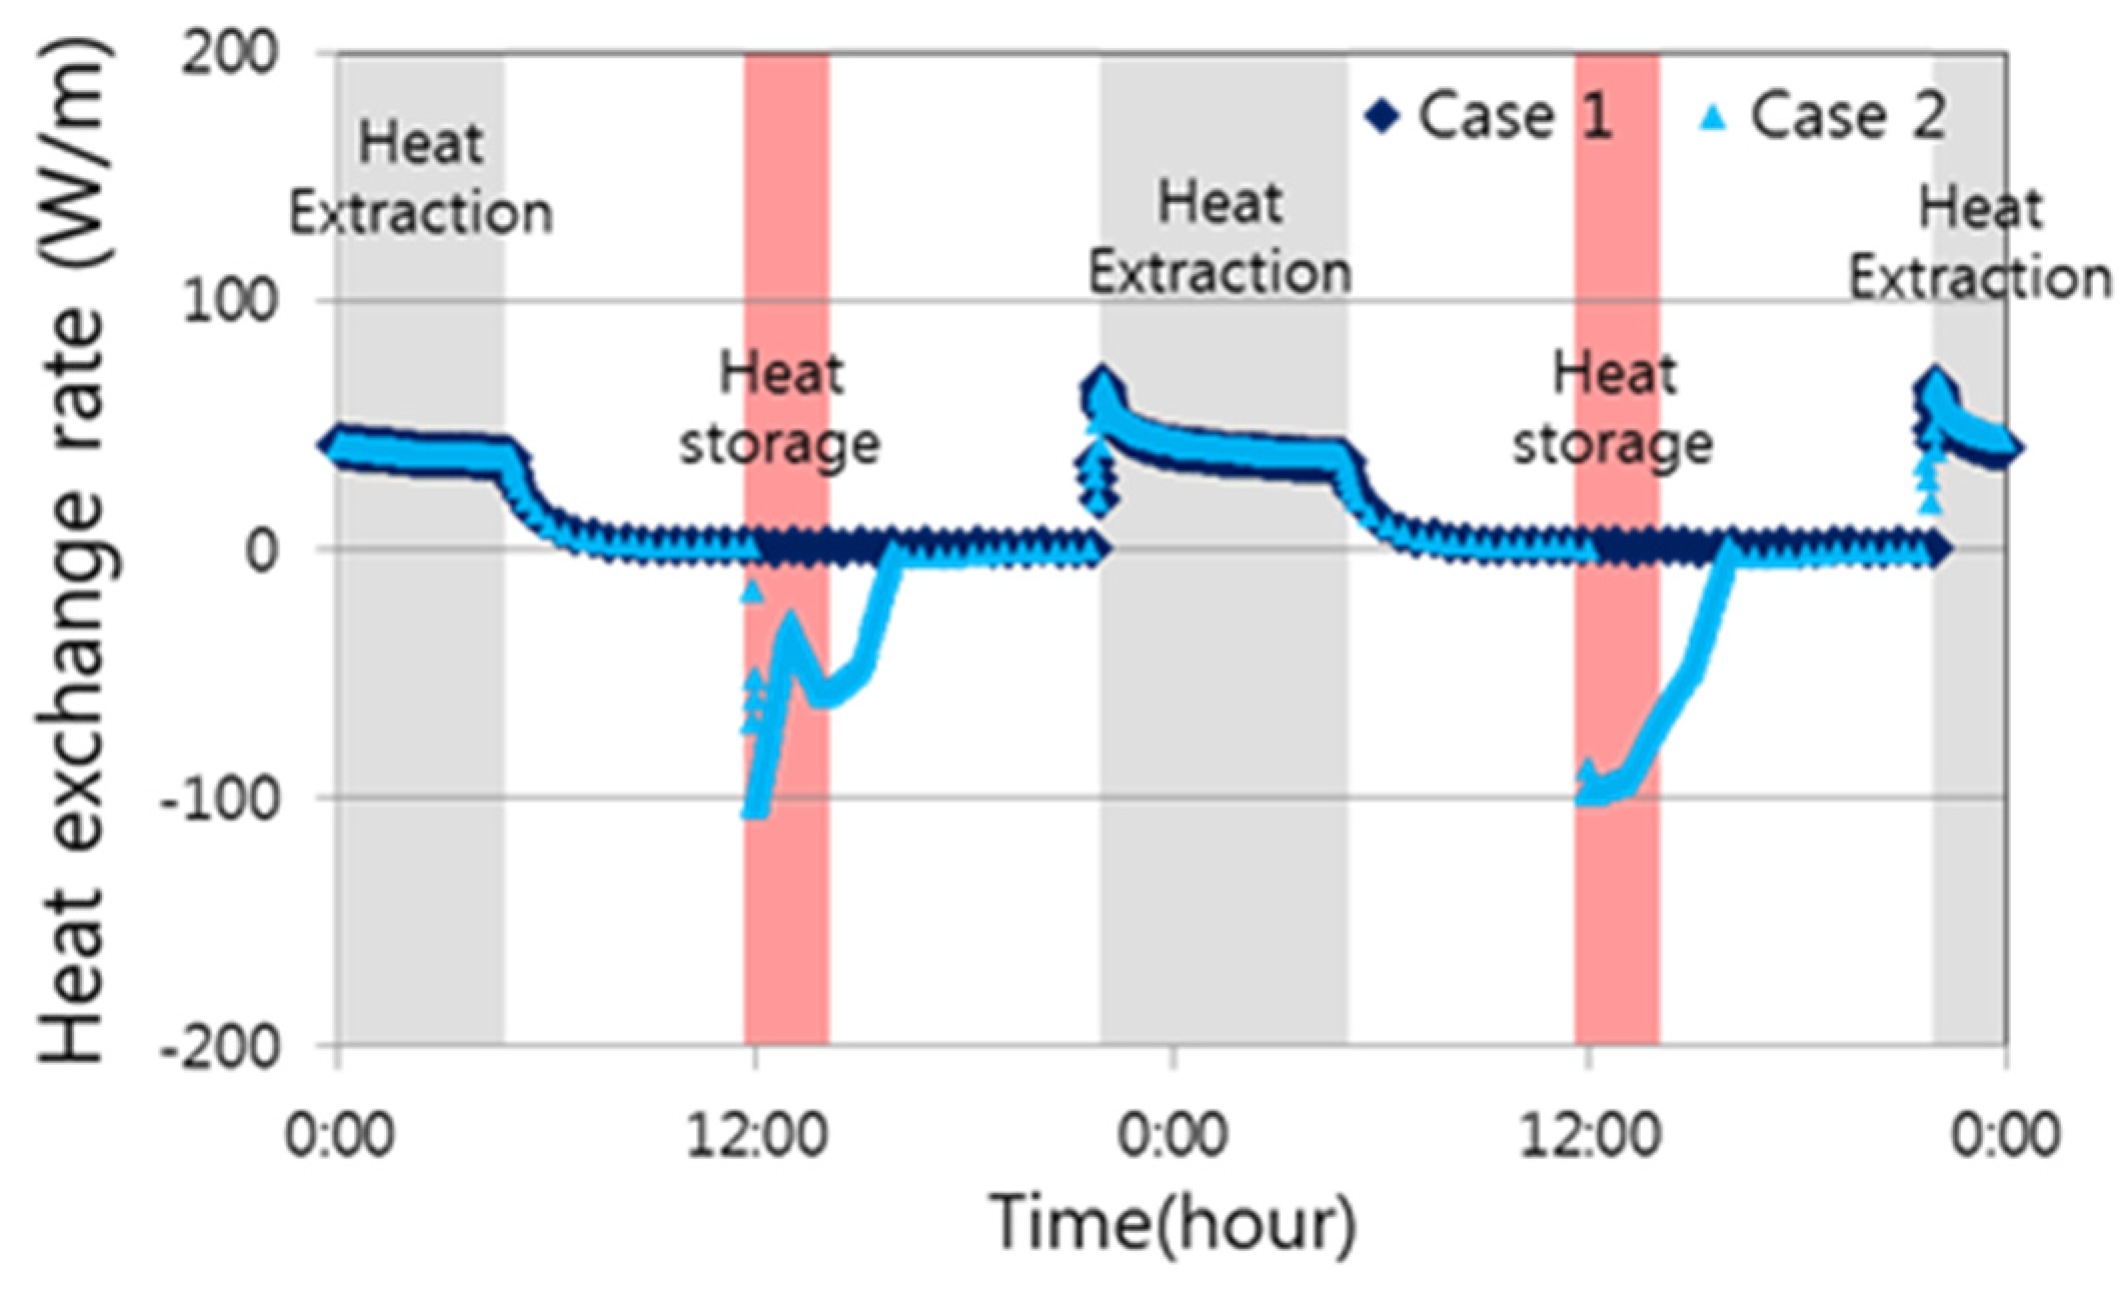
Figure 7. Due to the underground heat storage of solar energy, the temperature of the circulation water was kept high, which greatly contributed to the improved performance of the heat collection operation.
Figure 5.
Average heat exchange rate (Cases 1 and 2).
Figure 5.
Average heat exchange rate (Cases 1 and 2).
Figure 6.
Operation of circulatory water temperature (Cases 1 and 2).
Figure 6.
Operation of circulatory water temperature (Cases 1 and 2).
Figure 7.
Operation of heat storage and heat exchange rate (Cases 1 and 2).
Figure 7.
Operation of heat storage and heat exchange rate (Cases 1 and 2).
Results of the comparative analysis of heat storage rate and variation of circulation water are shown in
Figure 8,
Figure 9 and
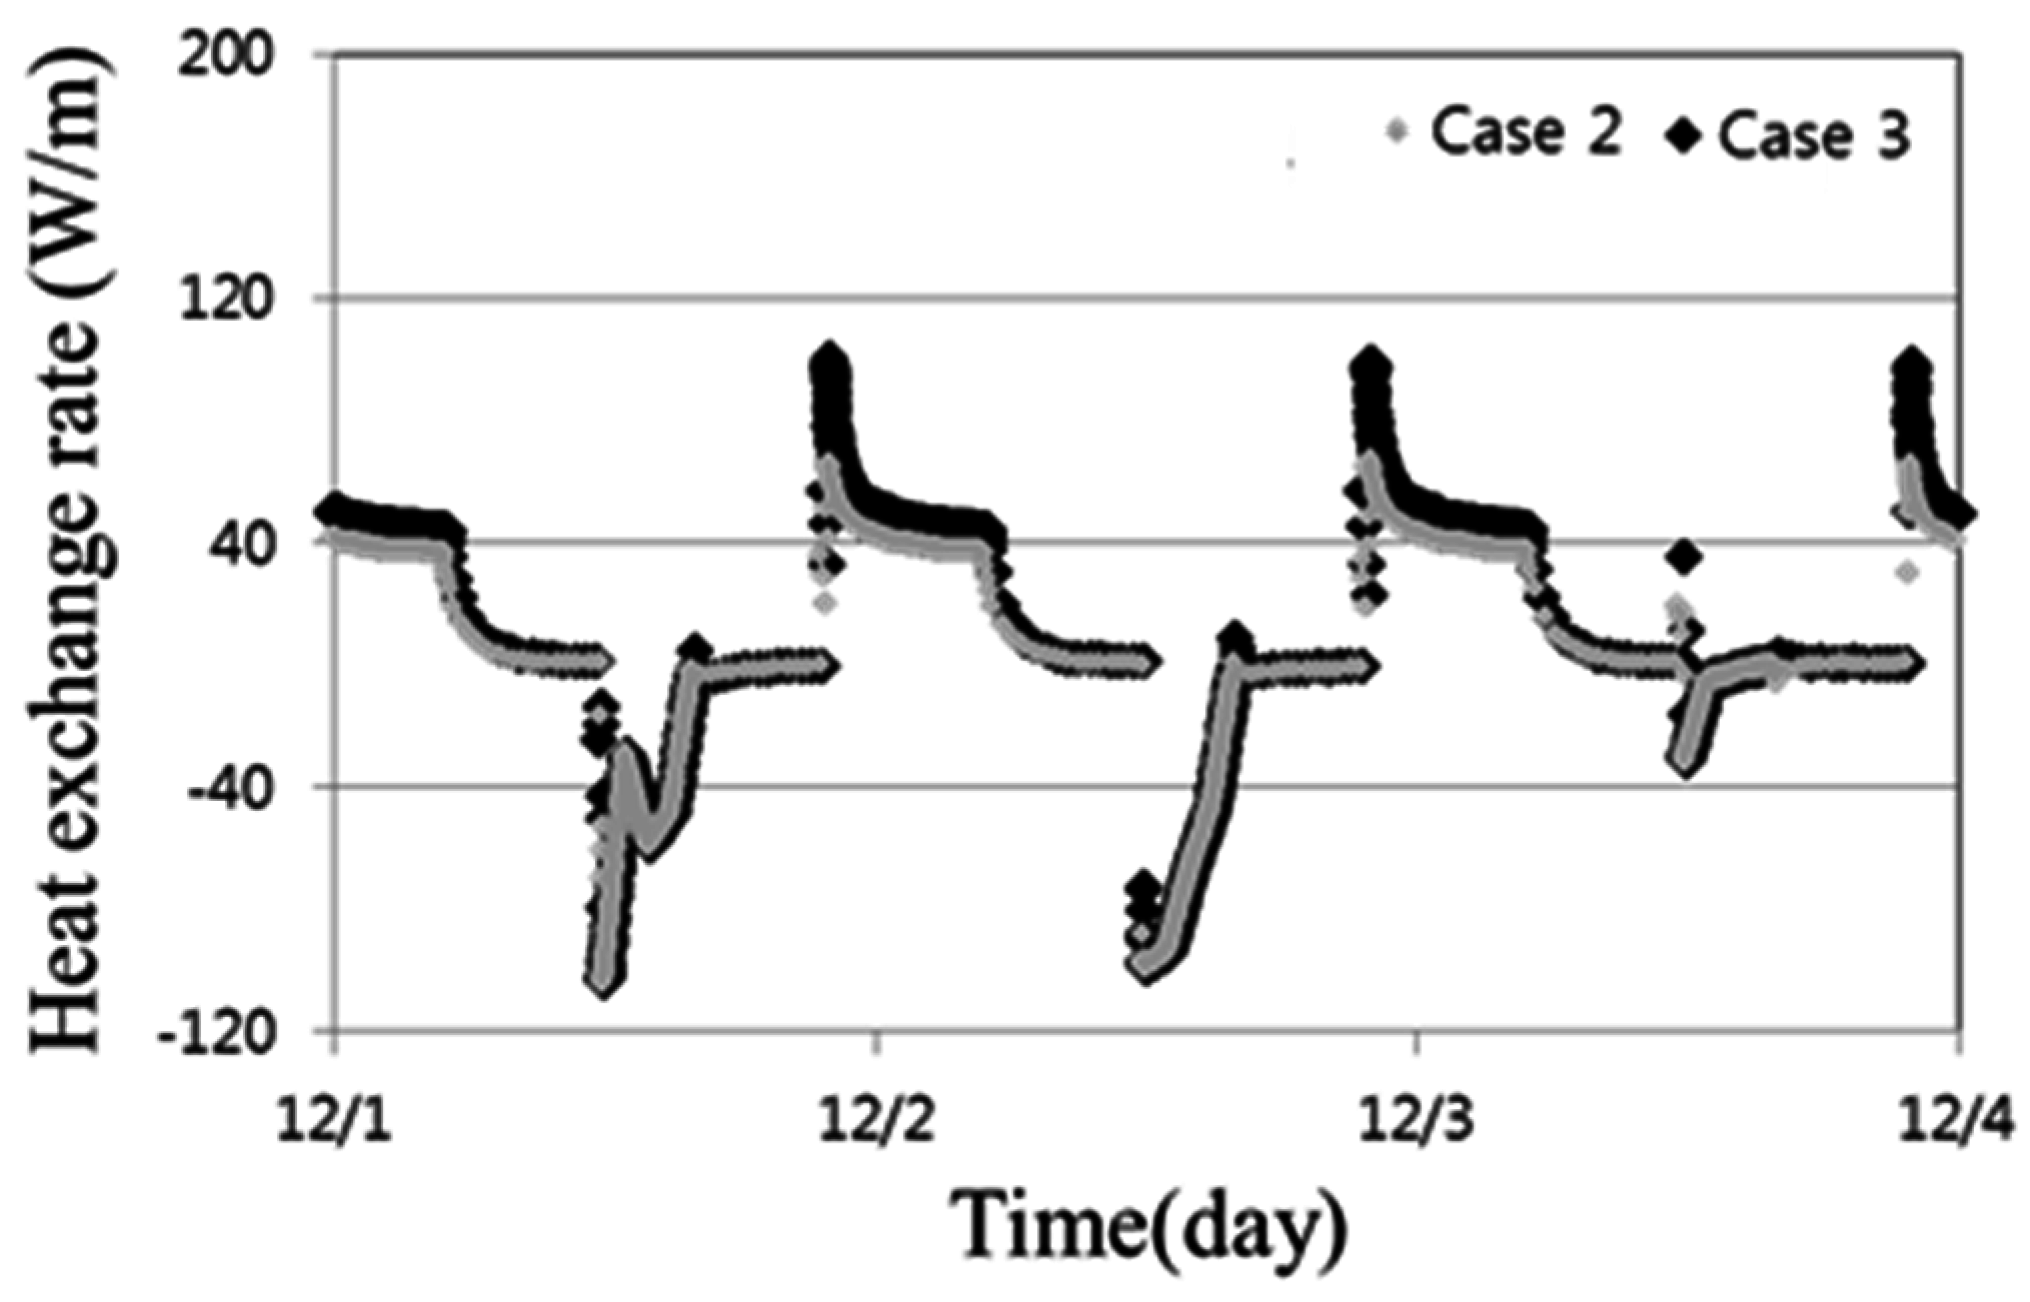
Figure 10. The flow rate during underground heat storage was set at 9.30 L/min. However, for heat collection, the flow rates in Cases 2 and 3 were set at 9.30 L/min and 13.95 L/min, respectively. The changes in heat storage rate and heat exchange rate in Cases 2 and 3 are shown in
Figure 8.
Figure 8.
Operation of heat storage and heat exchange rate (Cases 2 and 3).
Figure 8.
Operation of heat storage and heat exchange rate (Cases 2 and 3).
Figure 9.
Average of heat storage rate for flow rate change (Cases 2 and 3).
Figure 9.
Average of heat storage rate for flow rate change (Cases 2 and 3).
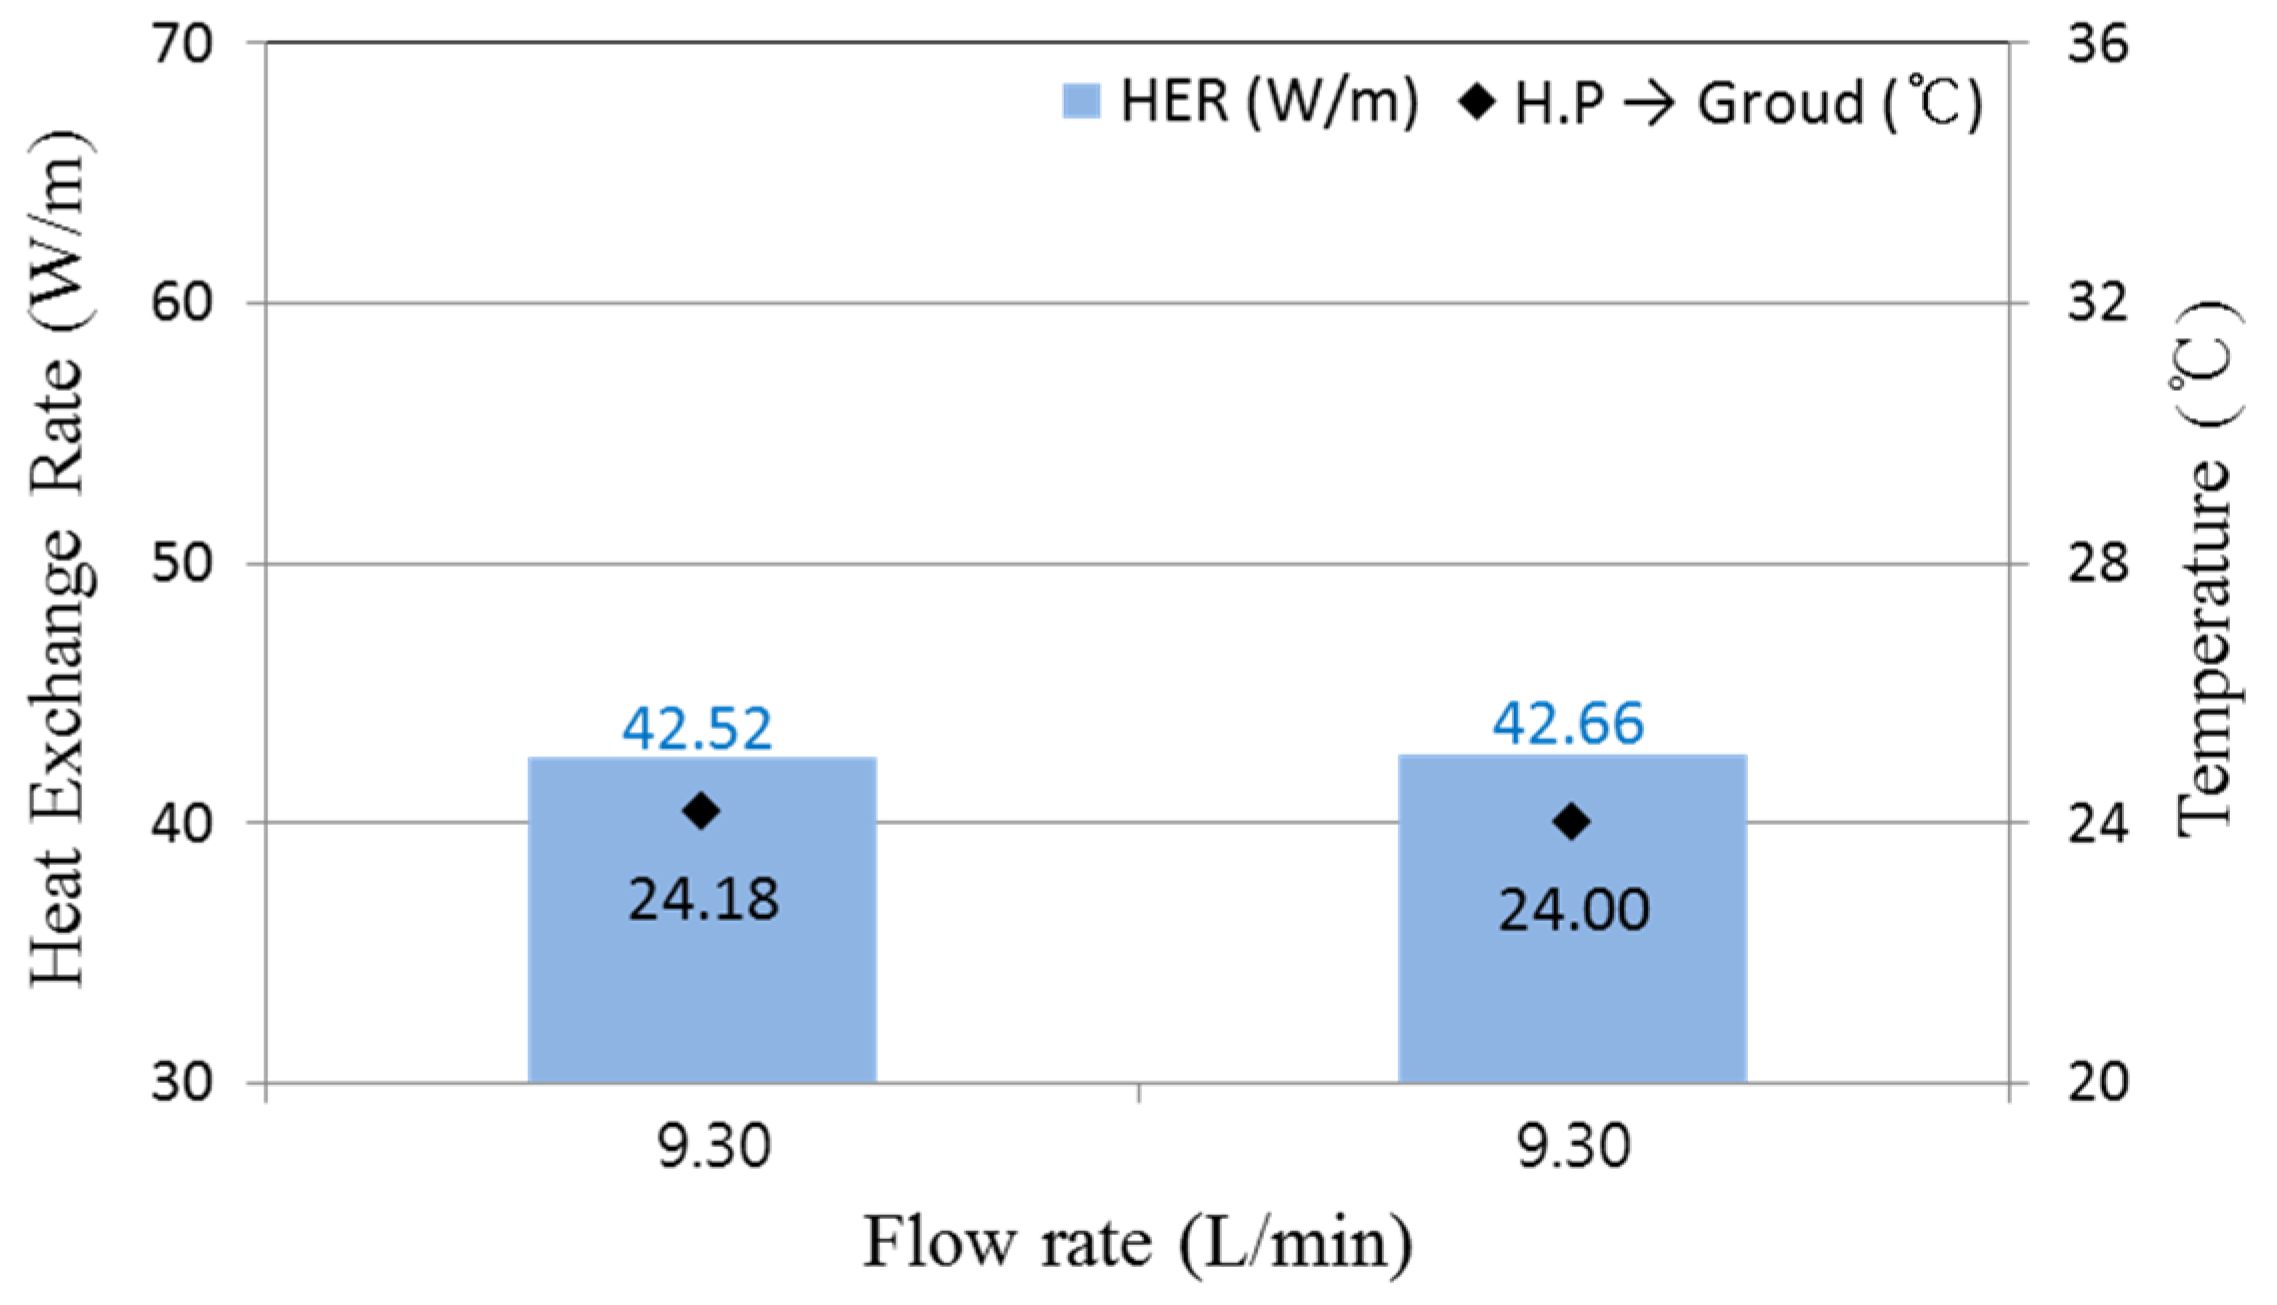
The average inlet temperatures of circulation water calculated at each unit length and heat storage rate during underground heat storage are shown in
Figure 9. The average outlet temperatures of circulation water calculated at each unit length and heat exchange rate during heat collection are shown in
Figure 10. The results obtained from the analysis showed that the difference in heat storage rates between Cases 2 and 3 was insignificant. The heat exchange rate in Case 3 appeared to be approximately 19% bigger than that in Case 2. The flow rate appeared to be proportional to the heat exchange rate level. However, the difference in the temperature of circulation water in heat exchangers between the two cases was only 1.33 °C (Case 2: 11.40 °C, Case 3: 10.07 °C). Thus, the value of flow rate in heat collection for follow-up cases was set at 0.483 m/s for the simulation.
Figure 10.
Average of heat exchange rate for flow rate change (Cases 2 and 3).
Figure 10.
Average of heat exchange rate for flow rate change (Cases 2 and 3).
The comparisons between heat storage and heat collection performance according to the differences in the area of solar collector are illustrated in
Figure 11 and
Figure 12.
Figure 11.
Average of heat storage rate for solar collector area change (Cases 5 and 6).
Figure 11.
Average of heat storage rate for solar collector area change (Cases 5 and 6).
Figure 12.
Average of heat exchange rate for solar collector area change (Cases 5 and 6).
Figure 12.
Average of heat exchange rate for solar collector area change (Cases 5 and 6).
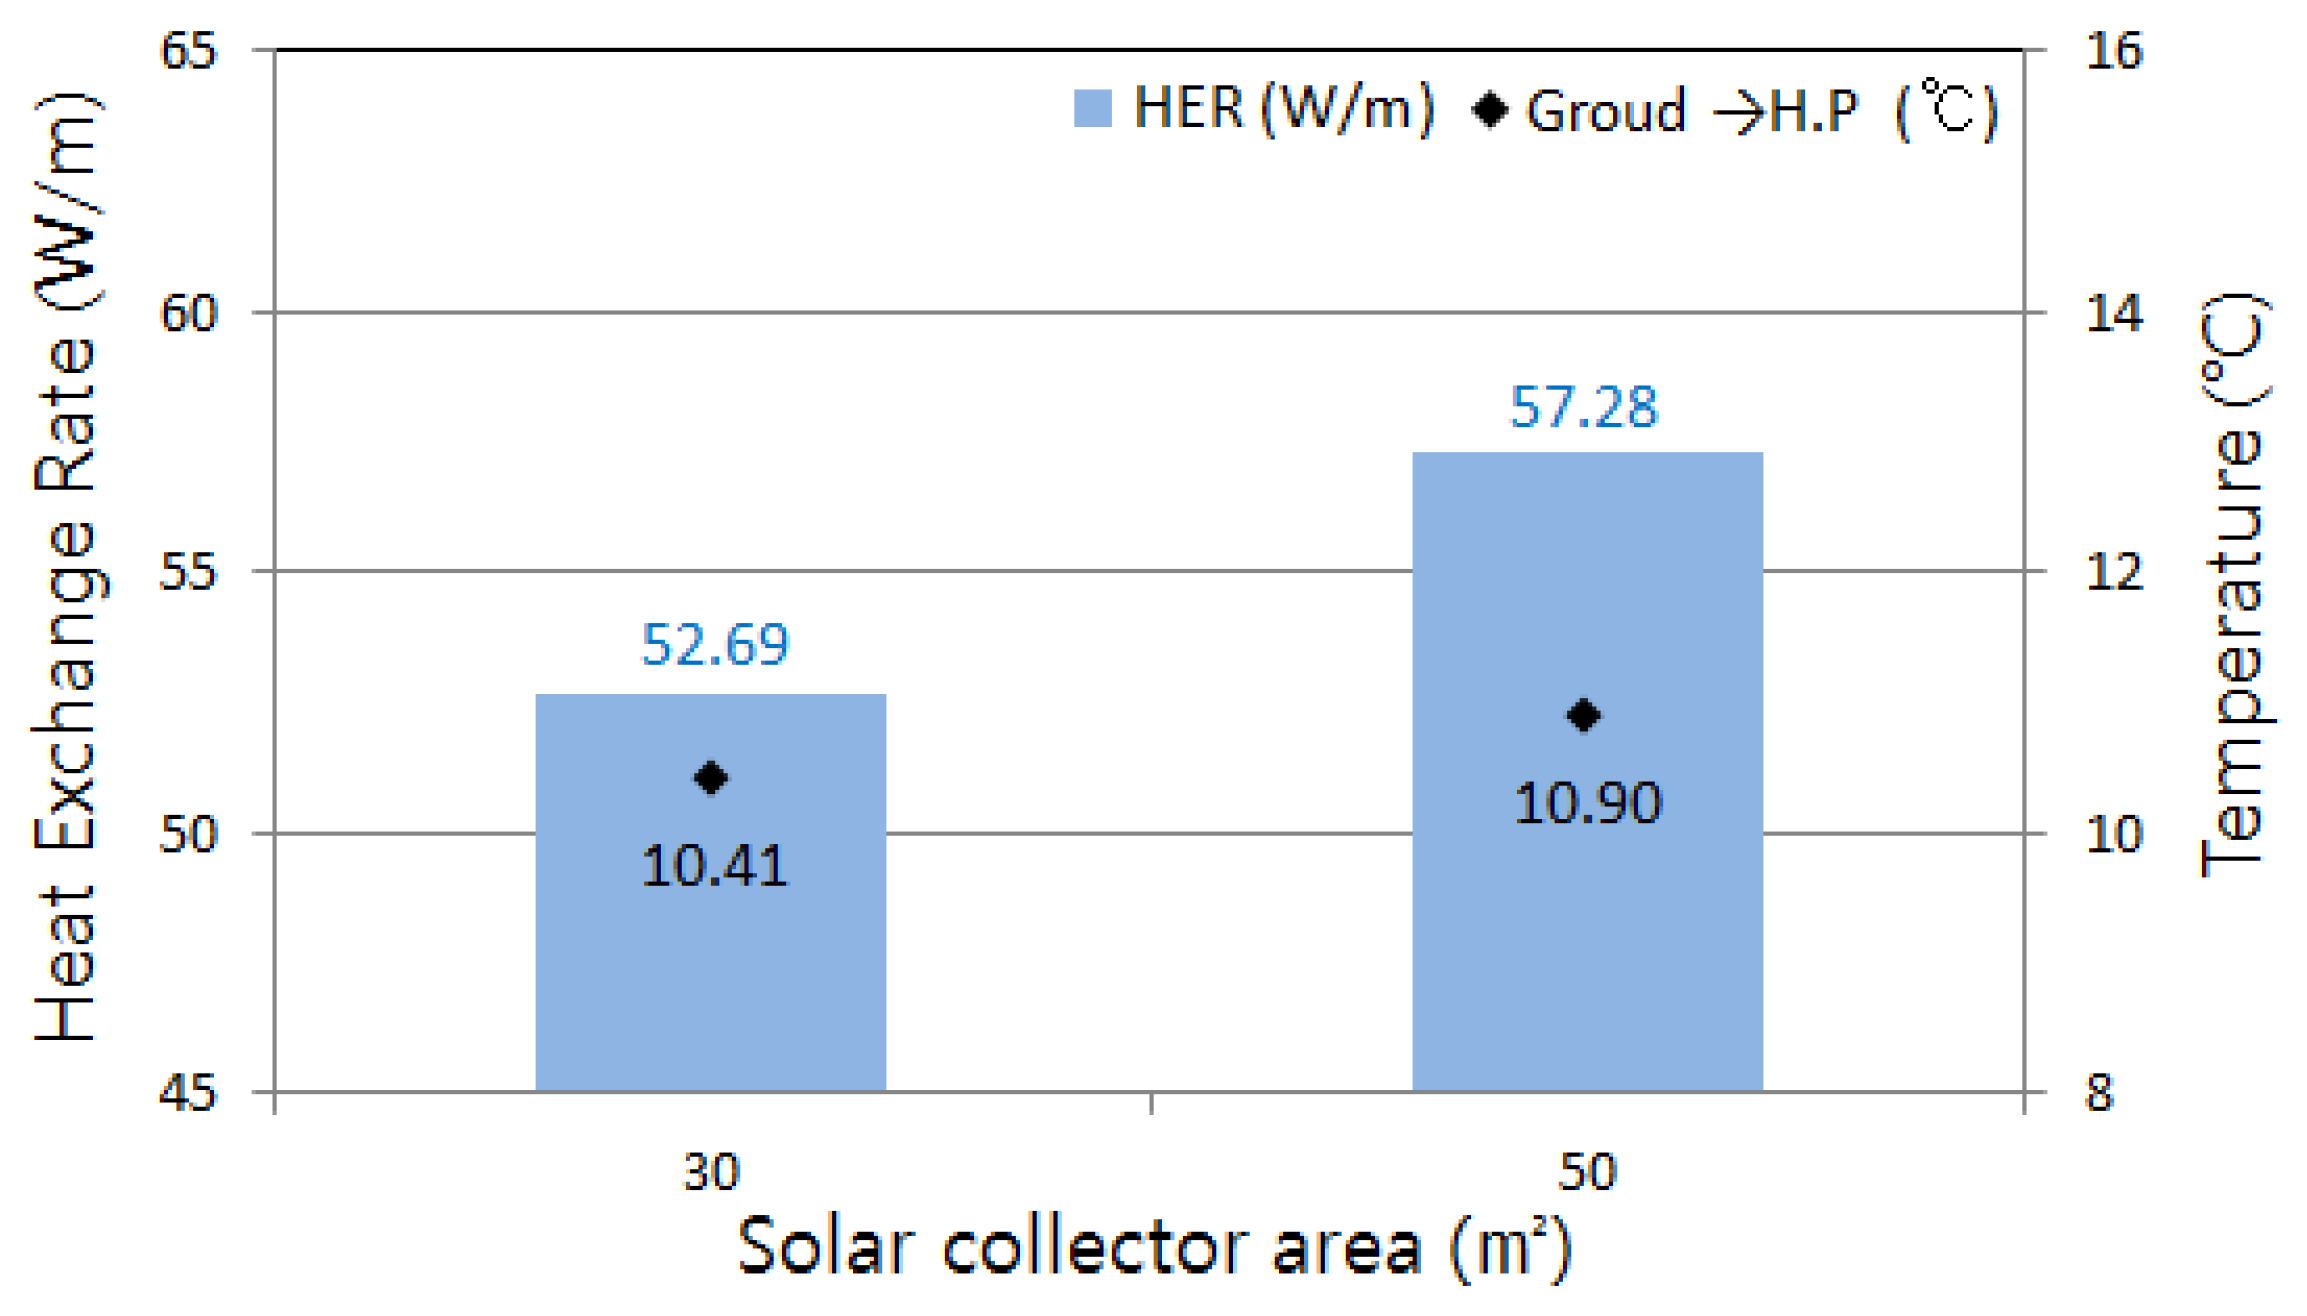
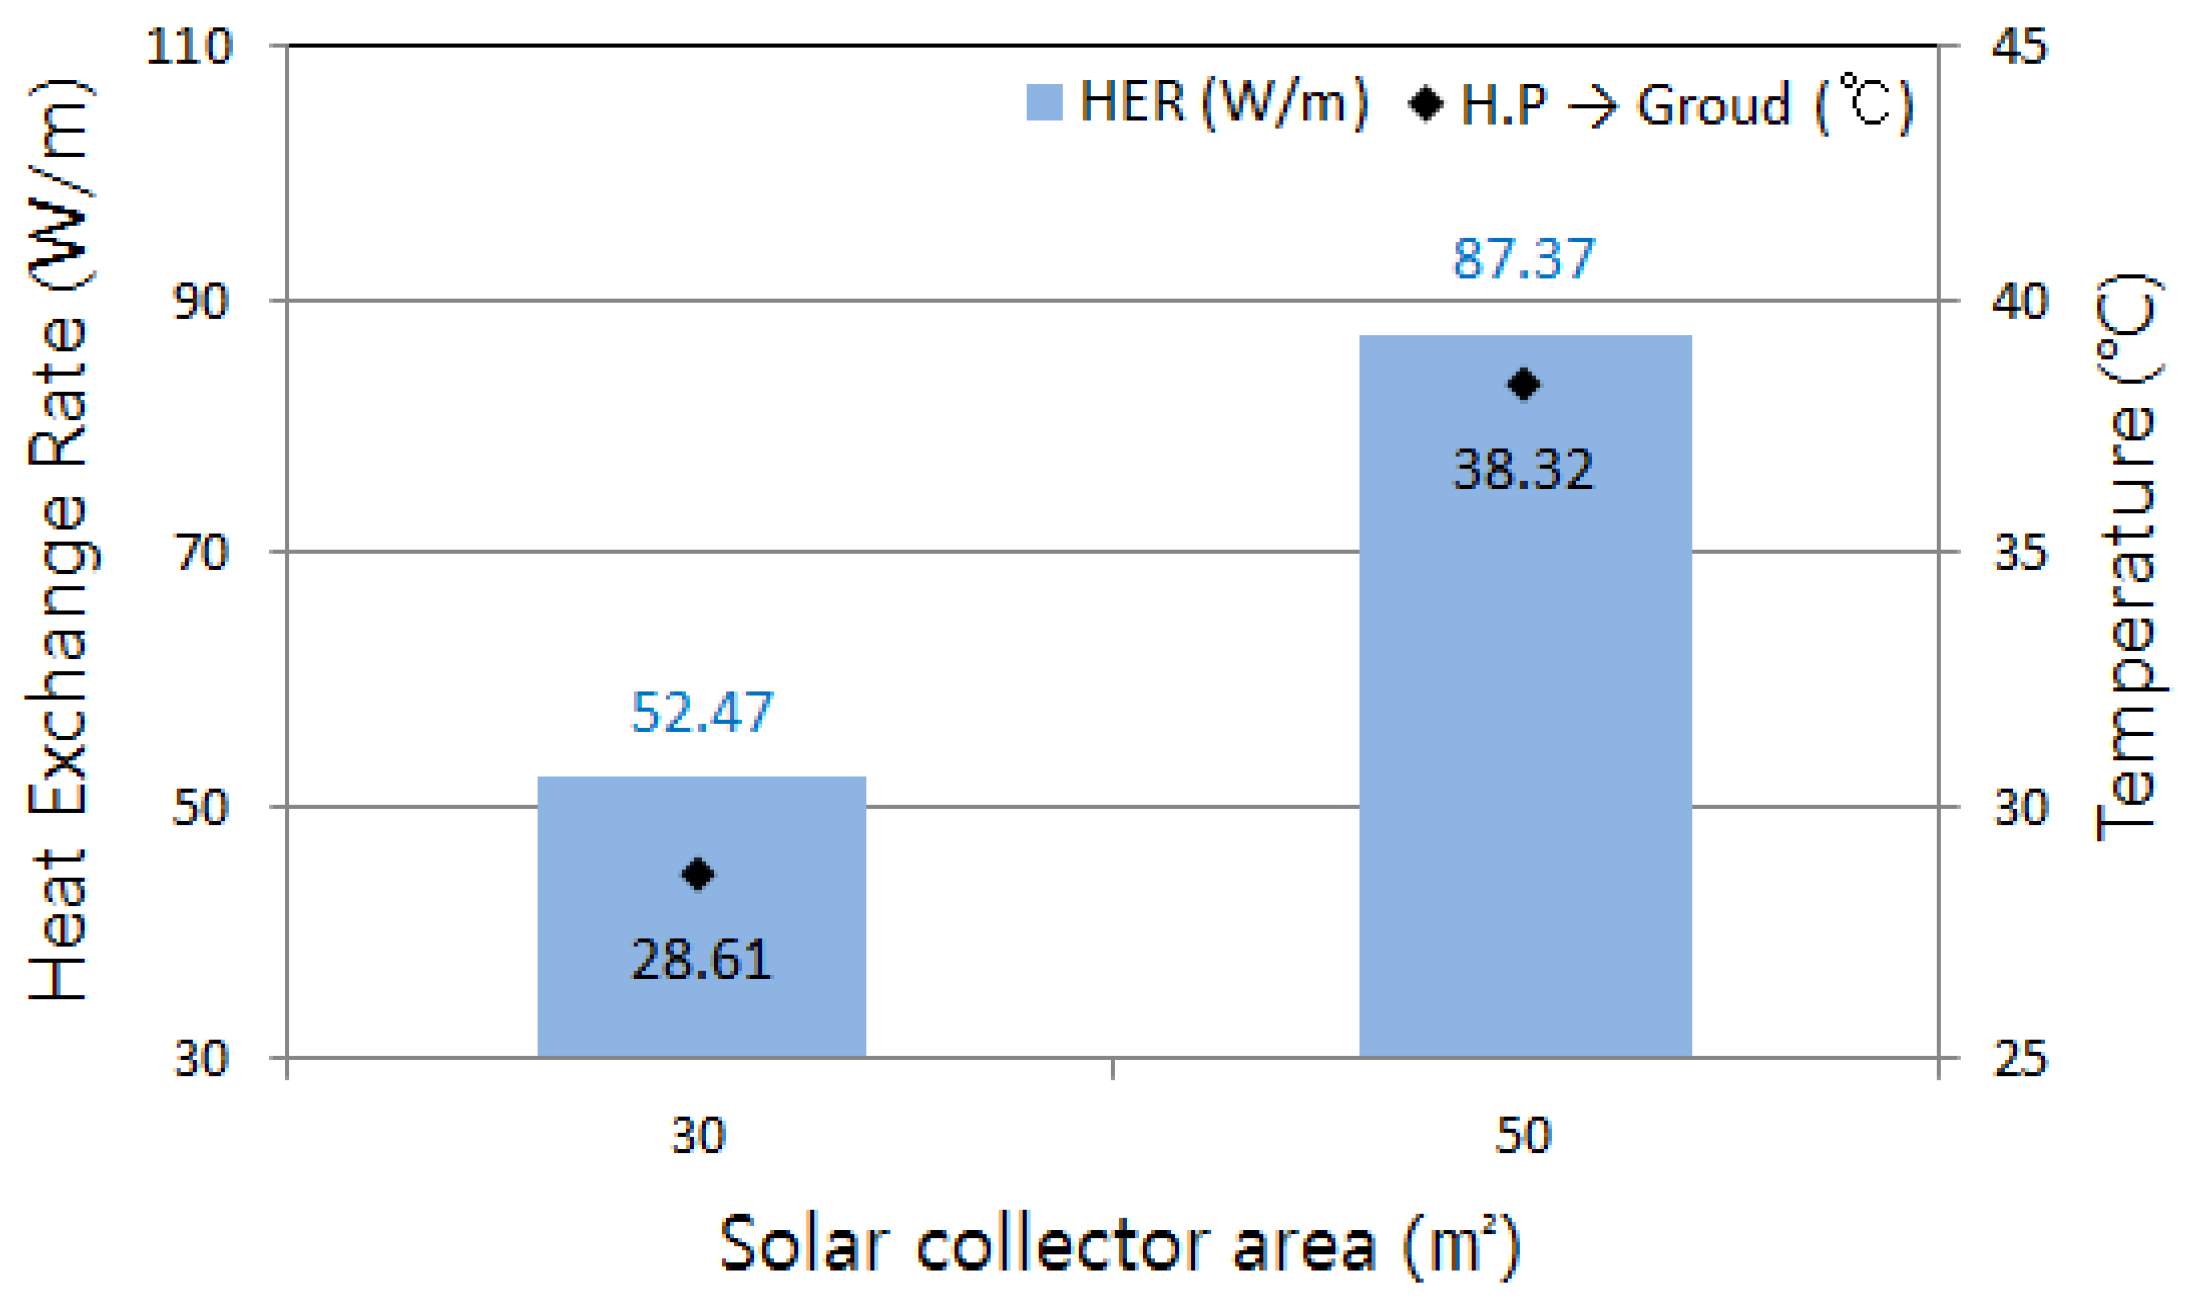
To identify the influence of difference in heat storage rate on heat exchange rate, the heat collection performance was examined by setting each solar collector area in Cases 5 and 6 at 30 m
2 and 50 m
2, respectively. The average inlet temperatures of circulation water calculated at each unit length and heat storage rate during underground heat storage are shown in
Figure 11. The average outlet temperatures of circulation water calculated at each unit length and heat exchange rate during heat collection are shown in
Figure 12. Analysis of monthly average heat storage rate and heat exchange rate showed that the heat storage rate and heat exchange rate in Case 6 equipped with a bigger solar collector area were 67% and 9% higher than those in Case 5, respectively. Based on these results, the influence of stored heat on the heat collection performance was found to be smaller than that on heat storage. This could be due to heat loss during downtime between the completion of heat storage and the heat collection operation.
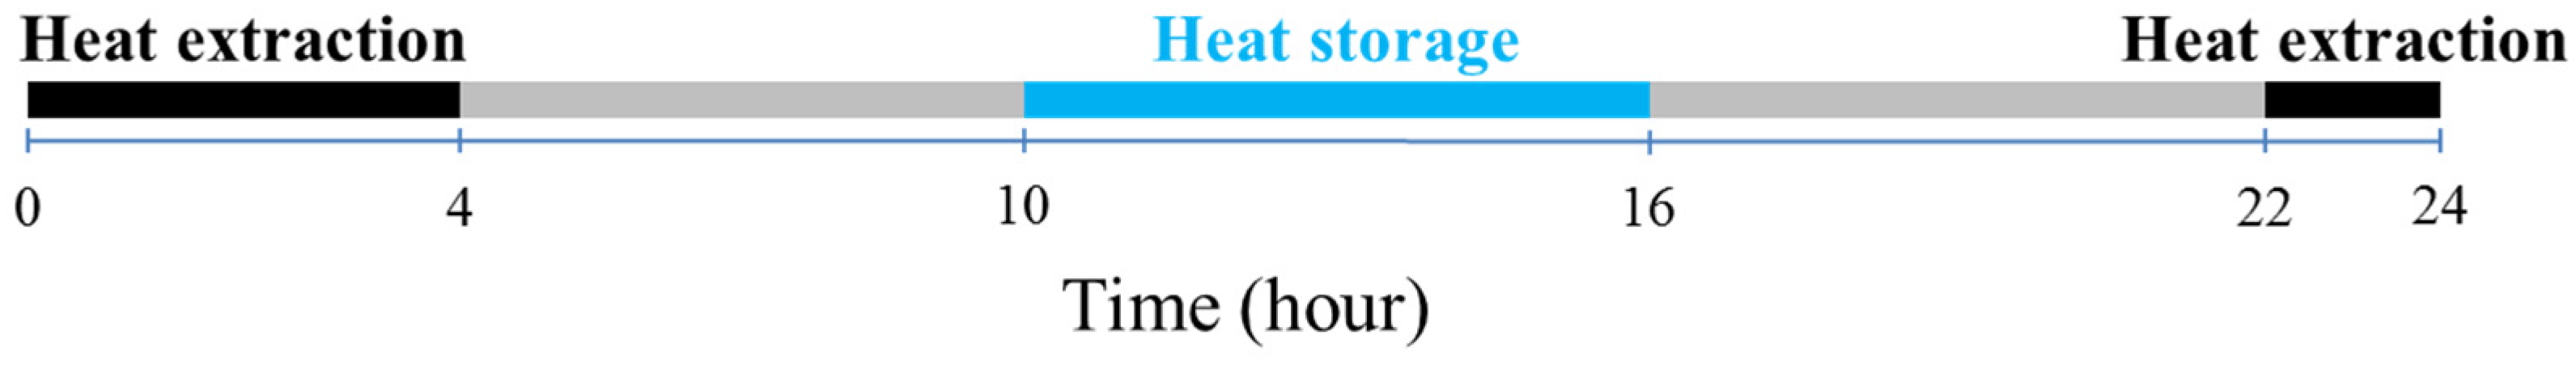
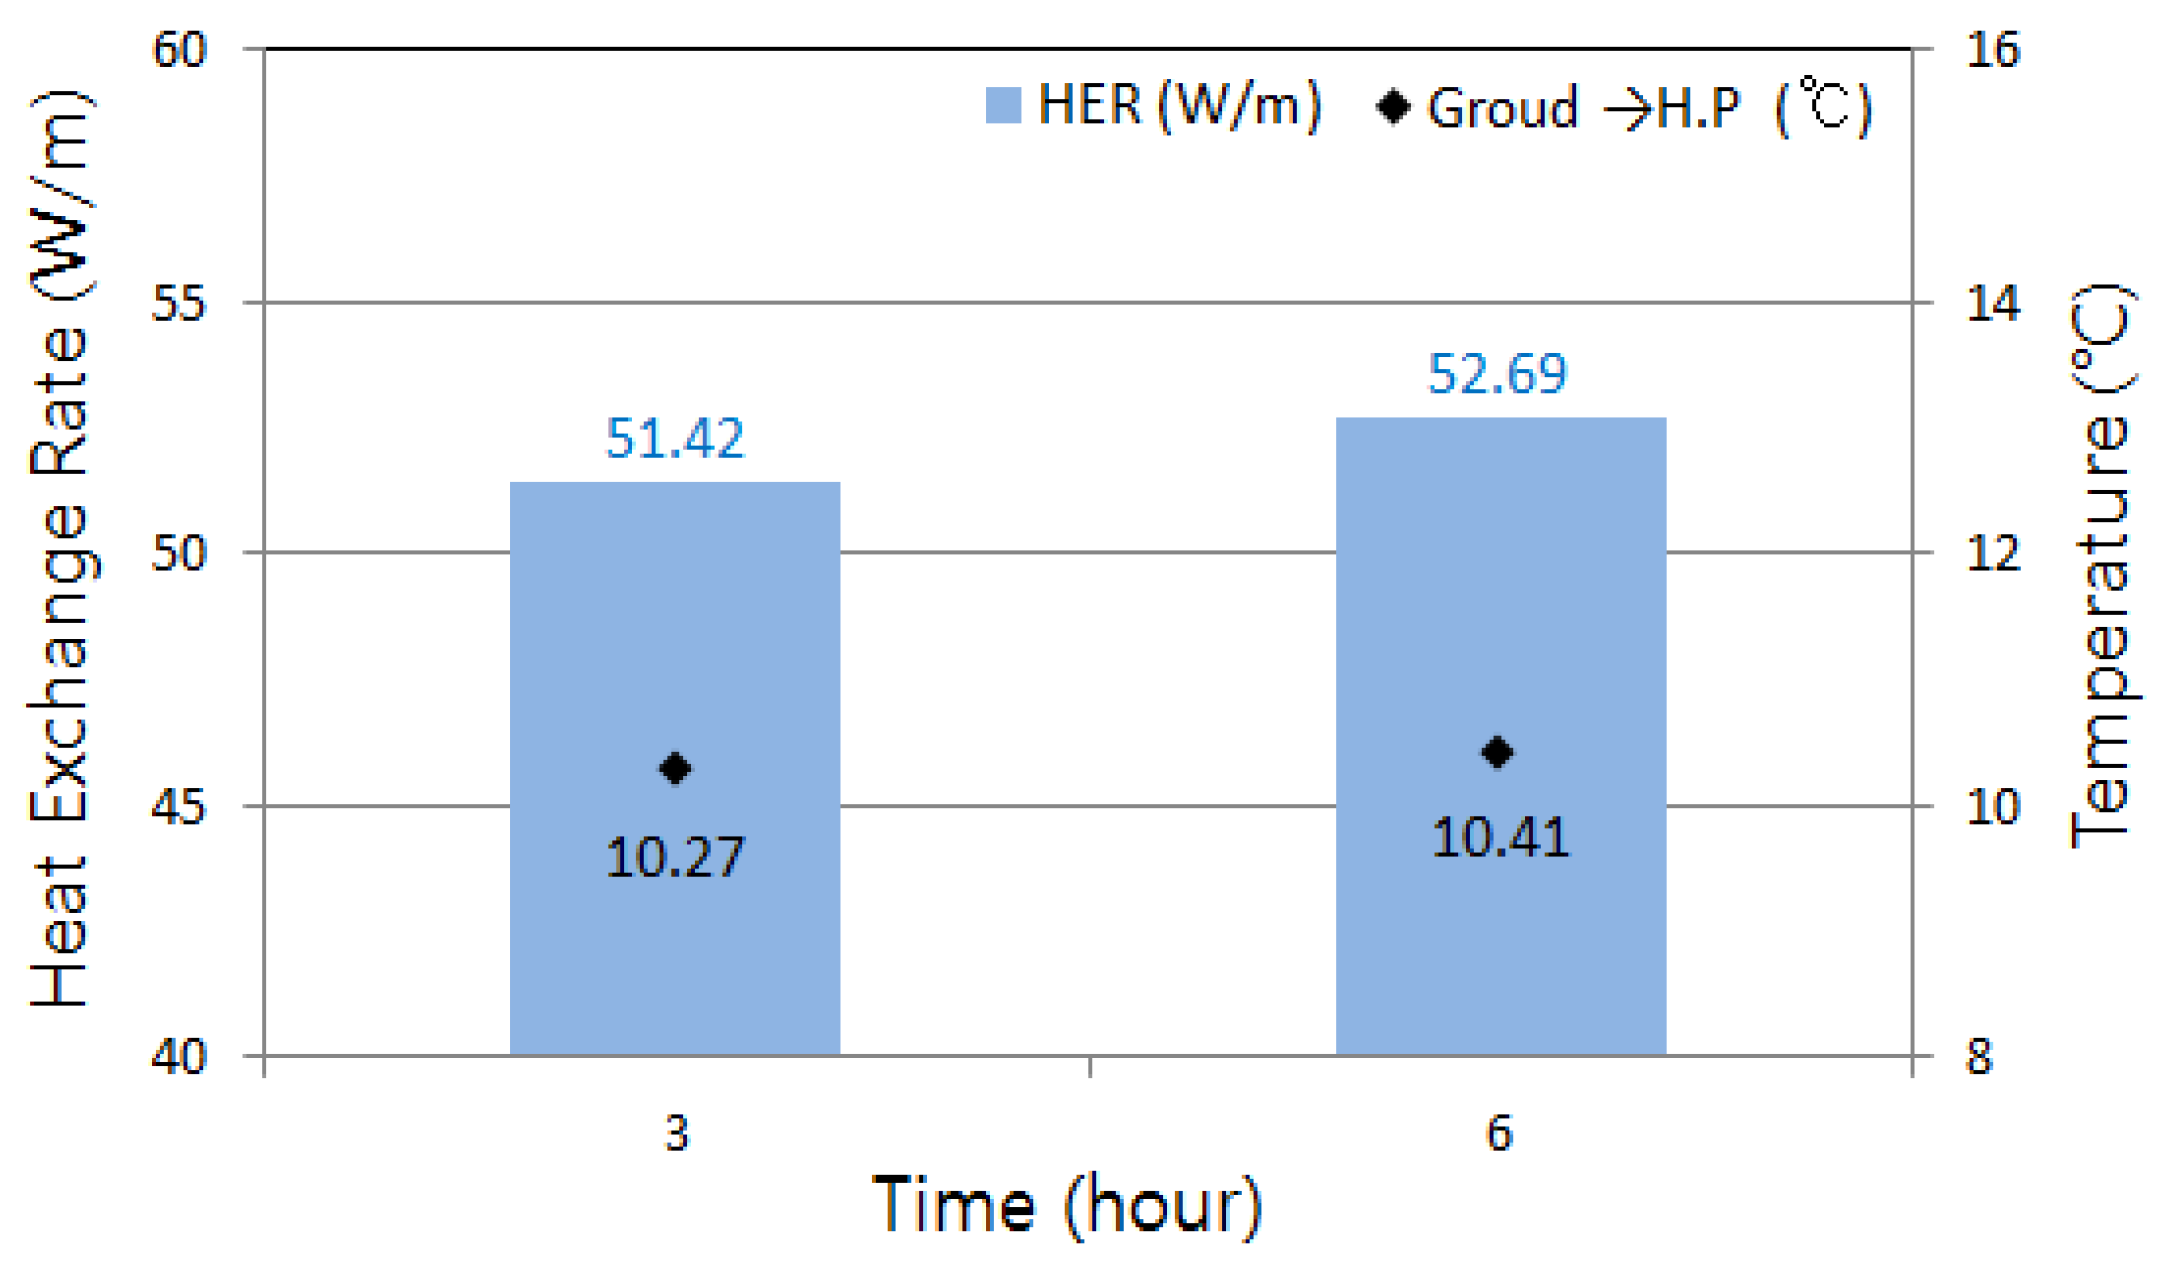
Results of the analysis on heat storage and heat collection performance in accordance with varied time of heat storage operation are shown in
Figure 13,
Figure 14 and
Figure 15. The operation of underground heat storage was continued for 3 h or 6 h (Case 4: 10:00–13:00, Case 5: 10:00–16:00). The average inlet temperatures of circulation water calculated at each unit length and heat storage rate during heat storage are shown in
Figure 13. The average outlet temperatures of circulation water calculated at each unit length and heat exchange rate during heat collection are shown in
Figure 14.
Figure 13.
Average of heat storage rate for storage time change (Cases 4 and 5).
Figure 13.
Average of heat storage rate for storage time change (Cases 4 and 5).
Figure 14.
Average of heat exchange rate for storage time change (Cases 4 and 5).
Figure 14.
Average of heat exchange rate for storage time change (Cases 4 and 5).
Figure 15.
Daily average of heat storage rate for storage time change (Cases 4 and 5).
Figure 15.
Daily average of heat storage rate for storage time change (Cases 4 and 5).
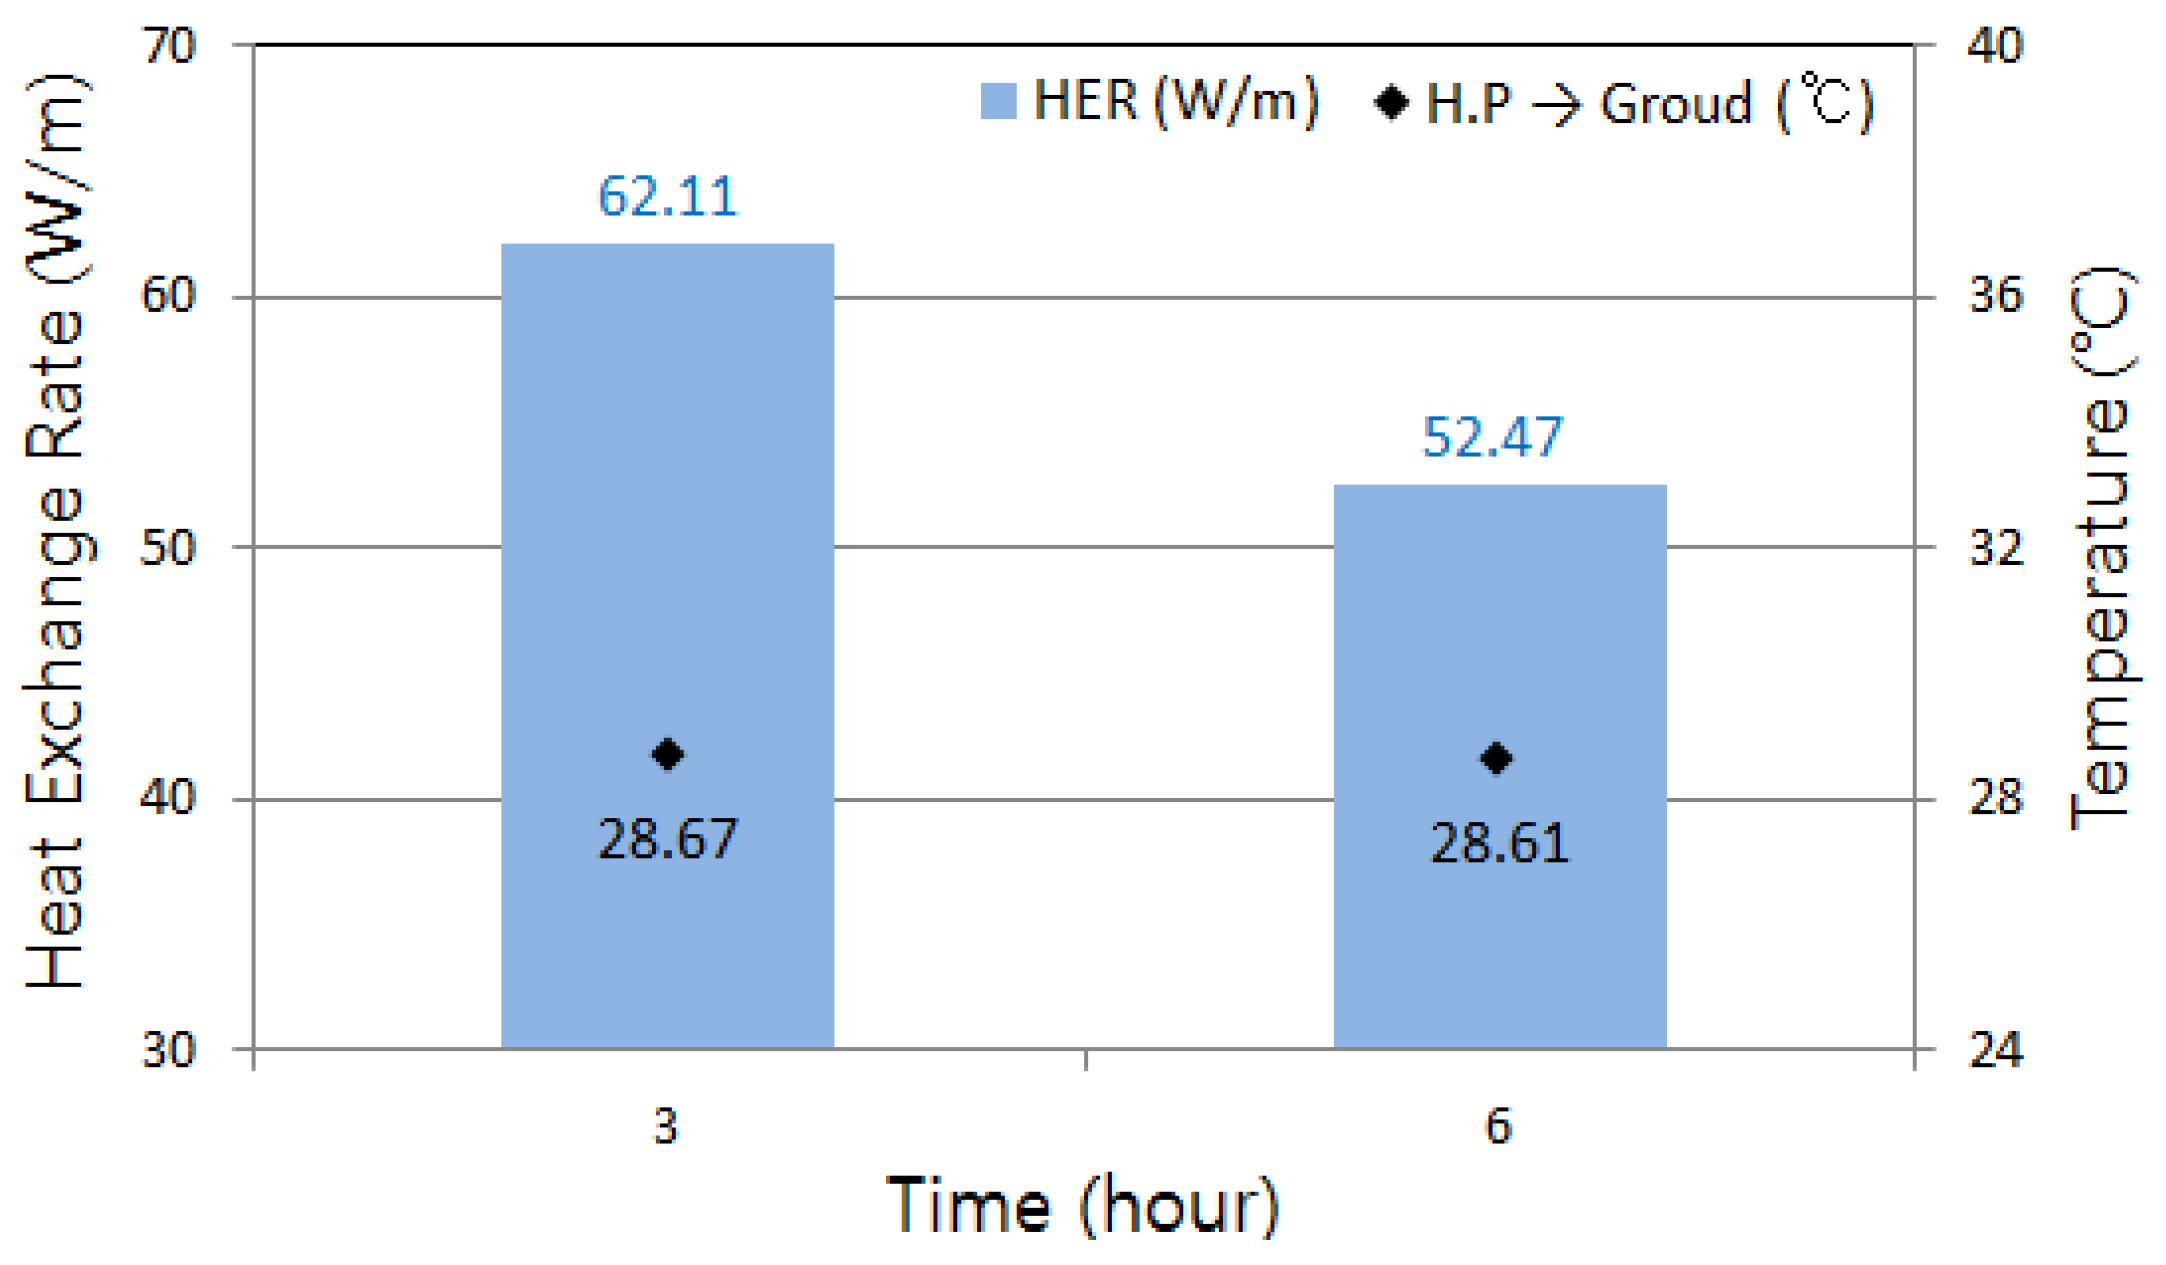
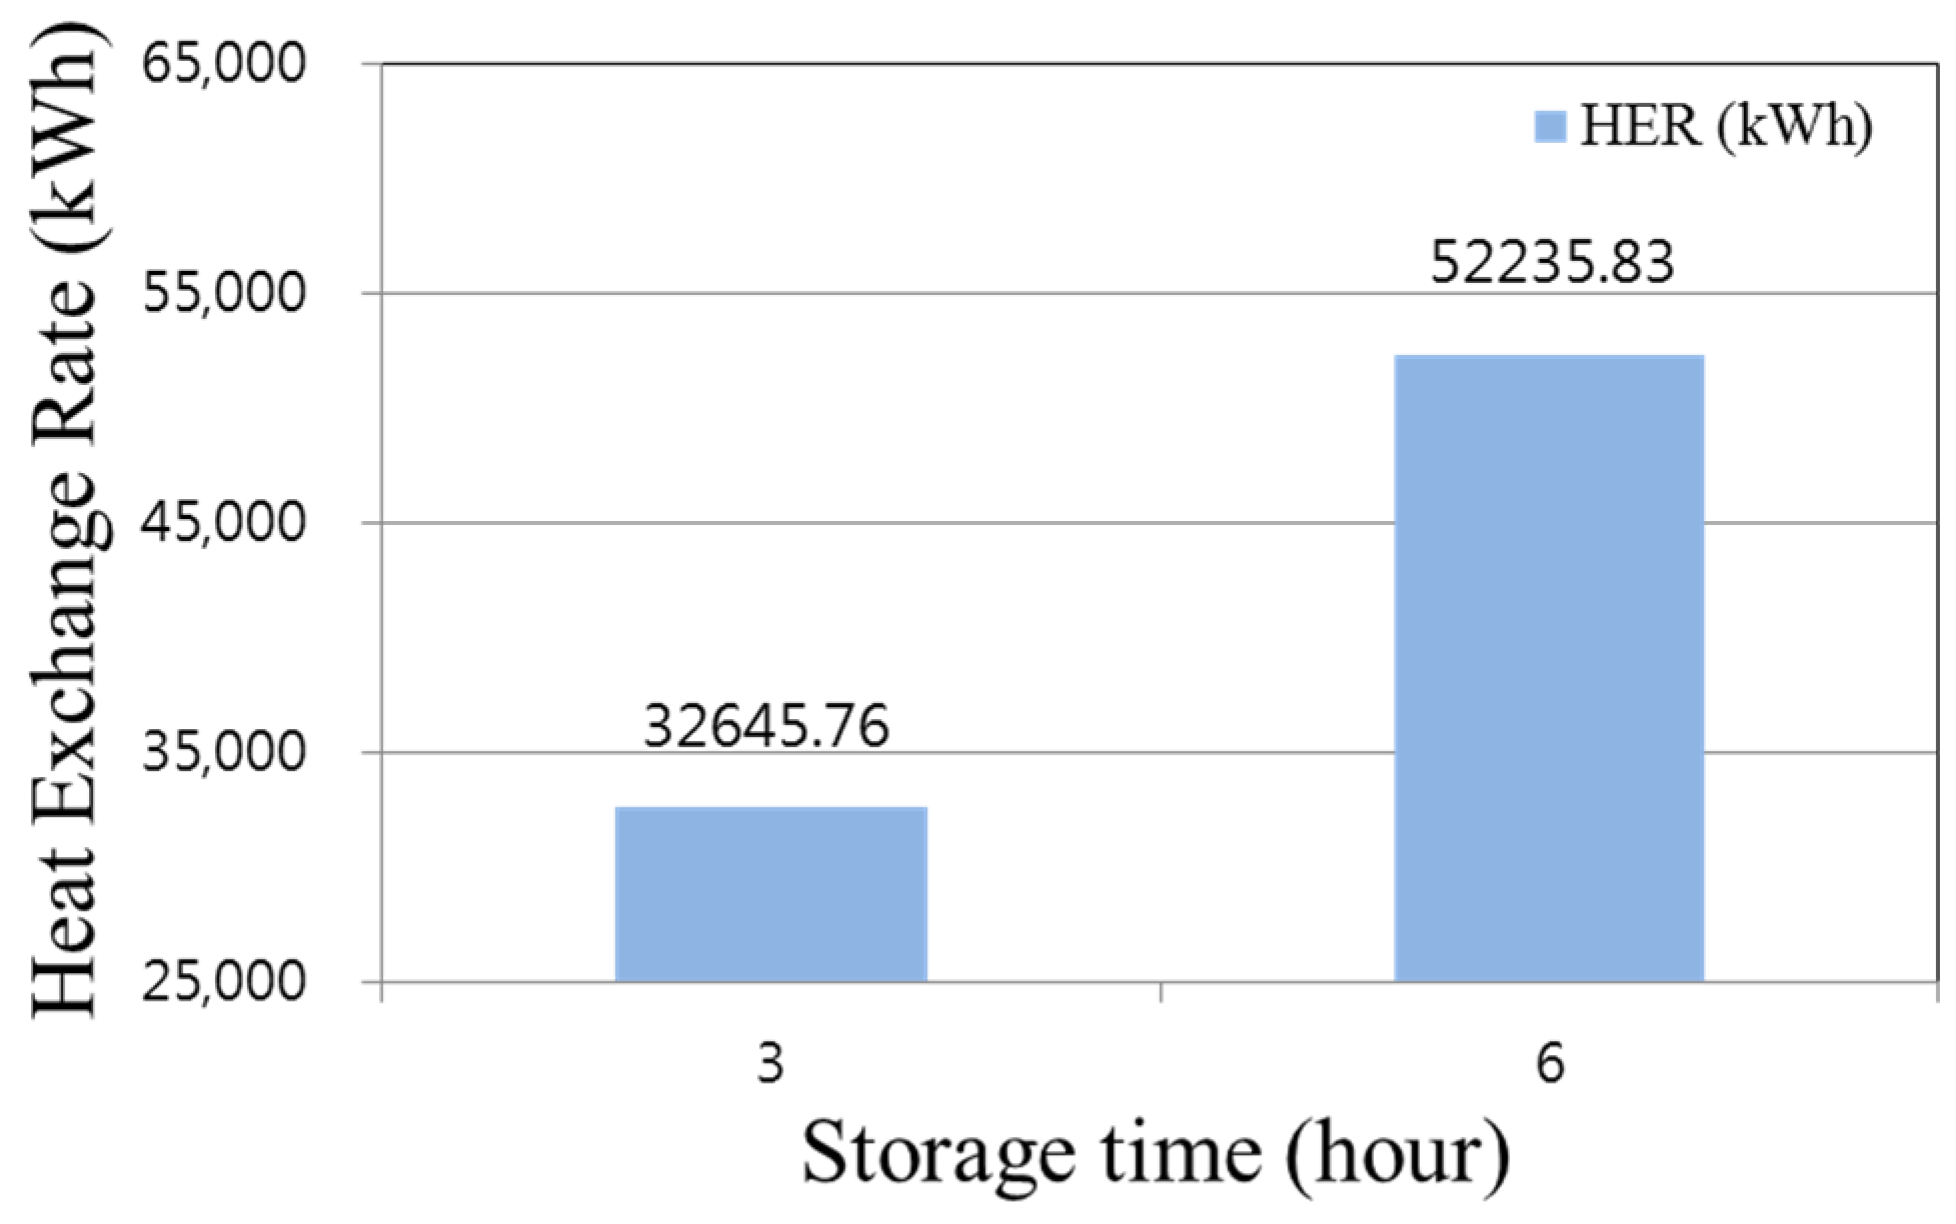
The daily average heat storage rates are shown in
Figure 15. The average heat storage rate calculated at each unit length in Case 4 that stored heat for 3 h appeared to be 18% higher than that in Case 5 which stored heat for 6 h. However, the total heat storage rate in Case 5 was about 1.6 times more than that in Case 4. The heat exchange rate in Case 5 also appeared to be slightly higher than that in Case 4. Such results could be attributed to the fact that less heat was lost and that more heat amount was accumulated due to higher heat storage rate in Case 5 despite the higher monthly average heat storage rate in Case 4. Thus, the time for heat storage should be determined by taking the cost of power consumption of the heat storage of solar energy into account since the difference in the heat exchange performance in accordance with varied duration of heat storage operation was found to be insignificant.
The average outer air temperature and average amount of solar radiation in each region are shown in
Figure 16,
Figure 17,
Figure 18 and
Figure 19. The weather data [
16,
17] of the three regions in Korea and Japan (Seoul, Busan, and Kagoshima) represented in Cases 6–8 were referred to those of respective meteorological administrations in both countries. The respective regional conditions are summarized in
Table 4.
Ta,
Rs,
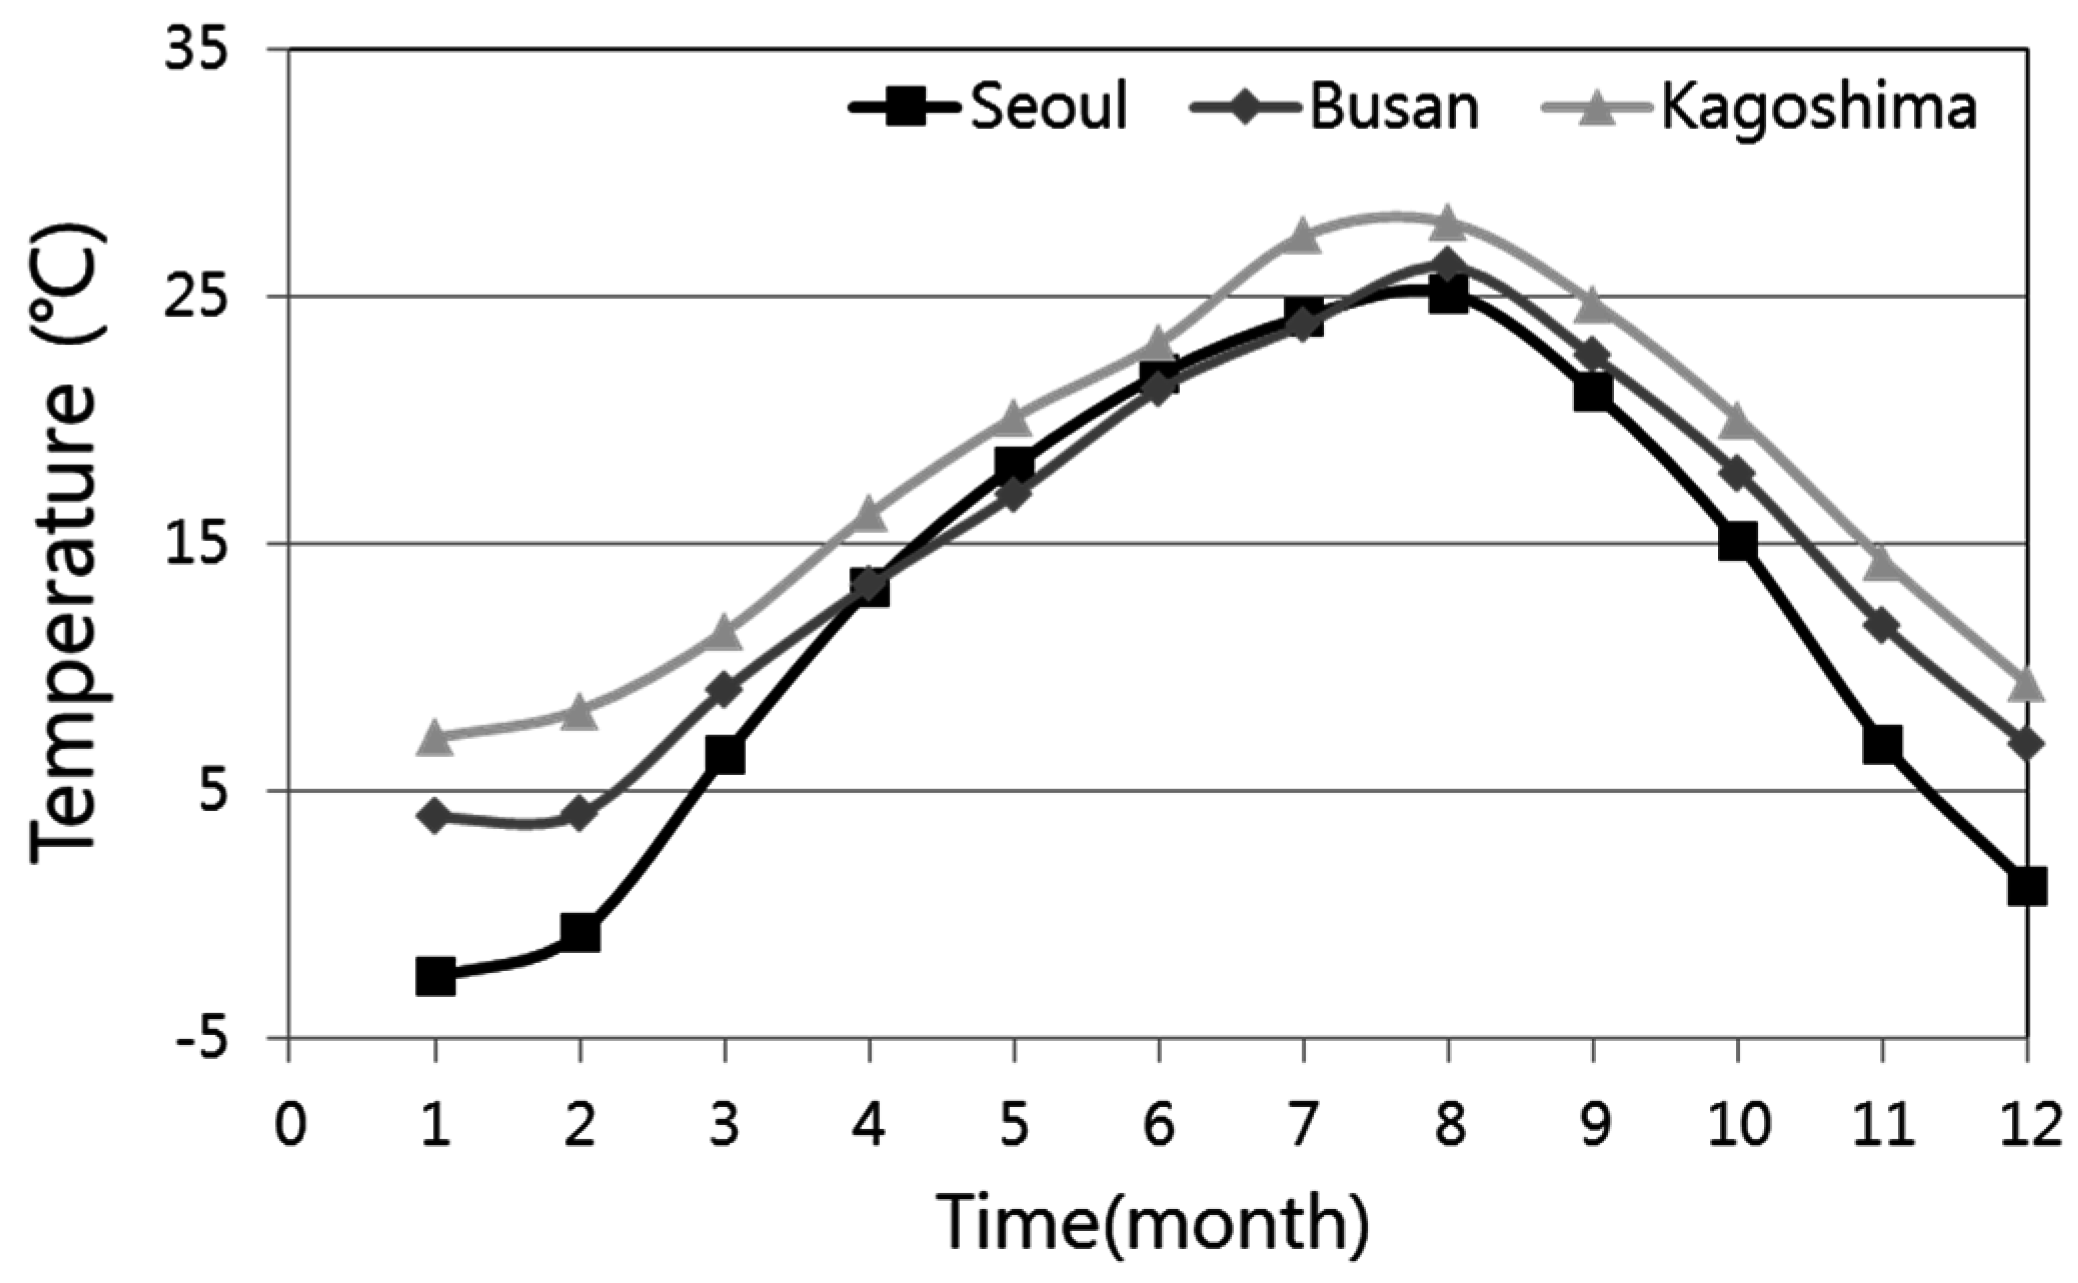
Tsoil, and north latitude denote the annual mean temperature of outer air, monthly average amount of solar radiation, set underground temperature, and northern latitude, respectively. The monthly average temperature of outer air of each region is shown in
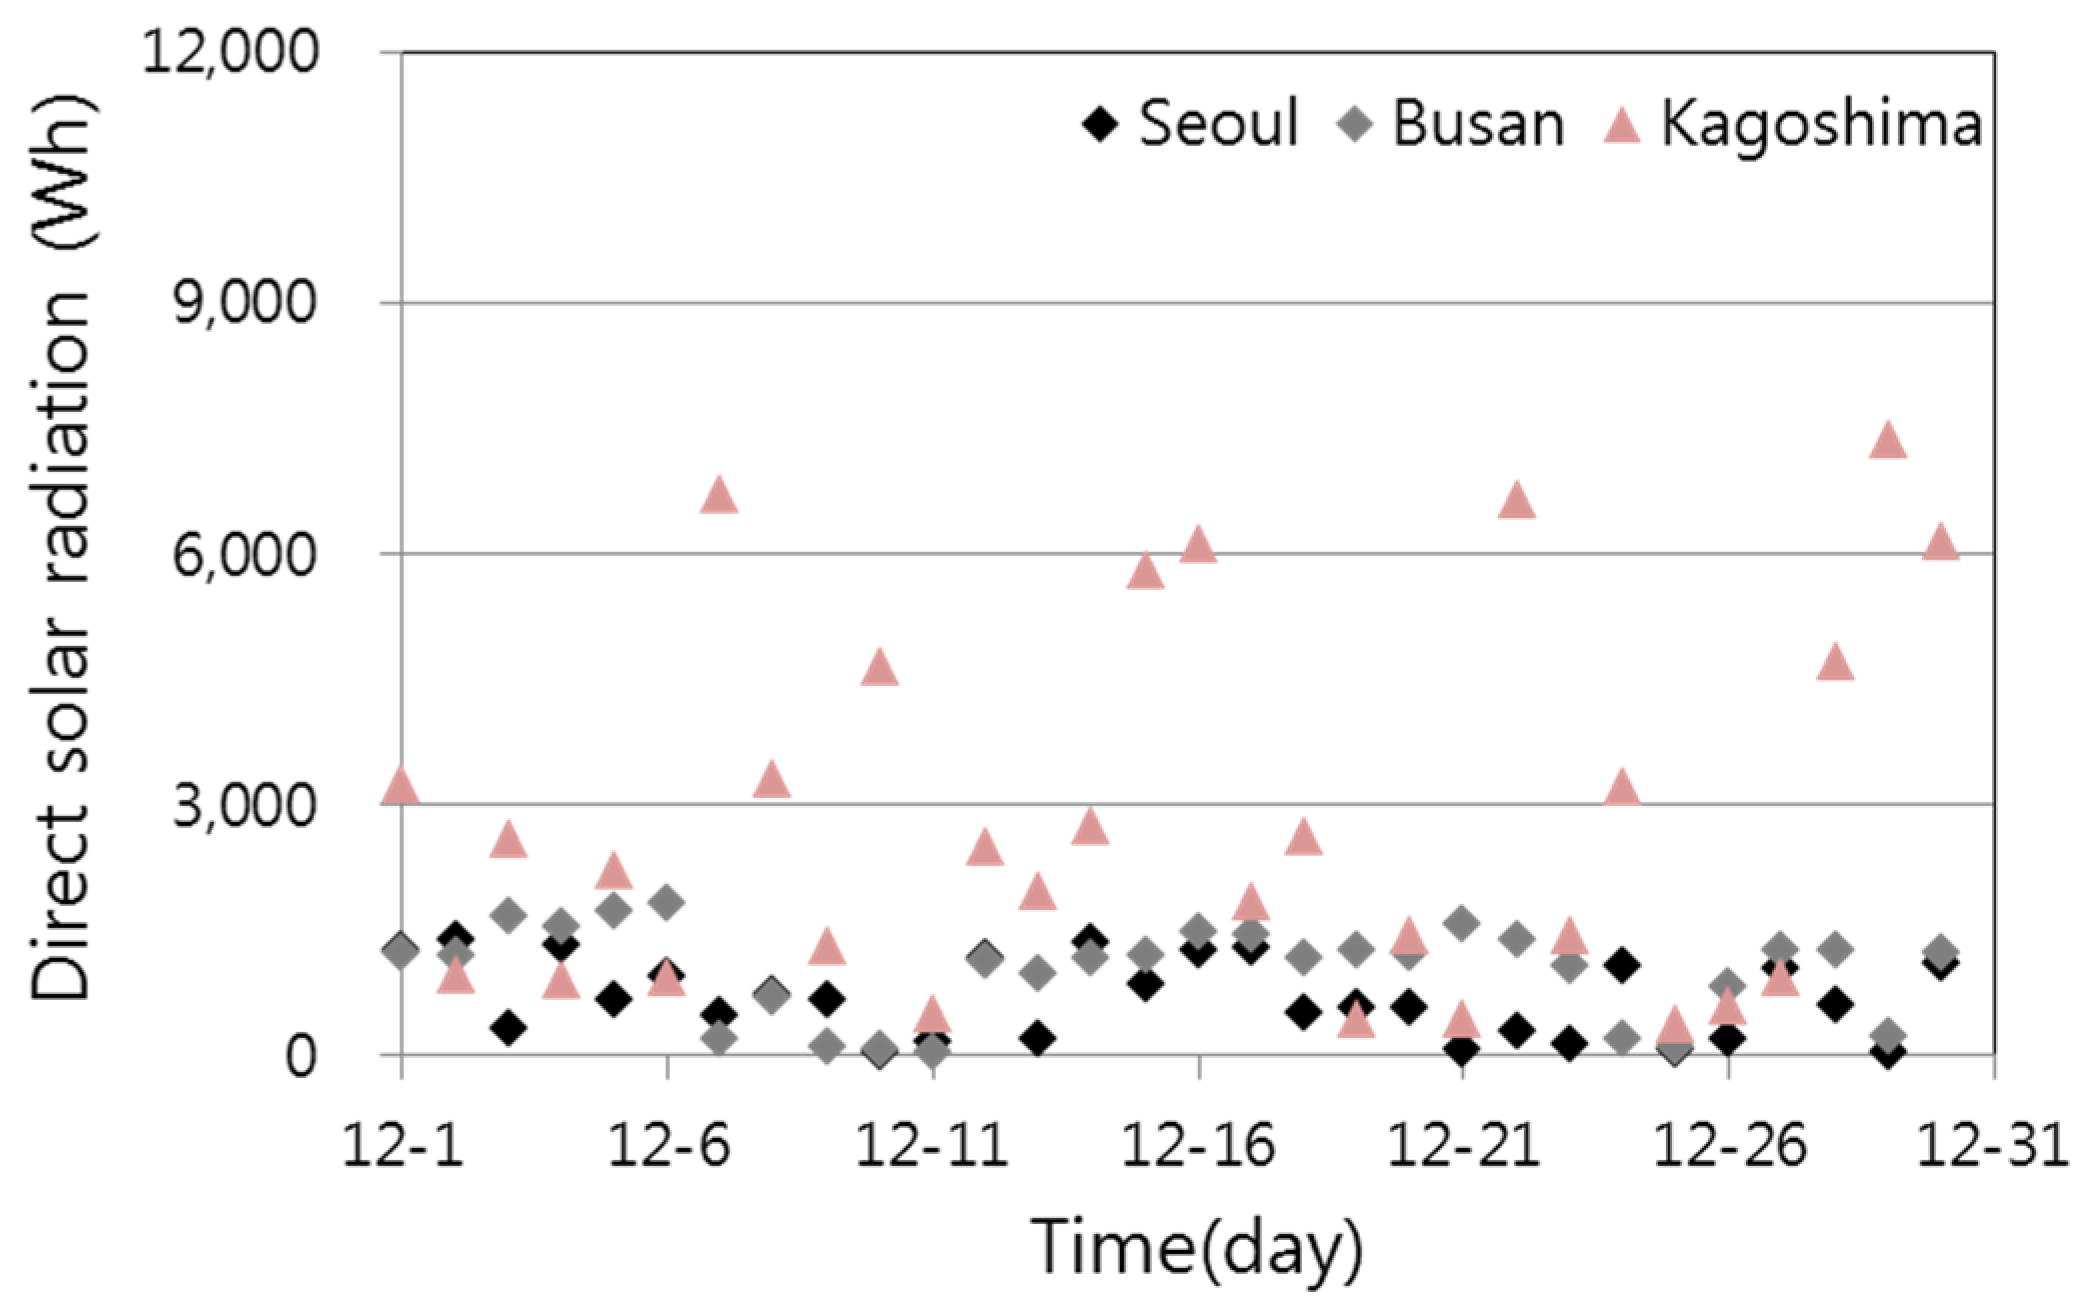
Figure 16. The amount of solar radiation in each region is shown in
Figure 17.
Figure 16.
Monthly average air temperature (Seoul and Busan, Kagoshima).
Figure 16.
Monthly average air temperature (Seoul and Busan, Kagoshima).
Figure 17.
Daily total direct solar radiation (Seoul and Busan, Kagoshima).
Figure 17.
Daily total direct solar radiation (Seoul and Busan, Kagoshima).
Table 4.
Simulation area conditions.
Table 4.
Simulation area conditions.
| Location | Ta (°C) | Rs (W/m2) | TSoil (°C) | North latitude (°) |
|---|
| Seoul | 12.57 | 80.20 | 16 | 37° 34' |
| Busan | 14.87 | 99.36 | 16 | 35° 06' |
| Kagoshima | 17.52 | 116.06 | 16 | 31° 33' |
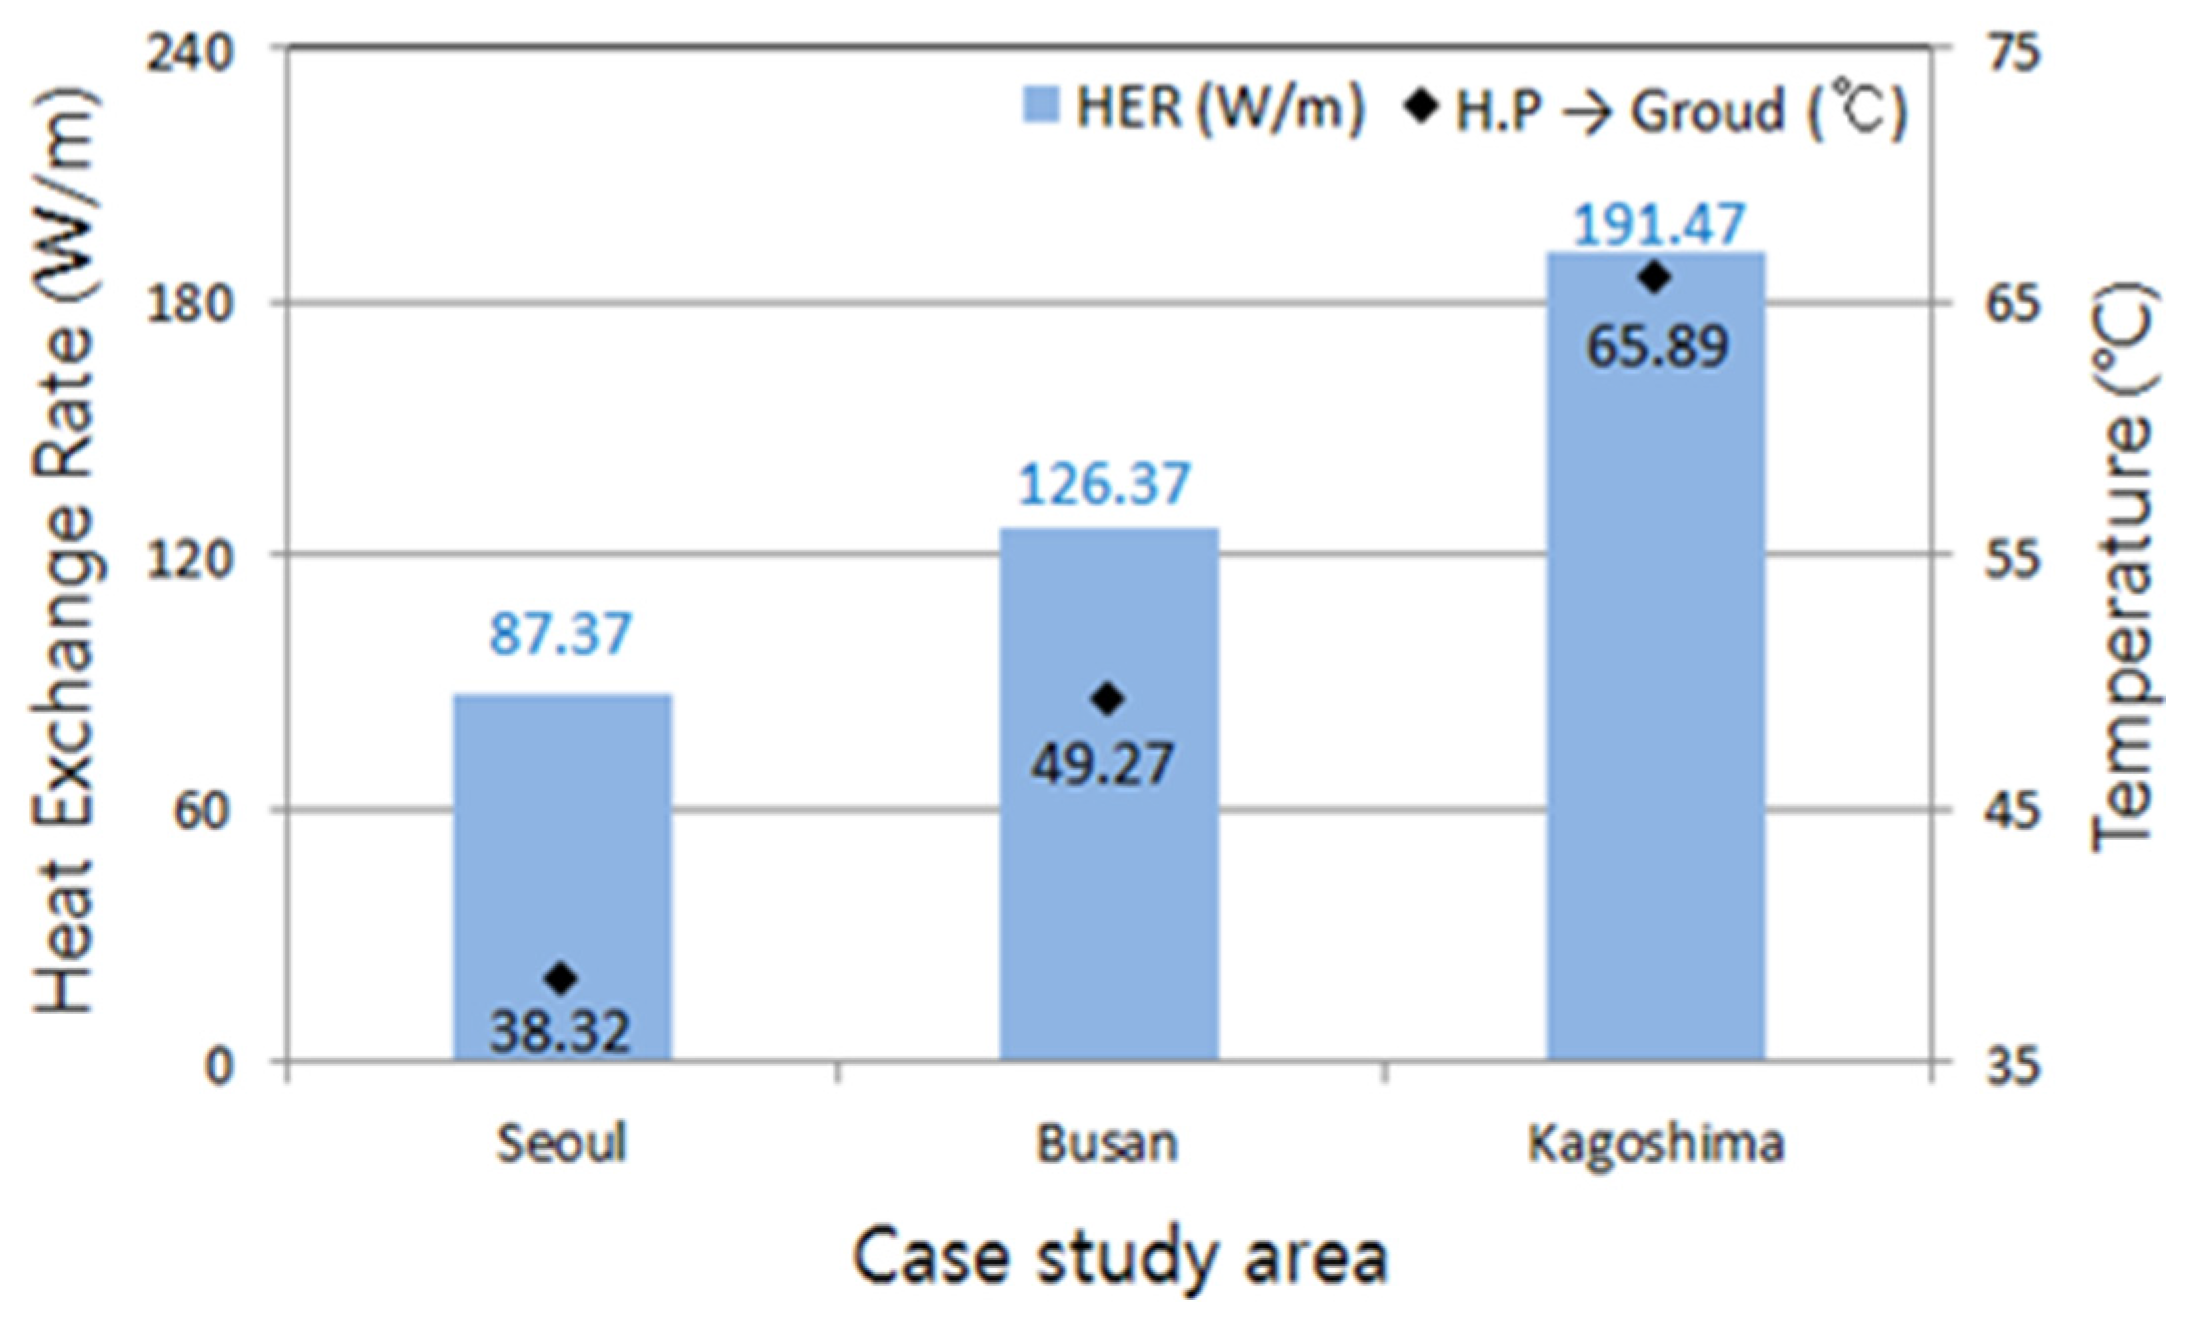
The average inlet temperatures of circulation water calculated at each unit length and heat storage rate during heat storage are shown in
Figure 18. The average outlet temperatures of circulation water calculated at each unit length and heat exchange rate during heat collection are shown in
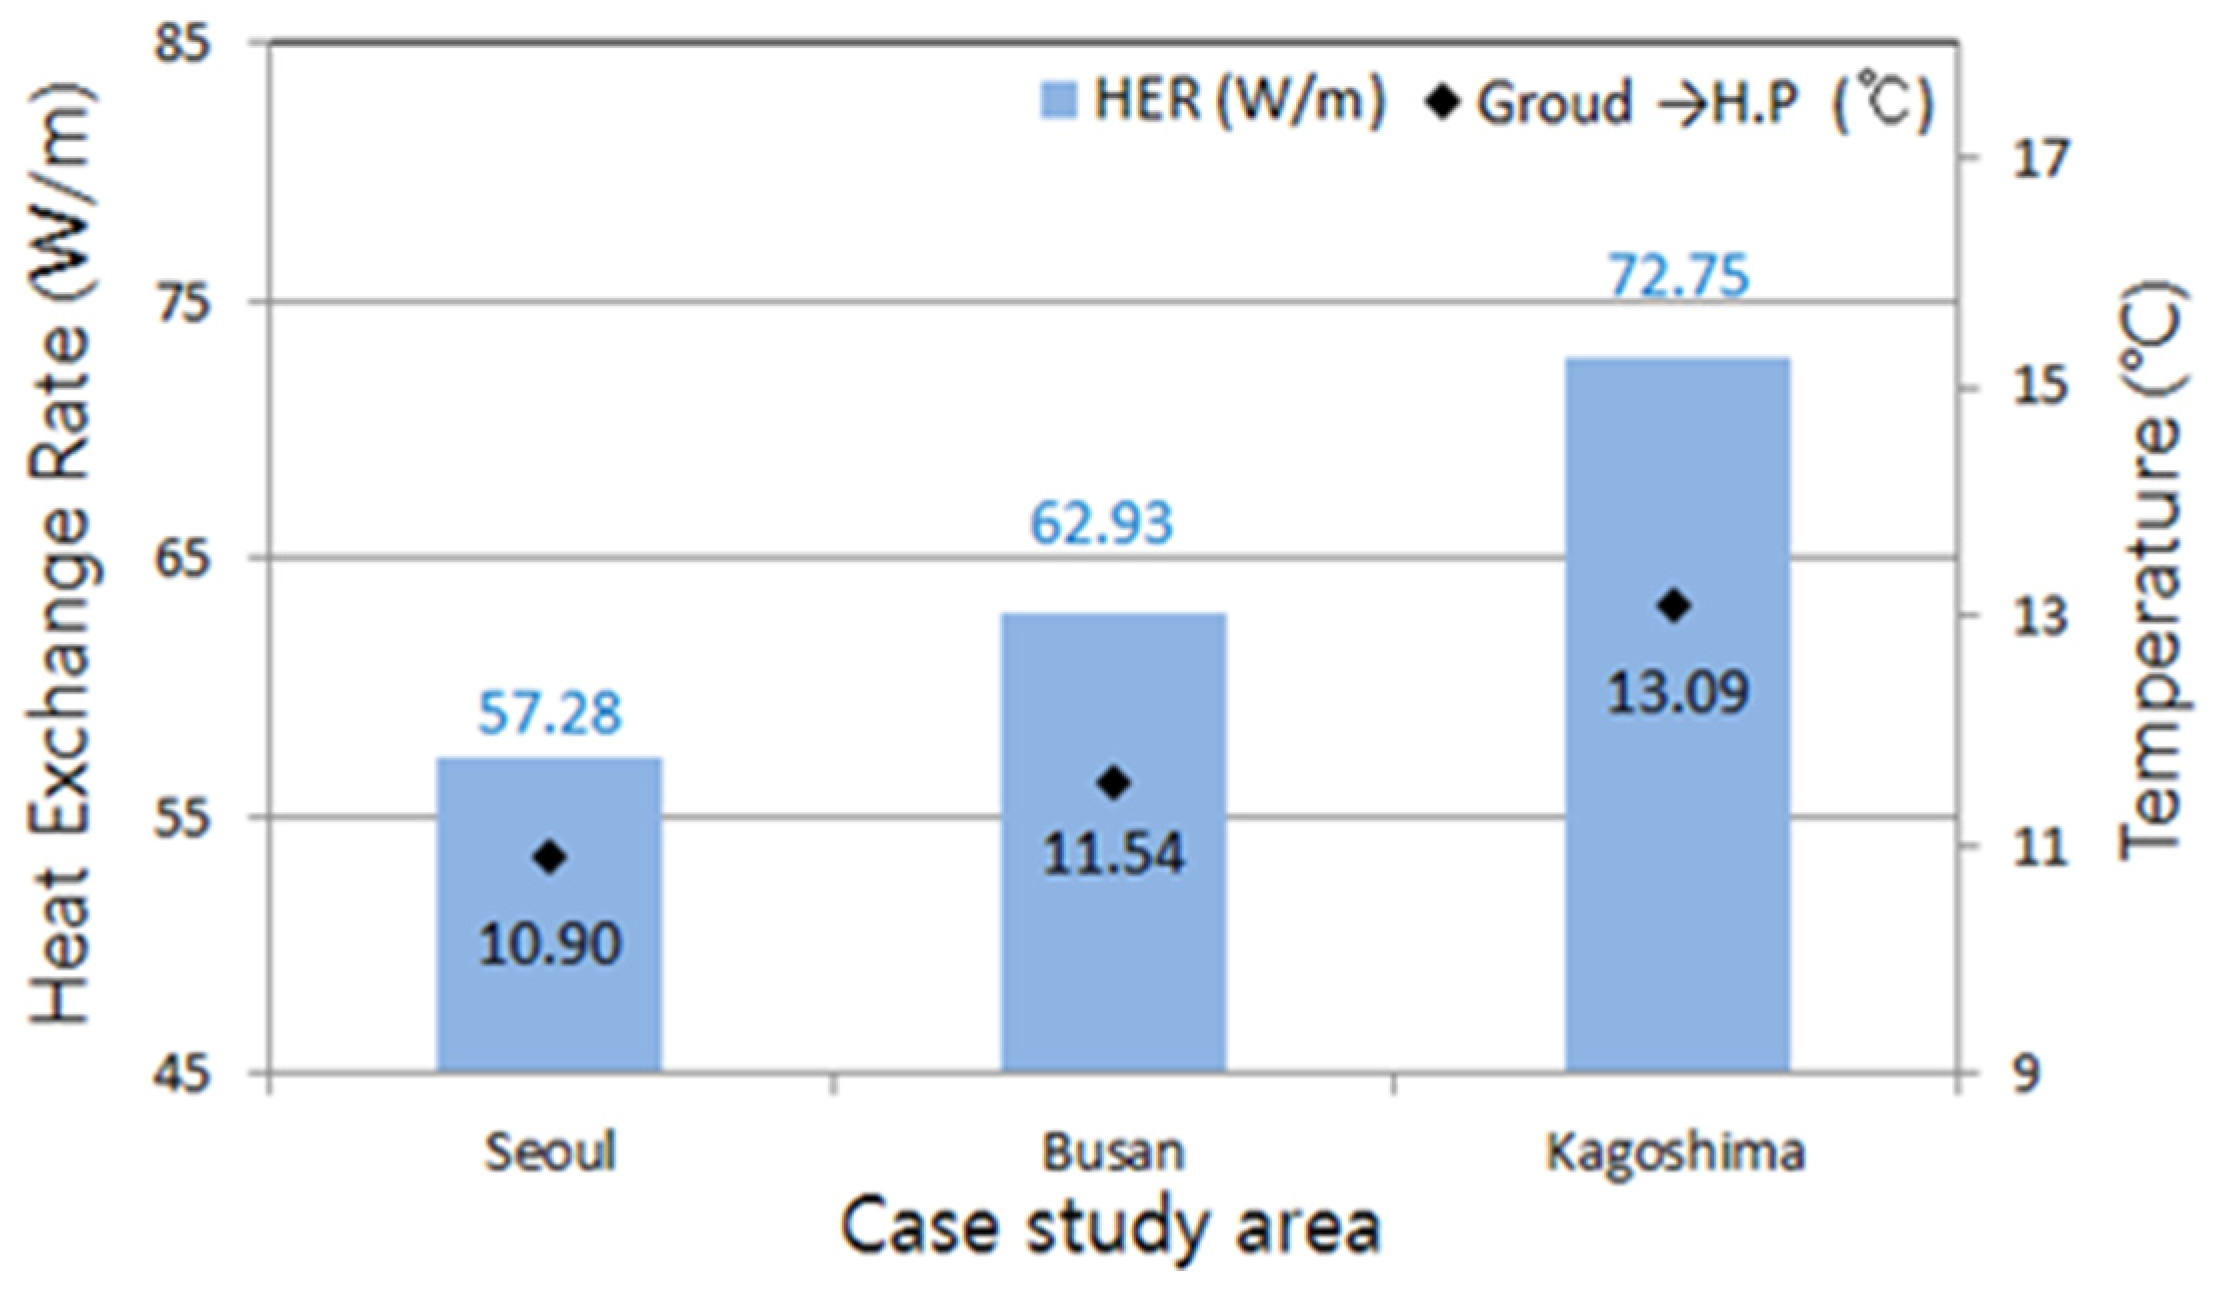
Figure 19. During heat storage, the average inlet temperatures of the heat exchanger were 38.32 °C in Seoul, 49.27 °C in Busan, and 65.89 °C in Kagoshima. The heat storage rate in Kagoshima had the highest value at 191.47 W/m, which was about 119% higher than the value in Seoul at 87.37 W/m.
The heat exchange rates during heating operation were 57.28 W/m in Seoul, 62.93 W/m in Busan, and 72.75 W/m in Kagoshima. The results indicate that the potential of heat exchange rate is higher in the southern region due to higher annual average temperature of outer air and higher amount of solar radiation in the south compared to the north. The difference in average heat exchange rate between Seoul and Kagoshima was about 27%, which was smaller than the value of 119% for the heat storage.
Figure 18.
Average of heat storage rate for simulation area change (Seoul and Busan, Kagoshima).
Figure 18.
Average of heat storage rate for simulation area change (Seoul and Busan, Kagoshima).
Figure 19.
Average of heat exchange rate for simulation area change (Seoul and Busan, Kagoshima).
Figure 19.
Average of heat exchange rate for simulation area change (Seoul and Busan, Kagoshima).
Results of the comparative analysis of heat collection performance according to different underground heat conductivity values are shown in
Figure 20,
Figure 21 and
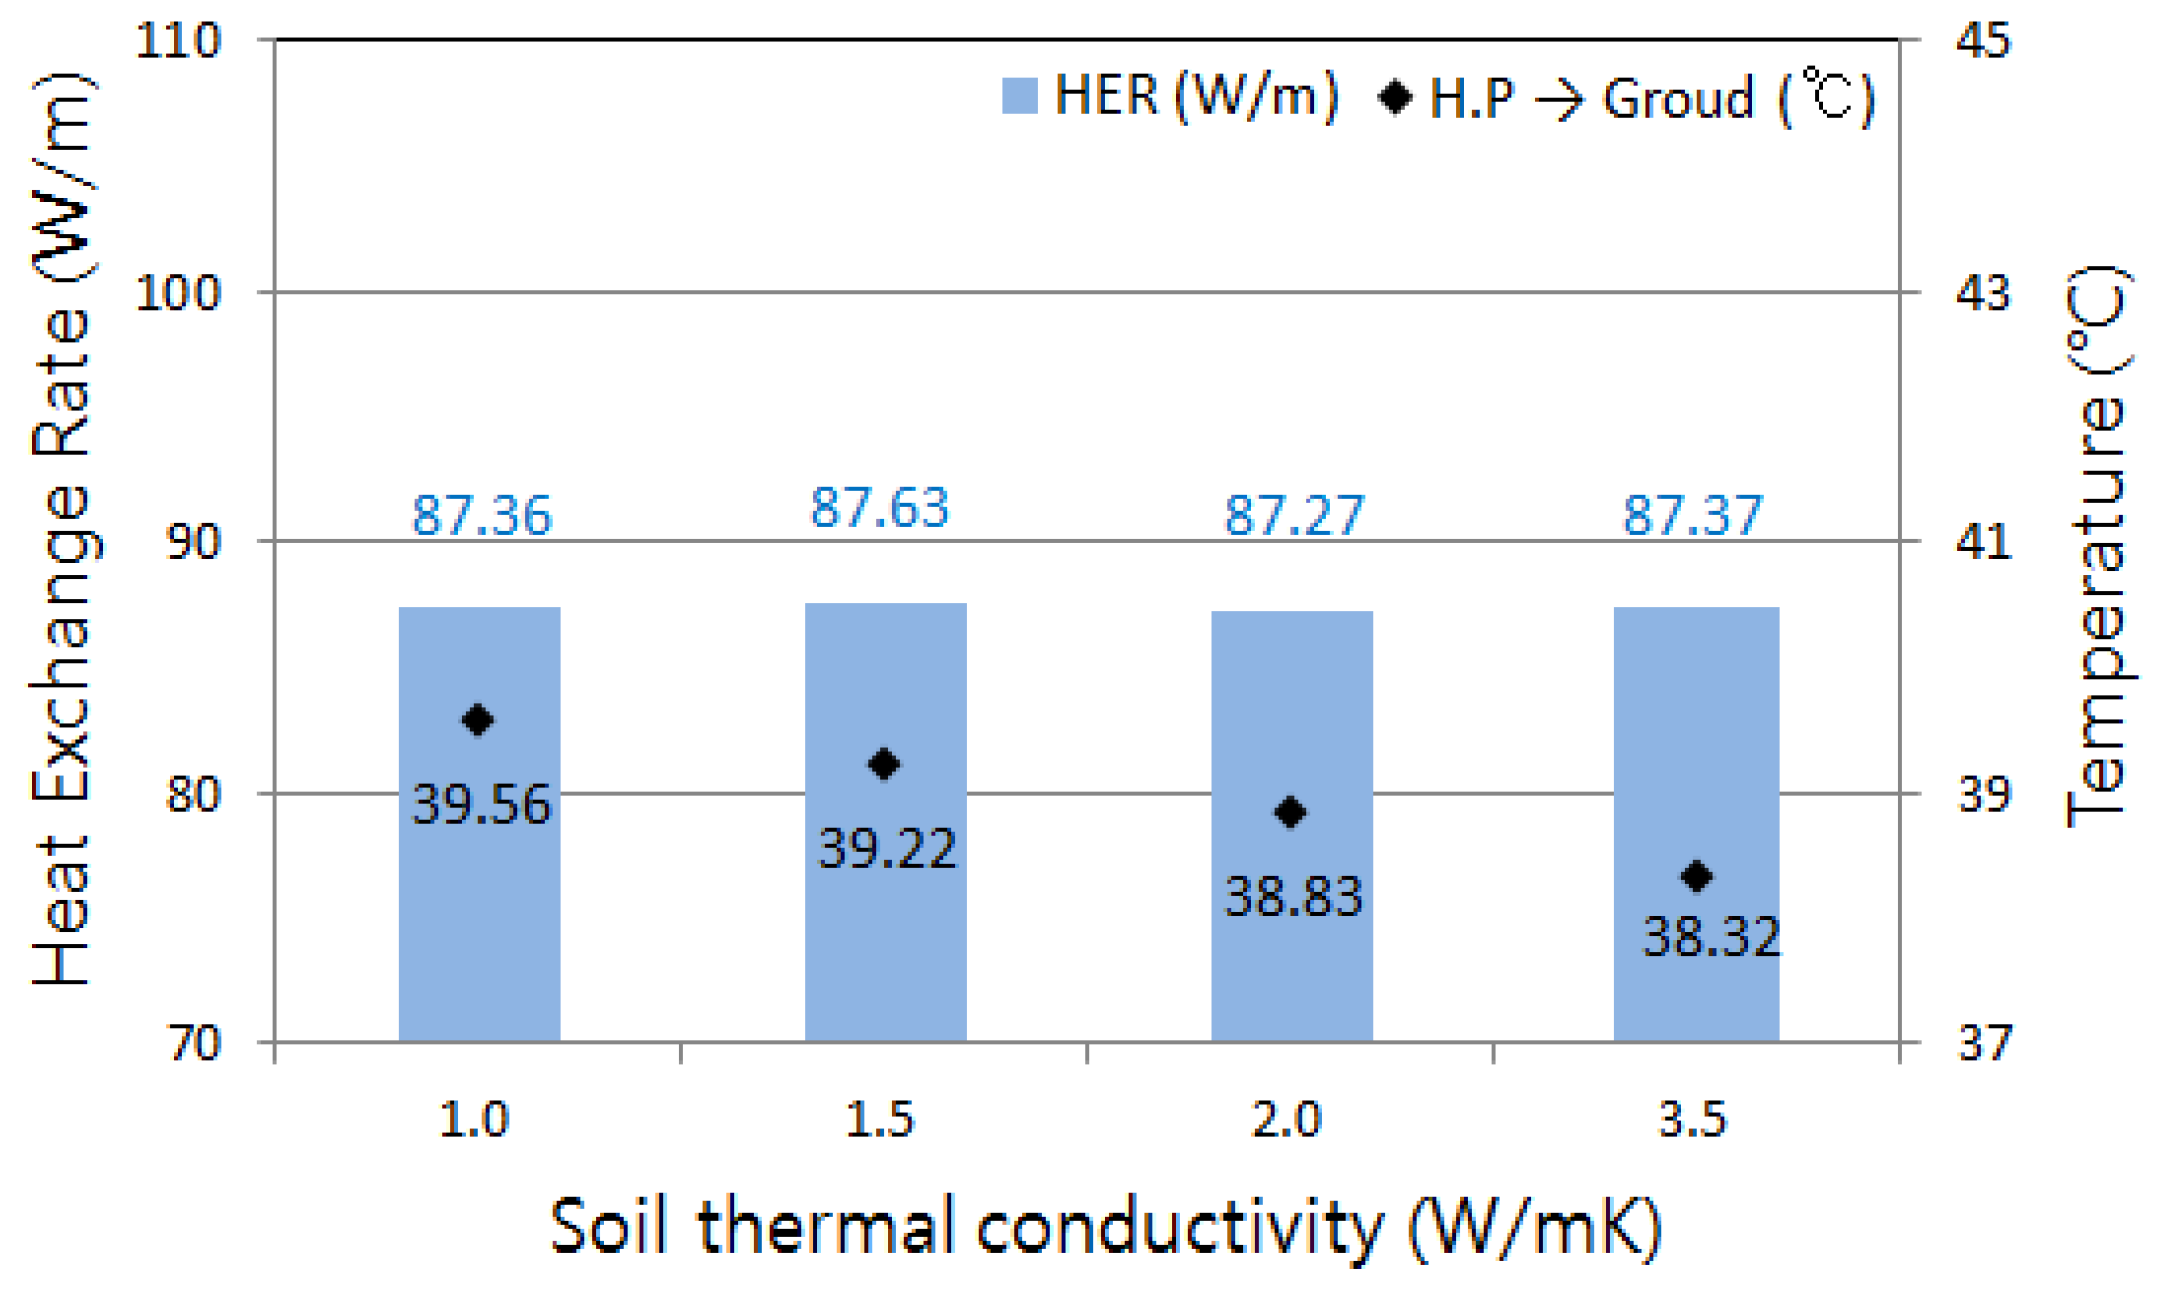
Figure 22. In Cases 9–11, the values of underground heat conductivity were set at 1.0 W/mK, 2.0 W/mK, and 3.0 W/mK, respectively, which were comparable to the value of Case 6 at 3.5 W/mK. The average inlet temperatures of circulation water calculated at each unit length and heat storage rate during heat storage operation are shown in
Figure 20. The average outlet temperatures of circulation water calculated at each unit length and heat exchange rate in the heat collection operation are illustrated in
Figure 21.
Figure 20.
Average of heat storage rate for soil conductivity change (Cases 6 and 9–11).
Figure 20.
Average of heat storage rate for soil conductivity change (Cases 6 and 9–11).
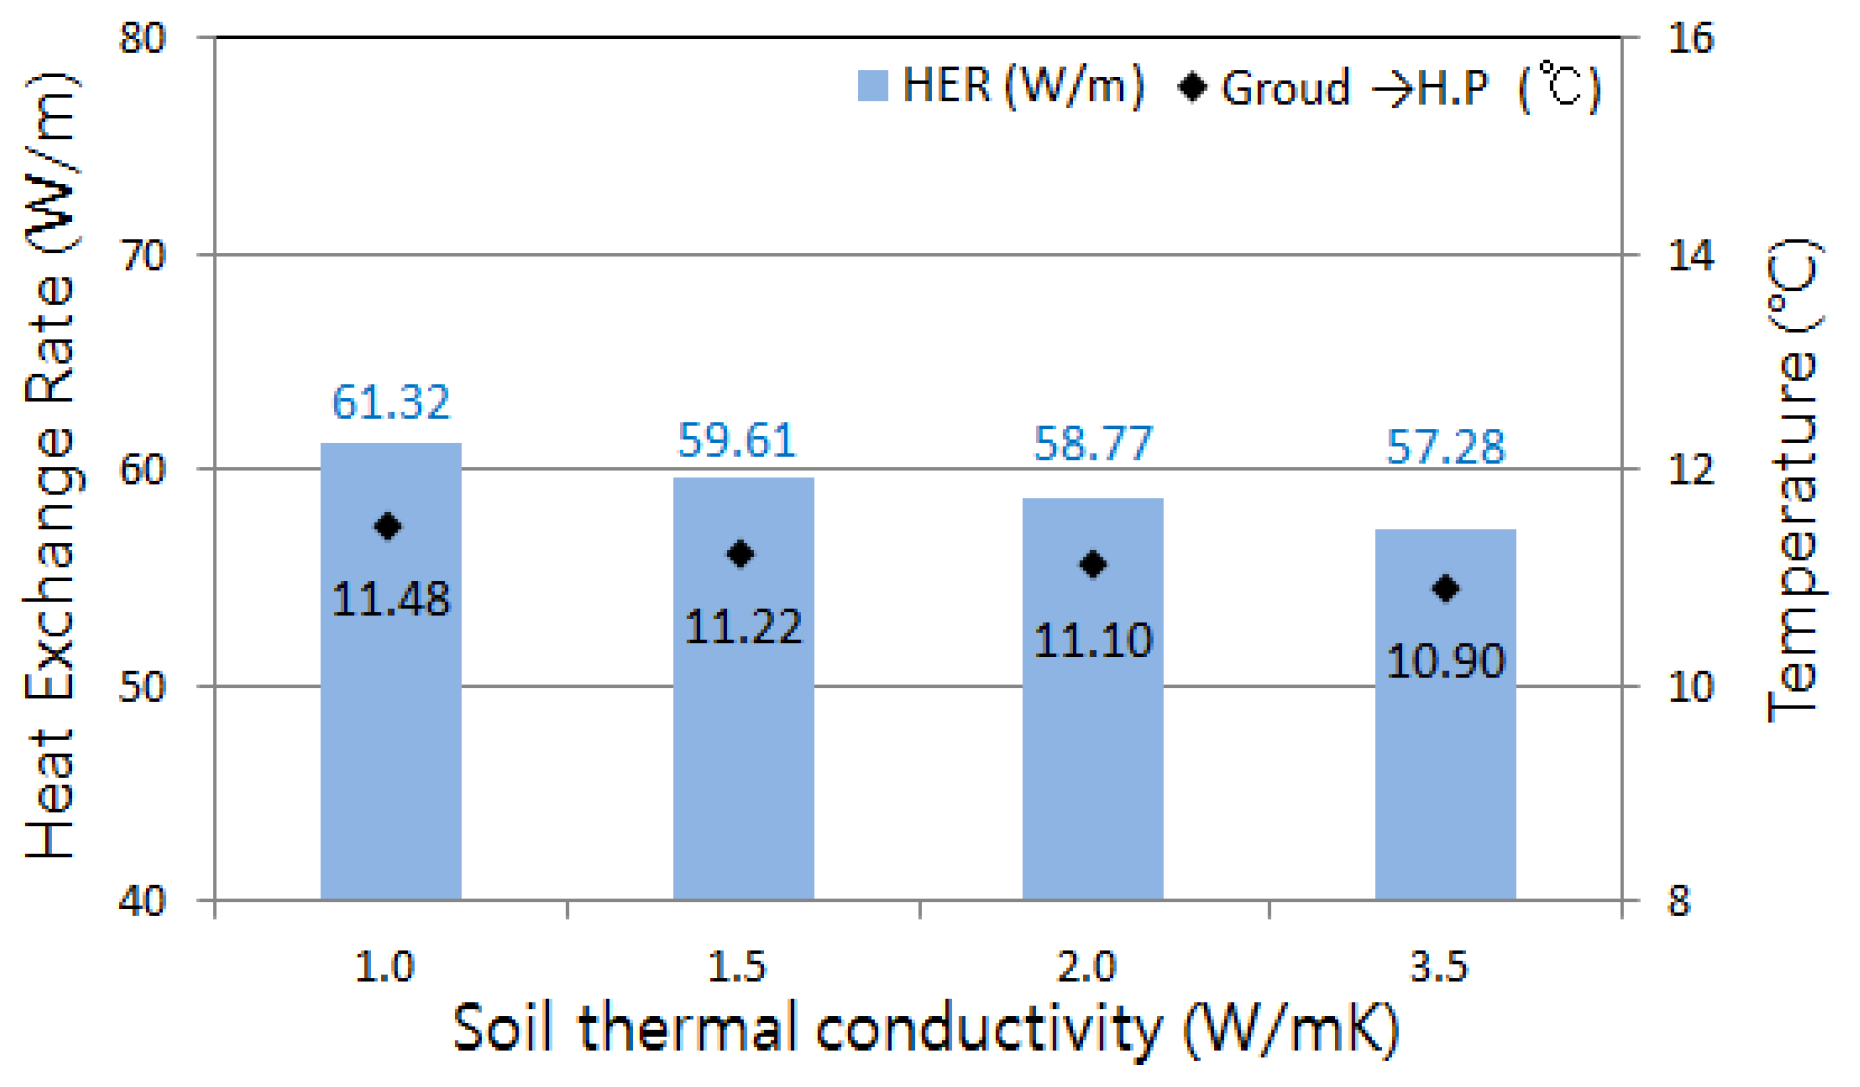
Figure 21.
Average of heat exchange rate for soil conductivity change (Cases 6 and 9–11).
Figure 21.
Average of heat exchange rate for soil conductivity change (Cases 6 and 9–11).
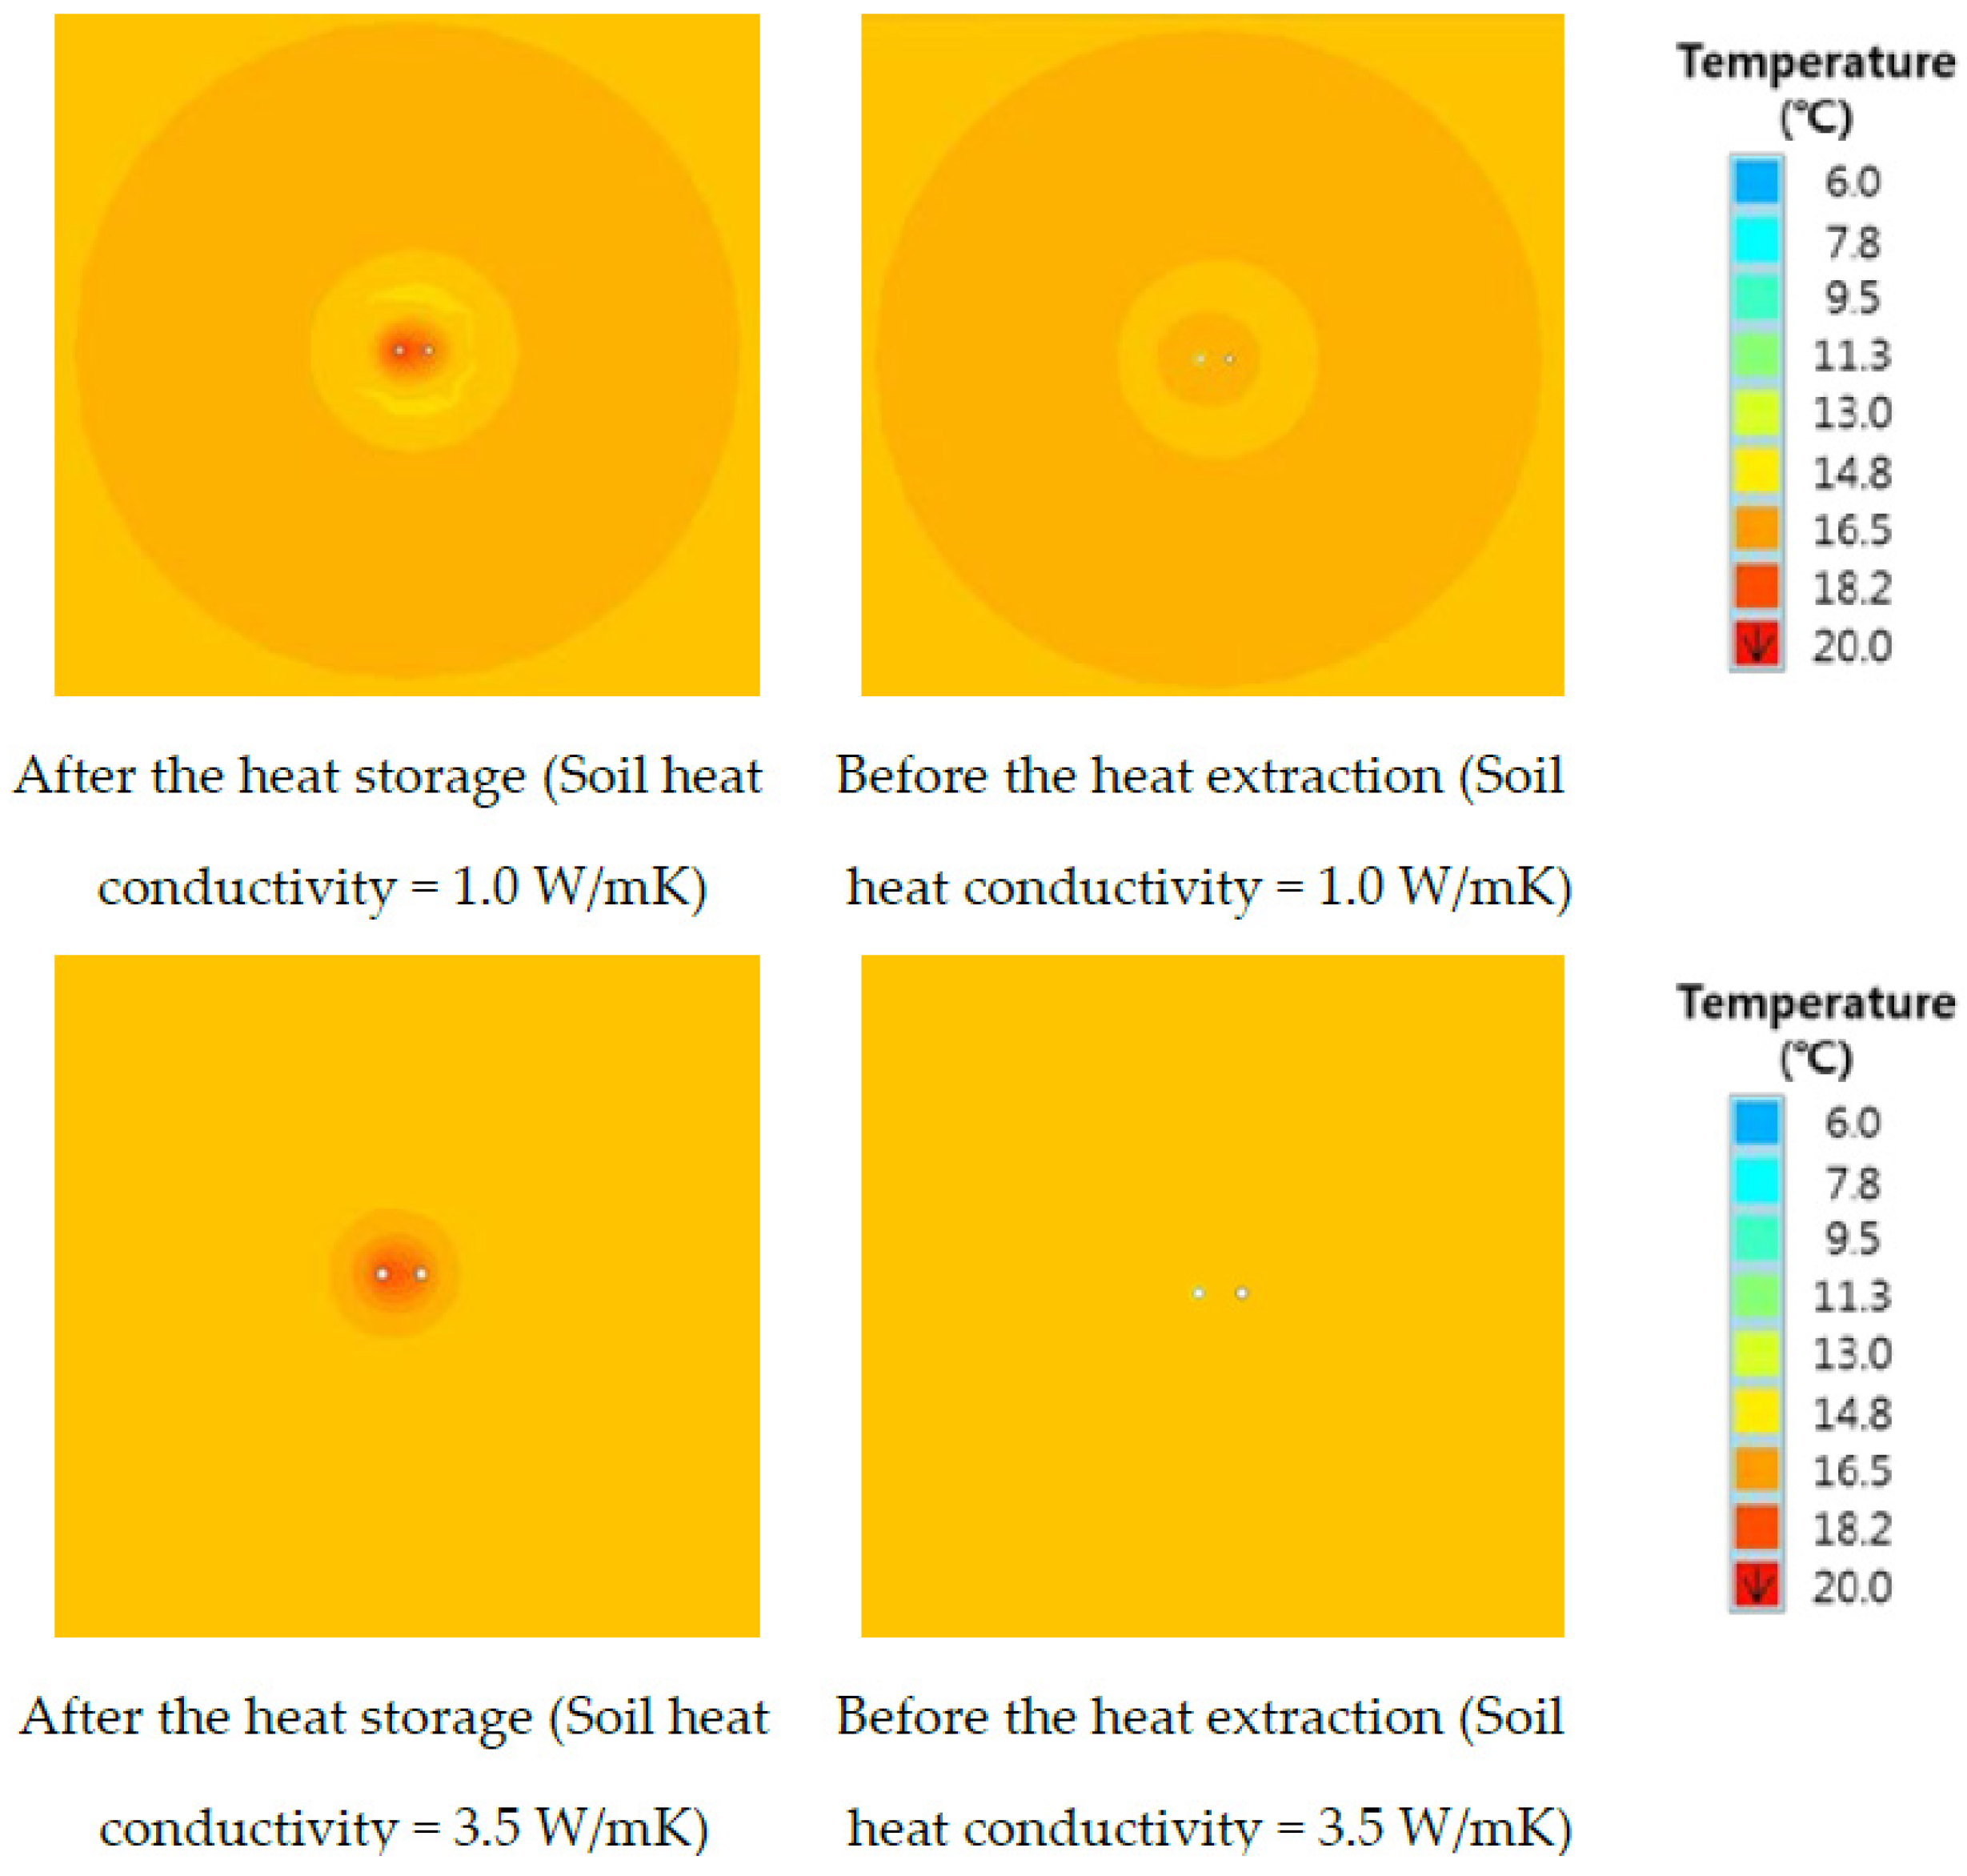
Figure 22.
Temperature distribution around the heat exchanger (Cases 6 and 9).
Figure 22.
Temperature distribution around the heat exchanger (Cases 6 and 9).
The difference in heat storage rate among heat storage cases (Cases 9–11) appeared to be insignificant. For heat collection cases, the values of heat exchange rate in Cases 9–11, and 6 were 61.32 W/m, 59.61 W/m, 58.77 W/m, and 57.28 W/m, respectively.
The maximum difference was about 7%, attributable to the decreased value in accordance with increased underground heat conductivity. Results obtained from the analysis for conditions of 1.0 W/mK and 3.5 W/mK of underground heat conductivity are shown in
Figure 22. The temperature change around the heat exchanger situated 30 m beneath the ground was calculated right before and after the heat storage operation. For Case 9 (λ
soil: 1.0 W/mK), the underground temperature on the boundary surface of the borehole calculated right after the heat storage operation was 19.4 °C, similar to the value of 19.0 °C in Case 6 (λ
soil: 3.5 W/mK). However, the underground temperature calculated right before the heat collection operation was 11.3 °C, revealing a rather bigger difference of 3.4 °C compared to 7.9 °C in Case 6. From this result, it was identified that the heat accumulated through heat storage could be effectively collected through heat collection. However, the efficiency of heat collection varied greatly due to the different soil heat conductivity values.
Results of the analysis for the performance of heat storage and heat collection with different grout heat conductivities are shown in
Figure 23,
Figure 24,
Figure 25,
Figure 26 and
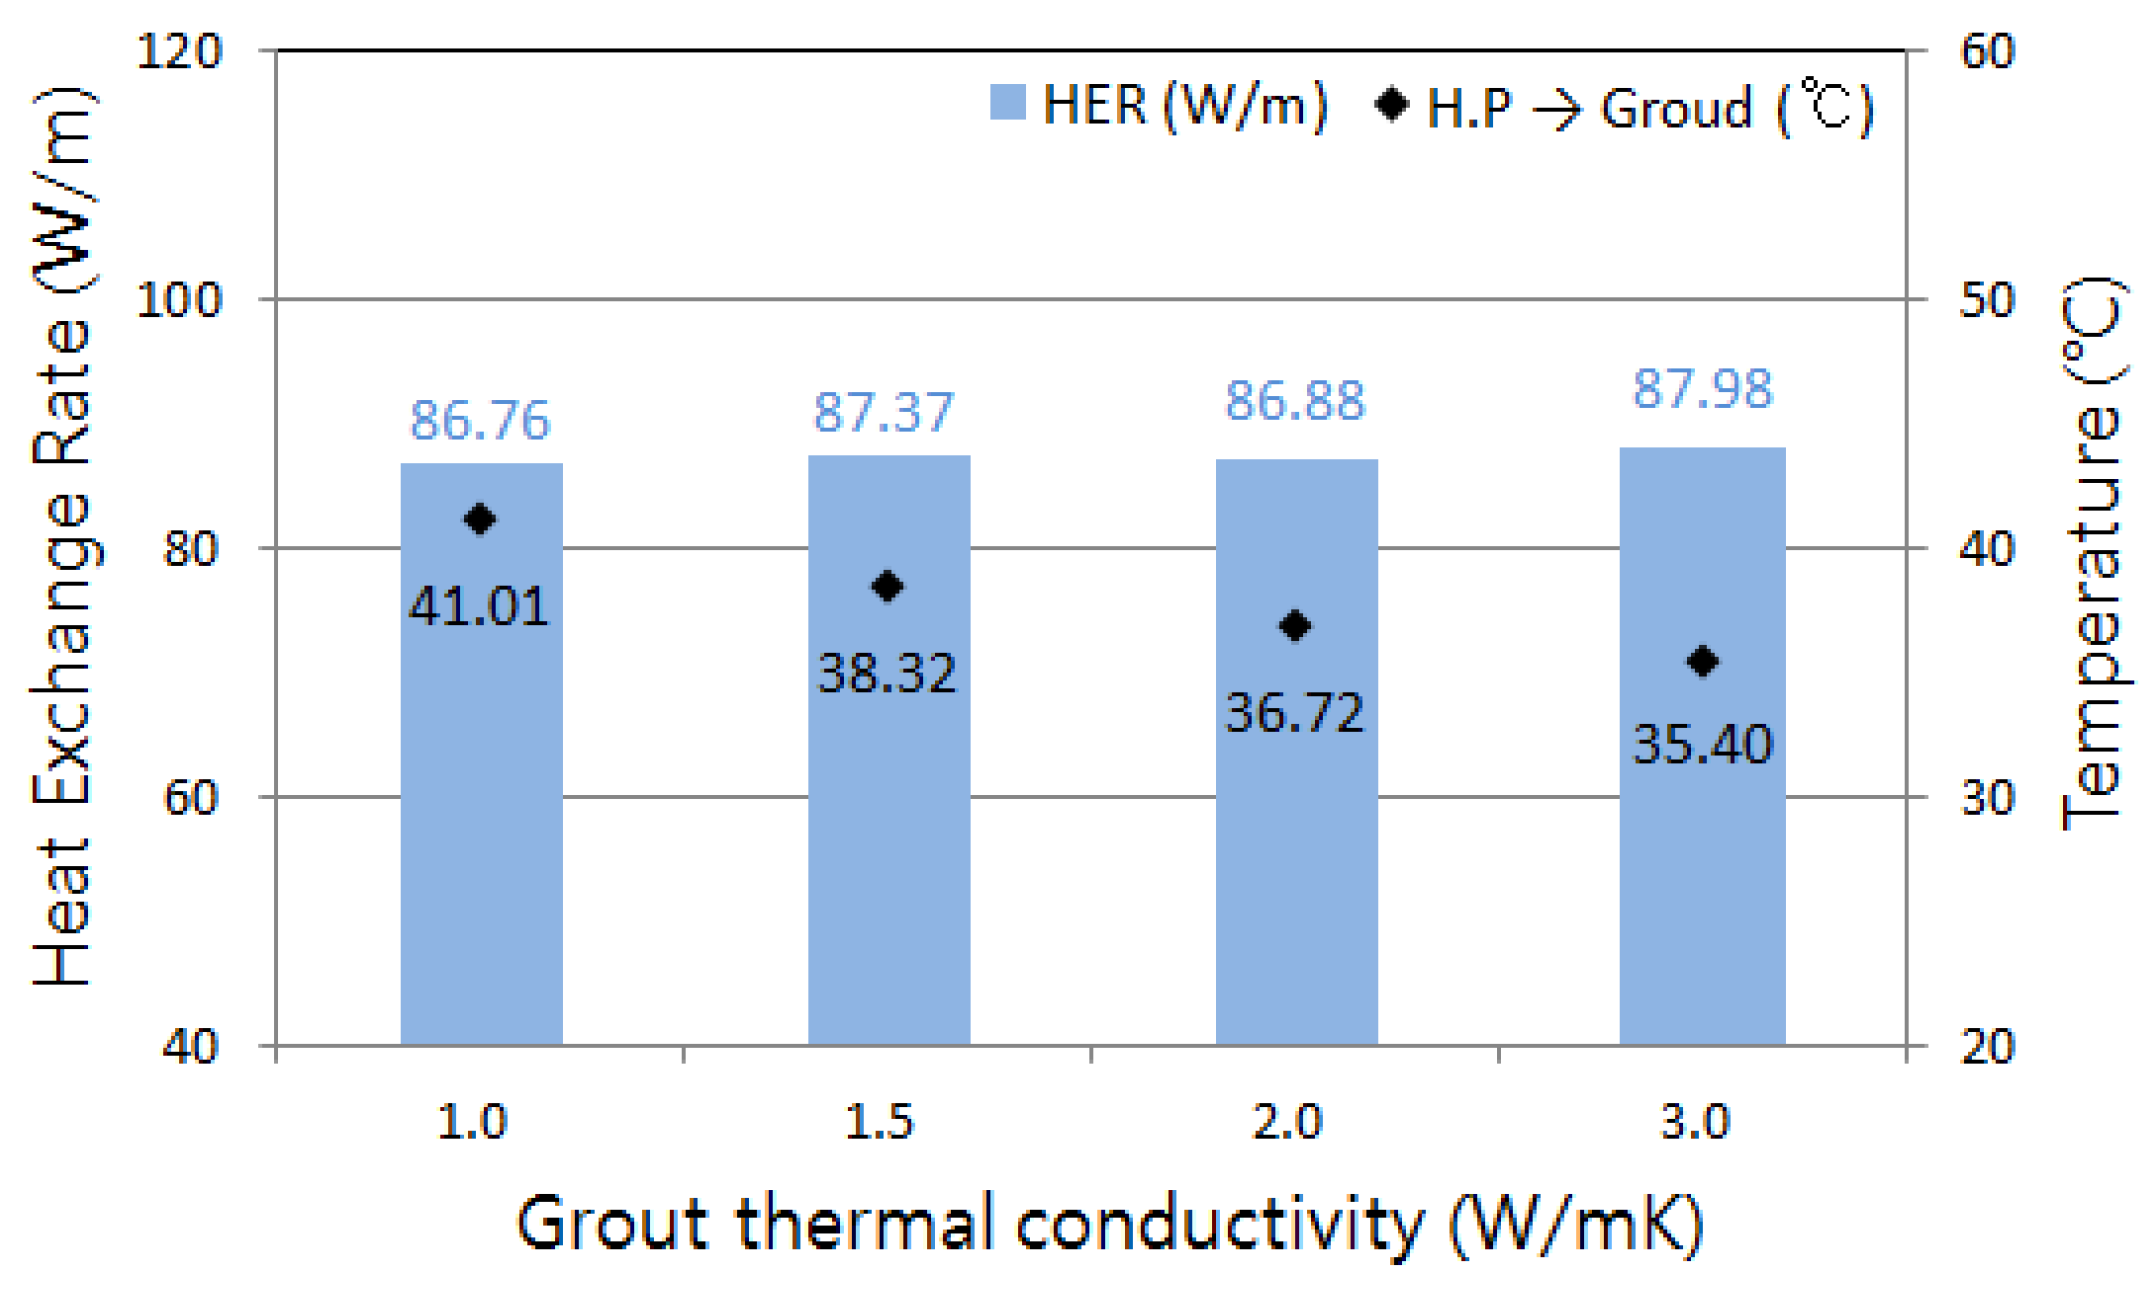
Figure 27. For Cases 12–14, the grout heat conductivity was 1.0 W/mK, 2.0 W/mK, and 3.0 W/mK, respectively, which was comparable to the grout heat conductivity at 1.5 W/mK in Case 6. The average inlet temperatures of circulation water calculated at each unit length and heat storage rate in the heat storage operation are shown in
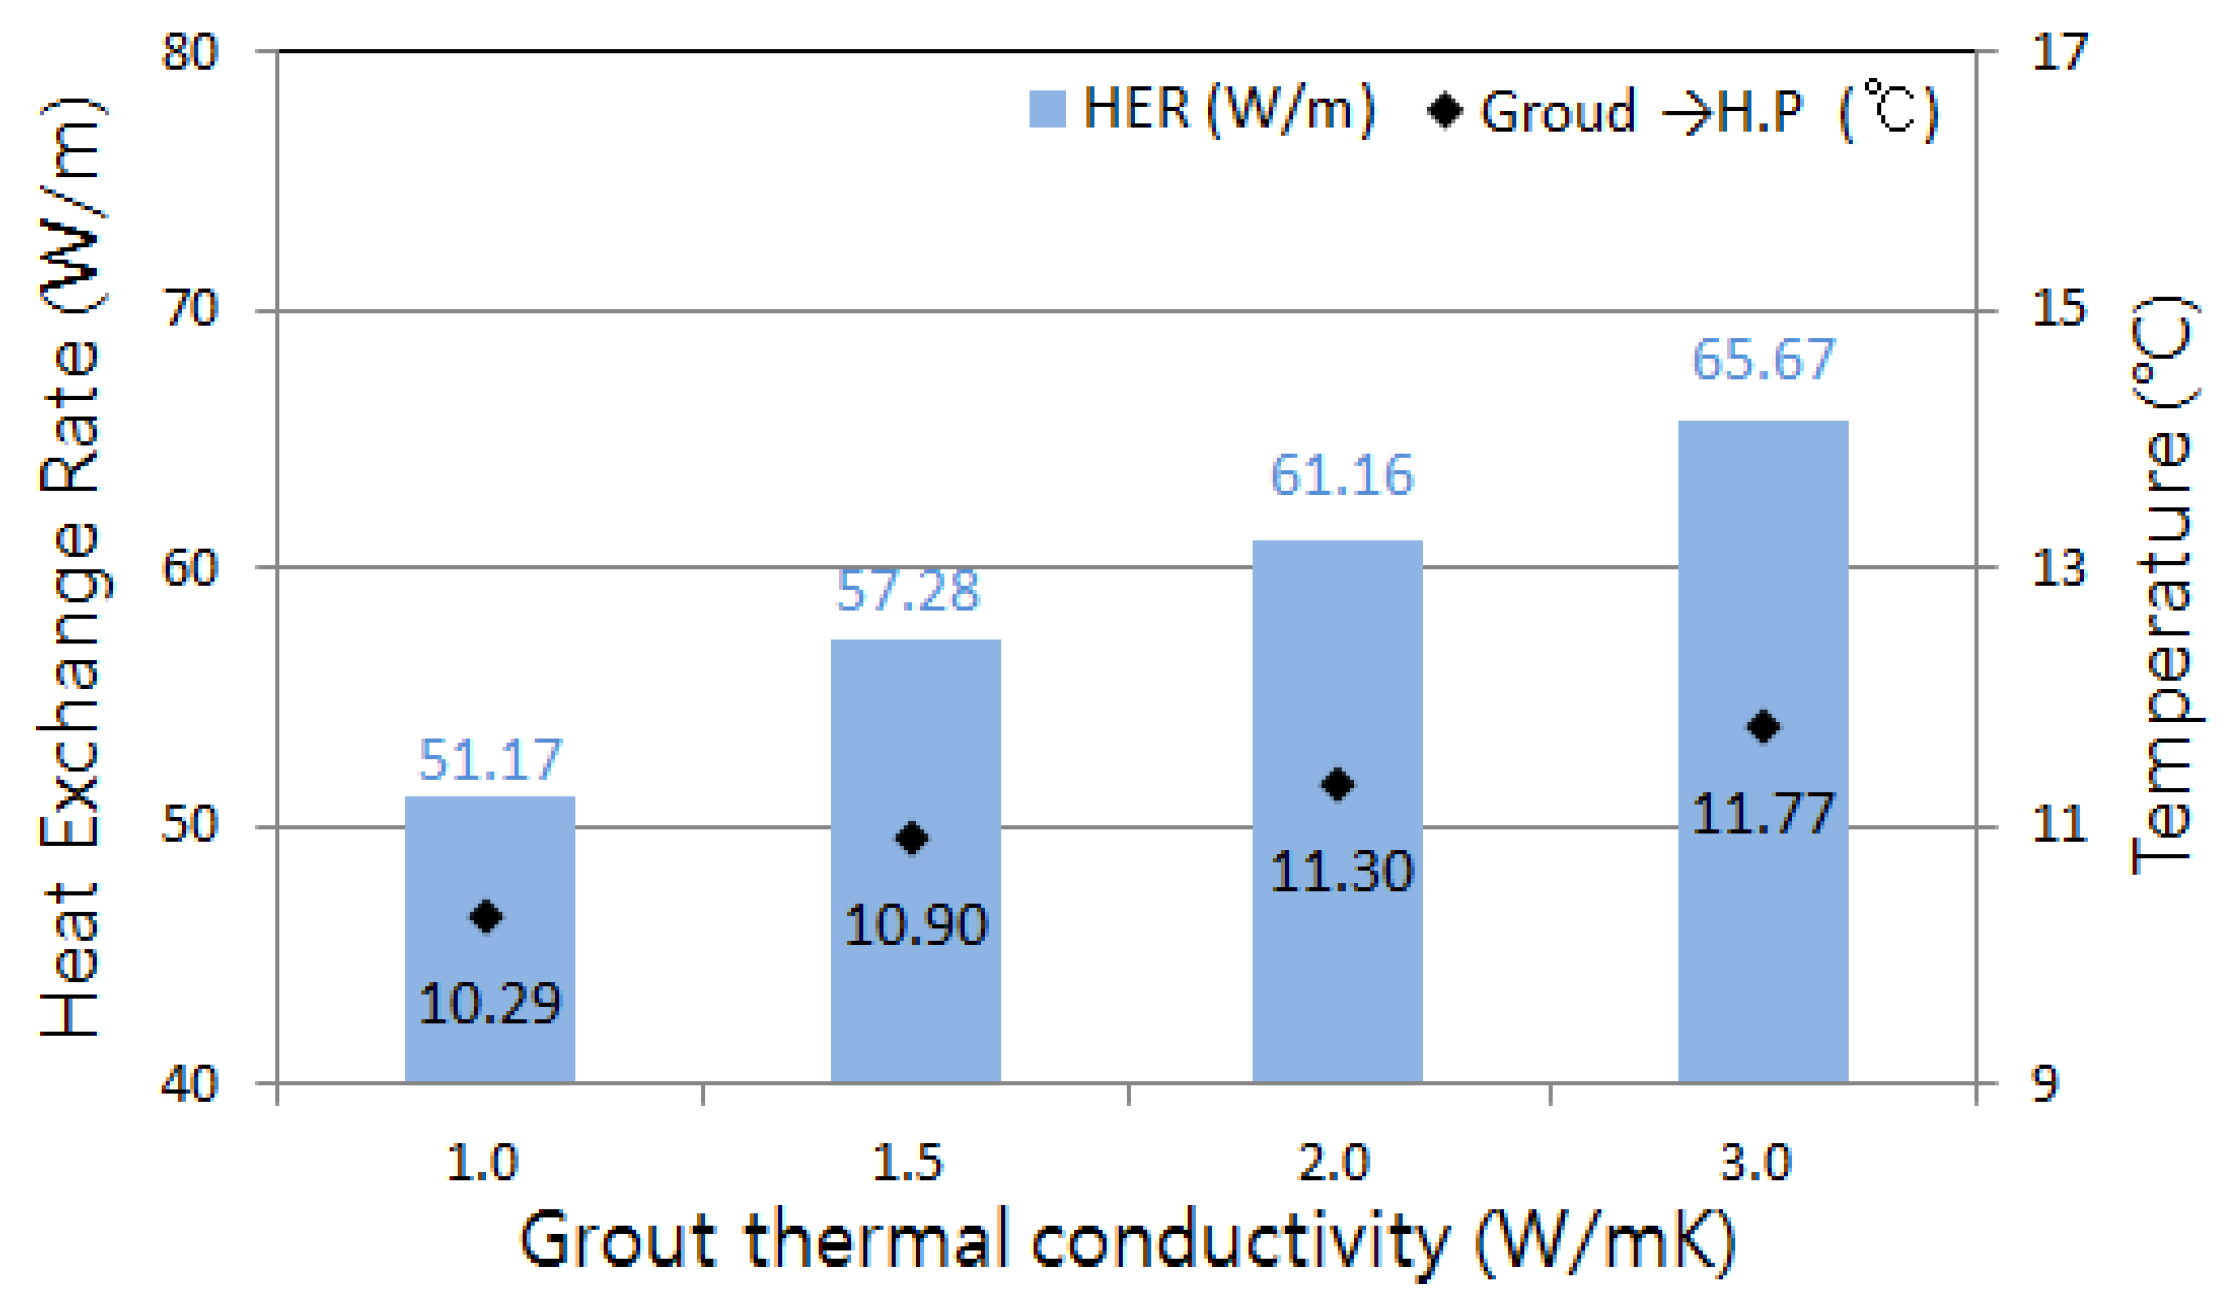
Figure 23. The average outlet temperatures of circulation water calculated at each unit length and heat exchange rate in the heat collection operation are shown in
Figure 24.
The differences in heat storage rate in the respective operations of heat storage among cases appeared to be insignificant. The values of inlet temperatures of each heat exchanger in the cases were calculated as 41.01 °C, 38.32 °C, 36.72 °C, and 35.40 °C, respectively. The inlet temperature of each heat exchanger in the cases appeared to be inversely proportional to the level of grout heat conductivity. However, the heat exchange rate in each case of heat collection was 51.17 W/m, 57.28 W/m, 61.16 W/m, and 65.67 W/m, respectively. And the heat collection performance appeared to be proportional to the level of grout heat conductivity.
Figure 23.
Average of heat storage rate for grout conductivity change (Cases 6 and 12–14).
Figure 23.
Average of heat storage rate for grout conductivity change (Cases 6 and 12–14).
Figure 24.
Average of heat exchange rate for grout conductivity change (Cases 6 and 12–14).
Figure 24.
Average of heat exchange rate for grout conductivity change (Cases 6 and 12–14).
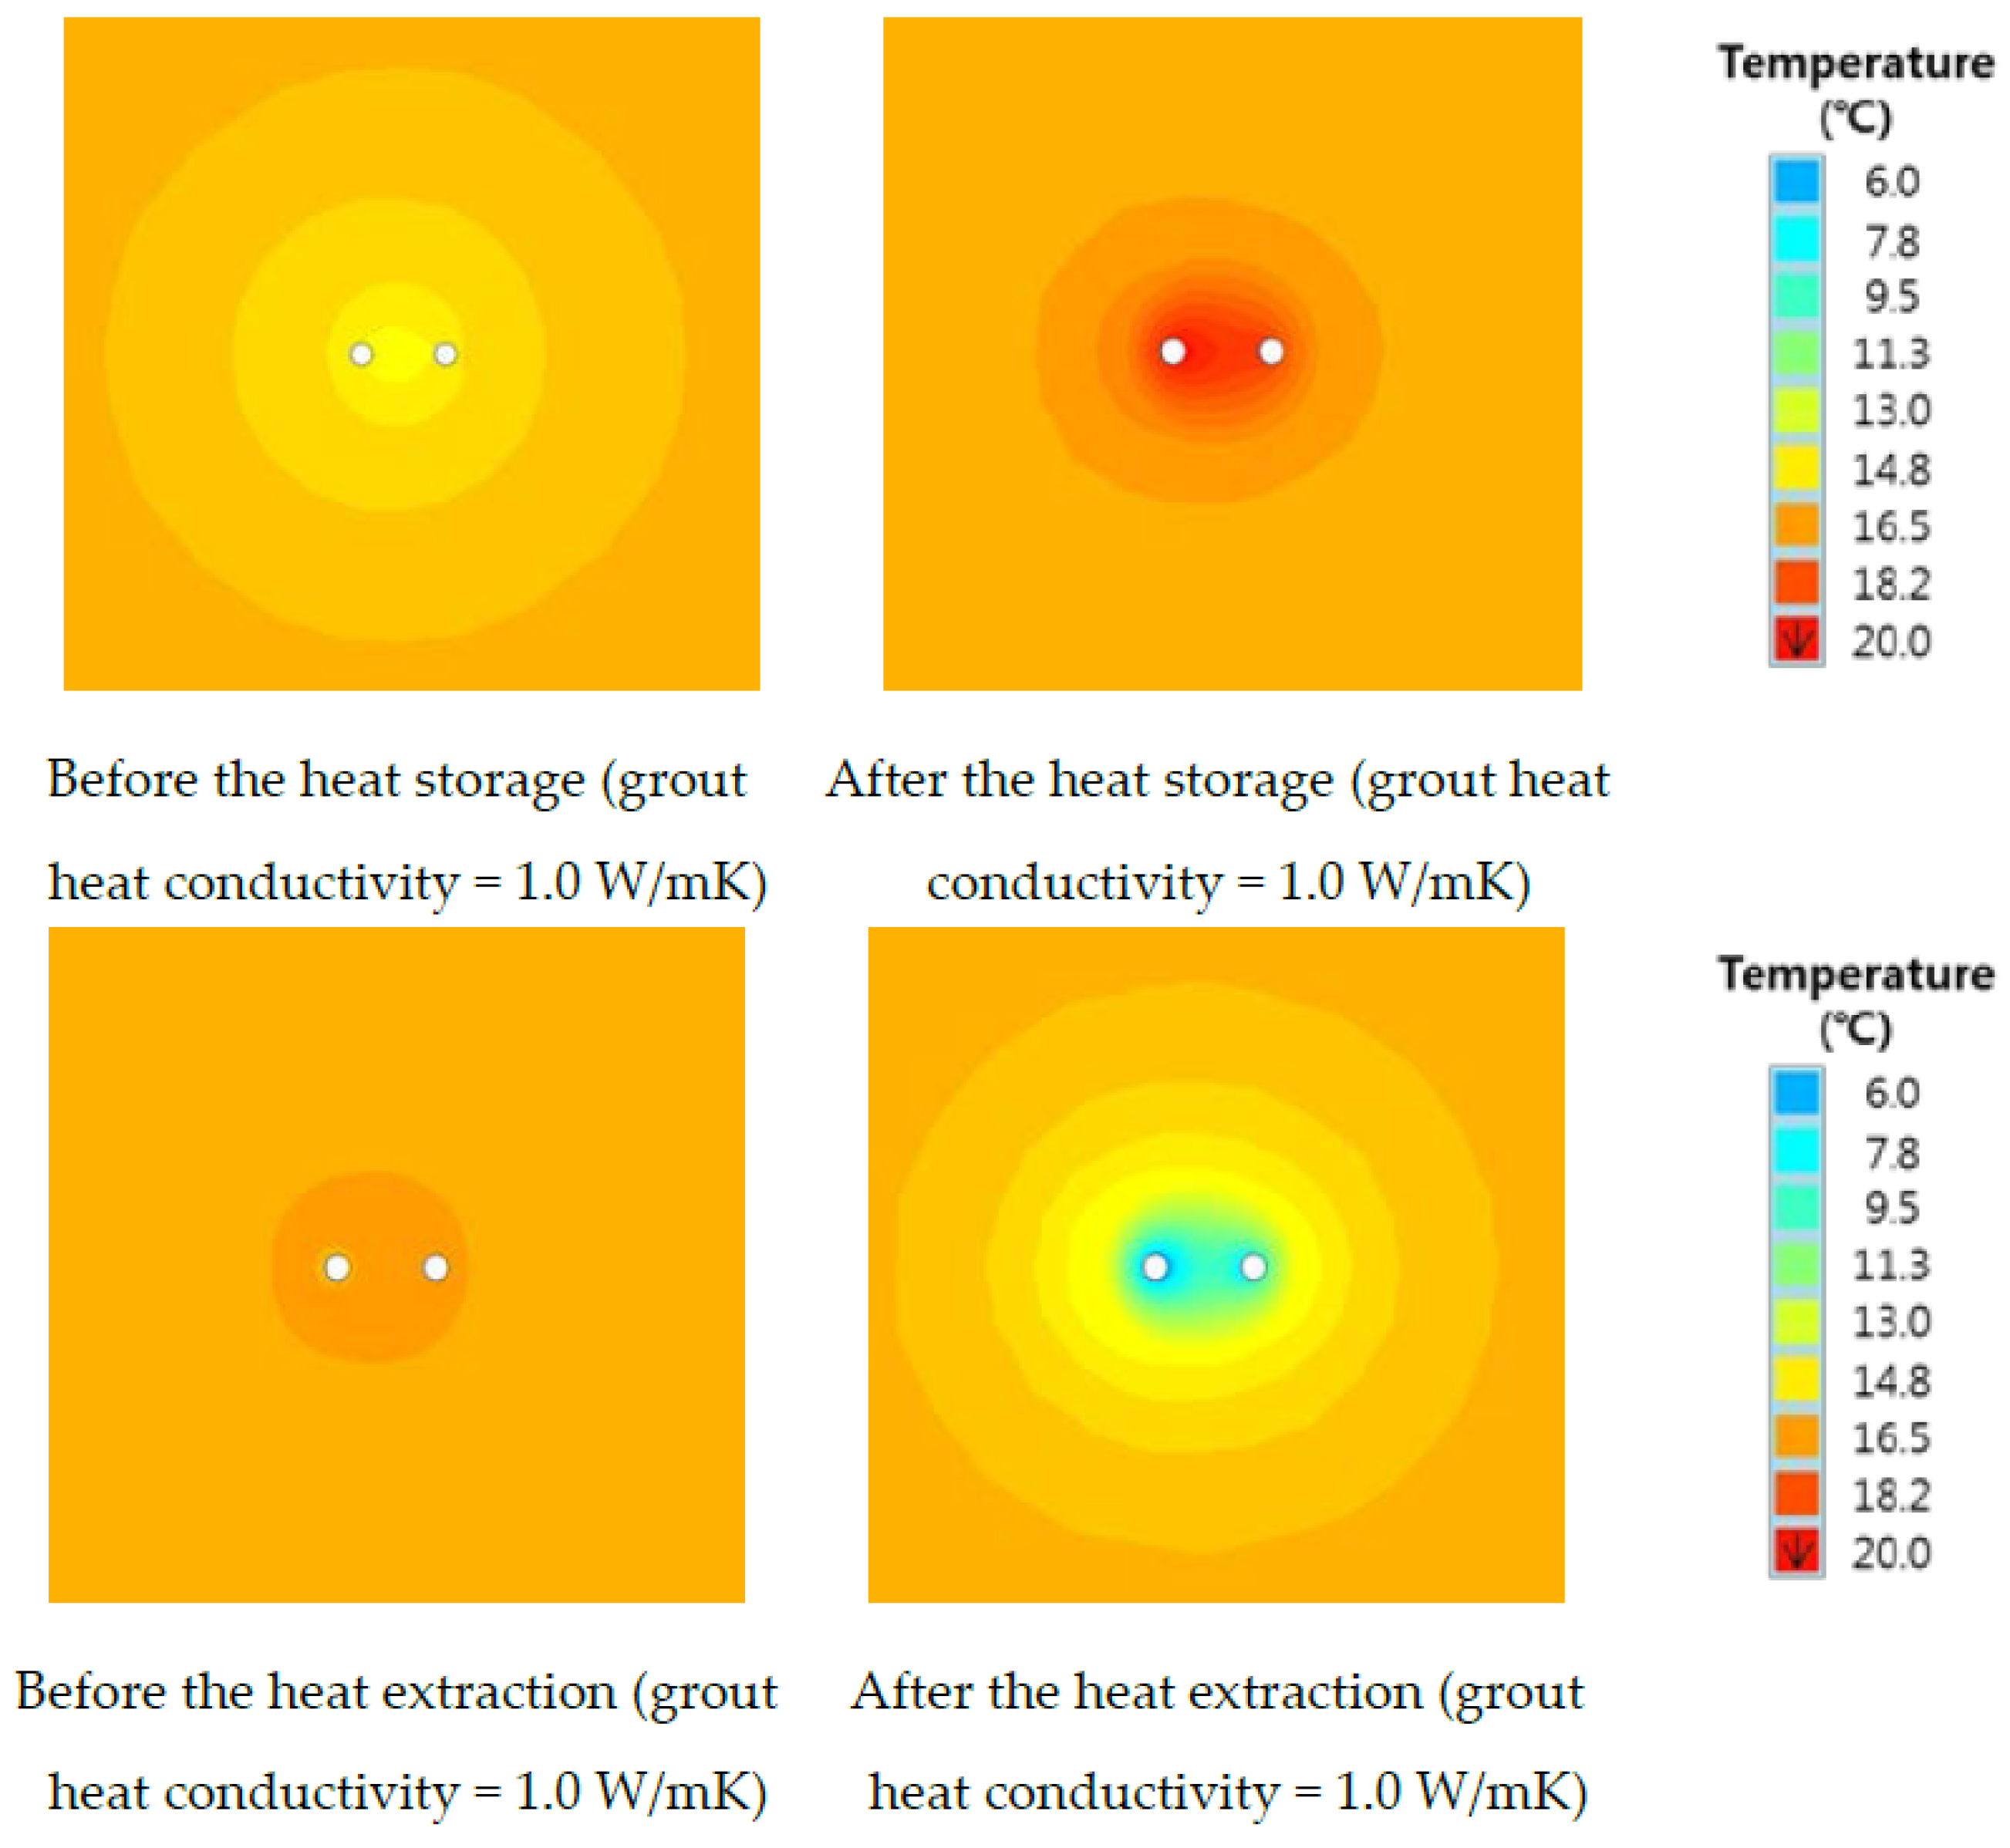
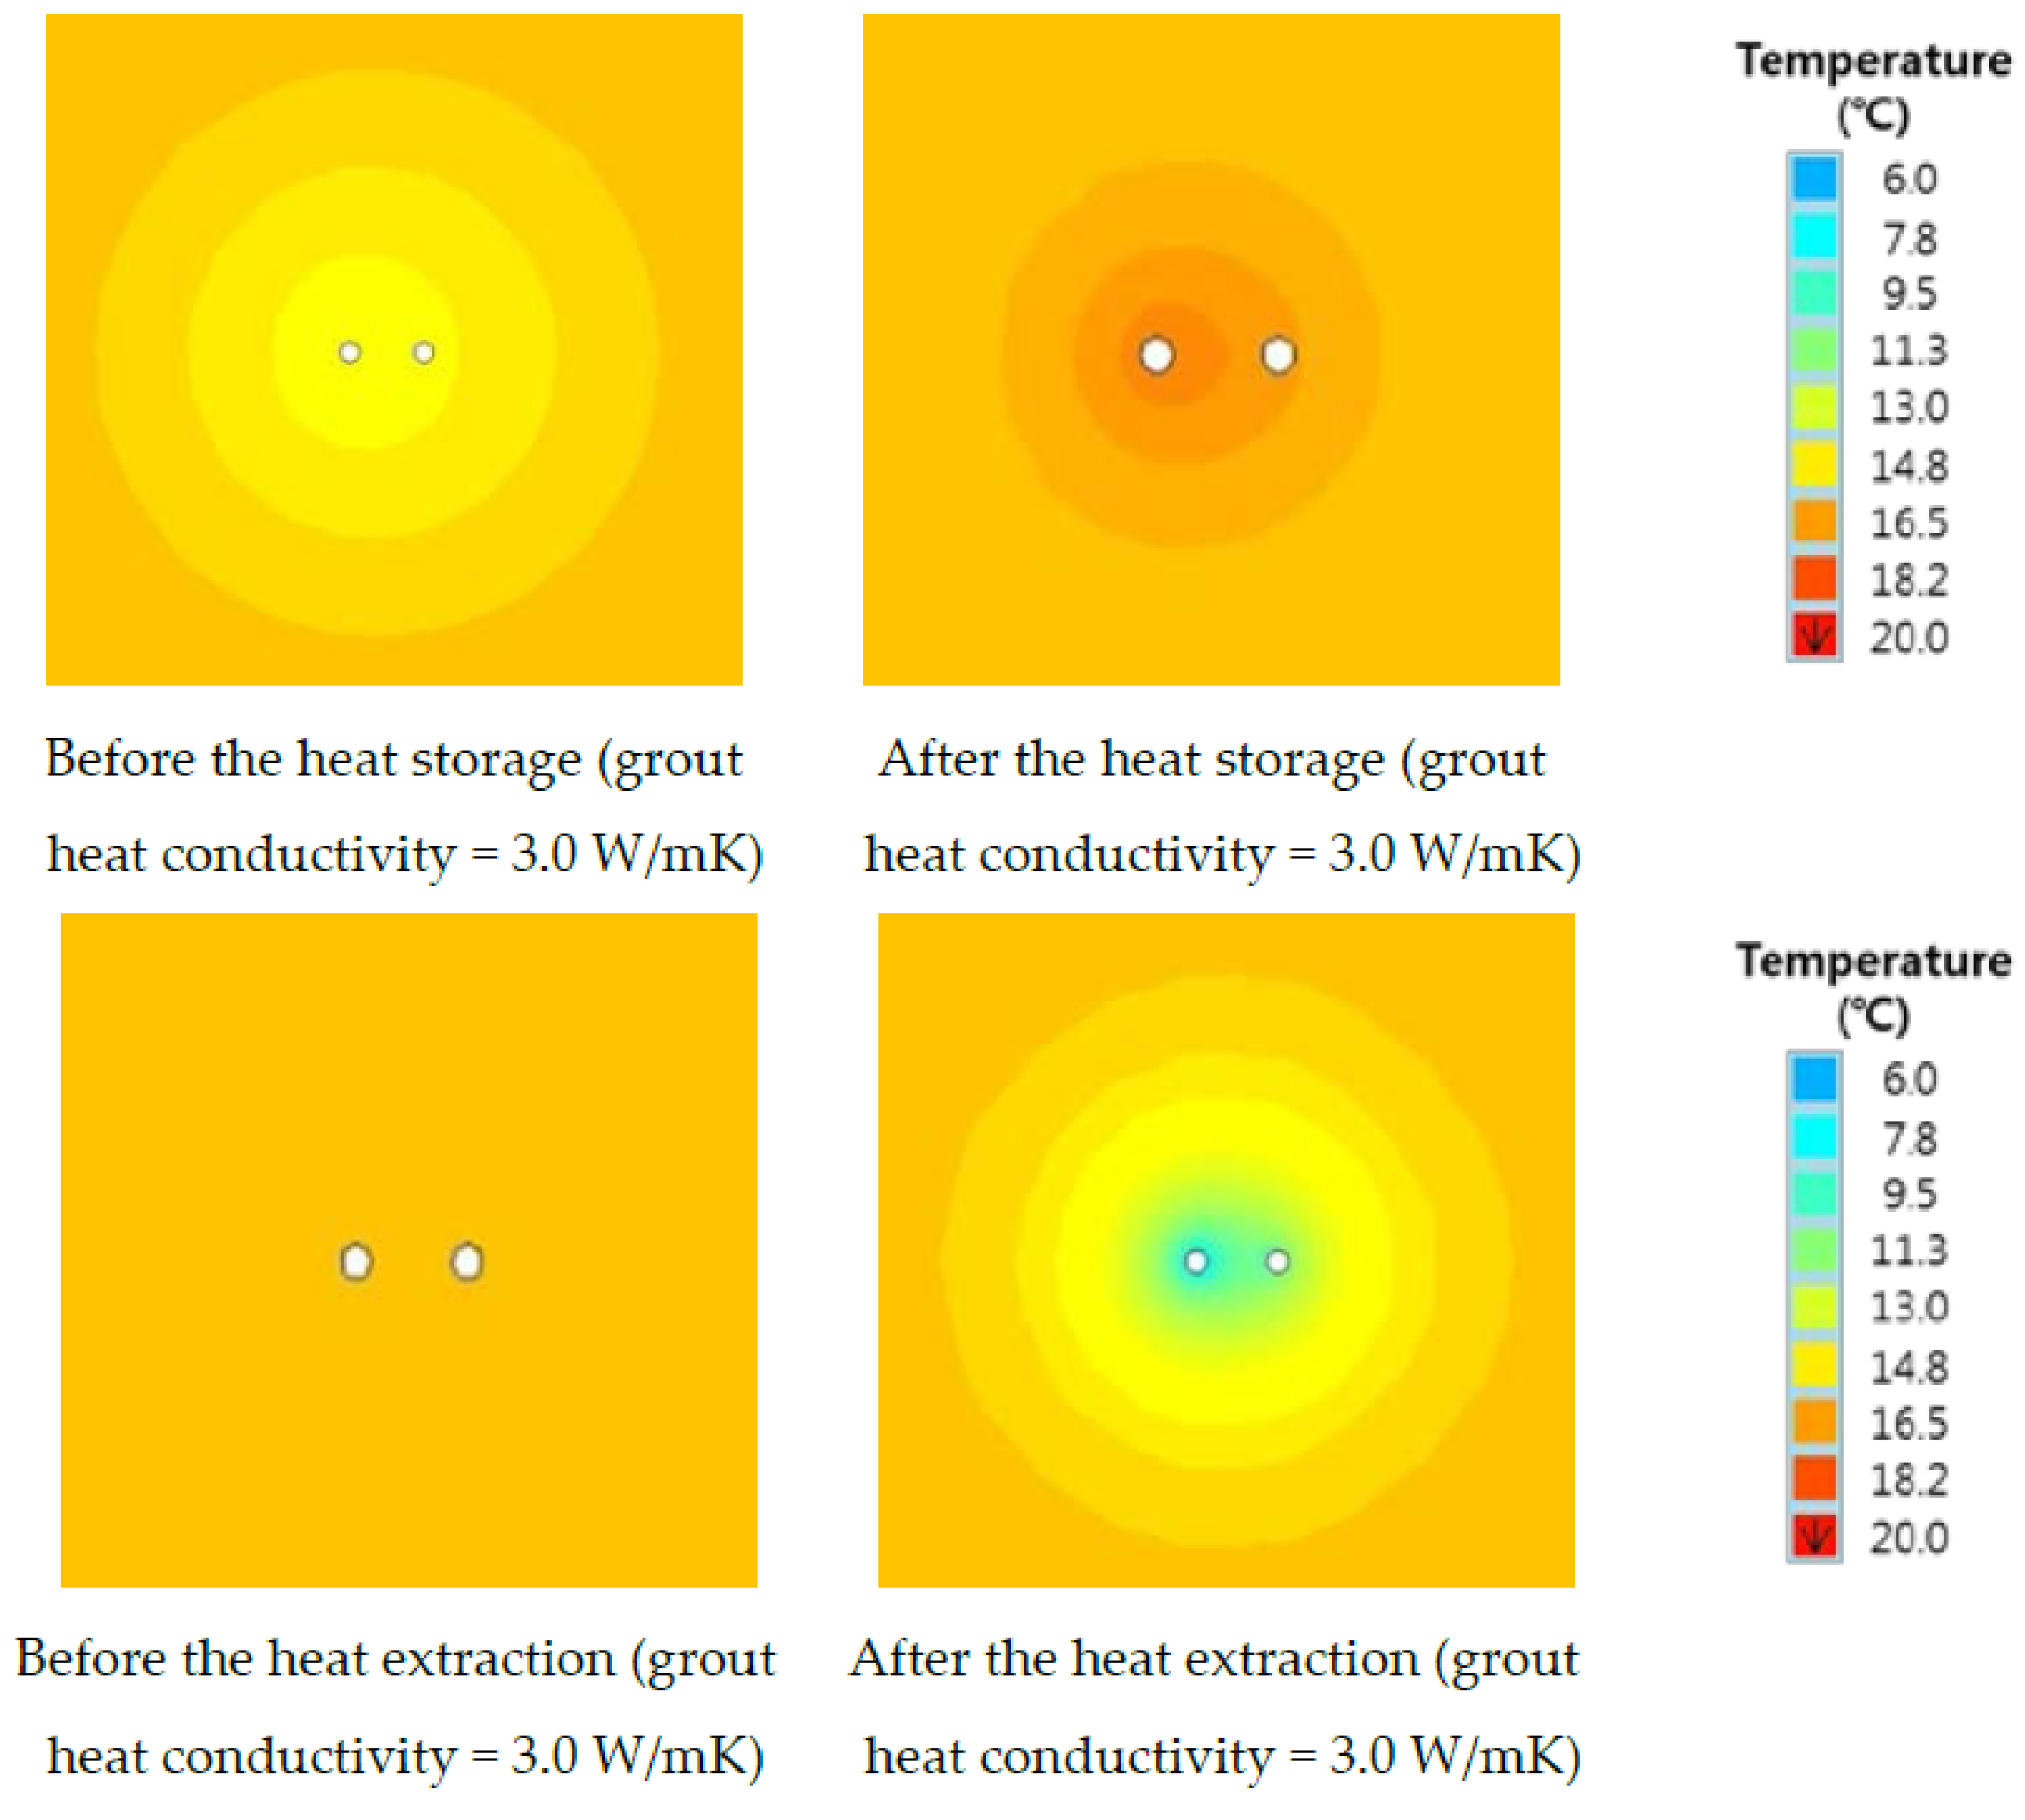
Analytical results of varied conditions of grout heat conductivity at 1.0 W/mK and 3.0 W/mK are shown in
Figure 25 and
Figure 26. Temperature changes around the heat exchanger situated 30 m beneath the ground are presented.
Figure 25.
Temperature distribution around the heat exchanger (Case 12).
Figure 25.
Temperature distribution around the heat exchanger (Case 12).
Figure 26.
Temperature distribution around the heat exchanger (Case 14).
Figure 26.
Temperature distribution around the heat exchanger (Case 14).
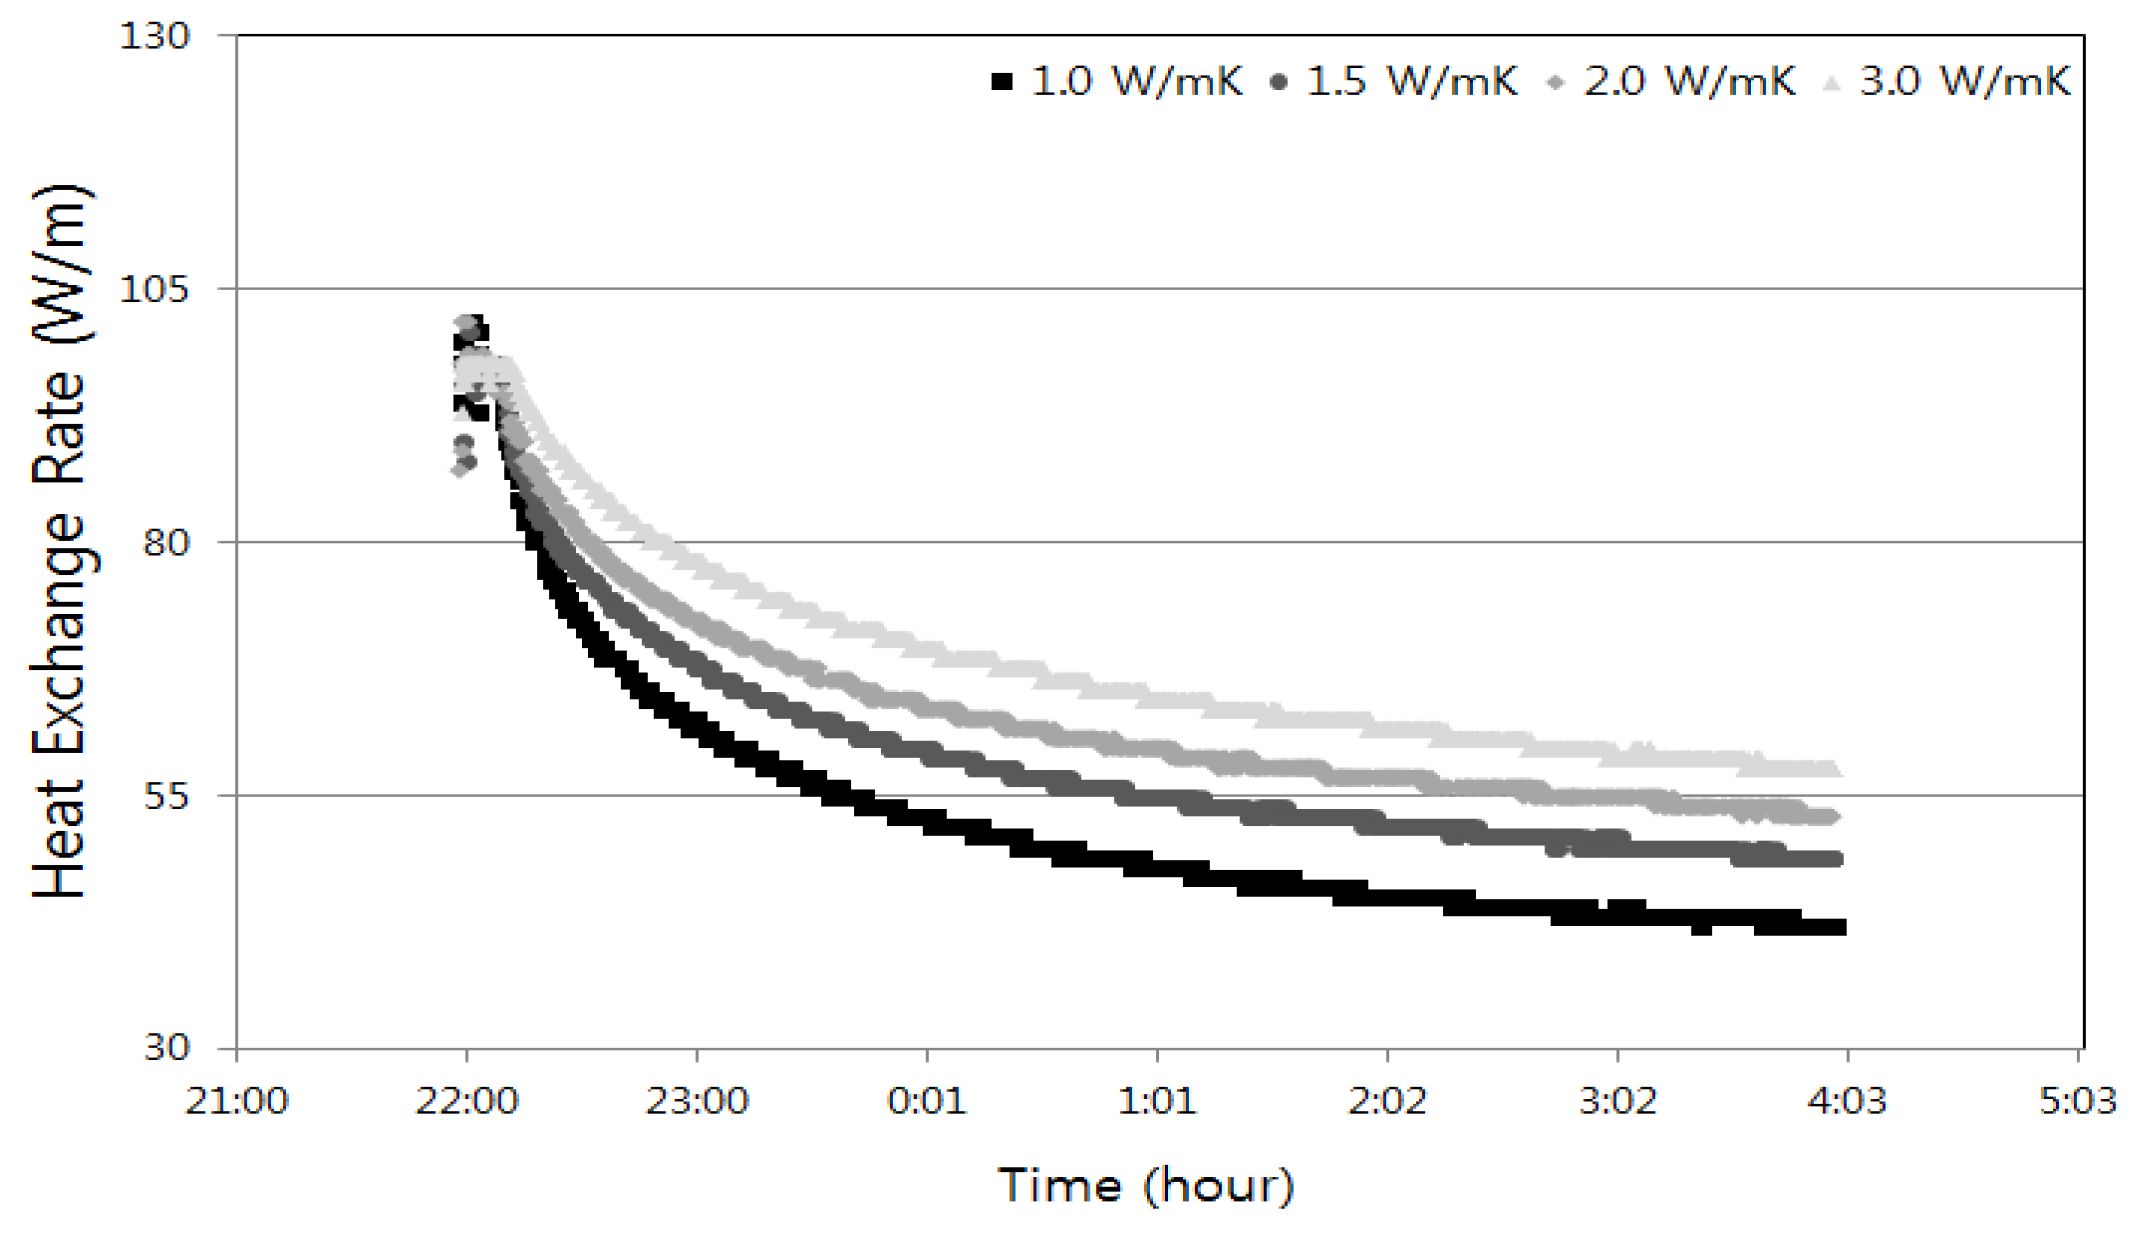
The temperature changes around the heat exchanger calculated right before and after respective operations of heat storage and heat collection for Case 12 (λ
grout = 1.0 W/mK) and Case 14 (λ
grout = 3.0 W/mK) were determined to identify the influence of grout heat conductivity on the performance of heat storage and heat collection. As for Case 12 (λ
grout = 1.0 W/mK), the temperature change right after heat storage influenced the temperature right before heat collection by borehole during heat storage because the low grout heat conductivity caused comparatively higher temperature around the borehole than that for Case 14 (λ
grout = 3.0 W/mK). This was in consistent with our assumption at the beginning of the simulation that an excellent heat collection performance would be facilitated by heat stored in the borehole with low grout heat conductivity. However, the result obtained from heat collection performance analysis during heat collection revealed the higher level of heat collection performance was proportional to the level of grout heat conductivity, with a maximum difference at about 28%. Contrary to the initial expectation, grout heat conductivity influenced heat collection with higher heat collection performance during the early stages of heat collection. However, it also manifested the decrease in efficiency in collecting peripheral heat, resulting in a rapid decrease in efficiency with time.
Figure 27 indicates the heat exchange rate with time of the base case (Case 6).
Figure 27.
Fluctuation of heat exchange rate (Cases 12 and 14).
Figure 27.
Fluctuation of heat exchange rate (Cases 12 and 14).


