
Critical Clearing Time and Wind Power in Small Isolated Power Systems Considering Inertia Emulation

Abstract
:
1. Introduction
- (1)
- loss of system stability;
- (2)
- an unacceptable value of load shedding;
- (3)
- unacceptable parameters values in the subsequent steady state.
2. Methodology
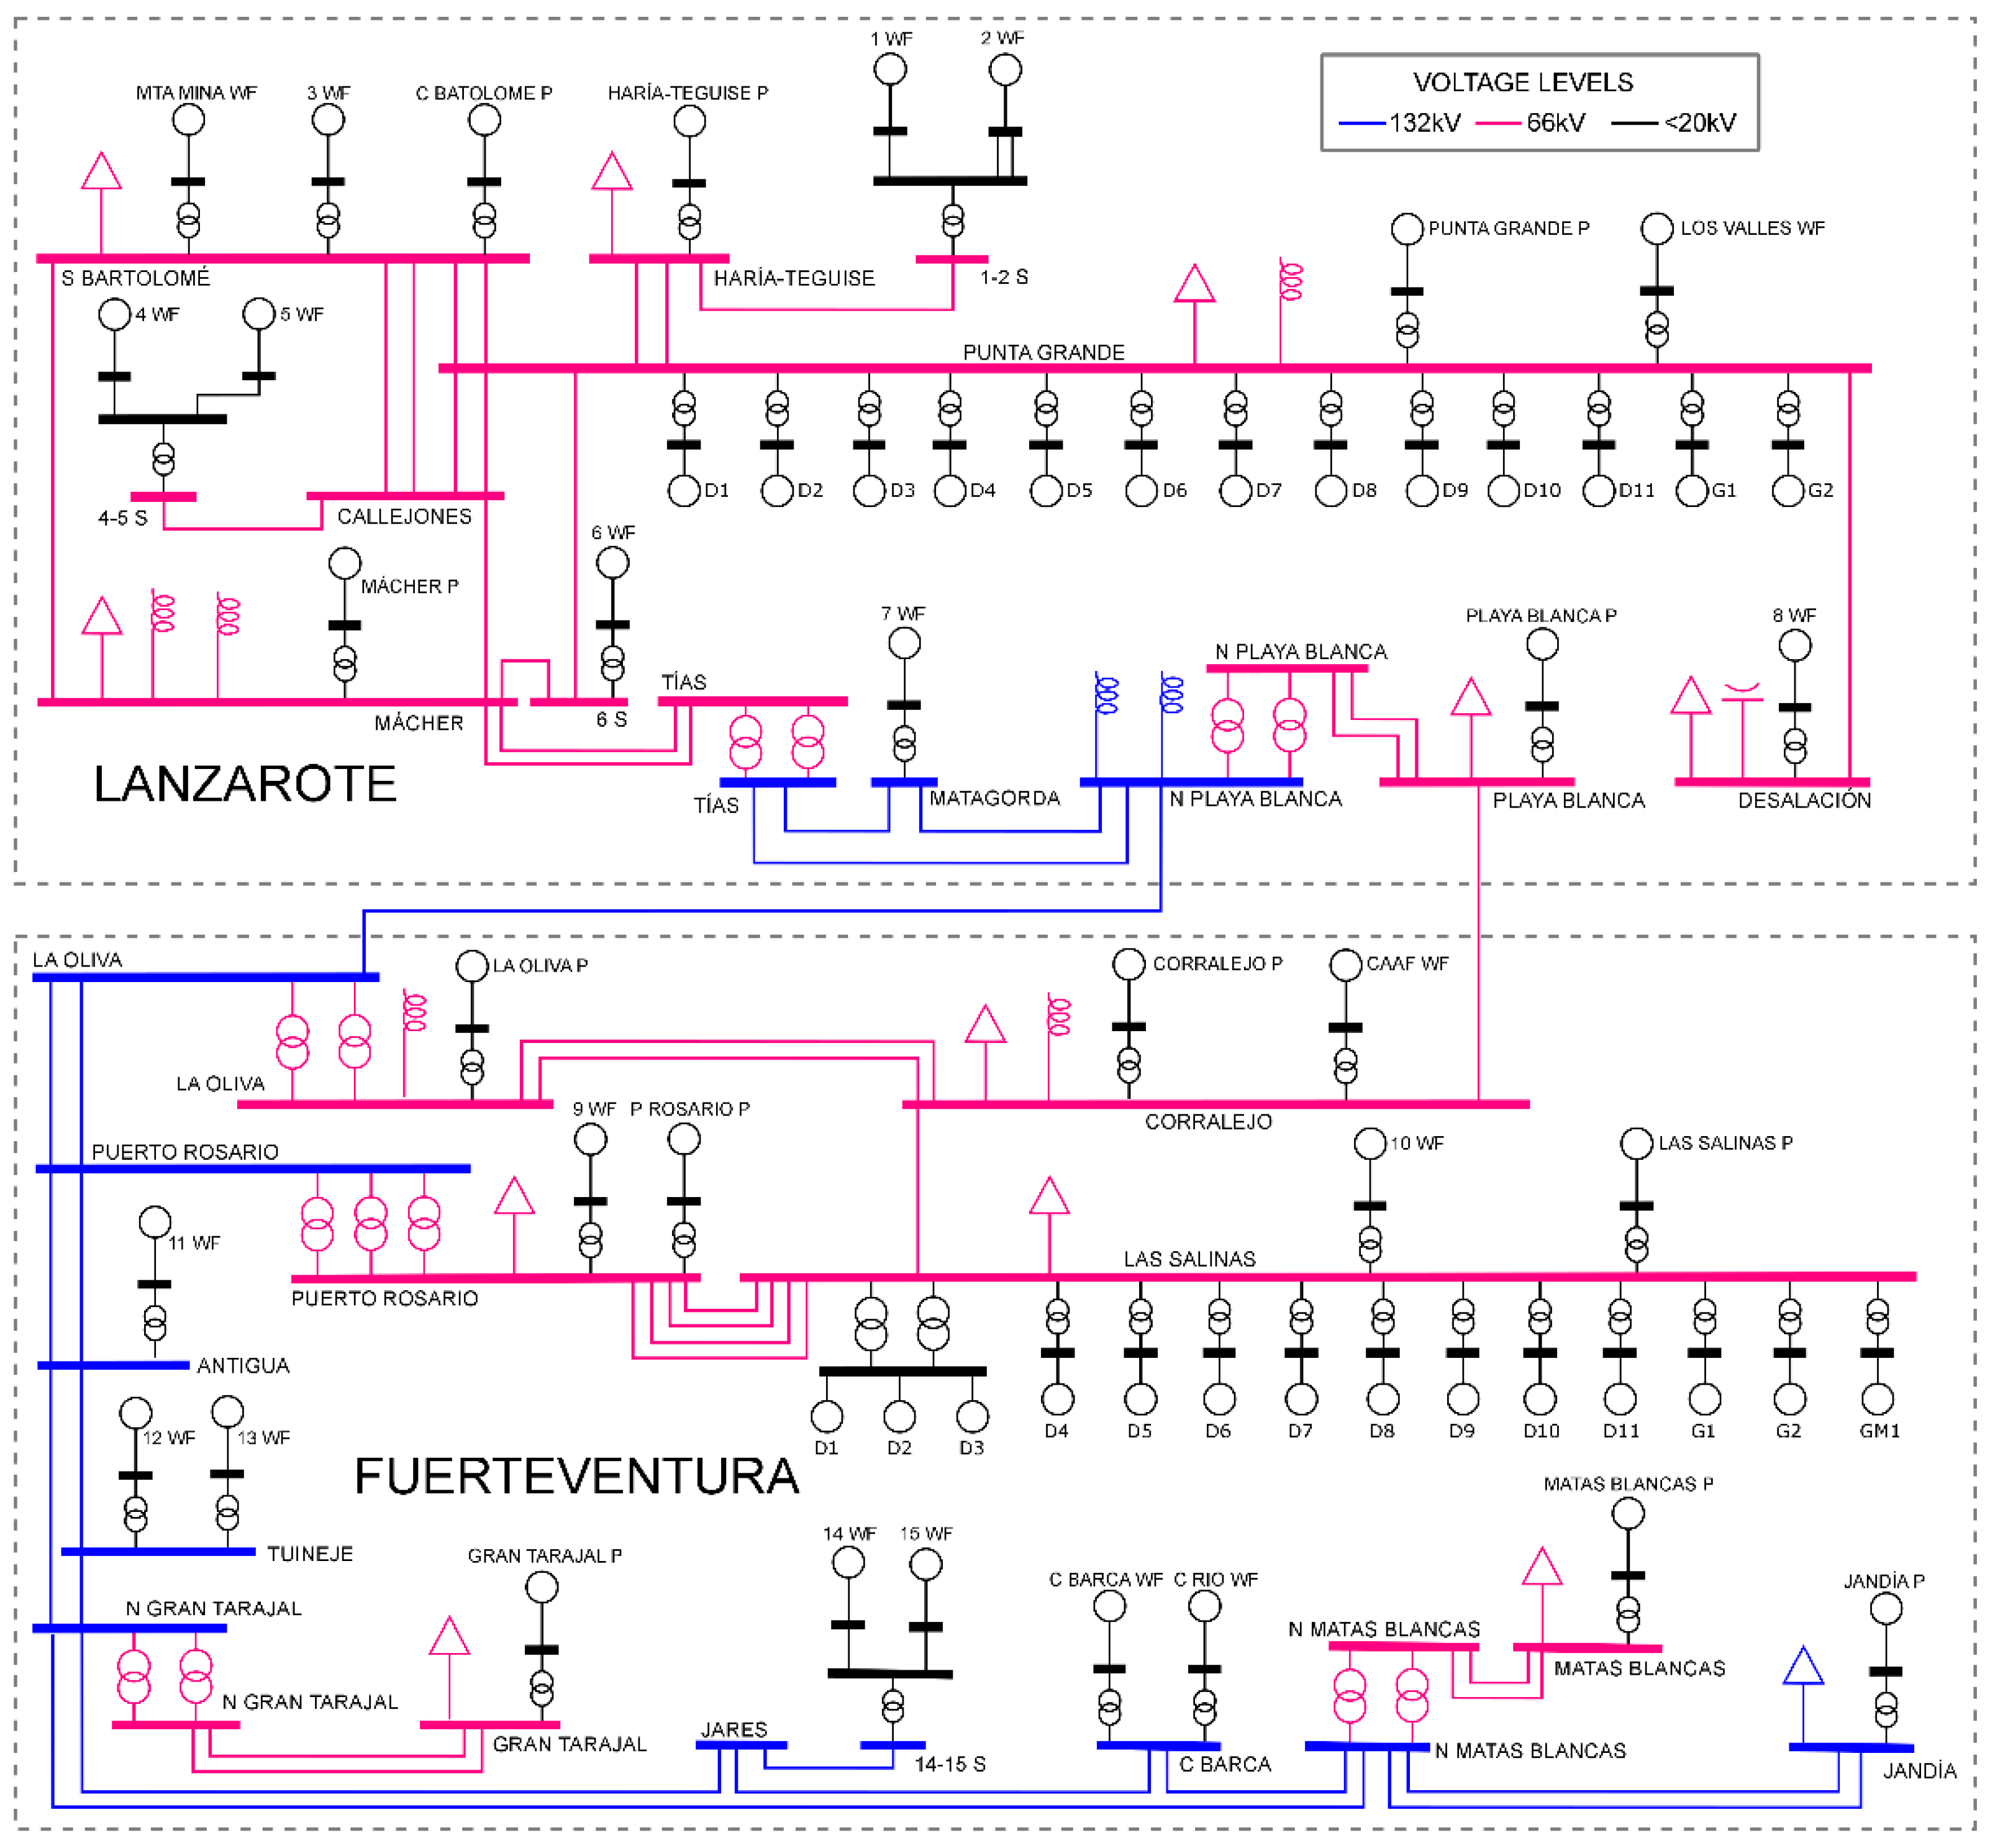
3. Description of the Studied Power System

| Punta Grande unit name | Capacity (MVA) | Las Salinas unit name | Capacity (MVA) |
|---|---|---|---|
| Diesel 1 | 9.4 | Diesel 1 | 5.4 |
| Diesel 2 | 9.4 | Diesel 2 | 5.4 |
| Diesel 3 | 9.4 | Diesel 3 | 6.3 |
| Diesel 4 | 20 | Diesel 4 | 9.4 |
| Diesel 5 | 20 | Diesel 5 | 9.4 |
| Diesel 6 | 30 | Diesel 6 | 30 |
| Diesel 7 | 22.5 | Diesel 7 | 18 |
| Diesel 8 | 22.5 | Diesel 8 | 18 |
| Diesel 9 | 22.5 | Diesel 9 | 18 |
| Diesel 10 | 22.5 | Gas 1 | 32.42 |
| Diesel 11 | 22.5 | Gas 2 | 40.93 |
| Gas 1 | 27.24 | Gas Mobile 1 | 15 |
| Gas 2 | 40.93 | - | - |
4. System Modeling

4.1. Conventional Generation
4.2. Wind Conversion Energy System
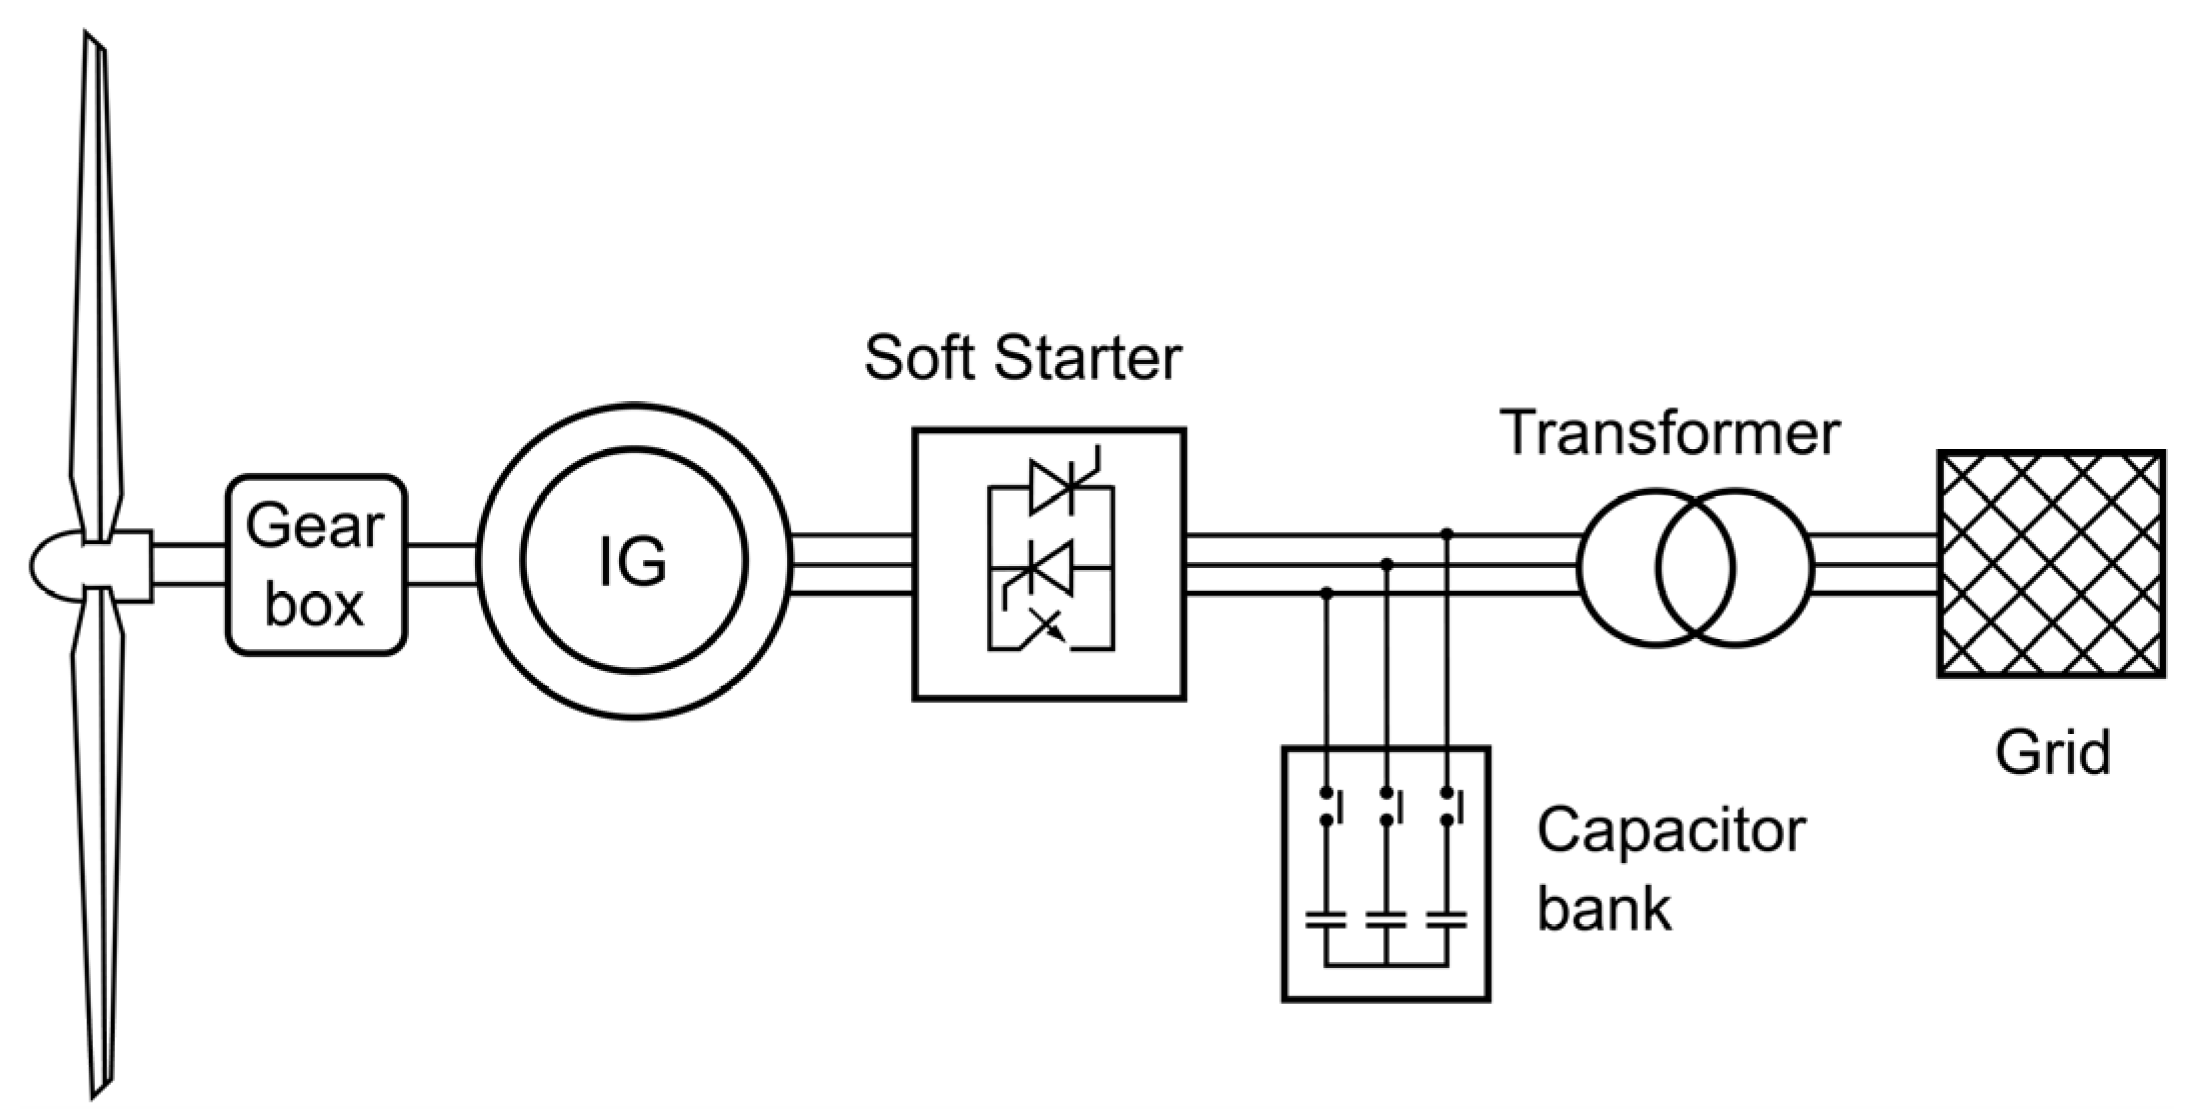
4.2.1. Squirrel Cage Induction Generator (SCIG) Wind Turbine

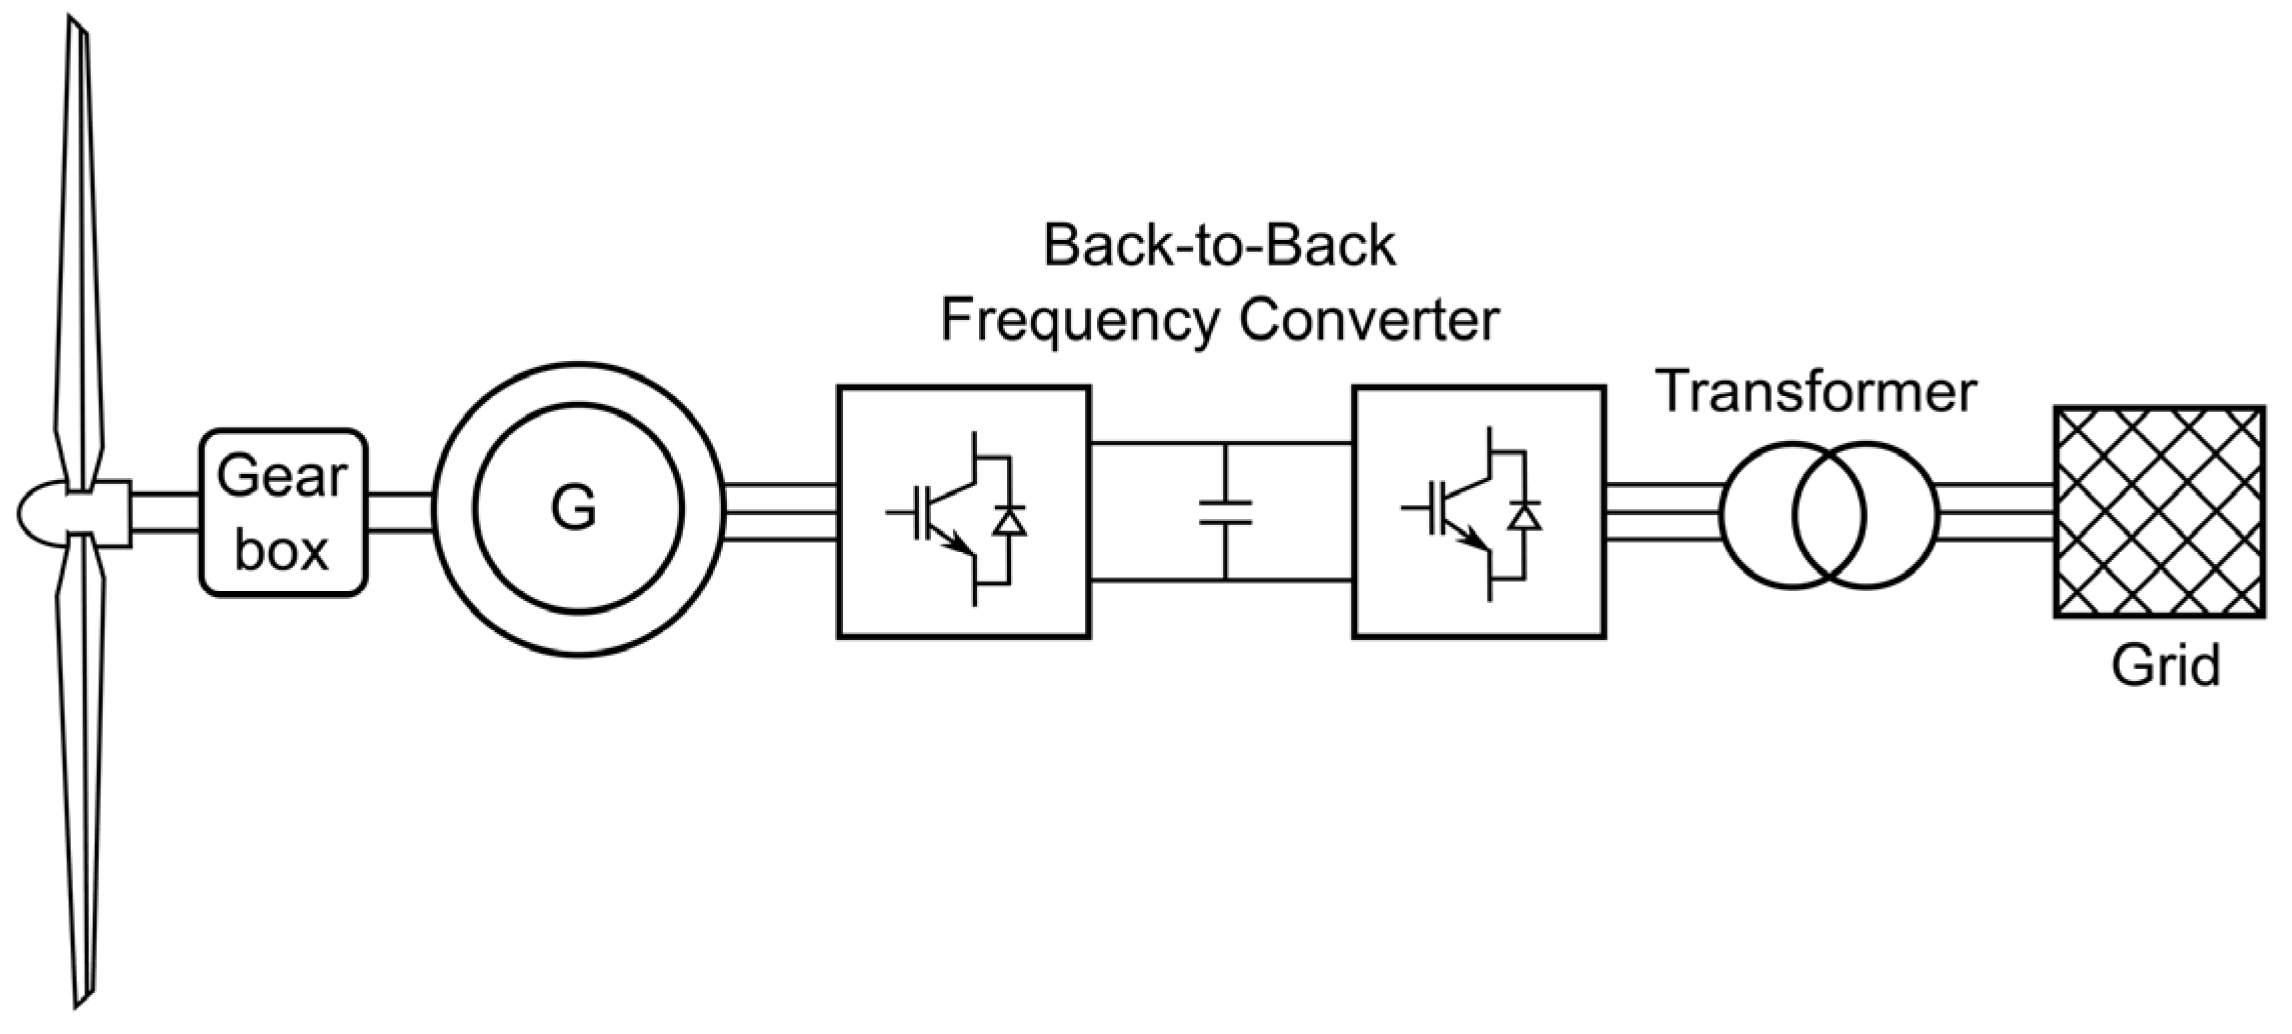
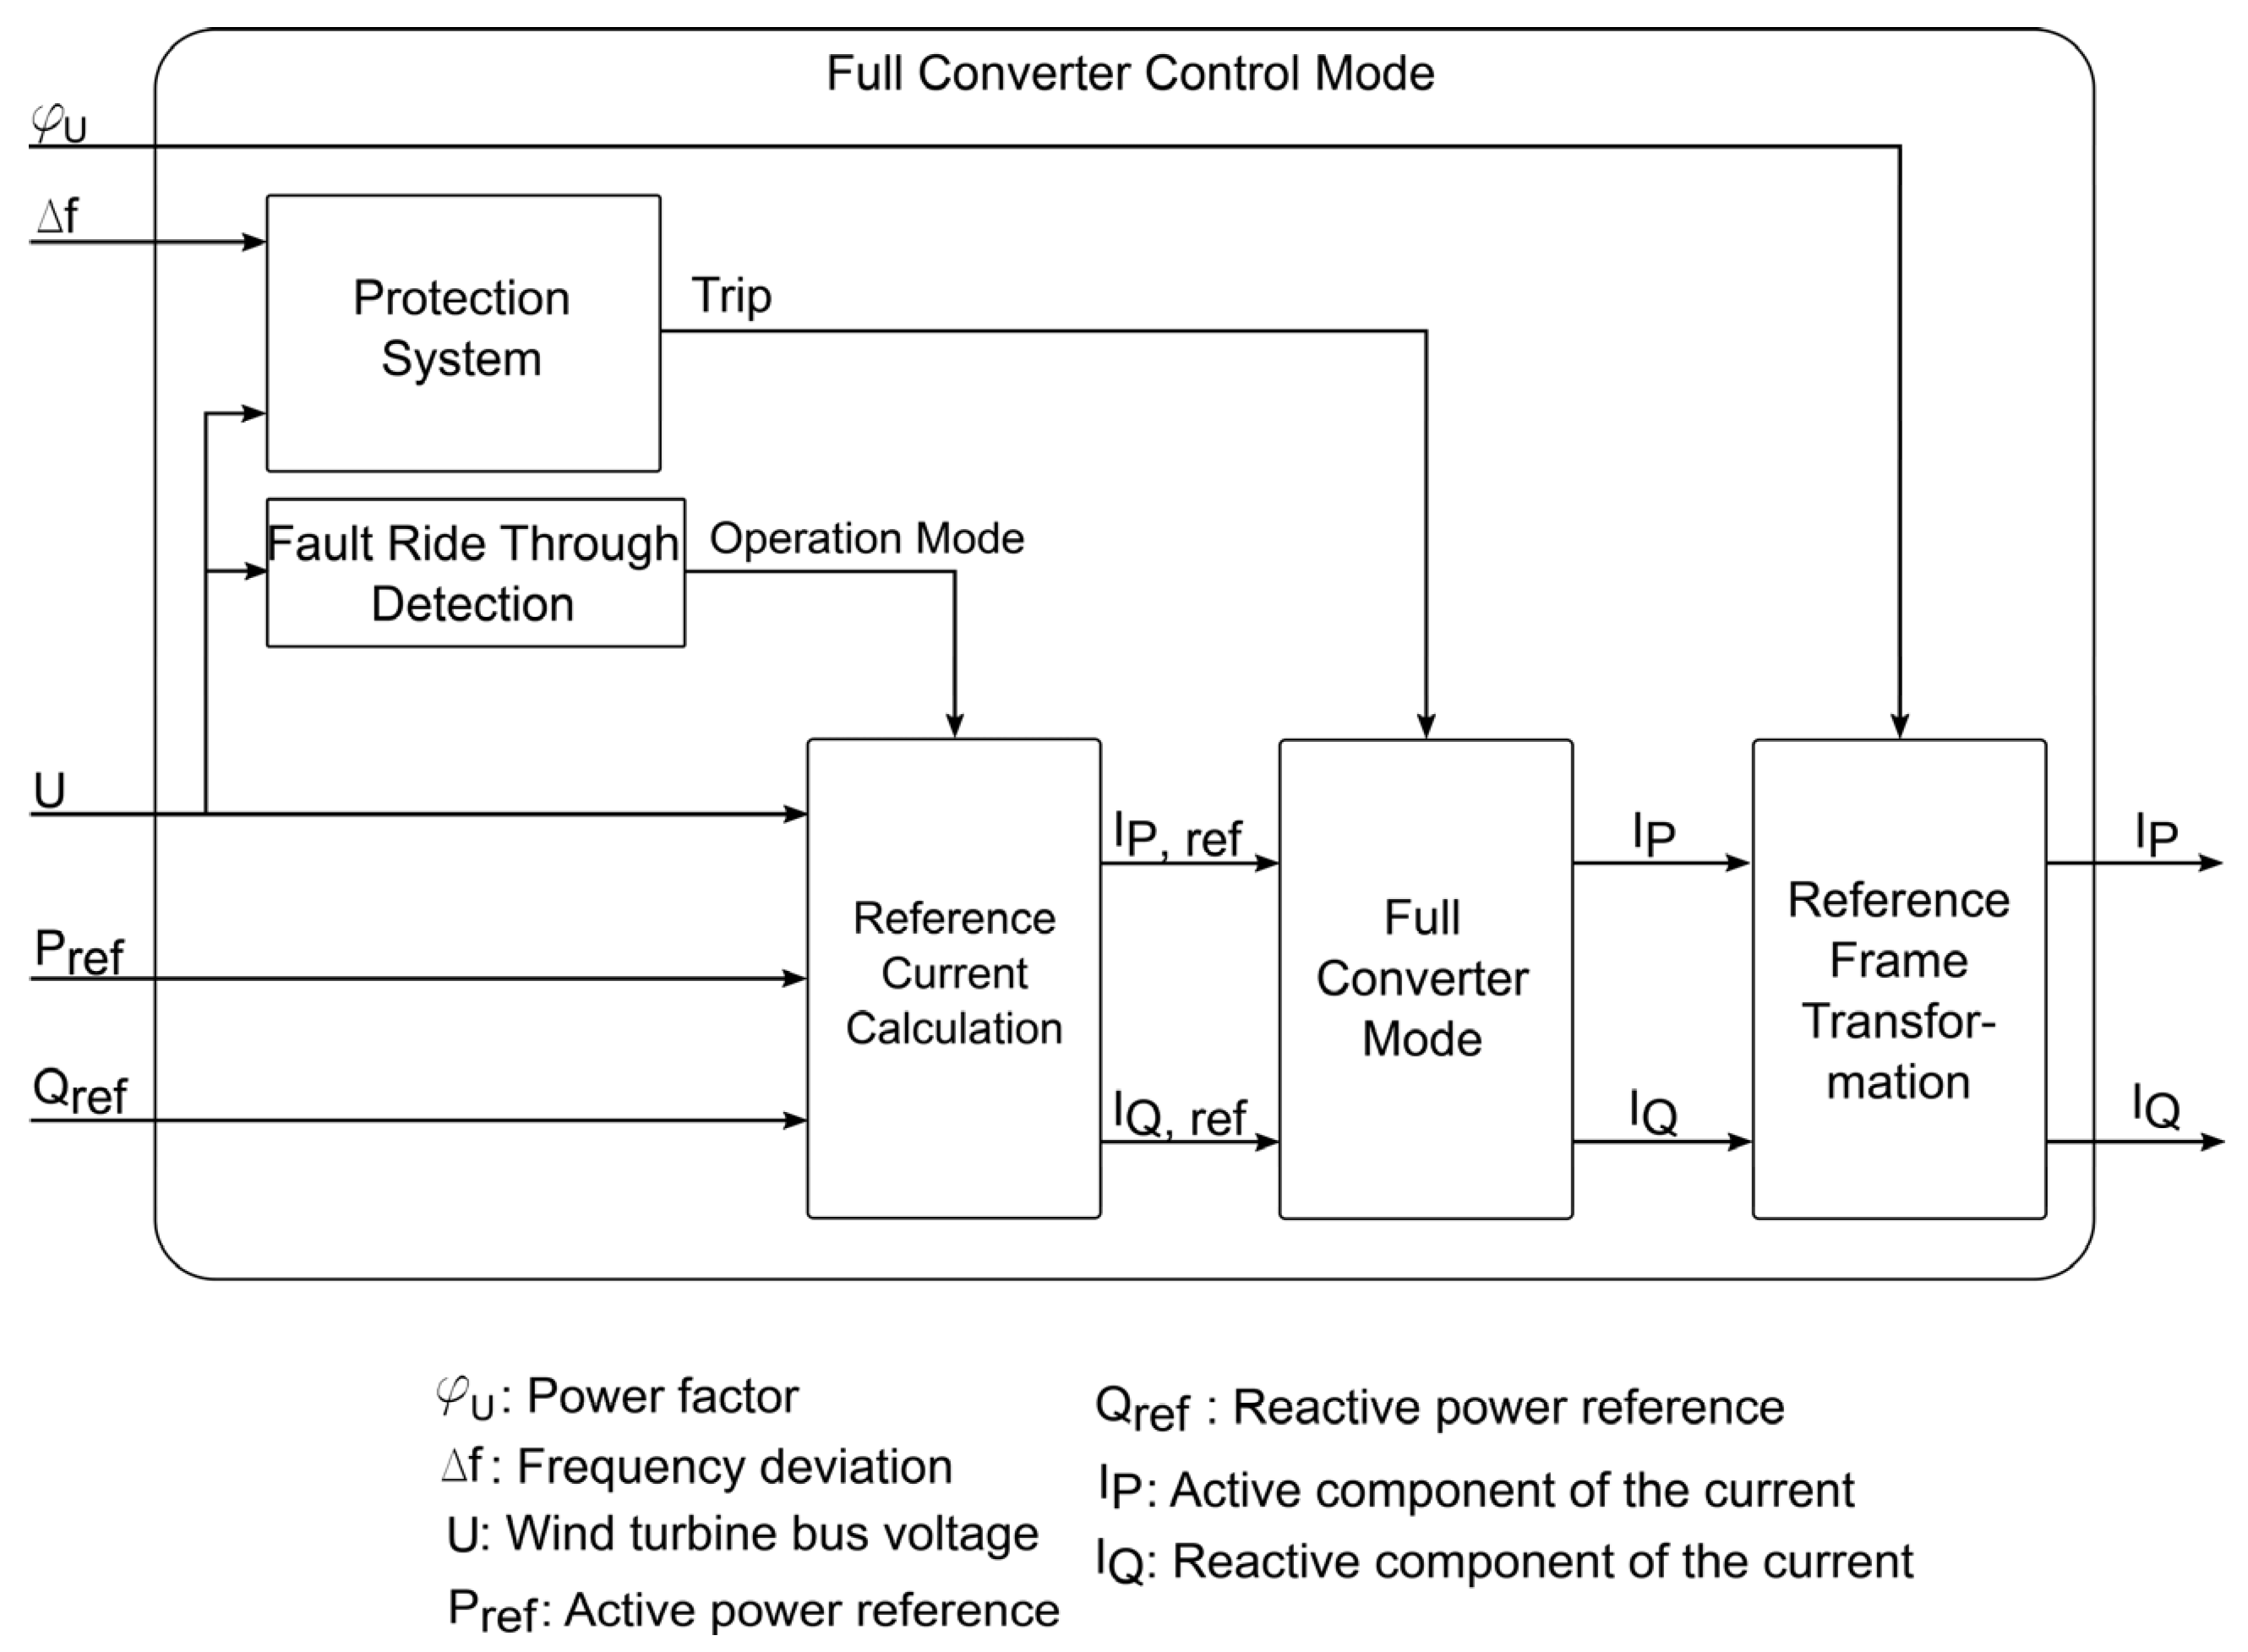
4.2.2. Full Converter Wind Turbine


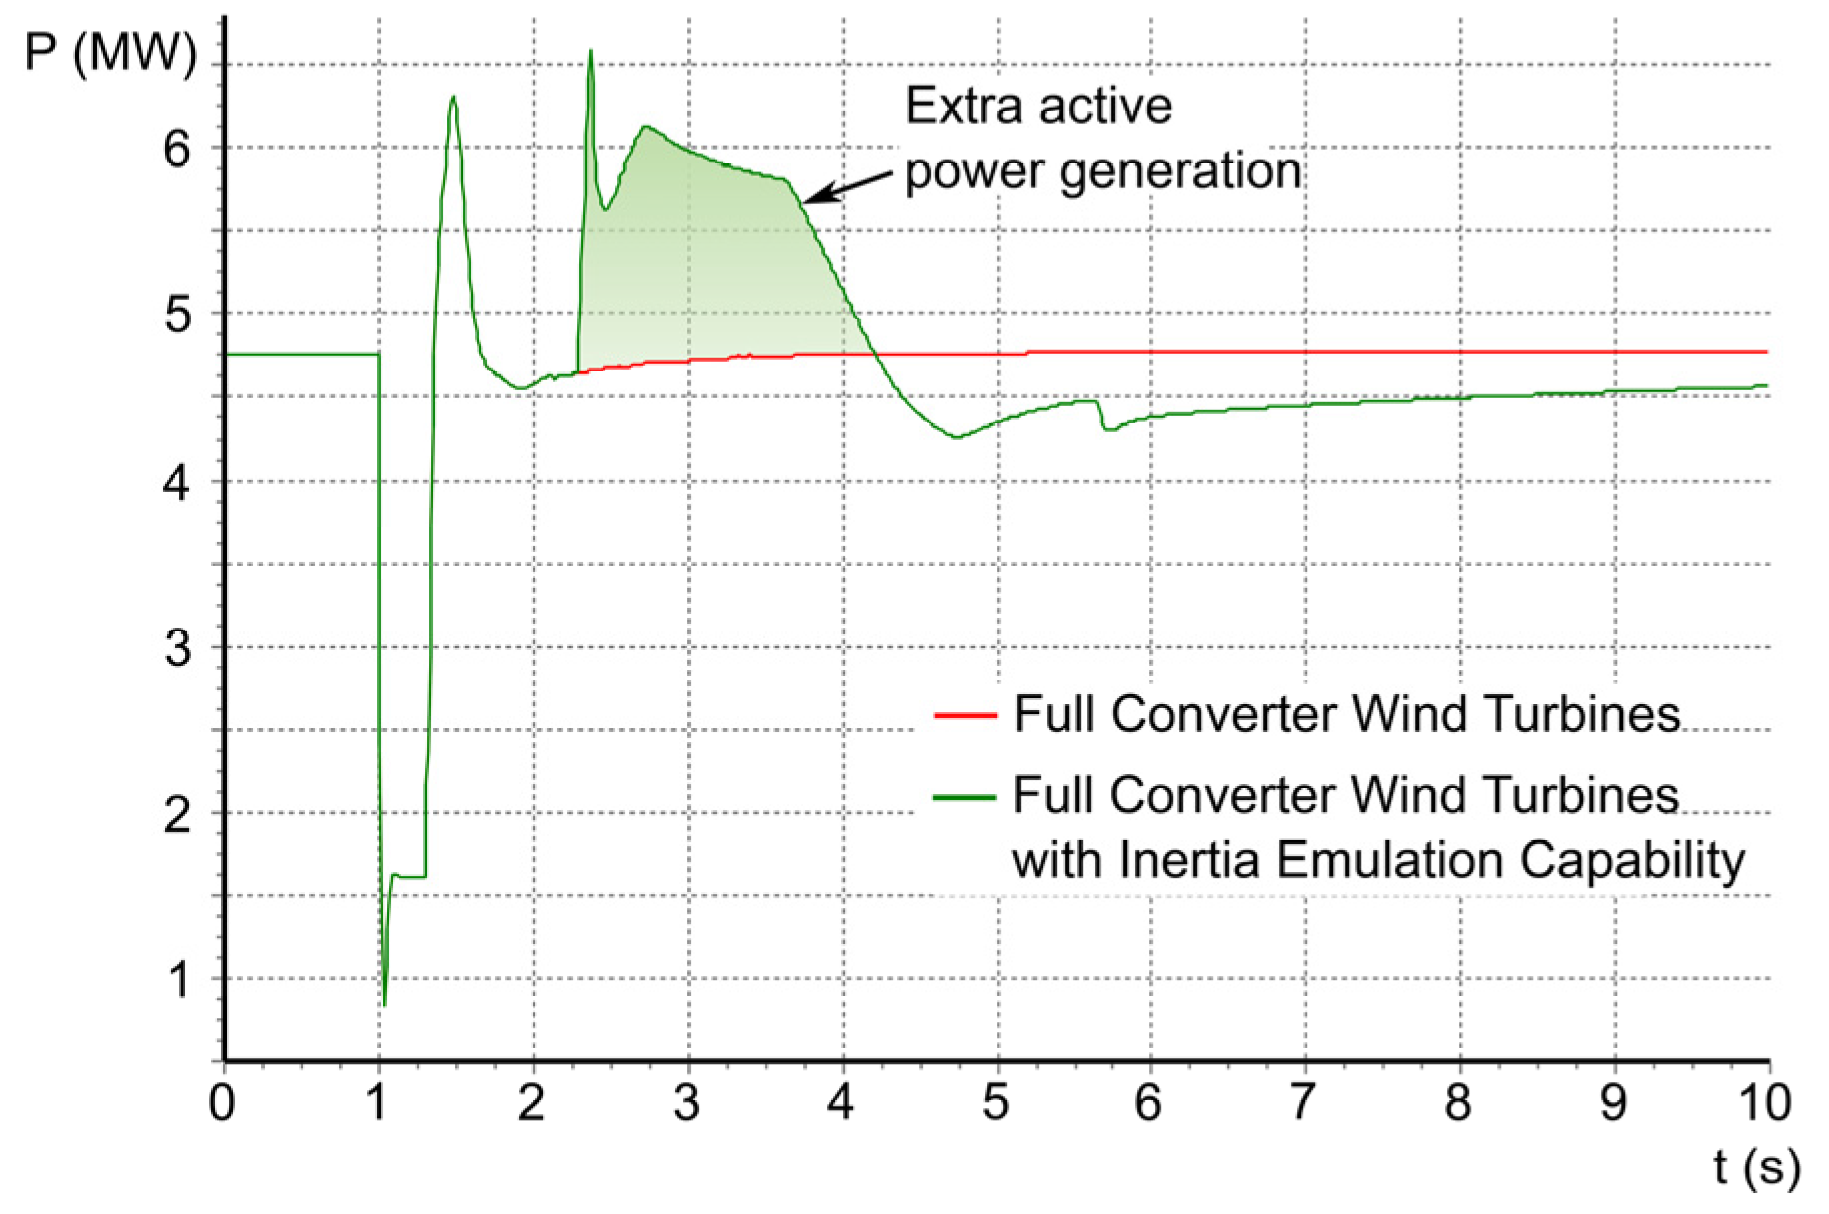
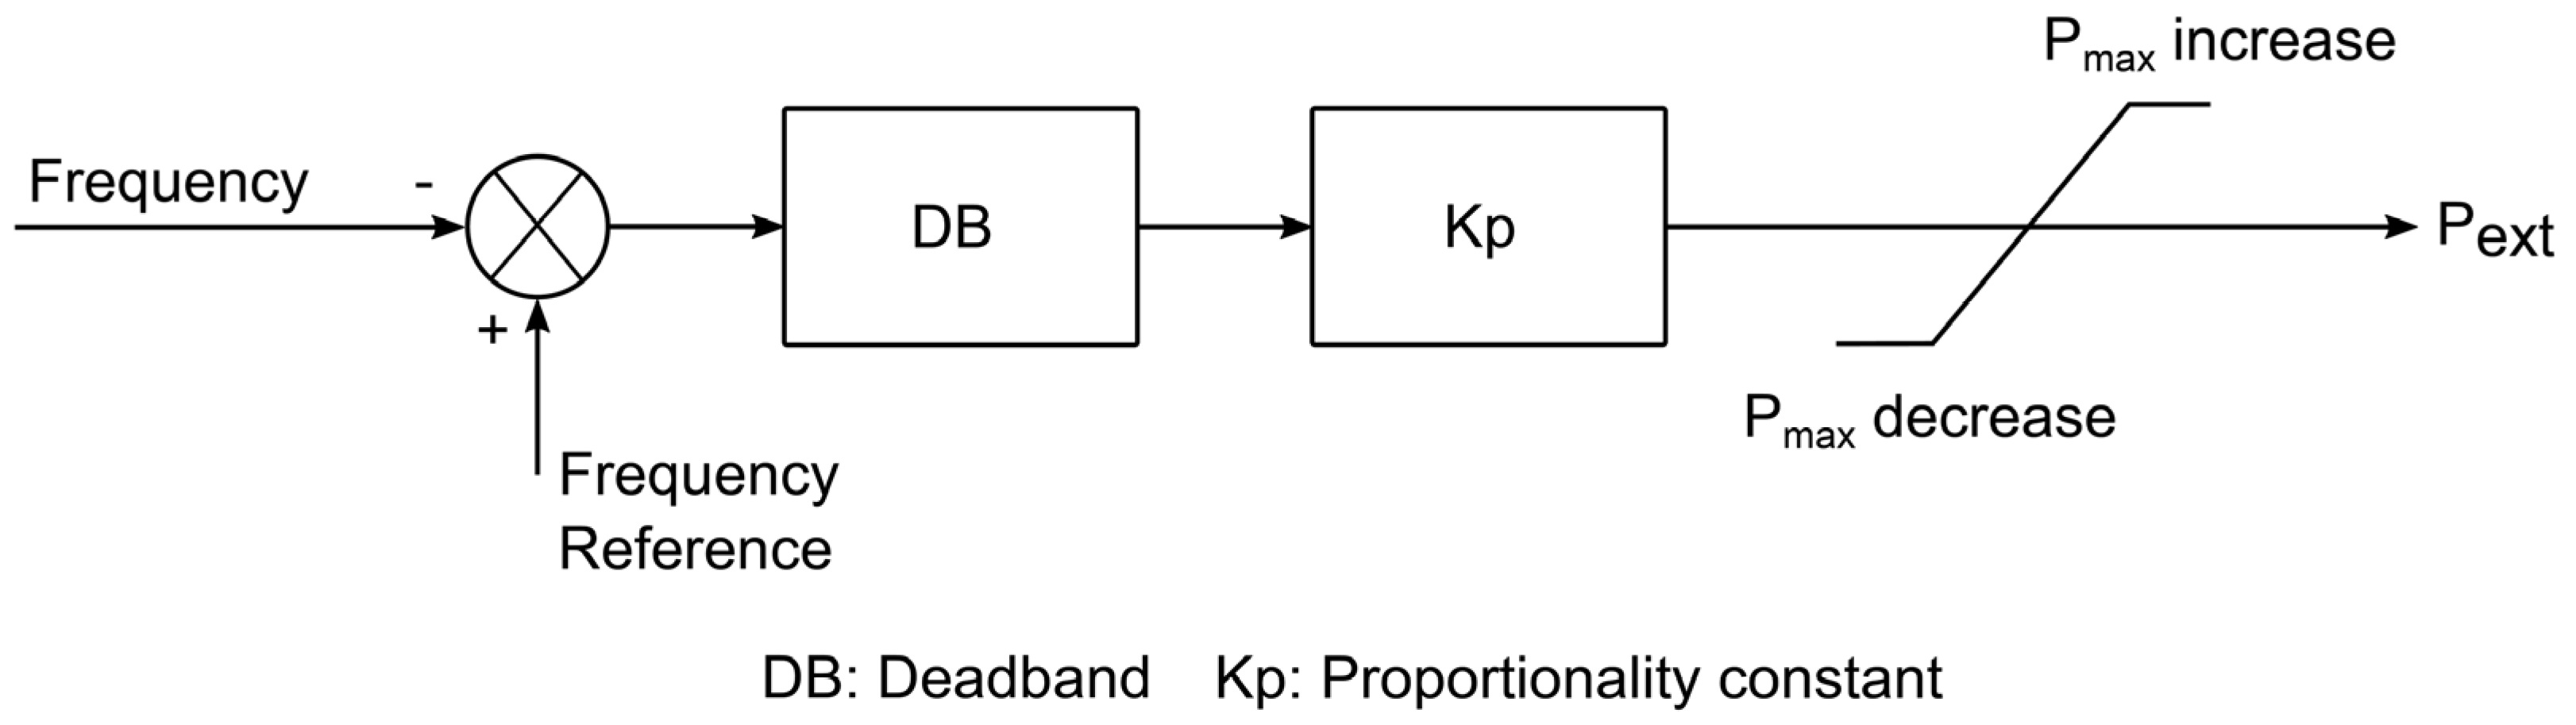
4.2.3. Inertia Emulation
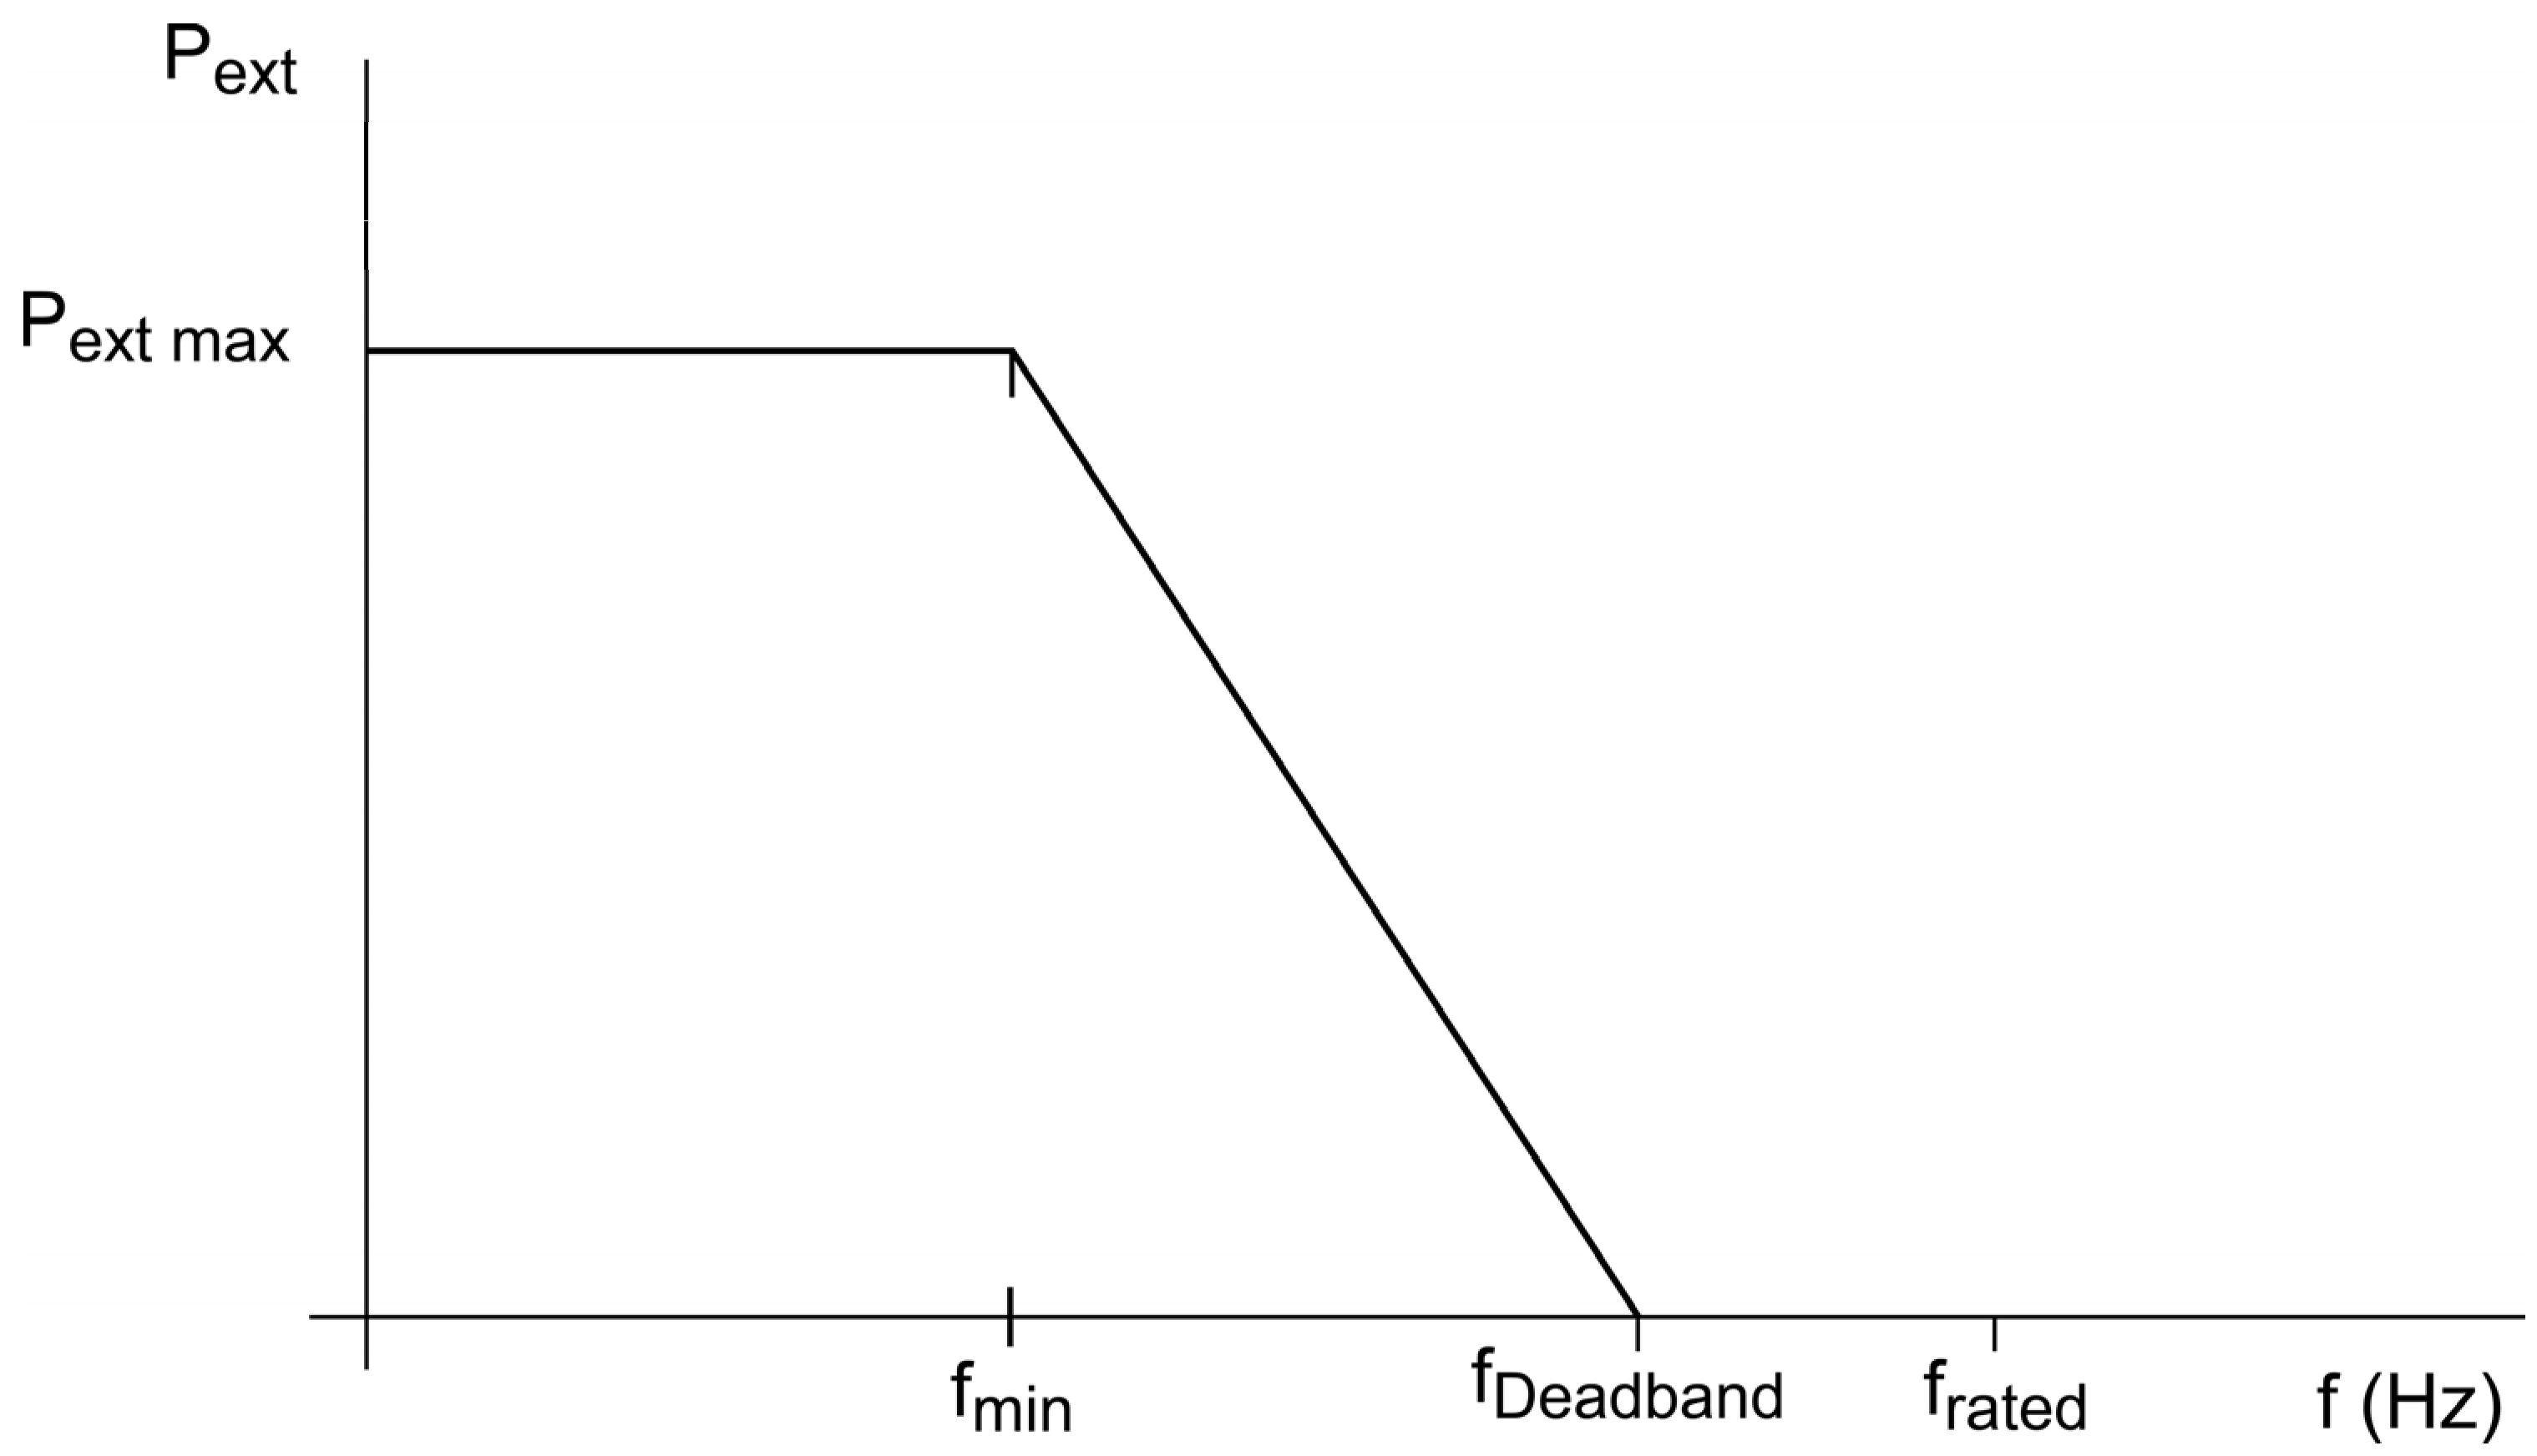
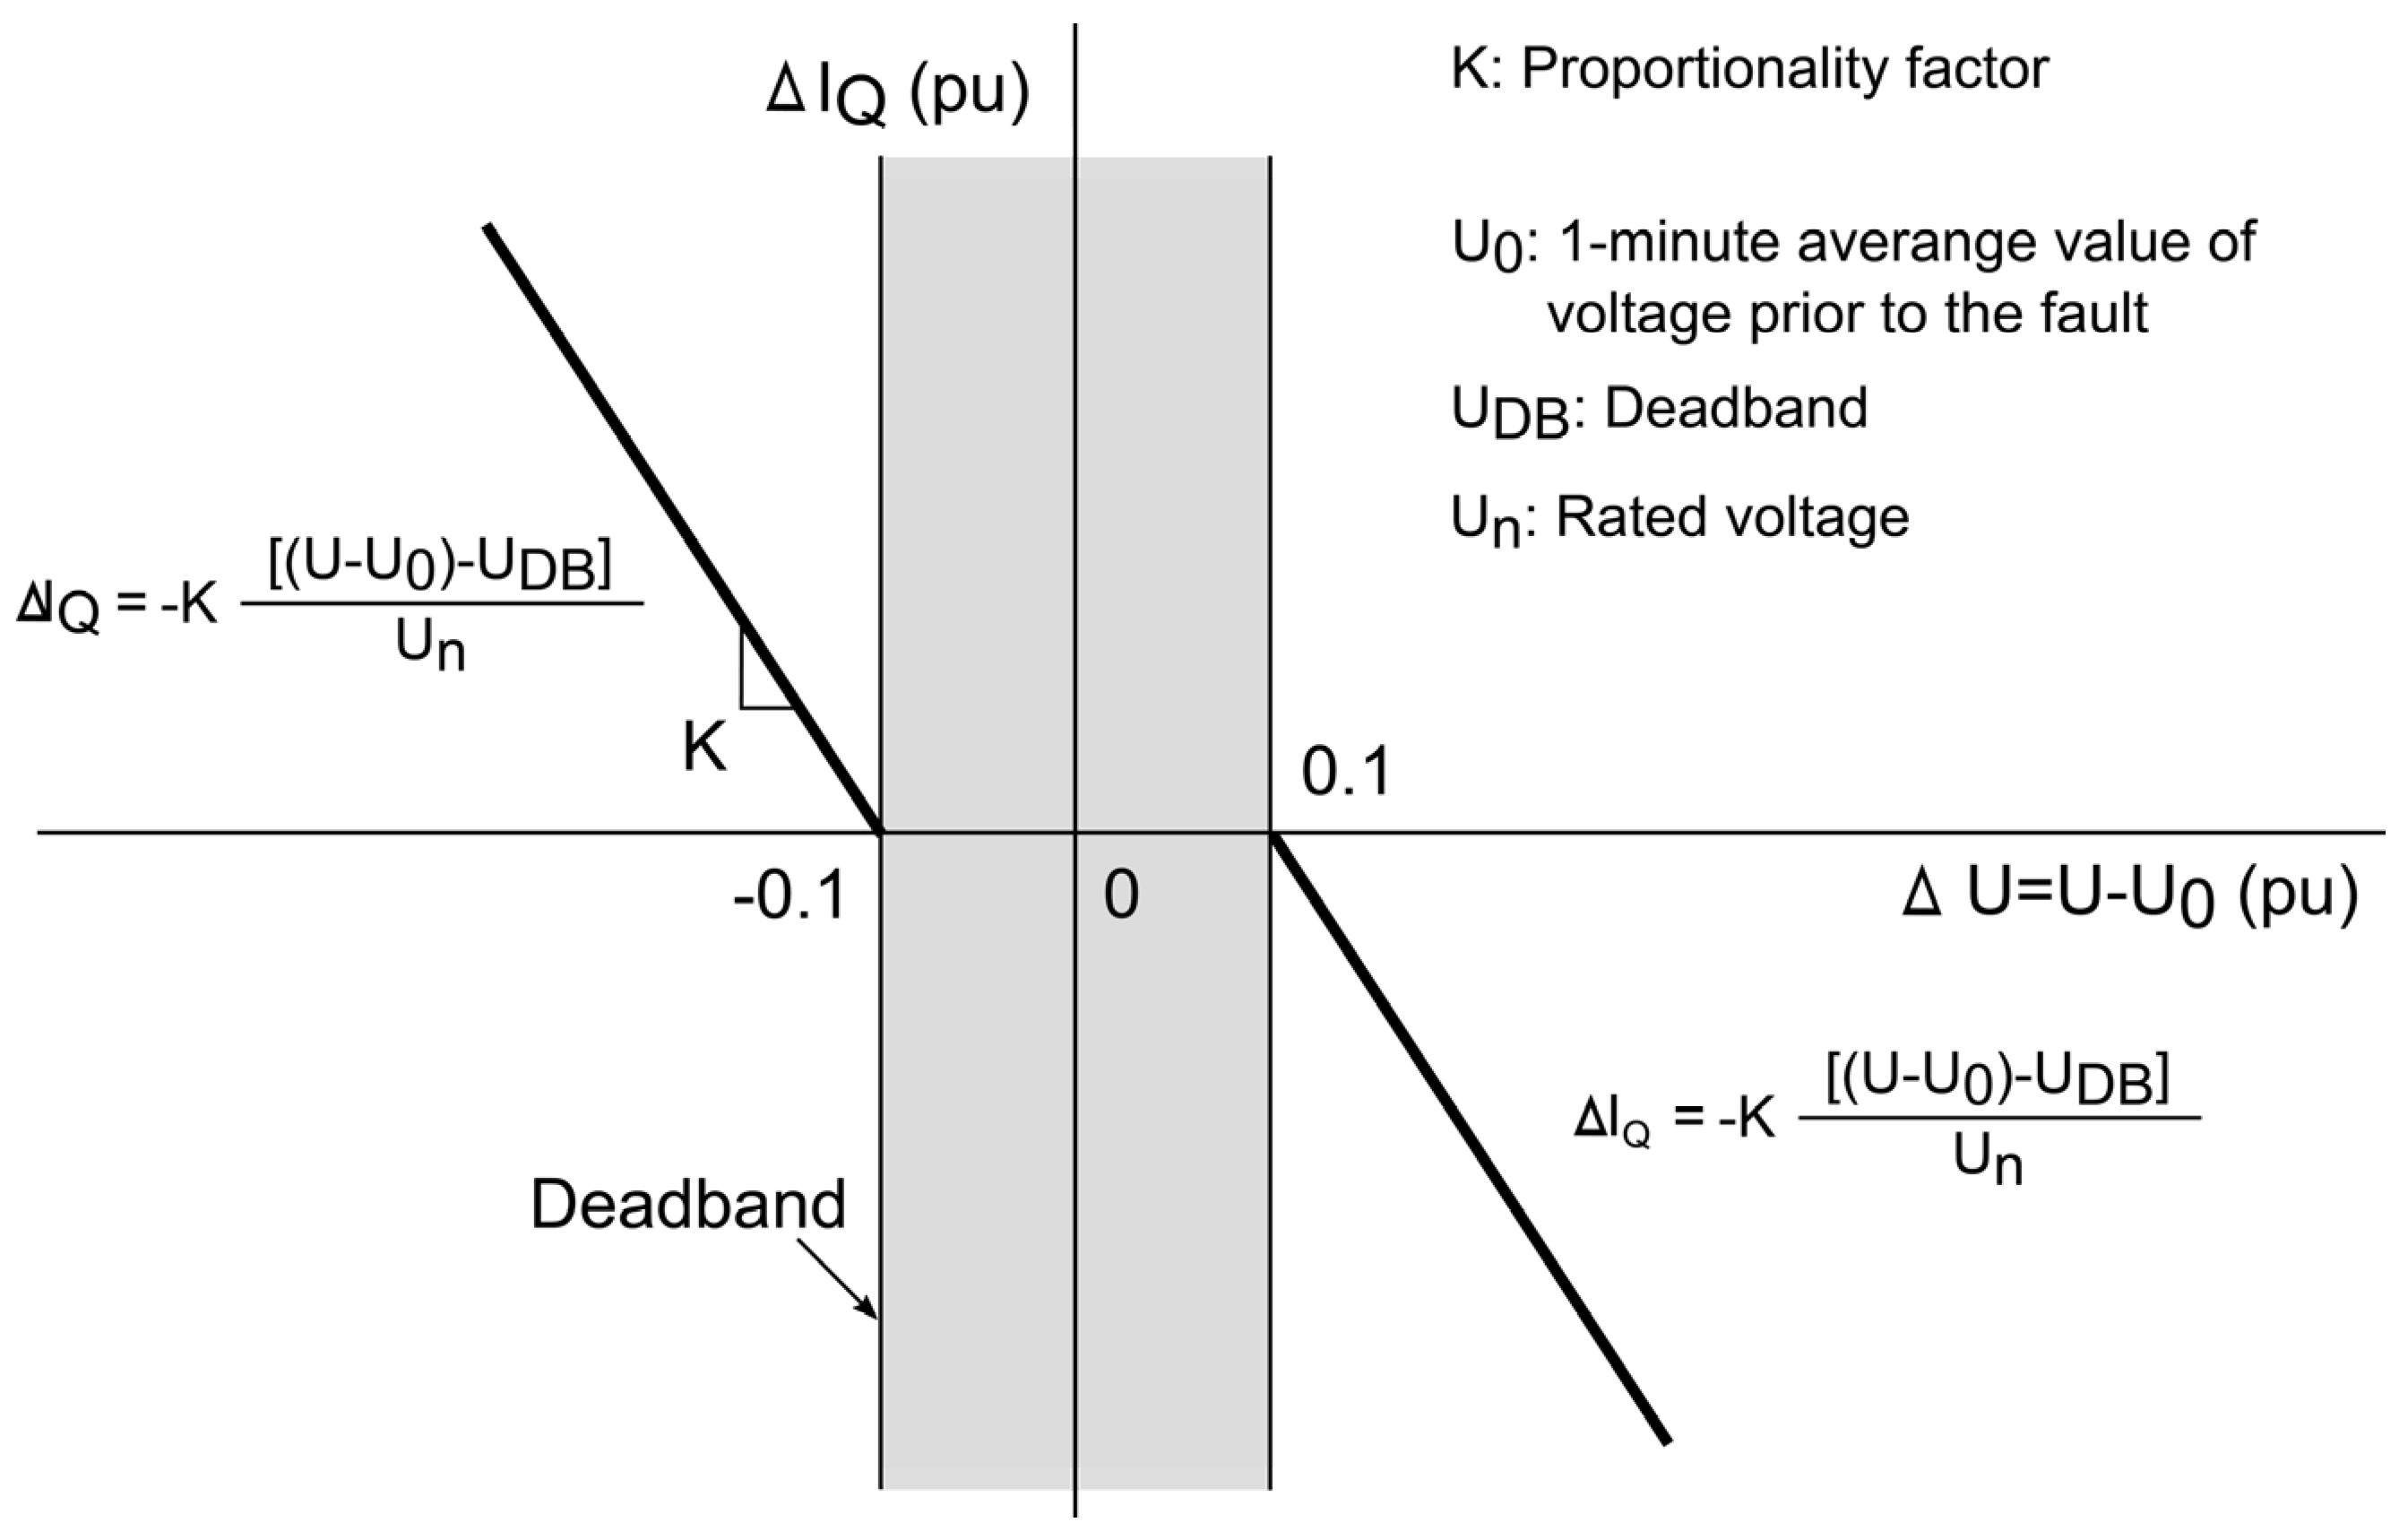
4.3. Protections Relays
| Generator type | Parameter | Under voltage | Overvoltage | Under frequency | Over frequency | Over current 1 | Over current 2 | Over speed |
|---|---|---|---|---|---|---|---|---|
| Conventional generator | Value | 0.75 pu | 1.12 pu | 47 Hz | 52.2 Hz | 1.25 pu | 3 pu | 1.08 pu |
| Delay (s) | 0.8 | 1 | 1.25 | 2 | 6.5 | 0.5 | Instant | |
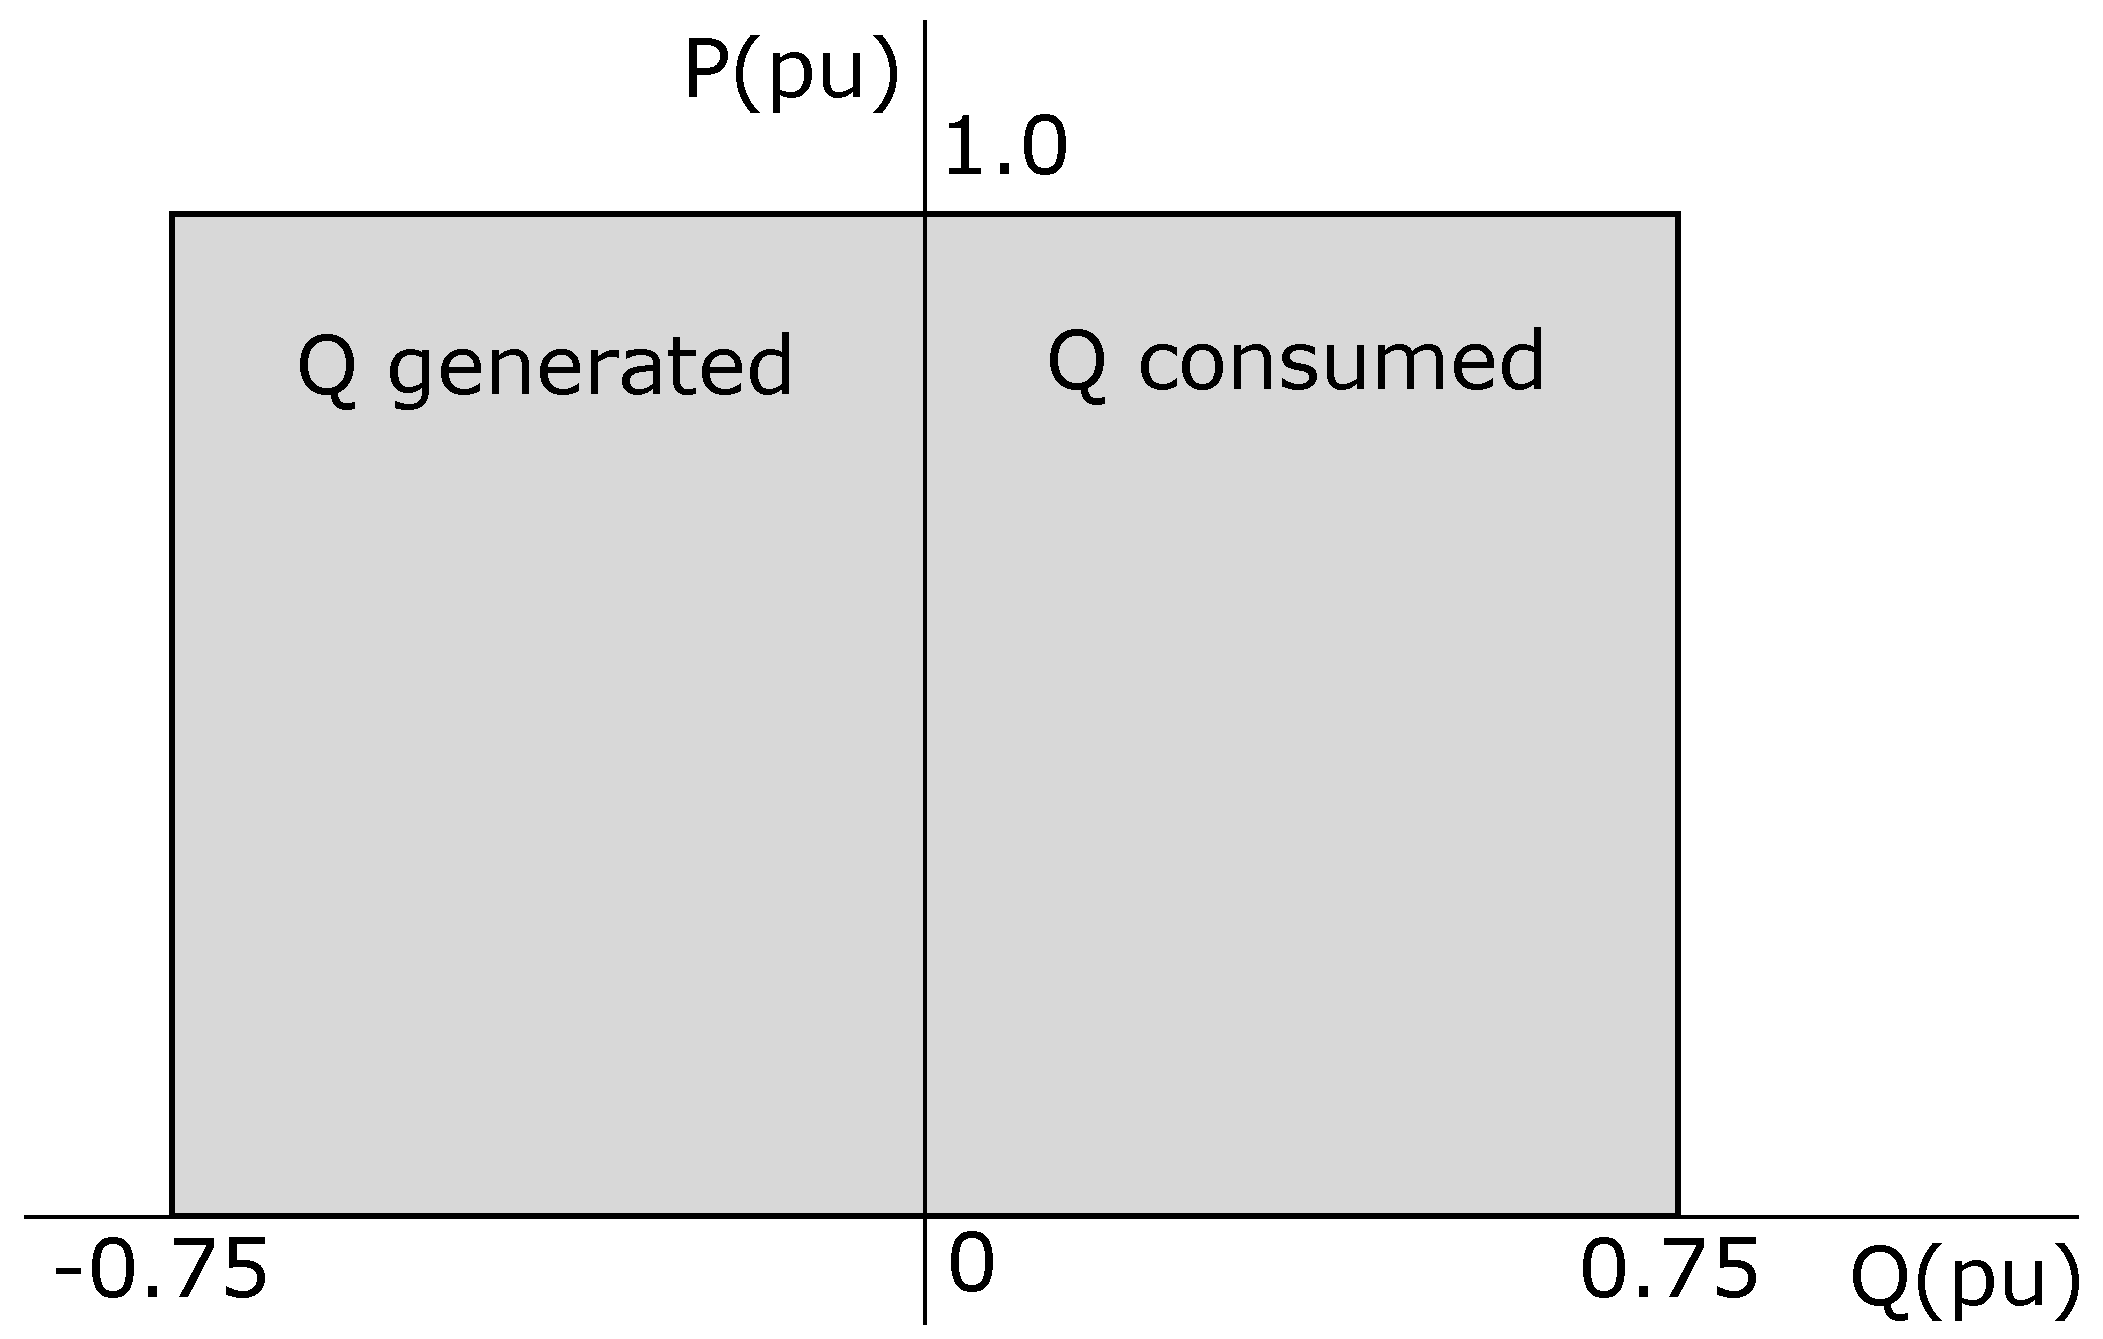
| Wind turbine | Value | 0.8 pu | 1.12 pu | 47 Hz | 51 Hz | 1.25 pu | 3 pu | 1.08 pu (Only SCIG WT) |
| Delay (s) | 5 | 0.3 | 1.3 | 0.1 | 6.5 | 0.5 | Instant (Only SCIG WT) |
4.4. Load Shedding Scheme
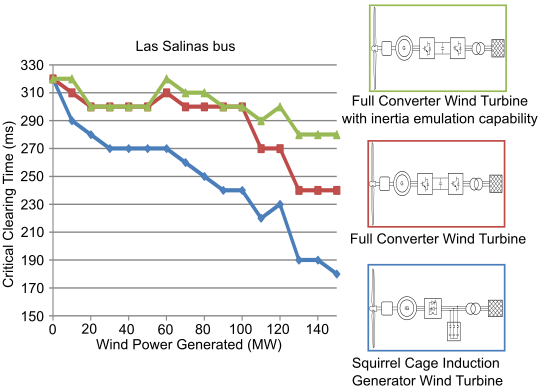
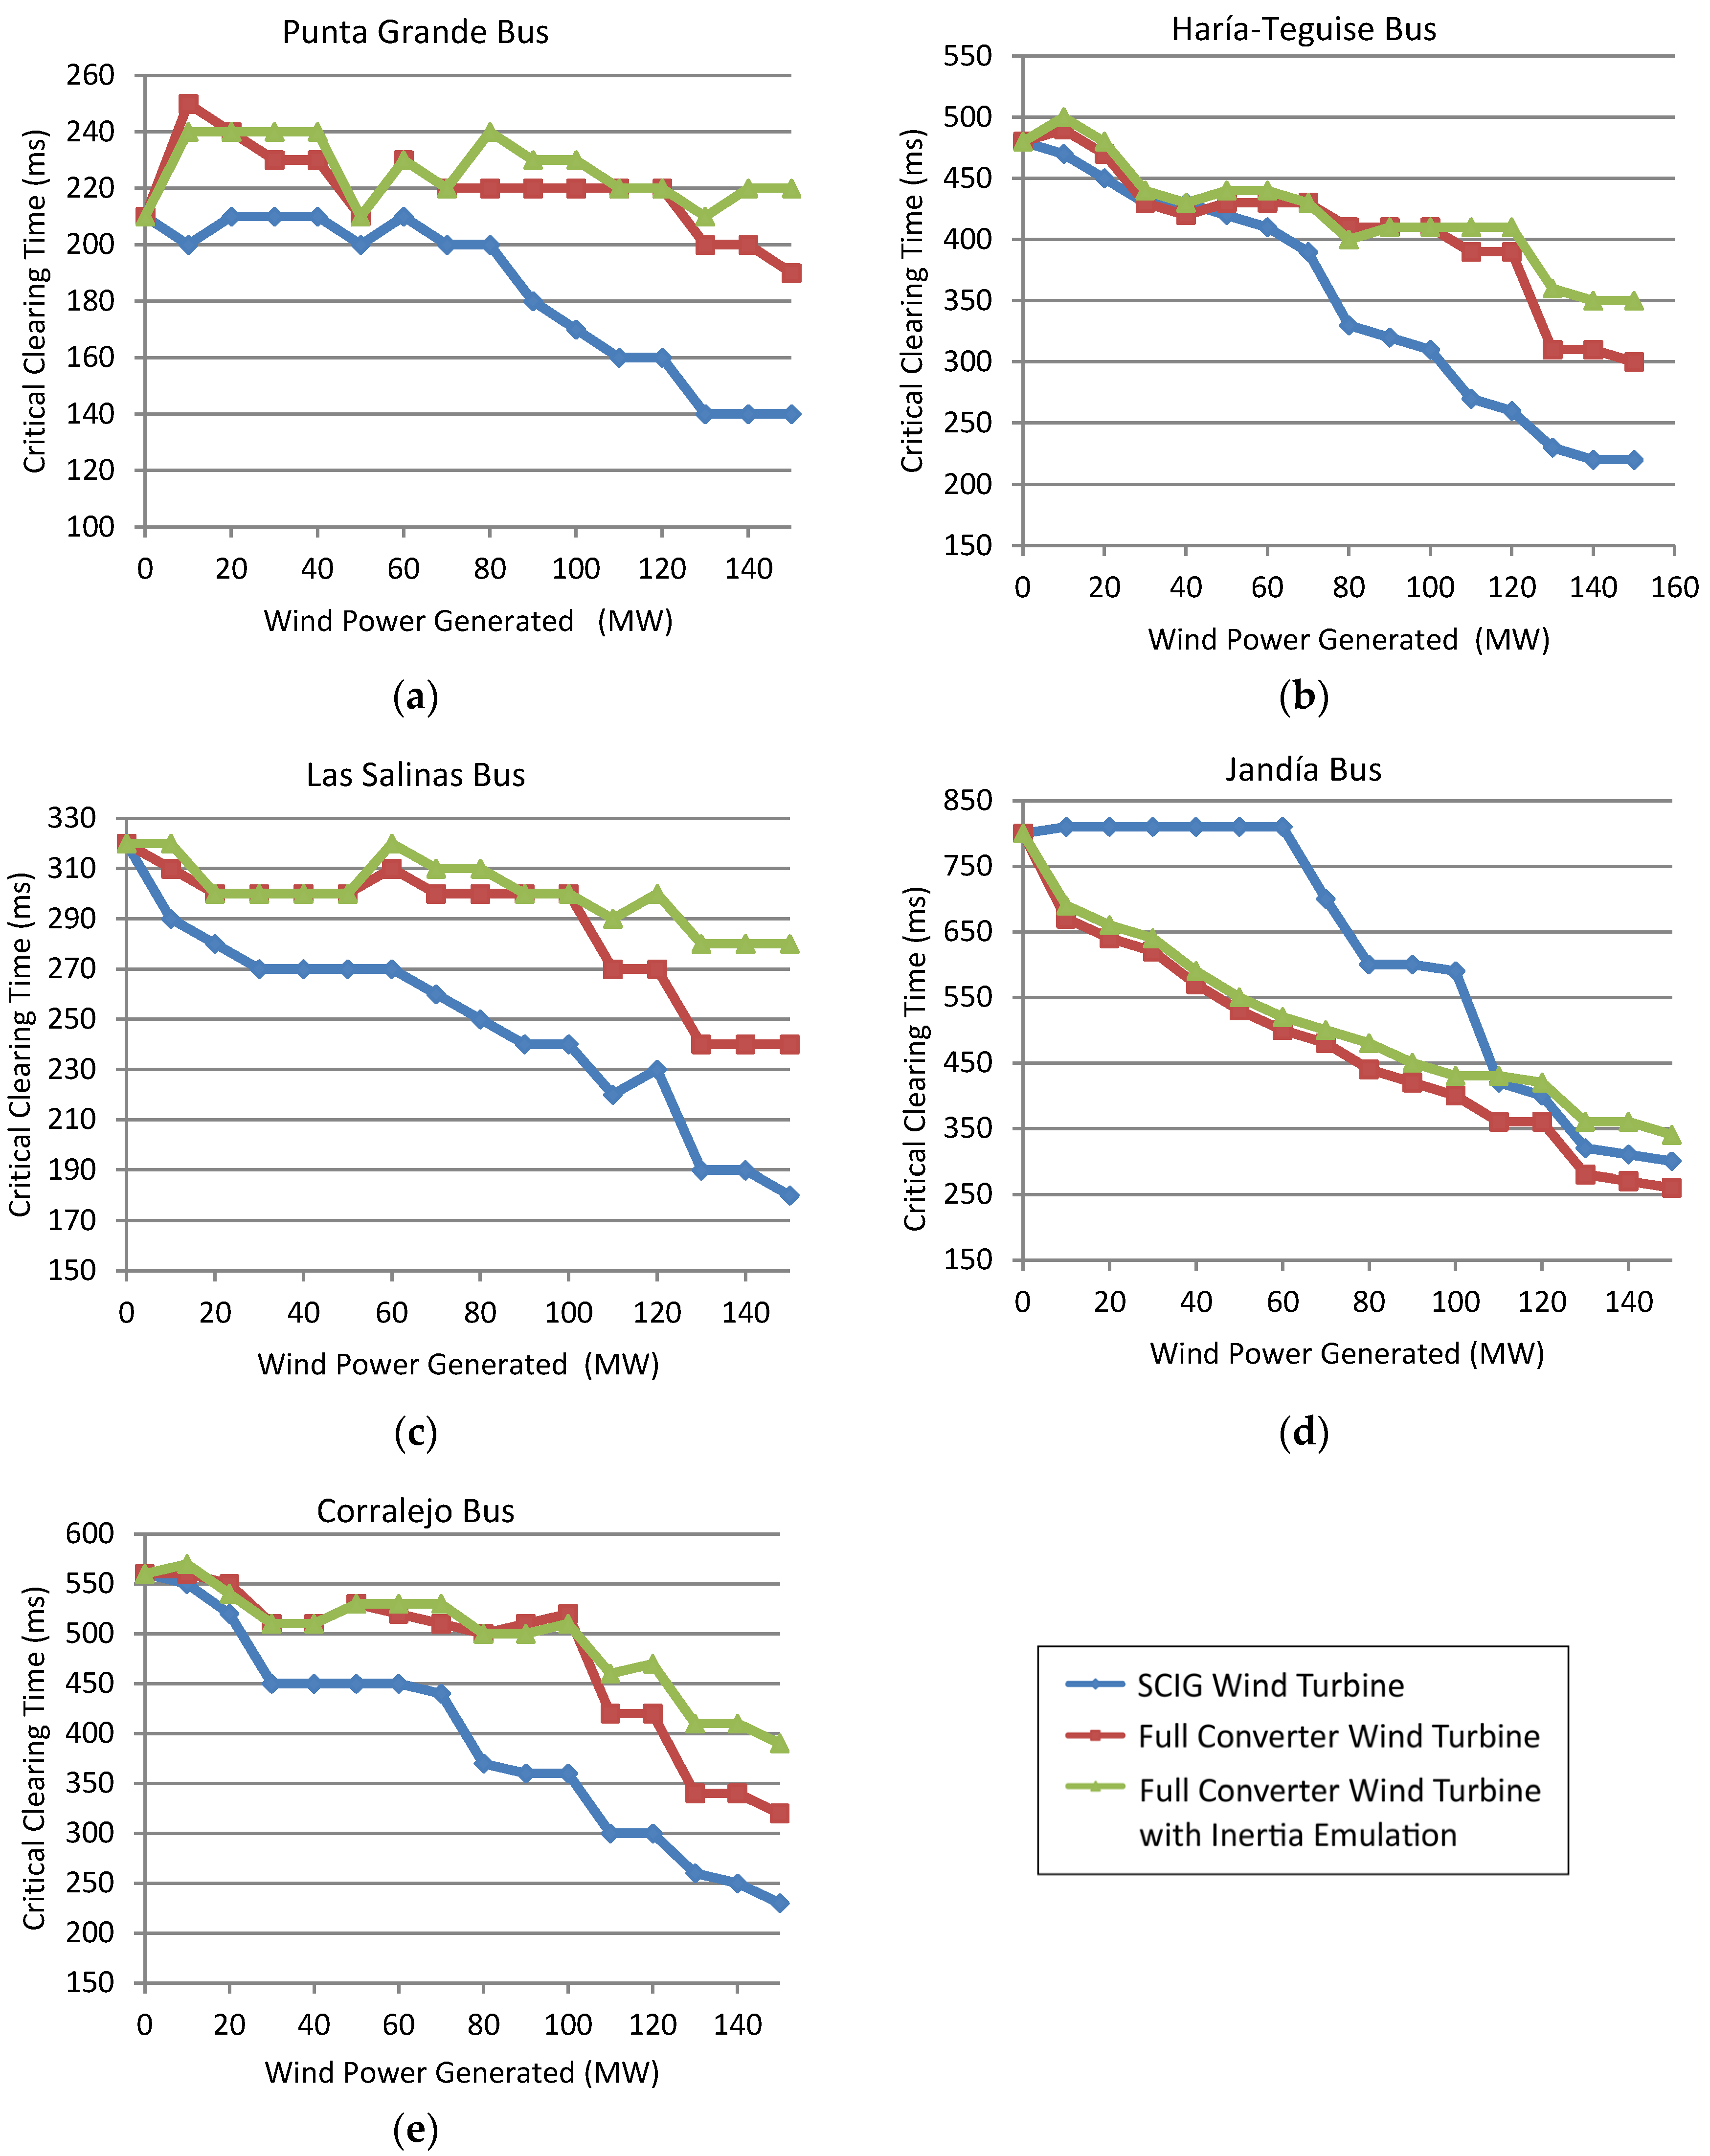
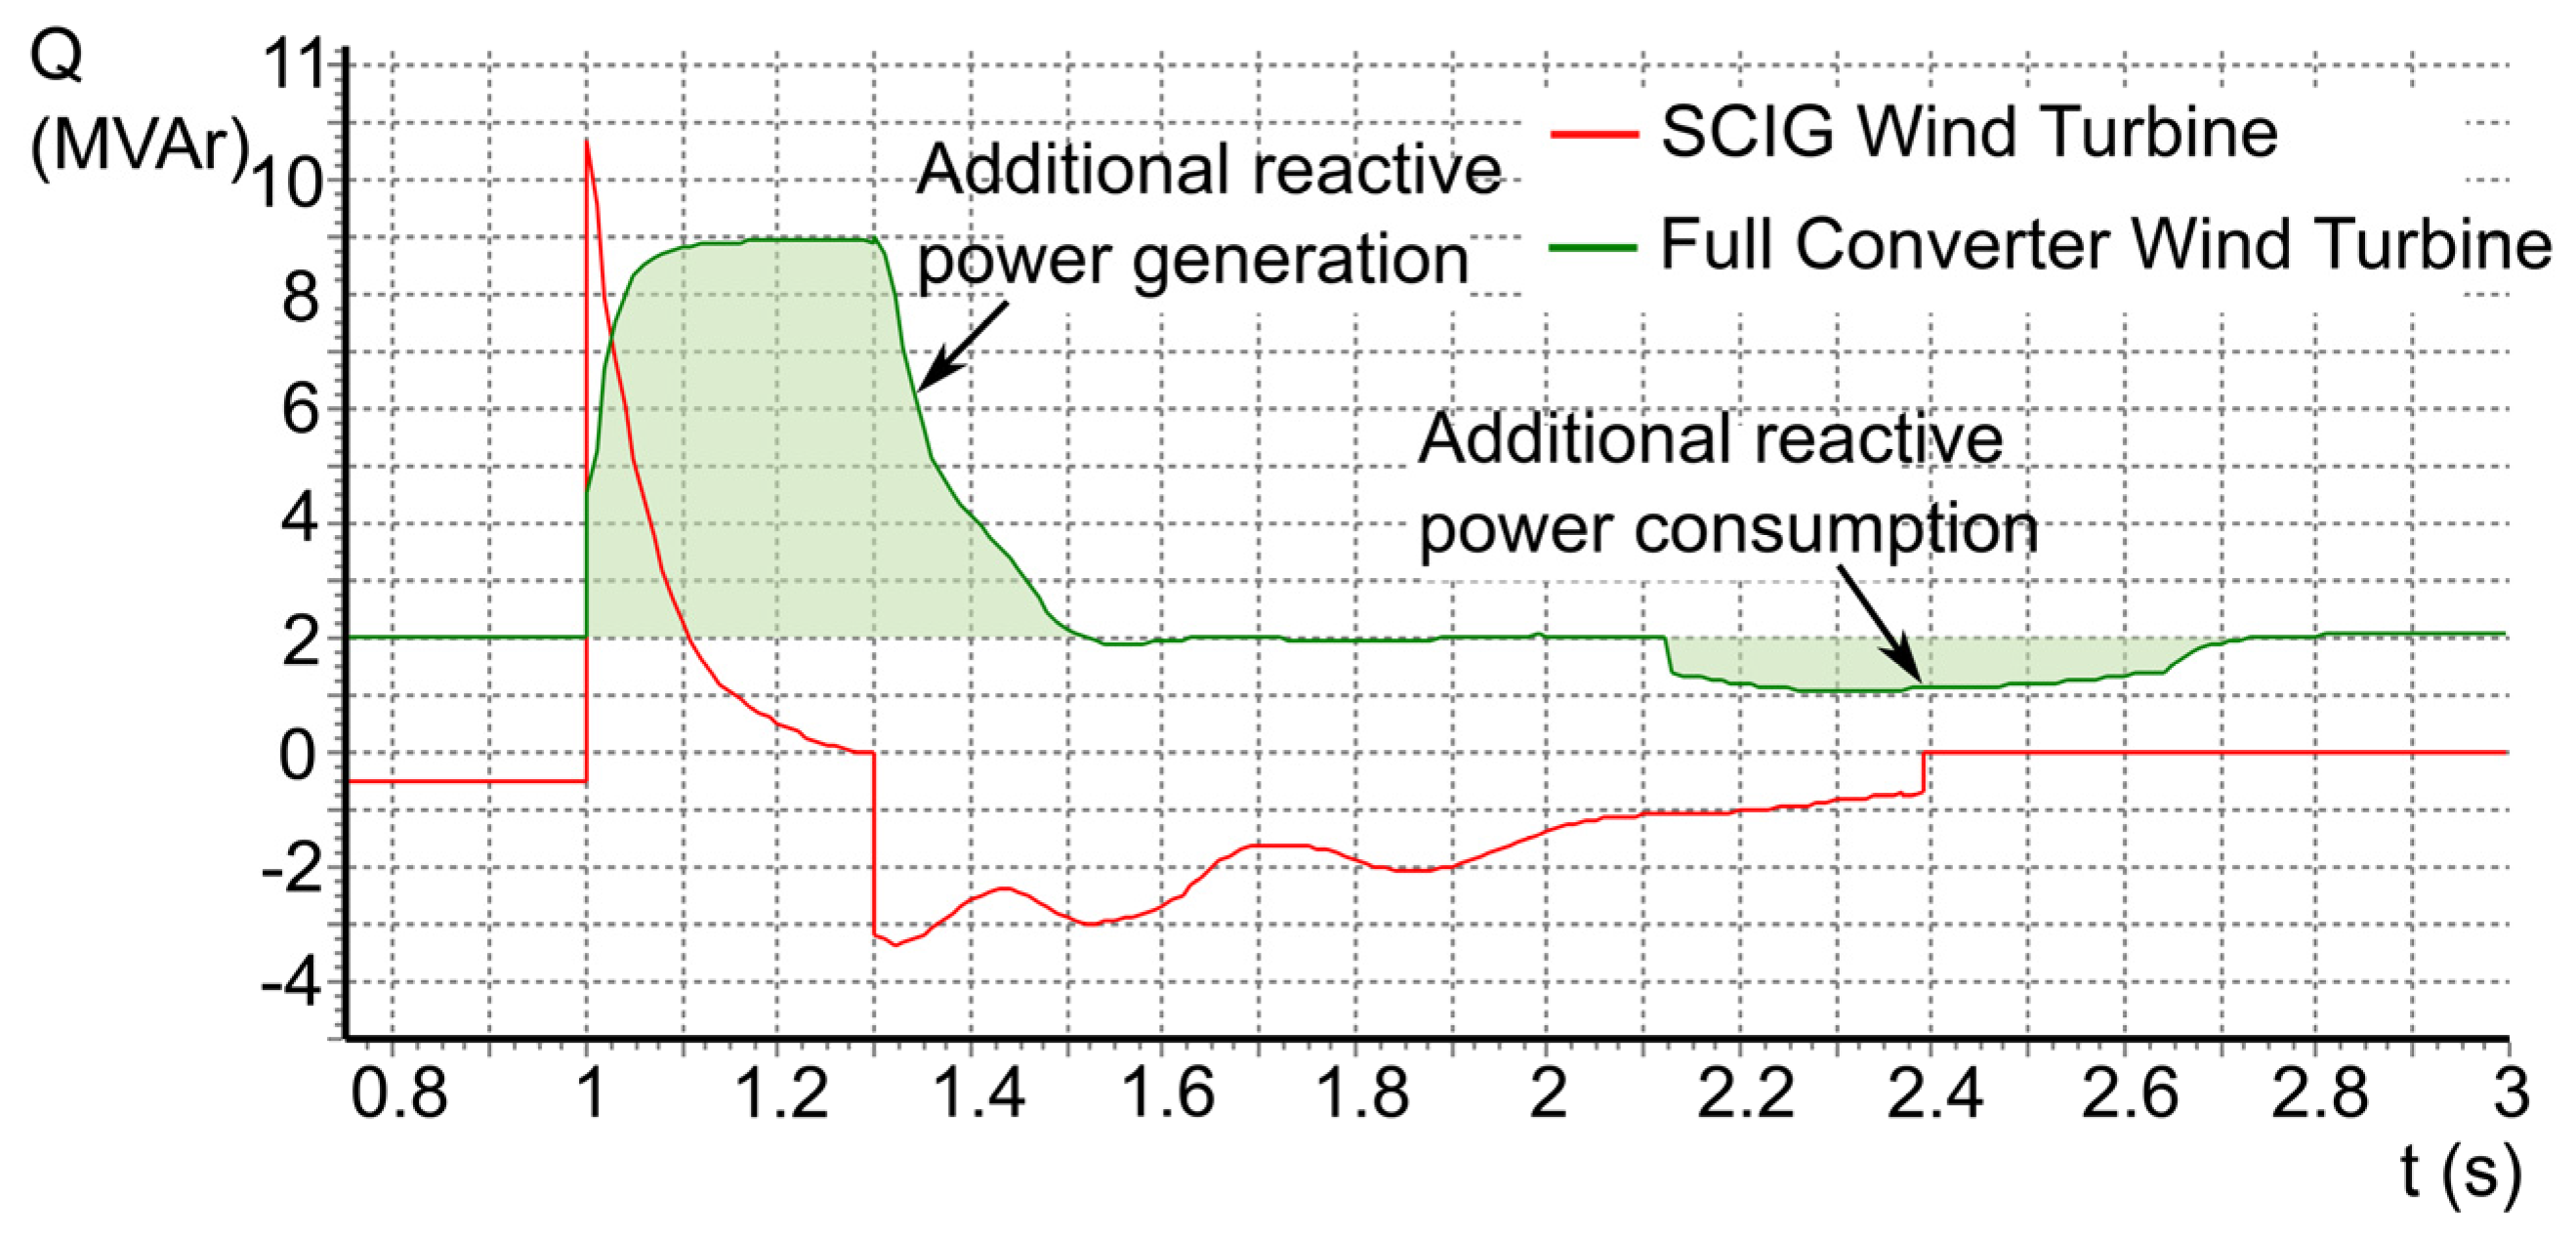
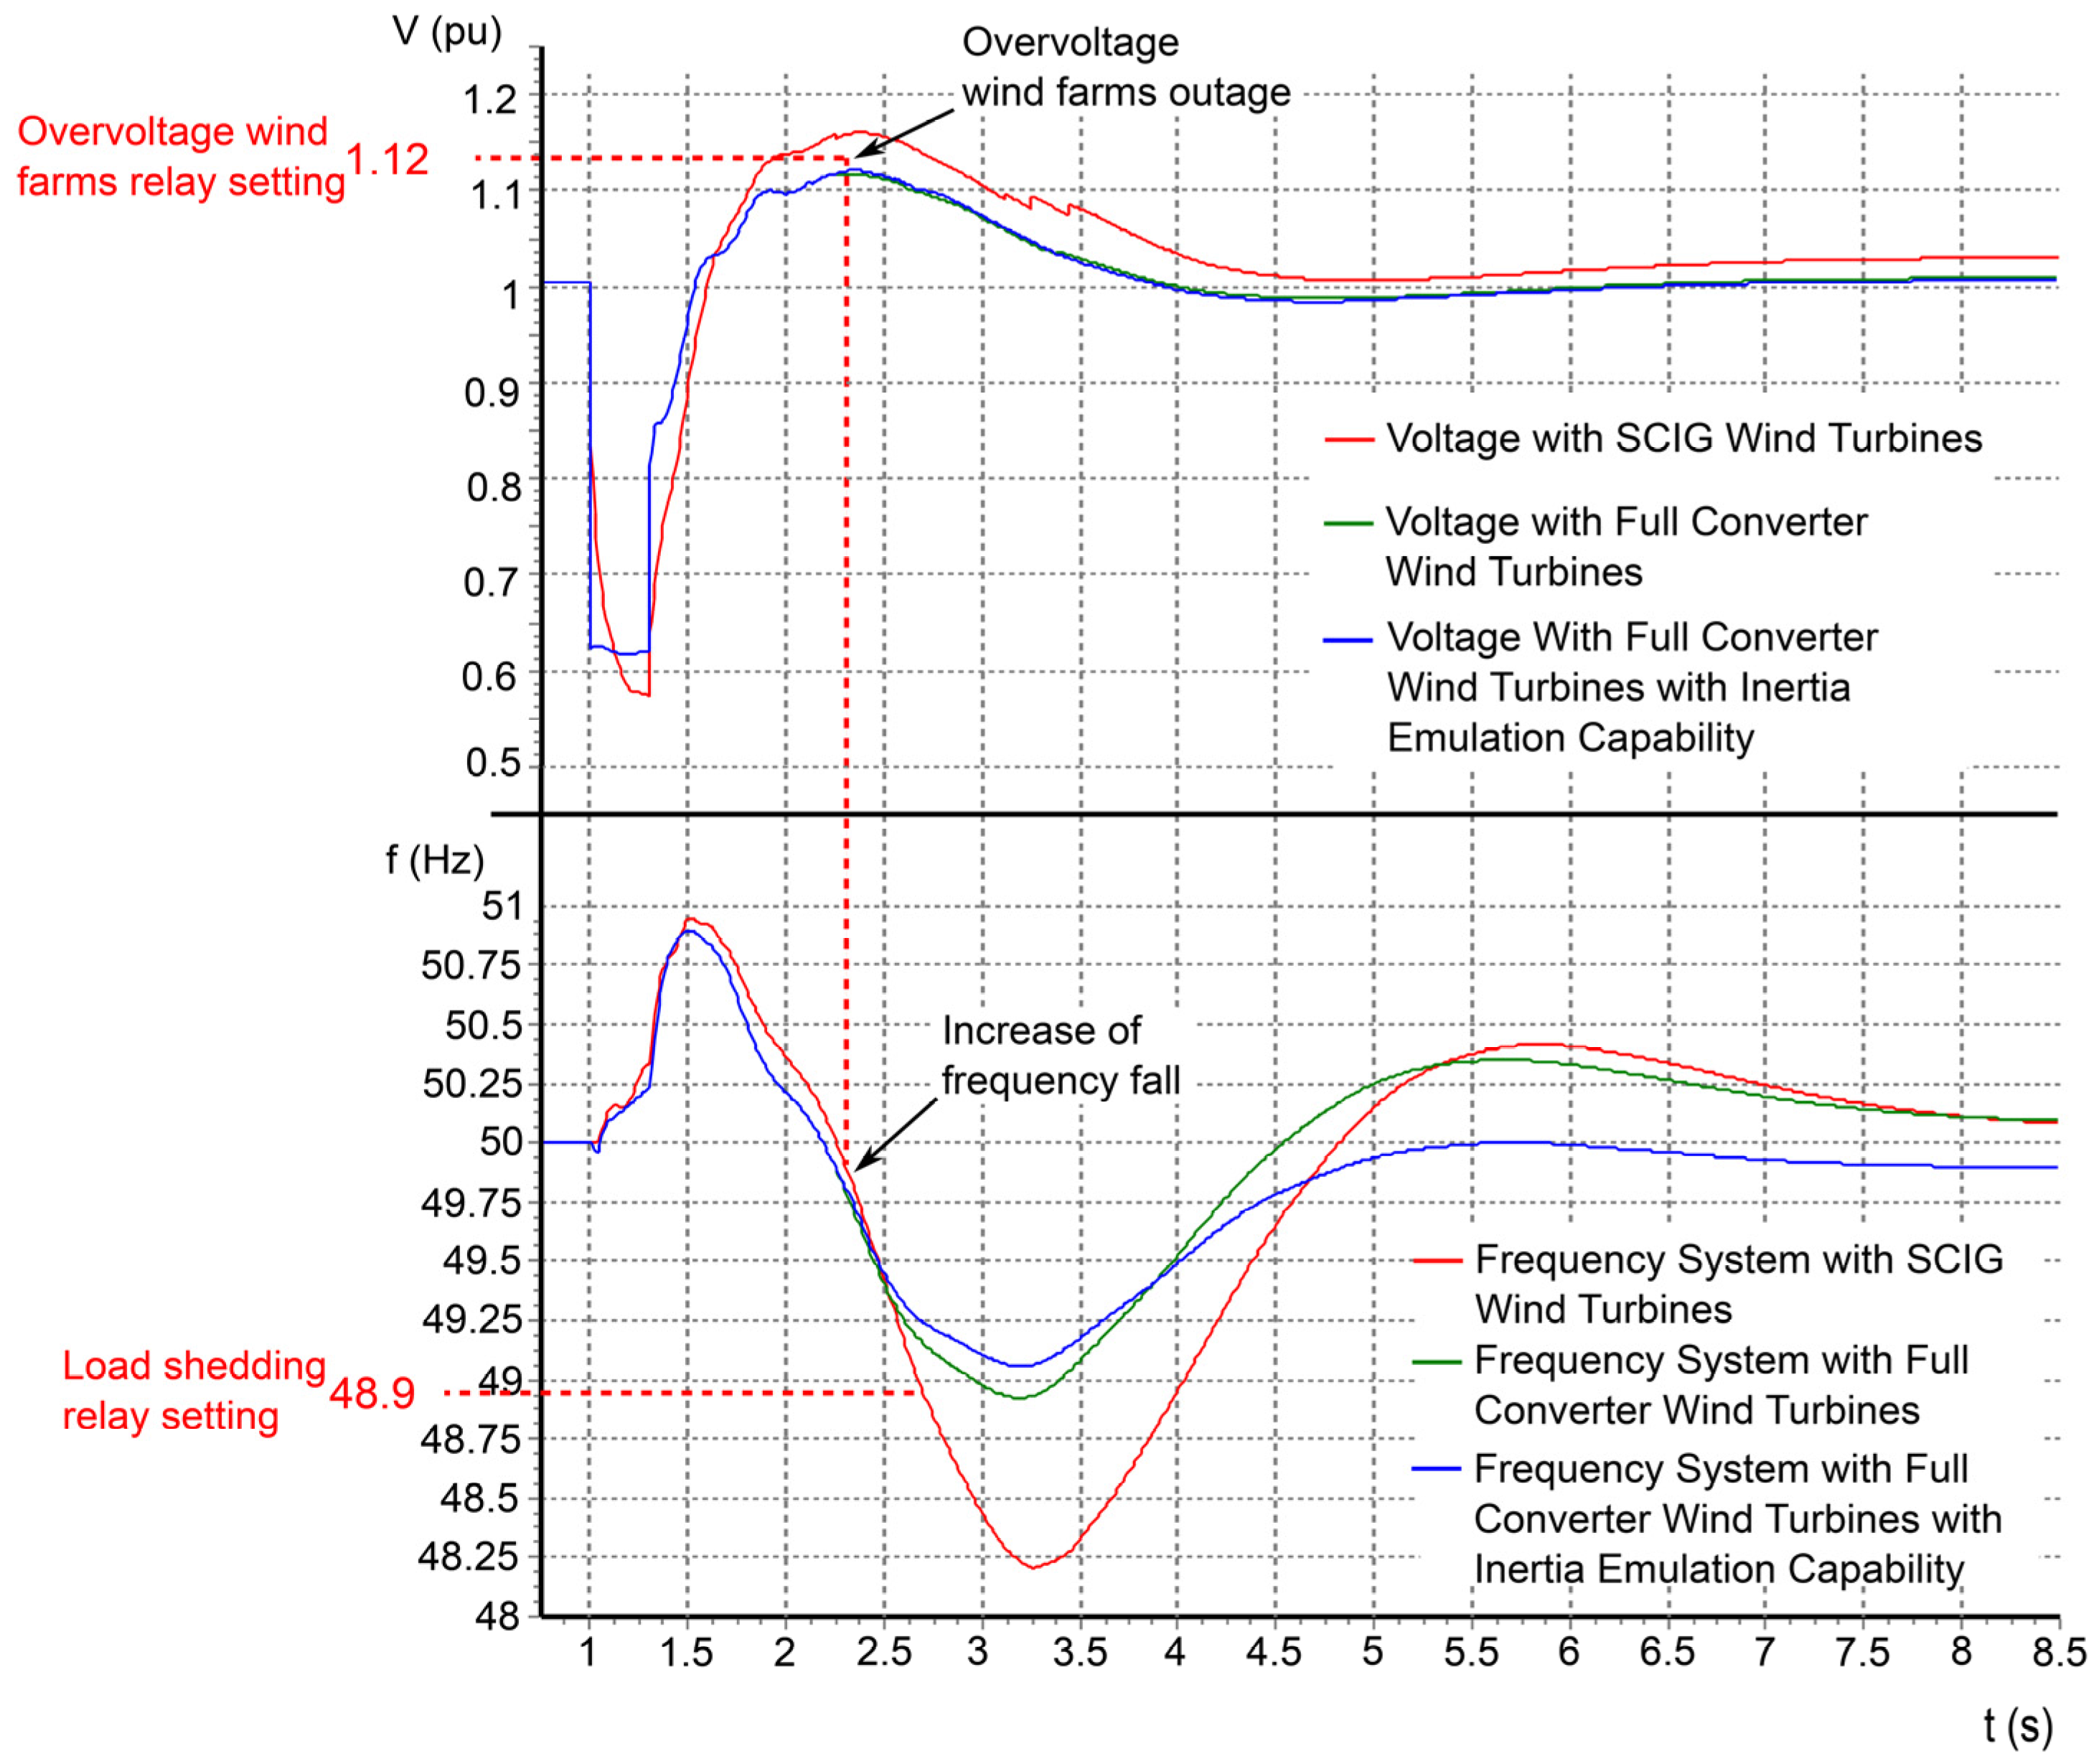
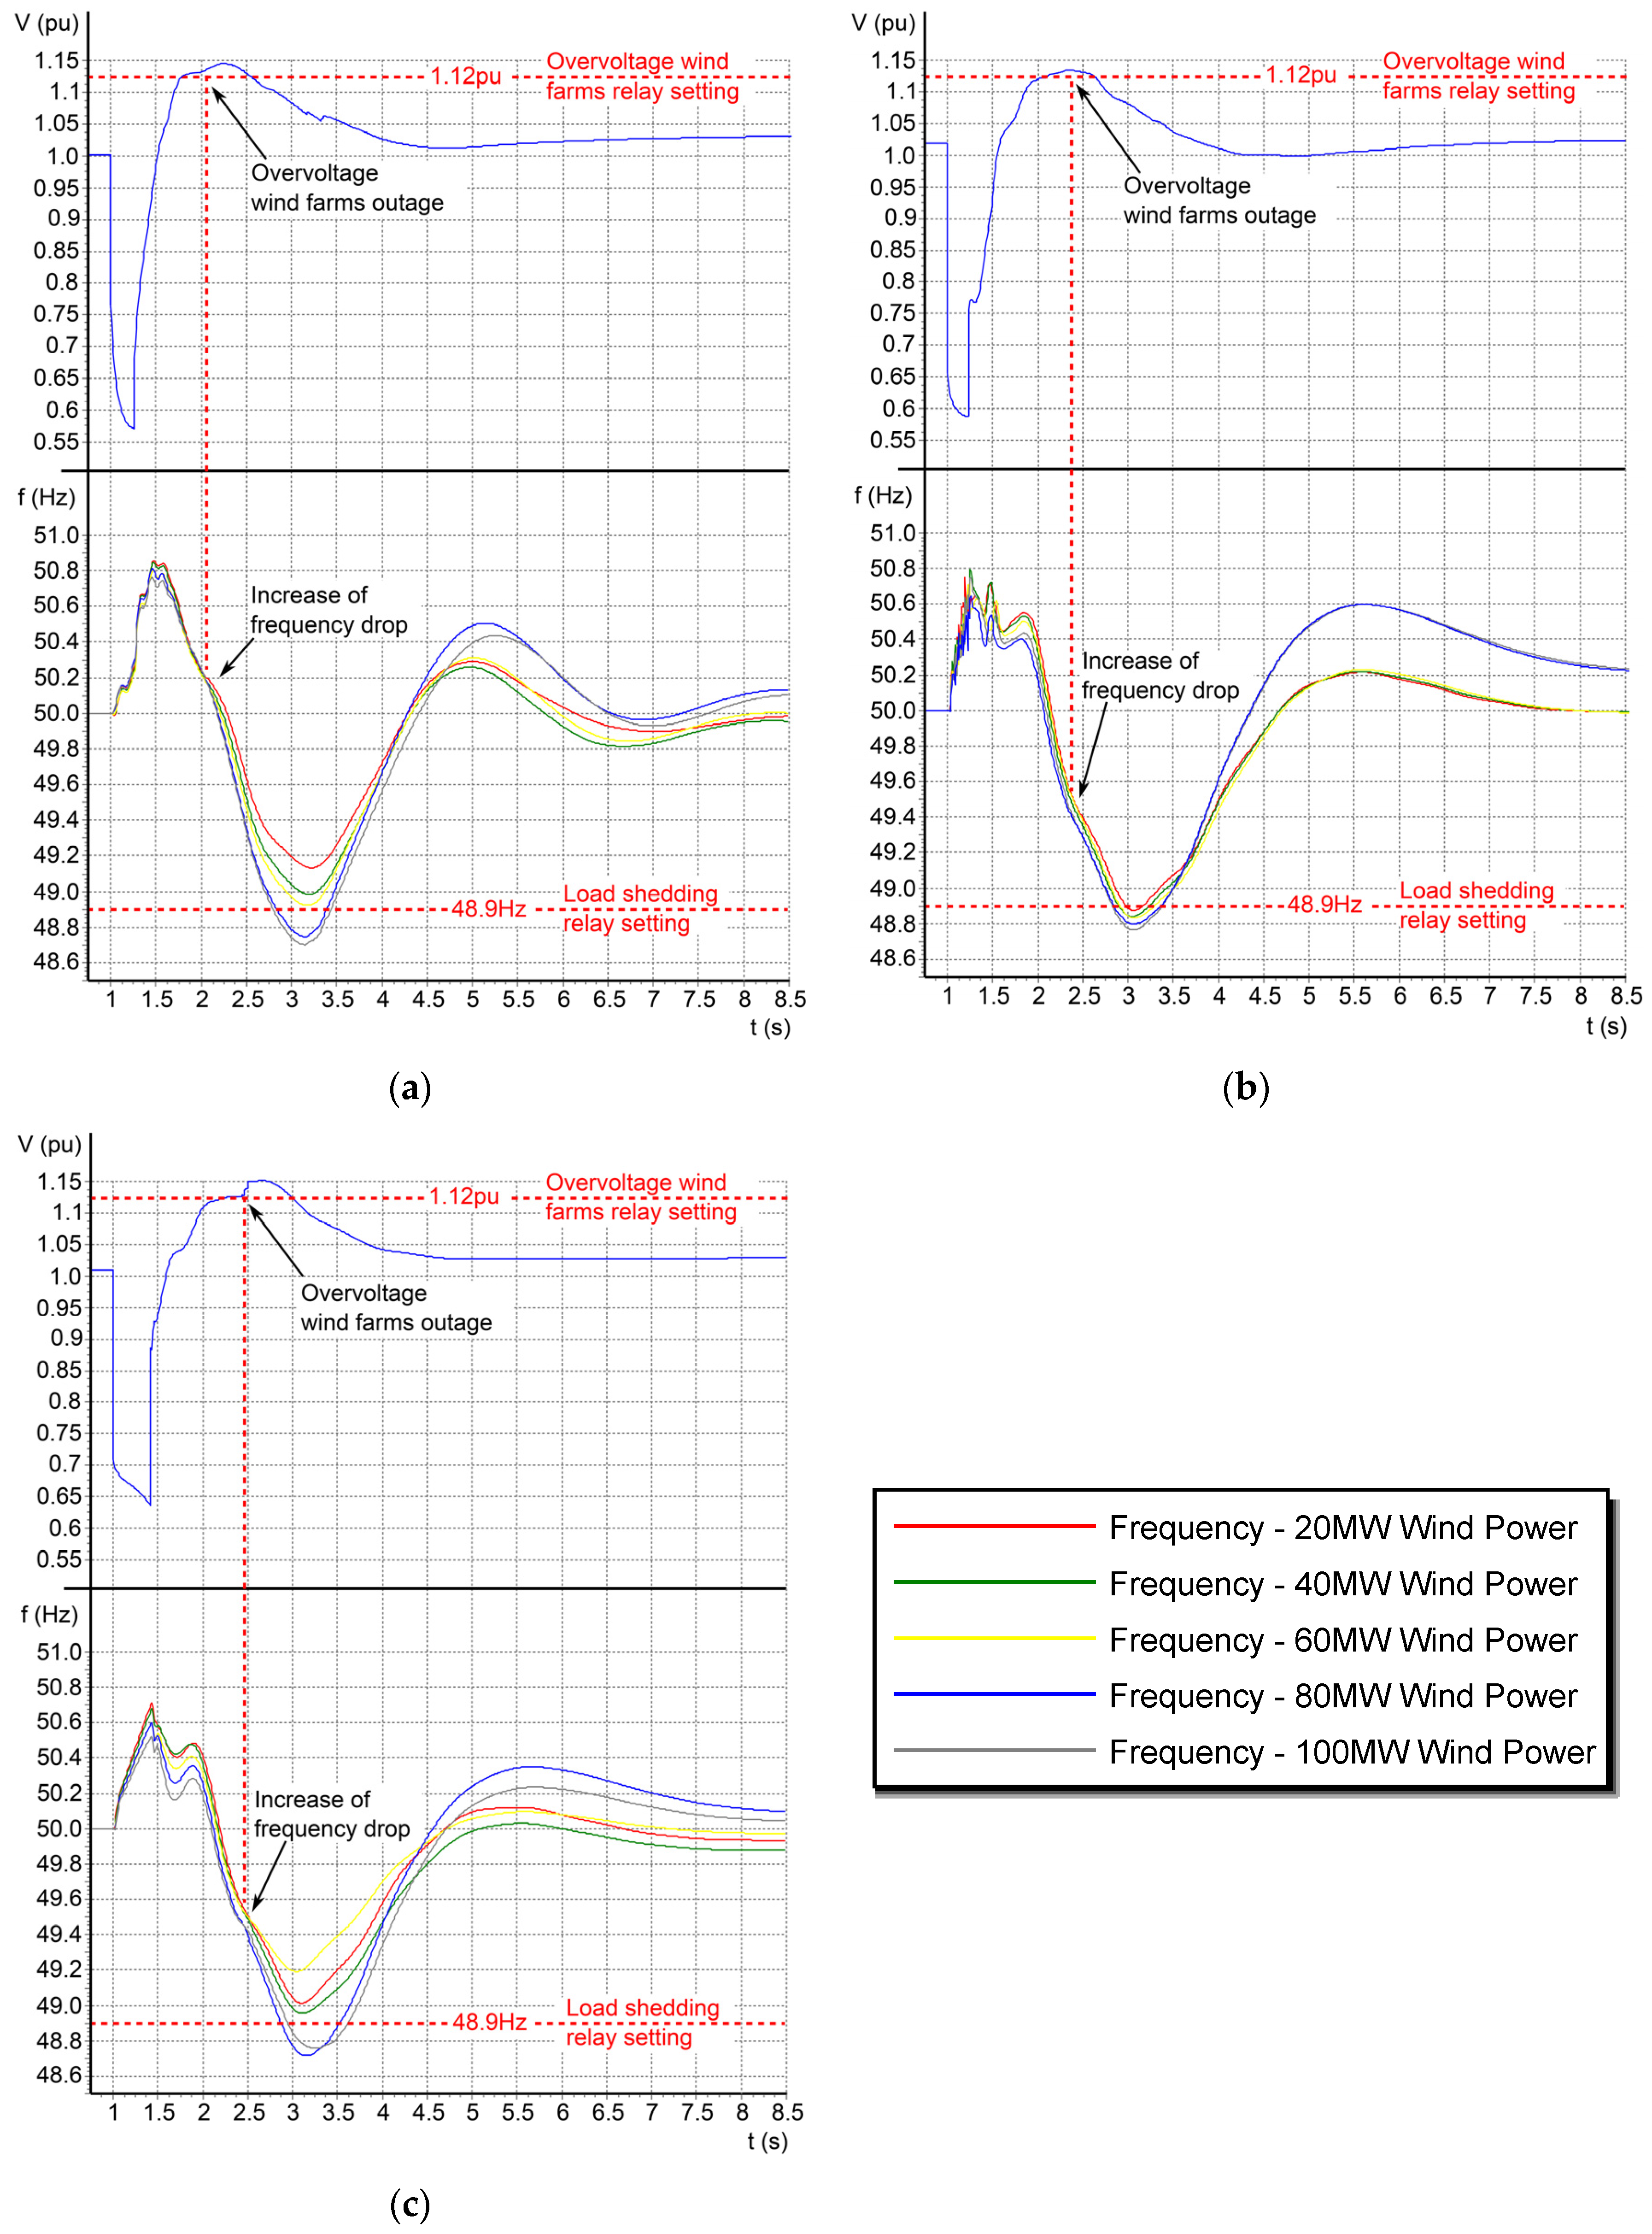
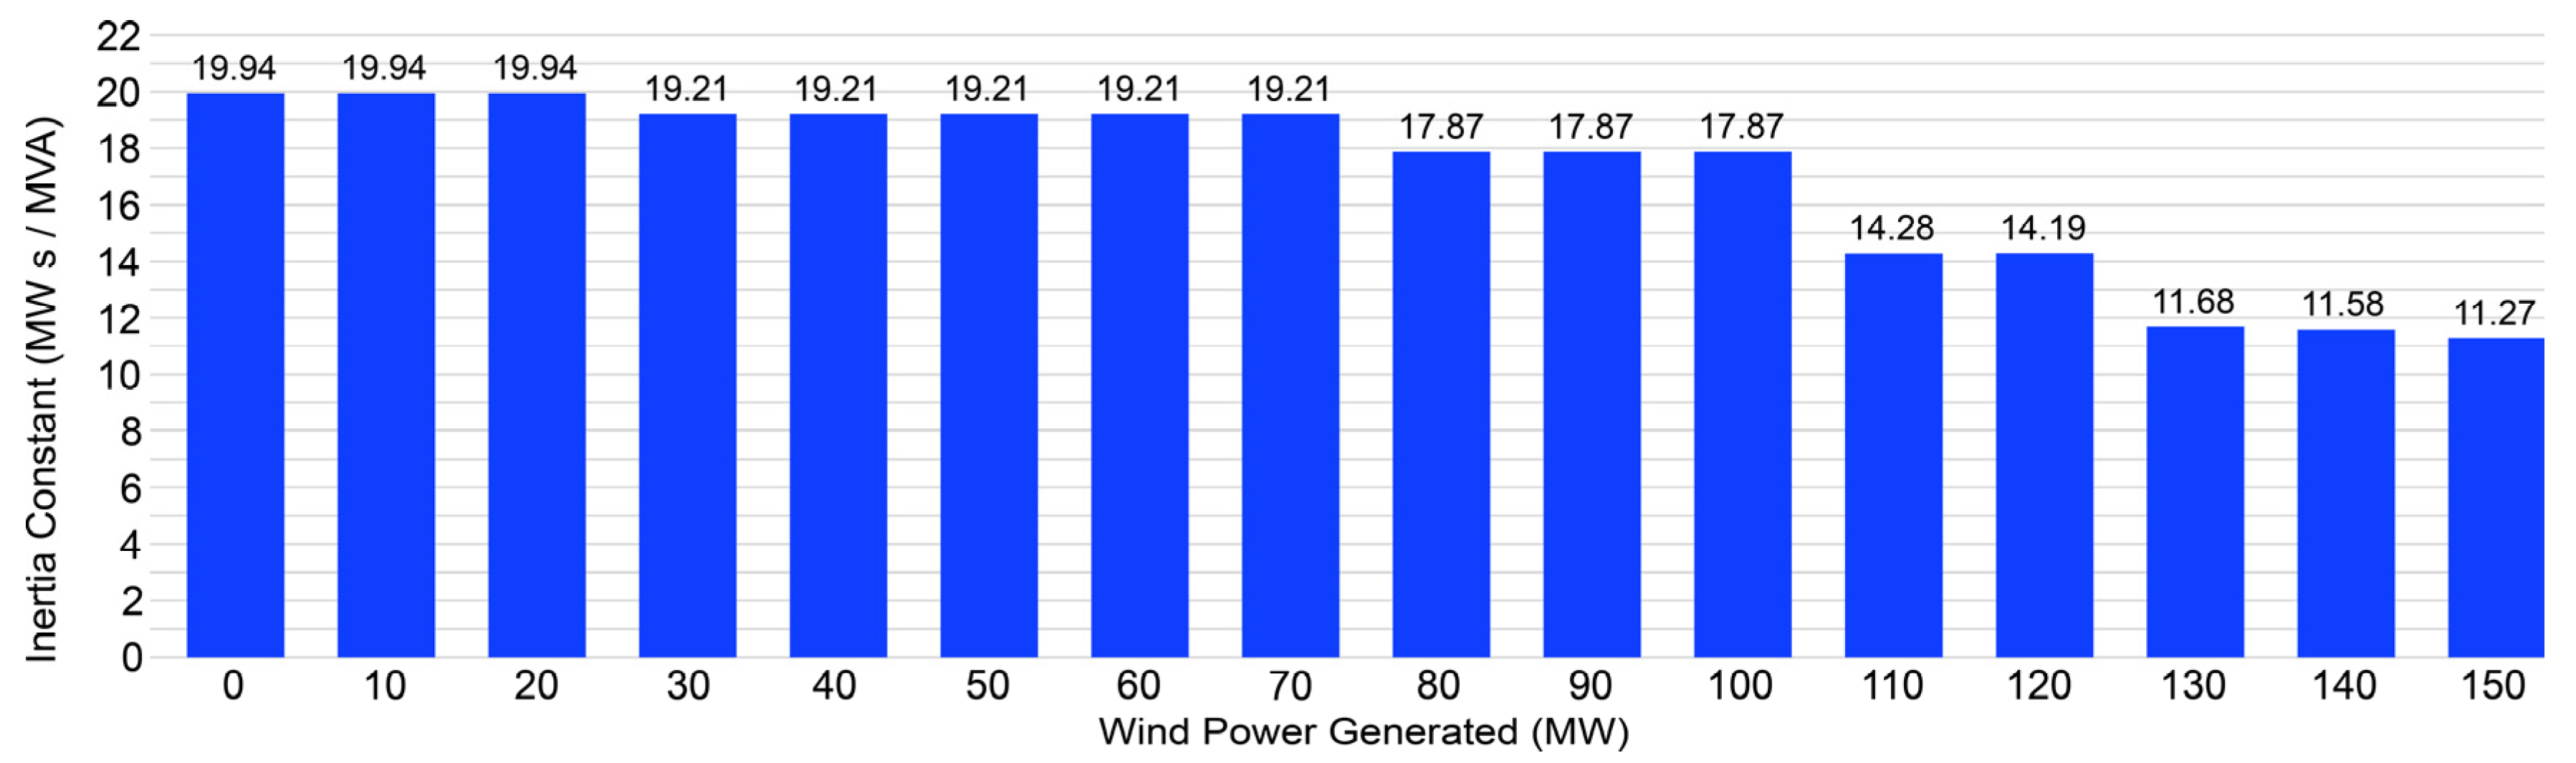
5. Results and Discussion


6. Conclusions
Acknowledgments
Conflicts of Interest
References
- Global Wind Energy. Council Global Wind Energy Outlook 2014. Available online: http://www.gwec.net/wp-content/uploads/2015/03/GWEC_Global_Wind_2014_Report_LR.pdf (accessed on 6 May 2014).
- Egido, I.; Fernandez-Bernal, F.; Centeno, P.; Rouco, L. Maximum frequency deviation calculation in small isolated power systems. IEEE Trans. Power Syst. 2009, 24, 1731–1738. [Google Scholar] [CrossRef]
- Lenga, O. Application of critical clearing time as a transient stability criterion for power system expansion planning. In Proceedings of the 2014 IEEE International Conference on Intelligent Energy and Power Systems (IEPS), Kyiv, Ukraine, 2–6 June 2014.
- Shi, L.; Sun, S.; Yao, L.; Ni, Y.; Bazargan, M. Effects of wind generation intermittency and volatility on power system transient stability. IET Renew. Power Gener. 2014, 8, 509–521. [Google Scholar] [CrossRef]
- Criterios Generales de Protección del Sistema Eléctrico Peninsular Español. Available online: http://www.ree.es/sites/default/files/downloadable/criterios_proteccion_sistema_1995.pdf (accessed on 30 September 2015). (In Spanish)
- Criterios Generales de Protección de Los Sistemas Eléctricos Insulares y Extrapeninsulares. Available online: http://www.ree.es/sites/default/files/downloadable/criterios_proteccion_sistema_2005_v2.pdf (accessed on 3 October 2014). (In Spanish)
- Ribot, J.; Vaquero, J.; López, S.; Rodríguez, F.; Martínez, J.L.; Lozano, P.; Fernández, C.; Nicolau, G.; Roca, J.M.; Rodríguez, B.; et al. Evolution in the Spanish Power System: New Protection Coordination Criteria and Critical Clearing Time Calculation Methodology; International Council on Large Electric Systems (CIGRE): Paris, France, 2006. [Google Scholar]
- Metodología de Aplicación de los Criterios Generales de Protección de los Sistemas Eléctricos Insulares y Extrapeninsulares. Available online: http://www.ree.es/sites/default/files/criterios_proteccion_sistema_2007.pdf (accessed on 30 September 2015). (In Spanish)
- Liu, C.; Chen, Z.; Bak, C.L.; Liu, Z.; Lund, P.; Ronne-Hansen, P. Transient stability assessment of power system with large amount of wind power penetration: The Danish case study. In Proceedings of the 2012 Conference on Power & Energy IPEC, Ho Chi Minh City, Vietnam, 12–14 December 2012.
- Chowdhury, M.A.; Hosseinzadeh, N.; Shen, W.X.; Pota, H.R. Comparative study on fault responses of synchronous generators and wind turbine generators using transient stability index based on transient energy function. Int. J. Electr. Power Energy Syst. 2013, 51, 145–152. [Google Scholar] [CrossRef]
- Mitra, A.; Chatterjee, D. A sensitivity based approach to assess the impacts of integration of variable speed wind farms on the transient stability of power systems. Renew. Energy 2013, 60, 662–671. [Google Scholar] [CrossRef]
- Morren, J.; de Haan, S.W.H.; Kling, W.L.; Ferreira, J.A. Wind turbines emulating inertia and supporting primary frequency control. IEEE Trans. Power Syst. 2006, 21, 433–434. [Google Scholar] [CrossRef]
- Conroy, J.F.; Watson, R. Frequency response capability of full converter wind turbine generators in comparison to conventional generation. IEEE Trans. Power Syst. 2008, 23, 649–656. [Google Scholar] [CrossRef]
- Ullah, N.R.; Thiringer, T.; Karlsson, D. Temporary primary frequency control support by variable speed wind turbines—Potential and applications. IEEE Trans. Power Syst. 2008, 23, 601–612. [Google Scholar] [CrossRef]
- Keung, P.-K.; Li, P.; Banakar, H.; Ooi, B.T. Kinetic energy of wind-turbine generators for system frequency support. IEEE Trans. Power Syst. 2008, 24, 279–287. [Google Scholar] [CrossRef]
- Brisebois, J.; Aubut, N. Wind farm inertia emulation to fulfill Hydro-Québec’s specific need. In Proceedings of the 2011 IEEE Power and Energy Society General Meeting, Detroit, MI, USA, 24–29 July 2011.
- Björnstedt, J. Integration of Non-synchronous Generation Frequency Dynamics. Ph.D. Thesis, Lund University, Lund, Sweden, 2012. [Google Scholar]
- Gonzalez-Longatt, F. Impact of synthetic inertia from wind power on the protection/control schemes of future power systems: Simulation study. In Proceedings of the 11th International Conference on Developments in Power Systems Protection DPSP 2012, Birmingham, UK, 23–26 April 2012.
- The utilization of synthetic inertia from wind farms and its impact on existing speed governors and system performance. Available online: http://www.elforsk.se/Rapporter/?rid=13_02_ (accessed on 21 January 2014).
- Gevorgian, V.; Zhang, Y.; Ela, E. Investigating the impacts of wind generation participation in interconnection frequency response. IEEE Trans. Sustain. Energy 2014, 6, 1004–1012. [Google Scholar] [CrossRef]
- Papaefthymiou, S.V.; Lakiotis, V.G.; Margaris, I.D.; Papathanassiou, S.A. Dynamic analysis of island systems with wind-pumped-storage hybrid power stations. Renew. Energy 2015, 74, 544–554. [Google Scholar] [CrossRef]
- Yang, Y.; Wei, H.; Zhao, X.; Zhang, Q. Direct critical clearing time calculation based on interior point nonlinear programming. In Proceedings of the 2012 Asia-Pacific Power and Energy Engineering Conference (APPEEC), Shanghai, China, 27–29 March 2012.
- DYNA. El Sistema Eléctrico Español en 2013. DYNA Ing. Ind. 2014, 89, 253. (In Spanish) [Google Scholar]
- Ministerio de Industria, Turismo y Comercio, Gobierno de España. Planificación de los Sectores de Electricidad y Gas 2012–2020. Desarrollo de las Redes de Transporte. Primer Borrador (July 2011). Available online: http://www.minetur.gob.es/energia/esES/Novedades/Documents/PlanificacionElectricidadGas_2012_2020.pdf (accessed on 2 June 2013). (In Spanish)
- Camm, E.H.; Behnke, M.R.; Bolado, O.; Bollen, M.; Bradt, M.; Brooks, C.; Dilling, W.; Edds, M.; Hejdak, W.J.; Houseman, D.; et al. Characteristics of Wind Turbine Generators for Wind Power Plants. In Proceedings of the 2009 IEEE Power & Energy Society General Meeting, Calgary, AB, Canada, 26–30 July 2009.
- Ellis, A.; Muljadi, E.; Sanchez-Gasca, J.; Kazachkov, Y. Generic models for simulation of wind power plants in bulk system planning studies. In Proceedings of the 2011 IEEE Power and Energy Society General Meeting, Detroit, MI, USA, 24–29 July 2011.
- Taveira, N.; Mendonça, A.; Quitmann, E.; Moreira, C.L.; Silva, B.; Moreira, J.; Pereira, C. The connection studies for 1200 MW wind power integration in Portugal. In Proceedings of the 11th International Workshop on Large-Scale Integration of Wind Power into Power Systems as well as on Transmission Networks for Offshore Wind Power Plants, Lisboa, Portugal, 13–15 November 2012.
- Fischer, M.; Schellschmidt, M. Fault ride through performance of wind energy converters with FACTS capabilities in response to up-to-date German grid connection requirements. In Proceedings of the 2011 IEEE/PES Power Systems Conference and Exposition (PSCE), Phoenix, AZ, USA, 20–23 March 2011.
- Lalor, G.; Mullane, A.; O’Malley, M. Frequency control and wind turbine technologies. IEEE Trans. Power Syst. 2005, 20, 1905–1913. [Google Scholar] [CrossRef]
- Sun, Y.-Z.; Zhang, Z.-S.; Li, G.-J.; Lin, J. Review on frequency control of power systems with wind power penetration. In Proceedings of the 2010 International Conference on Power System Technology (POWERCON), Hangzhou, Zhejiang, China, 24–28 October 2010.
- Wachtel, S.; Beekmann, A. Contribution of wind energy converters with inertia emulation to frequency control and frequency stability in power systems. In Proceedings of the 8th International Workshop on Large Scale Integration of Wind Power into Power Systems as well as on Offshore Wind Farms, Bremen, Germany, 14–15 October 2009; Energynautics: Darmstadt, Germany, 2009. [Google Scholar]
- Burra, R.; Ambekar, A.; Narang, H.; Liu, E.; Mehendale, C.; Thirer, L.; Longtin, K.; Shah, M.; Miller, N. GE brilliant wind farms. In Proceedings of the 2014 IEEE Symposium Power Electronics and Machines for Wind and Water Applications (PEMWA), Milwaukee, WI, USA, 24–26 July 2014.
- Taveira, N. Improving the grid compatibility with Enercon wind energy converters. In Proceedings of the Convención Eólica 2010, Madrid, Spain, 15–16 June 2010.
- Ruttledge, L.; Miller, N.W.; O’Sullivan, J.; Flynn, D. Frequency response of power systems with variable speed wind turbines. IEEE Trans. Sustain. Energy 2012, 3, 683–691. [Google Scholar] [CrossRef]
- Merino, J.; Veganzones, C.; Sánchez, J.A.; Martínez, S.; Platero, C.A. Power system stability of a small sized isolated network supplied by a combined wind-pumped storage generation system: A case study in the Canary Islands. Energies 2012, 5, 2351–2369. [Google Scholar] [CrossRef]
- Anderson, P.; Fouad, A. Power System Control and Stability, 1st ed.; The Iowa State University Press: Ames, IA, USA, 1977. [Google Scholar]
© 2015 by the authors; licensee MDPI, Basel, Switzerland. This article is an open access article distributed under the terms and conditions of the Creative Commons by Attribution (CC-BY) license (http://creativecommons.org/licenses/by/4.0/).
Share and Cite
Medina-Domínguez, E.J.; Medina-Padrón, J.F. Critical Clearing Time and Wind Power in Small Isolated Power Systems Considering Inertia Emulation. Energies 2015, 8, 12669-12684. https://doi.org/10.3390/en81112334
Medina-Domínguez EJ, Medina-Padrón JF. Critical Clearing Time and Wind Power in Small Isolated Power Systems Considering Inertia Emulation. Energies. 2015; 8(11):12669-12684. https://doi.org/10.3390/en81112334
Chicago/Turabian StyleMedina-Domínguez, Elías Jesús, and José F. Medina-Padrón. 2015. "Critical Clearing Time and Wind Power in Small Isolated Power Systems Considering Inertia Emulation" Energies 8, no. 11: 12669-12684. https://doi.org/10.3390/en81112334
APA StyleMedina-Domínguez, E. J., & Medina-Padrón, J. F. (2015). Critical Clearing Time and Wind Power in Small Isolated Power Systems Considering Inertia Emulation. Energies, 8(11), 12669-12684. https://doi.org/10.3390/en81112334