Article

Photovoltaic Systems with and without Radiation Concentrators for Temperate and Tropical Regions

by
Vania Reis de Souza Sant’Anna
1,†,
Delly Oliveira Filho
1,*,†,
Miguel Angel Egido
2,
Aristides Ribeiro
1,†,
Adílio Flauzino Lacerda Filho
1,† and
Augusto Cesar Fonseca Ferreira
1,†
1
Agricultural Engineering Department of the Federal University of Vicosa, Vicosa 36570-900, Brazil
2
Instituto de Energia Solar, Universidad Politécnica de Madrid, Avenida Complutense s/n, Madrid 28040, Spain
*
Author to whom correspondence should be addressed.
These authors contributed equally to this work.
Energies 2015, 8(11), 12505-12529; https://doi.org/10.3390/en81112316
Submission received: 13 May 2015 / Revised: 22 September 2015 / Accepted: 14 October 2015 / Published: 4 November 2015
(This article belongs to the Special Issue Perovskite-Based Solar Cells)

Abstract

:
The industrial development of solar photovoltaic technology has attracted investors and influenced governments to establish public policies for the sector. The present research consisted of studying, building and testing low concentration solar radiation systems for photovoltaic energy conversion. The study used optical nonimaging parameters for the V-trough type radiation concentrator constructed of anodized aluminum, to reflect and to cool. Designed to concentrate radiation by about two times and consisting of a set of photovoltaic modules connected in parallel, they were modeled in the Laboratory of Energy Area in the Department of Agricultural Engineering of the Federal University of Vicosa, Brazil, at the coordinates 20°45′14′′ S latitude, 42°52′53′′ W longitude and altitude 648.74 m. They were installed to the geographic North, with the same slope as the local latitude. For comparative analysis, it was determined the electrical characteristics for evaluation of the prototype’s performance with and without radiation concentration, the final productivity for cities in tropical and temperate regions and economic analysis for the system. It was concluded that the prototypes allowed for a gain of energy with concentration, about 31.3% more, and therefore a productivity gain for the analyzed cities in, kWh·kWp−1.

Graphical Abstract

1. Introduction

The industrial development of solar photovoltaic technology has attracted investors and for several governments they are a priority in terms of public policies. According to the International Energy Agency, the forecast demand for photovoltaic systems is expected to grow considerably in the following years, from 21 GW in 2011 to 126 GW in 2020, there is around 22.0% per year. This analysis encompassing regional and global trends shows a greater increase of clean energy in comparison with fossil fuel-based technologies [1,2,3].
It is estimated that photovoltaic (PV) systems will supply 16% of the world demand by 2050, reducing CO2 equivalent emissions to the atmosphere by 2300 million ton per year. This will occur if there is technology development, cost reduction and industrial production increase for mass use in the next decade. There is also the perspective that the system might become competitive with the power network in some regions by 2020 [2].
The Brazilian normative resolution 482, of 17 April 2012, of the Electrical Energy State Regulatory Agency-ANEEL established the net metering tariff system, i.e., the energy consumed by a consumer could be compensated by the electrical energy generated. This resolution also established necessary technical adaptations in electricity distribution of the National Electric System and in consumer units to reduce investment cost of the systems to be introduced [4,5,6,7,8].
Solar photovoltaic generator with flat-plate radiation concentrators or lenses (Fresnel lenses, for example), constitute a technical alternatives, as they may easily exceed 20% in energy conversion efficiency. The V-trough concentrator has been used to concentrate solar radiation to the photovoltaic module, assuring an attractive cost-benefit ratio [9,10,11].
Integrated radiation concentrator optics for photovoltaic systems (optical nonimaging) has been used to evaluate the focusing of light. It has as a reference light source and not an object, a receiver and not an image, a concentrated irradiance at the receiver (PV module/absorber) and not the source image. Designed for two-dimensional optical photovoltaic systems, it is useful for radiation concentration factors less than 10. Some of the important characteristics of this type of solar radiation concentrators are: (i) they do not require solar tracking; (ii) they are designed as a function of the dimensions of the PV modules; (iii) they require a simple framework to support them and; (iv) they are considered to be of low production cost. Although require precision in their installation, they are not influenced by spectral impacts as with systems with radiation concentration in the range of 100 to 1000 [10,11,12,13,14,15].
Studies of the solar radiation concentration systems should evaluate the influence of geographic and climatological location, uniformity of radiation reaching the PV modules and the radiation concentration ratio, among other important aspects for the performance of the system [11,16].
The main purpose of this study was to simulate, construct and evaluate both energetically and economically the performance of photovoltaic systems with optical concentrator systems for solar radiation concentration of about two times, installed in regions of temperate and tropical climates.

2. Material and Methods

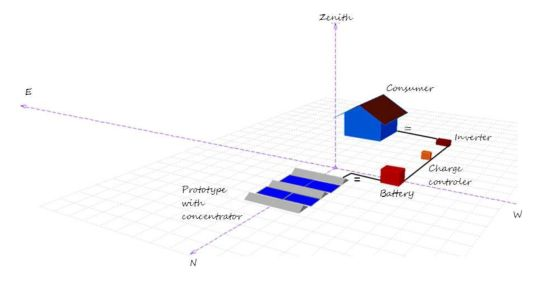
The simulations and experiments were performed at the Energy Area Laboratory in the Department of Agricultural Engineering of the Federal University of Vicosa, Vicosa (MG, Brazil) at 20°45′14′′ S latitude, 42°52′53′′ W longitude and 648.74 m altitude.

2.1. Material

The prototype built for this study was composed of six Kyocera Solartec KS5 PV modules (Kyocera Solar of Brazil, Rio de Janeiro, RJ, Brazil), produced with multi-crystalline cells. The power rating of each PV module was 5 Wp, with 580.8 cm2 module area (35.2 cm length and 16.5 cm width) and floor plan area used for each prototype of 1.04 m2 [17].
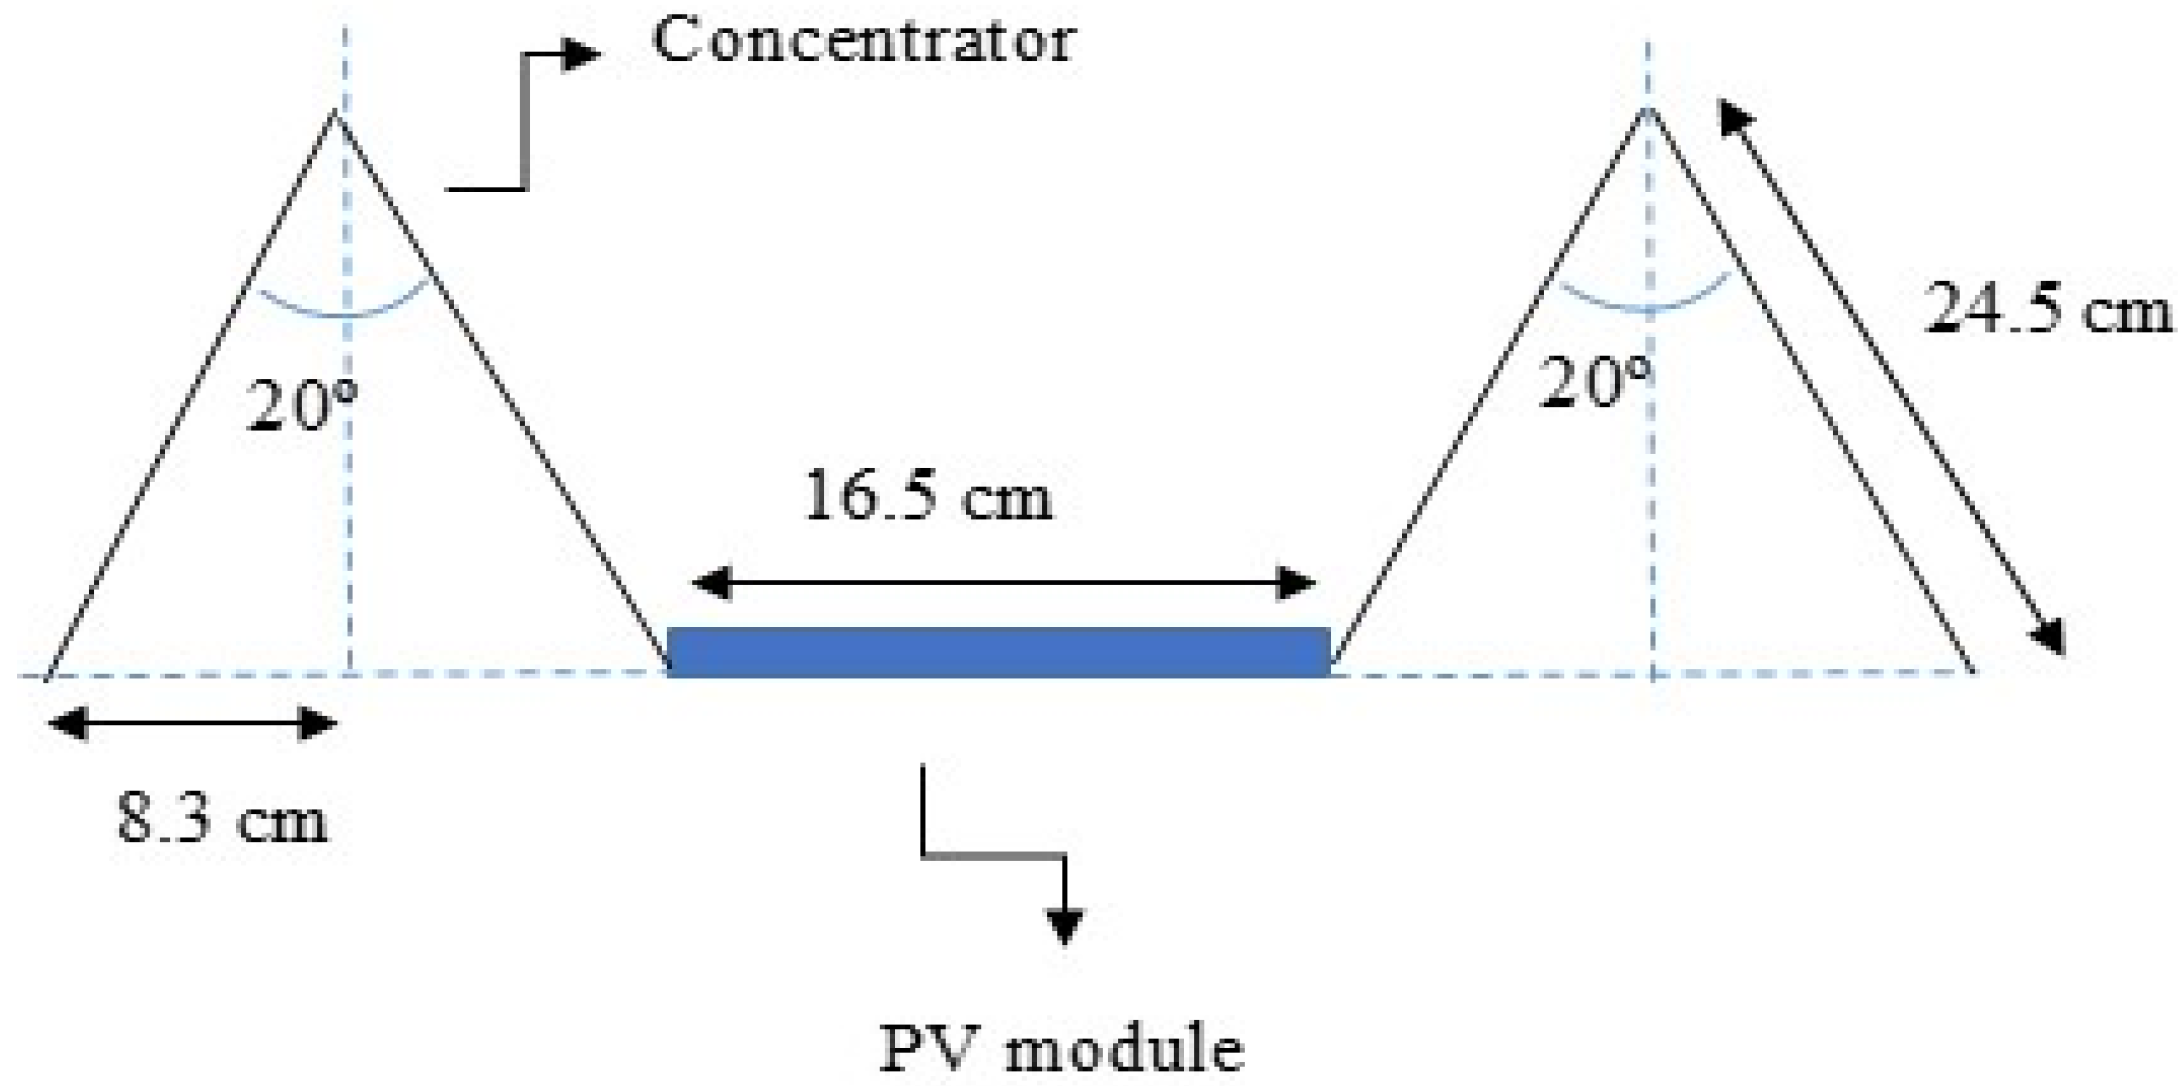
The concentrator model selected, 
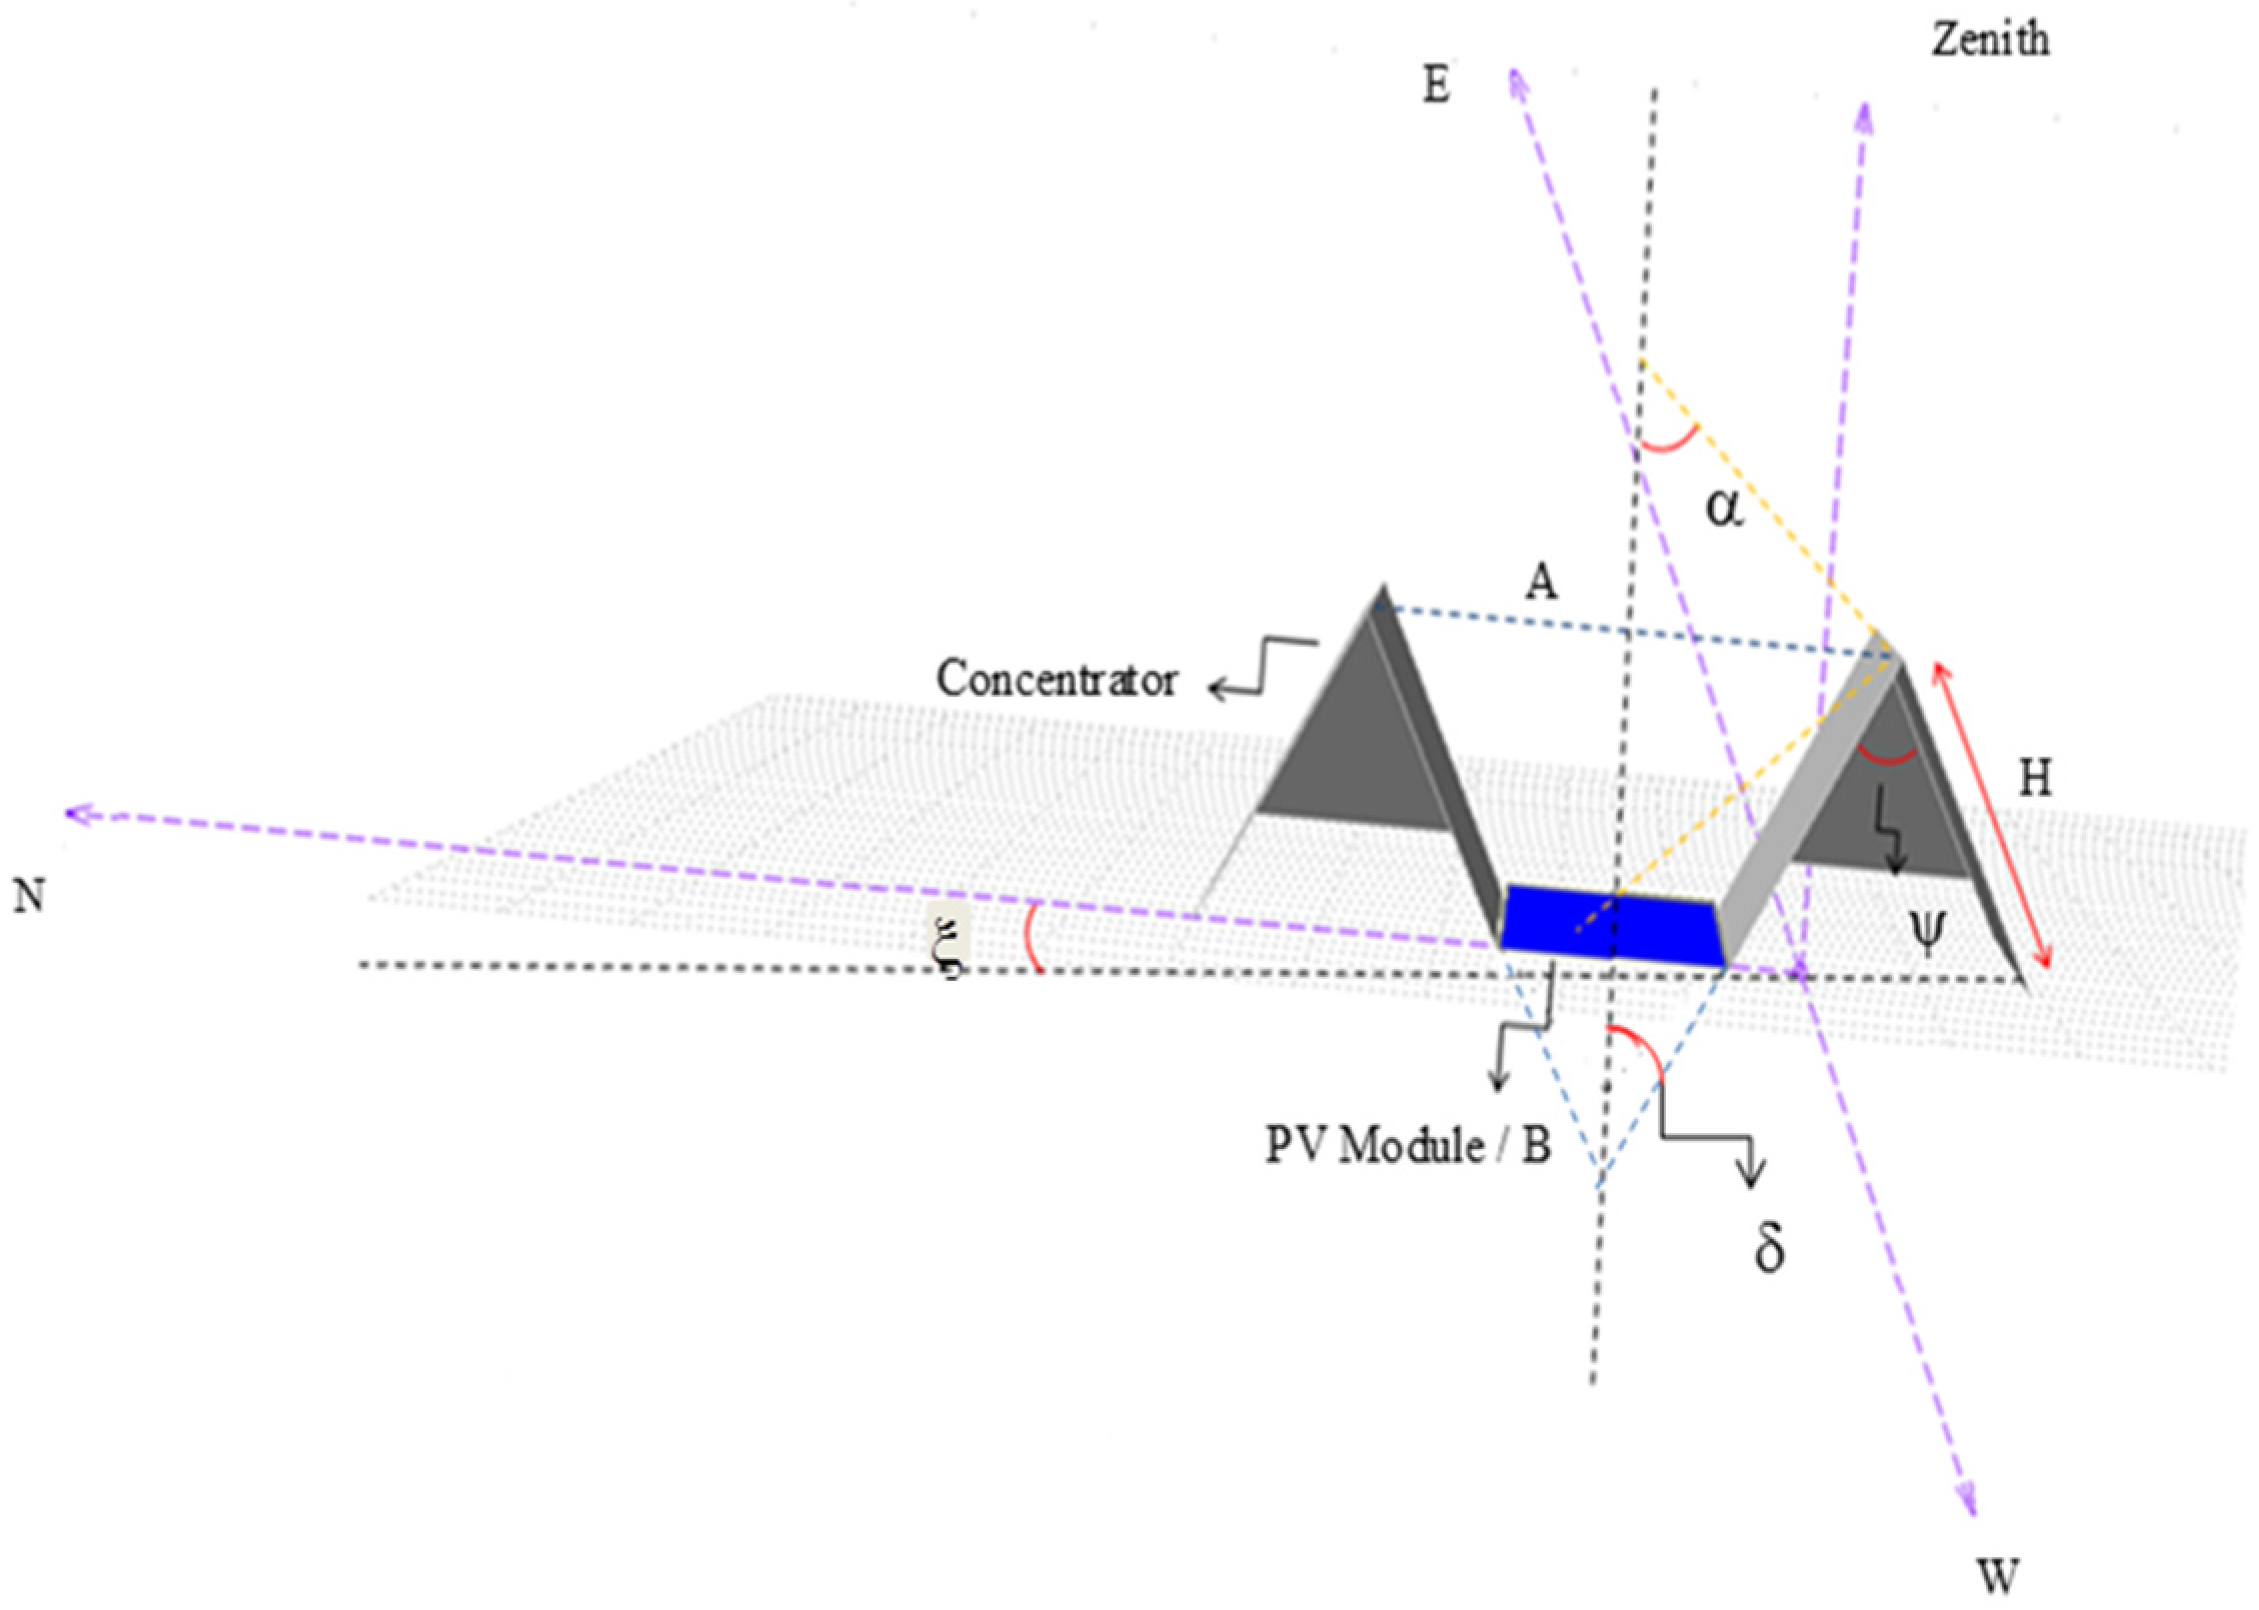
Figure 1, was used because: (i) it was considered the most energetically efficient; (ii) it is a fixed system with possibility of seasonal alignments for greater performance; and (iii) is appropriate for low radiation concentration.
Figure 1. V-trough radiation concentrator illustrating the project parameters.
Energies 08 12316 g001
In Figure 1, α is the acceptance angle, ψ is the channel angle, A is the collector-opening width, B is the PV module/absorber base width, H is the length of the side of concentrator, δ is the opening angle of the V-troughs and ξ is the prototype inclination [18,19,20].
Table 1 lists the physical characteristics of the prototypes.
The PV system was built using specular anodized aluminum mirrors (Lucchi, Sao Paulo, Brazil) with 0.3 mm thickness, 86% total reflection TR 2, 12% diffuse reflection and low iridescence [21].
Pyranometers were used for measurement of global solar radiation on horizontal and inclined planes, CMP3 model (Campbell Scientific, Logan, UT, USA), with frequency bands of light spectrum between 310 to 2800 nm, [22].
Table 1. Physical characteristics of the V-trough type prototype with and module or prototype without radiation concentrators.
ParameterPrototype with Concentrator (PWC)Prototype without Concentrator (PWoutC)
Dimension of cell area in the module, length × width (m)0.165 × 0.3520.165 × 0.352
Number of modules61
Dimension of a module (m)0.205 × 0.352 × 0.0220.205 × 0.352 × 0.022
System area (m2)0.348480.05808
System weight (modules, and concentrator) (kg)~8~1.2
Mirror area of system concentrator (m2)~1.5
A potentiometer (0 to 100 Ω) was used as load for generation determination of current signal and voltage. A prototype with radiation concentrator (PWC) was used for the load variation in field test, while a system without radiation concentrator (PWoutC) was used as the standard.
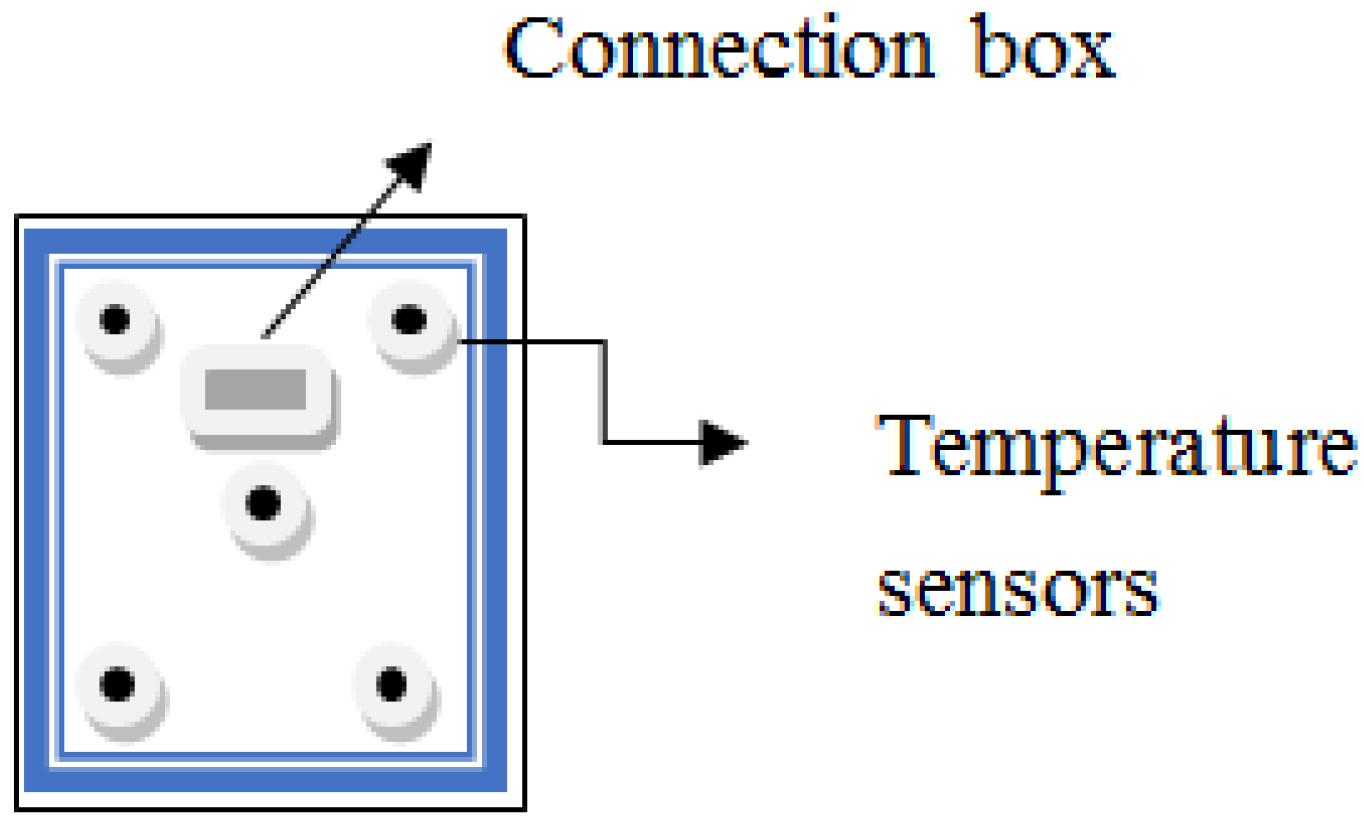
The thermal image of the studied PV systems was recorded using an infrared i-series high resolution, thermo-graphic camera (Flir Systems, Portland, OR, USA) with 0.1 °C thermal sensibility at 25 °C [23]. The temperature of the concentrators, on the front and back parts of the modules was also measured with a portable digital thermometer, model Kiltherm 500 (Cotergavi, Santa Cecilia, Sao Paulo, Brazil) [24].

2.2. Instrumentation

To evaluate the behavior of the PV modules, instrumentation was carried out using 1-wire™ technology (Dallas Semiconductor, Dallas, TX, USA). A portable weather station connected to a microcomputer through 1-Wire/USB adapter was used, measuring the following variables: (i) PV module temperature at five different points, PV module current and voltage and (ii) meteorological variables (wind speed, ambient temperature, relative humidity and solar radiation). Data acquisition occurred from 28 August 2010 to 28 September 2010. Five sensors were attached to the back of the PV modules according to the Figure 2, in order to record the temperature.
Figure 2. Location of temperature sensors in the back of the PV modules.
Energies 08 12316 g002

2.3. System Assembly and Methodology

The prototype was developed in two stages: concentrators were dimensioned according to size of the selected PV module, followed by determination of channel inclination angle. The mirrors were then cut and folded to the proposed form for a radiation concentration ratio of nearly two, and for system cooling which allows atmospheric air convection.
The prototype design considered values for PV module width (B), reflector inclination height (H) and cells area, so that the set volume was the smallest possible.
Solar energy concentration and the sizes of the concentrator for the selected model are described by Equations (1) and (2), in accordance with [18]:
C =   sin [ ( 2 n   +   1 )   ψ + α ]   sin ( ψ   +   α )
H B =   sin [ ( 2 n   +   1 )   ψ + α ]     sin ( ψ   +   α )   2 sin ( ψ   +   α ) sin ( ψ )
where C, solar radiation concentration, decimal; n, series of reflections from reflector before reaching radiation PV module, decimal; ψ, channel angle, (°); α, acceptance angle, (°); H, length of the side of concentrator, m; and B, PV module or absorber width, m.
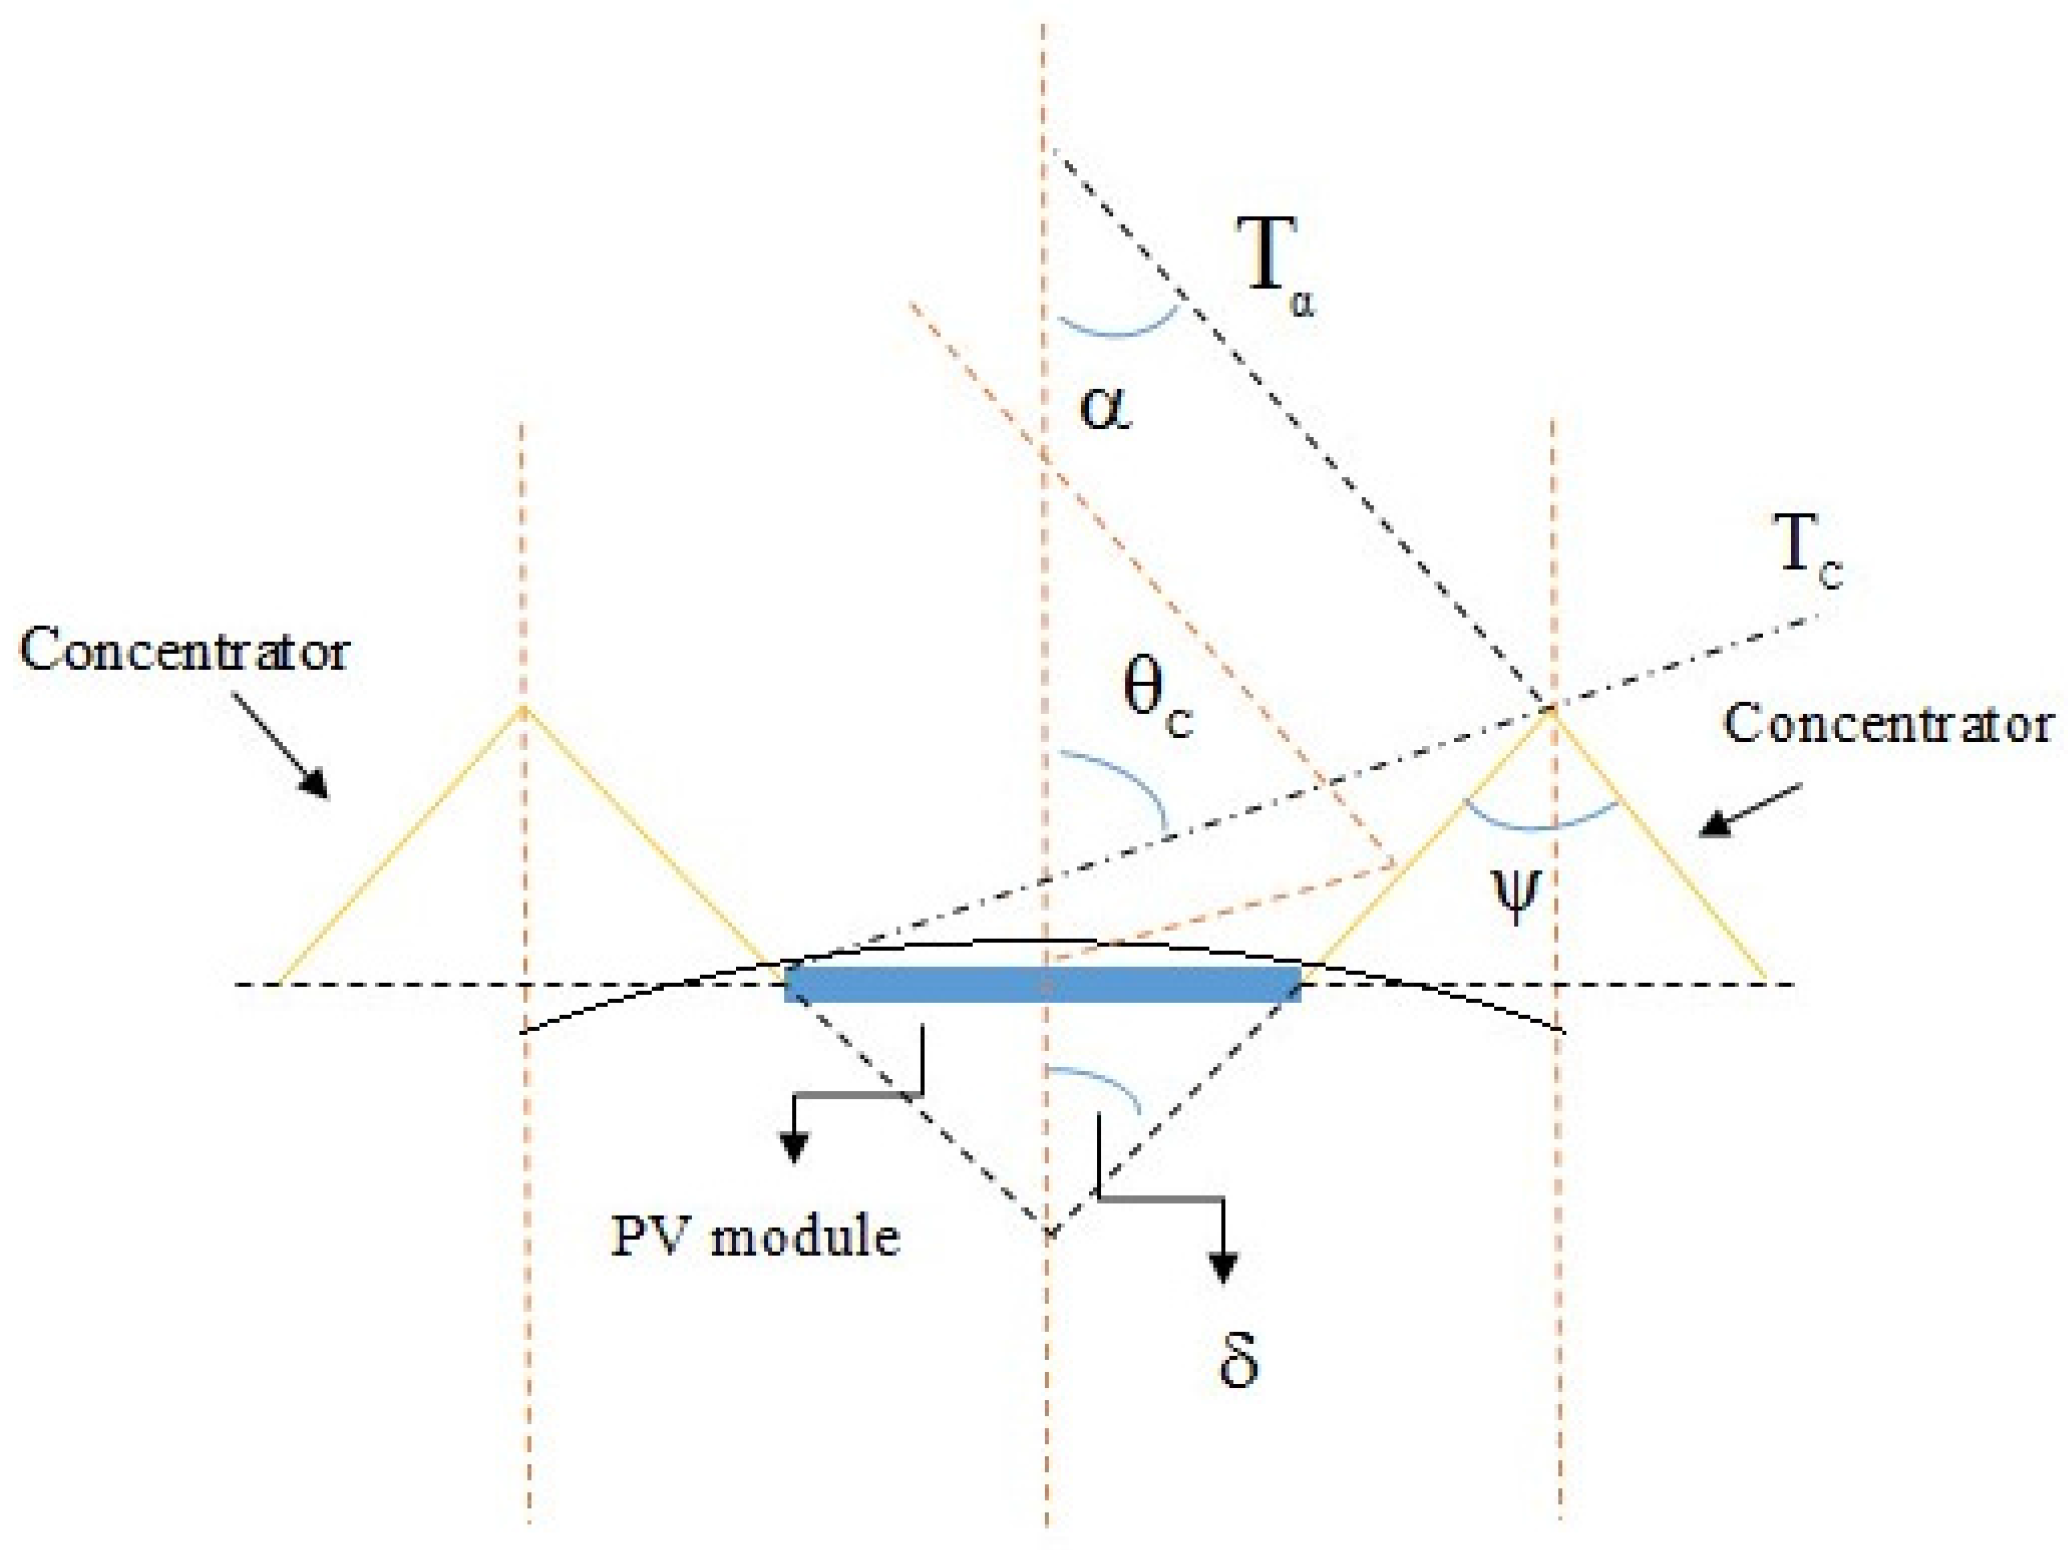
Figure 3 illustrates the incidence of solar radiation on concentrators and other optical and geometrical characteristics to be considered in PV systems with radiation concentration.
Figure 3. Relationships among θc (angle beyond which the solar radiation does not reach the PV module), α (acceptance angle), ψ (angle channel), δ (light cone angle) and the tangents Tα and Tc.
Energies 08 12316 g003
The PV module, according to studies developed by [14,15,19,25], must be positioned between two concentrators, thus receiving a higher intensity of reflected radiation from each. The number of radiation reflections varies according to the radiation angle of incidence, where θc is the rejection angle, α is the acceptance angle, δ is the opening semi-angle and the tangents Tα and Tc are drawn for the circle passing through the extremities of the PV module. Figure 3 characterizes the PV system with radiation concentrators [13,15,25].
The sizing of the radiation concentrator was done by performing the following:
(i)
Determine the solar radiation acceptance angle incident on the PV module; α;
(ii)
Evaluate direct and reflected solar radiation, incident on the PV modules; and
(iii)
Determine the angle from which reflectors stop reflecting, i.e., angle from which the PV module no longer receives solar radiation, θc.
For determination of angles α and θc, the following procedure is assessed:
(i)
Tangents Tα and Tc are drawn for the circle passing through the extremities of the PV module;
(ii)
Opening semi angle is determined, defined as that perpendicular to the PV module by the reference circle circumference; and
(iii)
The angles α and θc are obtained from Tα and Tc, as indicated in Figure 3.
The relationship between α, acceptance angle, radiation incident on the PV module and θc, rejection angle, angle from which the PV module no longer receives solar radiation, is given by Equation (3), according to [15]:
θc =  α + 2 δ
where θc is the ejection angle, angle from which the PV module no longer receives solar radiation, (°); α is the acceptance angle, radiation incident on the PV module, (°); and δ is the opening semi-angle, (°).
The relationship between the angular acceptance α and θc, as cited by [15], necessary to avoid radiation losses requires that α + δ < π/2 and ϕ < π/4, with values |θin| < α. It was noticed that as the angular acceptance decreases, the value of the angle at which the reflectors stop reflecting, θc, increases, indicating that the PV module will not receive any more radiation on its surface.
It is important to observe the following characteristics of the radiation concentrator [15,25]: factor of radiation concentration, acceptance angle (for lower values, higher concentrations), sensibility to concentrator alignment errors (which may lead to non-uniform radiation of PV module), concentrator area and mean reflection number.
The 1.077 m × 2.258 m aluminum structure was built so that the PV modules with concentrators were arranged in such a way that the channel angle was maintained.
The concentrator design has the following characteristics:
i)
Solar radiation concentration ratio on surface of the PV module/absorber of approximately two, i.e., the concentration factor, C, was around two;
ii)
Use of specular aluminum with high reflection coefficient rate, exceeding 86%;
iii)
Assembly of the PV module and concentrator set forming channels or ducts that allow air circulation, in order to permit passive cooling of the PV module and concentrator set; and
iv)
Need for seasonal positioning adjustments, to avoid shading.
According to [
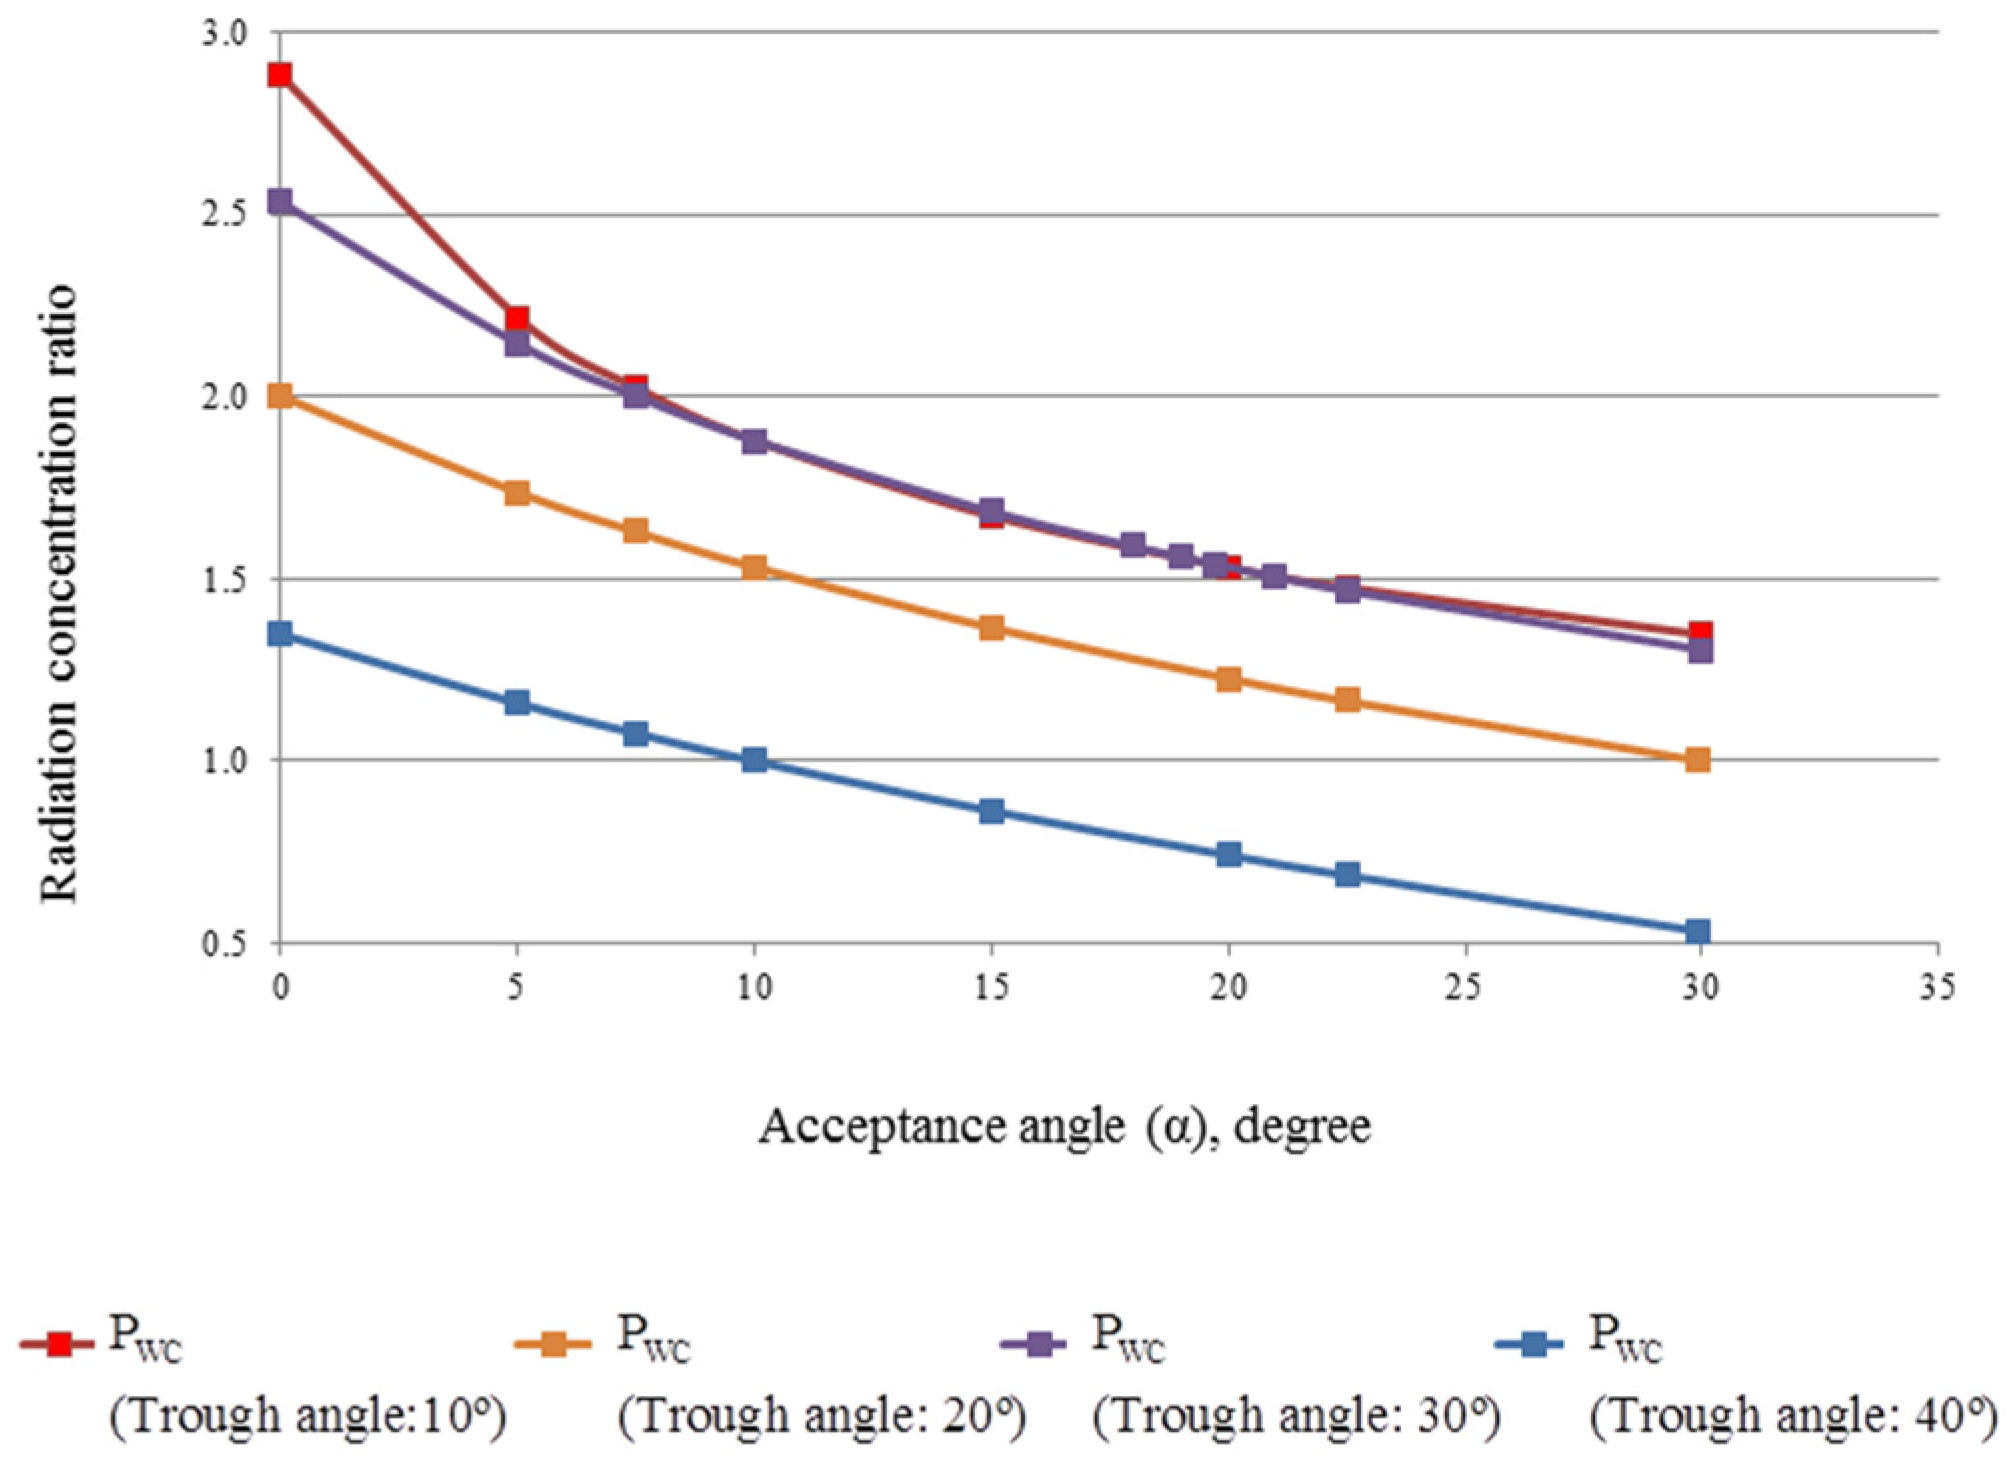
18] radiation and reflection uniformity losses should be observed, which vary according to the channel design. For channel angles lower than 20°, solar radiation incidence on the absorbing surface is not uniform and requires a larger area for the concentrator; however, greater energy conversion efficiency is obtained in comparison with channel angles higher than 40°.
Selection of the concentrator geometrical characteristics was performed based on determination of the maximum yield of solar radiation conversion into electric energy by the PV module and concentrator set. The characteristics of the concentrators compared were: PV module width (B), length of the side of concentrator (H) and trough angle that are given by Equations (1) and (2).
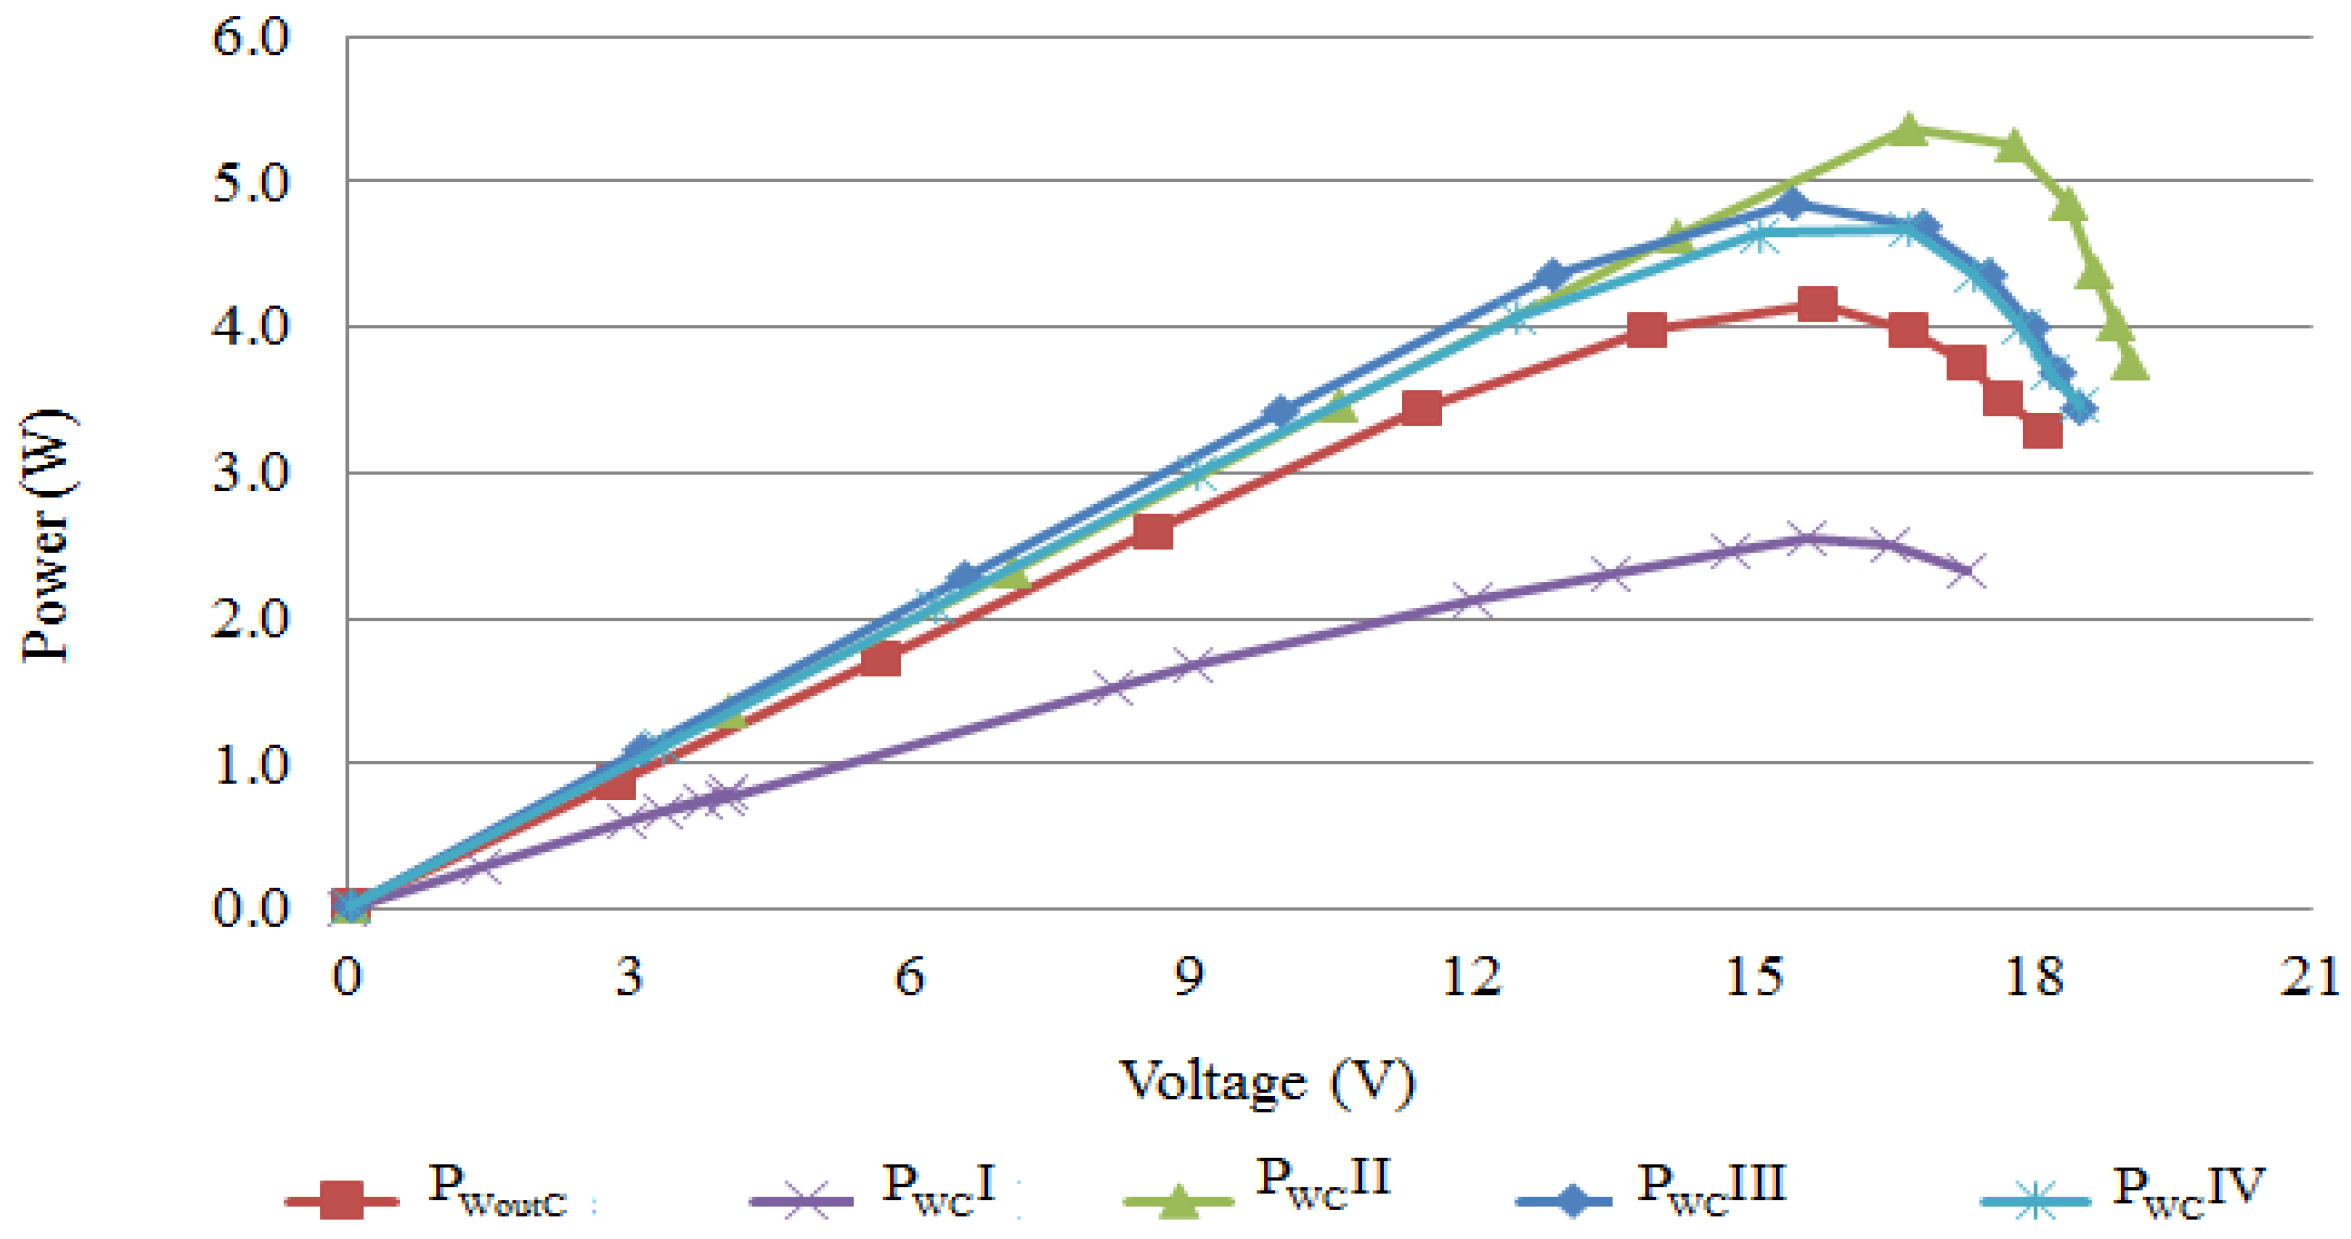
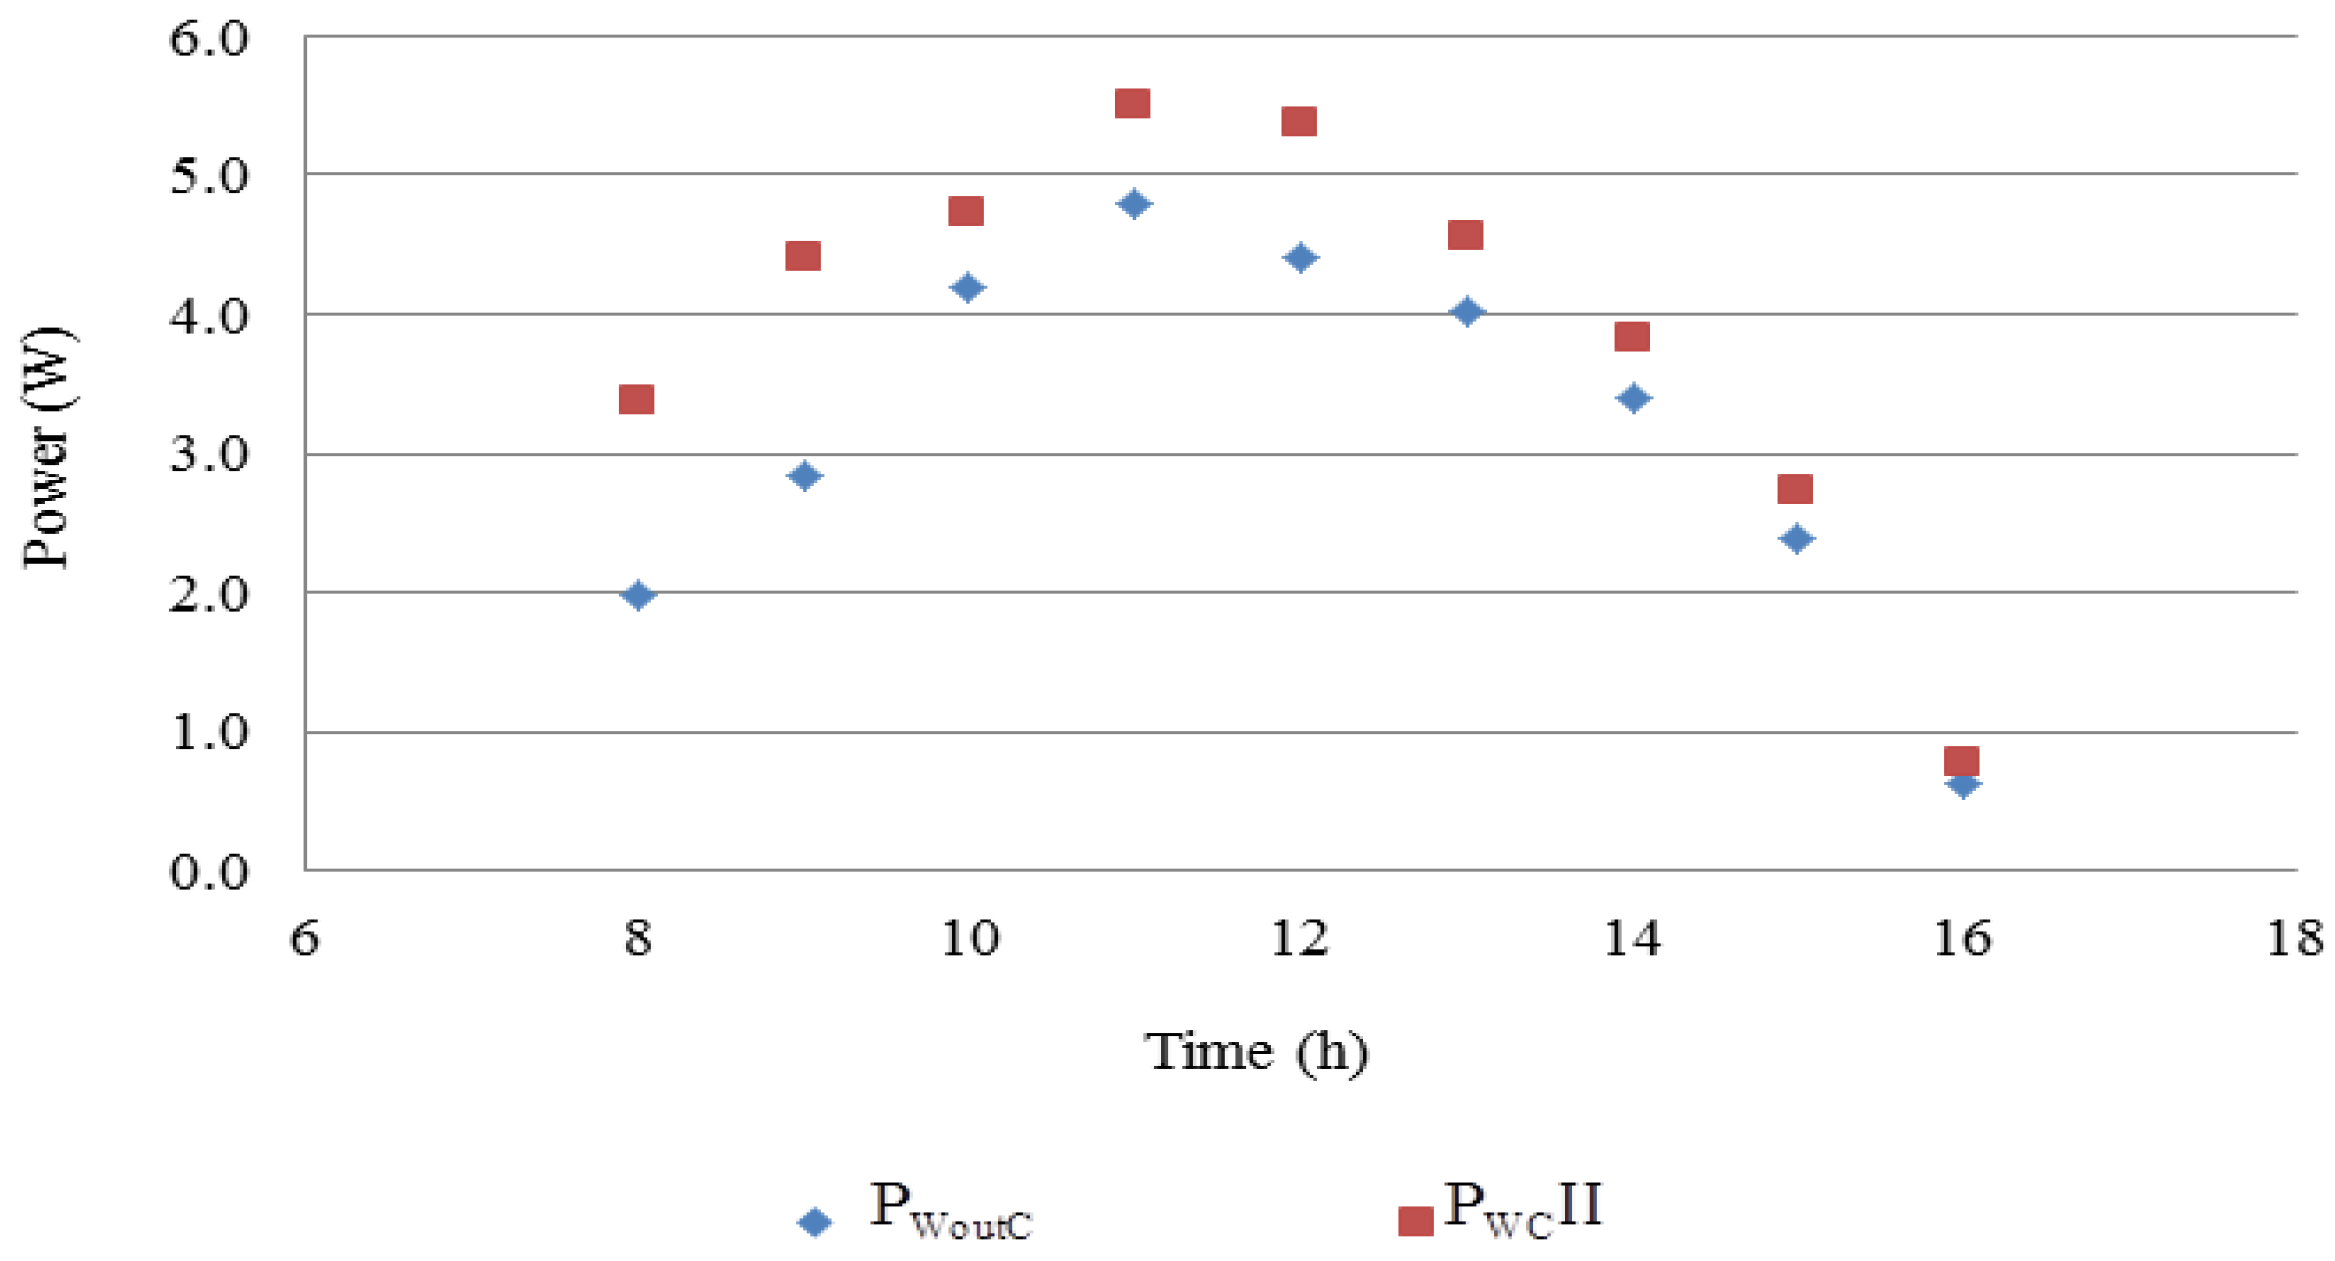
The studied trough angles were 10°, 20°, 30° and 40°. The concentrators built with these angles were denominated PWC I, PWC II, PWC III and PWC IV, respectively. For each built concentrator model characteristic curves were determined, i.e., voltage versus current curve for each radiation concentrator and solar PV module set.
Reflection originating from a mirror or reflecting surface, used as optical mechanism to concentrate solar energy, depends on the incident light wave length, material used for reflection, surface conditions and incidence angle. The characteristic quality parameters are reflectance, roughness, undulation, form and alignment. External agents that may cause changes to the expected results of these systems are temperature, solar radiation and wind [13,14,26].
According to [19,25,26], two conditions should be met: the concentrator must be ideally specular so that the PV module is uniformly radiated, maximizing PV module efficiency and no ray should suffers more than one reflection so not to lose energy intensity from solar radiation. The relationship between incident radiation, Rinc, and the normal radiation intensity on the concentrator surface, Rnor, is given by Equation (4), [15]:
R i n c =   R n o r + 2 R n o r   × γ   × cos δ
where: Rinc, incident radiation, W·m−2; Rnor, normal radiation intensity on the concentrator surface, W·m−2; and γ, reflectivity of side wall reflectors in the V-troughs, decimal.

2.4. Performed Tests

In the present study, preliminary tests were carried out with clear sky conditions, cloudless. The ambient temperature, solar radiation and wind speed conditions met the requirements determined for standard test conditions, i.e., solar radiation around 1000 W·m−2, ambient temperature around 25 °C and wind speed around 1.5 m·s−1 [27].
The prototype with concentrator, PWC, was exposed to radiation with data acquisition every one minute for voltage, PV module temperature, solar radiation on horizontal and inclined plans, rainfall, wind direction and speed and relative humidity. The sampling period presented in this study was five randomly chosen days from the collected data that met the standard test conditions.
Determination of the moments for the preliminary tests considered the period when the optical air mass was 1.5 AM. This procedure was performed in order to reduce the influence of spectral distribution of solar radiation incident on the absorbing surface on the results [28]. The SunPlot 3D Program was used to determine the preliminary test moments. This program is part of the package Solar Design Studio 5.0®, Maui software® (Maui Solar Energy Software, Gaithersburg, MD, USA). The input data to determine the solar hour, azimuth and prototype inclination regarding the horizontal plane for realization of tests were the test dates, latitude and longitude of the location.
Characteristic current/voltage (I × V) and power/voltage (P × V) curves were determined with the collected data, using a potentiometer, voltmeter, ammeter and global radiation sensors (pyranometer) [
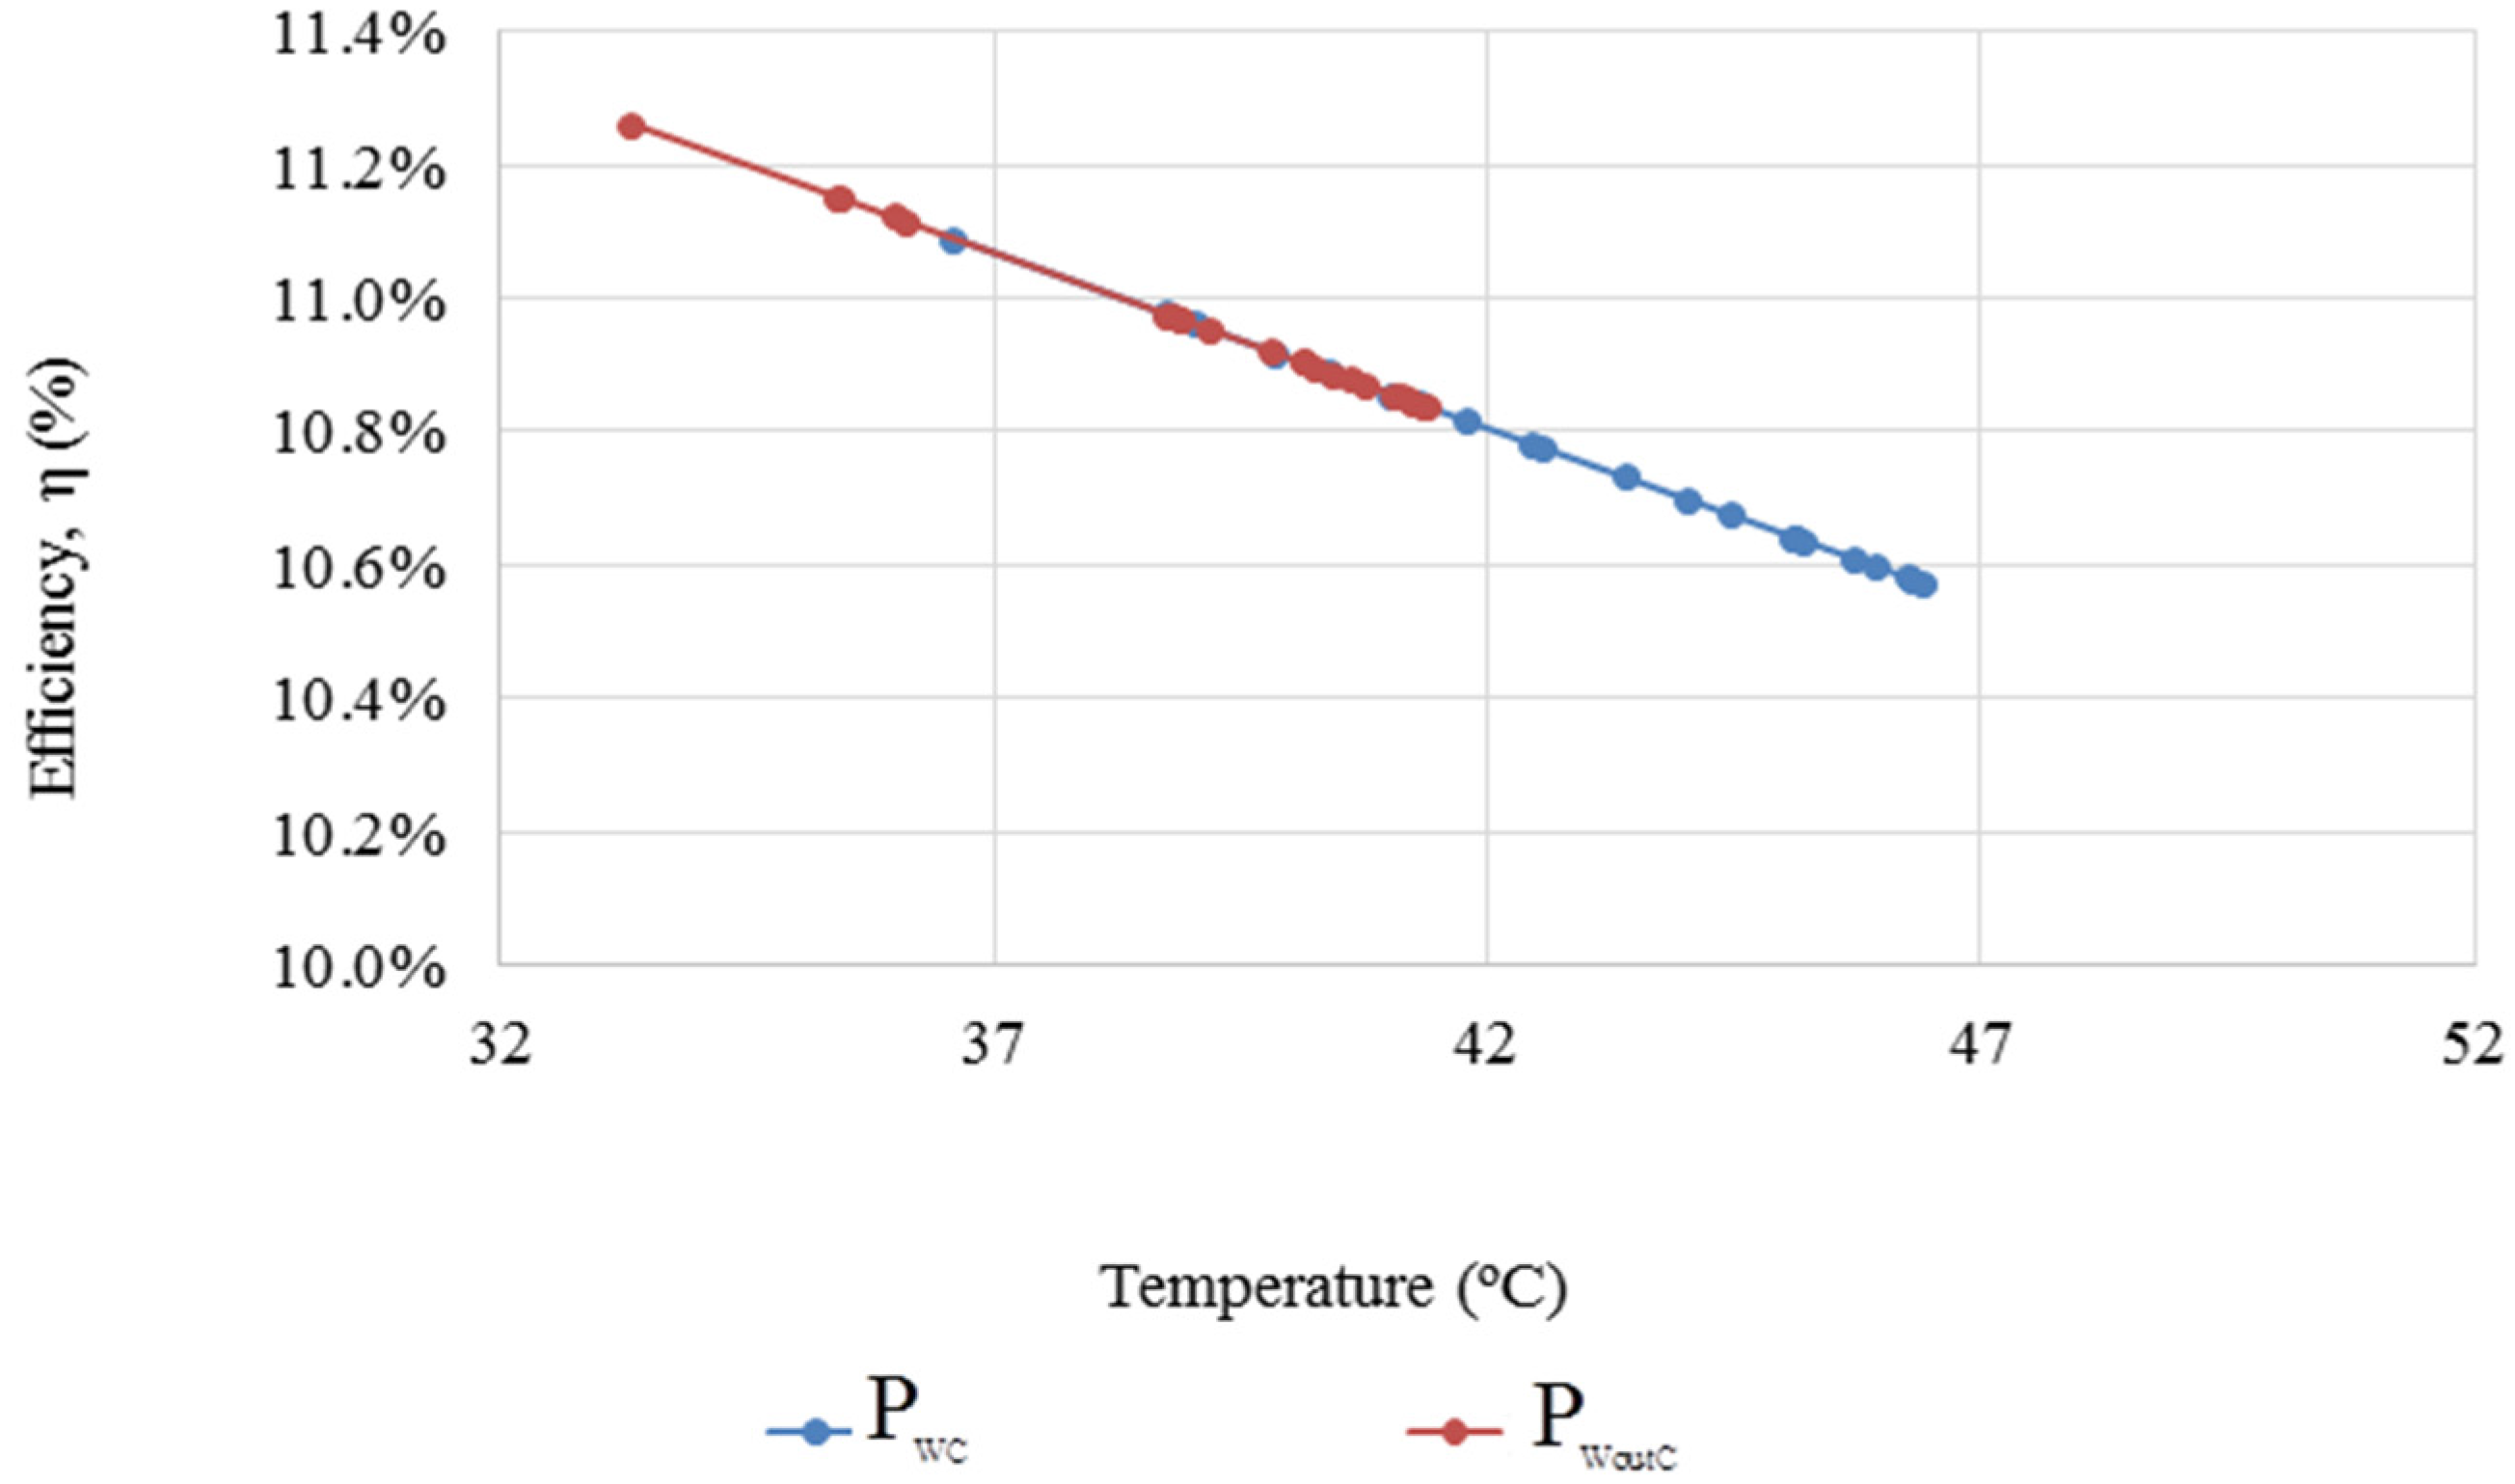
27]. The relationship between solar radiation conversion efficiency into electric energy and the PV module temperature was determined by Equation (5) (where * means nominal conditions) [9]:
η e l   =   η r e f   [ 1     β ( T M o d u l e     T r e f * )
where: ηel, efficiency of solar into electric energy, %; ηref, efficiency of solar into electric energy at reference temperature, %; β, temperature coefficient, °C−1; TModule, PV module temperature, °C; and Tref reference temperature, 25 °C.
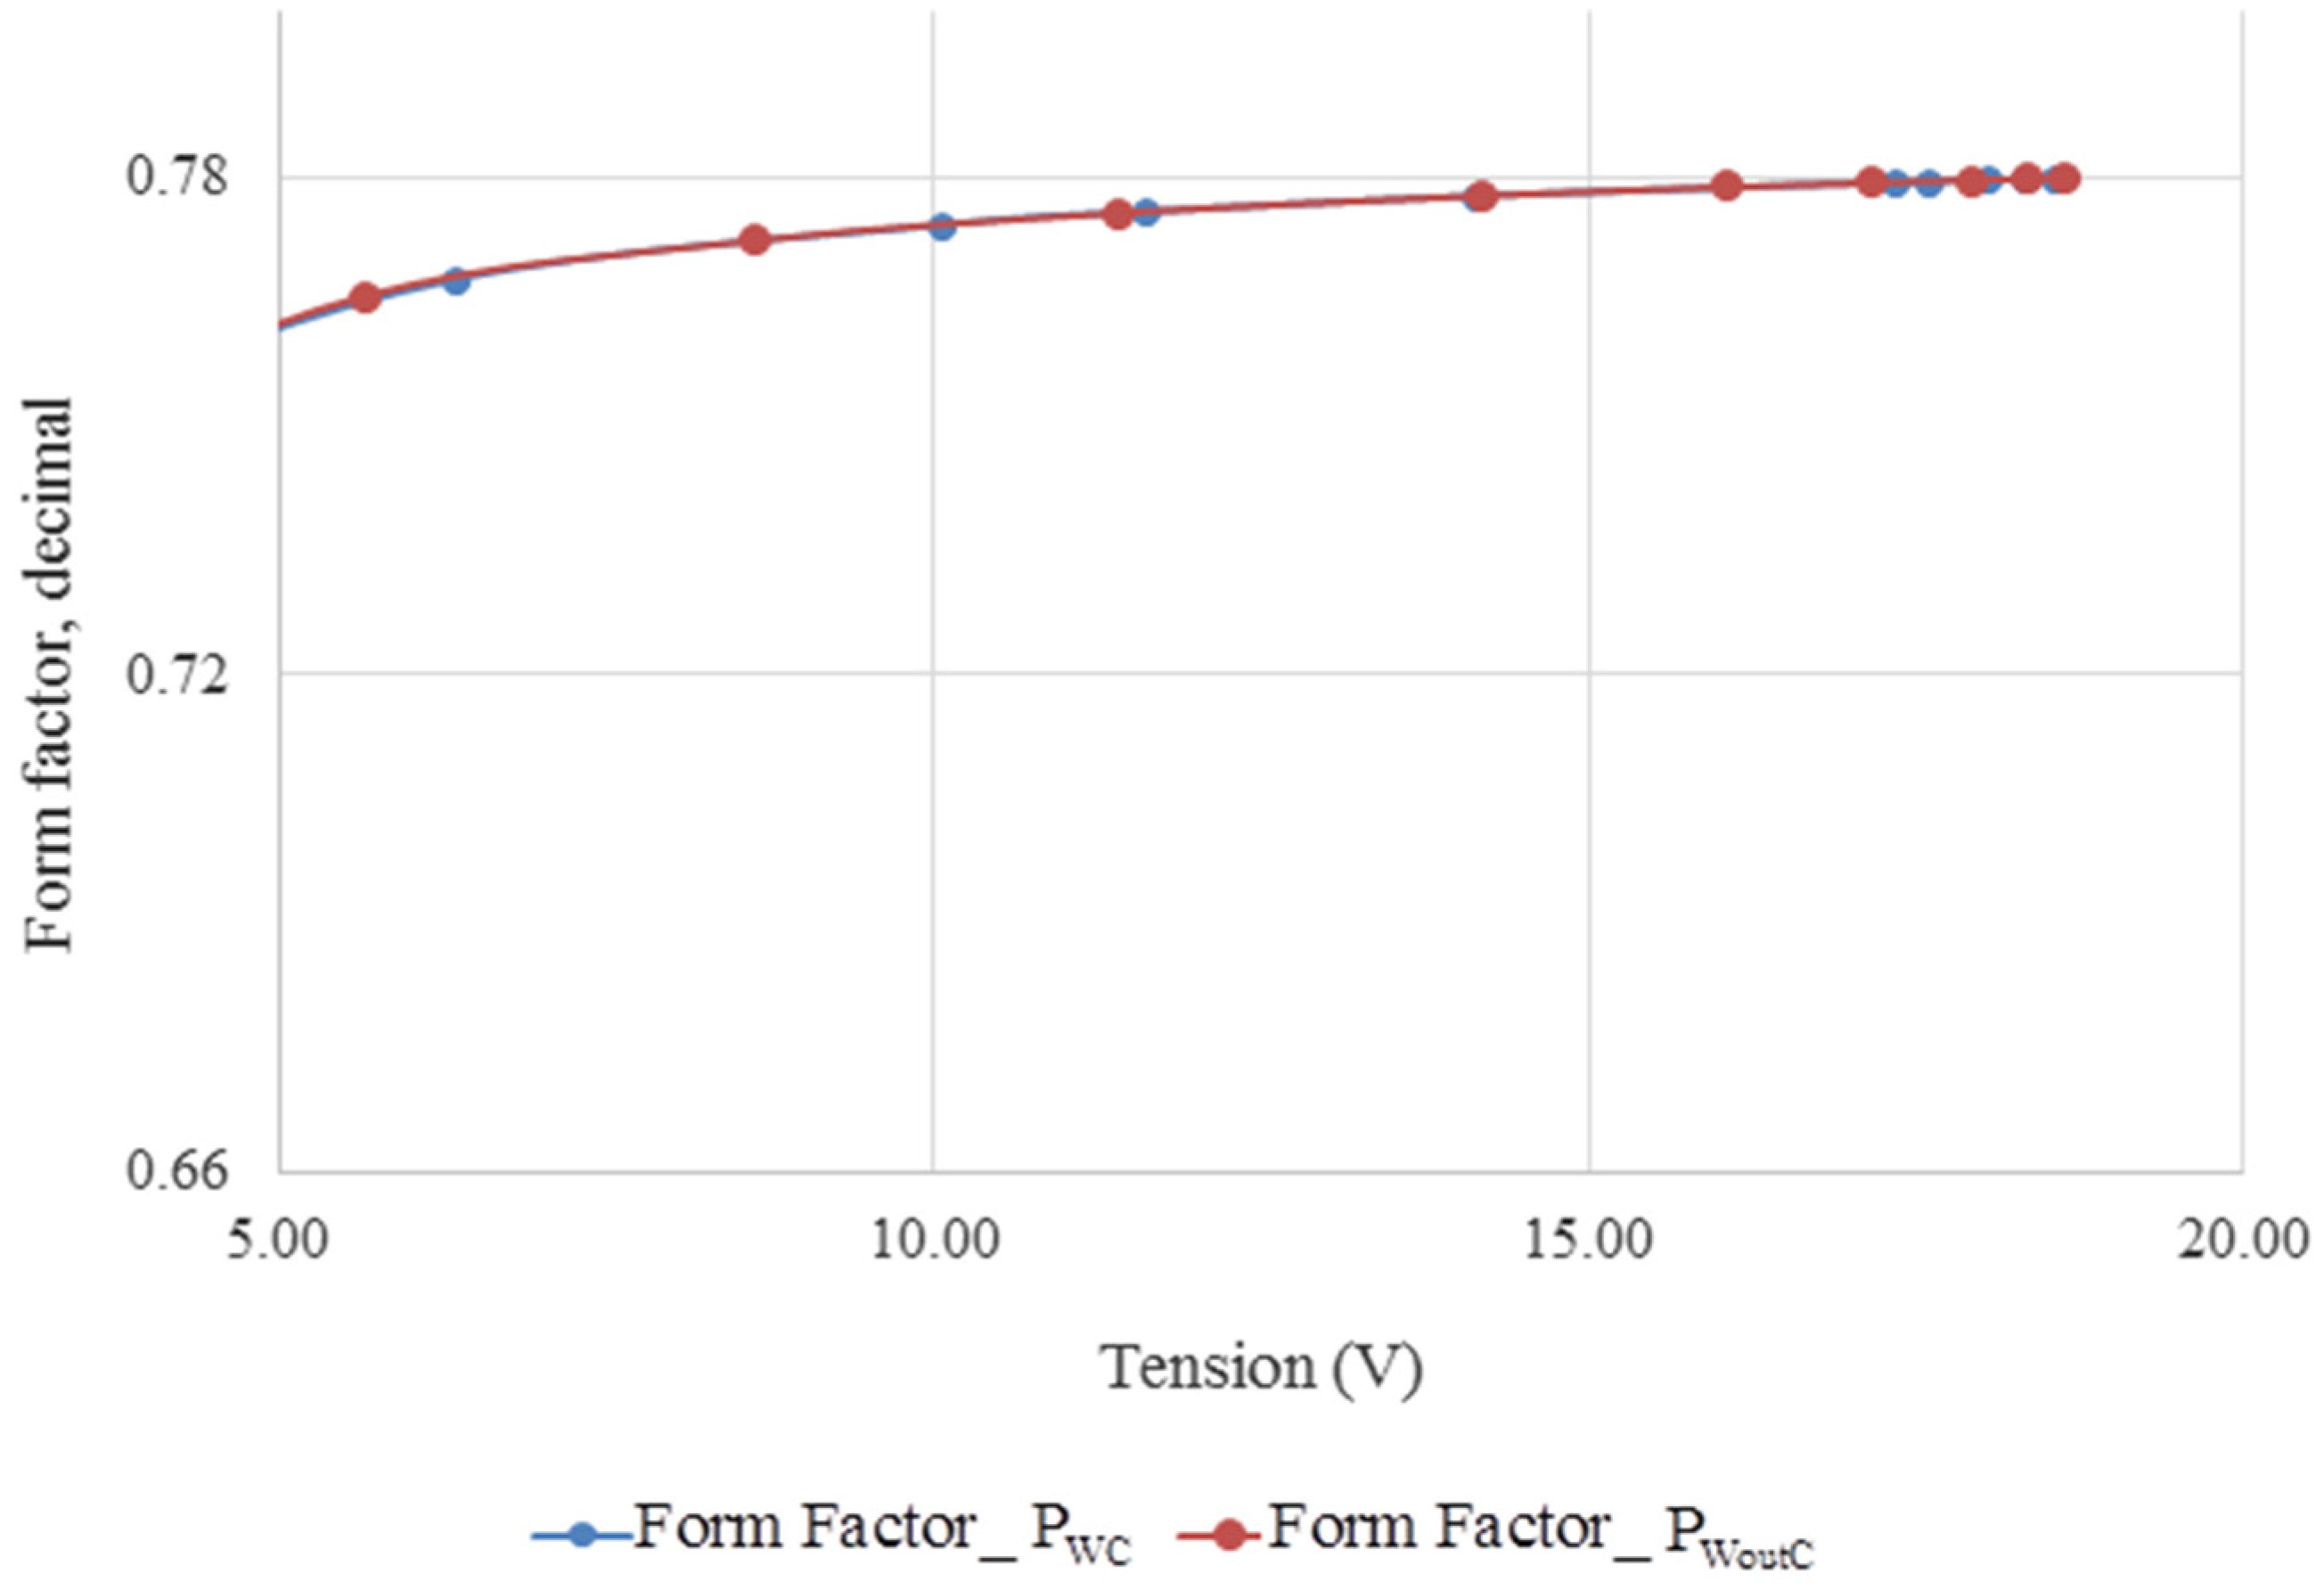
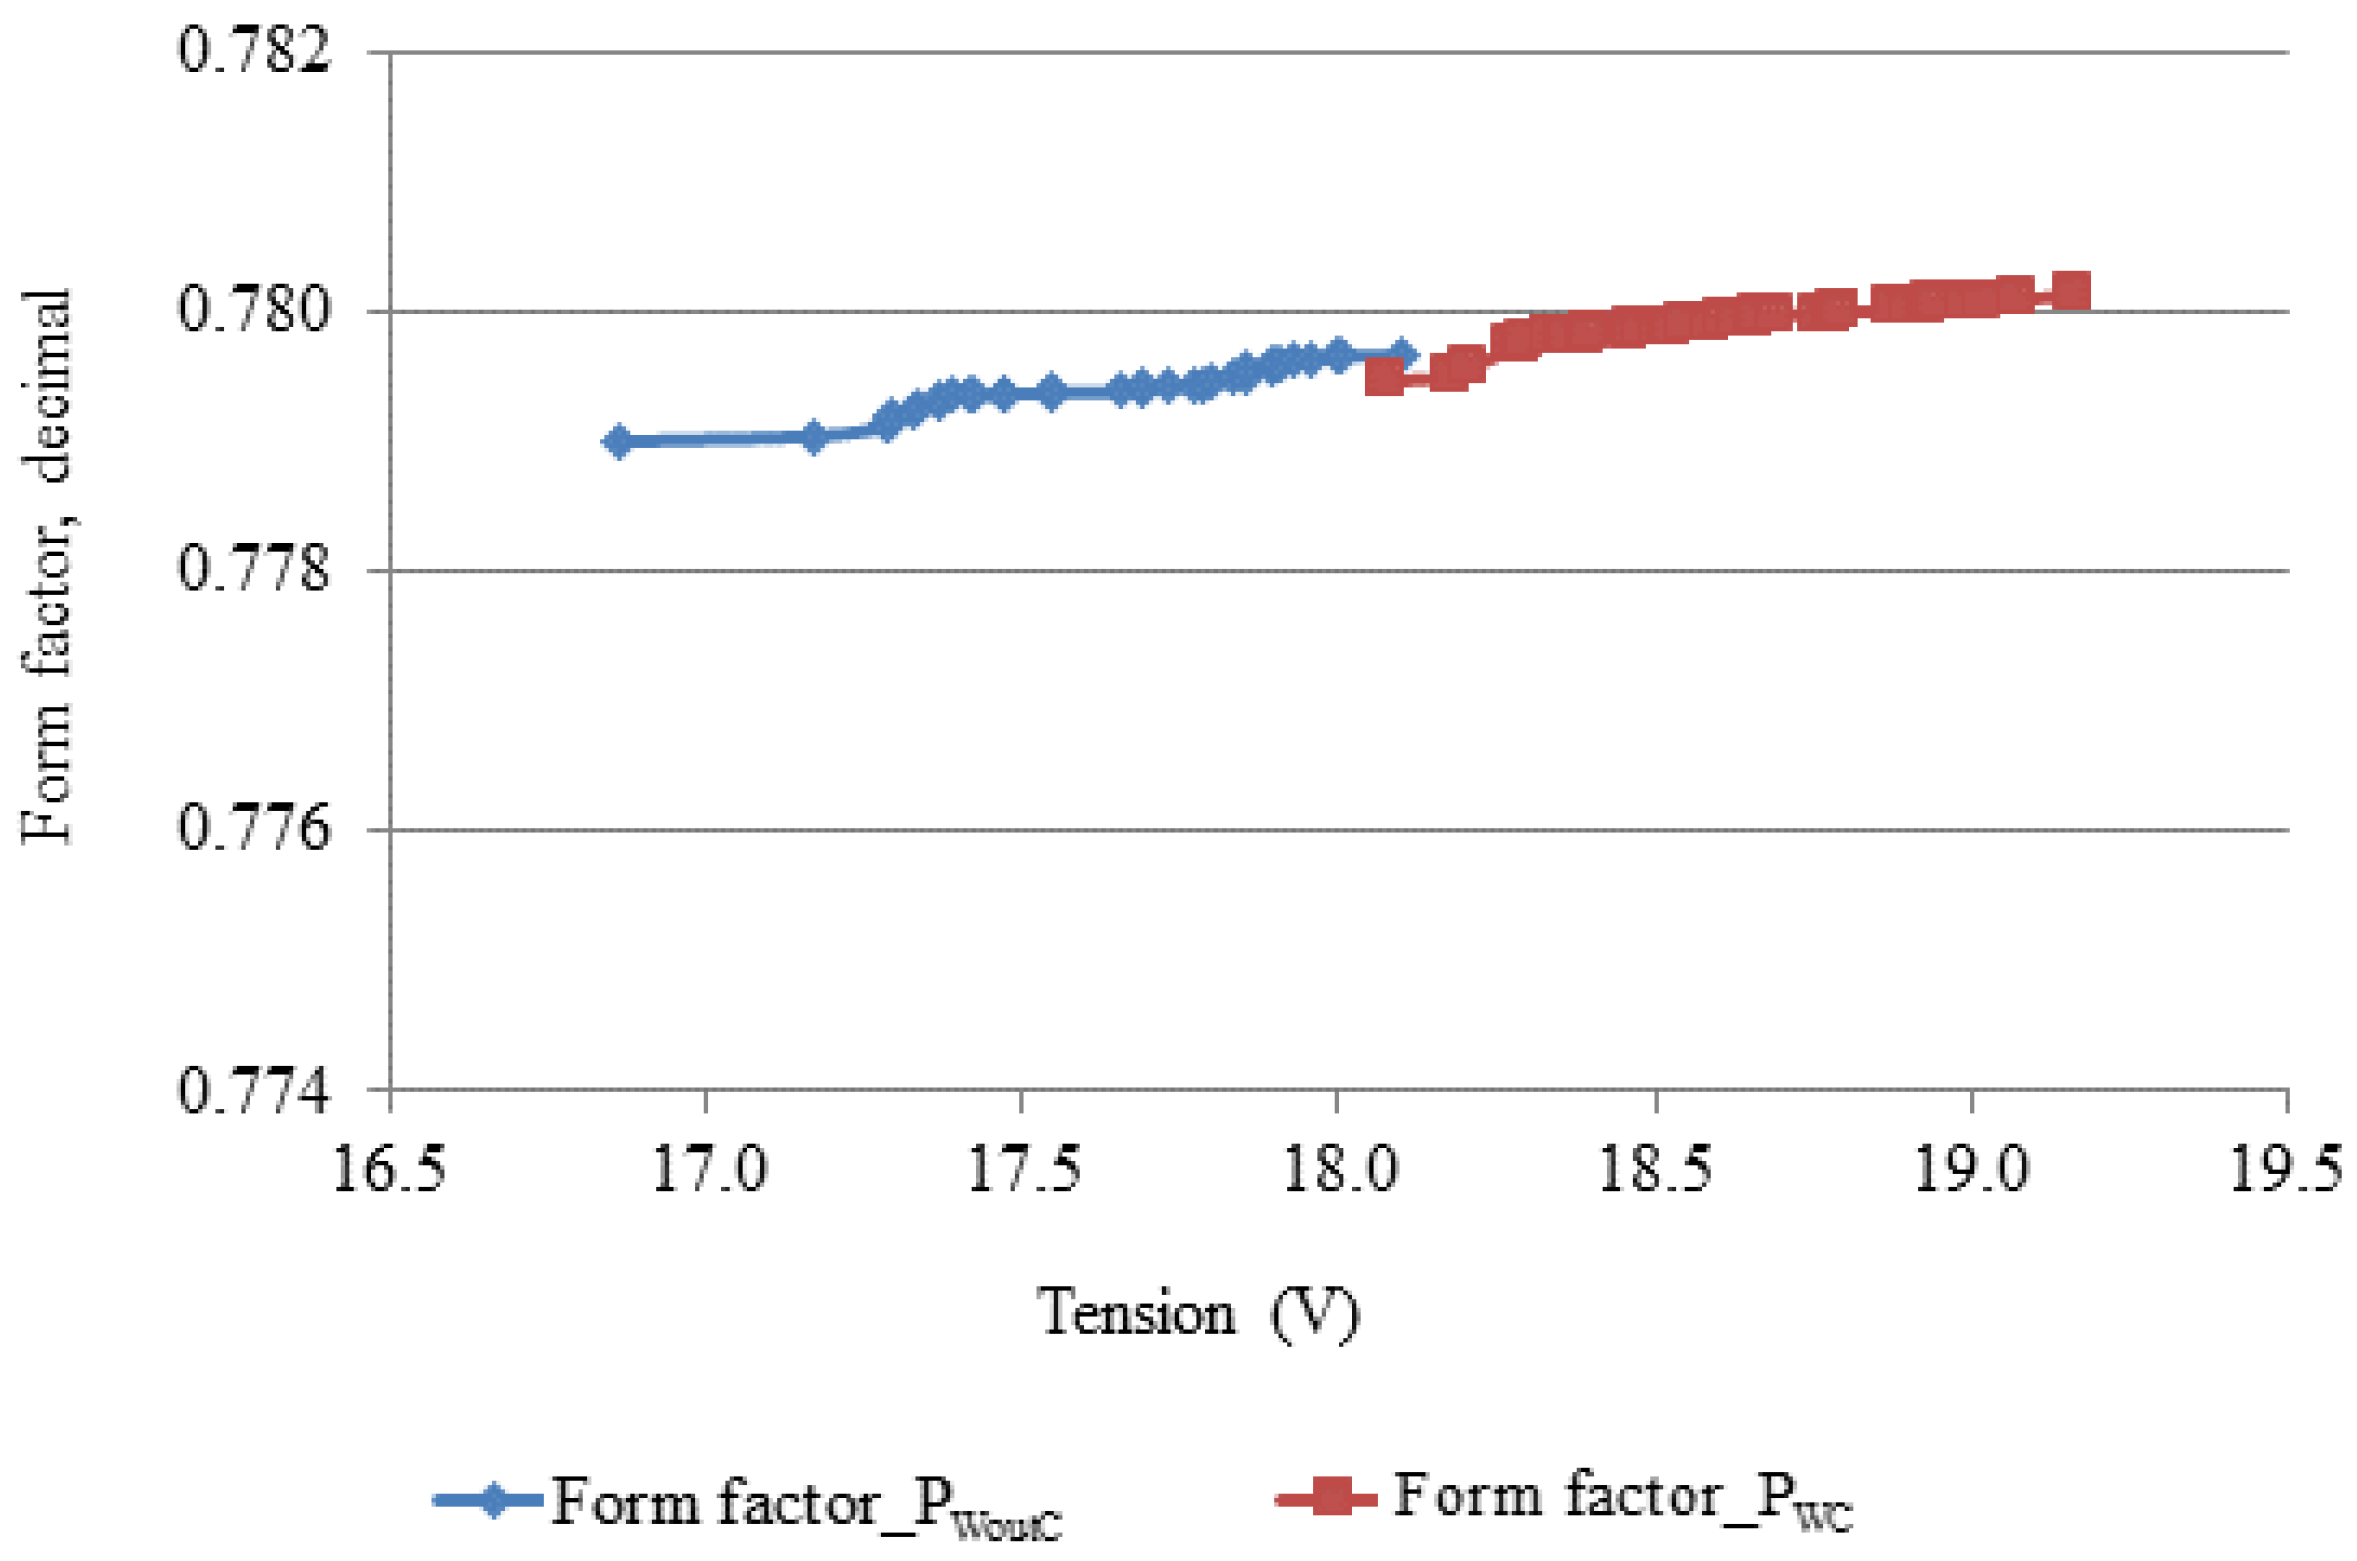
Equation (6) was used to estimate the form or fill factor (FF) value, indicative of PV module quality, where proximity of the value to one indicates better module performance, i.e., the PV module presents higher conversion efficiency [9]:
F F =   V M   ×   I M   V o c   ×   I s c
where: FF, form factor, decimal; Voc, open circuit voltage, V; Isc, short circuit current, A; VM, maximum power voltage, V; and IM, maximum power current, A.
And Equation (7):
η m o d u l e =   F F   ×   V o c   ×   I s c A   × R
where: ηmodule, module efficiency, %; A, module area, m2; Isc, short circuit current, A; and R, global solar radiation, W·m−2.
The Equations (8) and (9) were used to estimate the variation of the short circuit current, Isc, the open circuit voltage, Voc with the solar radiation and the temperature (where * means nominal conditions) [9,29]:
I s c =   I s c * × R R *   + α   × ( T M o d u l e     T r e f * )
where: R, global solar radiation, W·m−2; α, temperature coefficient, %·°C−1, and TModule, module temperature, °C.
V o c =   V o c * +   V t   × ln I s c I s c *     β ( T M o d u l e     T r e f * )
and Equation (10):
V t =   N s   × m   × K   × T e
where: Ns, number of associated cells in series in the module; m, ideality factor, dimensionless; K, boltzman constant, J·K−1; T, module temperature, °C; and e, electron charge, C.
The influence of temperature on efficiency of the prototypes was statistically evaluated using the t-test at 5% probability.
Equation (11) were used to evaluate the short circuit current and diode saturation as a function of the current density and area, respectively, in both cases: with and without radiation concentration for the prototypes:
I s c =   A c   ×   J s c
where: Isc, short-circuit current, A; Ac, total cell area, m2; and Jsc, density of short-circuit current, A·m−2.

2.5. Economic Analysis

An economic analysis for the expected life was performed for the four photovoltaic systems: (i) with and (ii) without energy storage; and with (iii) and without (iv) the solar radiation concentrator. For the economic analysis both the NPV (Net Present Value) and IRR (Internal Rate of Return) were calculated. The hypothesis tested was that photovoltaic systems with a solar radiation concentration ratio of approximately two are less expensive than those without concentration.
The economic analysis was used to estimate and assess the projects based on the economic indicators NPV and IRR for the four scenarios described below: (i) photovoltaic systems with concentrators and batteries; (ii) photovoltaic systems with concentrators and without batteries; (iii) photovoltaic systems without concentrators and with batteries; and (iv) photovoltaic systems without concentrators and without batteries.
The results for these indicators allowed for assessing the real potential for return on investment according to the parameters considered in the sensitivity analysis, such as initial capital, opportunity cost, increased energy costs above inflation, cost of energy and CO2 emissions reduction equivalent credit value on the financial market. In this study CO2 emissions reduction equivalent credit value was named—carbon credit value.

3. Results and Discussion

3.1. Prototype Design

The main goal of the prototype design was to optimize the amount of electrical energy generated by the photovoltaic PV module with the concentrator in kWh·kWp−1. Furthermore, the volume of the prototype was minimized, in order to minimize the area required for installation of the prototype.
The simulations were made in such a way that:
(i)
Equations (1)–(4) were used in the design process. These equations correlate nine variables and/or parameters;
(ii)
Two of the parameters were assumed to be given values, i.e., n = 1 and B = length of the side of module;
(iii)
The incident solar radiation on the PV module, Rnor, was considered to be that correspondent to those of the three locations simulated;
(iv)
Two of the following three parameters were assumed per simulation (C, ψ and α). The intervals allowed for varying these three parameters were: C [0.57 to 2.53 radiation concentration ratio], ψ [0° to 30°] and α [0° to 27.94°]. In the simulation process C, ψ, and α varied by steps of 0.5°, 10° and 5°, respectively;
(v)
The remaining parameters were calculated including H, θc, δ and the one parameter that was not assumed in the previous step. For example: if C and ψ were assumed in the simulation then H, θc, δ and α were calculated by Equations (1–4);
(vi)
Then the PV module productivity, p, in kWh·kWp−1 was calculated;
(vii)
In the case that the two designs have the same maximum p, selection was based on that which presented the minimum volume, since it requires the minimum area for prototype installation.
The simulation result limits were: H [0.060 to 0.910 m], θc [30° to 40°] and δ [5° to 15°].

3.2. Physical Structure and Characteristic Parameters of Prototypes with and without Concentrator

Figure 4 illustrates power versus voltage in the prototypes for the studied systems PWC I, PWC II, PWC III, PWC IV as shown in Table 2. It indicates that PWC II (20° channel angle) obtained better performance than the other systems, PWC I, PWC III and PWC IV. Models PWC III and PWC IV presented better results than PWoutC. The PV power at solar noon of model PWC I was inferior to the other topologies. Results indicated that the best performance was obtained with the V-trough type concentrator, with 20° channel angle.
Figure 4. Typical power versus voltage curve for systems with varying channel angle and radiation concentrator height, for solar radiation from 471.46 to 1050 W·m−2, 2010.
Energies 08 12316 g004
The analysis of the concentrator resistance during field tests did not use the finite element method. However, during testing the concentrators of greater height suffered from the hampering action of the wind and the test results indicate that concentrators in structures with those dimensions would not resist the actions of nature for a longer time. Table 2 shows the relationship between the channel angle and length of the side of concentrator determined for the concentrator according to Equations (1) and (2).
Table 2. Relation between channel angle and concentrator length for the studied systems.
PrototypeChannel Angle (°)Length of the Side of Concentrator, H (m)
PWC I100.475
PWC II200.245
PWC III300.165
PWC IV400.128
According to Figure 1.
It is believed that the concentrator length, H, in PWC I, the largest of the systems and also measured 0.3 mm thick, impaired the structure, which did not hold up well to wind speed variations, resulting in non-uniform concentration of solar energy on the PV module surface and greater shading factor. Therefore, it is necessary to mechanically reinforce the prototype PWC I for better wind resistance.
Based on these results, it was defined that the PV prototype with concentrator model PWC II would be tested in more detail. The electric power curve was then constructed, generating points every hour of the day for PWC II and PWoutC, Figure 5. Solar radiation on the presented day varied between 471.46 W·m−2 and 1050 W·m−2 during the tests.
Figure 5. Power generated by the prototype without concentrator, PWoutC, and with radiation concentrator, PWC II, during a typical day (solar radiation during the tests ranging from 471.46 to 1050 W·m−2, 2010).
Energies 08 12316 g005
Figure 6 presents the relationship between the radiation concentration factor, C, versus acceptance angle, α, for three different trough angles, ψ.
Figure 6. Radiation concentration factor, C, versus acceptance angle, α (for four different trough angles, ψ).
Energies 08 12316 g006
When analyzing Figure 6 it is noticed that for a higher acceptance angle, α, there is a decrease in the radiation concentration factor, C. Furthermore, for an acceptance angle α above 7.5° the radiation concentration ratio was very similar for the trough angles ψ = 10° and ψ = 20°.
For the conditions simulated the optimum design characteristics were: ψ = 20°, α = 19.7°, δ = 10°, θc = 39.7°, H = 0.245 m, B = 0.352 m, C = radiation concentration factor 1.53, n = 1 and Rn = local radiation. These results are in accordance with those obtained by [18].

3.3. Radiation Uniformity

According to Equation (3) and Figure 3, in order to have radiation uniformity the following two conditions must be met: α + δ < π/2 and δ < π/4. These conditions were always satisfied in the simulations.
To avoid radiation losses the angle |θc| < α. In this case, the solar radiation incident angle should be |θc| < α, hence the PV module may have direct and reflected radiation, but for |θc| > α the PV module will not have direct and reflected radiation [15,25].
The photovoltaic system with concentrator was designed without metal sheets on the back of the PV modules, considering that in the experimental preliminary tests the temperature values of the PV modules did not vary significantly when they were inserted, Figure 7.
Figure 7. Mirror dimensions for the PV system with radiation radiation concentrator.
Energies 08 12316 g007

3.4. Final Productivity

In this manuscript the final productivity was estimated according to [30,31], considering that the degradation process occurs in two stages: in the first year the degradation rate is around 1% to 3%, while in subsequent years is approximately 0.5% to 1.0% per year, described below in Table 3 and Figure 8 and Figure 9.
Table 3. Annual productivity, kWh·kWp−1, for the chosen cities and productivity degradation percentage in the 25 year period, 3% degradation rates in the first year and 0.5% thereafter.
Annual Productivity for Each City, Prototype without Concentrator
CityVicosaBelo HorizonteFlorianopolisNew York
(kWh/kWp)2088.201673.501176.901759.80
Total Productivity in the Life Expectancy, Planning Horizon: 25 Years (kWh/kWp)
Prototype without concentrator48,006.1027,056.0038,472.5040,456.40
Prototype with concentrator62,407.9035,172.8050,014.2052,593.40
Degradation rate for the planning horizon of 25 years for systems with and without concentrator: (1st year ~3%) and (2nd to 25th ~0.5%) [30,31].
Figure 8 illustrates the expected final yield for the cities of Vicosa (Brazil), Belo Horizonte (Brazil), Florianopolis (Brazil) and New York (NY, United States), considering the effects of degradation for a period of 25 years based on the initial productivity of 2088.20, 1673.50, 1176.90 and 1759.80 kWh·kWp−1, respectively, for systems without radiation concentrators.
Figure 8. Expected productivity during the useful life, kWh·kWp−1, for the cities of Vicosa (Brazil), Belo Horizonte (Brazil), Florianopolis (Brazil) and New York (USA), considering the effects of degradation during 25 years, for systems without concentration.
Energies 08 12316 g008
The results in this case indicate that the final yield percentage in kWh·KWP−1, for a system with and without concentration after 25 years was 86%. Evaluating the degradation percentage cited by the authors, and adding the initial productivity to percentage gains from the concentration of solar radiation in the prototypes, it is a device able to increase productivity and contribute to a reduction in initial investment of the system, Figure 9.
Figure 9. Expected productivity during useful life, kWh·kWp−1, for the cities of Vicosa (Brazil), Belo Horizonte (Brazil), Florianopolis (Brazil) and New York (USA), considering the effect of degradation during 25 years for systems with radiation concentration.
Energies 08 12316 g009

3.5. Analysis of the Data Collected

3.5.1. Environmental Conditions and Electrical Characteristics

Data collected during the preliminary tests and instrumentation period was used for analysis of the performance of the photovoltaic system with and without radiation concentrator. During the experiments, it was possible to observe the radiation variation due to the presence of clouds or other events than according to [28] lead to radiation reduction during the day. Table 4 and Table 5 present the solar data and environmental conditions during the preliminary field tests.
Table 4. Solar data during field tests.
Tests1th Test2nd Test3th Test
Hour9 h 47 min12 h 00 min13 h 50 min
Solar time9 h 50 min 36 s12 h 03 min 37 s13 h 53 min 37 s
Solar altitude41.64°53.48°41.71°
Azimuth solar−136.44°178.54°142.18°
Angular hour−32.35°0.90°+28.40°
Inclination of generators21.00°21.00°21.00°
Angle of incidence64.77°57.52°65.81°
Solar declination15.73°15.76°15.77°
Air mass1.501.241.50
Table 5. Environmental conditions for the field tests.
Test EnvironmentAverageStandard Deviation
Tilted global radiation (W·m−2)947.3360.52
Global horizontal radiation (W·m−2)711.3485.81
Wind direction (degrees)300.007.64
Wind speed (m·s−1)1.100.39
Ambient temperature (°C)23.154.94
Relative humidity (%)60.3314.49
Atmospheric Pressure (hPa)937.931.04
Table 6 shows the preliminaries results for both prototypes with and without radiation concentrators: voltage, current, temperature and form factor, as well as their standard deviation. The result was calculated by Equations (6), (8) and (9) for PWoutC, PWC and using the technical parameters of the PV module informed by the manufacturer (form factor: 0.75). The measured values of the form factors, indicative of cell quality, did not vary significantly in the prototypes with concentrators.
Table 6. Data from the mean and standard deviation for current, voltage, temperature and form factor, collected in field trials for prototypes with and without radiation concentrators.
Prototype with Concentrator
ItemI (A)V (V)Parameter
1st test2nd test3rd test1st test2nd test3rd testTemperature (°C)Form factor
Average0.340.350.4120.1219.4819.1955.500.79
Standard deviation0.550.670.360.040.290.063.800.00
Prototype without Concentrator
ItemI (A)V (V)Parameter
1st test2nd test3rd test1st test2nd test3rd testTemperature (°C)Form factor
Average0.250.250.3219.6719.5919.6047.200.78
Standard deviation0.840.040.010.000.000.000.490.00
Figure 10 and Figure 11 describe the behavior of efficiency versus temperature and form factor (Equations (5) and (6)) one of the tests, respectively.
Figure 10. Efficiency, η, as a function of the operating temperature of the prototype, with and without radiation concentrator, in one of the preliminary tests.
Energies 08 12316 g010
Figure 11. Form factor, FF, as a function of the open circuit voltage, tension of the prototype, with and without radiation concentrator, in one of the preliminary tests.
Energies 08 12316 g011
It can be seen in Figure 10 and Figure 11 how the efficiency varies as function of the operating temperature and the form factor as a function of the open circuit voltage. Both efficiency and form factors are indicatives of system performance and quality.
The values calculated for efficiency regarding voltage (ηel), using Equation (7), based on the measurements and the manufacturer data for efficiency of the prototypes with and without concentrator were 10.90%, 8.30% and 9.50%, respectively. It is also highlighted, that the electric energy generation in the system with the concentrator was on average 31.3% higher than in the system without the concentrator.

3.5.2. Subsequent Tests

Table 7 presents the environmental conditions for the subsequent tests for the prototypes with and without radiation concentrator. The collected data were selected from those on a sample space that would satisfy the meteorological conditions necessary for the tests, from all experimental data only five days satisfied the standard conditions, i.e., solar radiation around 1000 W·m−2, ambient temperature around 25 °C and wind speed around 1.5 m·s−1 [27].
Table 7. Environmental conditions for the field tests.
Test EnvironmentAverageStandard Deviation
Tilted global radiation (W·m−2)905.6345.21
Global horizontal radiation (W·m−2)839.5354.03
Wind direction (degrees)26.910.12
Wind speed (m·s−1)7.080.01
Ambient temperature (°C)27.002.10
Relative humidity (%)26.050.11
Atmospheric Pressure (hPa)940.002.50
Figure 12 describes the behavior of the form factor for PV systems with and without radiation concentrator, as a function of the open circuit voltage. It can be seen that the form factor increases with the open circuit voltage and for the system with concentrator the open voltage circuit were always greater than the system without concentrator.
Figure 12. Form factor as a function of the open circuit voltage, tension for the prototype without and with radiation concentrator.
Energies 08 12316 g012
It was noticed that the weighted average of electric energy generation increase for the system with the concentrator, PWC, compared with the system without the concentrator was 31.3%. The prototype with the concentrator showed at least 30% better performance than that without the concentrator during 55.3% of the sampling period, Table 8.
Table 8. Electric energy generation efficiency of the system with radiation concentrator in function of the exposure time.
Exposure Time η P W C (%)
55.3% of sampling period η P WC > 30.0
28.0% of sampling period20.0 < η P WC < 30.0
16.7% of sampling period11.0 < η P WC < 20.0
Weighted average η P WC = 31.3%

3.5.3. Temperature

Table 9 shows the results of the statistical analysis. The collected data were adjusted considering solar radiation equivalent to 1000 W·m−2. The analyses indicated that the statistical relationship between the system with and without the concentrator was not equivalent.
Table 9. Statistical analysis of average values for the mean open circuit voltage, mean short circuit current and mean electric power output by the Tukey test at 5% probability, data for the prototype with the concentrator, PWC, and prototype without the concentrator, PWoutC, 28 August 2010 to 28 September 2010 [9].
TreatmentsMean Open-circuit Voltage (V)Mean Short-circuit Current (A)Mean Power Output (W)
PWC19.830 a0.396 a7.857 a
PWoutC19.933 a0.298 b5.591 b
The results followed by the same letter, aa or bb, indicate that the parameters are not statistically different according to Tukey’s test at 5% probability.
In general, in all tests according to the collected data, voltage in the PWC compared with the PWoutC indicated small variations, while the measured PWC short-circuit current was always higher (Table 9). This indicates that the performance of the photovoltaic system with the radiation concentrator obtained better results than the prototype without the concentrator [18].
The voltage in prototype PWC, compared with PWoutC, was 0.5% lower (Table 9), indicating no statistical difference by Tukey’s test at 5% probability.
The effects of solar radiation and natural convection [32,33] were those which most influenced heat transmission in the system with the concentrator:
  • solar radiation absorbed by the PV module (with a seasonal performance, dependent upon PV module inclination angle);
  • project geometry, in this case, V-type concentrator integrated with the PV module;
  • prototype orientation to facilitate cooling;
  • ambient temperature; and
  • wind speed, among other factors.
Thus, in a stationary state, the air flow induced through the channel is controlled by the balance between the pushing force and the opposite force [20]. The average wind speed was lower than 2.0 m·s−1, therefore ideal for realization of the experiments according to [27].
When the maximum temperature of prototype PWC was compared with PWoutC, a significant difference was noticed between averages by the t-test at 5% probability. It is highlighted that during field tests the maximum value for the temperature observed in prototypes with the concentrator was 64 °C, while the average ambient temperature for the city of Vicosa in this period peaked at 33 °C.
The average temperatures in the prototypes were:
  • 3 °C higher in the front part of the PV modules of the prototypes with concentrators, PWC, than in PWoutC;
  • 26.2 °C lower on the concentrators than on the PV modules of PWC;
  • 0.31 °C higher on the back of the prototype PWC than on the back of PWoutC.
The temperature of the PV modules and their distribution in prototypes were observed and measured by a Flir therm-graphic camera (Flir Systems, Boston, MA, USA). Figure 13 illustrates one of these measurements. Temperature distribution allowed for analysis of possible hot-spots in the prototypes, where in this case it was noticed that the central region of the PV modules reached the highest temperatures.
Figure 13. Thermal image of one of the PV module systems with radiation concentrator during the tests (units in °C).
Energies 08 12316 g013
In this case, the measured temperature values in the concentrators were lower than the temperature in the PV modules, indicating that there was no heat transfer from concentrators to PV modules. Such result suggests that the air flow through the concentrator channels cool the PV system with concentrators.
The conversion efficiency of solar radiation into electric energy was determined according to [33] as a function of the ambient and the generator temperature using silicon cells, Equation (5).
Table 10 shows simulated efficiency values of PV prototypes without concentrators, PWoutC, and with concentrators, PWC, with regards to reference and measured temperature values. The reference conversion efficiency was considered for the temperature of 25 °C.
It is emphasized that not only are the mean temperatures of systems with concentrators higher, but the non-uniformity of temperatures in the PV modules also contributed to reduced efficiency of the studied prototypes when compared with the manufacturer data.
Table 10. Temperature influence in the module’s efficiency for prototypes with and without radiation concentrators [9].
PrototypeAverage TModule (°C)η (%)
PWoutC49.2010.43
PWC52.2010.27
ηref = 11.70%; β = 0.0045 °C−1 and Tref = 25 °C, Equation (5).
In general, the main disadvantage of solar radiation concentration is the increase operating temperature of the module which results in reduced efficiency. Generated heat must be dissipated so there are not significant decreases in the open-circuit voltage (Voc). Losses can lead to a reduction in magnitude of the component V versus I, characteristic equation with approximations for silicon modules of 0.30%/°C to 0.50%/°C. There occurs an increase in series resistance of the cell, leading to ohm losses, and reductions in power, efficiency and the form factor. The effects are obviously dependent on the solar radiation concentration factor utilized [33,34].
A study on series resistance of the PV modules is very important to evaluate system performance, as well as to understand the relationship with current density, Jsc, dependent on the solar cell characteristics which are dependent on several physical parameters, such as diffusion coefficient of electrons in semiconductors, lifespan of minority loads, density of intrinsic loads and others [9].
In this study neither the test to evaluate the influence of series resistance on the short circuit current or the assay to analyze the influence of radiation concentration on system degradation have been carried out. Table 11 presents the measured and estimated values for current density calculated using Equation (11).
Table 11. Measured values for current density.
PrototypeCurrent Density (mA·cm−2)
PWC0.6818
PWoutC0.5130
Manufacturer data*0.5337
Source: [17].
The results shown in Table 11 indicate an increase in short-circuit current density in the prototype with the concentrators. This was due to a higher value for current measured during the tests when compared with the prototype without concentrator. Thus, it was noticed that the system with the concentrators did not cause accelerated degradation during the observed period.

3.6. Irradiation in the Selected Cities and Photovoltaic Systems with Concentrators

Results obtained indicated that when using the concentrators with cooling consisting of a continuous metal plate and radiation concentration factor of approximately two, nearly the same efficiency was obtained for the systems without concentrators and those with concentrators when the mono-crystal silicon solar cell area was reduced by 33.5%, corroborating the results obtained in the present study [18]. The present study, on the other hand, worked with photovoltaic modules and not with cells, furthermore, simulated the behavior for different latitudes and cloud rates from those cited in [18].
Figure 14 show the global solar irradiation on the PV solar prototype with (PWC) and without radiation concentrators (PWoutC) for Vicosa city (MG, Brazil) [35,36]. Viçosa has the following geographical coordinates: latitude 20°28′21′′ S and 42°52′54′′ W. It was noticed that the global solar irradiation for the prototype with the concentrators (PWC) are higher than those for the prototype without concentrator (PWoutC).
Figure 14. Global solar irradiation on the PV solar prototype with (PWC) and without radiation concentrators (PWoutC) for Vicosa city (MG, Brazil) [35,36].
Energies 08 12316 g014
Table 12 contains geographical coordinate, latitude, longitude and altitude, as well as the global irradiation maximum values, data from 1991 to 2010 data for the cities of Vicosa (Brazil), New York (USA), Belo Horizonte (Brazil) and Florianopolis (Brazil), which receive different solar irradiation intensities. The objective was to identify performance variations in systems with the radiation concentrator at different geographical locations [35,37].
Table 12. Geographical location of selected cities and maximum global irradiation values.
CityLatitude (°)Longitude (°)Altitude (m)Global Irradiation Maximum Values, Data from 1991 to 2010 (MJ·m−2·day−1)
Vicosa, Brazil20.75 S42.88 W6487.57
Belo Horizonte, Brazil19.92 S43.94 W8586.93
New York, USA40.71 N74.00 W104.07
Florianopolis, Brazil27.60 S48.55 W34.45
Source: [35,37].
Figure 15 illustrates global solar irradiation incident on the PV solar system (Equation (4)) for the selected cities, on the solstice day (21 December) [35,36,37]. It is noted in Figure 15 that the maximum irradiance measured in New York was around 4 MJ·m−2, which is about half the value for the cities of Vicosa or Belo Horizonte. Therefore, a radiation concentration ratio of around two, i.e., two suns in New York may have similar effect on the photovoltaic module, absorber, as the same PV module located in the cities of Vicosa or Belo Horizonte, Brazil. Nevertheless, further studies are required since local conditions may also affect system performance. Among the parameters that may influence system performance are: radiation attenuation, clarity index and local temperature.
Figure 15. Global solar irradiation on the PV prototype with solar radiation concentration of approximately two (PWC), in Vicosa, Belo Horizonte, Florianopolis, Brazil and New York, USA, on December 21, [35,36,37].
Energies 08 12316 g015
The direct irradiance on prototypes with and without concentrator, for the studied cities, i.e., Vicosa, Belo Horizonte, Florianopolis and New York, are show on Figure 16 and Figure 17, [35].
It can be noted by analyzing the Figure 16 and Figure 17 that the average gain of direct irradiance on the PV module by the use of the radiation concentrator were around 2.6 times higher for the cities studied. It was considered in this analysis, the average days, direct irradiance intermediate values between periods with and without cloudiness (Figure 16) and the clear days (Figure 17).
It was concluded that in some regions the use of solar energy concentration mechanisms on the PV prototype may have better performance than in others. Thus the use of a radiation concentrator should be considered as an option for conversion of solar radiation into electric energy since it promotes cost reduction of the system, since it allows for use of a smaller area of PV modules which is one of the costliest system components, but such systems require greater area.
Figure 16. Direct normal irradiance the cities of Vicosa, Belo Horizonte, Florianopolis and New York with and without solar radiation concentrator, for average days [35].
Energies 08 12316 g016
Figure 17. Direct normal irradiance the cities of Vicosa, Belo Horizonte, Florianopolis and New York with and without concentrator of solar radiation, for clear days [35].
Energies 08 12316 g017
The optical system of low solar radiation concentration for photovoltaic systems can attend isolated regions for solar electricity generation, considering that they do not require solar trackers, are inexpensive in relation to high concentration systems and the cost of modules, and they provide an energy gain with concentration [38].

3.7. Economic Analysis of the Systems

Technical and economic viability of these systems must be evaluated in places without area limitation, but with investment restriction.
The economic analysis considered a photovoltaic system with radiation concentrator, performing analyses with and without energy storage in batteries. The photovoltaic system was considered to be located in an isolated region. Table 13 shows the technical parameters of the project, where each PV module has a capacity of 110 Wp.
Two systems were evaluated: system I—system with and without concentrator, with batteries, and; system II—system without batteries, with and without concentrator (with a 30% increase in the cost of the system without concentrator).
Table 13. Technical parameters for the economic analysis.
Technical ParametersNumberCharacteristicTotal
Load4048.80 kWh/year
System without concentration36 modules150 Wp/module5400.00 Wp
System with concentration25 modules150 Wp/module3750.00 Wp
Yield charge and discharge batteries0.75 cycle
Autonomy of the battery set5 day
Batteries41155 (Ah)4.62 kW·h
System cost components were based on Spain market, 2014.
Table 14 shows parameters of the economic analysis and Table 15 the capital costs.
Table 14. Parameters of the economic analysis.
ItemValueUnity
Opportunity cost, interest rate4.00%·year−1
Electric energy rate0.18*€·kWh−1
Environmental benefits17.00ton CO2 equiv.·year−1
Value of carbon credits8.64€·ton−1
Increased energy above inflation2.00%·year−1
Planning horizon25.00year
Maintenance1.00%·year−1
* Residential electrical energy rates for Brazil 2015.
Table 15. Photovoltaic system capital cost.
ItemLifetime (Years)Unit Cost (€)NumberTotal (€)
Photovoltaic module25380.003613,680.00
Batteries102399.0049596.00
Charge controller102215.5812215.58
Frequency inverter151569.0011569.00
Support/Structure380.0093420.00
Subtotal30,480.58
Concentrators4.00% of subtotal1721.30
Cables and labor1.00% of subtotal430.33
The total capital cost32,632.21
All cost components were based on the Spain market, 2014.
Table 16 shows the values for the year 2014 of NPV (Net Present Value) and IRR (Internal Rate of Return) for the scenarios according to systems I and II, i.e., increased energy cost above inflation (2.00%·year−1); electricity tariff (0.18 €·kWh−1); opportunity cost (4.00%·year−1); carbon credit (8.64 €·ton CO2·year−1); system cost (100%). It can be seen in Table 16 that the results of NPV and IRR indicated that the project was not feasible for systems I and II considering the data from this scenario. It is noted that the system with concentrators presented better results for both systems.
Table 16. Results for the scenarios considering systems I and II.
ScenarioSystem I: with BatteriesSystem II: without Batteries
Parameterwith concentratorwithout concentratorwith concentratorwithout concentrator
NPV−€ 30,120.03−€ 34,376.85−€ 5887.62−€ 10,669.70
IRR−7.80%−8.16%1.18%−0.39%
Table 17 shows the threshold values for economic feasibility of both photovoltaic systems. In Table 17 the following parameters were evaluated in the sensitivity analysis: (i) initial capital; (ii) opportunity cost; (iii) increase in energy cost above inflation; (iv) energy cost; and (v) carbon credit value.
Table 17. Threshold values of economic parameters for the economic feasibility of photovoltaic systems.
ItemSystem I with Energy StorageSystem II without Energy Storage
Parameters of sensitivity analysisWith concentratorWithout concentratorWith concentratorWithout concentrator
Initial capital (%)54.3014.0073.0082.30
Opportunity cost (%·year−1)UnfeasibleUnfeasible1.70Unfeasible
Increase on energy costs above inflation (%·year−1)11.0011.505.006.60
Energy cost (€·kWh−1)0.590.640.270.32
Carbon credit (€·ton equiv. CO2·year−1)127.00143.4231.9750.98
When evaluating Table 17 it was noted that system II, without energy storage, was more attractive than system I. Evaluating each of the considered parameters it was found that:
  • Initial capital: In relation to the scenario considered a reduction of 27.00% and 17.70% of the initial cost of photovoltaic system without energy storage and with and without the concentrator is needed, respectively, in order to reach economic feasibility. Such reductions are expected to be reached in about three to five years. A systematic reduction in capital costs of photovoltaic system has been observed in the last 15 years or so of about 5% to 6% per year [2];
  • Opportunity cost: In most of the cases simulated, the variation in opportunity cost does not result in feasibility;
  • Increase in energy costs above inflation: The increase in energy costs above inflation varied from 5.00% to 11.00% per year to reach feasibility. Such values appear too high for stable economies but is not improbable for the Brazilian reality. In 2015 the residential rate in Brazil is expected to increase by about 25% for an inflation of 8% per year, indicating a 15.7% increase above inflation in that year [39];
  • Energy cost. Brazil already has one of the most expensive electricity rates in the world, and for feasibility this parameter needs to be between 0.27 and 1.80 (€·kWh−1), which is above the present rate in the country; and
  • Carbon credit: In the present context, it is not clear that a new agreement on the environment and reduction of emissions will be signed. Nevertheless, the carbon credit market had oscillated like any other asset on the stock market and between 2011 and 2015 it varied from 6.42 to 16.41 €·ton−1, while the limit values of this parameter were between 31.97 and 143.42 €·ton−1 to reach feasibility [40].
It is likely that the time of use of electrical energy tariffs that is planned to be implemented for residential customers in the next years will significantly change the results of the economic analysis, since in some countries like Brazil the ratio between the peak and off peak rates for nonresidential customers can exceed three fold.

4. Conclusions

The purpose of this research was to contribute with information about making systems for conversion of solar energy into electric energy more economical. For this purpose, the use of flat and fixed radiation concentrators was investigated. The main conclusions of this research were:
(i)
There is the influence of geographical location and climatic characteristics;
(ii)
The average temperatures in the prototypes were: 3 °C higher on the front of the PV modules of the prototypes with concentrators, PWC, than in the prototypes without concentrators, PWoutC; 26.2 °C lower on the concentrators than in the PV modules of PWC; and 0.31 °C higher on the back of the prototype PWC than on the back of PWoutC. This was not expected. It is believed that passive cooling depends on the geometry of concentrator, V-trough;
(iii)
The photovoltaic concentrator systems require a larger area for installation, which is around three times larger than the area for the system without concentrators. Thus, one can obtain a reduction in the initial cost, since the required area of the PV modules is around 31.3% smaller in systems with radiation concentrator, than in the ones without it.
For future studies it is suggested: (i) to investigate the degradation of systems with concentrators regarding temperature increase and geographical location; (ii) to evaluate energetically and economically, the possibility of selling excess energy in micro grids and to the electric power system; (iii) to evaluate aesthetic and architectural aspects of radiation concentrators when used on building facades and rooftops; (iv) to evaluate application in hybrid systems, combining one or more energy sources, such as: PV, wind, diesel, biogas, hydraulic or thermal; (v) to evaluate the influence of time of use rates on economic analysis of the use of solar concentrators with and without batteries, and finally; (vi) to evaluate the use of solar trackers with low solar radiation concentration systems.

Acknowledgments

The authors would like to thank Research Support Foundation of Minas Gerais and National Council for Scientific and Technological Development for their financial support.

Author Contributions

This paper is part of the first author’s research conducted at the Federal University of Vicosa, Vicosa, Minas Gerais, Brazil. This research was supervised and co-supervised by the corresponding author and the remaining authors, respectively.

Conflicts of Interest

The authors declare no conflict of interest.

References

  1. Kaldellis, J.K.; Zafirakis, D.; Kondilli, E. Optimum sizing of photovoltaic-energy storage systems for autonomous small islands. Int. J. Electr. Power Energy Syst. 2010, 32, 24–36. [Google Scholar] [CrossRef]
  2. IEA—International Energy Agency. Technology Roadmap Solar Photovoltaic Energy. Available online: http://www.iea.org/papers/2010/pv_roadmap.pdf (accessed on 20 April 2014).
  3. Bazilian, M.D.; Leenders, F.; van der Ree, B.G.C.; Prasad, D. Photovoltaic cogeneration in the built environment. Sol. Energy 2001, 71, 57–69. [Google Scholar] [CrossRef]
  4. Martins, F.M.; Oliveira, P.A.V. Economic analysis of the generation of electric energy from biogas in pig production. Eng. Agric. 2011, 31, 477–486. [Google Scholar]
  5. Resk, H.; EL-Sayed, A.H.M. Sizing of a standalone concentrated photovoltaic system in Egyptian site. Int. J. Electr. Power Energy Syst. 2013, 45, 325–330. [Google Scholar] [CrossRef]
  6. Marini, J.A.; Rossi, L.A. Systematization of the technical and economic sizing of isolated photovoltaic systems through specific software. Eng. Agric. 2005, 25, 67–75. [Google Scholar]
  7. Gabriel Filho, L.R.A.; Viais Neto, D.S.; Cremasco, C.P.; Seraphim, O.J.; Caneppele, F.L. Mathematical analysis of maximum power generated by photovoltaic systems and fitting curves for standard test conditions. Eng. Agric. 2012, 32, 650–662. [Google Scholar] [CrossRef] [Green Version]
  8. MME—Ministério de Minas e Energia-Análise da Inserção da Geração Solar na Matriz Elétrica Brasileira. Empresa de Pesquisa Energética—EPE: Brasilia, Brazil, 2012. Available online: http://www.epe.gov.br/geracao/documents/estudos_23/nt_energiasolar_2012.pdf (accessed on 5 December 2014).
  9. Luque, A.; Hegedus, S. Handbook of Photovoltaic Science and Engineering, 2nd ed.; John Wiley & Sons: Chichester, UK, 2003; Volume 1179. [Google Scholar]
  10. Sarmah, N.; Richards, B.S.; Mallick, T.K. Design, development and indoor performance analysis of a low concentrating dielectric photovoltaic module. Sol. Energy 2014, 103, 390–401. [Google Scholar] [CrossRef]
  11. Chemisana, D. Building integrated concentrating photovoltaics: A review. Renew. Sustain. Energy Rev. 2011, 15, 603–611. [Google Scholar] [CrossRef]
  12. Winston, R.; Minano, J.C.; Benitez, P. Nonimaging Optics; Elsevier Academic Press: San Diego, CA, USA, 2005; p. 509. [Google Scholar]
  13. Kim, J.M.; Dutta, P.S. Optical efficiency—Concentration ratio trade-off for a flat panel photovoltaic system with diffuser type concentrator. Sol. Energy Mater. Sol. Cells 2012, 103, 35–40. [Google Scholar] [CrossRef]
  14. Chaves, J.C. Introduction to Nonimaging Optics; CRC Press: Boca Raton, FL, USA, 2008; p. 560. [Google Scholar]
  15. Rabl, A. Comparison of solar concentrators. Sol. Energy 1975, 18, 93–111. [Google Scholar] [CrossRef]
  16. Cronemberger, J.; Caamano-Martín, E.; Sánchez, S.V. Assessing the solar irradiation potential for solar photovoltaic applications in buildings at low latitudes—Making the case for Brazil. Energy Build. 2012, 55, 264–272. [Google Scholar] [CrossRef]
  17. Kyocera. Solar do Brasil. Available online: http://www.kyocerasolar.com.br (accessed on 5 February 2015).
  18. Solanki, C.S.; Sangani, C.S.; Gunashekar, D.; Antony, G. Enhance heat dissipation of V-trough modules for better performance. Sol. Energy Mater. Sol. Cells 2008, 92, 1634–1638. [Google Scholar] [CrossRef]
  19. Mannan, K.D.; Bannerot, R.B. Optimal geometries for one and two faceted symmetric side wall booster mirrors. Sol. Energy 1978, 21, 385–391. [Google Scholar] [CrossRef]
  20. Florschuetz, L.W. Extension of the Hottel-Whillier model to the analysis of combined photovoltaic/thermal flat plate collectors. Sol. Energy 1979, 22, 361–366. [Google Scholar] [CrossRef]
  21. Lucchi. Componentes Para Sistemas de Iluminação e Alumínios Especiais. Available online: http://www.lucchi.com.br/ (accessed on 16 June 2015).
  22. Campbell Scientific Homepage. Available online: http://www.campbellsci.es/cmp3-especificaciones (accessed on 15 June 2015).
  23. Flir Hopepage. Flir Systems. Available online: http://www.flir.com.br/home/ (accessed on 16 June 2015).
  24. Cotergavi Hopepage. Medição e Instrumentos de Controle. Available online: http://www.cotergavi.com.br/ (accessed on 16 June 2015).
  25. Tang, R.; Liu, X. Optical performance and design optimization of V-trough concentrators for photovoltaic applications. Sol. Energy 2011, 85, 2154–2166. [Google Scholar] [CrossRef]
  26. Kuang, R.; Wu, Y.; Zheng, J.; Ye, C.; Zhang, X. Analysis of optical properties and geometrical factors of linear deflection surface concentrators. Sol. Energy Mater. Sol. Cells 2014, 121, 53–60. [Google Scholar] [CrossRef]
  27. Machado Neto, L.V.B. Characterization of Photovoltaic Generators and Development of a Maximum Power Point Tracking for Stand-Alone Systems Applied to Rural Electrification. Ph.D. Thesis, Federal University of Vicosa, Vicosa, Minas Gerais, Brazil, 2006. [Google Scholar]
  28. Cabral, C.V.T.; Oliveira Filho, D.; Diniz, A.S.A.C.; Martins, J.H.; Toledo, O.M.; Machado Neto, L.V.B. A stochastic method for stand-alone photovoltaic system sizing. Sol. Energy 2010, 84, 1628–1636. [Google Scholar] [CrossRef]
  29. Skoplaki, E.; Boudouvis, A.G.; Palyvos, J.A. A simple correlation for the operating temperature of photovoltaic modules of arbitrary mounting. Sol. Energy Mater. Sol. Cells 2008, 92, 1393–1402. [Google Scholar] [CrossRef]
  30. Vásquez, M.; Rey-Stolle, I. Photovoltaic module reliability model based on field degradation studies. Prog. Photovolt. Res. Appl. 2008, 16, 419–433. [Google Scholar] [CrossRef] [Green Version]
  31. Jordan, D.C.; Kurtz, S.R. Photovoltaic degradation rates—An analytical review. Prog. Phot. Res. Appl. 2012, 21, 12–19. [Google Scholar] [CrossRef]
  32. Tonui, J.K.; Tripanagnostopoulos, Y. Air-cooled PV/T solar collectors with low cost performance improvements. Sol. Energy 2007, 81, 498–511. [Google Scholar] [CrossRef]
  33. Tan, L.; Ji, X.; Li, M.; Leng, C.; Luo, X.; Li, H. The experimental study of a two-stage photovoltaic thermal system based on solar trough concentration. Energy Convers. Manag. 2014, 86, 410–417. [Google Scholar] [CrossRef]
  34. Zahedi, A. Review of modelling details in relation to low-concentration solar concentrating photovoltaic. Renew. Sustain. Energy Rev. 2011, 15, 1609–1614. [Google Scholar] [CrossRef]
  35. Swera. Solar and Wind Energy Resource Assessment. Available online: http://en.openei.org/wiki/SWERA/Data (accessed on 6 June 2014).
  36. Soda Service. Solar Energy Services for Professionals. Available online: http://www.soda-is.com (accessed on 6 June 2014).
  37. National Solar Radiation Database. Available online: http://rredc.nrel.gov/solar/old_data/nsrdb/1991-2010/ (accessed on 6 June 2014).
  38. Santos, I.P.; Rüther, R. The potential of building-integrated (BIPV) and building-applied photovoltaics (BAPV) in single-family, urban residences at low latitudes in Brazil. Energy Build. 2012, 50, 290–297. [Google Scholar] [CrossRef]
  39. ANEEL. Electrical Energy State Regulatory Agency. Available online: http://www.aneel.gov.br/aplicacoes/tarifaAplicada/index.cfm (accessed on 13 April 2015).
  40. Investing.com. Available online: http://br.investing.com/commodities/carbon-emissions-streaming-chart (accessed on 13 April 2015).

