Article

Analysing Performance Characteristics of Biomass Haulage in Ireland for Bioenergy Markets with GPS, GIS and Fuel Diagnostic Tools

1
School of Biosystems Engineering, University College Dublin, Dublin 4, Ireland
2
UCD Forestry, University College Dublin, Dublin 4, Ireland
*
Author to whom correspondence should be addressed.
Energies 2015, 8(10), 12004-12019; https://doi.org/10.3390/en81012004
Submission received: 20 August 2015 / Revised: 30 September 2015 / Accepted: 14 October 2015 / Published: 22 October 2015
(This article belongs to the Special Issue Economics of Bioenergy 2015)

Abstract

:
In Ireland, truck transport by road dominates and will remain the main transportation mode of biomass. Cost efficiency and flexibility of forest transport can be typically improved by optimising routes. It is important to know every process and attributes within the workflow of roundwood transport. This study aimed to analyse characteristics of timber trucking in Ireland, and to estimate the least-cost route for the distribution of biomass with the use of geographic information systems (GIS). Firstly, a tracking system that recorded the truck’s movements and fuel consumption was installed. A total of 152 trips were recorded, routes were chosen by the truck driver. The recorded information was used to analyse the distances and times travelled loaded and unloaded per road class, breaks, loading and unloading times as well as fuel consumption. Secondly, the routes taken by the truck where compared with routes created using Network Analyst (NA), an extension of ArcGIS. Four scenarios based on route selection criteria were selected: shortest distance (S1), shorted time (S2), and prioritising high-class roads with shortest distance (S3) and time (S4). Results from the analysis of the tracking system data showed that driving both loaded and unloaded occupied on average 69% of the driver’s working shift; with an average time driving loaded of 49%. The travel distance per trip varied from 112 km and 197 km, with the truck driver using mostly national and regional roads. An average 2% of the total distance and 11% of the total time was spent driving on forest roads. In general, the truck’s speed recorded on the different road classes was on average 30% lower than the legal maximum speed. The average fuel consumption was 0.64 L/km. In terms of the route comparison, the driving directions from the truck routes coincided with 77% of the directions of the routes based on shortest driving time (S2 and S4). All the routes chosen by the driver had 22% longer distance than the routes in S1 (shortest distance). The routes selected based on shortest distance (S1 and S3) had the longest travelling time, approximately 19% more than the ones taken by the truck and 30% more than S2 and S4. The average running cost for the truck was 0.83 €/km. Choosing the shortest distance routes (S1 and S3) not only implies reducing travelling costs but also a reduction of CO2 emissions by 12% in comparison to routes in S2 and S4. However, when selecting the routes, travel time can be a much more crucial parameter to analyse rather than distance in terms of transportation costs. Choosing the routes generated in scenario S2 over S1 implied an increase in distance by 12% but a decrease in time of 30%. Less driving time translates into better driving conditions across higher classes or roads; less wear and tear of trucks; and lesser fuel used. It also complies with local authorities preferences of having timber trucks move on higher road types in order to minimise the expenses associated with road maintenance.

1. Introduction

The increasing use of bioenergy has resulted in a growing demand for long-distance transportation of energy wood [1]. In Ireland, truck transport by road dominates and will remain the main transportation mode of domestic biomass along with many other commodities. From the public’s perspective, logging trucks are perhaps the most visible sign of forest industry activity [2]. In 2013, the total volume of roundwood harvested in Ireland was 2.85 million m3 [3]. This represents approximately 55,920 truckloads on Irish roads. With the rising amount of timber production forecasted, wood transportation will present major challenges to the Irish road network going forward, as it is expected that truck movements for both biomass and timber will double to over 100,000 truckloads per annum.
Transportation of material from the roadside landing to the customer is a large and important part of the overall supply cost in the forestry industry and represents a very energy demanding phase. In Ireland, truck transportation is the most intense stage in terms of energy demand, accounting for 70%–78% of the overall energy requirements, and (68%–75%) of greenhouse gas emissions [4]. Trucks often have to drive deep into the forests where driving conditions can deteriorate and driver’s skill sets have to be adapted accordingly. Truck operations require working in difficult field conditions and can be very frequently affected by extreme seasonal weather. These specific technological requirements considerably increase fuel consumption of timber-transport unit [5].
Over loaded trucks will accelerate the process of road damage and is described by the road wear number. The relationship between axle load and pavement damage is a power function such that a small increase in load causes a large increase in pavement damage. The damage caused is proportional to the fourth power of the weight of the truck [6] Increasing by a factor of 1.5 the vehicle weight of a 40 tons gross weight vehicle will result in a fivefold increase in road damage [7].
Cost efficiency and flexibility of roundwood transport can typically be improved by reducing trip times, increasing the weight and volume capacity of truck and trailer combinations, and optimising routes. For analysing and optimising trip times, it is important to know every process and its attributes within the workflow of round wood transport like times, speeds and fuel consumption. Collecting data can be done with time studies in the field or based on driver’s records. Classical time studies can be time consuming and expensive [8].
New portable, wireless communication techniques and internet-based systems for fleet management enable more cost-efficient control systems with low investment costs in hardware and software as well as low operating costs. It generally also requires minimal interaction by the truck driver [9]. Computer based geographic information systems (GIS) have been successfully adopted in the management of different sectors of the timber industry, including analysing the road transportation network in order to determine the most efficient transportation routes [10,11].
Advances in GIS, global positioning systems (GPS) and the use of both in recent decades have provided new means of undertaking forest productivity assessment [12]. In Finland, for example, these systems have been used in the management and control of timber procurement of forest industries since the beginning of the 1990s [9].
Ranta and Rinne [13] analysed the transport profitability of uncomminuted biomass for energy in Finland. The authors gathered payload information and used a fleet tracking system to monitor different work phases in the supply (e.g., time and fuel consumption). Results showed that improvements in the transportation of loose biomass can be achieved by maximising the delivered loads, and minimising the time trucks spend in the terminals.
Several research projects have been undertaken in an attempt to optimise the timber haulage routes over the road network. The objectives of these studies include (but is not limited) minimising the average travel cost and are discussed in detail below.
Depending on their location, public roads in Ireland are the responsibility of the National Roads Authority (NRA) or the Local Authorities. Annually, Coillte (a commercial semi state forest company) must inform the respective Local Authorities of the sites that they intend to harvest during the coming year and the roads that they intend to use as an access route. A felling licence is applied for to the Forest Service and must be granted before any timber extraction can be carried out. In some situations, felling licences can stipulate that certain routes for extraction must be agreed at a local level and this generally involves consultation with local road engineers and forest managers over which routes to use. These assigned extraction routes do not always agree economically with the movement of hauliers in terms of journey time, distance, revenue per mile and cost per mile [14].
In Ireland, over one third of the existing forests are on peatlands and are served by basic road infrastructure of flexible road pavements. These pavements exhibit fast and severe deterioration under the heavy truck transportation, causing continual expensive repair and maintenance, making timber haulage more costly and affecting nearby communities. Martin et al. [15] incorporated GIS technology to design transportation routes on the basis of shortest distance, as well as road maintenance costs. Results showed that shorter distance routes had an increase proportion of lower standard roads, which made the maintenance of the designed routes more expensive. This would suggest that the transport of timber should be routed towards the higher class of roads and not necessarily to the optimum route (shortest distance route), to minimise the road maintenance costs.
In order to reduce transport in minor roads (rural roads) and the impacts on local communities, local authorities in the UK, working with the regional timber transport groups, draw up agreed routes maps for roundwood haulage. The Agreed Routes Maps cover most of the forested areas of Scotland, as well as Cumbria, North Yorkshire and Durham. Agreed routes maps are also being developed for northeast England and for parts of Wales [16]. Developments on mapping agreed travel routes is also being researched in Ireland with the project MARTT (map of agreed routes for sustainable timber transport) [17].
To improve efficiency of roundwood transportation Devlin et al. [11] compared and analysed different GPS routes with simulated routes generated using ArcGIS’s Network Analyst (NA) tool. Results showed that the simulated routes based on shortest distance did not replicate GPS routes recorded. However, when the routes were selected based on a cost weighting system (higher class were prioritised), the GPS routes were over 90% similar with what was modelled within the GIS.
Sometimes the shortest routes are not the best routes; for Flisberg et al. [18], the best means routes agreed upon by both forestry companies and transporters, and that include drivers’ preferences and behaviour. The authors collected detailed information about a set of detailed routes in Sweden that both the forestry companies and the transporters agreed were efficient. Based on the road selection preferences a weight system was added to the GIS road network. This enabled finding minimum cost routes that were the same time agreed by the users.
Both vehicle payload utilisation choices of travel routes can be determined by behaviour and geography. The behaviour of truck drivers is out of the scope of this study. The aims of the study were:
  • To adopt fleet tracking systems in order to analyse characteristics of timber trucking in Ireland with respect to distance, time, fuel consumption and use of the different road classes.
  • To estimate the least-cost route for the distribution of biomass in Ireland with the use of GIS.

2. Materials and Methods

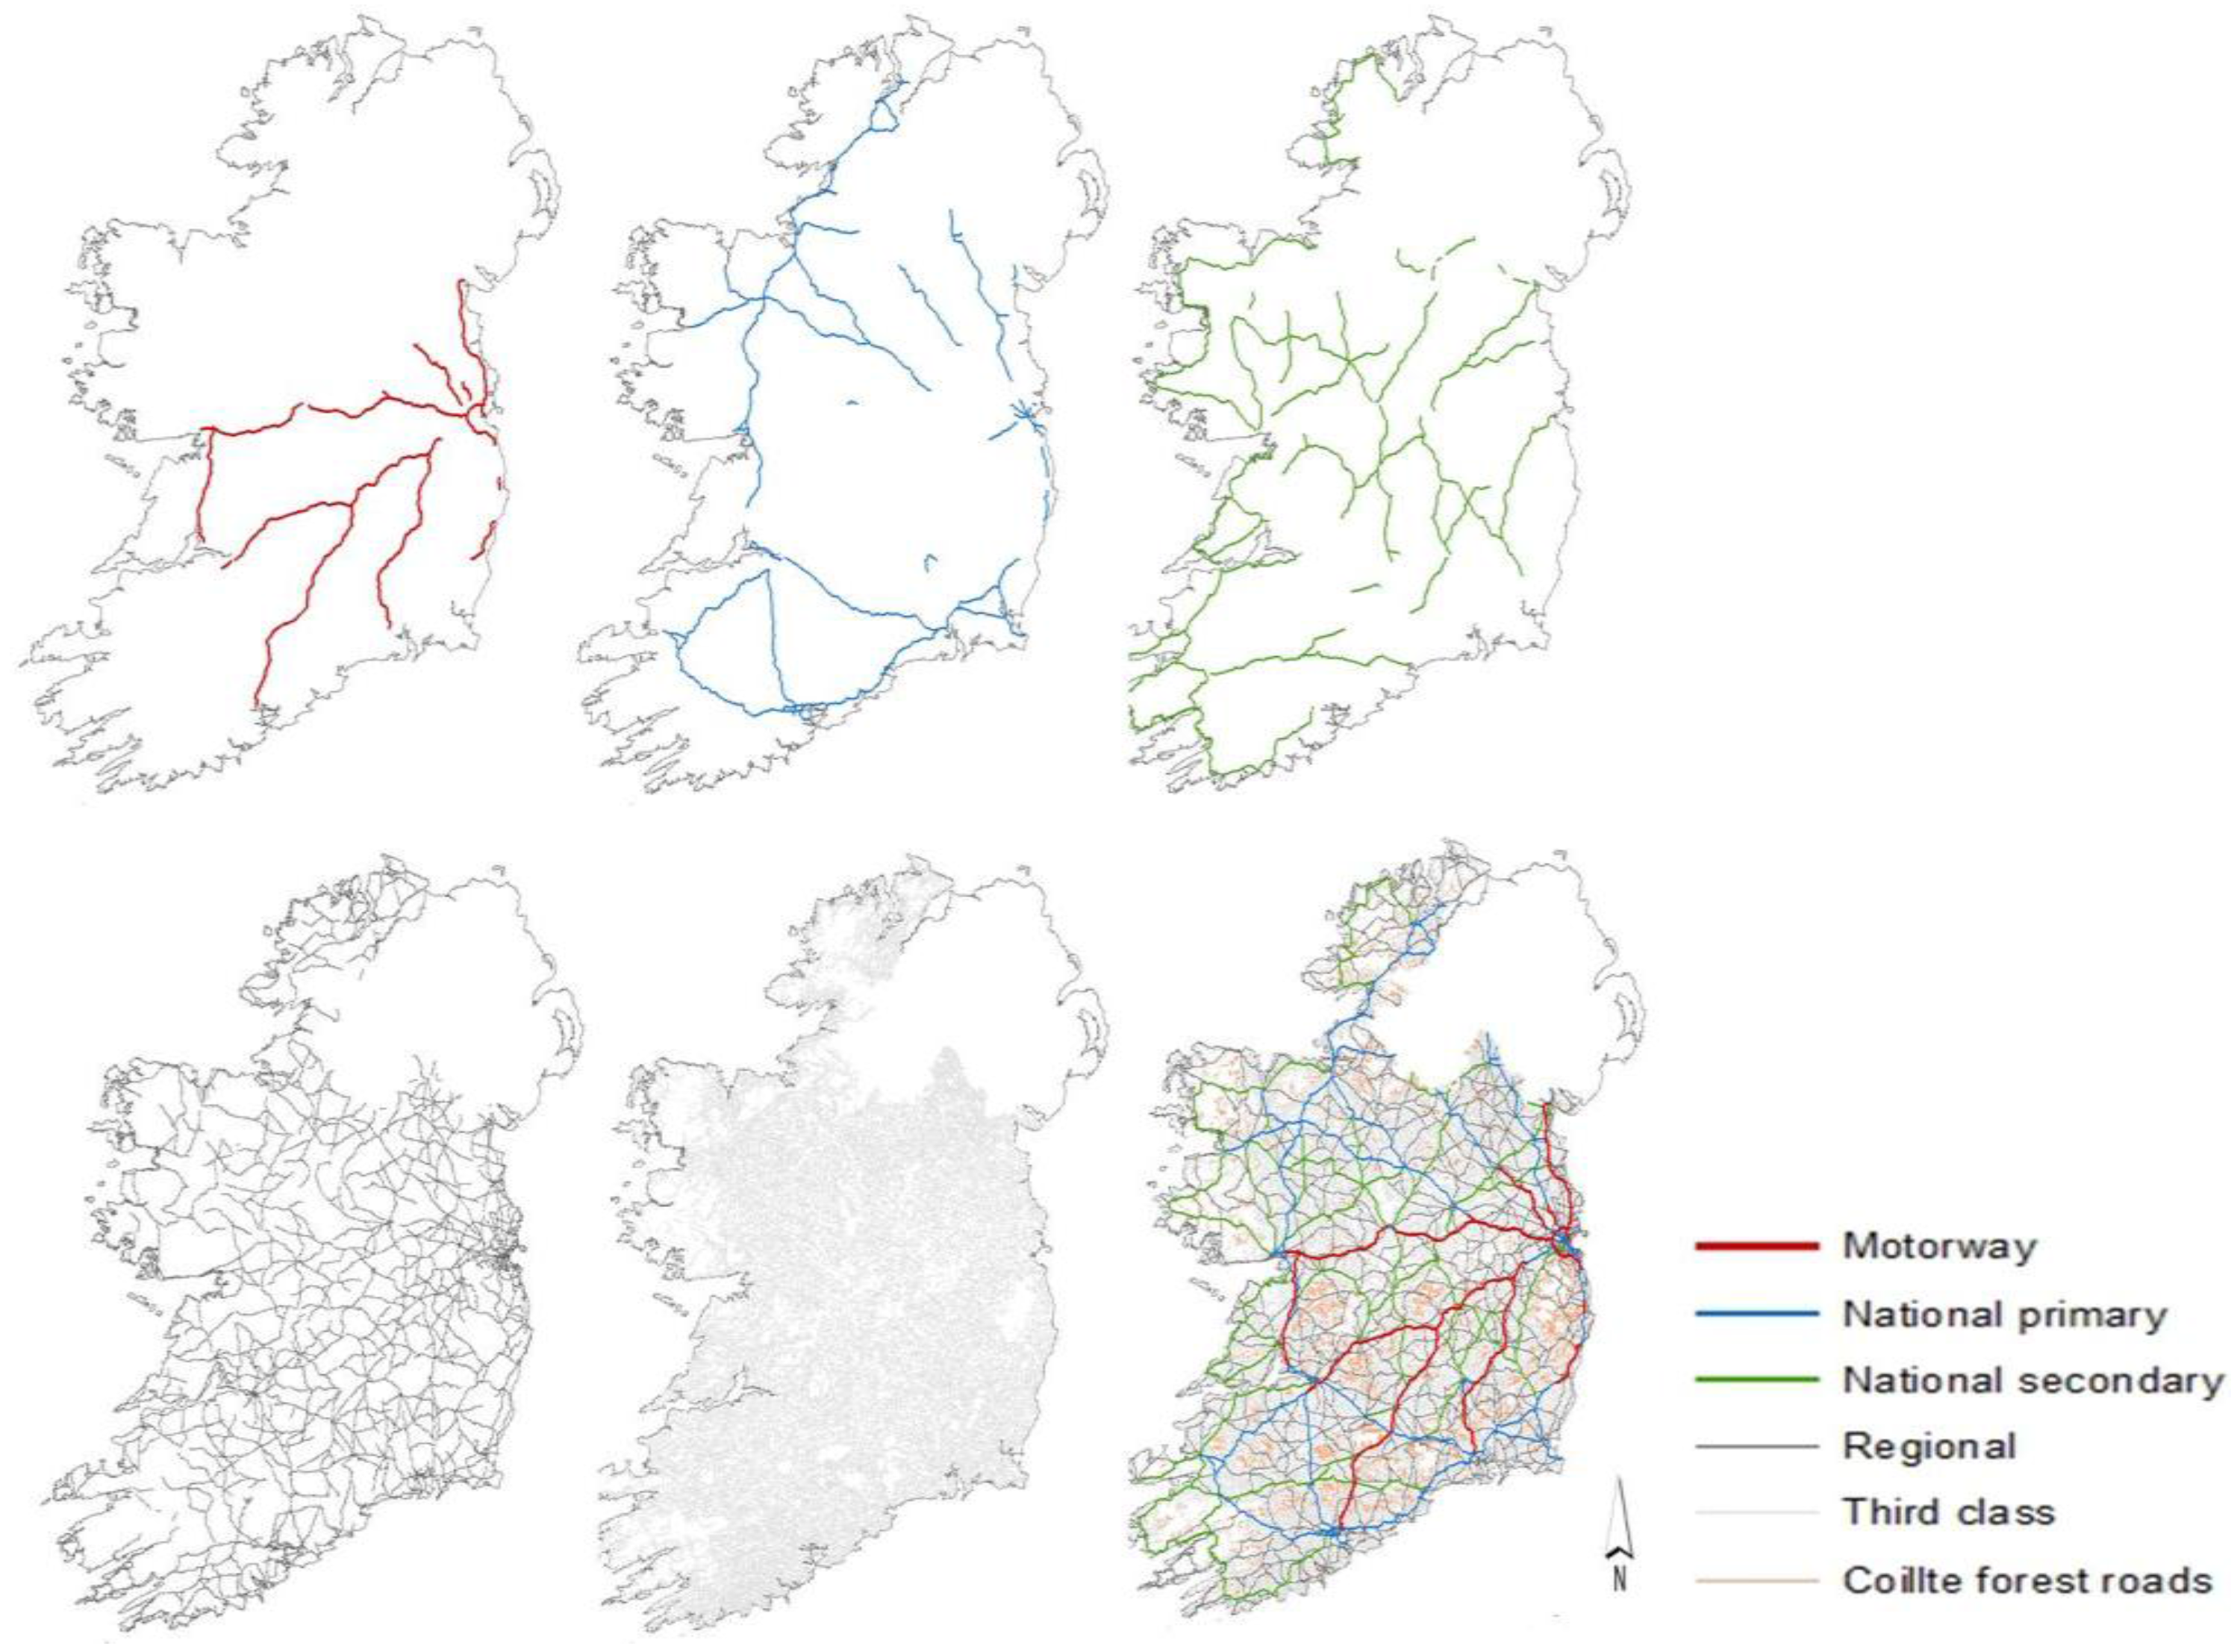
2.1. Ireland’s Road Network

A digital road network of Ireland provided by the Ordnance Survey was used within the GIS for this study [19]. Ireland public roads are comprised of motorways (1132 km), national primary routes (1948 km), national secondary routes (2724 km), regional (13,065 km) and local or third class roads (117,060 km) (Figure 1). National primary roads link the principal ports, airports, cities and large towns. National Secondary roads are secondary to the main arterial routes (National Primary) and connect important towns. National secondary routes are generally more poorly maintained than primary routes (although their quality can vary widely), but often carry more traffic than regional road. Regional roads do not form a major route but instead are the main feeder routes that provide the main links between the national roads. The local roads serve the transport need and requirements of urban areas and local communities. The NRA is responsible for Motorways, national primary roads, and secondary roads, whereas regional and local roads are managed by Local Authorities.
Figure 1. Geographic information systems (GIS) map of Ireland’s road network.
Energies 08 12004 g001

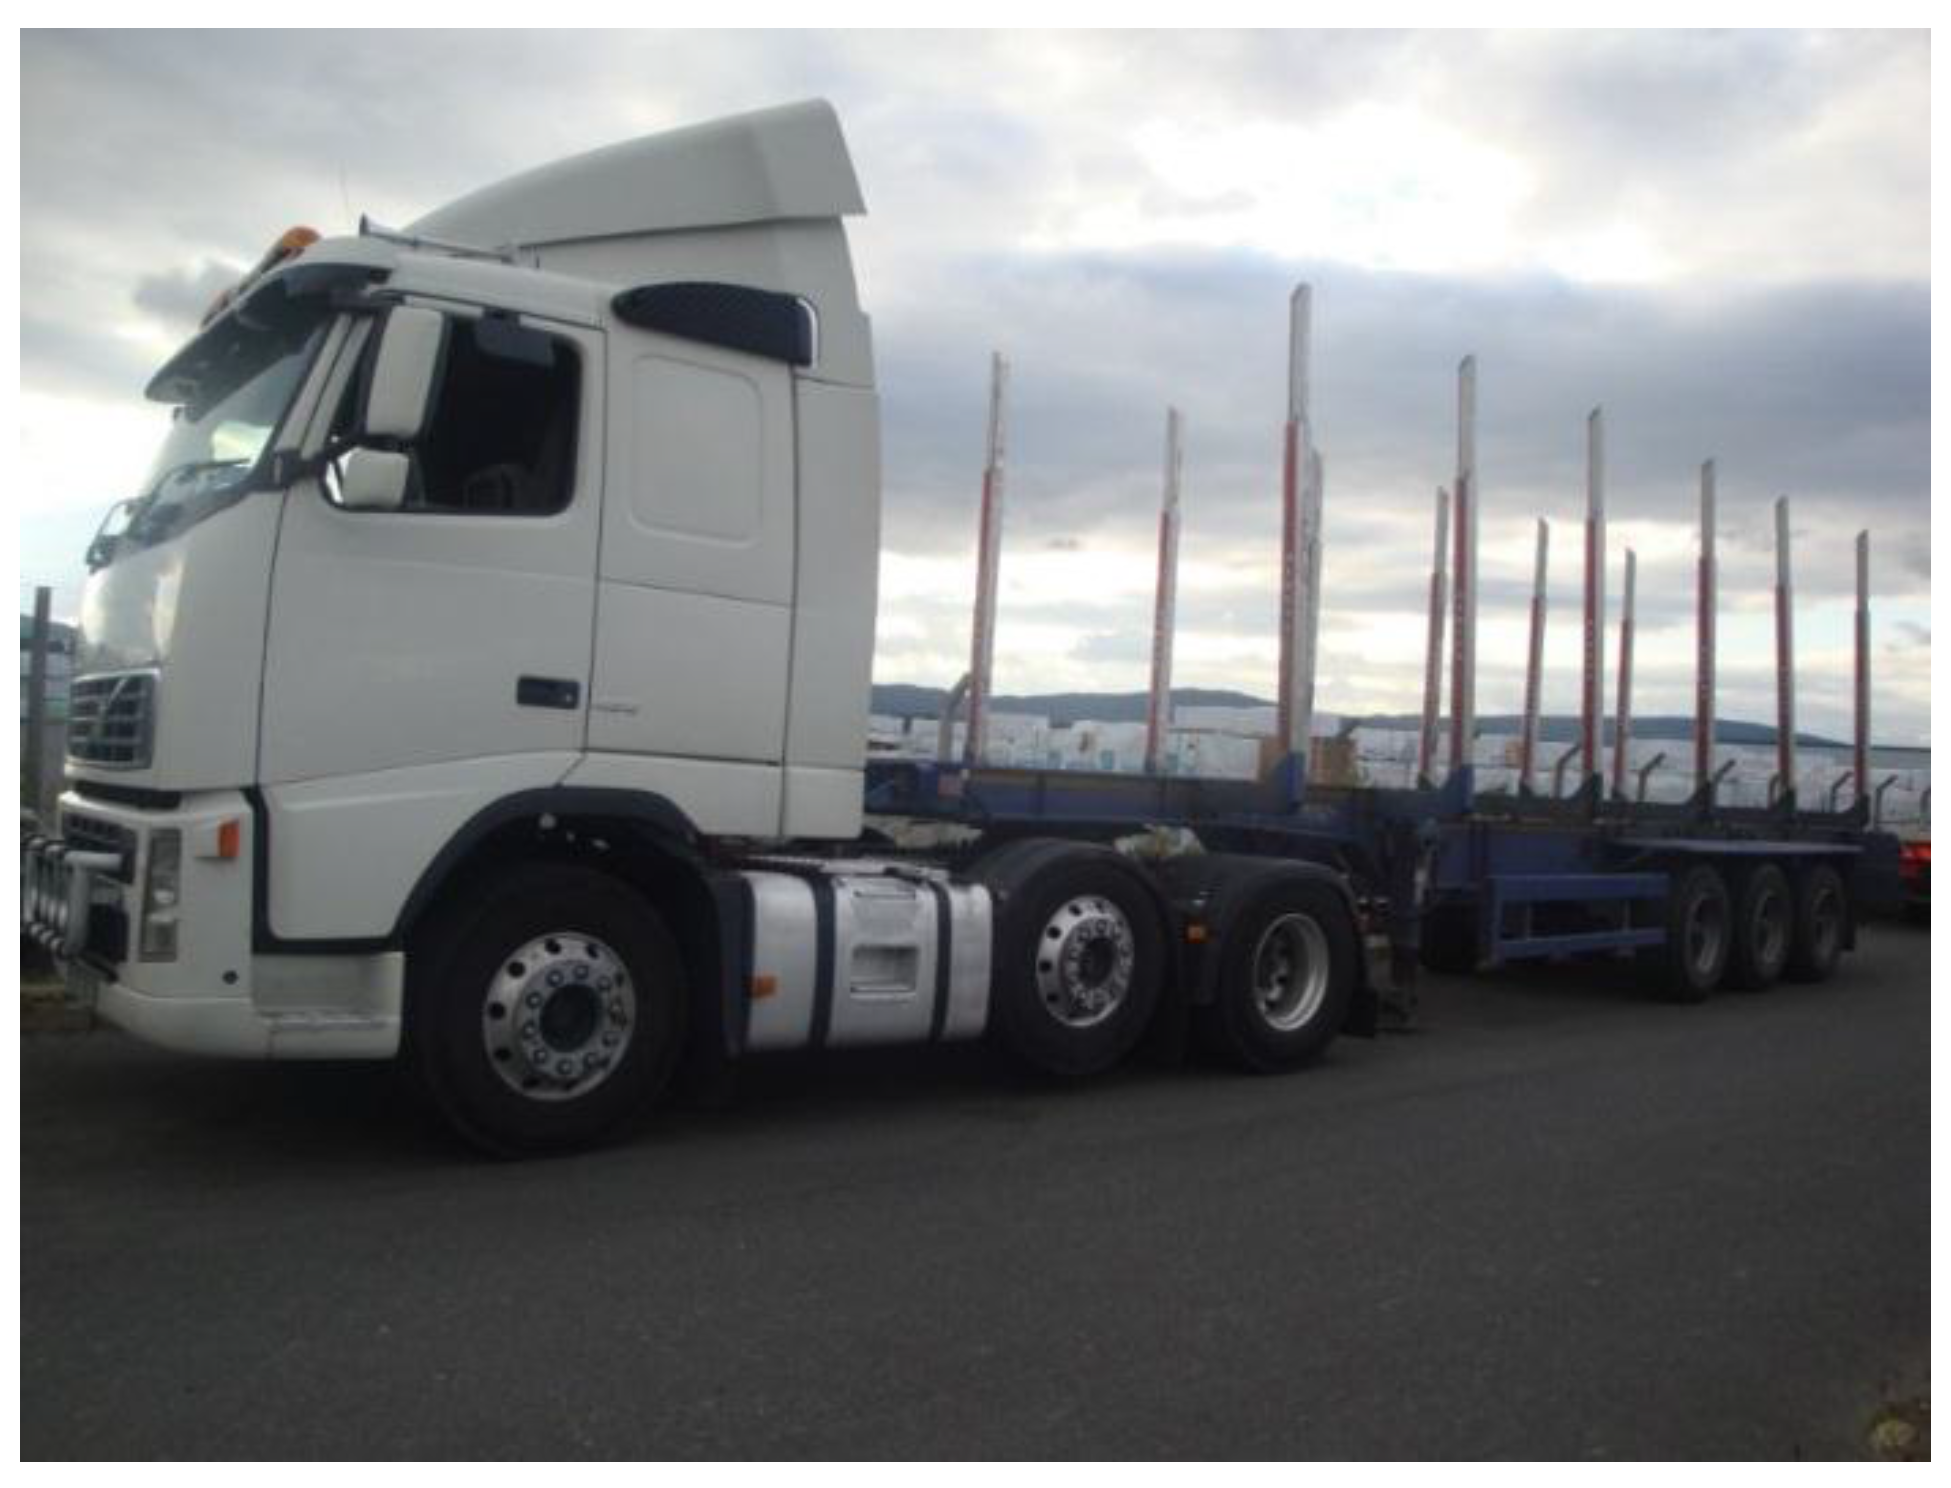
2.2. Truck Used in the Study

The truck used in the study was a Volvo FH12 (6 × 2) with 12.8-litre diesel engine with 460 horsepower (HP) and torque up to 2500 Nm coupled with Euro 4 tiered emission regulations. The engine has superior performance to its predecessor, but also offers increased fuel efficiency and environmental characteristics as a result of the Euro 4. It features high-technology design features like overhead camshaft, four-valve technology and unit injectors, together with the powerful volvo exhaust brake (VEB). The truck trailer combination was 6 axles giving a design gross vehicle weight of 46 tons with the truck having a mid-lift air suspension axle as opposed to the double drive options. The timber trailer was a 13.6 m Dennison™ timber skellig trailer with road friendly air suspension and 365/R22.5 super single wheels (Figure 2).
Figure 2. Volvo FH12 Truck used in the study.
Energies 08 12004 g002

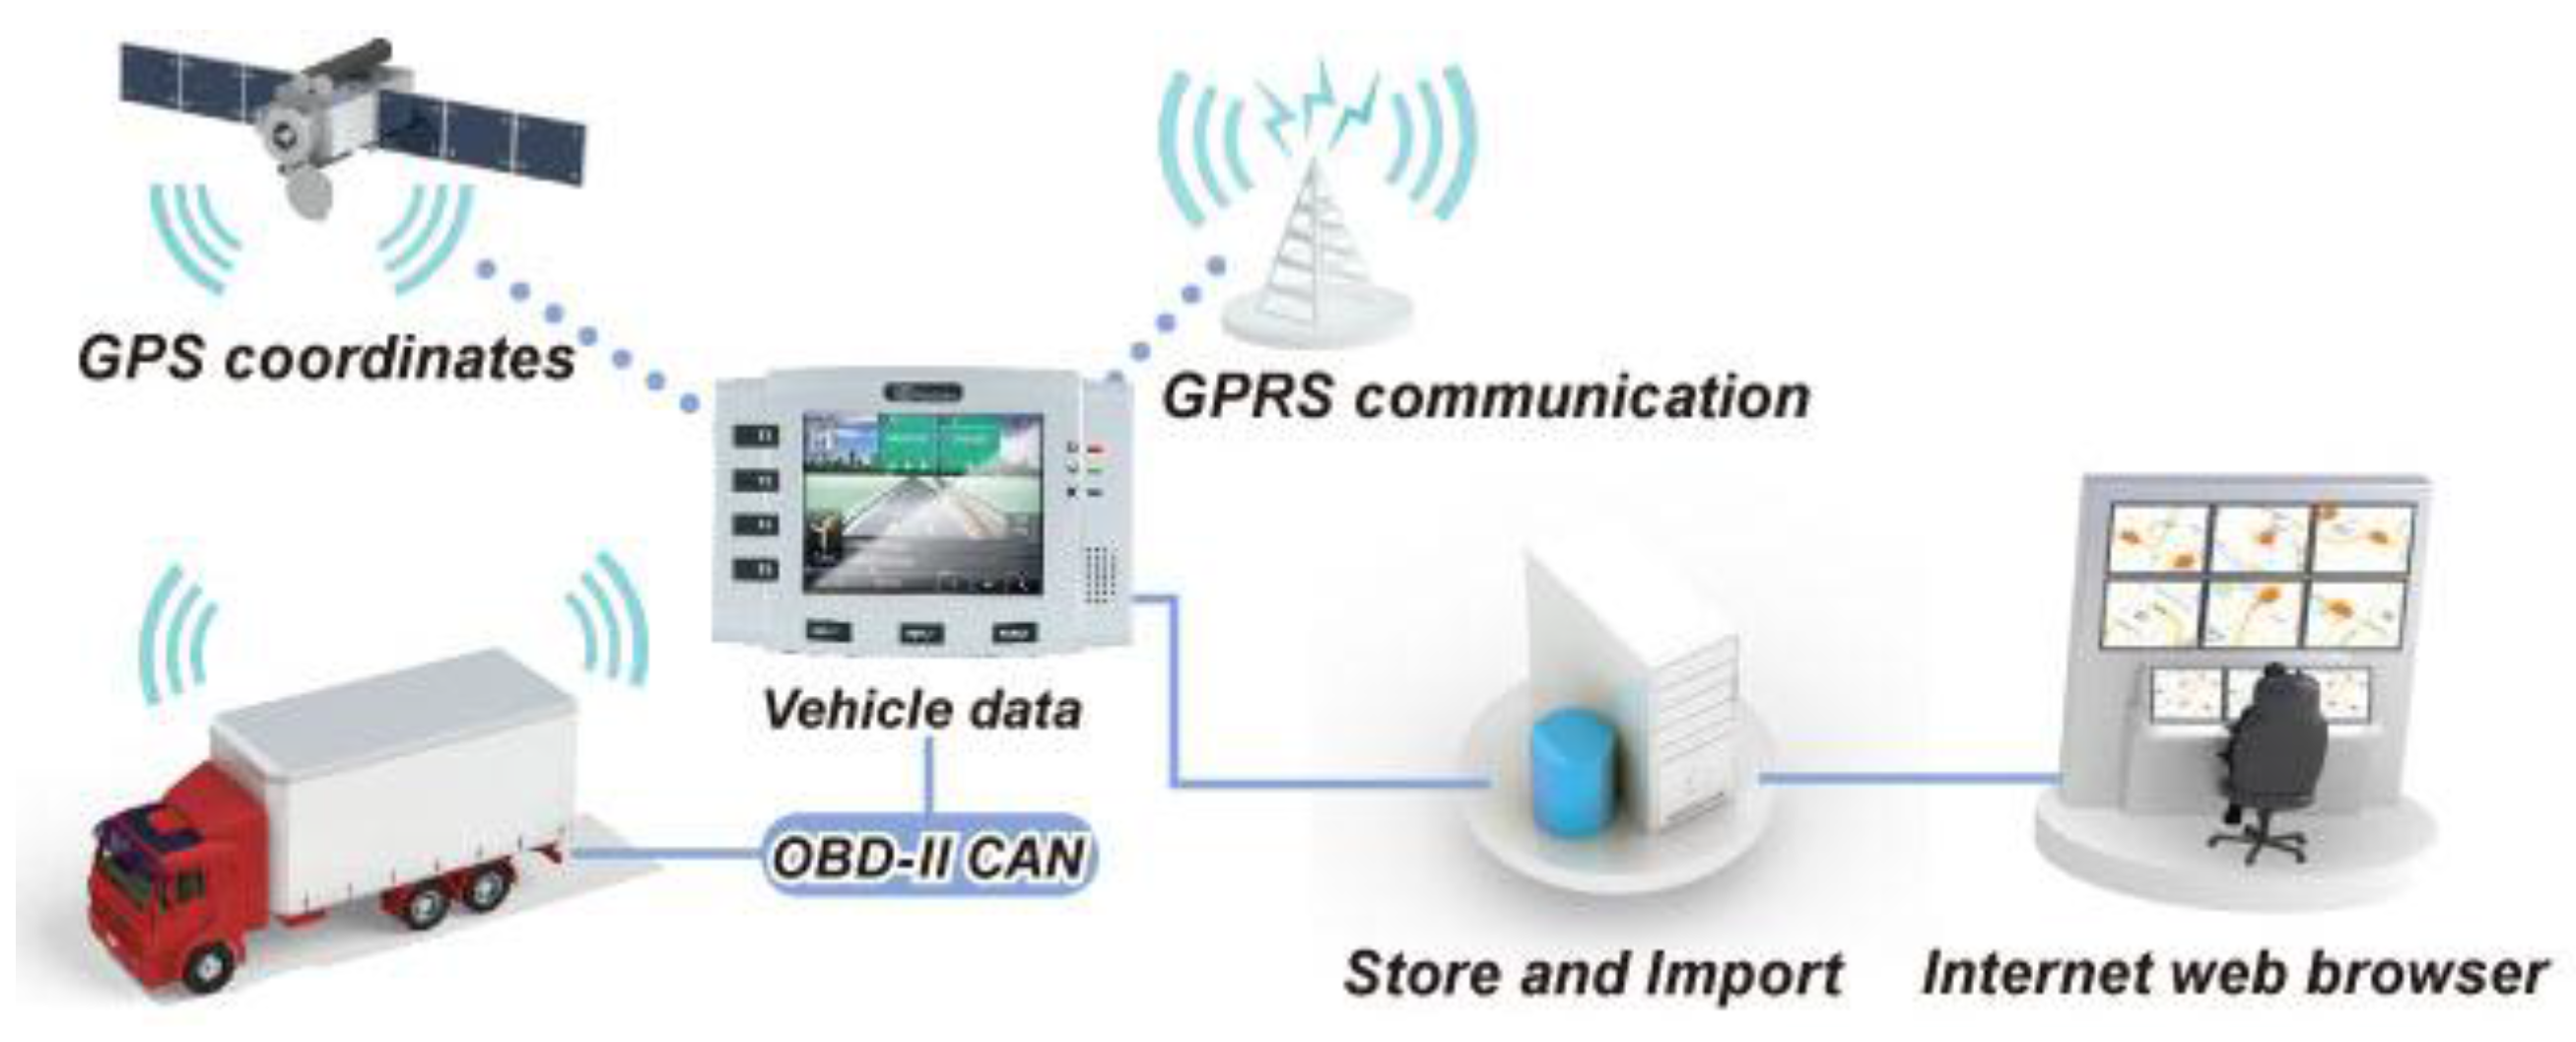
2.3. Fleet Management Systems

A fleet tracking system called R: COM provided by the service platform of Blue Tree was used in this study [20]. It consisted of a tracking system connected to the controller area network (CAN)-bus from the fleet management system (FMS) gateway on the truck’s engine. It has a GPS tracker positioned on the outer side of the dashboard so that it becomes visible through the front windscreen. The GPS Blackbox is fitted with a standard mobile phone SIM card and positional Latitude and Longitude. Information is recorded by the GPS and sent via the global system for mobile communications/general packet radio service (GSM/GPRS) phone network to the data servers. The system reports vehicle’s start up (ignition on) and shut down (ignition off) times, location, total travelling times, idling time and fuel consumption. The truck movements can be viewed in real-time and data are downloaded by logging online into the Blue Tree system (Figure 3).
Figure 3. Truck management system architecture scheme [21]. GPS: global positioning systems; GPRS: general packet radio service.
Energies 08 12004 g003

2.4. Data Management and Analysis

The recording interval of the truck’s position from the GPS was 1 min; these recordings were saved as an Excel file. The Excel files contained the truck’s positions as a series of columns indicating the Longitude (X, or Easting) and Latitude (Y, or Northing) in decimal number format. These data were converted to shapefiles where each GPS position point was transformed to a feature point using the Data Management Tool available in ArcGIS. GPS data are most often recorded in a geographic coordinate system world geodetic system (WGS) 1984 datum in this study), and with the use of the Projections and Management Tool also available in ArcGIS it was transformed to a projected coordinate system (TM65 Irish National Grid in this study) in order to be integrated to the Irish road network map [22]. Map projection allowed the correct alignment of data from different spatial references within GIS for linear analysis such as distance and positional accuracy to the underlying road network.
A total of 38 days and an average of 76 round trips were recorder using the R: COM system. Distance (odometer readings), speed and travelled time per road class, loading and unloading were recorded and determined for each road class per trip. Weight data from the truckloads were gathered from weighbridges at the destination.
The routes to the destination taken by the truck were based entirely on the knowledge and experience of the truck driver. The driver’s working hours are defined in this study as “working shift”, and it was divided into work phases (Table 1). The tracking system recorded odometer readings and if the ignition was tuned on or off, which enabled to determining legal breaks, while the use of Google Earth allowed identification of stopping (rest) areas corresponding to fuel stations where the fuel tank was refilled.
Table 1. Main work phases on the working shift.
Work PhaseDescription
DrivingDriving includes the total time driving from the depot to the forest, forest to the plant and plant to the depot during the total working shift.
Legal breaksLegal breaks includes the truck stopping at resting areas for legal breaks.
RefuellingTime filling the truck’s tank with fuel.
LoadingLoading time starts when the driver stops the truck to start using the truck’s loading crane, and finishes when the truck starts moving from the loading site
UnloadingUnloading time starts when the truck enters the weighbridge at the mill and ends when the truck leaves without a load.
Driving loadedDriving from when the truck leaves the forest road area after loading to when the truck stops at the mill gates to deliver the load.
Driving unloadedDriving from when the truck leaves the mill entrance after unloading to when the truck stops at the stat of the forest road to be loaded.

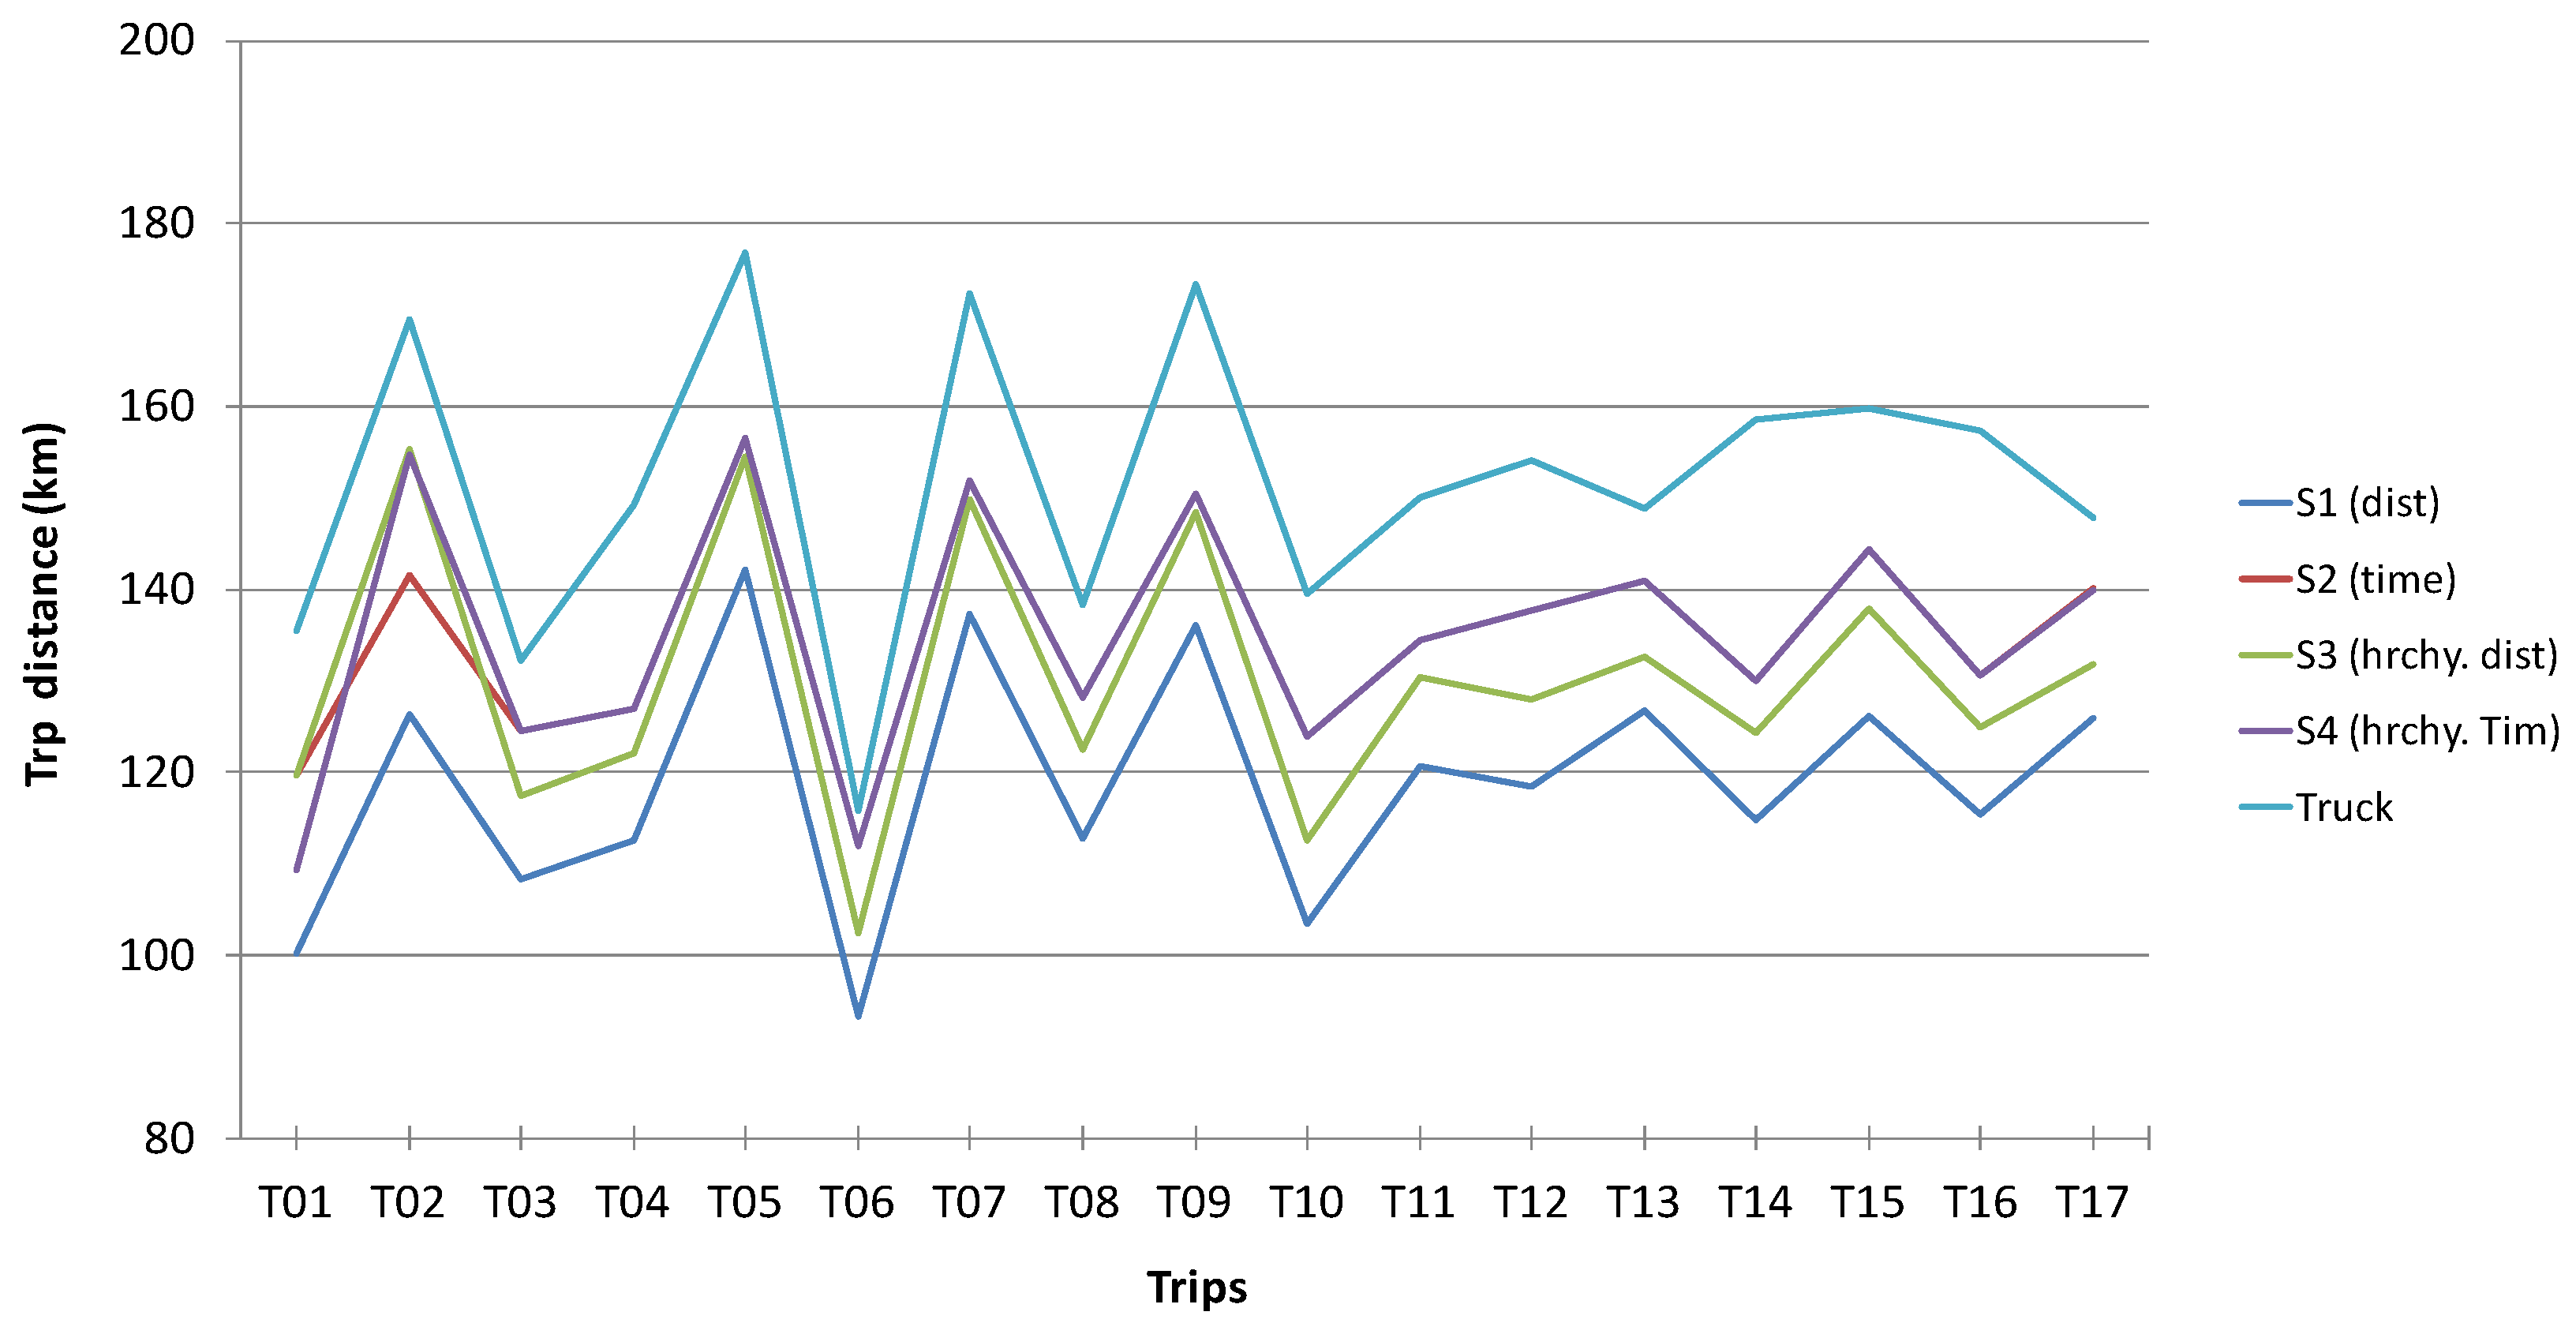
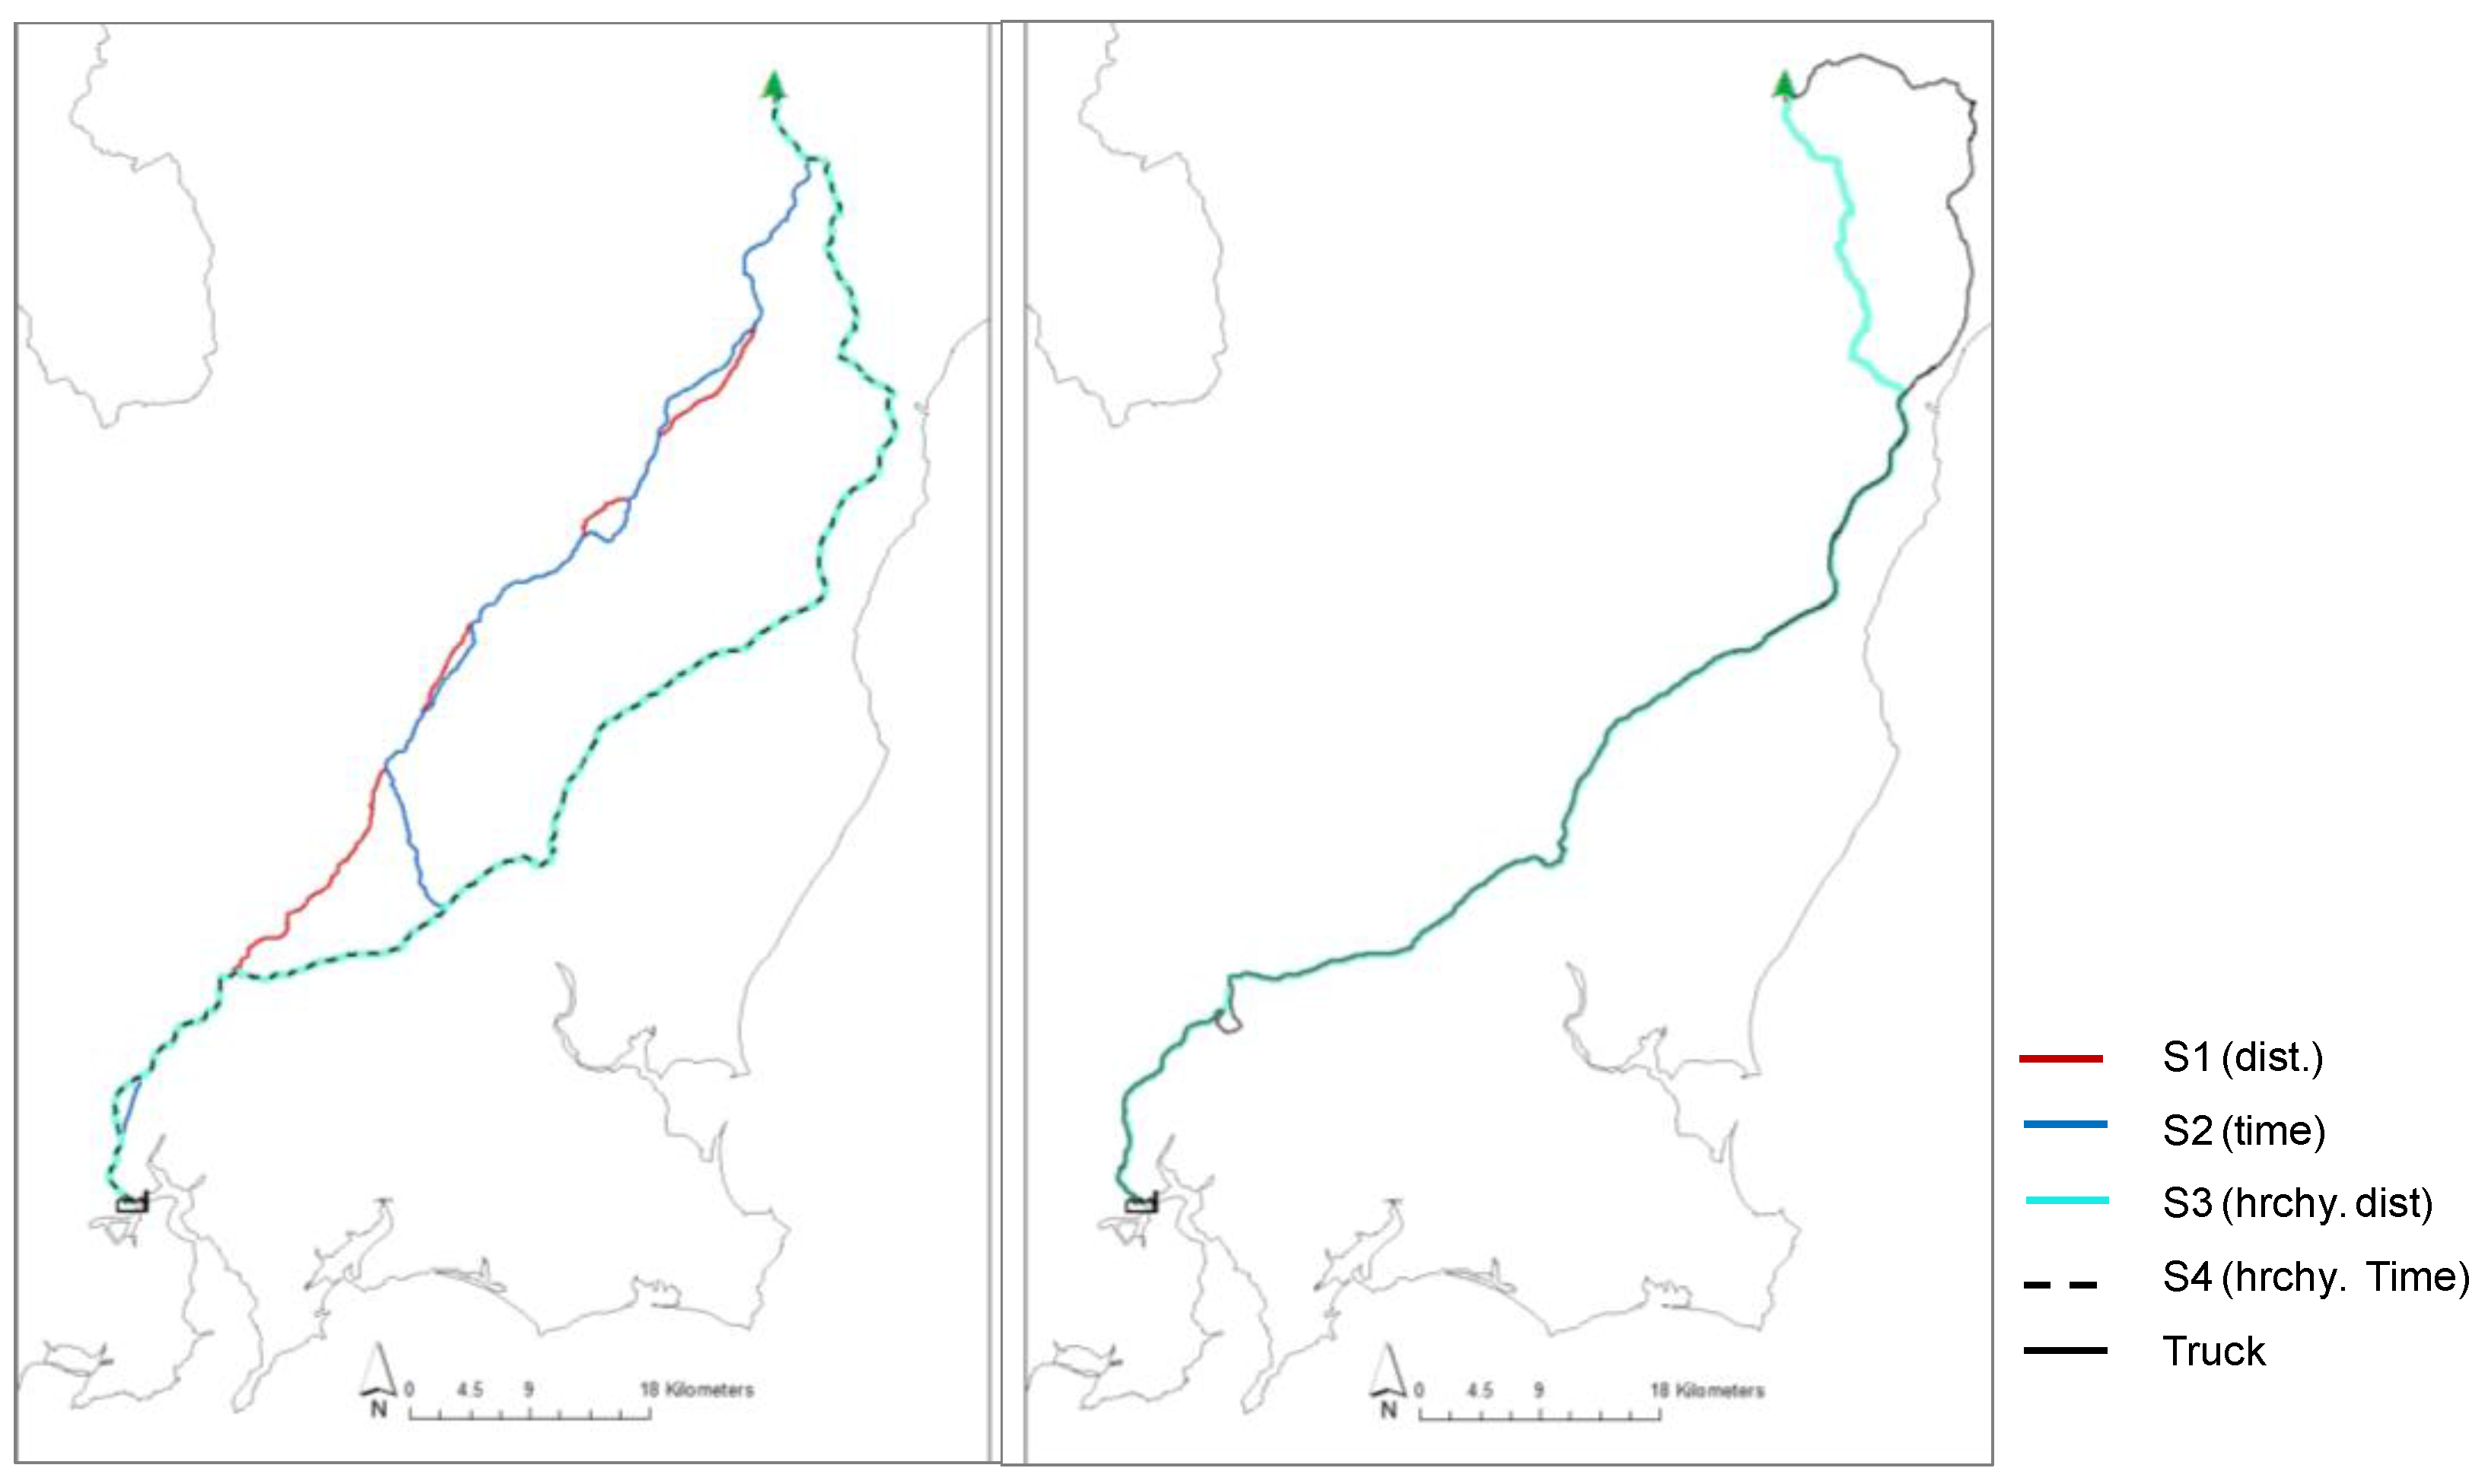
2.5. Selection of Optimal Routes

In its most basic form, a routing problem involves travelling from origin to destination with a minimum of distance travelled. NA is an extension of ArcGIS 10.1®; it is a powerful tool that allows building a network dataset, and provides network-based spatial analysis that includes the optimal route, travel directions, closest facilities, service area analysis, and origin-destination analysis.
NA uses the Dijkstra algorithm, a classical network analysis technique to find the least-cost paths based on distance, time or weighted cost. It uses the topological representation of the road network. Arcs hold attributes such as the road segment length, speed and other attributes. For each resource location (forest), NA scans the road network and assesses all the adjacent nodes and the nearest node is selected. This process is repeated until the destination node is reached. Applications of the NA tool can be found in other studies [23,24,25].
The Irish digital road network was represented as feature classes of each road types. Each road class is constituted by arcs connected by nodes, where the nodes represent the road intersections and the arcs represent homogeneous road segments. The Irish road network created represented the connections of 5917 nodes and 8941 links. A network dataset was created with the NA tool, which included the feature classes of the road network and supply and demand locations. The network’s connectivity is based on geometric coincidence. Connectivity allows the path finding analysis to be possible within NA.
After creating the network dataset the NA wizard was added to ArcMap’s interface in order to create travelling routes. Feature class attributes like distance and legal maximum speed limits were used by NA to determine travel time per road segment. Time spent at intersections, road tolls, roundabouts, traffic lights and road construction work was not included.
The routes taken by the truck driver (truck) and recorded by the tracking system were compared in terms of travelling time, distance and cost and use of the different road types with alternative routes simulated by NA. Four scenarios based on the criteria for determining the alternative routes were analysed:
-
Scenario 1 (S1): The route was chosen based on the least accumulative distance travelled on the road network.
-
Scenario 2 (S2): The route was designed based on the less required ravelled time.
-
Scenario 3 (S3): Shortest distance routes were chosen while prioritising travelling on higher-class roads.
-
Scenario 4 (S4): Shortest time routes were chosen while prioritising travelling on higher-class roads.
Local Authorities prefer timber trucks to move on higher road types (motorways, national primary roads and national secondary roads) in order to minimize the expenses associated with road maintenance [15]. In scenarios S3 and S4, these roads are prioritized by assigning a hierarchy that makes use of a heuristic that favours travelling on higher of the hierarchy (higher road classes). The ranges that define the hierarchy attribute were based on a “cost weighting” (not the actual cost of road haulage) applied as attributes to the attribute table of each road type’s feature class within ArcGIS before the geometric dataset was built (as these values cannot be modified afterwards). When the weights were applied, Dijkstra’s routing algorithm scanned the road network and selected the nodes of highest road classes so that the shortest cumulative distance or time (S3 or S4) is achieved from the origin to the destination node. The values are based upon the relative significance of using the different types of routes and have been used by [11] and [16] (Table 2).
Table 2. Cost weights applied to road classes in the geometric network.
Road ClassificationRoad DescriptionCost Weighting (units/km)
MMotorway1
NPNational primary3
NSNational secondary5
RRegional8
LThird class12

3. Results and Discussion

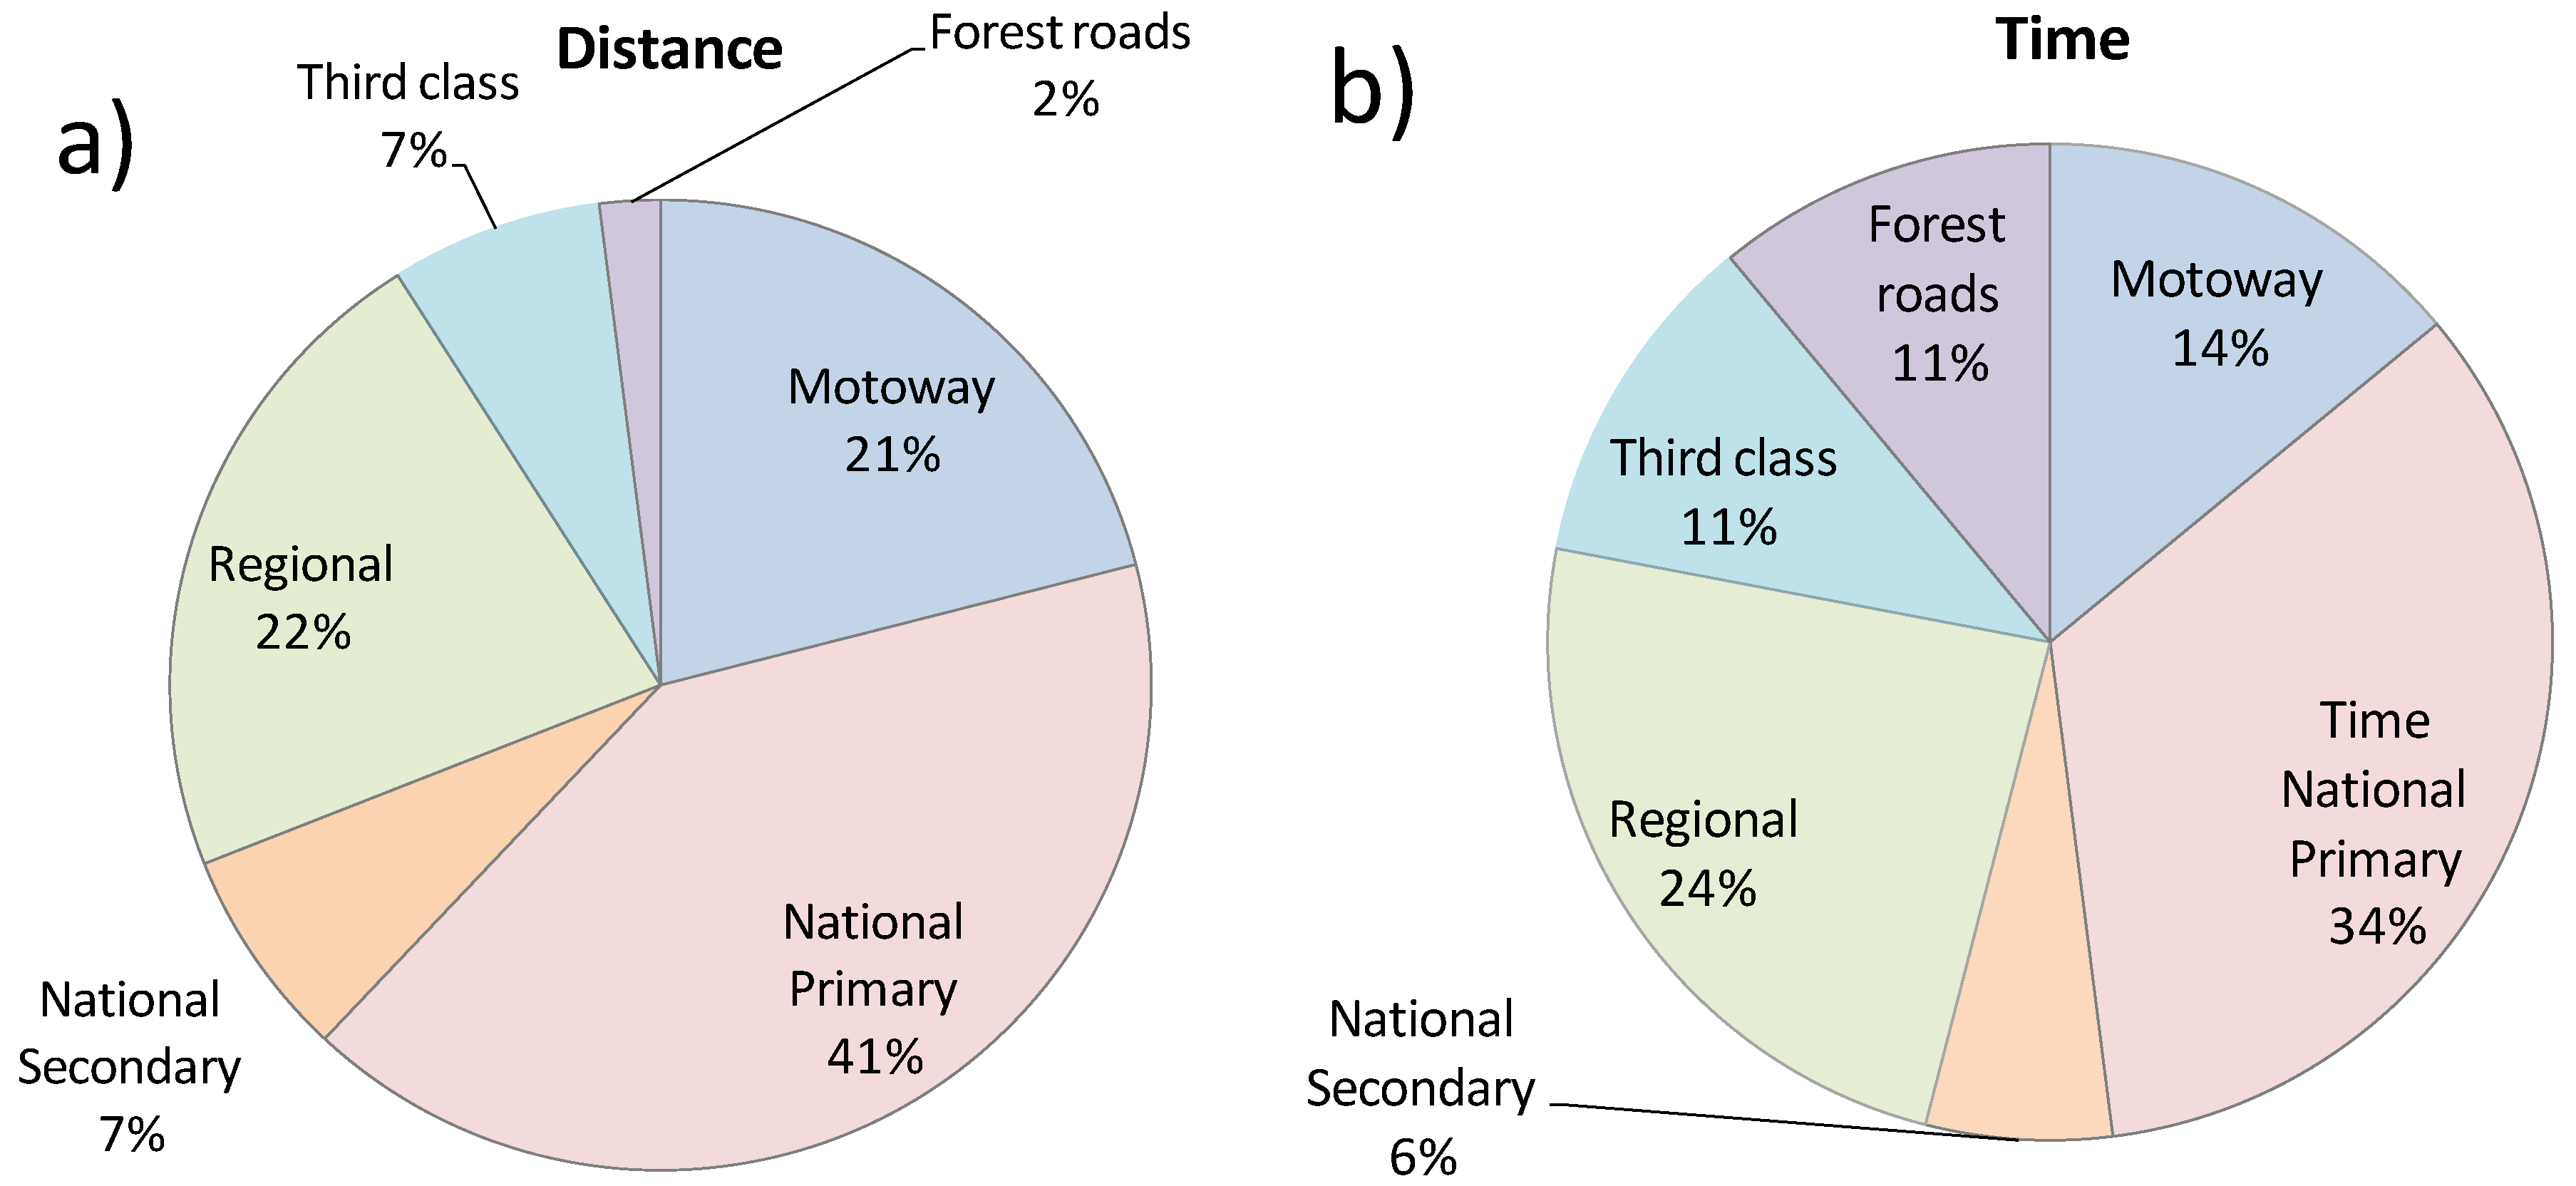
3.1. Time and Road Network Utilisation

For a one working day, shift the tracking system installed in the truck provided approximately 760 GPS sampling points. In total, 152 trips were recorded, representing a total of 16,640 km travelled in total. Driving occupied on average 69.17% of the time per shift, an average 12.48% of the working shift corresponded to legal breaks, and refilling the truck’s fuel tank took 1.91%. Total loading and unloading times during the work shift constituted 9.55% and 6.88%, respectively. Per trip, the productivity of loading and unloading an average truck volume capacity of 69 m3 was 2.55 m3/min loading and 1.97 m3/min unloading.
During a working shift, Nurminen and Heinonen [26] found that driving occupied was approximately 59%, while in Holzleitner et al. [8] found it was 60%, based on an average trip distance of 50 km. The average driving time was 9 h and the total breaks taken by the driver added to an average of 1.5 h (Table 3). These values complied with the EU road transport working time directive. This working time directive states that a driver can drive for a maximum of 9 h in one day. This can be increased to 10 h twice a week resulting in a total of 56 h in one week but only a total of 90 h in any two-week period. In terms of legal breaks, after 4.5 h driving, a driver must take a break of 45 min. This break can be replaced by breaks of at least 15 min each, distributed over the driving period [27].
Table 3. Time of different work operations.
Work OperationsTime (min)% Time UsedStd. Dev.
Per shiftDriving54369.1790
Legal breaks9812.4813
Refuelling151.9108
Loading759.5526
Unloading546.8814
Per tripLoading 359.7805
Unloading277.5407
Driving loaded 15242.4617
Driving unloaded14440.2218
The travel distance per trip varied from 112 km to 197 km. The average loaded trip distance was 153 km, while for unloaded trips the average distance was 147 km—this represents 49% of back haulage. The road types in the road network were used in different proportions, with national primary and regional roads being the most used in terms of distance and time. The proportion of distance travelled on forest roads was an average of 2% or 4.38 km (Figure 4). An Austrian study by Holzleitner et al. [8] presented an average distance travelled per trip on forest roads of 7.7 km. Transportation time is dependent on factors such as driver performance, truck engine, road and track conditions, weather, etc. These factors were held constant throughout the analysis as in Dahal and Mehmood [10].
Figure 4. Average (a) distance and (b) time per road type.
Energies 08 12004 g004

3.2. Truck’s Speeds on the Road Network

The average speeds of the truck driving on different road classes, loaded and unloaded, are shown in Table 4. In all the tracking data analysed the truck kept its speed under the legal speed limits established by the Irish government [28]. In general, the truck’s speed recorded on the different road classes was on average 30% lower than the legal maximum speed. Average speed on different functional road classes varied from 83 km/h on motorways to 35 km/h on third class roads, while average speed on forest roads was on average 15 km/h.
Table 4. Average speeds per road type travelling loaded and unloaded.
Road typeLegal limit (km/h)Avg. Speed (km/h)Speed Unloaded (km/h)Speed Loaded (km/h)
Avg.Std. Dev.Avg.Std. Dev.
Motorway12083866813
National primary10073744722
National secondary10070726665
Regional8053547519
Third class5035404337
Forest roads--152152

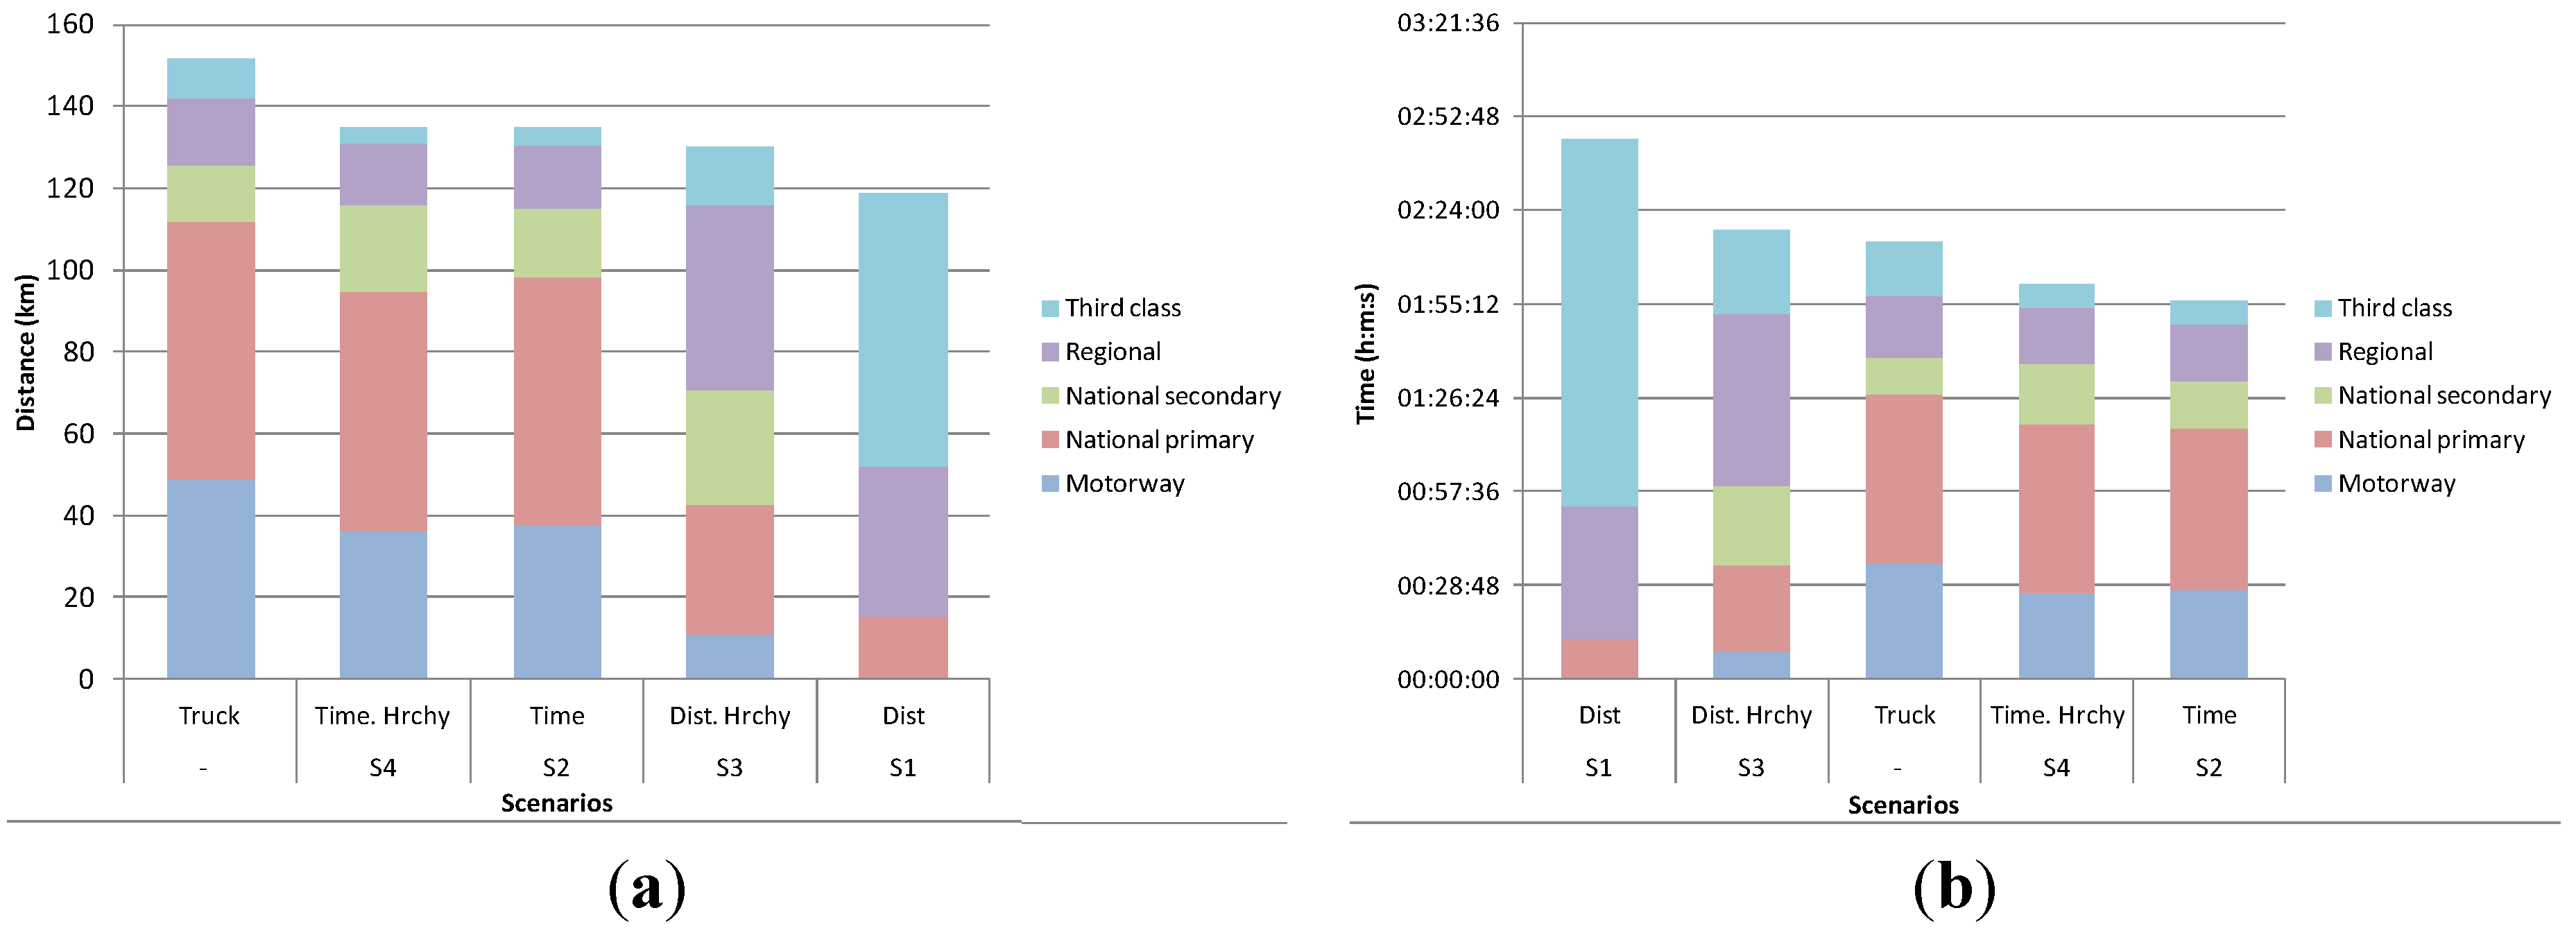
3.3. Determination of Best Routes for Biomass Haulage

Trips taken by the truck from 17 different harvest areas to the mill were identified and analysed, a total of 68 routes resulted from the four scenarios evaluated with NA. The transport distances from all these routes are presented in Figure 5. All the routes chosen by the truck driver were the longest in term of distance with an average 151.72 km, followed by scenarios S2 and S4 (134.91 km and 135.06 km, respectively). On the other hand, the minimum distance resulted from routes in S1, with average routes of 118.21 km, followed by S3 with average distance of 130.27 km (Table 5).
Figure 5. Comparison of travelling distance per trip under five different routing scenarios: shortest distance (S1), shortest time (S2), hierarchical shortest distance (S3), hierarchical shortest time (S4), and routes taken by the truck (S5).
Energies 08 12004 g005
The routes originated based on shortest distance had the longest travelling time (S1 and S3), with routes in S1 having an average driving time of 2 h and 46 min, approximately 19% more time than the routes taken by the truck. Routes in scenarios S2 and S4 had approximately 30% less driving time than S1. The driving time of the routes selected by the truck driver were in the middle in terms of time with an average of 2 h and 14 min per trip (Table 5).
Table 5. Summary of average distances and time per route under different scenarios.
Road class(S1) Distance(S2) Time(S3) Distance (hierarchy)(S4) Time (hierarchy)Truck
Distance (km)Motorway037.6311.0336.2148.86
National primary15.1160.8031.3858.5063.05
National secondary0.216.6528.0721.3513.54
Regional36.4415.5645.3314.9716.57
Third class67.114.2914.464.049.70
Total118.21134.91130.27135.06151.72
Time (h:m:s)Motorway000:27:1200:08:1200:26:3100:35:19
National primary00:12:1300:49:5800:26:3300:48:4400:51:49
National secondary00:00:1000:14:1600:24:4600:18:3300:11:36
Regional00:40:3500:17:3700:52:5000:17:1000:18:45
Third class01:53:1100:07:2100:25:3200:07:0100:16:38
Total02:46:1001:56:2402:17:5401:57:5902:14:08
Shortest path routes determined by S1 and S3 did not replicate the actual routes taken by the truck. Routes selected based on shortest driving time S2 and S4 agreed 99% on the driving directions, while the routes taken by the truck coincided 77% with the driving directions of routes from scenario S2 and S4. An example of the geographical representation of the routes under different scenarios can be seen in Figure 6. The routes selected by the truck drivers demonstrate that the shortest distance routes are not necessarily the best routes for the truck drivers. Truck drivers have preferences on the types of roads they take; these preferences can be described by road features such as road length, quality, width, slope, speed limits, etc. [18].
Different proportions of road types were chosen in each scenario, when the objective was to find the shortest distances, routes presented a higher proportion of third class and regional roads (S1 and S3). When the objective was to find the routes based on shortest time (S2 and S4), the routes presented a higher proportion of national primary roads and motorways (Figure 7).
Figure 6. Geographical representation of routes under different scenarios and selected by the truck driver.
Energies 08 12004 g006
Figure 7. Different proportions of road types by routes under different scenarios: (a) by distance; (b) by time.
Energies 08 12004 g007
The lower the kilometres travelled per litre of diesel, the higher the fuel consumption, resulting in increased cost per kilometre and thus decreased revenue per kilometre. Low km per litre also implies more kilograms of CO2 emitted into the atmosphere. Fuel consumption by trucks is one of the largest contributors of greenhouse gases (GHGs) [5]. Carbon dioxide emissions are directly related to the amount of diesel burned and one litre corresponds to 2.67 kg of CO2 [29]. Based on the average distances per trip presented in Table 5 (Section 3.3) and taken into consideration that the driver delivered two loads per workday, choosing the shortest distance routes (S1) implied a reduction in CO2 emissions of 12% in comparison to S2 and S4.
Dockets from the weighbridge at the mill recorded the weight of the loads supplies during the study. The average truck payload was 28,300 kg (±1500 kg) and complied with the Irish vehicle regulations, as the truck weighed less than the legal maximum gross vehicle weight of 44,000 kg. Average fuel consumption per unit of production (ton) was 19.63 L/ton (±1.02 L).
The cost calculation of truck transportation was divided into those that are independent of the transportation distance and costs that depend on distance (Table 6). With approximately 55,920 truckloads carrying the round wood harvested in 2013, and an average running cost of 0.83 €/km, choosing routes based on shortest distance instead of the ones chosen by the ones the truck used could translate into 1.5 million euro savings per year. However, these shortest distance routes are composed mostly of low class roads (third class), increasing road maintenance costs for Local Authorities and problems with public safety. Choosing routes with shortest distance but that prioritises higher road classes can produce approximately 0.8 million euro savings per year in comparison with the routes selected by the truck driver.
Table 6. Truck and trailer standing and running costs for six axle articulated truck [30].
DescriptionTruckTrailer
Cost basisVehicle cost (€)86,00033,000
Depreciation years610
Average km annually120,00040,000
Working days annually240240
Average tyre life km100,00050,000
Standing costs per annumWages (€)38,0000
Depreciation (€)14,3333300
Road tax (€)26000
Insurance (€)5300400
Interest (€)43001500
Overhead per vehicle (€)14,4970
Standing cost per annum (€)79,3375200
Standing cost per day (€)330.622
Running cost per kmCost of 1 litre of fuel (net of vat) (€)0.970
Litres per 100 km’s640
Km’s per litre1.560
Fuel cost per km (€)0.620
Tyres (€)0.060.06
Maintenance/Repairs (€)0.040.05
Running cost per km (€)0.720.11
Transportation cost per ton was sensitive to the transportation distance. Fuel consumption per unit of production in general is affected by the hauling distance; the greater is the hauling distance, the higher is the fuel consumption per unit of production [5]. Nurminen and Heinonen [26] analysed different types of truck configurations and concluded that the use of semi-trailer trucks were more competitive due to a bigger load size, increasing productivity per hour and when transportation distances increased.
An important problem in forest operations is how to organise daily trips for a truck or fleet of trucks from different stands to different demand plants [31]. The aim of truck scheduling is to maximise the utilisation of the truck’s capacity during a day. Therefore, when selecting the routes, travel time can be a much more crucial parameter to analyse rather than distance in terms of transportation costs. Choosing the routes generated in scenario S2 and S4 over S1 and S3 implied an increase in distance by 12%, but a decrease in time of 30%. This decrease in time allow trucks to be within the legal maximum driving time, while being able to deliver two loads, which it could not be possible following the routes in S1 and S3. Less driving time translates into better driving conditions across higher classes or roads, less wear and tear of trucks, less diesel and overall less expense for hauliers.

4. Conclusions

The projected increasing demand for wood biomass will result in longer distance transportations, as the forest units in Ireland tend to be small and are scattered over an extended geographical area. This does and will continue to make truck haulage the main mode of transportation. This study aimed to understanding the characteristics of biomass haulage in Ireland, and also to determine the best, cost-effective routes for biomass supply.
The semi state forest company Coillte, is now implementing the use of tracking systems on all its timber haulage trucks. The analysis conducted in this study shows the benefits of these portable, wireless communication and Internet-based systems for fleet management. It enables recording data that otherwise would be more expensive and time consuming to gather. The combination of tracking technology with GIS aided in the analysis of driving distances, times and fuel consumption. Results showed that driving occupied on average 69% of the driver’s working shift, and highlighted the inefficiency of transportation by driving empty almost half of the time, and the high amount of time spent driving on forest roads (an average 2% of the total distance and 11% of the total time).
In terms of route selection, with the use of ArcGIS extension tool NA routes based on four scenarios were determined based on: shortest time (S1), shortest distance (S3), and prioritising high class roads with shortest time (S2) and distance (S4). Results showed that routes in S1 had 12% shorter distances than the routes in S2 but an increase in travelling time of 30%. Shorter distance routes also have an increase proportion of lower standard roads (88% vs. 14% in regional and third class roads in S2). This makes road maintenance more expensive for the Local Authorities. The routes taken by the truck driver coincided with the directions of the routes based on shortest driving time (S2 and S4) 77% of the time.
In conclusion, the findings of this study illustrate the trade-offs of selecting biomass transportation routes based either on shortest driving distance or time. Although shortest distance implies less fuel consumption, less driving time on higher road classes translates into better driving conditions, less wear and tear of trucks and less fuel used. It also complies with local authorities preferences of having timber trucks move on higher road types in order to minimise the expenses associated with road maintenance.

Acknowledgments

This study was funded by CoFoRD Forest Energy Programme 2008/RD (National Council for Forest Research and Development in Ireland) and under the Charles Parsons Energy Research Program (Grant Number Grant Number 6C/CP/E001) of Science Foundation Ireland (www.sfi.ie).

Author Contributions

Amanda Sosa and Ger Devlin collected the data and wrote the manuscript. Kevin McDonnell is the principal investigatoron the project.

Conflicts of Interest

The authors declare no conflict of interest.

References

  1. Tahvanainen, T.; Anttila, P. Supply chain cost analysis of long-distance transportation of energy wood in Finland. Biomass Bioenergy 2011, 35, 3360–3375. [Google Scholar] [CrossRef]
  2. Murphy, G.; Hall, P. Reducing Trucks on the Road through Optimal Route Scheduling and Shared Log Transport Services. South. J. Appl. For. 2003, 27, 198–205. [Google Scholar]
  3. Knaggs, G.; O’Driscoll, E. Woodflow and Forest-Based Biomass Energy Use on the Island of Ireland 2013; Programme of Competitive Forestry Research for Development (COFORD): Dublin, Ireland, 2014. [Google Scholar]
  4. Murphy, F.; Devlin, G.; McDonnell, K. Forest biomass supply chains in Ireland: A life cycle assessment of GHG emissions and primary energy balances. Appl. Energy 2014, 116, 1–8. [Google Scholar] [CrossRef]
  5. Klvač, R.; Kolařík, J.; Volná, M.; Drápela, K. Fuel Consumption in Timber Haulage. Croat. J. For. Eng. 2013, 34, 229–240. [Google Scholar]
  6. Transport Research Laboratory. Overseas Road Note 40: A Guide to Axle Load Surveys and Traffic Counts for Determining Traffic Loading on Pavements; Department for International Development: Berkshire, UK, 2004. [Google Scholar]
  7. Road Haulage of Round Timber: Code of Practice; Irish Forest Industry Chain: Dublin, Ireland, 2003.
  8. Holzleitner, F.; Kanzian, C.; Stampfer, K. Analyzing time and fuel consumption in road transport of round wood with an onboard fleet manager. Eur. J. For. Res. 2010, 130, 293–301. [Google Scholar] [CrossRef]
  9. Sikanen, L.; Asikainen, A.; Lehikoinen, M. Transport control of forest fuels by fleet manager, mobile terminals and GPS. Biomass Bioenergy 2005, 28, 183–191. [Google Scholar] [CrossRef]
  10. Dahal, P.; Mehmood, S. A GIS Approach to Determining Efficient Timber Transportation Routes. Avaliable online: http://sofew.cfr.msstate.edu/papers/0604dahal.pdf (accessed on 21 April 2013).
  11. Devlin, G.; McDonnell, S.; Ward, S. Development of a Spatial Decision Support System (SDSS) for route costing calculation within the Irish timber haulage sector. Trans. ASABE Am. Soc. Agric. Biol. Eng. 2008, 51, 273–279. [Google Scholar]
  12. Morgenroth, J.; Visser, R. Uptake and barriers to the use of geospatial technologies in forest management. N. Z. J. For. Sci. 2013, 43. [Google Scholar] [CrossRef]
  13. Ranta, T.; Rinne, S. The profitability of transporting uncomminuted raw materials in Finland. Biomass Bioenergy 2006, 30, 231–237. [Google Scholar] [CrossRef]
  14. Devlin, G.; McDonnell, K.; Ward, S. Timber haulage routing in Ireland: An analysis using GIS and GPS. J. Transp. Geogr. 2008, 16, 63–72. [Google Scholar] [CrossRef]
  15. Martin, A.; Owende, P.; Holden, N.; Ward, S.; O’Mahony, M. Designation of timber extraction routes in a GIS using road maintenance cost data. For. Prod. J. 2001, 51, 32–38. [Google Scholar]
  16. UK Timber Transport Forum, Agreed Route Maps 2012. Available online: http://timbertransportforum.org.uk/maps/agreed-routes (accessed on 13 April 2013).
  17. Devlin, G. Developing a GIS based Agreed Routes Map for Sustainable Timber Transport in Ireland—MARTT. In Proceedings of the IrBEA National BioEnergy Conference, Dublin, Ireland, 4 February 2015.
  18. Flisberg, P.; Lidén, B.; Rönnqvist, M.; Selander, J. Route selection for best distances in road databases based on drivers’ and customers’ preferences. Can. J. For. Res. 2012, 42, 1126–1140. [Google Scholar] [CrossRef]
  19. GIS explained 2012. Available online: http://www.osi.ie/education/gis-explained/ (accessed on21 January 2013).
  20. Blue Tree Systems, R:COM Truck management 2011. Available online: http://www.bluetreesystems.com/region/eu/products/solutions/ (accessed on 3 July 2012).
  21. Fleet Management System. 2014. Available online: http://www.geneko.rs/en/products/tracking-products-and-solutions/fox-fleet-management-system-fms.html (accessed on 7 March 2015).
  22. Using ArcGIS 9: Using ArcMap; Environmental Systems Research Institute (ESRI): Redlands, CA, USA, 2005.
  23. Möller, B. Least-cost allocation strategies for wood fuel supply for distributed generation in Denmark—A geographical study. Int. J. Sustain. Energy 2004, 23, 187–197. [Google Scholar] [CrossRef]
  24. Alfonso, D.; Perpiñá, C.; Pérez-Navarro, A.; Peñalvo, E.; Vargas, C.; Cárdenas, R. Methodology for optimization of distributed biomass resources evaluation, management and final energy use. Biomass Bioenergy 2009, 33, 1070–1079. [Google Scholar] [CrossRef]
  25. Panichelli, L.; Gnansounou, E. GIS-based approach for defining bioenergy facilities location: A case study in Northern Spain based on marginal delivery costs and resources competition between facilities. Biomass Bioenergy 2008, 32, 289–300. [Google Scholar] [CrossRef]
  26. Nurminen, T.; Heinonen, J. Characteristics and Time Consumption of Timber Trucking in Finland. Silva Fenn. 2007, 41, 471–487. [Google Scholar] [CrossRef]
  27. Regulation (EC) No 561/2006 of the European Parliament and of the Council of 15 March 2006 on the Harmonisation of Certain Social Legislation and Amending Council Regulations (EEC) No 3821/85 and (EC) No 2135/98 and Repealing Council Regulation (EEC) No 3; European Comission: Brussels, Belgium, 2006.
  28. Road Traffic Act 2004; Irish Department of Transport: Dublin, Ireland, 2010.
  29. Devlin, G.; Klvac, R.; McDonnell, K. Fuel efficiency and CO2 emissions of biomass based haulage in Ireland—A case study. Energy 2013, 54, 55–62. [Google Scholar] [CrossRef]
  30. Devlin, G.; Talbot, B. Deriving cooperative biomass resource transport supply strategies in meeting co-firing energy regulations: A case for peat and wood fibre in Ireland. Appl. Energy 2014, 113, 1700–1709. [Google Scholar] [CrossRef]
  31. Weintraub, A.; Epstein, R.; Morales, M.; Seron, J.; Travieso, P. A truck scheduling system improves efficiency in the forest industry. Interfaces 1996, 26, 1–12. [Google Scholar] [CrossRef]

