Article

Design, Optimization and Energetic Efficiency of Producing Hydrogen-Rich Gas from Biomass Steam Gasification

*
Author to whom correspondence should be addressed.
Department of Chemical Engineering, National Cheng Kung University, Tainan 70101, Taiwan
Energies 2015, 8(1), 94-110; https://doi.org/10.3390/en8010094
Submission received: 24 October 2014 / Accepted: 11 December 2014 / Published: 25 December 2014

Abstract

:
In this article, the conceptual design of biomass steam gasification (BSG) processes using raw oil palm (ROP) and torrefied oil palm (TOP) are examined in an Aspen Plus simulator. Through thermodynamic analysis, it is verified that the BSG process with torrefied feedstock can effectively enhance the hydrogen yield. When the heat recovery design is added into the BSG process, the system energetic efficiency (SEE) is significantly improved. Finally, an optimization algorithm with respect to SEE and hydrogen yield is solved, and the optimum operating conditions are validated by simulations.

1. Introduction

Gasification is a thermochemical process that is currently used to produce higher calorific value gases, such as hydrogen, carbon monoxide, carbon dioxide, methane, and other hydrocarbons [1,2]. In these product gases, the hydrogen and carbon monoxide are called synthesis gas (syngas) which is widely used in heat or power generation and the synthesis of fuels and chemicals, such as ethanol via a chemical BTL (biomass to liquid) process [3,4] and methanol or dimethyl ether (DME) [5]. Biomass can be used as a feedstock for gasification. However, the utilization of biomass as fuels has some drawbacks. For example, raw biomass contains high moisture levels, so the energy density is low compared to that of coal, and it cannot be stored for a long time [6,7,8]. Moreover, it is difficult to comminute the biomass into small particles due to the high energy consumption required for this [7,8,9]. The utilization efficiency of raw biomass is thus relatively low. In order to improve the natural characteristics of raw biomass, the use of torrefied biomass has been considered to replace that of raw biomass and coal. This is because torrefied biomass has a number of advantages, such as a lower moisture content, higher energy density, improved grindability, and the ability to become a more uniform fuel [8,10,11].
In recent years, a combination of torrefaction and gasification has been developed as an effective process to enhance the efficiency of biomass gasification [12,13,14,15,16]. For instance, Chen et al. [12] used a bench-scale laminar entrained-flow gasifier to investigate the effect of torrefied sawdust on gasification. They found that the H2 and CO content increased when using torrefied sawdust, whilst the CO2 content decreased, and the H2 content at the torrefaction temperatures of 270 or 290 °C was lower than that at 250 °C. They also reported that the cold gas efficiency was improved by torrefaction, especially for torrefied sawdust at 250 °C. Kuo et al. [13] evaluated torrefied bamboo gasification based on the thermodynamic equilibrium, and reported that using a torrefaction temperature of 250 °C could enhance the cold gas efficiency compared to that of both raw bamboo and bamboo torrefied at a temperature of 300 °C. More recently Sarkar et al. [14] gasified torrefied switchgrass in a fixed bed by using air as the gasifying agent. They concluded that the severity of torrefaction has a significant influence on gasification performance. Berrueco et al. [15] performed O2/steam gasification of torrefied woody biomass in a lab scale fluidized bed under various pressures. They found that the gas yield and tar were positively influenced by the pressure and torrefaction temperature. Weiland et al. [16] conducted torrefied wood residue gasification in an entrained flow gasifier. They observed that the carbon conversion was improved by the torrefaction pretreatment.
In general, air, oxygen, and steam can be used as gasifying agents to convert carbonaceous fuels into gaseous products [1,2]. However, unlike air and oxygen gasification, using steam as gasifying agent makes it possible to produce hydrogen-rich gas due to the effect of the water gas reaction [1,17,18]. Furthermore, a higher energy content of the produced gas, which is in the range of 10–16 MJ/Nm3, can be obtained compared with 4–6 MJ/Nm3 when using air [1]. However, steam gasification requires external heat, because of the endothermic steam reforming reactions involved [19,20].
In reviewing recent studies, it is evident that gasification in association with torrefaction is an effective and promising method to enhance gasification performance. Although numerous studies have investigated the gasification characteristics of torrefied biomass, very little work has been done on the steam gasification process for producing enriched-hydrogen gas from torrefied biomass. For these reasons, raw oil palm and torrefied oil palm are examined in an Aspen Plus simulator in the present study in order to comprehensively understand the effects of torrefied fuel on steam gasification performance. In addition, a heat recovery design is added to the biomass steam gasification (BSG) process to enhance the system energetic efficiency (SEE). Finally, the optimal operating inlet conditions of the system are obtained.

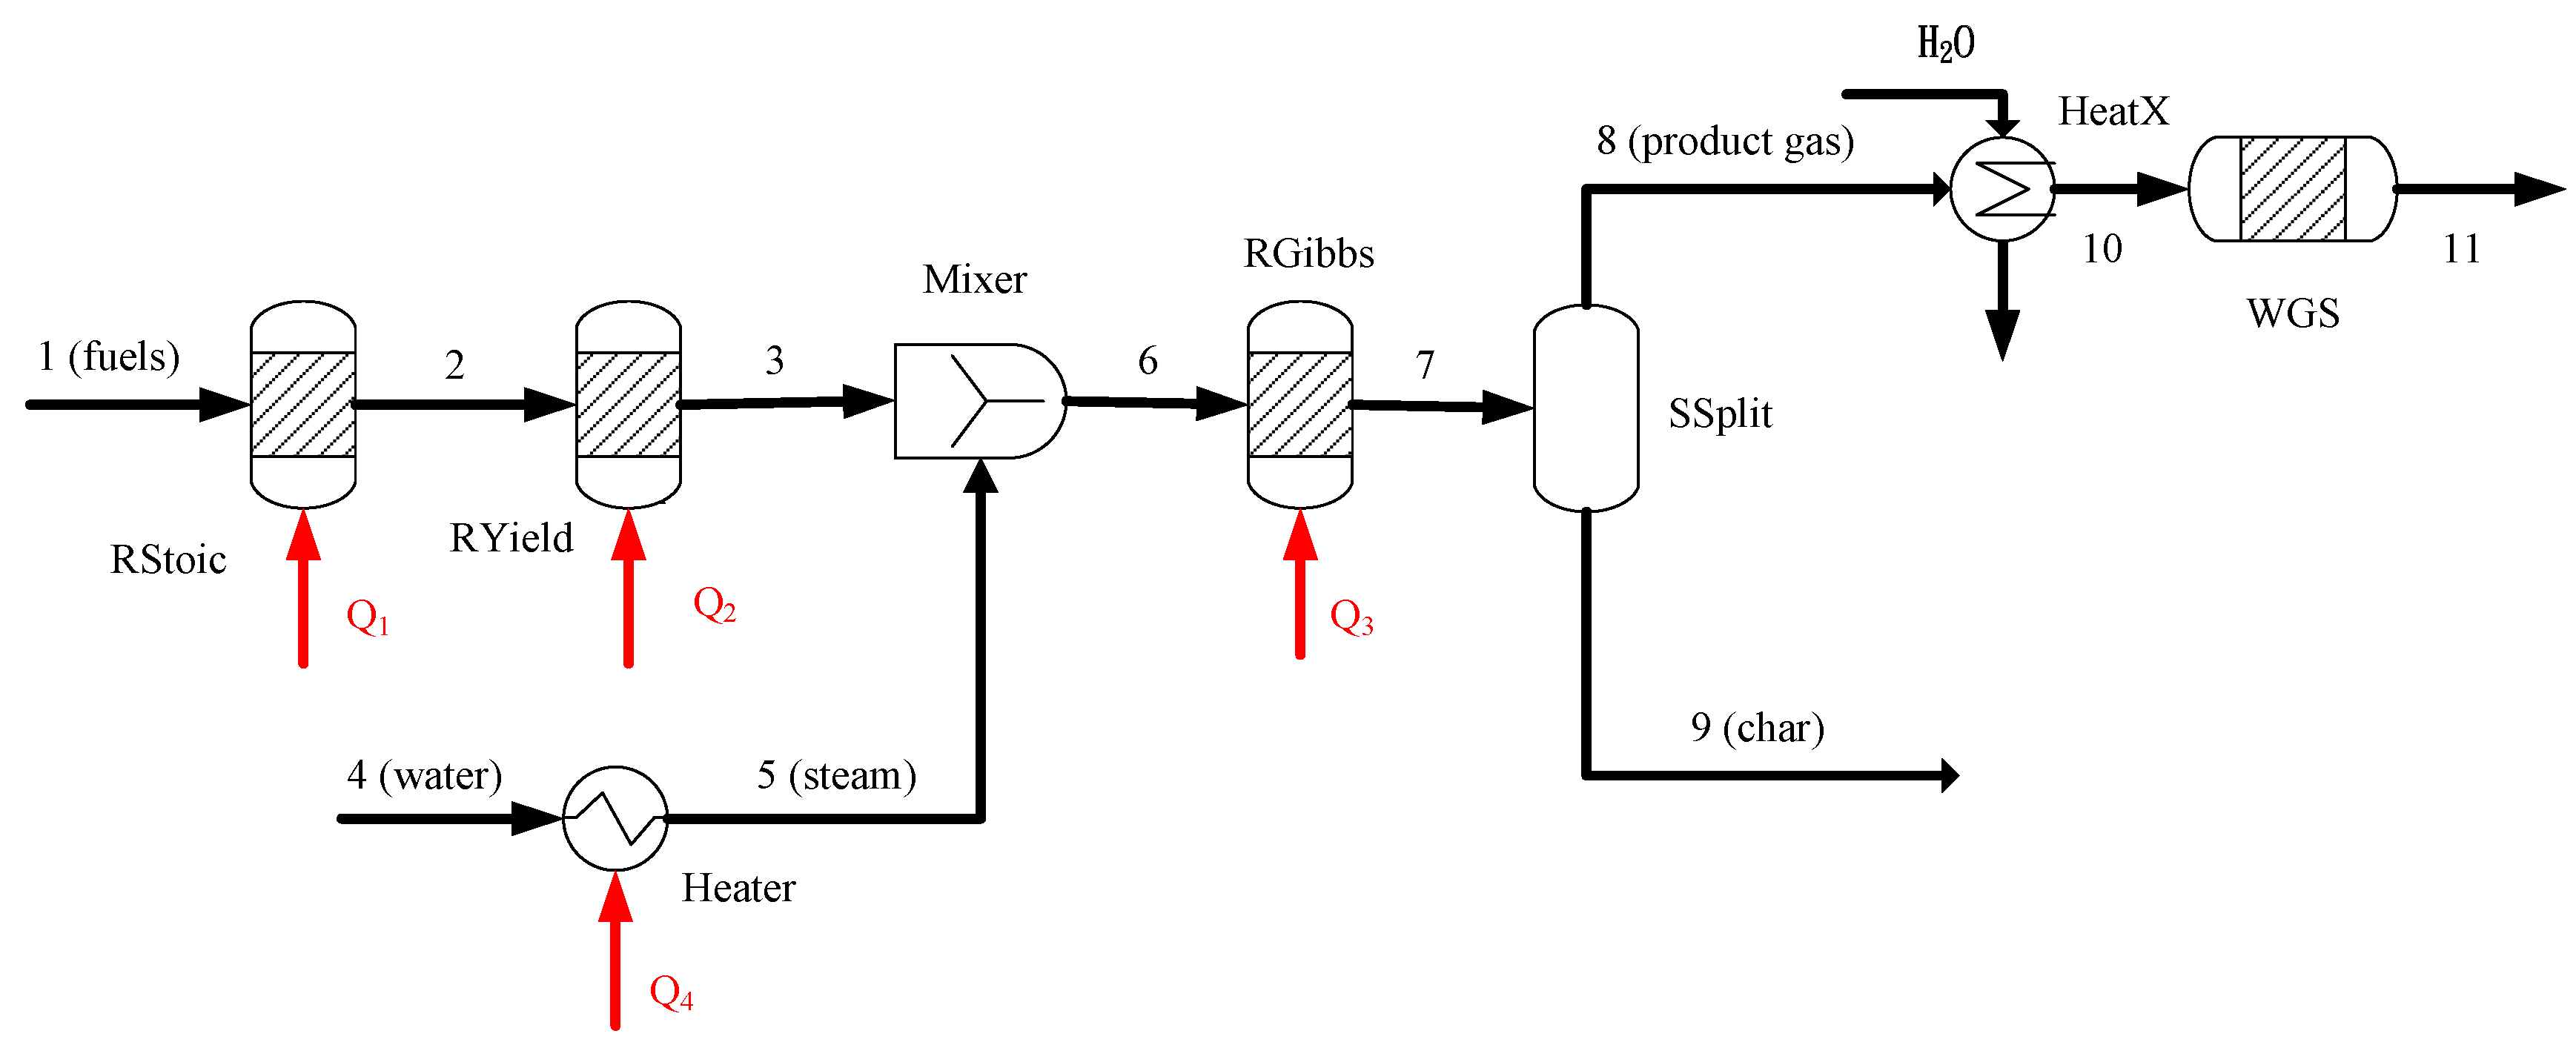
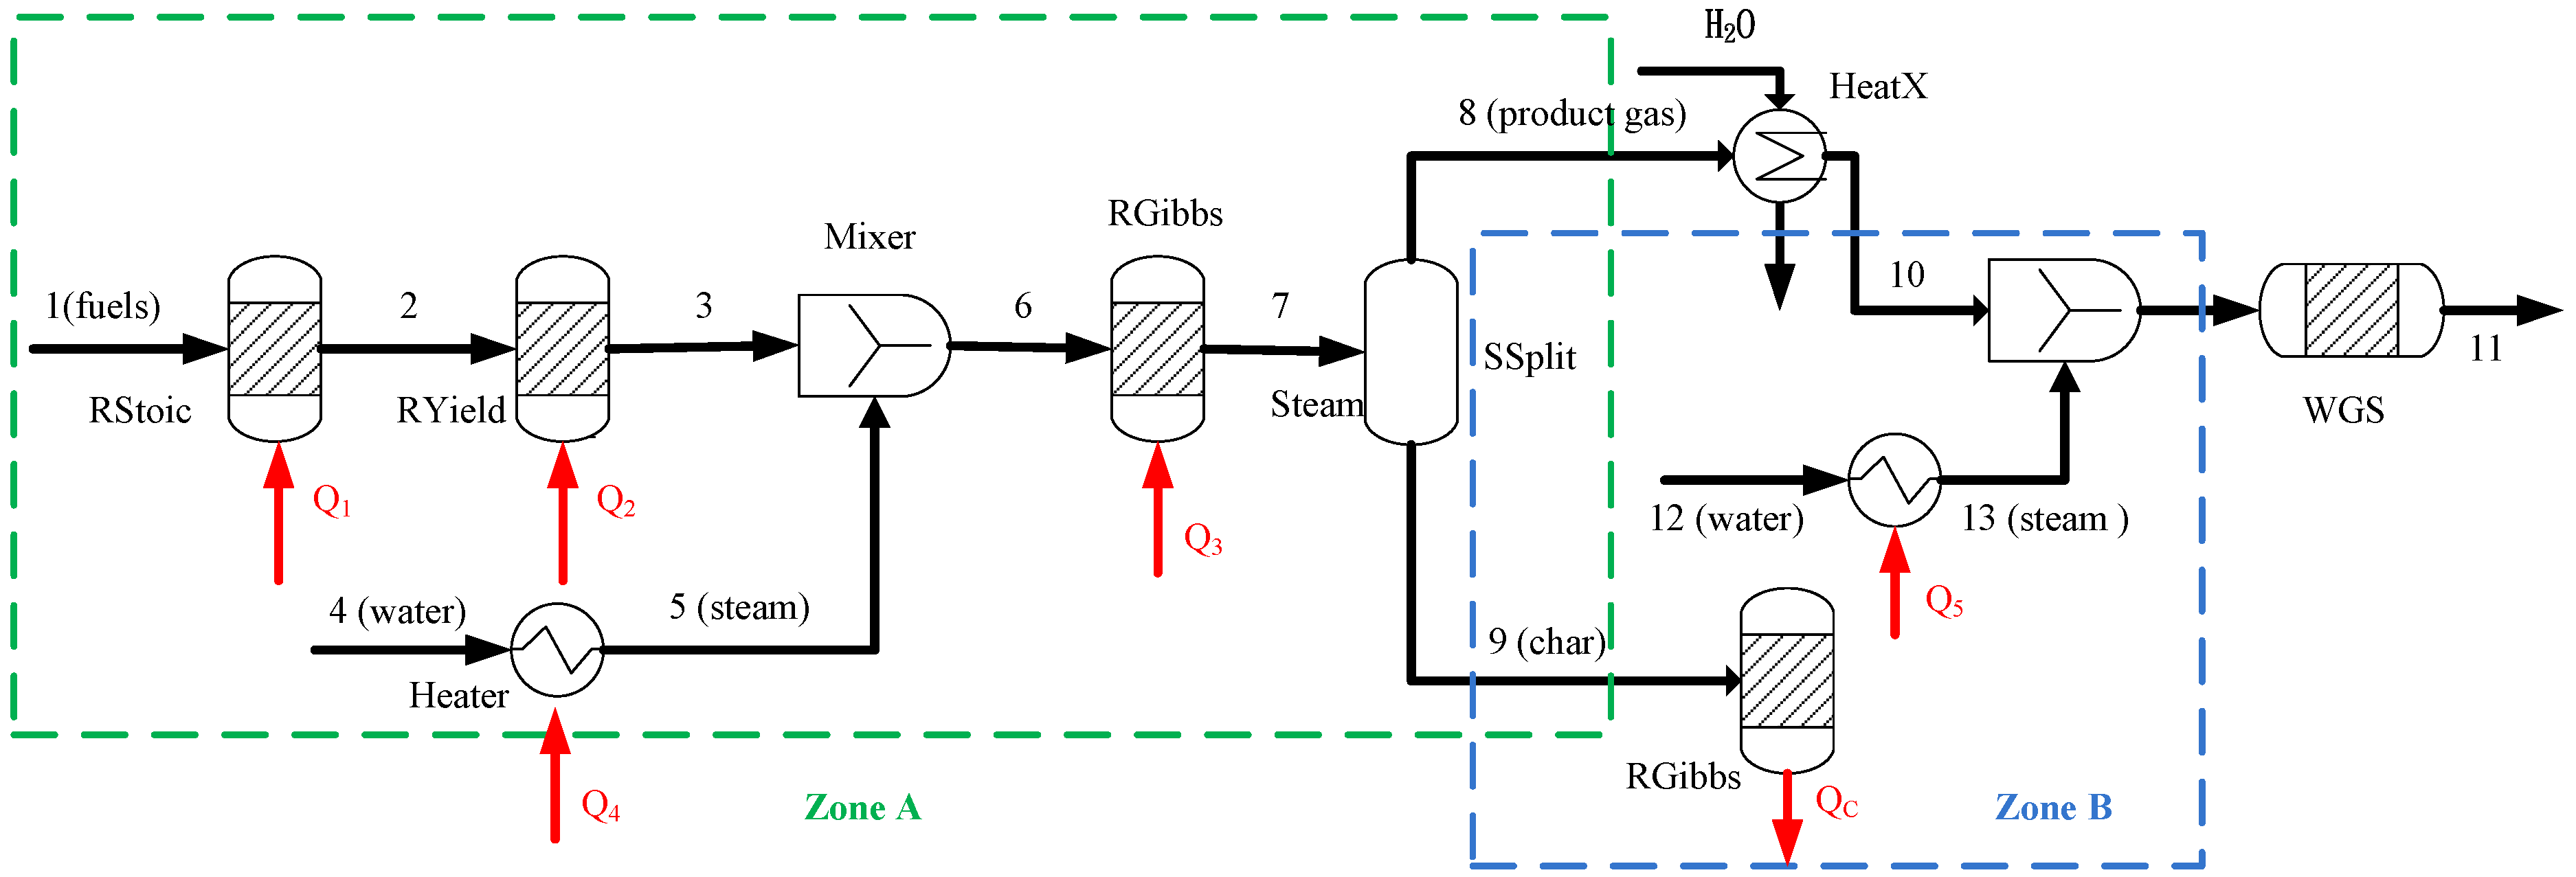
2. BSG Process Description

The objective of this model is to simulate the biomass steam gasification (BSG) process using Aspen Plus V8.4. The model is based on the following main assumptions in the development of the biomass gasification process: (1) the process is steady and isothermal; (2) the feedstock is at normal conditions (i.e., 25 °C and 1atm); (3) the solid and gaseous phases are in a state of thermodynamic equilibrium; (4) the gaseous species in the system are H2O, H2, CO, CO2 and CH4; (5) char only contains carbon and ash, and tar formation is neglected [21,22].
In the simulation, the Peng-Robinson equation of state with the Boston-Mathias alpha function (PR-BM) is used to derive the basic thermodynamic properties of the system [23]. As a whole, the reaction zones are represented by a number of blocks. The fuels are defined as an unconventional component, based on the results of elemental analysis and proximate analysis. Because of the nonconventional stream for the biomass, the biomass must be defined using the HCOALGEN model, including a number of empirical correlations for heat of combustion, heat of formation, and heat capacity. The density of biomass is evaluated by the DCOALIGT model [23]. A schematic of the BSG process is shown in Figure 1.
Figure 1. Flow chart of the steam gasification process.
Energies 08 00094 g001
When the “fuels” (stream 1) are fed into the system, the first step is the heating and drying of the biomass. The block RStoic is used to model the drying process. The process of drying is simulated by the following chemical reaction [24]:
F u e l 0.0555 H 2 O + f u e l d r y
After drying, the fuel is decomposed into its elemental constituents in the block RYield. In this block, the unconventional stream (stream 2) transforms from an unconventional solid into volatiles and char (stream 3). The volatiles consist of carbon, hydrogen, oxygen, and nitrogen. In addition, the char is converted into ash and carbon. The actual yield distributions in RYield are calculated by a calculator block which is controlled by the FORTRAN statement in accordance with the component characteristics of the feedstock. The gasification of biomass is simulated by a block called RGibbs, in which the chemical equilibrium calculations are performed by minimizing the Gibbs free energy. With regard to the gasifying agents, water (stream 4) is heated in the block Heater to become steam (stream 5). The product gas is divided into two streams product gas (stream 8) and char (stream 9), in the block SSPLIT. The product gas is cooled by a heat exchanger in order to reach the desired inlet temperature (550 °C) in the following plug flow reactor (WGS). Subsequently, a high-temperature water-gas-shift (WGS) reactor directly connects to the outlet stream (stream 10) to reduce CO and produce rich-hydrogen gas (stream 11).
The water-gas-shift (WGS) reactor with a packed catalyst is connected to convert some of the components, CO and H2O, into CO2 and H2. The WGS reaction over the CeO2-La2O3-based Cu catalyst at atmospheric pressure and a reaction temperature in the 500–600 °C range is:
C O + H 2 O C a t C O 2 + H 2 ,    Δ H 0 = 42   k J m o l 1
The corresponding rate of reaction is expressed by [25]:
r W G S = 10 0.724 exp ( 92350 R T ) P C O 0.95 P C O 2 0.06 P H 2 0.085 ( 1 1 K P C O 2 P H 2 P C O P H 2 O )
where K is the equilibrium constant of the WGS reaction.

2.1. Model Validation

The model tests for the validation of the biomass gasification process have been carried out in a previous study [13]. In order to be able to examine the model developed in this simulation, the model results are compared to results obtained by Jayah et al. In their experiments, the feedstock used in their study is rubber wood in a fixed bed gasifier operated at atmospheric pressure (1 atm) along with the gasification temperature of 900 °C. Table 1 shows the comparisons of results between the predictions and the experimental data as reported by Jayah et al. [26]. It can be seen that the predicted results of the three gases at various air-to-fuel mass flow rate ratios are in good agreement with the experimental measurements.
Table 1. The comparison of predicted results with the experimental data from [26].
Air/fuel ratioMeasurementGas composition (vol %)
H2COCO2
2.03Experimental17.2019.609.90
Model18.6421.149.90
Relative error (%)8.377.860
2.20Experimental18.3020.209.70
Model17.2620.5910.00
Relative error (%)5.681.933.09
2.37Experimental17.2019.409.70
Model15.8519.5710.39
Relative error (%)7.850.887.11

2.2. Mass Balance

Based on the mass balance, the global gasification reaction is written as:
C H x O y N z + w H 2 O n C O 2 C O 2 + n C O C O + n C H 4 C H 4 + n H 2 H 2 + n H 2 O H 2 O + n c h a r C h a r
where w is the amount of steam per mole of biomass; n C O 2 , n C O , n C H 4 , n H 2 , n H 2 O and n c h a r are the numbers of moles of CO2, CO, CH4 H2, H2O, and char, respectively. The major chemical reactions occurring in the gasifier are listed in Table 2 [2,27].
Table 2. A list of chemical reactions in the gasifier [2,27].
ReactionProcessReaction number
Drying H 2 O ( l ) H 2 O ( g ) ,     Δ H 0 = + 40.7 k J m o l 1 R1
Devolatilization C H x O y N z c h a r + v o l a t i l e g a s e s R2
Oxidation C + 0.5 O 2 C O ,     Δ H 0 = 268 k J m o l 1
C + O 2 C O 2 ,     Δ H 0 = 406 k J m o l 1
R3
R4
Water gas reaction C + H 2 O C O + H 2 ,     Δ H 0 = + 131.4 k J m o l 1 R5
Boudouard reaction C + C O 2 2 C O ,     Δ H 0 = + 172.6 k J m o l 1 R6
Shift reaction C O + H 2 O C O 2 + H 2 ,     Δ H 0 = 42 k J m o l 1 R7
Methanation reaction C + 2 H 2 C H 4 ,     Δ H 0 = 75 k J m o l 1
C H 4 + H 2 O C O + 3 H 2 ,     Δ H 0 = 206 k J m o l 1
R8
R9
The fuels are expressed by CHxOyNz where the subscripts x, y, and z are determined from the elemental analysis of biomass. As a result, each elemental mass-balance in the system can be expressed in the following equations:
Carbon balance:
n C O 2 + n C O + n C H 4 + n c h a r 1 = 0
Hydrogen balance:
4 n C H 4 + 2 n H 2 + 2 n H 2 O 2 w x = 0
Oxygen balance:
2 n C O 2 + n C O + n H 2 O w y = 0

2.3. Energy Balance

The energy balance between the reactants and the products is calculated based on the following equations:
i n H ˙ i + Q ˙ r x n = o u t H ˙ j
i n H ˙ i + Q ˙ r x n = H ˙ b i o m a s s + H ˙ a g e n t
o u t H ˙ j = H ˙ p r o d u c t g a s + H ˙ a s h + H ˙ c h a r
where i n H ˙ i and o u t H ˙ j are the enthalpy rates of the input and output material streams, respectively. All inputs on the left-hand side of Equation (8) are at 25 °C. The outputs on the right-hand side are at the gasification temperature. H ˙ b i o m a s s , H ˙ a g e n t , H ˙ p r o d u c t g a s , H ˙ a s h , and H ˙ c h a r are the rates of the heat of the formation of biomass, gasifying agents, gaseous products, ash, and char, respectively, and Q ˙ r x n is the rate of the heat of the reaction.

3. Results and Discussion

Two kinds of biomass are selected as the feedstock in this work, raw oil palm (ROP), and torrefied oil palm (TOP). The oil palm was torrefied at 250 °C for one hour. The properties of the feedstock, such as the results of the proximate analysis, elemental analysis, and higher heating values (HHV) are listed in Table 3 [28]. The BSG process is performed at 700 °C and 1 atm [29,30,31]. The parameter of steam-to-carbon mass ratio (S/C ratio) is considered to account for influences that the feedstock has on the BSG process. Details of the operation and process conditions are given in Table 4.
Table 3. Proximate and elemental analyses of the feedstock used in the simulation [28].
FeedstocksRaw oil palmTorrefied oil palm at 250 °C
Proximate analysis (wt%)
  Moisture7.203.69
  Volatile matter (VM)67.2553.76
  Fixed carbon (FC)19.0332.58
  Ash6.529.97
Elemental analysis (wt%)
  C44.8154.41
  H4.104.54
  N2.101.54
  O *42.4729.62
Higher heating value (MJ kg−1)17.1020.59
Note: * By difference.
Table 4. Simulation of operating condition and gasification parameters.
ItemsParameters
Stream classMCINCPSD
Thermodynamic propertyPeng-Robinson
Nonconventional propertiesEnthalpyHCOALGEN
DensityDCOALIGT
FeedstocksRaw oil palmCH1.10O0.71N0.040
Torrefied oil palm (250 °C)CH1.00O0.41N0.024
Ambient conditions25 °C and 1 atm
Input conditionsFuel:25 °C and 1 atm
Steam:200 °C and 1 atm
Gasifier700 °C and 1 atm
Sensitivity analysisS/C ratio (mass flow rate)0.4–2

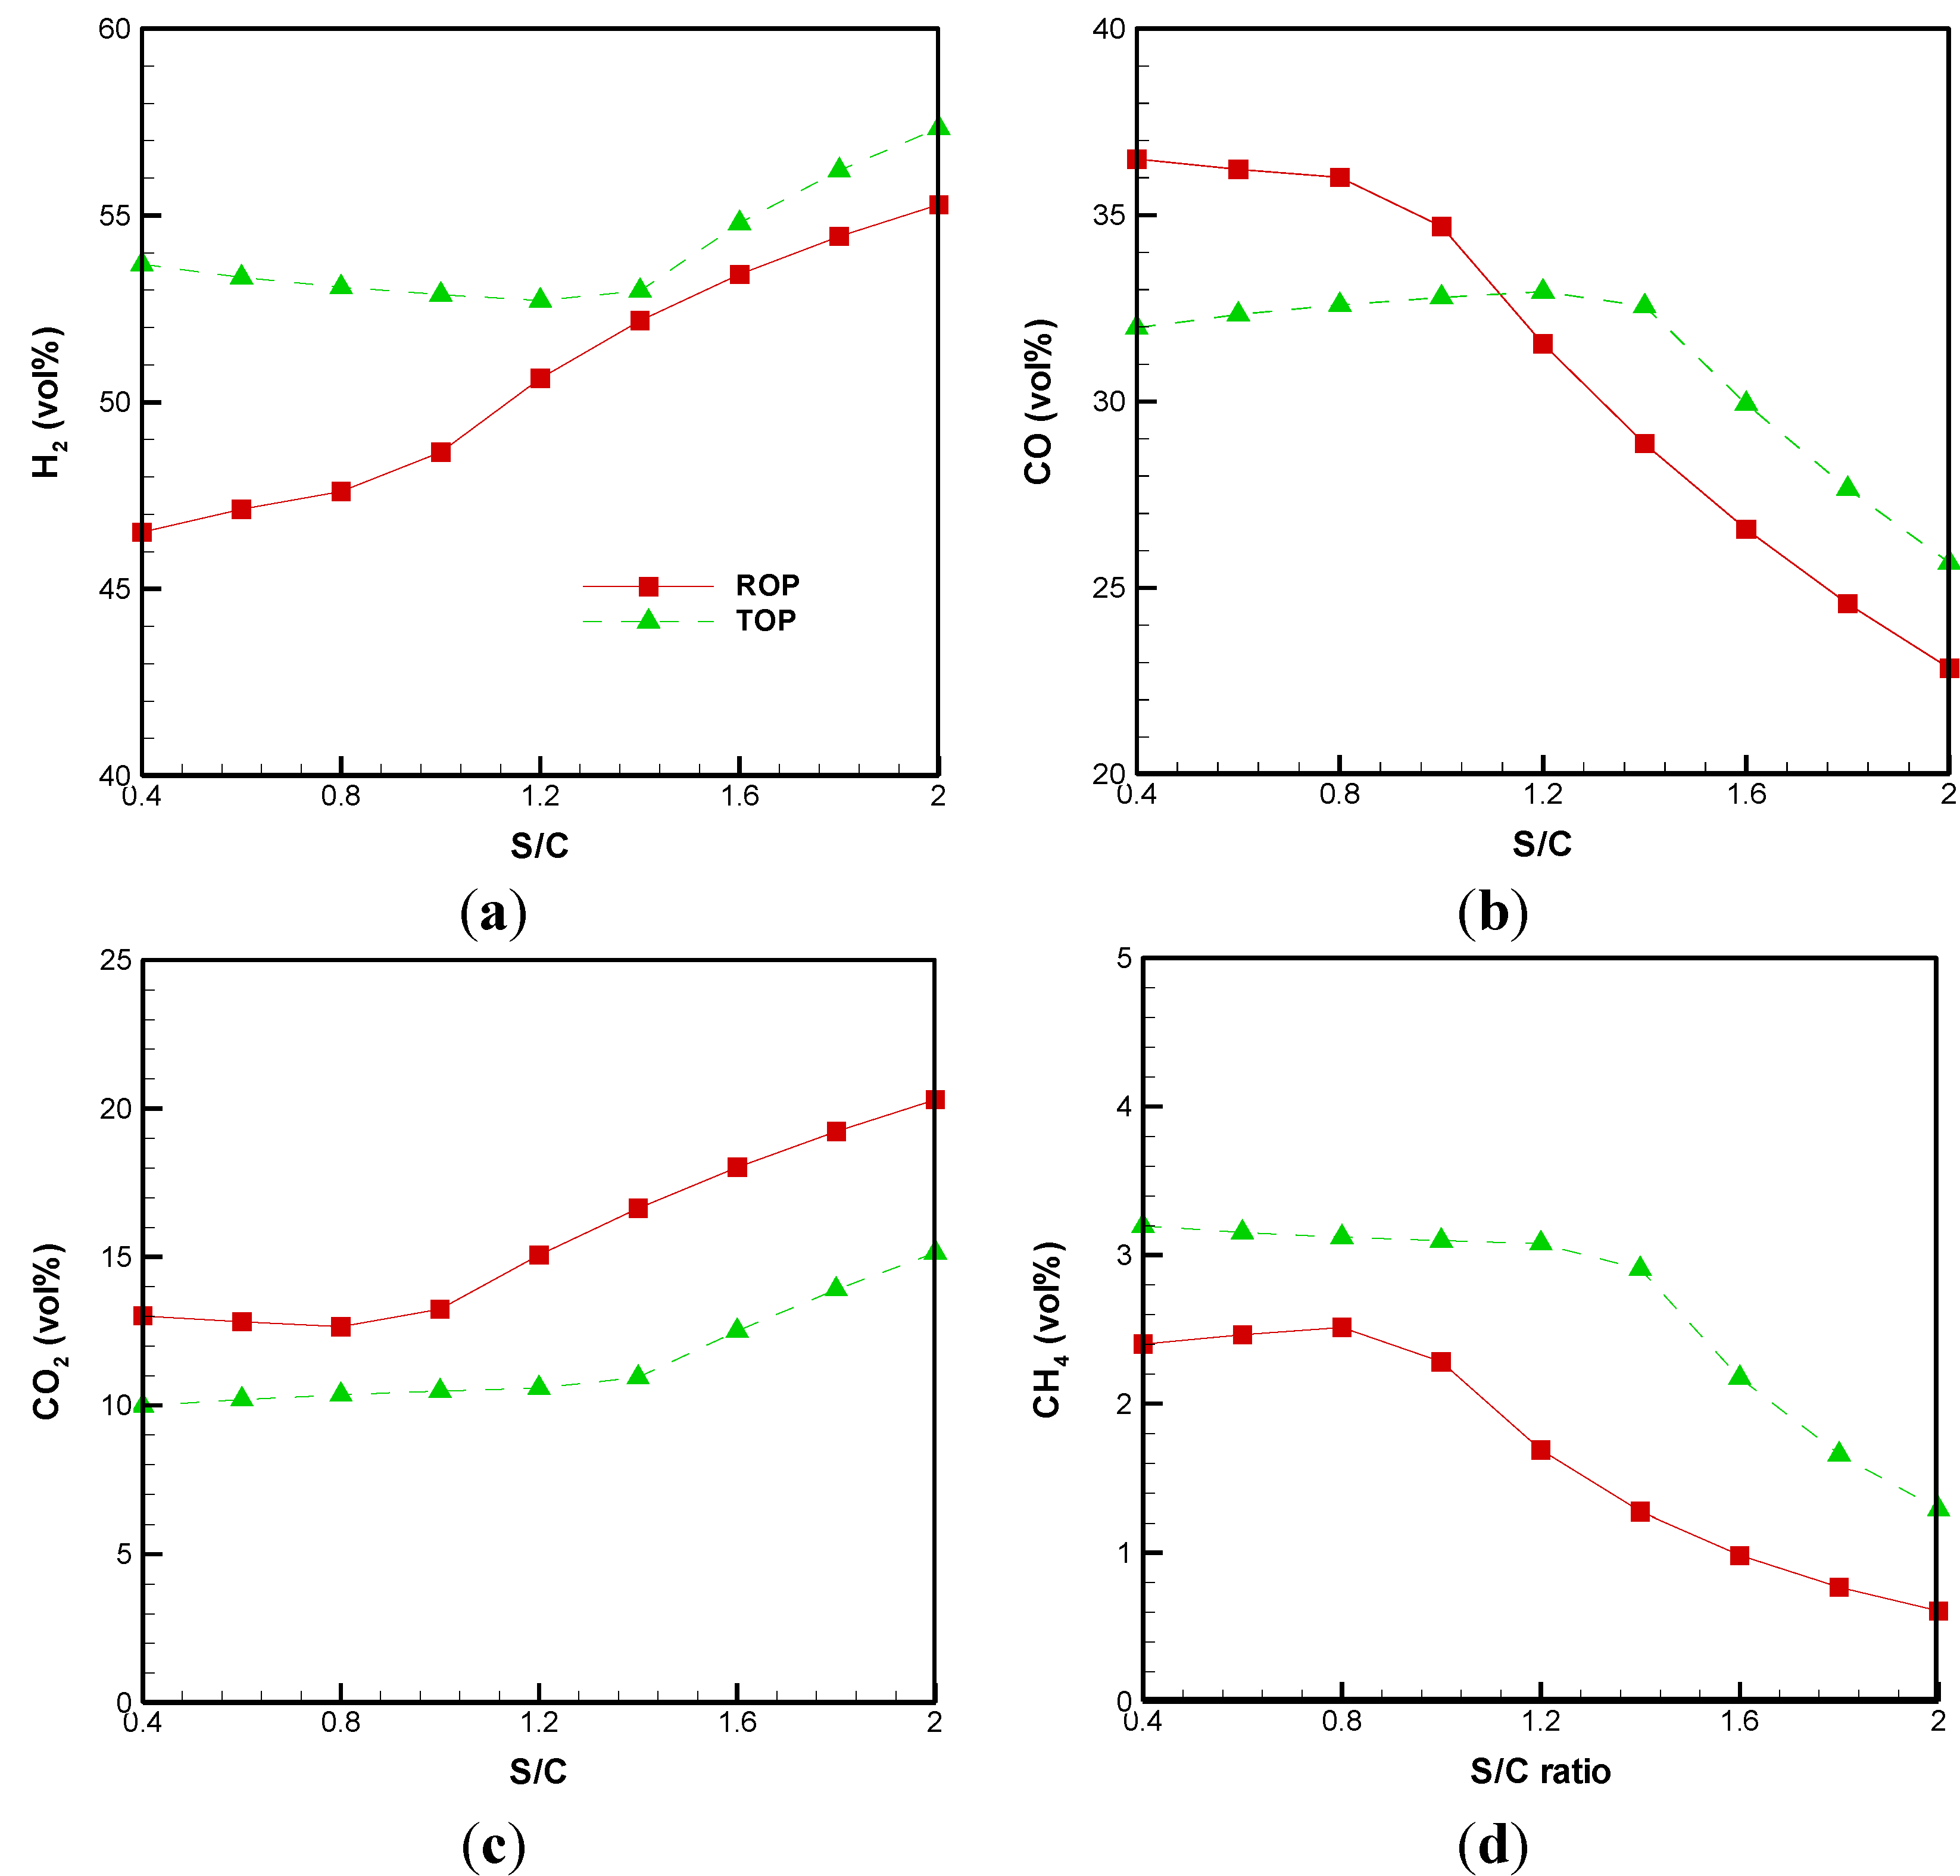
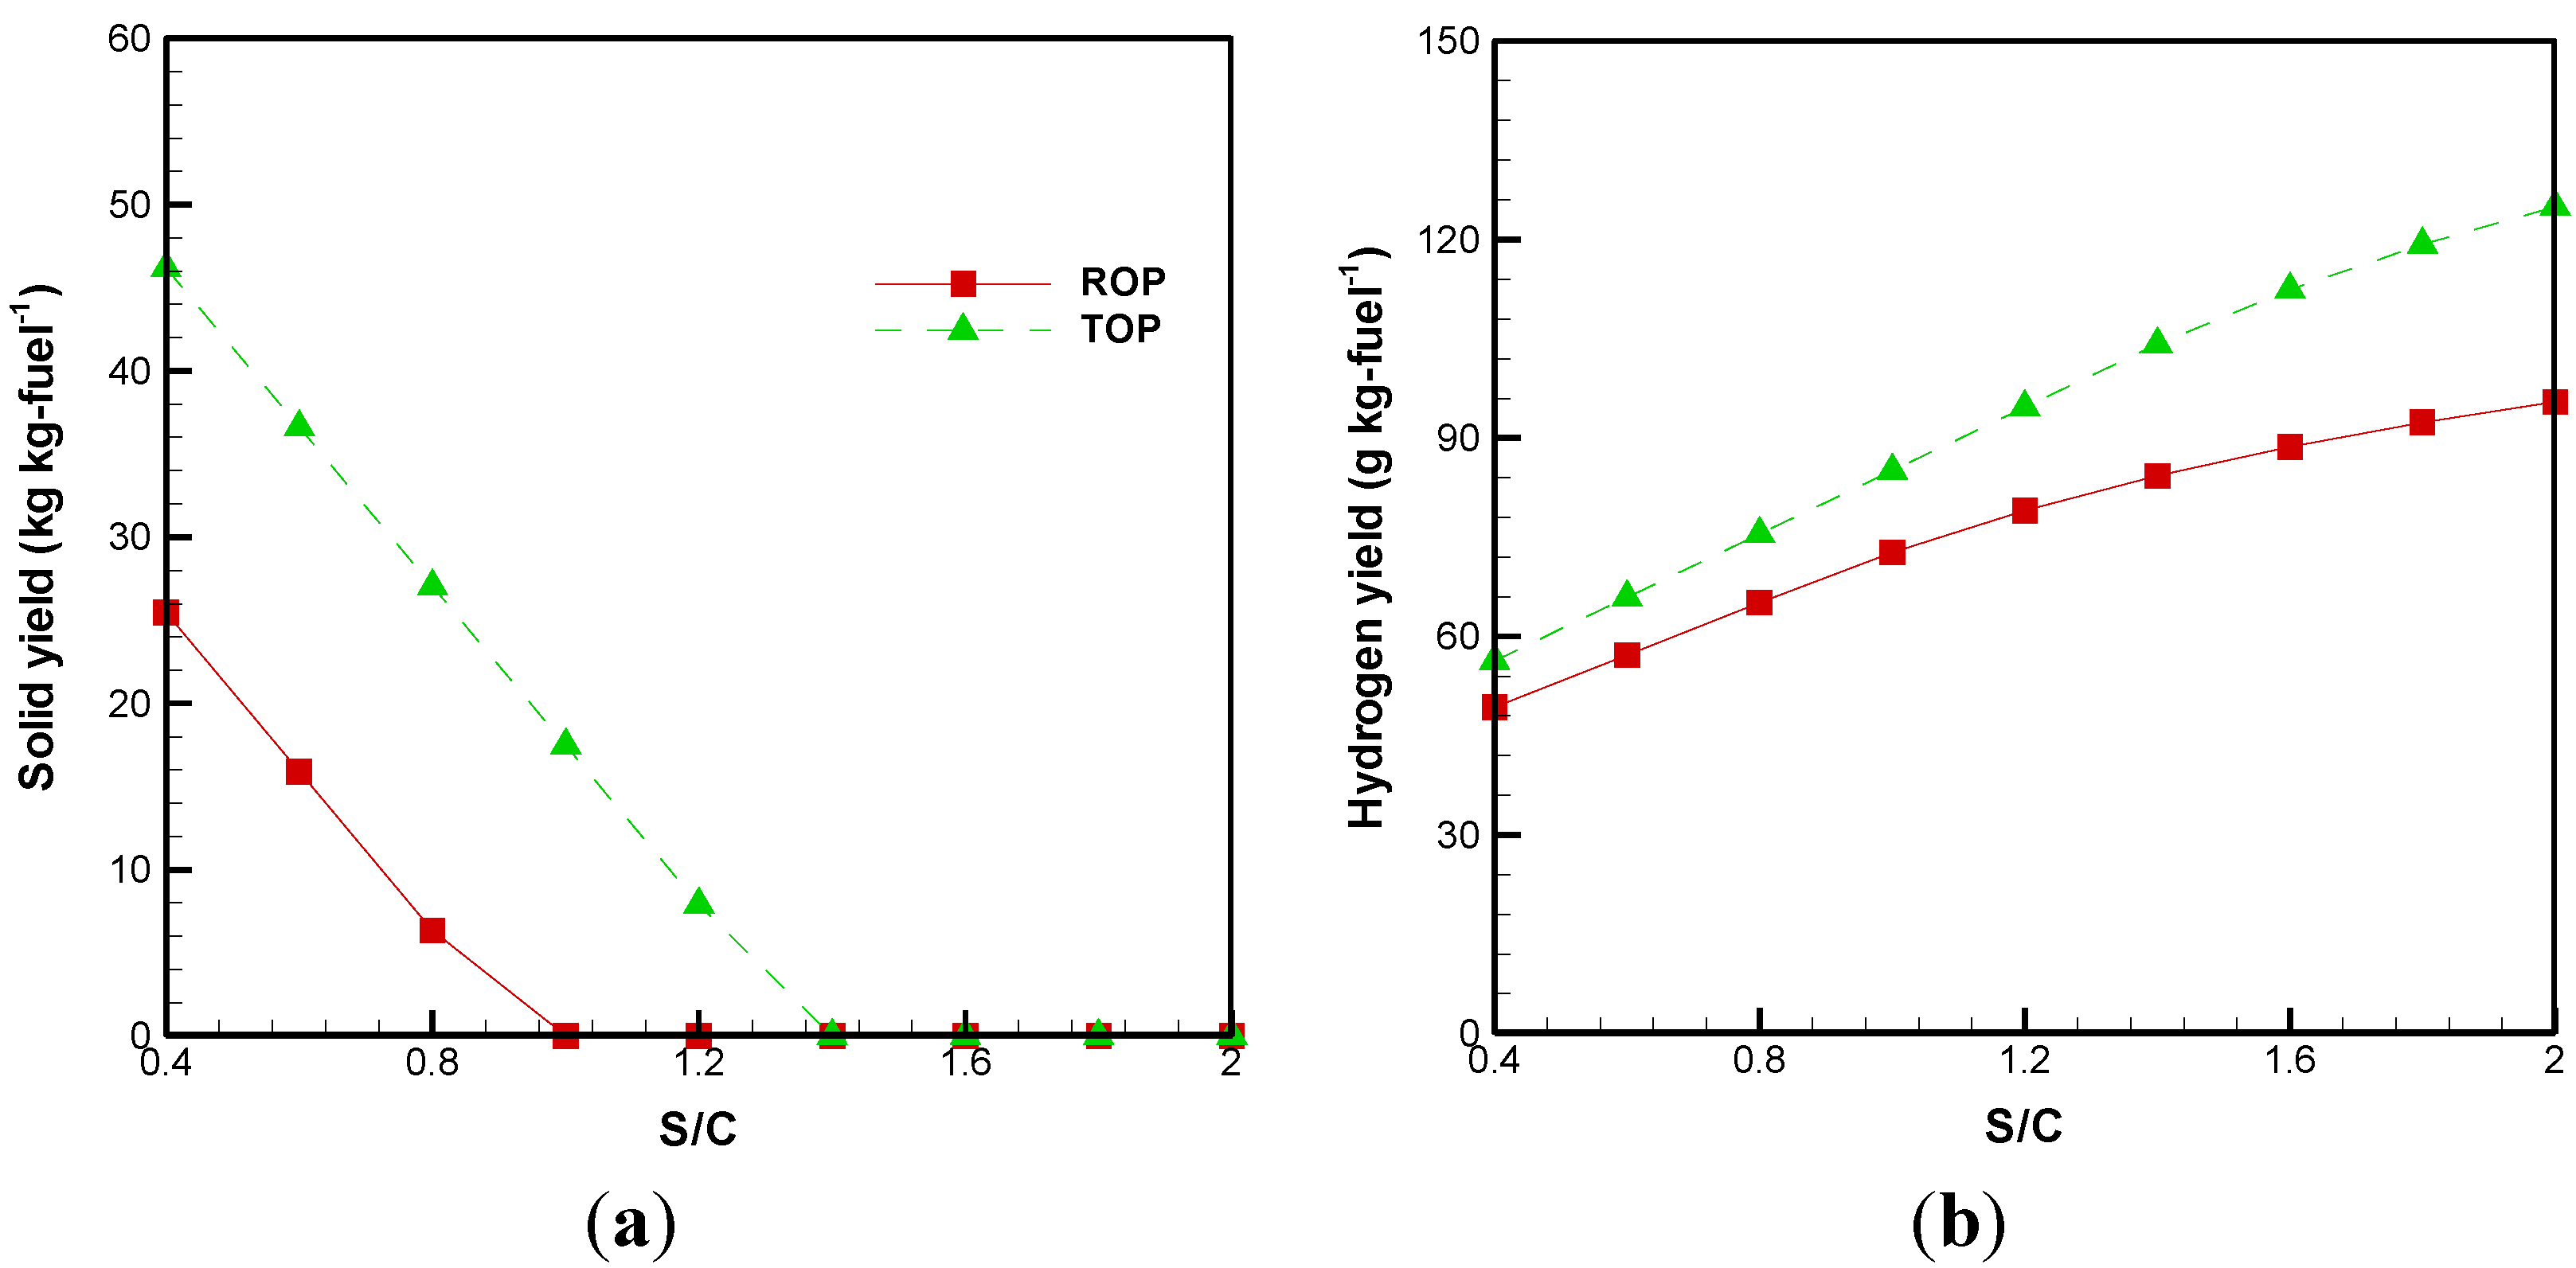
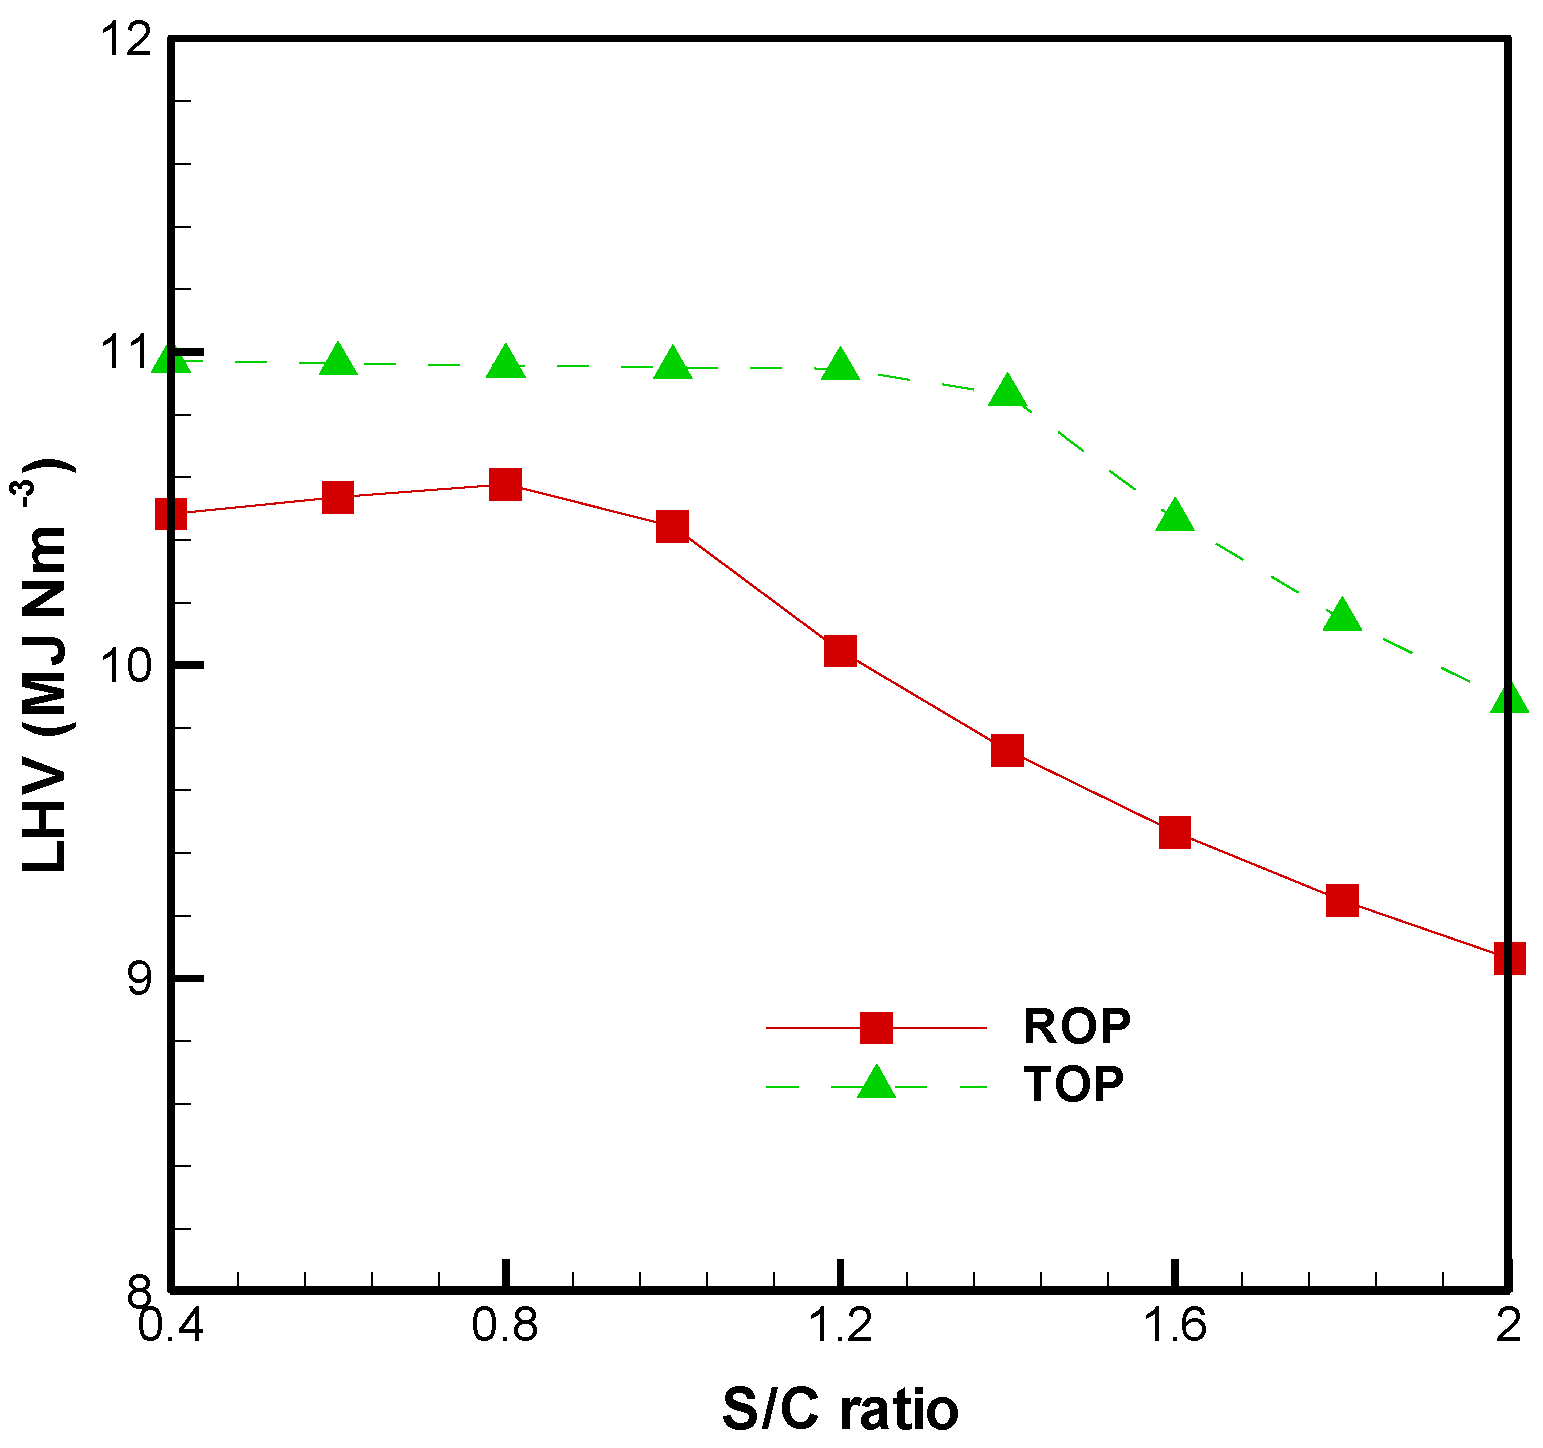
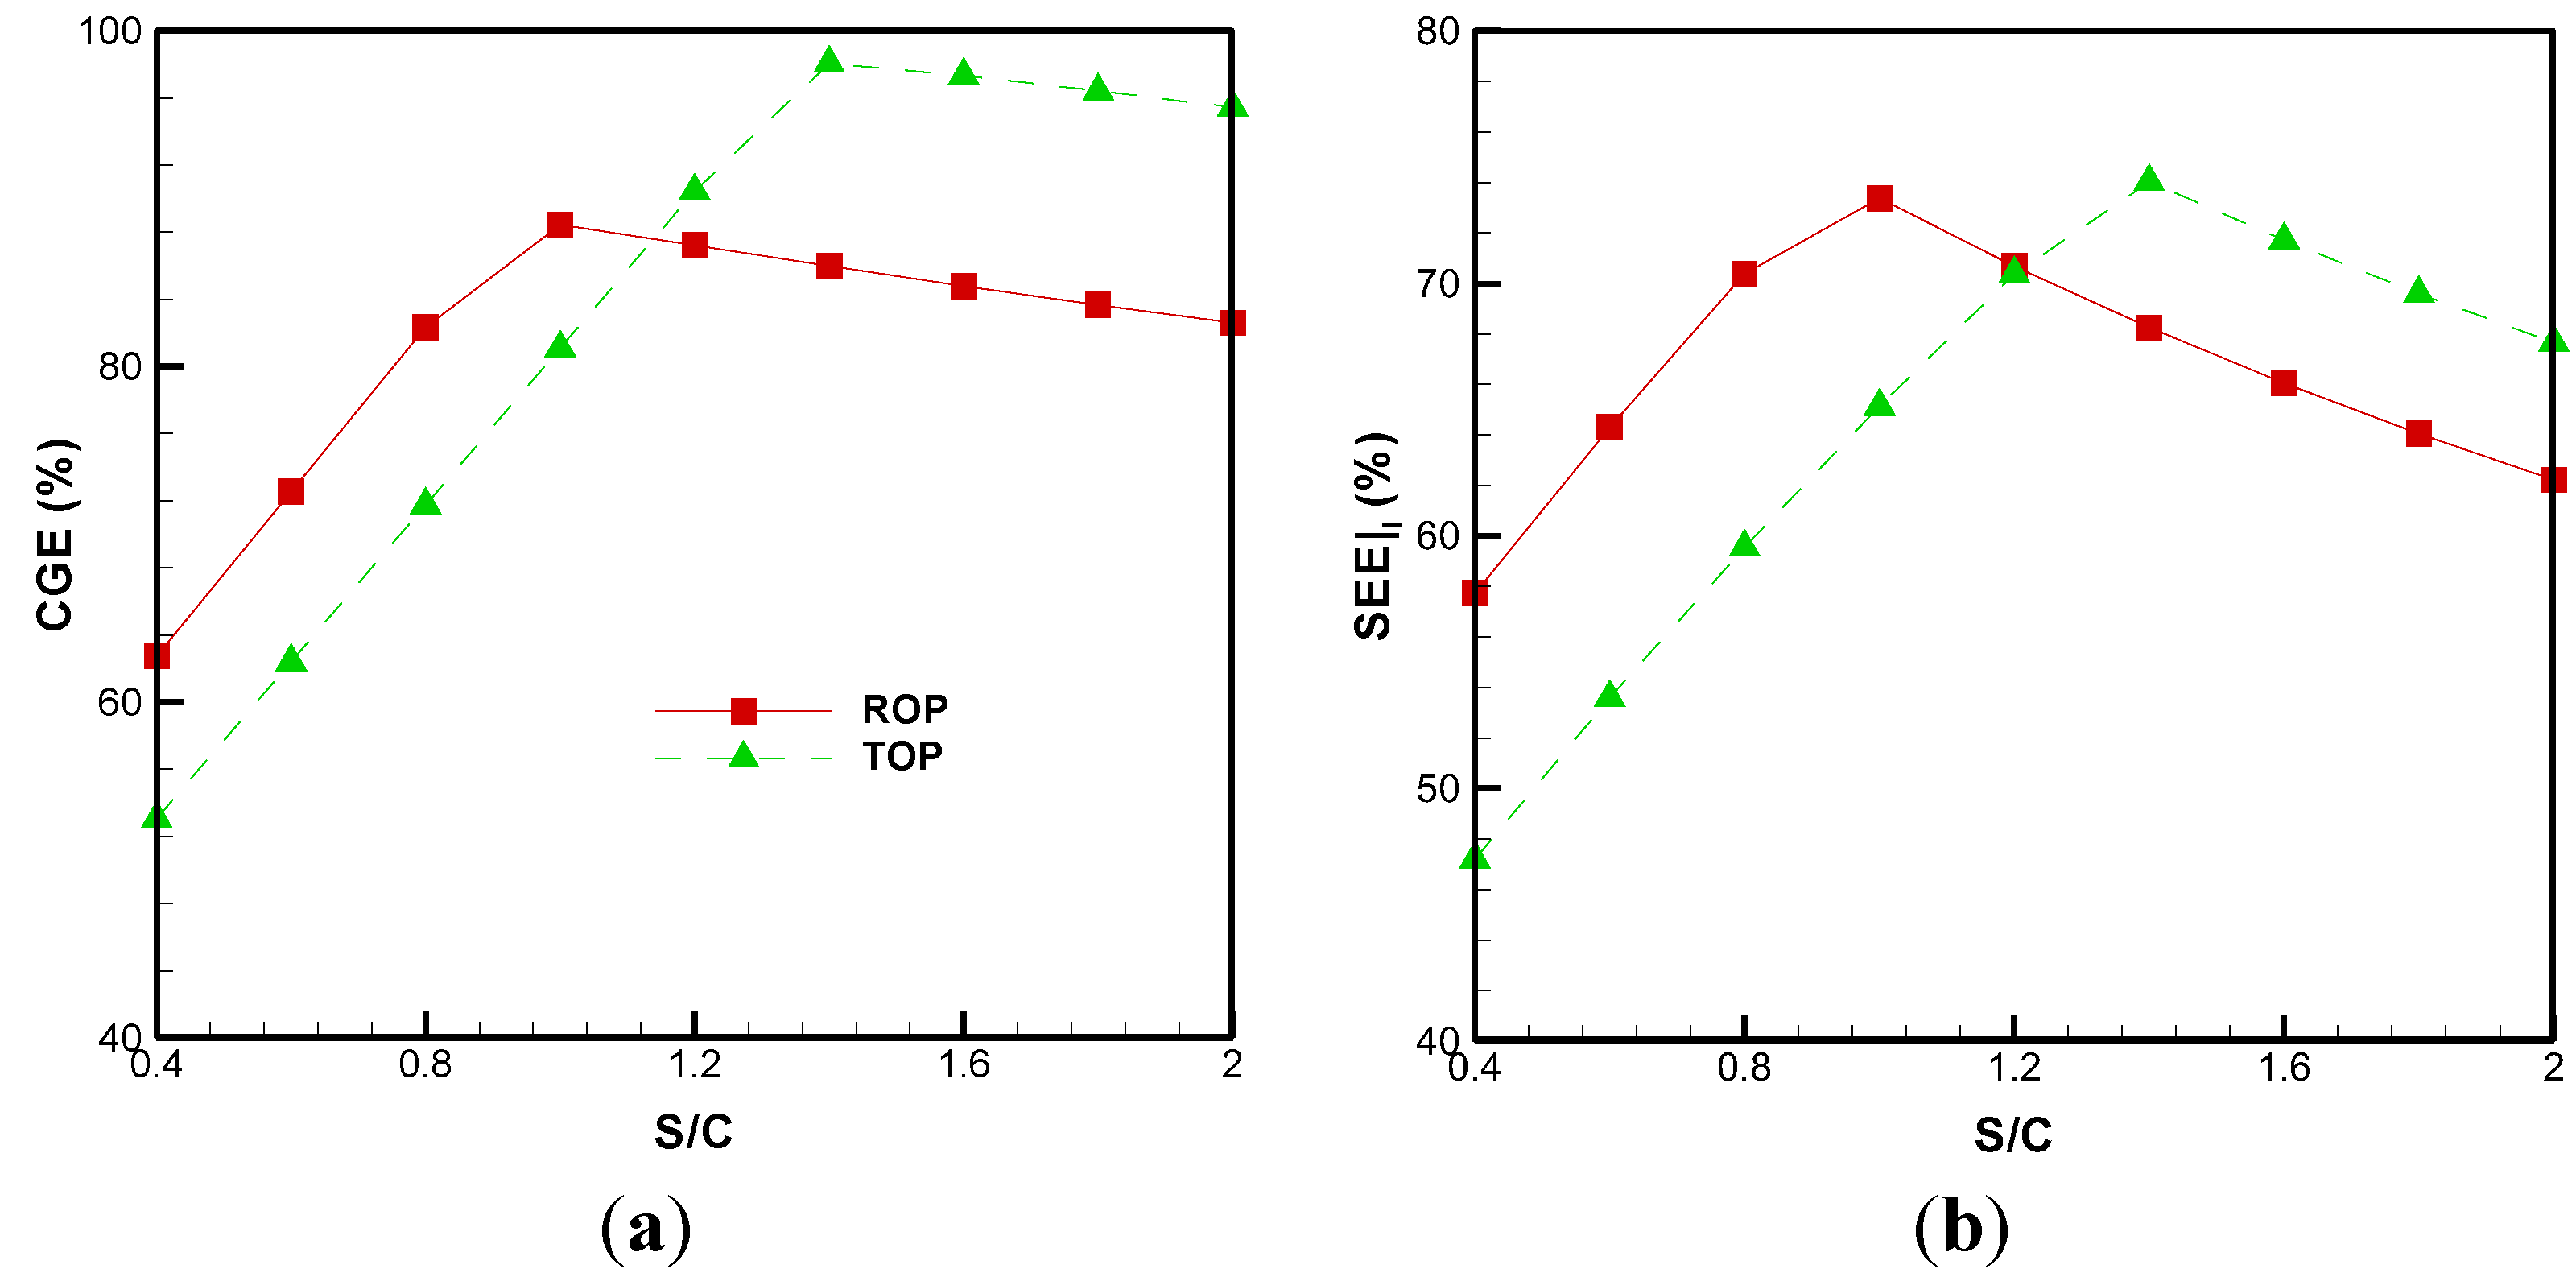
3.1. Effect of S/C Ratio

Figure 2 shows the concentration distributions of H2, CO, CO2, and CH4 (dry basis) in the product gas with respect to the S/C ratio. When ROP is gasified, the addition of steam has a positive effect on the H2 formation, in that it monotonically increases along with the S/C ratio (Figure 2a). This behavior can be explained by the water gas reaction (R5). In contrast, the concentration of CO decreases as the S/C ratio increases (Figure 2b).
Figure 2. Effects of the S/C ratio on product distribution of (a) H2; (b) CO; (c) CO2; and (d) CH4.
Energies 08 00094 g002
This may be due to the shift reaction where the generated CO further reacts with steam to produce CO2 and H2. With regard to the gasification of TOP, the H2 formation is characterized by a decrease followed by an increase when the S/C ratio increases. This could be due to the high carbon content in TOP (Table 3). Notably, the concentration of H2 of TOP is higher than that of ROP, no matter what S/C ratio is used. The minimum H2 concentration from the gasification of TOP is located at S/C = 1.4. In contrast, CO formation has the opposite trend to that seen with H2. The maximum CO concentration of TOP is thus also located at S/C = 1.4. Examining the CO2 concentration of the two cases shown in Figure 2c, it can be seen that that ROP is higher than that of TOP. Since ROP contains a significant amount of oxygen (Table 3), this means that more CO2 is produced than in the gasification of TOP due to the oxidation reaction (R3 and R4). Moreover, it is also noted that the CO2 concentration of ROP and TOP increase when the S/C ratio is over 1.0 and 1.4, respectively. In general, steam can be thought of as an oxidizer in a gasification environment. The higher the S/C ratio, the more oxidizer provided for gasificaiton. Therefore, more CO2 can be generated because the concentration of CO2 rises along with the S/C ratio through a shift reaction (R7), which decreases the CO concentration. With regard to the concentration of CH4, Figure 2d depicts its concentration of ROP and TOP drops rapidly as the S/C ratio increases. The decrease in CH4 can be attributed mainly to R7 and R9 while an increase was observed in H2 and CO2 [31].
The effects of the S/C ratio on the solid yield and hydrogen yield are illustrated in Figure 3a,b, respectively. Since TOP contains more carbon than ROP (Table 3), more unconverted carbon is observed. As a result, in order to complete the carbon conversion, ROP and TOP should be used at the S/C ratios of 1.0 and 1.4, respectively.
In examining the distributions of hydrogen yield, Figure 3b shows that it increases when the oil palm is torrefied. In comparison to ROP, the hydrogen yield from the gasification of TOP is increased by approximately13%–31%. The maximum hydrogen yields of ROP and TOP are found to be 95.46 and 124.97 g/kg, respectively, with a S/C ratio of 2. A higher S/C ratio increases H2 production because of the water gas reaction (R5 and R7) and steam methanation (R8 and R9). These changes in the hydrogen yield are consistent with the results of experiments in Kaewpanha et al. [32] and the thermodynamic analysis carried out Vivanpatarakij and Assabumrungrat [33].
Figure 3. Effects of the S/C ratio on (a) solid yield and (b) hydrogen yield.
Energies 08 00094 g003
Figure 4 shows the lower heating value (LHV, MJ/Nm3) of the product gas, which is expressed as [20]:
L H V p r o d u c t g a s = ( 3.0 0 x C O + 2.57 x H 2 + 8.54 x C H 4 ) × 4.2
where x stands for the mole fraction of gas species in the product gas (dry basis). As mentioned earlier, the char of ROP and TOP react completely with steam when the S/C ratio is more than 1.0 and 1.4, respectively. Once excess steam is introduced, a sharp decrease in LHV is observed, especially for ROP. Similar results were also observed in Chaudhari et al. [29], and Yan et al. [30]. In addition, the shift reaction (R7) lowers the CO concentration in the product gas (Figure 2b). This is also the reason why the LHV drops significantly when the S/C ratio is more than 1.0 and 1.4 for ROP and TOP, respectively. However, the LHV of the product gas can be improved by using TOP as the feedstock, and it is in the range of 9.67–10.98 MJ/Nm3.
Figure 4. Effects of the S/C ratio on distributions of lower heating value.
Energies 08 00094 g004

3.2. Cold Gas Efficiency and System Energetic Efficiency

The cold gas efficiency (CGE) is a crucial index to account for the performance of biomass gasification, and it is defined as [14,16]:
C G E ( % ) = G P × L H V p r o d u c t ​   g a s H H V f u e l + Q t o r r e f a c t i o n × 100 %
where Gp is the volume of the product gas from the gasification of per unit weight of fuel (Nm3/kg-fuel), and HHVfuel is the higher heating value of the fuel (MJ/kg-fuel), respectively.
When ROP is torrefied at 250 °C, the heat needed to carry out torrefaction is also considered in the equation. Therefore, in the study of Granados et al. [34], they evaluated that the heat needed to perform oil palm fiber torrefaction was Qtorrefaction= 2320 kJ/kg. The effect of the S/C ratio on CGE is shown in Figure 5a. The CGE of the BSG process is in the range of 62.7%–88.5% for ROP and 43.71%–95.45% for TOP, respectively. Moreover, this suggests that an optimum value can be obtained. The maximum values are developed at S/C ratios of 1.0 and 1.4 for ROP and TOP, respectively. Subsequently, a higher S/C ratio lessens the value of CGE, due to the reduction of LHV (Figure 4). When ROP is torrefied at 250 °C, the CGE values are enhanced by approximately 3.7%–15.7%.
In addition to CGE, the system energetic efficiency ( S E E   | I ) align of the BSG process is also analyzed, and this defined as:
S E E   | I     ( % ) = m ˙  product gas × G P × L H V  product gas m ˙ f u e l × H H V f u r l + Q ˙ r x n + m ˙ s Δ H s + Q ˙ t o r r e f a c t i o n × 100 %
where m ˙ s y n g a s and m ˙ f u e l are the mass flow rates of product gas and fuel (kg/hr); Q ˙ r x n is the energy required to generate steam and heat the reactor (MJ/hr); Q ˙ t o r r e f a c t i o n is the energy required during the torrefaction pretreatment (MJ/hr); m ˙ s is the mass flow rate of steam (kg/hr); and Δ H s is the change in enthalpy of the steam.
Figure 5b shows that when the S/C ratio is higher than 1.2, the S E E   | I of TOP is always greater than that of ROP. The values are enhanced by approximately 8.4%–8.8%, and the maximum values for ROP and TOP are 73.38 and 74.03, respectively.
Figure 5. Effects of the S/C ratio on distributions of (a) cold gas efficiency; (b) system energetic efficiency.
Energies 08 00094 g005

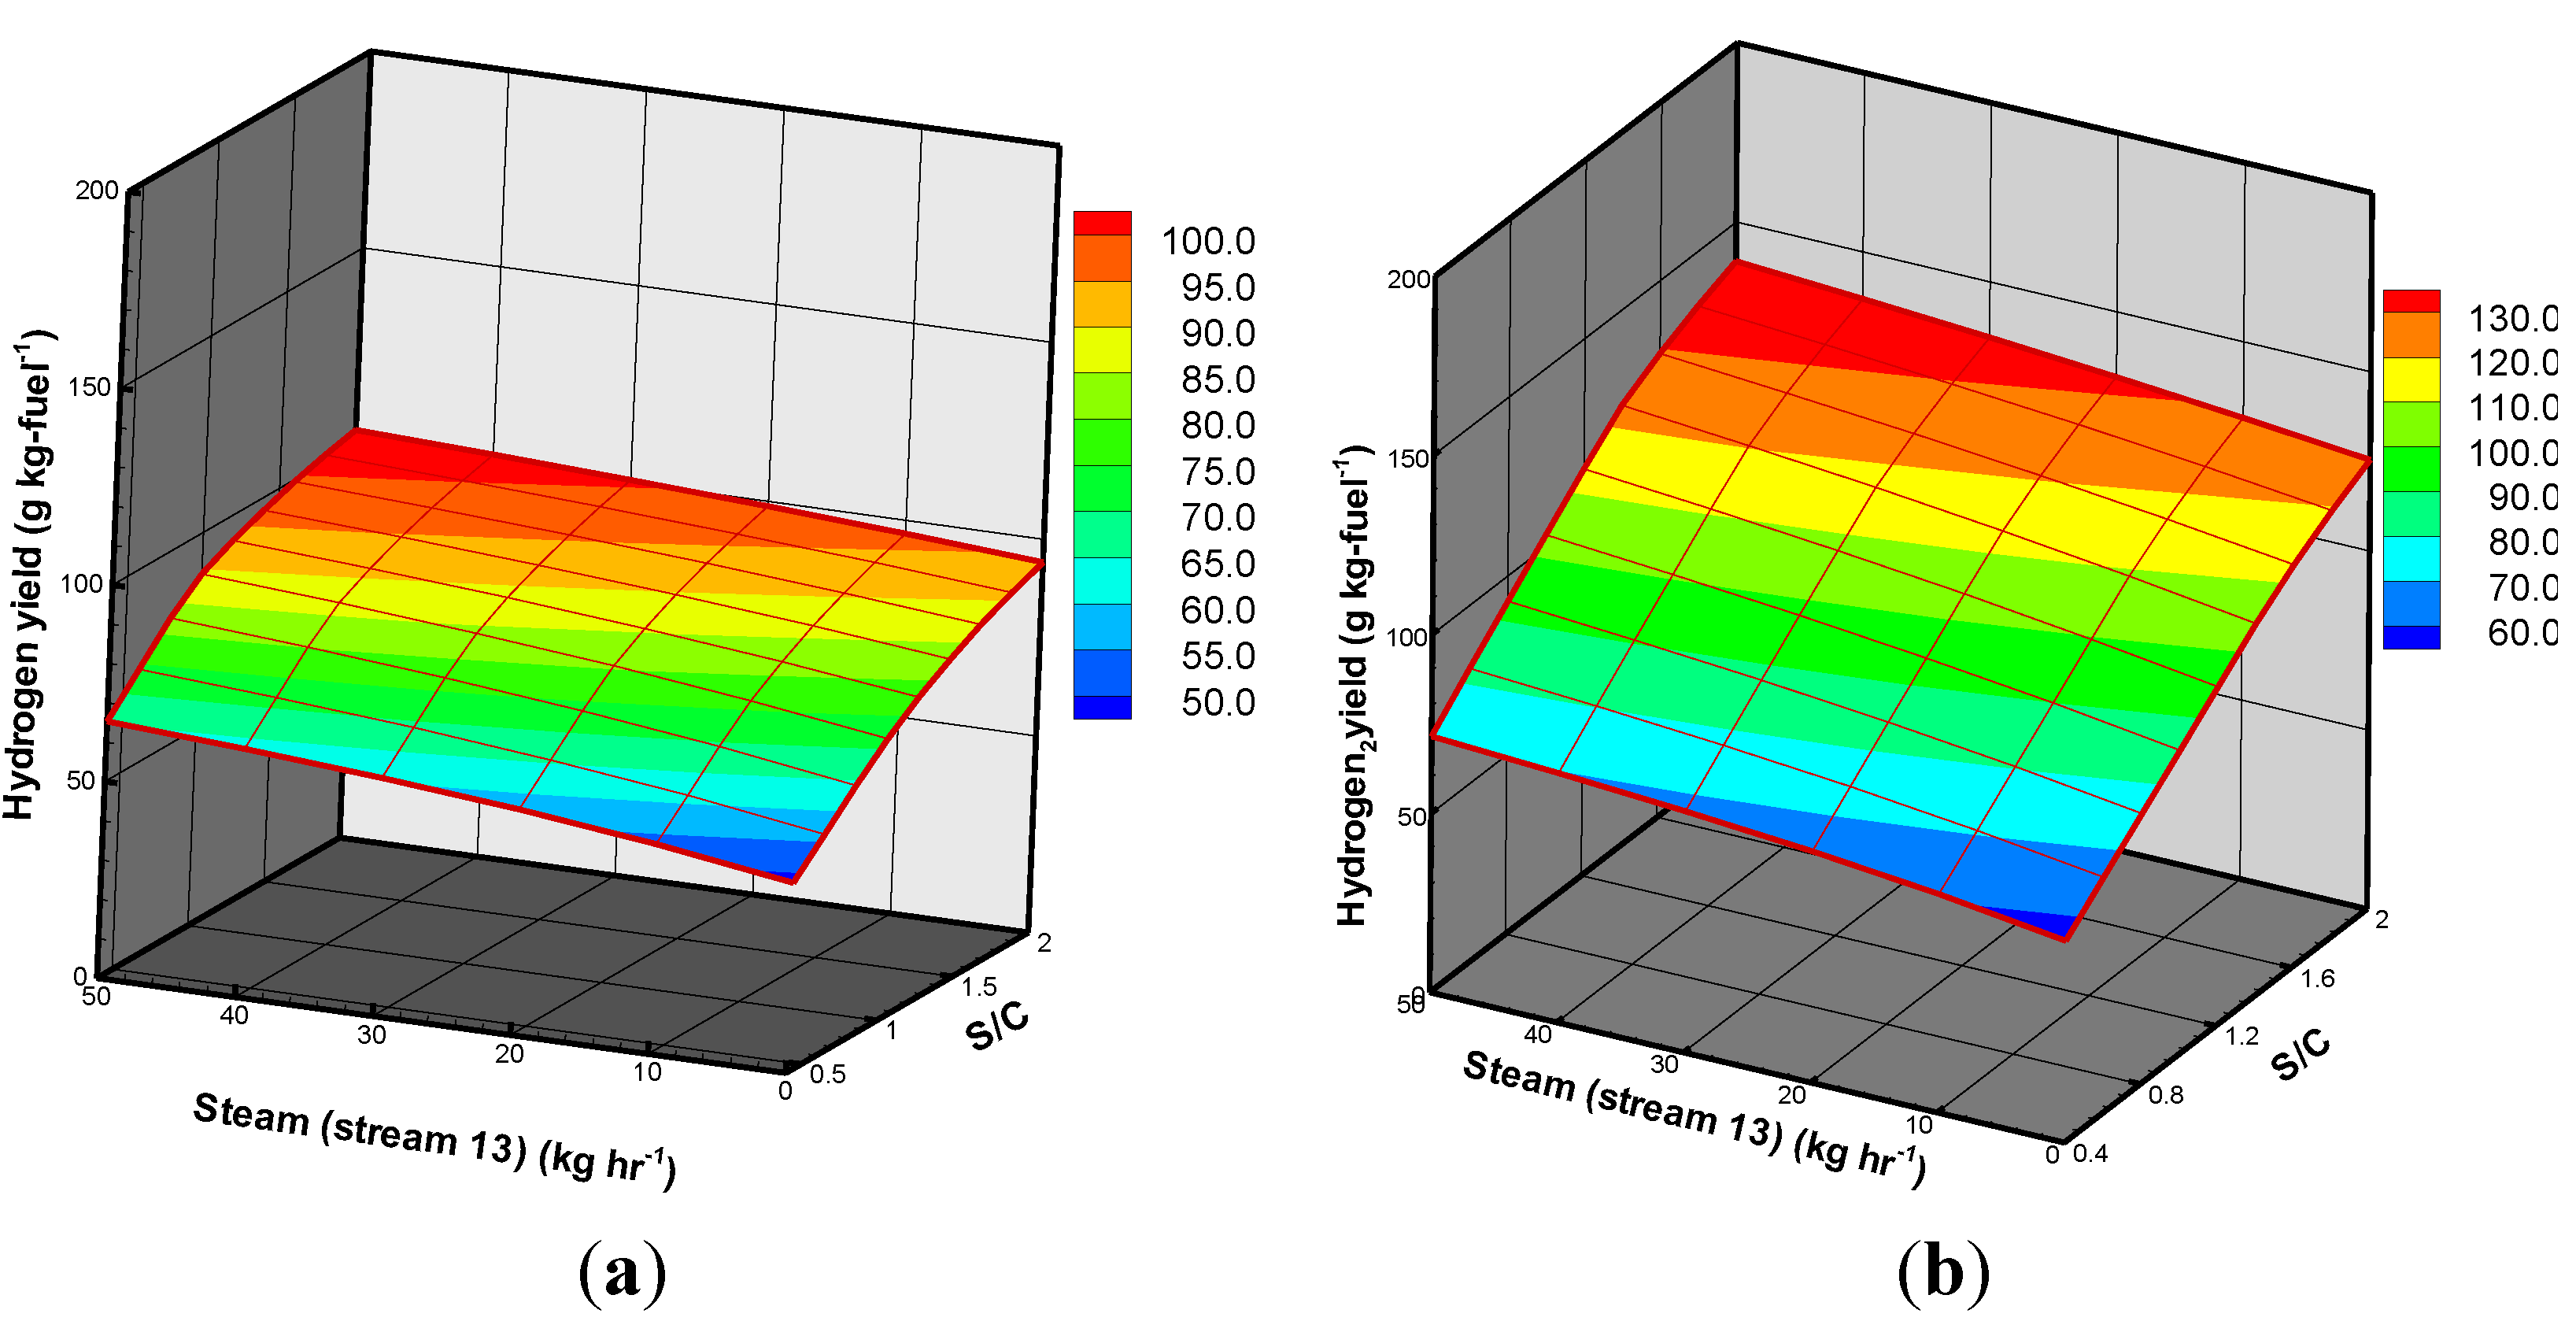
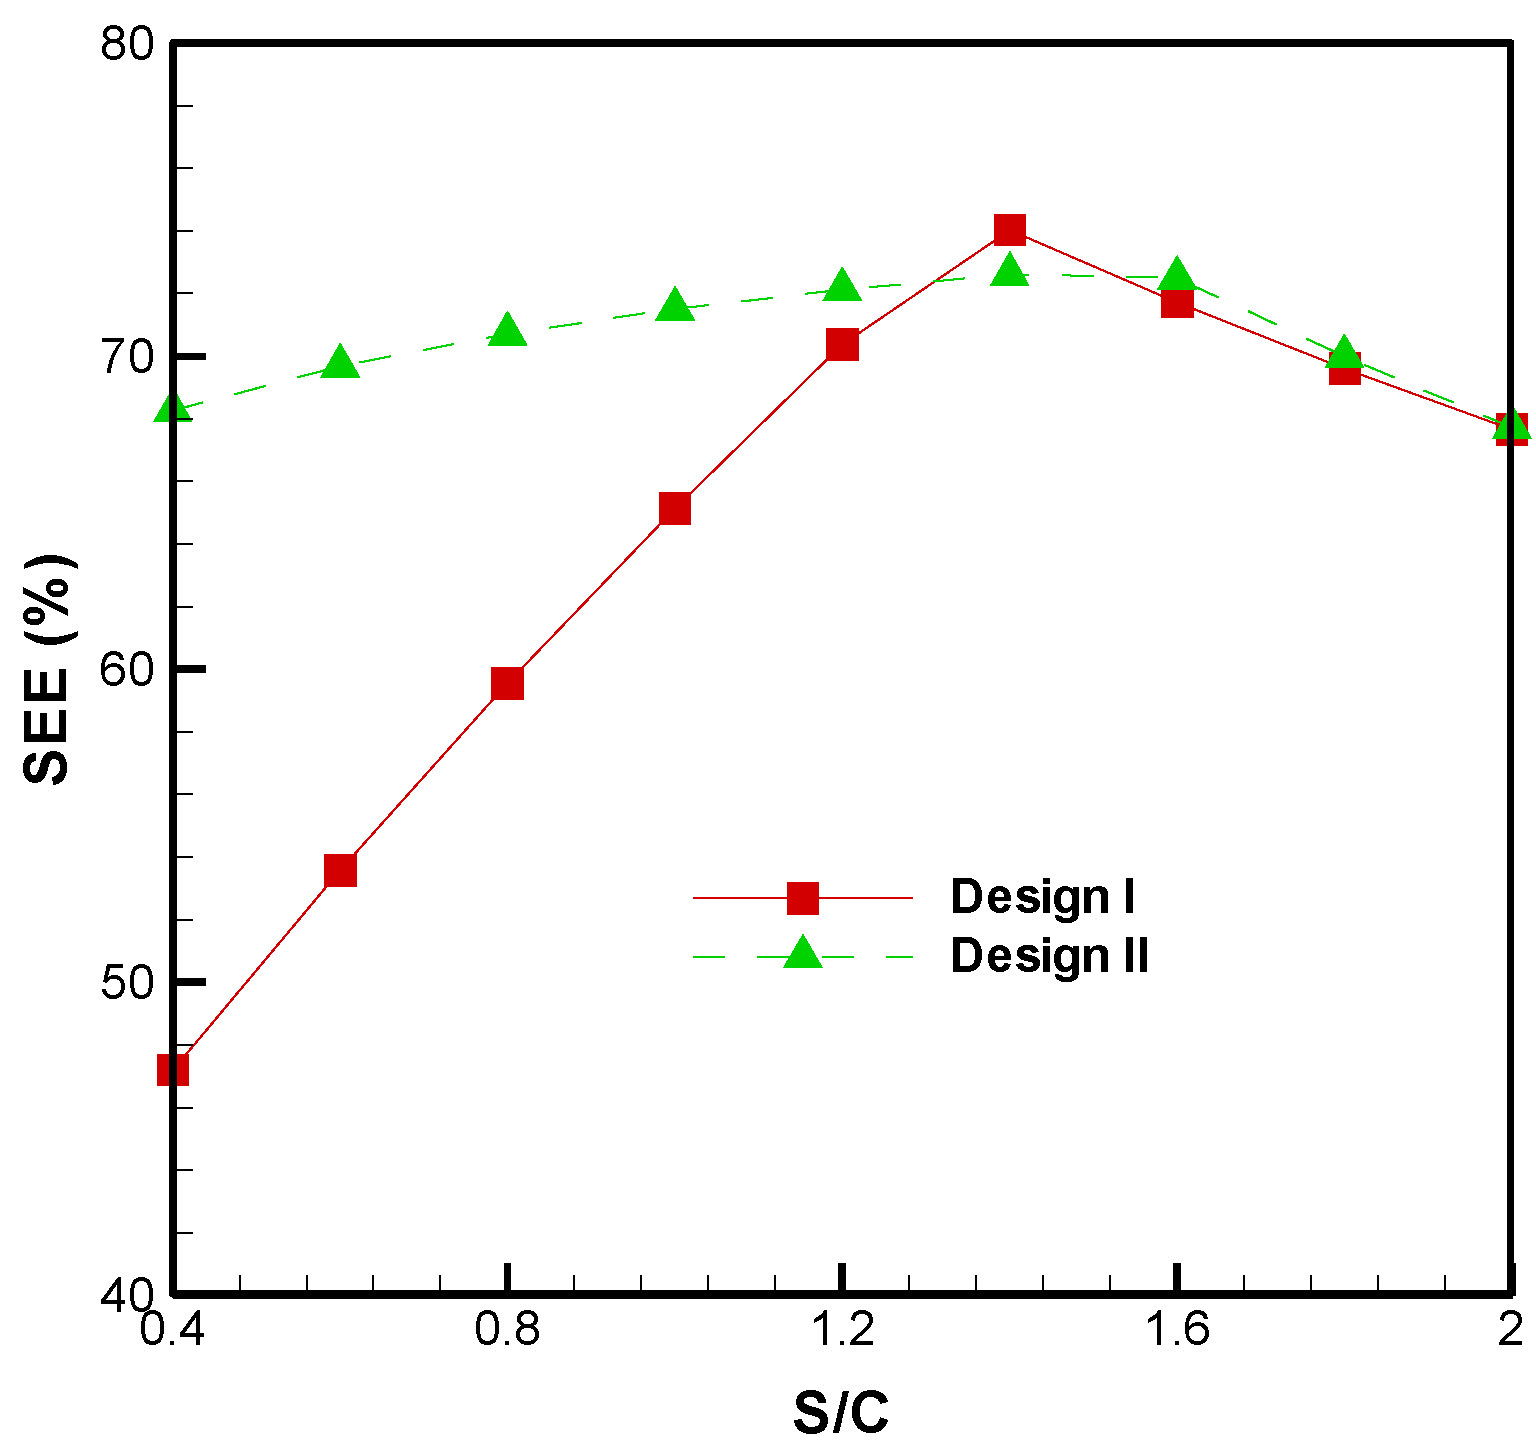
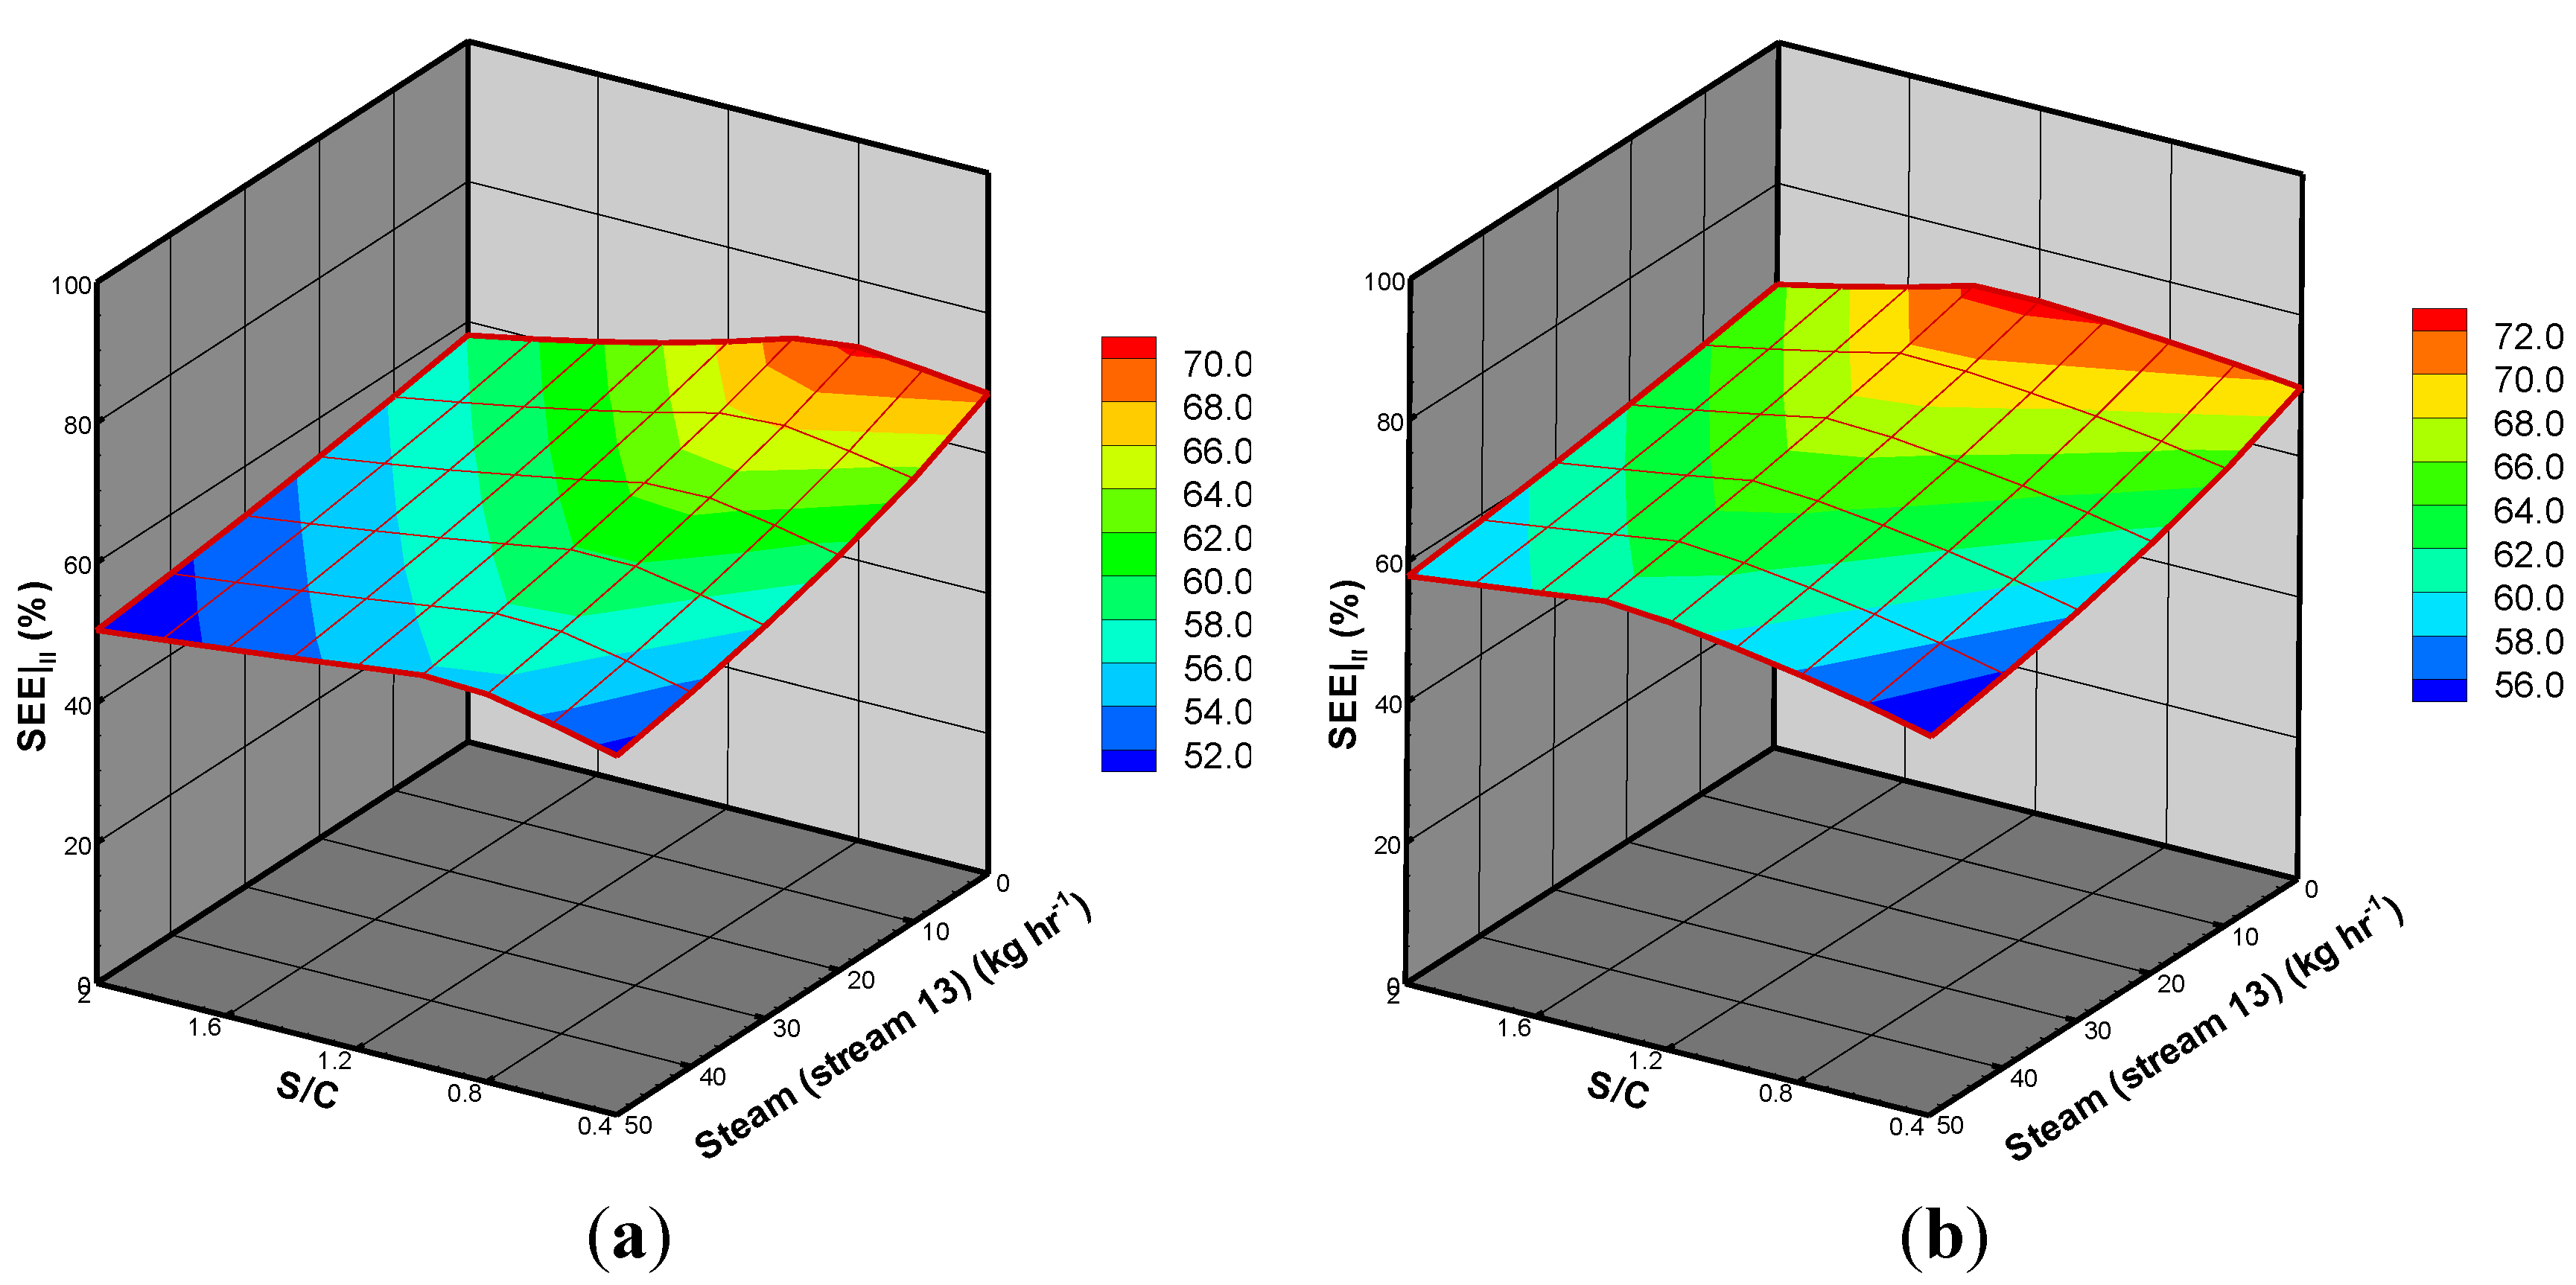
3.3. BSG Process with Heat Recovery

From the above observations, it is apparent that the hydrogen yield and SEE are significantly improved by the torrefaction pretreatment. However, if the S/C ratio is below 1.2, the SEE of TOP is lower than that of ROP. To enhance the SEE when TOP is operated at a lower S/C ratio (S/C < 1.2), a heat integration design that uses a heat recovery method is implemented in a BSG process (design II). As shown in Figure 6, a combustor (zone B) is used to react with the remaining residual char, and thus the combustion heat (QC) can recover the whole process to enhance the SEE.
Figure 6. Flow chart of the steam gasification process with heat recovery.
Energies 08 00094 g006
On the other hand, TOP has a relatively high content of CO in the product gas compared to that of ROP when the S/C ratio is beyond 1.2 (Figure 2). Therefore, to enhance the hydrogen production from TOP, design II introduces another water stream (stream 12) that is fed into the mixer. This is used to provide extra steam (stream 13) to react with the remaining CO in the WGS reactor and produce more hydrogen gas.
The effects of the amount of steam (stream 13) on the hydrogen yield are presented in Figure 7a,b. These show that increasing the amount of steam (stream 13) increases the hydrogen yield, no matter which fuels are used. This is a consequence of more hydrogen being produced from both the water gas and shift reactions (R5 and R7). However, it can be seen that the increase in the hydrogen yield of TOP is greater than that of ROP, especially when the S/C ratio is over 1.2. The maximum increase in hydrogen yield is 34.90% when the ROP is torrefied. As previously mentioned, this is because the CO concentration of TOP is greater than that of ROP, and this is responsible for the improvement in hydrogen yield.
Figure 7. Three-dimensional distributions of hydrogen yield from the gasification of (a) ROP; and (b) TOP.
Energies 08 00094 g007
With regard to the efficiency of the BSG process with heat recovery, the system energetic efficiency ( S E E   | II ) is taken into account again, and the equation is defined as follows:
S E E   | II    ( % ) = m ˙  product gas × G P × L H V  product gas m ˙ f u e l × H H V f u r l + Q ˙ r x n + m ˙ s Δ H s + Q ˙ t o r r e f a c t i o n Q ˙ c h a r × 100 %
where Q ˙ c h a r is the energy produced from combustion of the remaining residual char from the gasification process (MJ/hr).
In the definition of S E E   | II , Q ˙ c h a r contributes to BSG process system energy. Figure 8 shows the S E E   | II of ROP and TOP changes with the S/C ratio and amount of steam, where the maximum values of S E E   | II appear at 70.44 (S/C = 0.8) and 72.62% (S/C ratio = 1.2), respectively.
Figure 8. Three-dimensional distributions of system energetic efficiency from the gasification of (a) ROP; and (b) TOP.
Energies 08 00094 g008
However, if more steam is blown into the gasification system then this leads to a decrease in S E E   | II . A comparison between design I and design II of the TOP BSG process is shown in Figure 9. The S E E   | II is amplified by a factor of 2.49%–44.61% when the S/C ratio is below 1.2. Therefore, design II can be used to enhance the system energetic efficiency from the steam gasification process of TOP.
Figure 9. Effects of the S/C ratio on the system energetic efficiency of the two designs.
Energies 08 00094 g009
Table 5 gives the hydrogen yield and SEE values for the two designs. For design I, the increasing factors of hydrogen yield and SEE are 19.77% and −0.44%, respectively, when TOP is used as feedstock. Compared to the results for design I, the hydrogen yield of design II is further improved from 79.04 to 85.52 g/kg-fuel and 94.67 to 103.84 g/kg-fuel, corresponding to ROP and TOP, respectively. Although the SEE of design II may be reduced due to energy consumption to produce the extra steam (stream 13), the increasing factor of hydrogen can be raised from 19.77% to 21.42%.
Table 5. Hydrogen yield and SEE at the S/C ratio of 1.2.
ProcessDesign IDesign II (stream 13 = 20 kg/hr)
FeedstocksROPTOPROPTOP
Hydrogen yield (g/kg feedstock)79.0494.6785.52103.84
Increasing factor * (%)-19.77-21.42
SEE (%)70.6870.3760.6266.74
Increasing factor * (%)-−0.44-10.10
Note: *   Increasing   factor = Torrefied   oil   palm     Raw   oil   palm Raw   oil   palm × 100 .

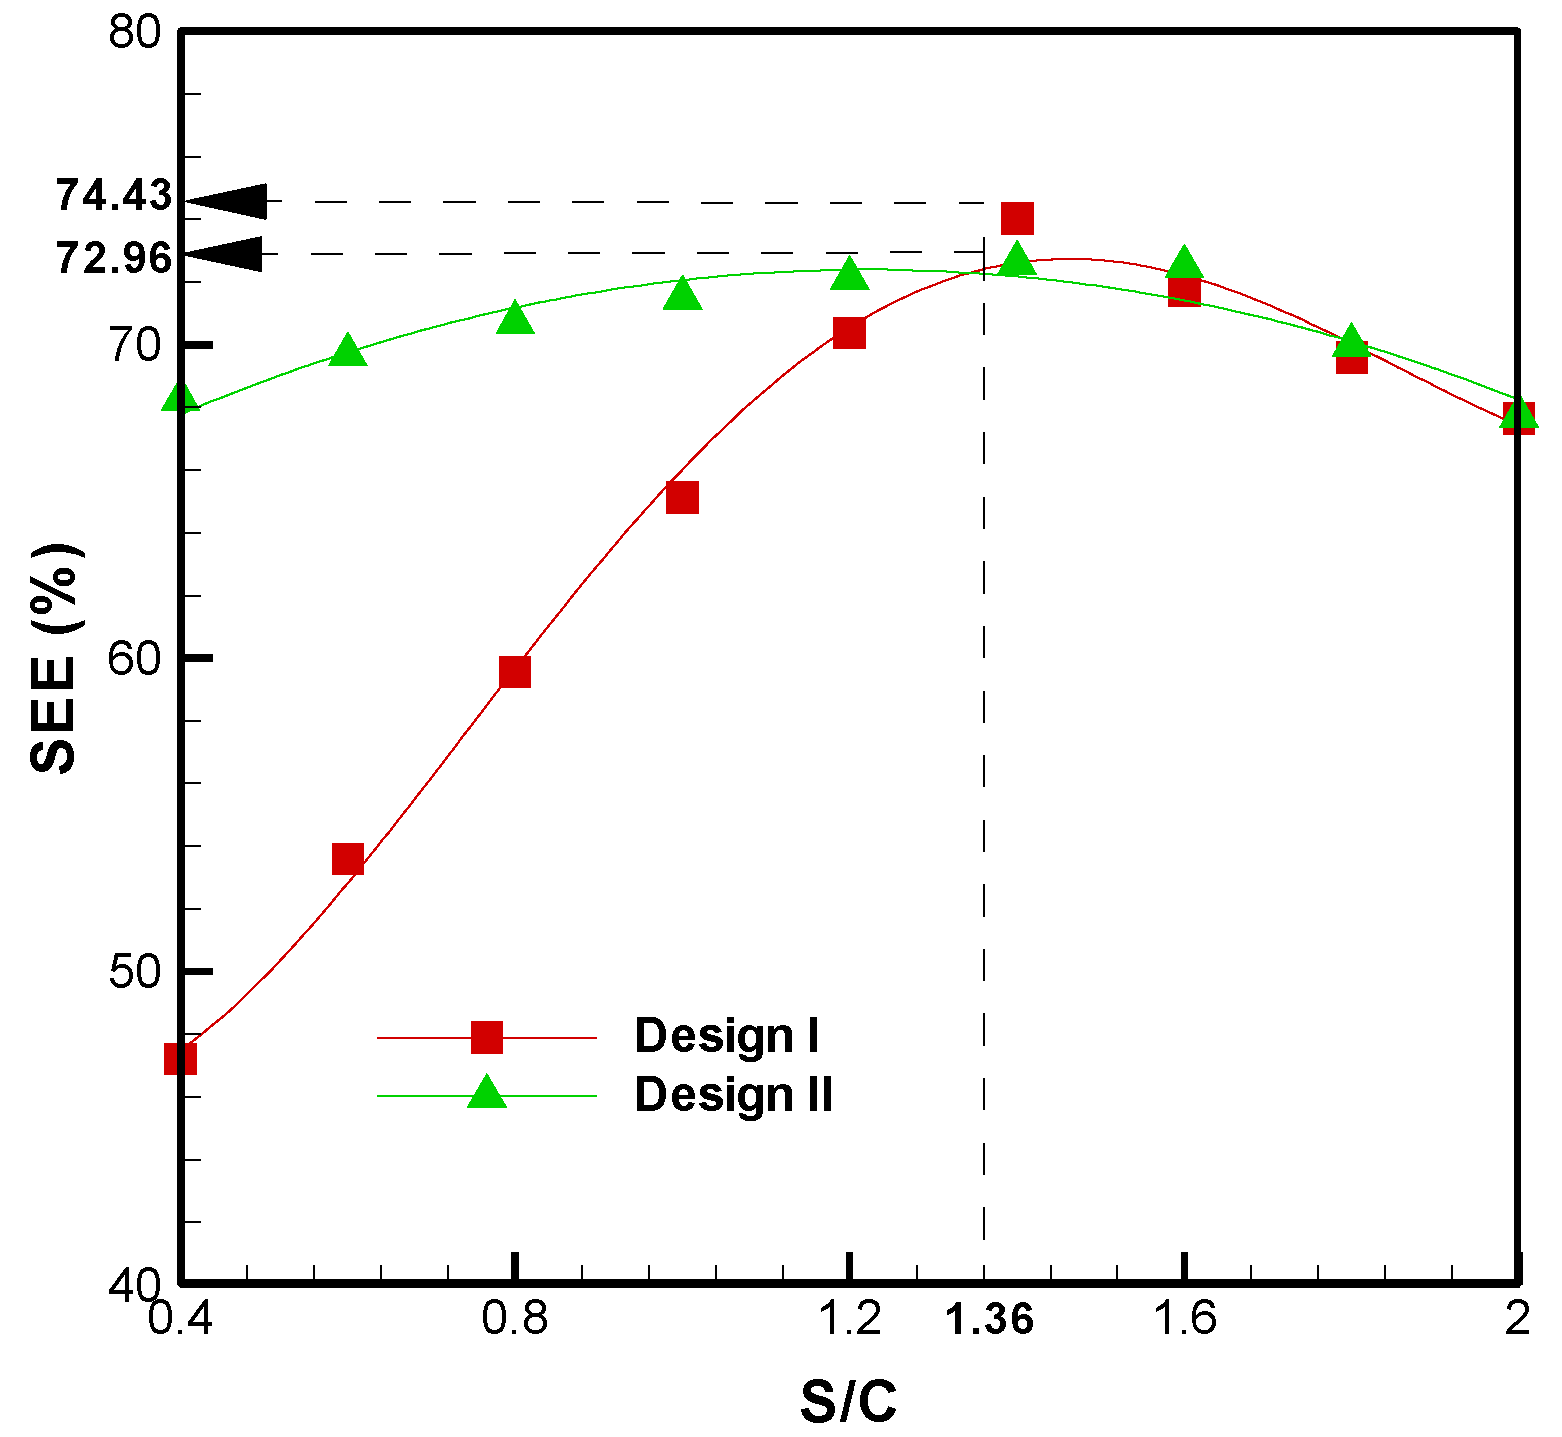
3.4. Process Optimization

The results presented above show that using TOP as feedstock in the BSG process is favorable with regard to producing rich hydrogen gas. To obtain the optimum operating conditions from TOP; an optimization process is carried out to improve the process performance and maximize the process profitability. Therefore; the optimization of the maximum SEE of the BSG process subject to constraint equations is defined in terms of two manipulated variables via FORTRAN code. The following optimization algorithm for maximizing the SEE of designs I and II is described by:
max   J i u i j = S E E | i ,    i = I, II
subject to:
a j u i j b j    j = 1 , 2
0.4 S / C = Δ m ˙ s m ˙ c a r b o n 2
where S E E   | i , is denoted as the objective (Ji) of design I and design II, and u i j = [ m ˙ s , m ˙ c a r b o n ] i T represents the steady-state operating conditions. To determine the optimal steady-state operating conditions, first the lower and upper bounds of u i j , a i and b i , are given in Table 6.
Table 6. Bounds of manipulated variables.
u i , j a j b j
u I, 1 = m ˙ s ( k g / h r ) 0120
u I, 2 = m ˙ c a r b o n ( k g / h r ) 44.8154.41
u II, 1 = m ˙ s ( k g / h r ) 0120
u II, 2 = m ˙ c a r b o n ( k g / h r ) 44.8154.41
u III, 3 = m ˙ s ( k g / h r ) 0120
u III, 4 = m ˙ c a r b o n ( k g / h r ) 44.8154.41
u III, 5 = m ˙ s t r e a m 13 ( k g / h r ) 050
Using the sequential quadratic programming (SQP) method in the Aspen Plus environment, the optimal solutions are obtained by solving the optimization algorithm, which is bounded by specific constraints in Equation (17). As a result, if the maximum LHV of the product gas is achieved, i.e., L H V p r o d u c t g a s L H V p r o d u c t g a s ,   max , then the corresponding S E E   | I would be close to the maximum value. Regarding design II, the maximum SEE is achieved by adjusting the variables, L H V p r o d u c t g a s and Q ˙ c a h r , respectively.
When the optimization of design I and design II is treated as the design specification, Figure 10 shows the profiles of the SEE of BSG process. The corresponding optimal operating condition is the S/C ratio of 1.36, and the maximum SEE values are 74.43% and 72.96%, corresponding to design I and design II, respectively. Moreover, the values of the proposed system before and after optimization are given in Table 7. Based on these optimal conditions, the increasing factor of SEE is 0.54% and 0.65%, corresponding to design I and design II, respectively. Although the optimization of design II cannot ensure a higher maximum SEE than the design I, design II can cause a significant increase in SEE when the S/C ratio is below 1.2 (Figure 9).
Figure 10. Optimization of SEE for the steam gasification process using torrefied oil palm.
Energies 08 00094 g010
Table 7. The results of BSG process from TOP before and after optimization.
ProcessDesign IDesign II
Before optimizationAfter optimizationBefore optimizationAfter optimization
S/C ratio1.41.361.41.36
SEE (%)74.0374.4372.4972.96
Increasing factor * (%)-0.54-0.65
Hydrogen yield (g/kg feedstock)104.18102.53104.20102.59
Increasing factor * (%)-−1.58-−1.54
Note: *   Increasing   factor   = After   optimization     Before   optimization Before   optimization × 100 .
The optimal operating conditions are usually based on the objective of a higher SEE. However, the maximization of hydrogen yield is another objective of this BSG process for design II. It aims to reach the maximum hydrogen yield by introducing an extra steam stream (stream 13) and keeping the SEE value of design II up to at least 0.7. The optimization algorithm is expressed by:
max u III   J III = F H 2 F H 2 i d
subject to:
a j u III , j b j    j = 3 , 4 , 5
0.4 S / C = Δ m ˙ s m ˙ c a r b o n 2
0.7 S E E
where F H 2 i d is denoted as the theoretical H2 production rate; u III = [ m ˙ s , m ˙ c a r b o n , m ˙ s t r e a m 13 ] III T represent adjustable variables. Similarly, the upper and lower bounds of u III are shown in Table 6.
The S/C ratio of 1.36 and steam (stream 13) at 18 kg hr−1 will be the optimal operating conditions in terms of J III . The maximum hydrogen yield is 111.05 g/kg-fuel and the value of SEE is 70.24%. The optimization of the BSG process (design II) in this way can thus enhance hydrogen production and ensure a high SEE.

4. Conclusions

The study presented a conceptual design of the BSG process using an Aspen Plus simulator. The results show that the optimum conditions of ROP and TOP are at the S/C ratios of 1.0 and 1.4, respectively. Under these conditions, a maximum SEE of 73.38% and a hydrogen yield of 72.74 g/kg-fuel are achieved from ROP steam gasification. The SEE and hydrogen yield values can be enhanced when ROP undergoes torrefaction at 250 °C. Accordingly, TOP is recommended to produce hydrogen enriched gas. To enhance the SEE from TOP, a heat recovery step is added to the BSG process. With regard to the heat recovery design, the SEE of TOP is amplified by a factor of 2.49%–44.61% when the S/C ratio is below 1.2. Therefore, this design can be used to enhance the system energetic efficiency from the steam gasification process of torrefied oil palm. Finally, the optimum S/C ratio is 1.36, based on the optimal strategy for maximizing the SEE.

Acknowledgments

The authors would like to thank the Ministry of Science and Technology of the Republic of China for its partial financial support of this research under grant MOST 103-2221-E-006-251.

Conflicts of Interest

The authors declare no conflict of interest.

References

  1. Howaniec, N.; Smolinski, A. Steam co-gasification of coal and biomass-Synergy in reactivity of fuel blends chars. Int. J. Hydrog. Energy 2013, 38, 16152–16160. [Google Scholar] [CrossRef]
  2. Taba, L.E.; Irfan, M.F.; Daud, W.A.M.W.; Chakrabarti, M.H. The effect of temperature on various parameters in coal, biomass and CO-gasification: A review. Renew. Sustain. Energy Rev. 2012, 16, 5584–5596. [Google Scholar] [CrossRef]
  3. Trippe, F.; Fröhling, M.; Schultmann, F.; Stahl, R.; Henrich, E. Techno-economic assessment of gasification as a process step within biomass-to-liquid (BtL) fuel and chemicals production. Fuel Process. Technol. 2011, 92, 2169–2184. [Google Scholar] [CrossRef]
  4. Balat, M.; Balat, M.; Kırtay, E.; Balat, H. Main routes for the thermo-conversion of biomass into fuels and chemicals. Part 2: Gasification systems. Energy Convers. Manag. 2009, 50, 3158–3168. [Google Scholar] [CrossRef]
  5. Normann, F.; Thunman, H.; Johnsson, F. Process analysis of an oxygen lean oxy-fuel power plant with co-production of synthesis gas. Energy Convers. Manag. 2009, 50, 279–286. [Google Scholar] [CrossRef]
  6. Pentananunt, R.; Rahman, A.N.M.M.; Bhattacharya, S.C. Upgrading of biomass by means of torrfaction. Energy 1990, 15, 1175–1179. [Google Scholar] [CrossRef]
  7. Phanphanich, M.; Mani, S. Impact of torrefaction on the grindability and fuel characteristics of forest biomass. Bioresour. Technol. 2011, 102, 1246–1253. [Google Scholar] [CrossRef] [PubMed]
  8. Chen, W.H.; Kuo, P.C. Torrefaction and co-torrefaction characterization of hemicellulose, cellulose and lignin as well as torrefaction of some basic constituents in biomass. Energy 2011, 36, 803–811. [Google Scholar] [CrossRef]
  9. Mani, S.; Tabil, L.G.; Sokhansanj, S. Grinding performance and physical properties of wheat and barley straws, corn stover and switchgrass. Biomass Bioenergy 2004, 27, 339–352. [Google Scholar] [CrossRef]
  10. Chew, J.J.; Doshi, V. Recent advances in biomass pretreatment-Torrefaction fundamentals and Technology. Renew. Sustain. Energy Rev. 2011, 15, 4212–4222. [Google Scholar] [CrossRef]
  11. van der Stelet, M.J.C.; Gerhauser, H.; Kiel, J.H.A.; Ptasinski, K.J. Biomass upgrading by torrefaction for the production of biofuels: A review. Biomass Bioenergy 2011, 35, 3748–3762. [Google Scholar]
  12. Chen, Q.; Zhou, J.S.; Liu, B.J.; Mei, Q.F.; Luo, Z.Y. Influence of torrefaction pretreatment on biomass gasification technology. Chinese Sci. Bull. 2011, 56, 1449–1456. [Google Scholar] [CrossRef]
  13. Kuo, P.C.; Wu, W.; Chen, W.H. Gasification performances of raw and torrefied biomass in a downdraft fixed bed gasifier using thermodynamic analysis. Fuel 2013, 117, 1231–1241. [Google Scholar] [CrossRef]
  14. Sarkar, M.; Kumar, A.; Tumuluru, J.S.; Patil, K.N.; Bellmer, D.D. Gasification performance of switchgrass pretreated with torrefaction and densification. Appl. Energy 2014, 127, 194–201. [Google Scholar] [CrossRef]
  15. Berrueco, C.; Recari, J.; Matas Güell, B.; del Alamo, C. Pressurized gasification of torrefied woody biomass in a lab scale fluidized bed. Energy 2014, 70, 68–78. [Google Scholar] [CrossRef]
  16. Weiland, F.; Nordwaeger, M.; Olofsson, I.; Wiinikka, H.; Nordin, A. Entrained flow gasification of torrefied wood residues. Fuel Process. Technol. 2014, 125, 51–58. [Google Scholar] [CrossRef]
  17. Nipattummakul, N.; Ahmed, I.I.; Kerdsuwan, S.; Gupta, A.K. Hydrogen and syngas production from sewage sludge via steam gasification. Int. J. Hydrog. Energy 2010, 35, 11738–11745. [Google Scholar] [CrossRef]
  18. Hernández, J.J.; Aranda, G.; Barba, J.; Mendoza, J.M. Effect of steam content in the air-steam flow on biomass entrained flow gasification. Fuel Process. Technol. 2012, 99, 43–55. [Google Scholar] [CrossRef]
  19. Franco, C.; Pinto, F.; Gulyurtlu, I.; Cabrita, I. The study of reactions influencing the biomass steam gasification process. Fuel 2003, 82, 835–842. [Google Scholar] [CrossRef]
  20. Lv, P.M.; Xiong, Z.H.; Chang, J.; Wu, C.Z.; Chen, Y.; Zhu, J.X. An experimental study on biomass air-steam gasification in a fluidized bed. Bioresour. Technol. 2004, 95, 95–101. [Google Scholar] [CrossRef] [PubMed]
  21. Schuster, G.; Loffler, G.; Weigl, K.; Hofbauer, H. Biomass steam gasificationan-extensive parametric modeling study. Bioresour. Technol. 2001, 77, 71–79. [Google Scholar] [CrossRef] [PubMed]
  22. Doherty, W.; Reynolds, A.; Kennedy, D. Aspen plus simulation of biomass gasification in a steam blown dual fluidised bed. In Materials and Processes for Energy: Communicating Current Research and Technological Developments; Méndez-Vilas, A., Ed.; Formatex Research Centre: Badajoz, Spain, 2013. [Google Scholar]
  23. Ramzan, N.; Ashraf, A.; Naveed, S.; Malik, A. Simulation of hybrid biomass gasification using Aspen plus: A comparative performance analysis for food, municipal solid and poultry waste. Biomass Bioenergy 2011, 35, 3962–3969. [Google Scholar] [CrossRef]
  24. Chen, X.; Zheng, D.; Guo, J.; Liu, J.; Ji, P. Energy analysis for low-rank coal based process system to co-produce semicoke, syngas and light oil. Energy 2013, 52, 279–288. [Google Scholar] [CrossRef]
  25. Hla, S.S.; Morpeth, L.D.; Sun, Y.; Duffy, G.J.; Ilyushechkin, A.Y.; Roberts, D.G.; Edwards, J.H. A CeO2–La2O3-based Cu catalyst for the processing of coal-derived syngases via high-temperature water–gas shift reaction. Fuel 2013, 114, 178–186. [Google Scholar] [CrossRef]
  26. Jayah, T.H.; Aye, L.; Fuller, R.J.; Stewart, D.F. Computer simulation of a downdraft wood gasier for tea drying. Biomass Bioenergy 2003, 25, 459–469. [Google Scholar] [CrossRef]
  27. Gao, N.; Li, A.; Quan, C.; Gao, F. Hydrogen-rich gas production from biomass steam gasification in an updraft fixed-bed gasifier combined with a porous ceramic reformer. Int. J. Hydrog. Energy 2008, 33, 5430–5438. [Google Scholar] [CrossRef]
  28. Chen, W.H.; Du, S.W.; Tsai, C.H.; Wang, Z.Y. Torrefied biomasses in a drop tube furnace to evaluate their utility in blast furnaces. Bioresour. Technol. 2012, 111, 433–438. [Google Scholar] [CrossRef] [PubMed]
  29. Chaudhari, S.T.; Bej, S.K.; Bakhshi, N.N.; Dalai, A.K. Steam gasification of biomass-derived char for the production of carbon monoxide-rich synthesis gas. Energy Fuels 2001, 15, 736–742. [Google Scholar] [CrossRef]
  30. Yan, F.; Luo, S.Y.; Hu, Z.Q.; Xiao, B.; Cheng, G. Hydrogen-rich gas production by steam gasification of char from biomass fast pyrolysis in a fixed-bed reactor: Influence of temperature and steam on hydrogen yield and syngas composition. Bioresour. Technol. 2010, 101, 5633–5637. [Google Scholar] [CrossRef] [PubMed]
  31. Sattar, A.; Leeke, G.A.; Hornung, A.; Wood, J. Steam gasification of rapeseed, wood, sewage sludge and miscanthus biochars for the production of a hydrogen-rich syngas. Biomass Bioenergy 2014, 69, 276–286. [Google Scholar] [CrossRef]
  32. Kaewpanha, M.; Guan, G.; Hao, X.; Wang, Z.; Kasai, Y.; Kusakabe, K.; Abudula, A. Steam co-gasification of brown seaweed and land-based biomass. Fuel Process. Technol. 2014, 120, 106–112. [Google Scholar] [CrossRef]
  33. Vivanpatarakij, S.; Assabumrungrat, S. Thermodynamic analysis of combined unit of biomass gasifier and tar steam reformer for hydrogen production and tar removal. Int. J. Hydrog. Energy 2013, 38, 3930–3936. [Google Scholar] [CrossRef]
  34. Granados, D.A.; Vel asquez, H.I.; Chejne, F. Energetic and exergetic evaluation of residual biomass in a torrefaction process. Energy 2014, 74, 181–189. [Google Scholar] [CrossRef]

