
Stochastic Multicriteria Acceptability Analysis for Evaluation of Combined Heat and Power Units

Abstract
:1. Introduction
2. Combined Heat and Power Units and Evaluation Criteria
2.1. Combined Heat and Power Units
- S1: compression engines diesel 200 kWe (industry).
- S2: compression engines diesel 20 MWe (industry).
- S3: gas engines—Otto cycle 1 kWe (household).
- S4: gas engines—Otto cycle 13 MWe (industry).
- S5: GT 500 kWe (industry).
- S6: GT 225 MWe (industry).
- S7: micro-turbines (CHP) 10 kWe (industry).
- S8: micro-turbines (CHP) 500 kWe (industry).
- S9: combined cycle gas turbines (CCGT) 8 MWe (industry).
- S10: CCGT 750 MWe (industry).
- S11: ST 500 kWe (coal) (hot water) (industry).
- S12: ST 500 kWe (fuel oil) (hot water) (industry).
- S13: ST 500 kWe (natural gas) (hot water) (industry).
- S14: ST 150 MWe (coal) (hot water) (industry).
- S15: ST 150 MWe (fuel oil) (hot water) (industry).
- S16: ST 150 MWe (natural gas) (hot water) (industry).

| CHP | Electrical output (kWe) | Power to heat ratio | Efficiency (%) | Installation cost (€/kWe) | Maintenance cost (c€/kW·he) | Electricity cost (c€/kW·he) | Heat cost (c€/kW·hth) | CO2 production (kg/MW·he) | Footprint (m2/kWe) |
|---|---|---|---|---|---|---|---|---|---|
| S1 | 200 | 1.00 | 85 | 500 | 1 | 5.64 | 7.74 | 623.53 | 0.02 |
| S2 | 20,000 | 1.23 | 88 | 1,500 | 0.5 | 2.30 | 4.84 | 545.96 | 0.011 |
| S3 | 1 | 0.45 | 85 | 500 | 2 | 32.82 | 17.85 | 758.17 | 0.3 |
| S4 | 13,000 | 0.90 | 88 | 2,500 | 0.7 | 3.81 | 4.84 | 479.80 | 0.014 |
| S5 | 500 | 0.45 | 80 | 500 | 0.8 | 15.93 | 7.74 | 805.56 | 0.015 |
| S6 | 225,000 | 0.70 | 90 | 1,200 | 0.2 | 4.37 | 4.72 | 539.68 | 0.0045 |
| S7 | 10 | 0.29 | 75 | 1,500 | 1 | 33.84 | 9.61 | 1,186.21 | 0.05 |
| S8 | 500 | 0.60 | 85 | 1,100 | 0.5 | 10.12 | 7.74 | 627.45 | 0.02 |
| S9 | 8,000 | 0.96 | 73 | 1,000 | 0.8 | 5.78 | 5.18 | 559.36 | 0.03 |
| S10 | 750,000 | 1.25 | 90 | 500 | 0.2 | 1.73 | 4.72 | 400 | 0.025 |
| S11 | 500 | 0.25 | 82 | 2,000 | 0.5 | 2.23 | 0.51 | 2,042.68 | 0.06 |
| S12 | 500 | 0.25 | 82 | 2,000 | 0.45 | 8.23 | 2.18 | 1,615.85 | 0.05 |
| S13 | 500 | 0.25 | 82 | 2,000 | 0.4 | 28.35 | 7.74 | 1,219.51 | 0.027 |
| S14 | 150,000 | 0.60 | 85 | 1,100 | 0.25 | 0.77 | 0.51 | 1,050.98 | 0.06 |
| S15 | 150,000 | 0.60 | 85 | 1,100 | 0.2 | 2.82 | 2.18 | 831.37 | 0.05 |
| S16 | 150,000 | 0.60 | 85 | 1,100 | 0.15 | 5.98 | 4.72 | 627.45 | 0.027 |
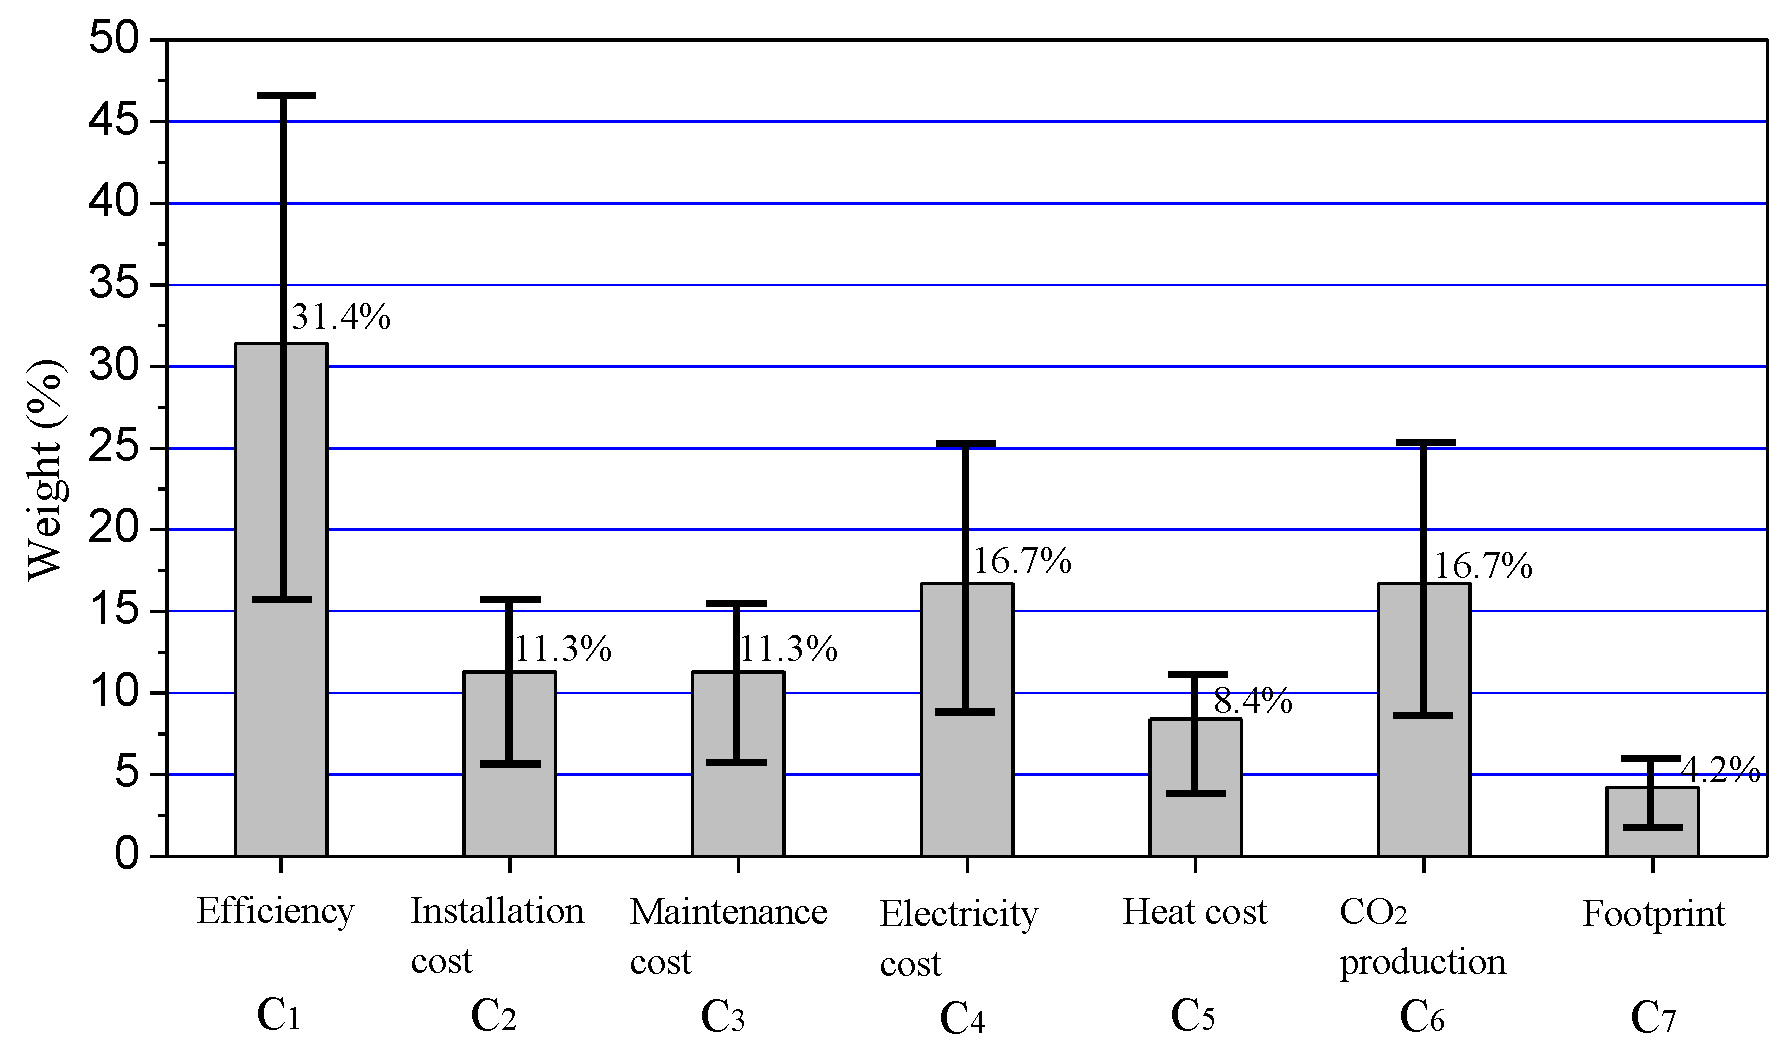
2.2. Properties and Measurements of Criteria
| Criteria | Efficiency | Installation cost | Maintenance cost | Electricity cost | Heat cost | CO2 production | Footprint |
|---|---|---|---|---|---|---|---|
| Criteria No. | C1 | C2 | C3 | C4 | C5 | C6 | C7 |
| Property 1 | ▲ | ▼ | ▼ | ▼ | ▼ | ▼ | ▼ |
| Uncertainty | ±5% | ±10% | ±10% | ±10% | ±10% | ±10% | ±10% |
3. Weighting Method Based on a Complementary Judgment Matrix
3.1. Complementary Judgment Matrix
| Description | aij | aji |
|---|---|---|
| ith criterion is equally important compared with jth | 0.5 | 0.5 |
| ith criterion is a little more important compared with jth | 0.6 | 0.4 |
| ith criterion is important compared with jth | 0.7 | 0.3 |
| ith criterion is very important compared with jth | 0.8 | 0.2 |
| ith criterion is extremely important compared with jth | 0.9 | 0.1 |
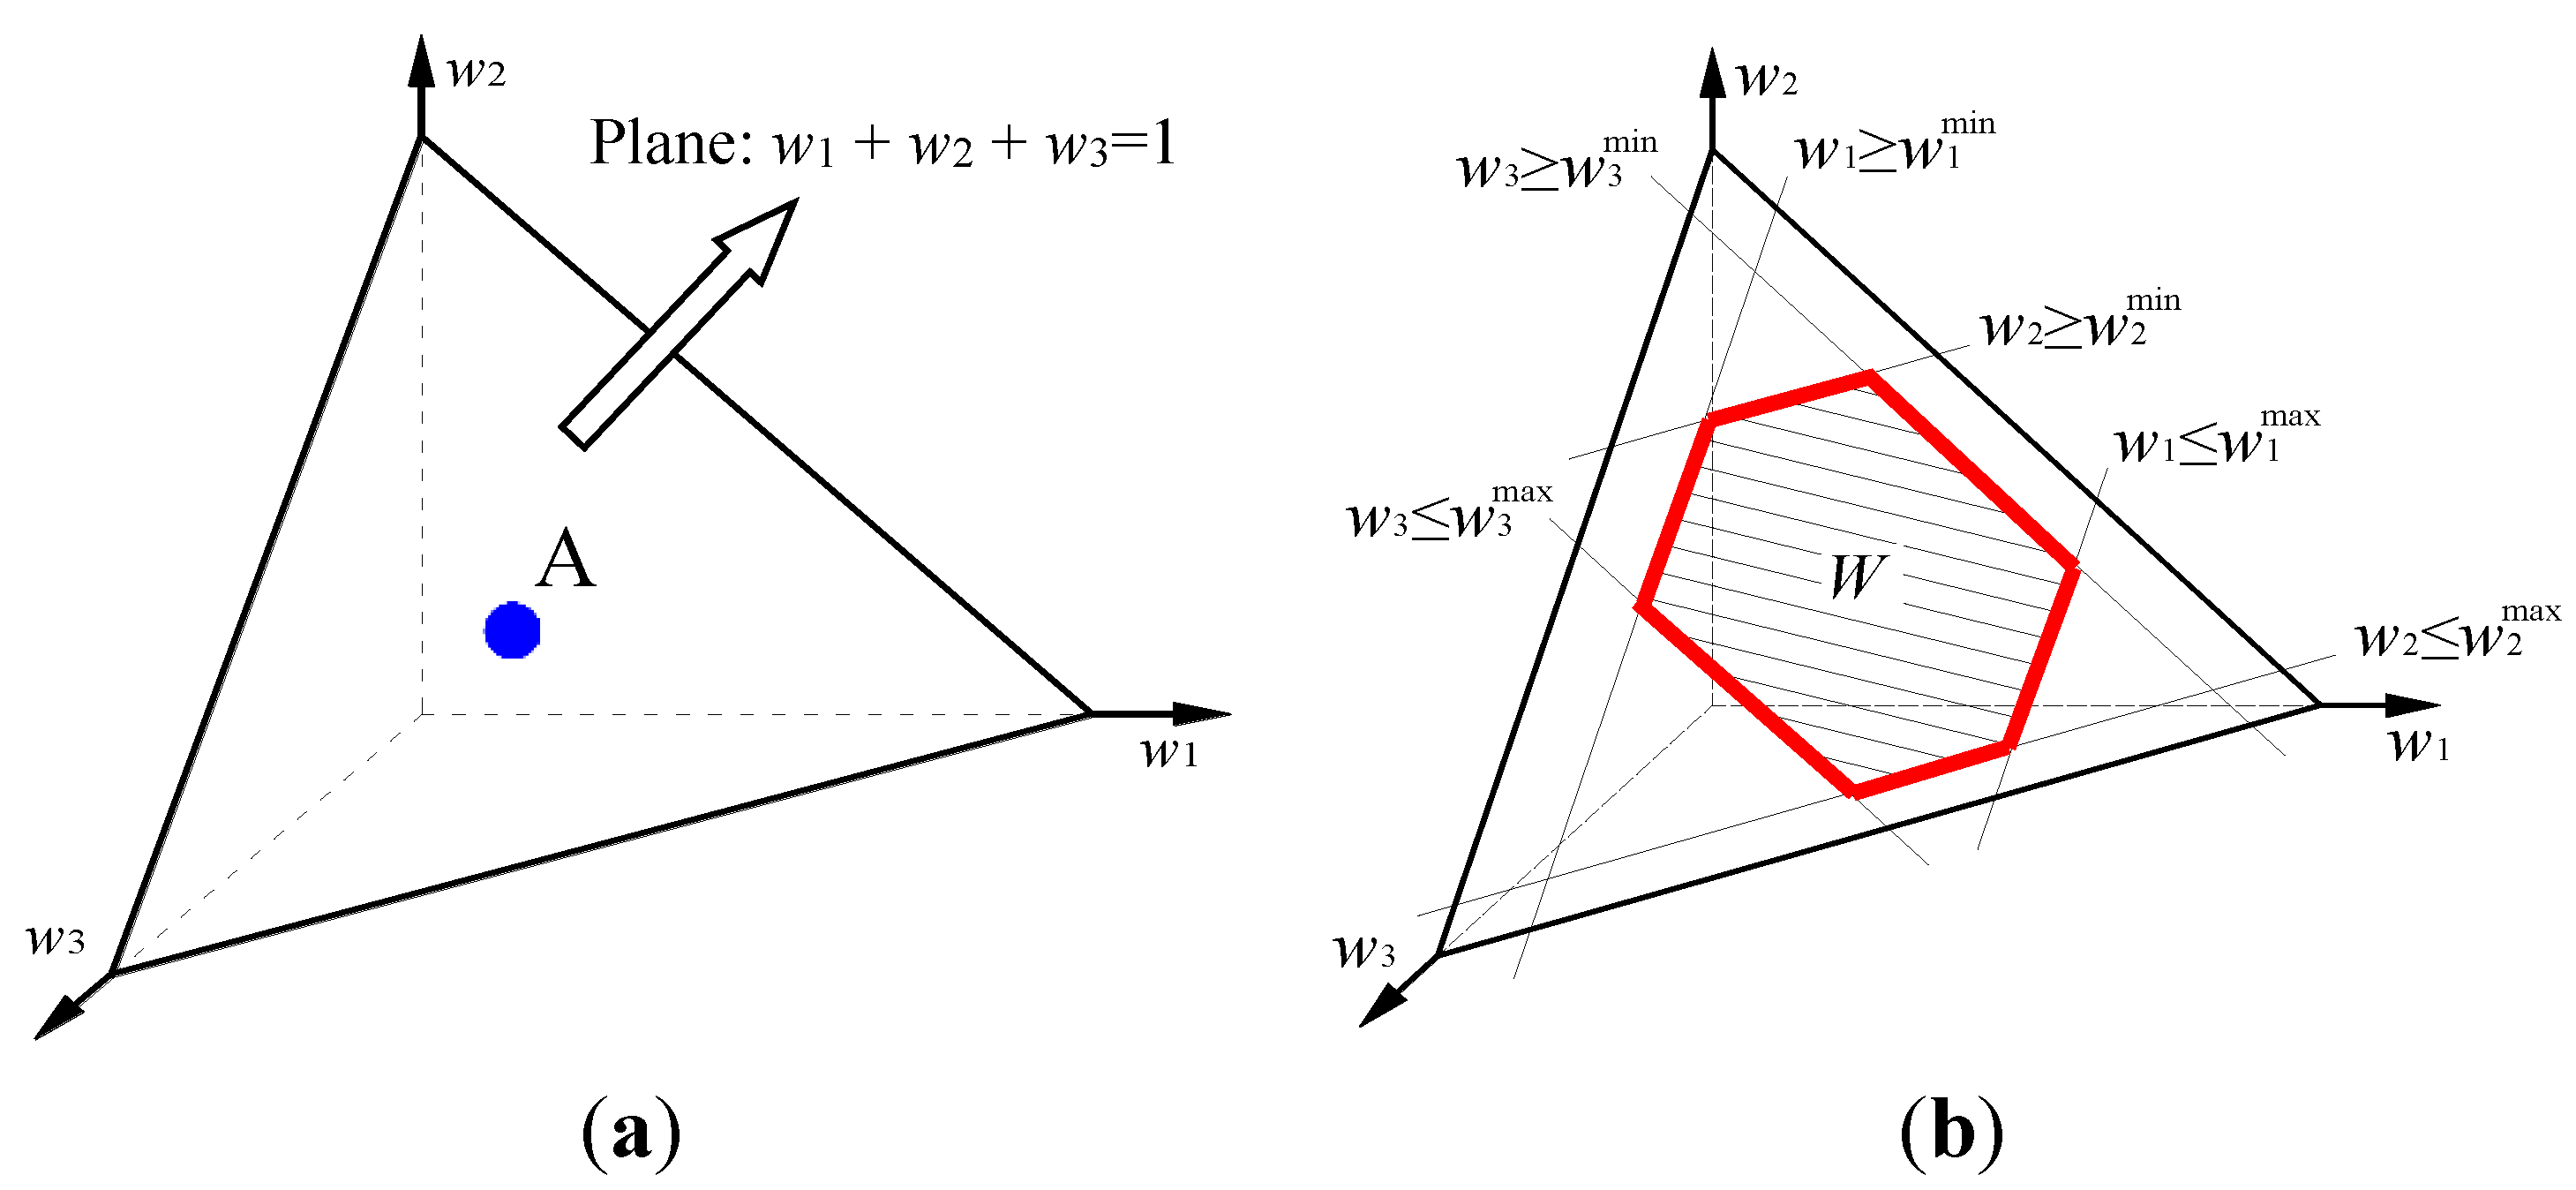
3.2. Feasible Weight Space


4. Stochastic Multicriteria Acceptability Analysis
4.1. The Stochastic Multicriteria Acceptability Analysis-2 Model
4.2. Handling the Uncertainties
4.2.1. Uncertainties in Criteria Measurements
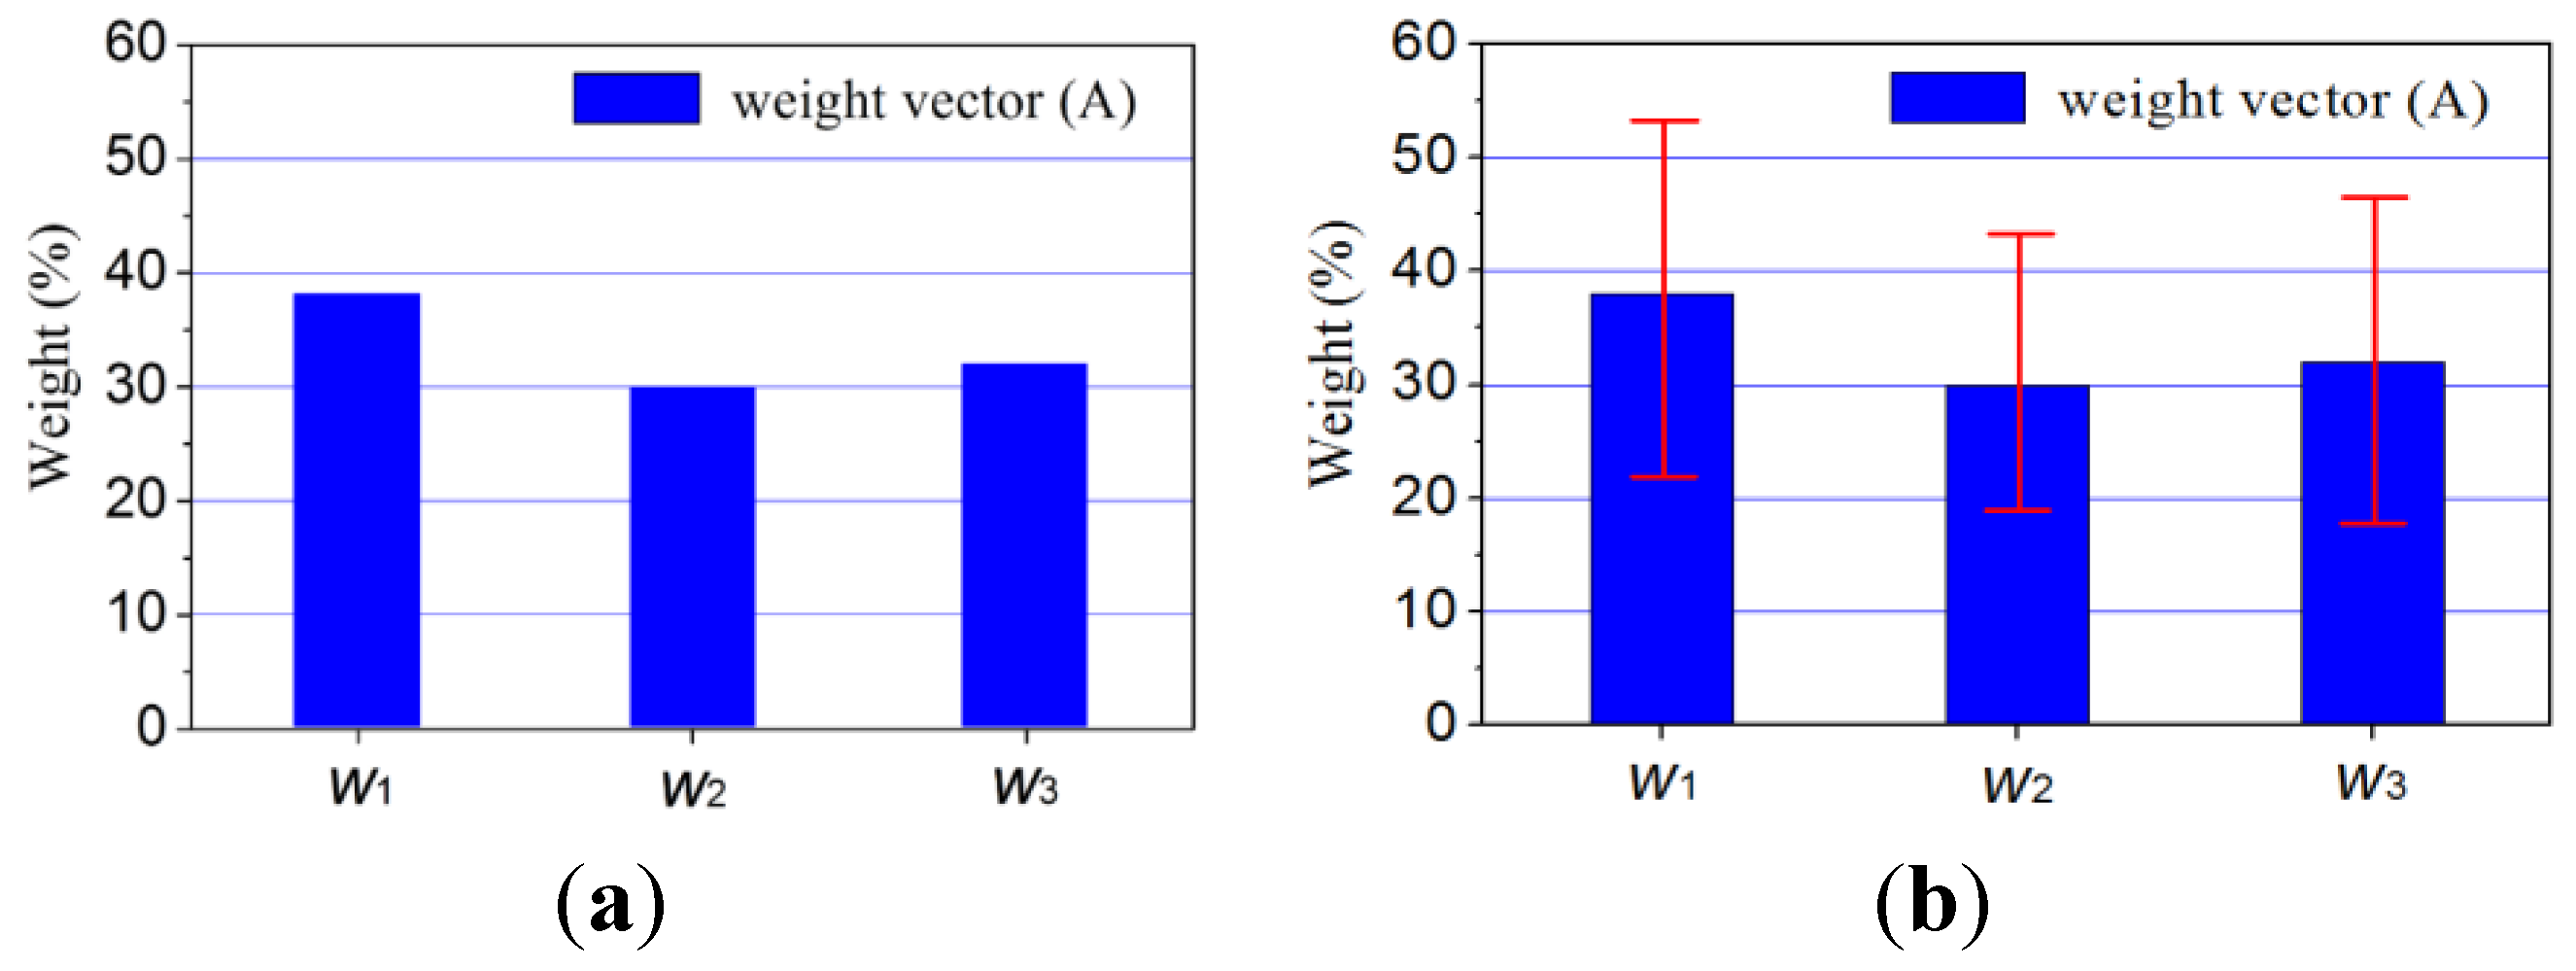
4.2.2. Uncertainties in Weighting


5. Results and Discussion
| Weight type | No. | Description |
|---|---|---|
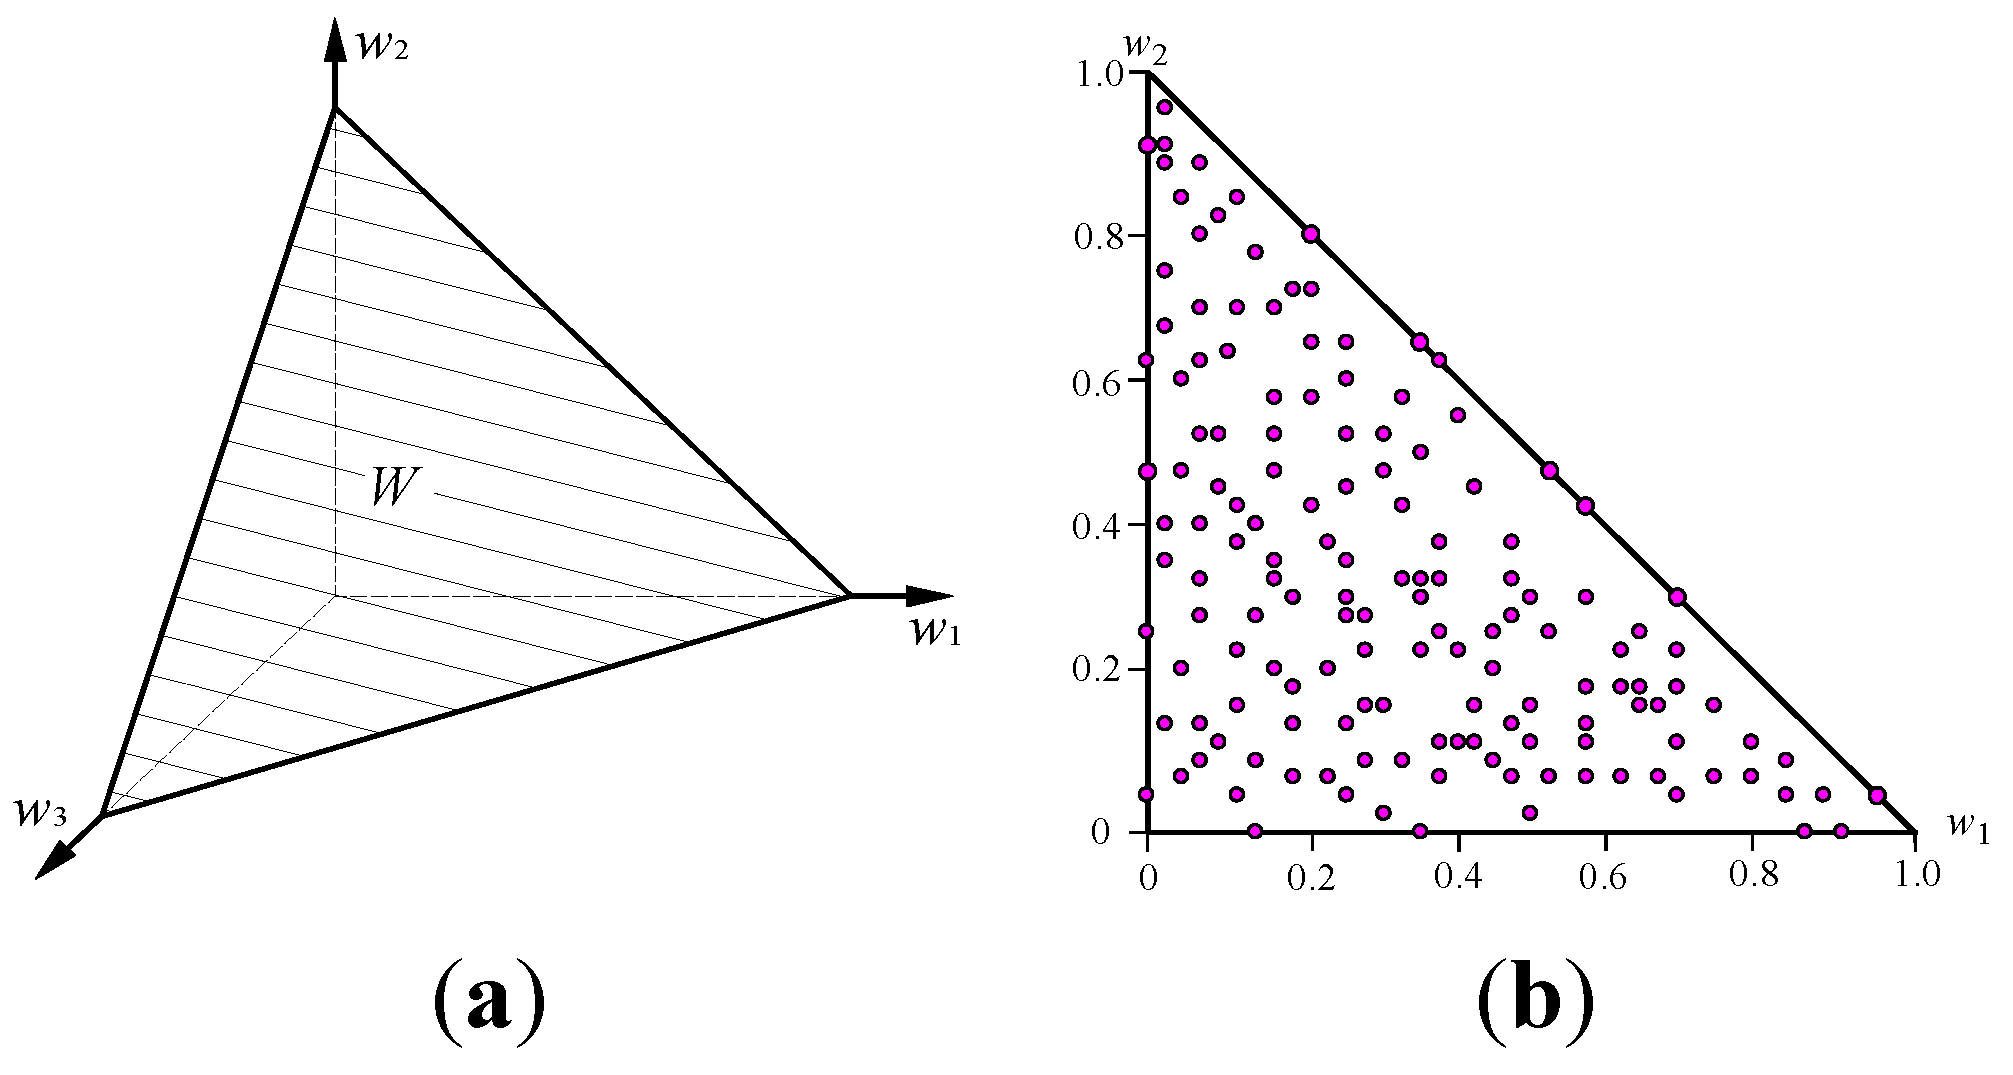
| No weight information | (a) | The FWS is the general weight space with seven criteria, i.e., a six-dimensional simplex |
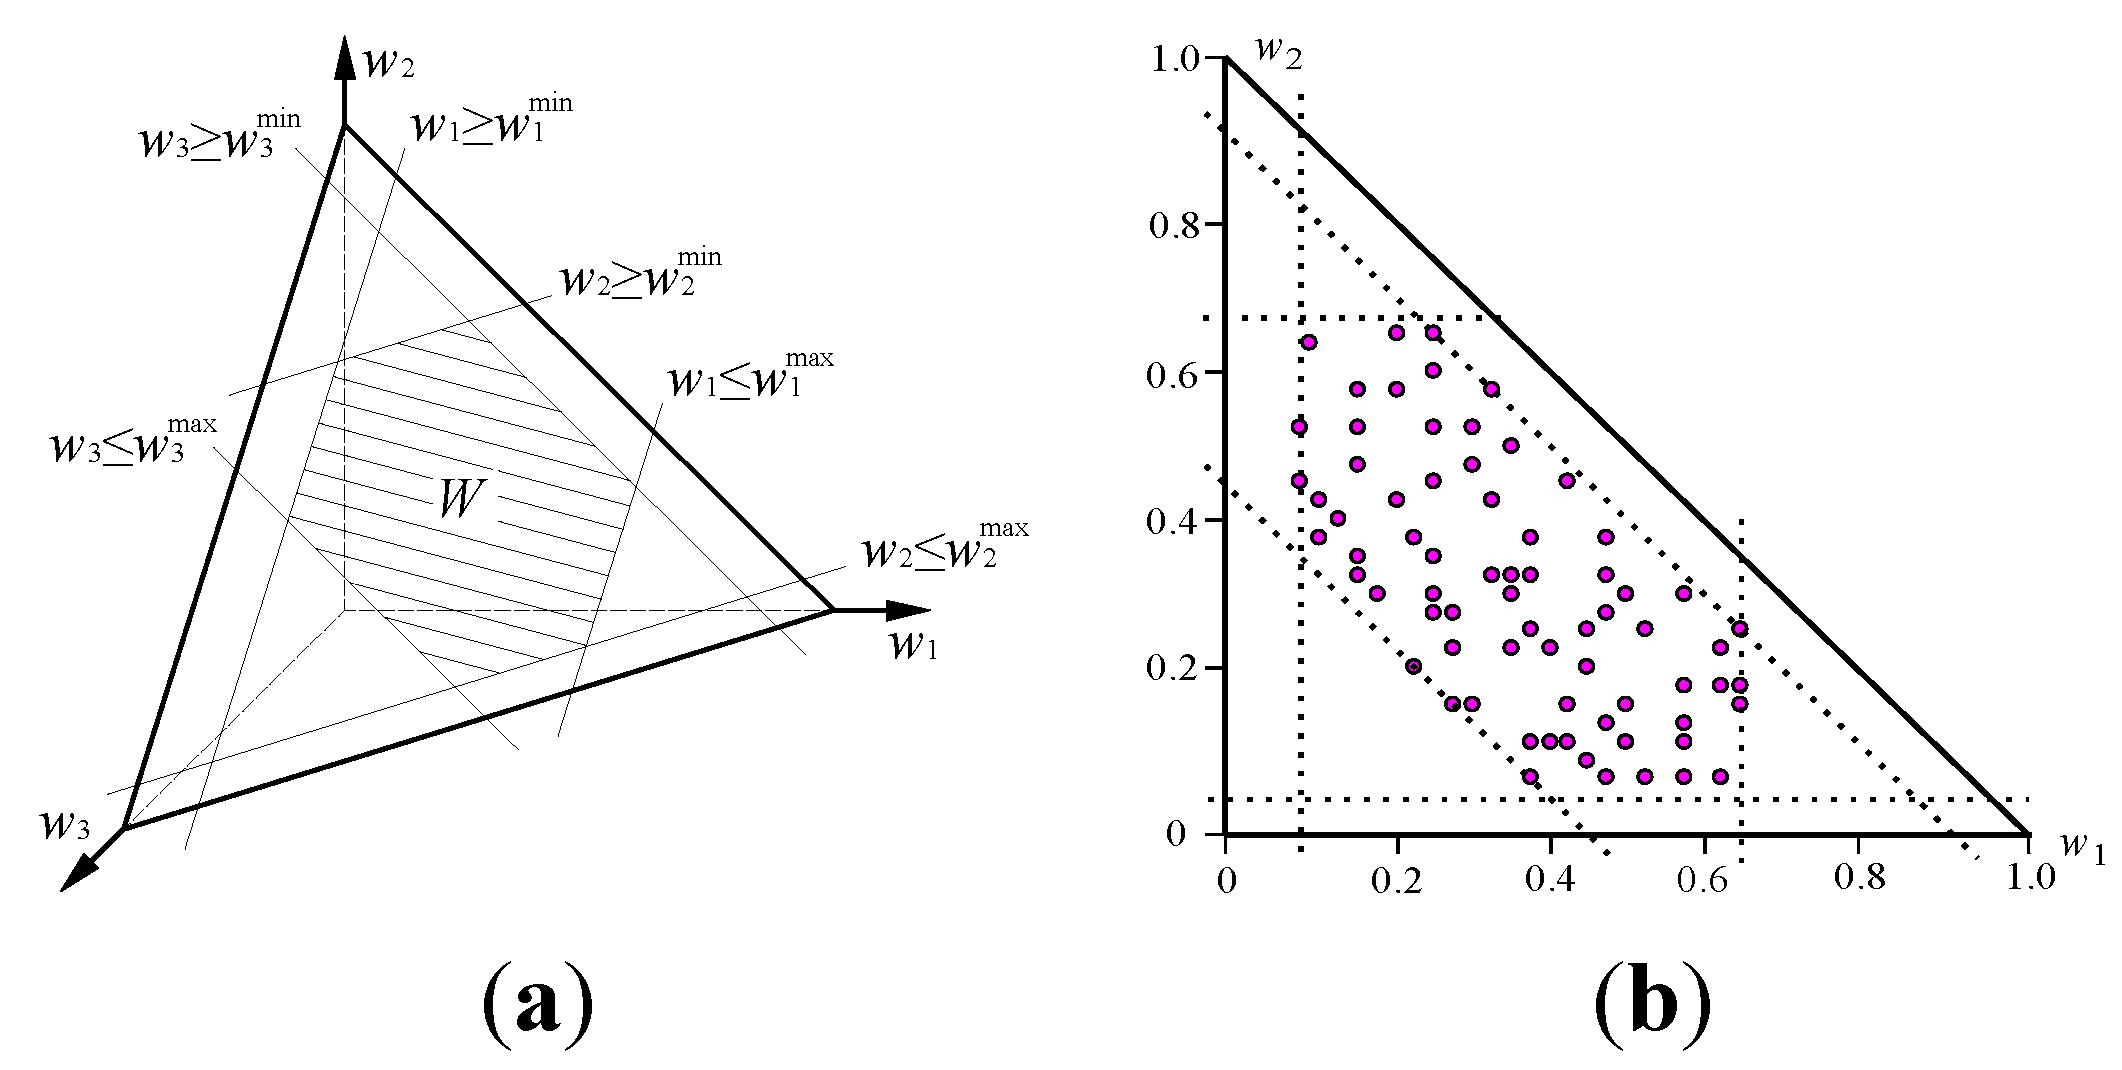
| Interval constraints of weights | (b) | The FWS shown in Figure 5 |
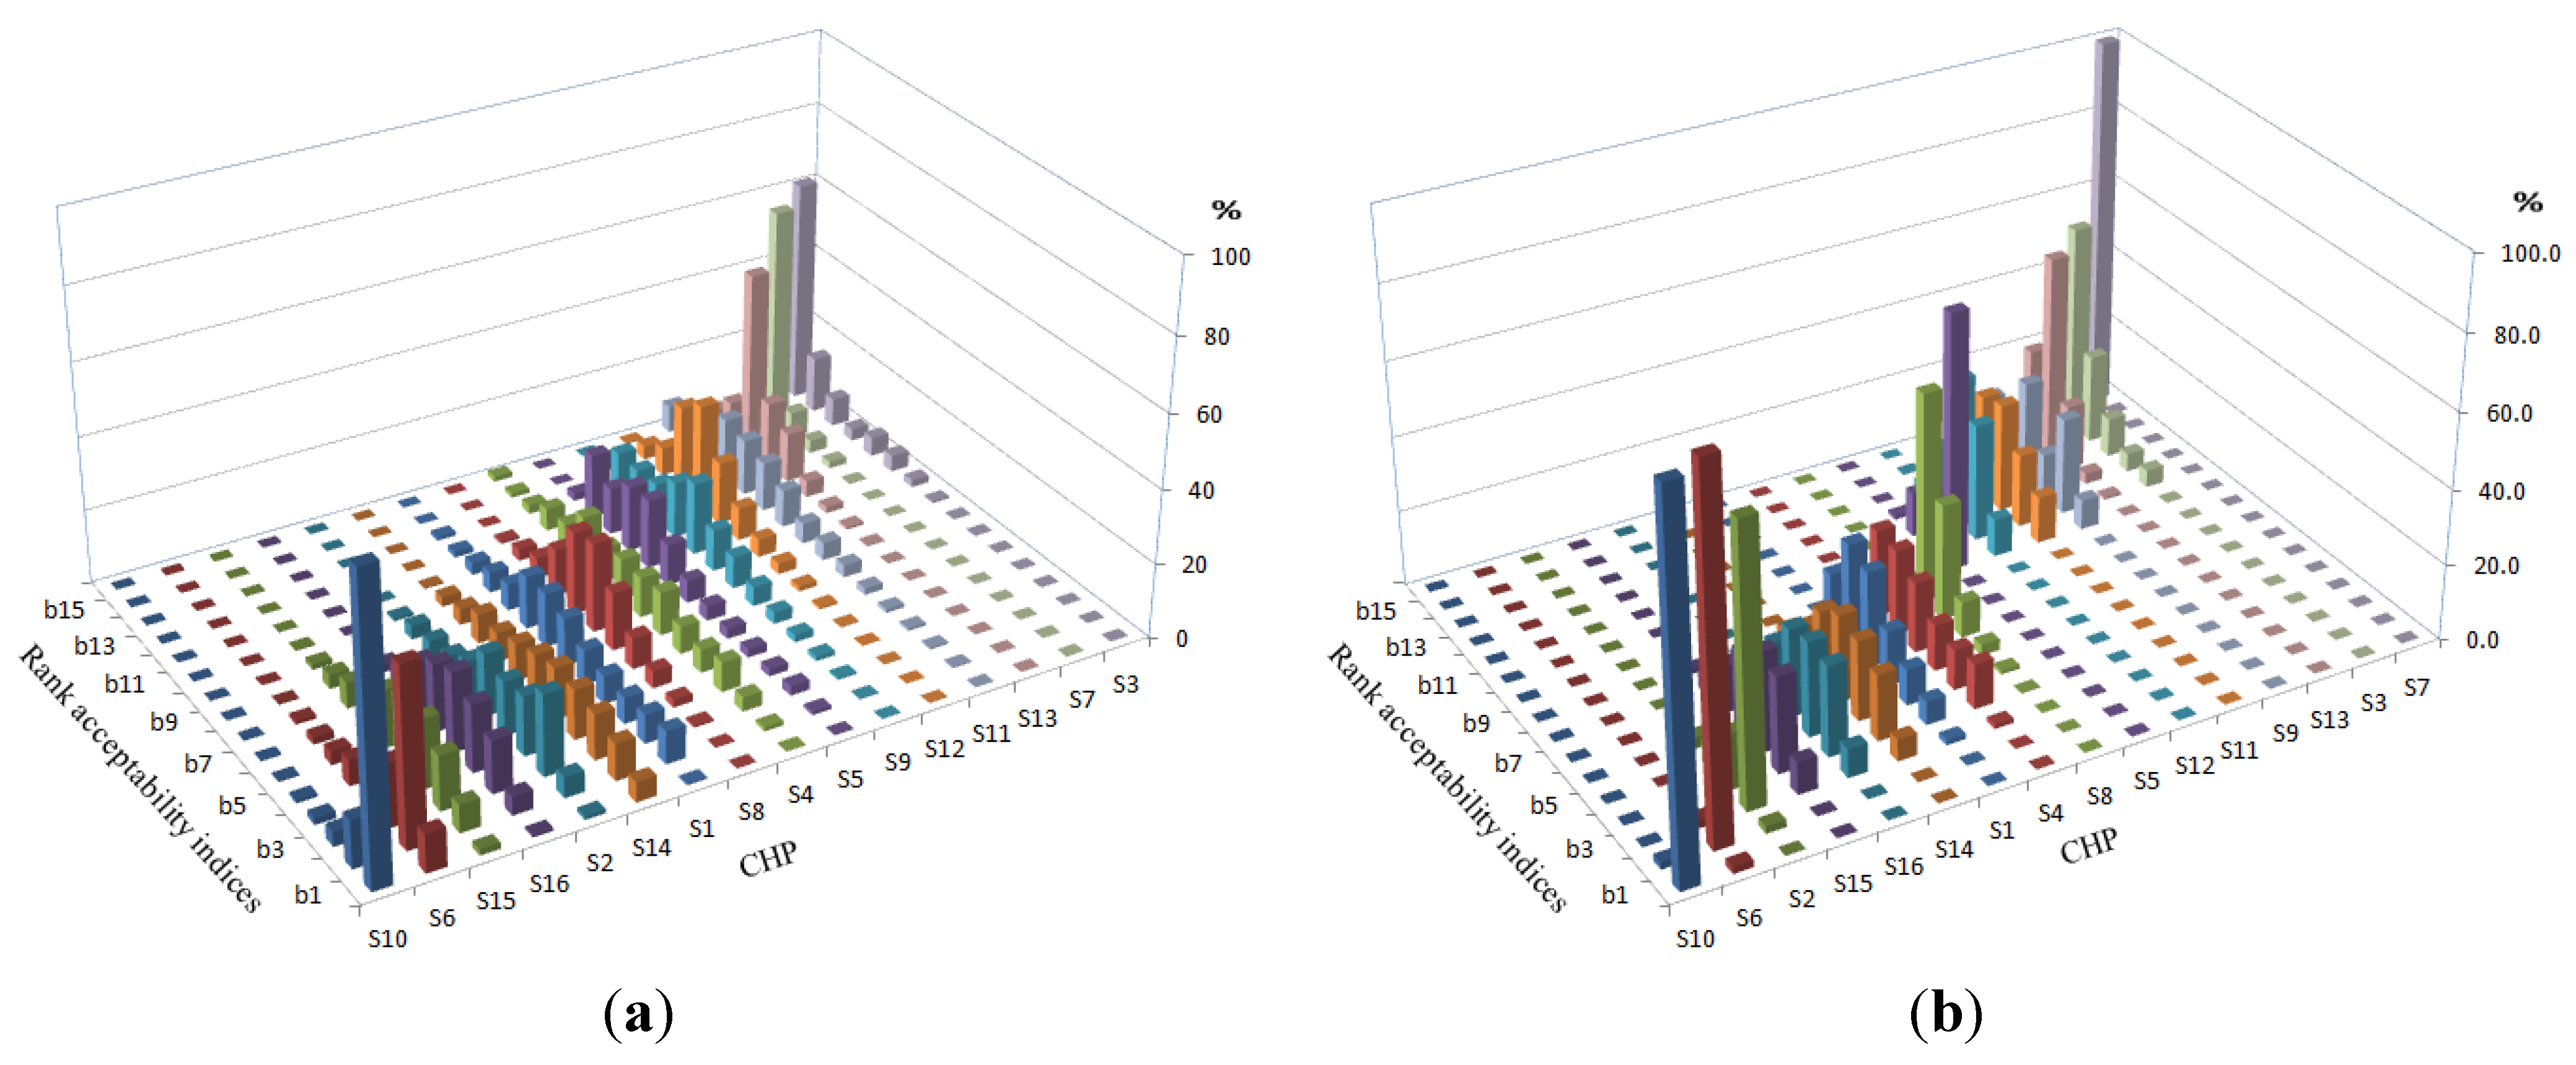
5.1. Results
| CHP | pc | ah | b1 | b2 | b3 | b4 | b5 | b6 | b7 |
| S1 | 6.2 | 30.7 | 0.4 | 8.8 | 7.8 | 6.9 | 7.5 | 9.2 | 12.6 |
| S2 | 7.1 | 39.9 | 1.1 | 5.6 | 21.8 | 15.9 | 14.5 | 16.7 | 9.5 |
| S3 | 0 | 2.5 | 0 | 0 | 0 | 0.1 | 0.1 | 0.1 | 0.1 |
| S4 | 4.2 | 22.7 | 0.3 | 1.1 | 3.8 | 8.0 | 6.2 | 7.4 | 11.7 |
| S5 | 6.3 | 16.3 | 0.1 | 1.0 | 2.5 | 2.0 | 2.2 | 2.8 | 3.9 |
| S6 | 23.9 | 62.4 | 10.3 | 47.6 | 17.2 | 11.0 | 6.9 | 3.7 | 1.9 |
| S7 | 0 | 1.9 | 0 | 0 | 0 | 0 | 0 | 0 | 0 |
| S8 | 0.7 | 21.9 | 0 | 0.1 | 0.7 | 2.1 | 4.6 | 8.4 | 15.6 |
| S9 | 0.5 | 14.7 | 0 | 0.2 | 0.6 | 1.3 | 2.0 | 3.2 | 5.2 |
| S10 | 99.4 | 92.5 | 80.1 | 12.8 | 3.9 | 1.8 | 0.8 | 0.3 | 0.2 |
| S11 | 11.0 | 10.9 | 0.1 | 0.3 | 0.4 | 0.7 | 1.0 | 1.8 | 3.4 |
| S12 | 0 | 10.1 | 0 | 0 | 0.1 | 0.1 | 0.2 | 0.6 | 1.4 |
| S13 | 0 | 5.6 | 0 | 0 | 0 | 0 | 0 | 0 | 0.1 |
| S14 | 53.1 | 40.8 | 5.4 | 10.0 | 12.2 | 13.4 | 13.9 | 12.2 | 10.0 |
| S15 | 11.5 | 40.3 | 1.6 | 7.4 | 14.7 | 18.6 | 18.8 | 15.5 | 10.8 |
| S16 | 4.8 | 39.0 | 0.6 | 5.1 | 14.2 | 18.1 | 21.2 | 18.1 | 13.5 |
| CHP | b8 | b9 | b10 | b11 | b12 | b13 | b14 | b15 | b16 |
| S1 | 14.4 | 14.0 | 7.1 | 5.4 | 3.3 | 1.6 | 1.0 | 0 | 0 |
| S2 | 5.7 | 4.6 | 3.7 | 0.8 | 0 | 0 | 0 | 0 | 0 |
| S3 | 0.2 | 0.5 | 2.0 | 4.5 | 5.2 | 3.3 | 7.6 | 15.1 | 61.0 |
| S4 | 10.7 | 10.9 | 9.2 | 13.1 | 6.4 | 6.0 | 2.5 | 1.2 | 1.4 |
| S5 | 6.1 | 11.1 | 18.7 | 17.6 | 12.7 | 17.4 | 1.9 | 0 | 0 |
| S6 | 1.0 | 0.3 | 0.1 | 0 | 0 | 0 | 0 | 0 | 0 |
| S7 | 0 | 0 | 0 | 0.3 | 1.8 | 3.5 | 7.1 | 60.2 | 27.1 |
| S8 | 24.0 | 22.2 | 12.7 | 5.6 | 3.1 | 0.8 | 0.1 | 0 | 0 |
| S9 | 8.6 | 11.3 | 19.5 | 15.1 | 10.1 | 9.5 | 9.9 | 3.4 | 0.2 |
| S10 | 0.1 | 0 | 0 | 0 | 0 | 0 | 0 | 0 | 0 |
| S11 | 4.8 | 5.5 | 10.1 | 13.2 | 15.1 | 16.6 | 12.5 | 7.1 | 7.3 |
| S12 | 2.9 | 4.9 | 8.9 | 16.9 | 28.5 | 23.7 | 7.6 | 3.8 | 0.3 |
| S13 | 0.3 | 0.7 | 1.7 | 4.4 | 13.4 | 17.6 | 49.8 | 9.2 | 2.6 |
| S14 | 7.8 | 7.8 | 4.3 | 2.6 | 0.3 | 0.1 | 0 | 0 | 0 |
| S15 | 7.0 | 3.8 | 1.5 | 0.3 | 0 | 0 | 0 | 0 | 0 |
| S16 | 6.3 | 2.3 | 0.6 | 0.1 | 0 | 0 | 0 | 0 | 0 |
| CHP | pc | ah | b1 | b2 | b3 | b4 | b5 | b6 | b7 |
| S1 | 0 | 27.1 | 0 | 0 | 1.3 | 6.2 | 9.5 | 14.5 | 25.4 |
| S2 | 0 | 51.6 | 0 | 2.0 | 73.3 | 14.8 | 6.4 | 2.9 | 0.6 |
| S3 | 0 | 3.8 | 0 | 0 | 0 | 0 | 0 | 0 | 0 |
| S4 | 0 | 27.7 | 0 | 0 | 1.2 | 11.9 | 10.6 | 12.2 | 18.5 |
| S5 | 0 | 13.4 | 0 | 0 | 0 | 0 | 0 | 0 | 0 |
| S6 | 2.5 | 70.0 | 1.8 | 95.8 | 2.2 | 0.1 | 0 | 0 | 0 |
| S7 | 0 | 0.0 | 0 | 0 | 0 | 0 | 0 | 0 | 0 |
| S8 | 0 | 20.7 | 0 | 0 | 0 | 0.2 | 1.0 | 3.0 | 9.4 |
| S9 | 0 | 7.8 | 0 | 0 | 0 | 0 | 0 | 0 | 0 |
| S10 | 99.1 | 99.5 | 98.2 | 1.8 | 0 | 0 | 0 | 0 | 0 |
| S11 | 0 | 8.9 | 0 | 0 | 0 | 0 | 0 | 0 | 0 |
| S12 | 0 | 9.9 | 0 | 0 | 0 | 0 | 0 | 0 | 0 |
| S13 | 0 | 4.2 | 0 | 0 | 0 | 0 | 0 | 0 | 0 |
| S14 | 0 | 33.8 | 0 | 0.1 | 5.8 | 17.4 | 21.2 | 22.8 | 18.9 |
| S15 | 0 | 37.1 | 0 | 0.1 | 8.5 | 25.4 | 26.4 | 21.3 | 12.6 |
| S16 | 0 | 36.5 | 0 | 0.1 | 7.6 | 23.9 | 24.9 | 23.3 | 14.6 |
| CHP | b8 | b9 | b10 | b11 | b12 | b13 | b14 | b15 | b16 |
| S1 | 27.9 | 15.1 | 0 | 0 | 0 | 0 | 0 | 0 | 0 |
| S2 | 0 | 0 | 0 | 0 | 0 | 0 | 0 | 0 | 0 |
| S3 | 0 | 0 | 0.2 | 4.6 | 4.9 | 10.4 | 23.8 | 55.6 | 0.3 |
| S4 | 22.4 | 23.0 | 0.2 | 0 | 0 | 0 | 0 | 0 | 0 |
| S5 | 0 | 0.2 | 69.1 | 17.9 | 11.8 | 1.0 | 0 | 0 | 0 |
| S6 | 0 | 0 | 0 | 0 | 0 | 0 | 0 | 0 | 0 |
| S7 | 0 | 0 | 0 | 0 | 0 | 0 | 0 | 0.3 | 99.7 |
| S8 | 30.7 | 55.7 | 0 | 0 | 0 | 0 | 0 | 0 | 0 |
| S9 | 0 | 0.1 | 8.0 | 25.9 | 11.7 | 27.3 | 12.2 | 15.0 | 0 |
| S10 | 0 | 0 | 0 | 0 | 0 | 0 | 0 | 0 | 0 |
| S11 | 0 | 0 | 12.4 | 19.6 | 29.0 | 27.1 | 7.7 | 4.2 | 0 |
| S12 | 0 | 0 | 10.1 | 31.3 | 39.7 | 16.7 | 1.8 | 0.3 | 0 |
| S13 | 0 | 0 | 0 | 0.7 | 2.9 | 17.4 | 54.4 | 24.6 | 0 |
| S14 | 9.8 | 4.1 | 0 | 0 | 0 | 0 | 0 | 0 | 0 |
| S15 | 4.5 | 1.1 | 0 | 0 | 0 | 0 | 0 | 0 | 0 |
| S16 | 4.7 | 0.8 | 0 | 0 | 0 | 0 | 0 | 0 | 0 |
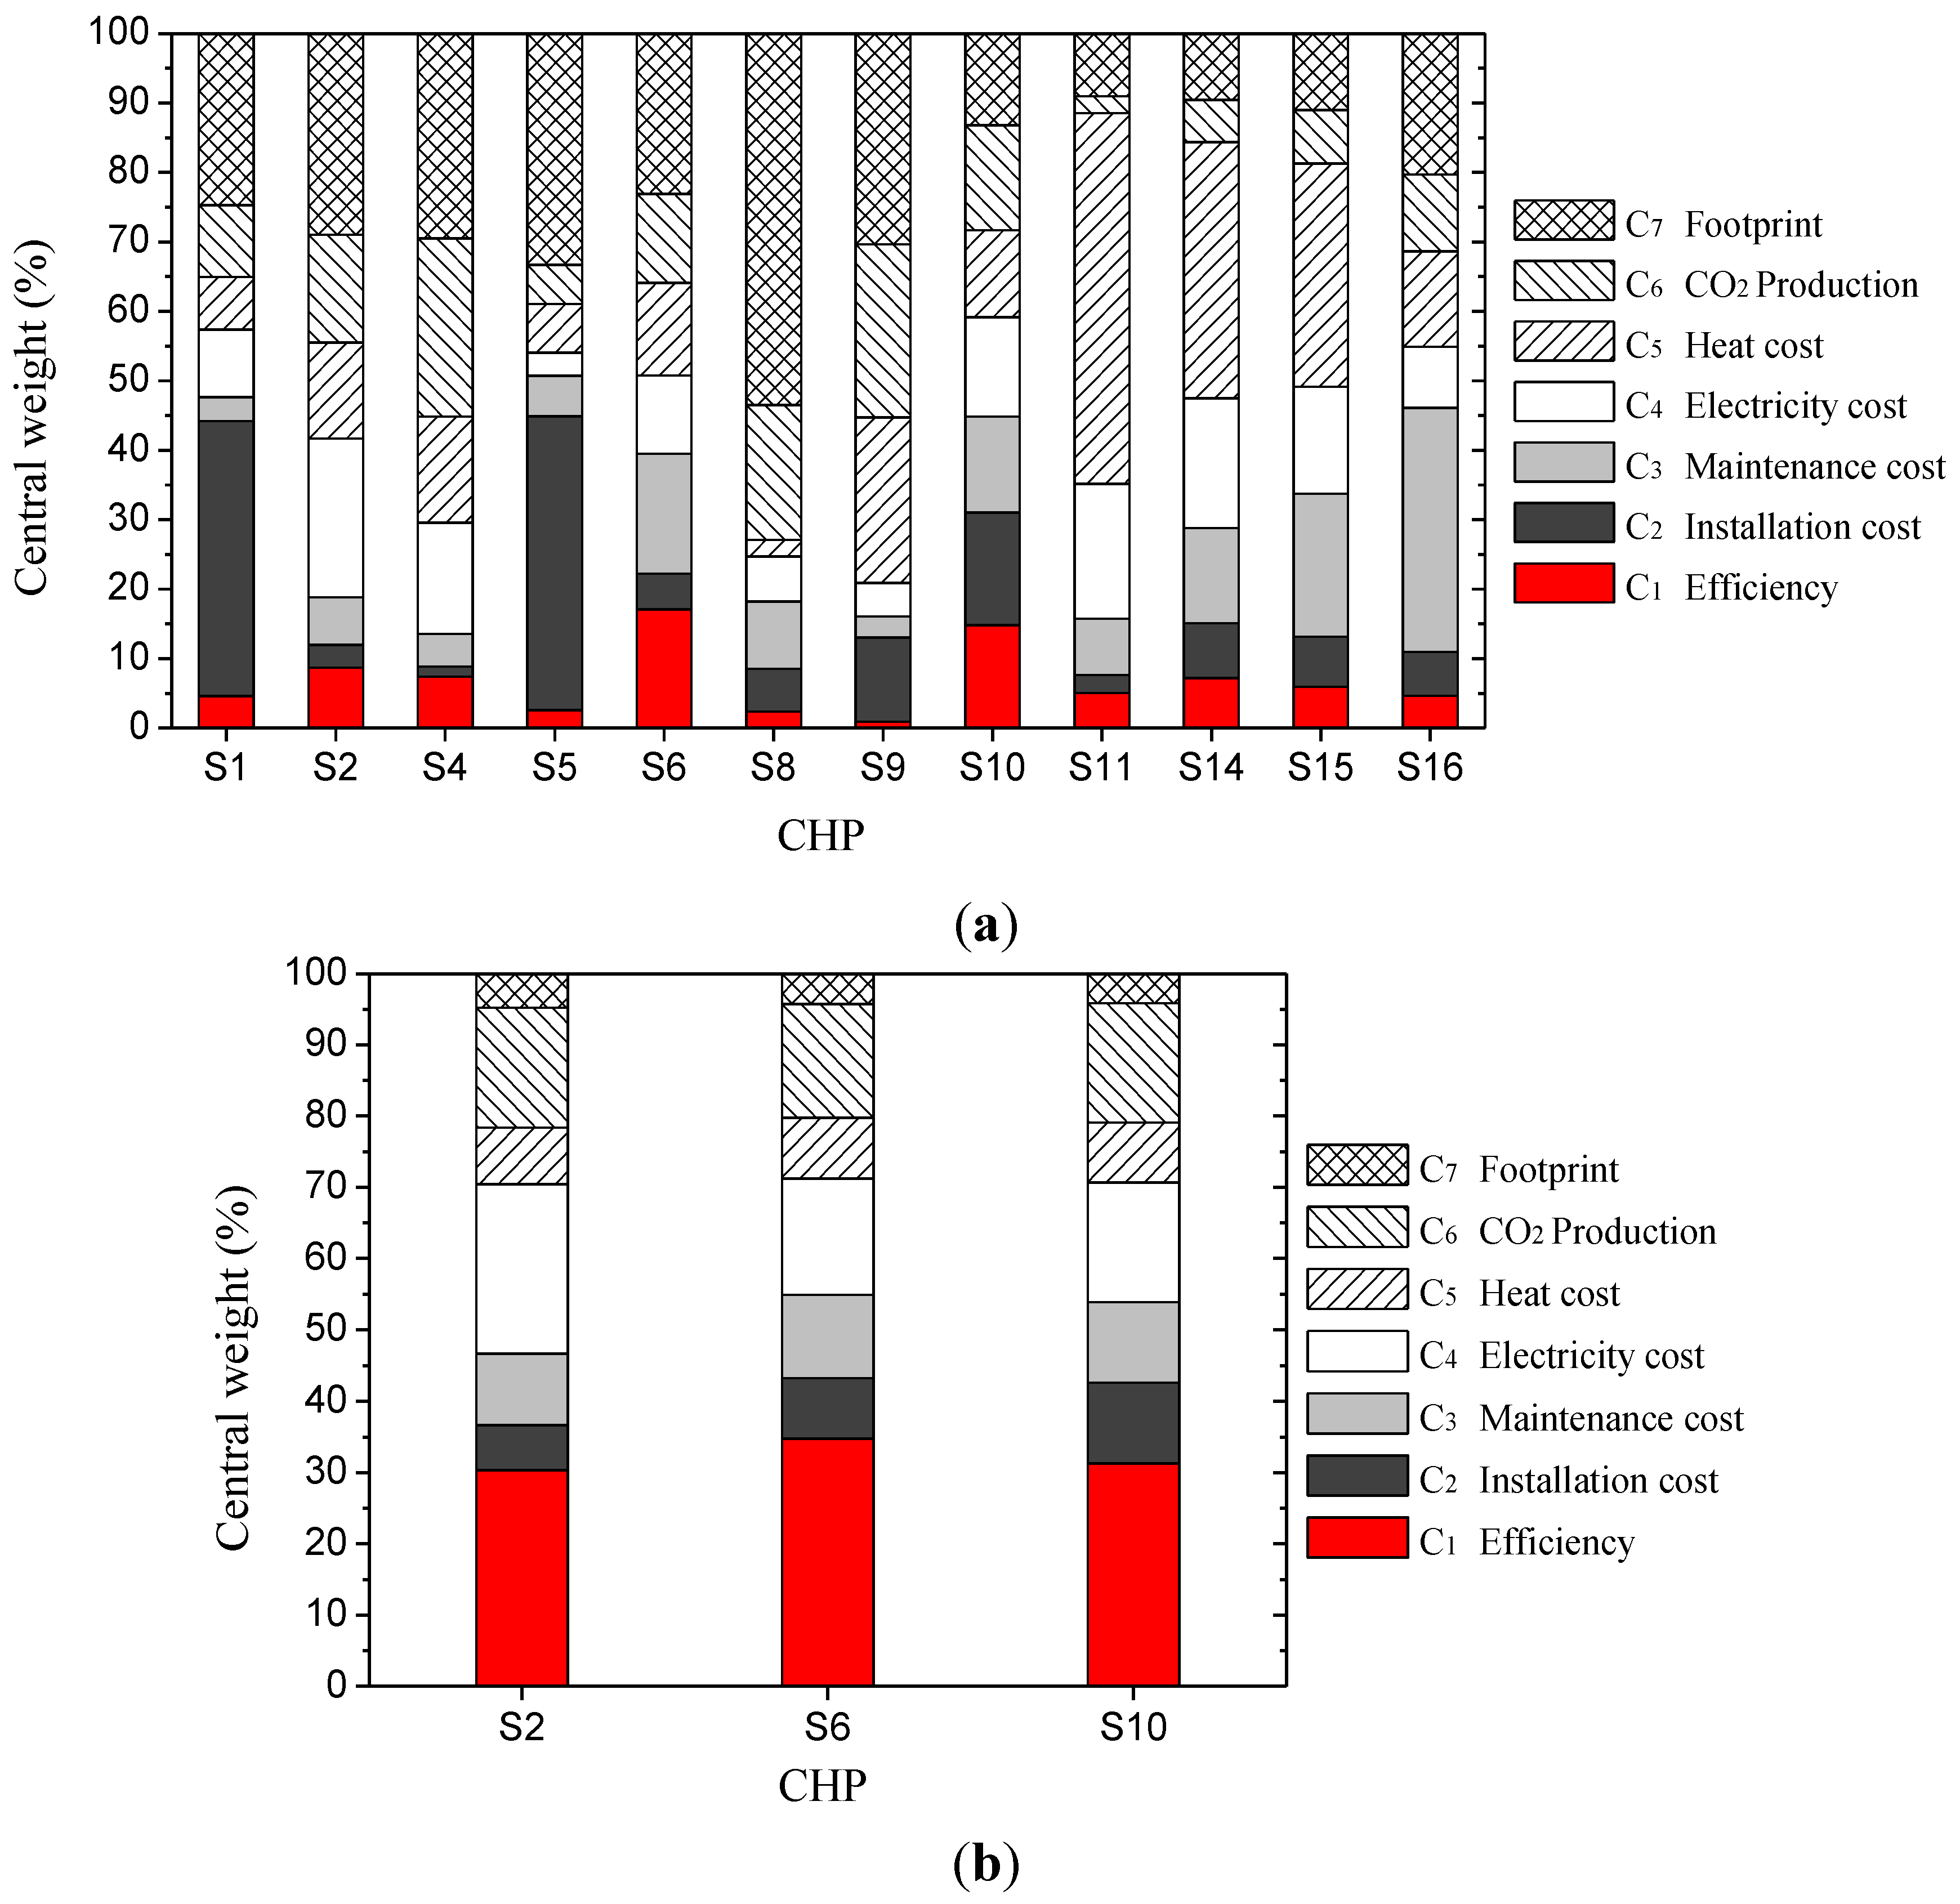
5.2. Discussion
6. Conclusions
Acknowledgments
Author Contributions
Abbreviations
| AHP | Analytical hierarchy process |
| CC | Combined cycle |
| CCGT | Combined cycle gas turbine |
| CHP | Combined heat and power |
| CJM | Complementary judgment matrix |
| DM | Decision maker |
| FWS | Feasible weight space |
| GT | Gas turbine |
| MCDA | Multicriteria decision analysis |
| SMAA | Stochastic multicriteria acceptability analysis |
| ST | Steam turbine |
Letter Symbols
| A | Complementary judgment matrix |
| aij | Element of a judgment matrix |
| aih | Holistic acceptability index of alternative i |
| pic | Confidence factor of alternative i, % |
| W | Weight space |
| Wir | Favorable ranking weights |
| w | Weight |
| w | Weight vector |
| wic | Central weight vector |
Subscripts and Superscripts
| e | Electricity |
| th | Thermal |
| c | Cent |
Conflicts of Interest
References
- Xu, J.Z.; Sui, J.; Li, B.Y.; Yang, M.L. Research, development and the prospect of combined cooling, heating, and power systems. Energy 2010, 11, 4361–4367. [Google Scholar] [CrossRef]
- Ge, Z.H.; Hu, X.W.; Yang, Z.P. The application of energy step utilize in co-generation. J. North China Electr. Power Univ. 2010, 1, 66–68. (in Chinese). [Google Scholar]
- Conde Lázaro, E.; Ramos Millán, A.; Reina Peral, P. Analysis of cogeneration in the present energy framework. Fuel Process. Technol. 2006, 87, 63–68. [Google Scholar]
- Wang, H.C.; Jiao, W.L.; Lahdelma, R.; Zou, P.H.; Zhan, S.H. Atmospheric environmental impact assessment of a combined district heating system. Build. Environ. 2013, 64, 200–212. [Google Scholar] [CrossRef]
- Lund, H.; Siupsinskas, G.; Martinaitis, V. Implementation strategy for small CHP-plants in a competitive market: The case of Lithuania. Appl. Energy 2005, 82, 211–227. [Google Scholar] [CrossRef]
- Rong, A.; Hakonen, H.; Lahdelma, R. An efficient linear model and optimisation algorithm for multi-site combined heat and power production. Eur. J. Oper. Res. 2006, 168, 612–632. [Google Scholar] [CrossRef]
- International Energy Agency (IEA). Energy Technology Perspectives. 2012. Available online: http://www.iea.org/w/bookshop/add.aspx?id=425 (accessed on 27 December 2013).
- Frederiksen, S.; Werner, S. District Heating and Cooling; Studentlitteratur AB: Lund, Sweden, 2013; pp. 1–16. [Google Scholar]
- Huang, J. Comprehensive Evaluation for the Setup of Peak Heating Using Gas Fired Boiler. Master’s Thesis, Beijing University of Civil Engineering and Architecture, Beijing, China, 2008. [Google Scholar]
- Statistics Finland. Energy, 2012. Available online: http://www.stat.fi/til/ene_en.html (accessed on 4 January 2014).
- Sustainable Transition of European Energy Markets. STEEM Project Description. Available online: http://energytech.aalto.fi/fi/research/energy_efficiency_and_systems/energy_economics_and_power_plant_engineering/steem/ (accessed on 27 December 2013).
- Rong, A.; Lahdelma, R. Efficient algorithms for combined heat and power production planning under the deregulated electricity market. Eur. J. Oper. Res. 2007, 176, 1219–1245. [Google Scholar] [CrossRef]
- Balli, O.; Aras, H. Energetic and exergetic performance evaluation of a combined heat and power system with the micro gas turbine (MGTCHP). Int. J. Energy Res. 2007, 31, 1425–1440. [Google Scholar] [CrossRef]
- Ertesvag, I.S. Exergetic comparison of efficiency indicators for combined heat and power (CHP). Energy 2007, 32, 2038–2050. [Google Scholar] [CrossRef]
- Fryda, L.; Panopoulos, K.D.; Kakaras, E. Integrated CHP with autothermal biomass gasification and SOFC-MGT. Energy Convers. Manag. 2008, 49, 281–290. [Google Scholar] [CrossRef]
- Biezma, M.V.; San Cristobal, J.R. Investment criteria for the selection of cogeneration plants—A state of the art review. Appl. Therm. Eng. 2006, 26, 583–588. [Google Scholar] [CrossRef]
- Hinojosa, L.R.; Day, A.R.; Maidment, G.G.; Dunham, C.; Kirk, P. A comparison of combined heat and power feasibility models. Appl. Therm. Eng. 2007, 27, 2166–2172. [Google Scholar] [CrossRef]
- Hawkes, A.D.; Leach, M.A. Cost-effective operating strategy for residential micro-combined heat and power. Energy 2007, 32, 711–723. [Google Scholar] [CrossRef]
- Zheng, Z.; Fu, L.; Di, H.; Jiang, Y. Comprehensive evaluation of urban heating types with analytic hierarchy process. Heat. Vent. Air Cond. 2009, 8, 96–98. (In Chinese) [Google Scholar]
- Clemen, R.T. Making Hard Decisions—An Introduction to Decision Analysis, 2nd ed.; Duxbury Press/Wadsworth Publishing Company: Belmont, CA, USA, 1996. [Google Scholar]
- Hyde, K.; Maier, H.R.; Colby, C. Incorporating uncertainty in the PROMETHEE MCDA method. J. Multi-Crit. Decis. Anal. 2003, 12, 245–259. [Google Scholar] [CrossRef]
- Troldborg, M.; Heslop, S.; Hough, R.L. Assessing the sustainability of renewable energy technologies using multi-criteria analysis: Suitability of approach for national-scale assessments and associated uncertainties. Renew. Sust. Energy Rev. 2014, 39, 1173–1184. [Google Scholar] [CrossRef]
- Zarghami, M.; Szidarovszky, F. Stochastic-fuzzy multi criteria decision making for robust water resources management. Environ. Res. Risk Assess. 2009, 23, 329–339. [Google Scholar] [CrossRef]
- Durbach, I.N.; Stewart, T.J. Modeling uncertainty in multi-criteria decision analysis. Eur. J. Oper. Res. 2012, 223, 1–14. [Google Scholar] [CrossRef]
- Tylock, S.M.; Seager, T.P.; Snell, J.; Bennett, E.R.; Sweet, D. Energy management under policy and technology uncertainty. Energy Policy 2012, 47, 156–163. [Google Scholar] [CrossRef]
- Angilella, S.; Corrente, S.; Greco, S. Stochastic multiobjective acceptability analysis for the Choquet integral preference model and the scale construction problem. Eur. J. Oper. Res. 2015, 240, 172–182. [Google Scholar] [CrossRef]
- Afgan, N.H.; Carvalho, M.G. Multi-criteria assessment of new and renewable energy power plants. Energy 2002, 27, 739–755. [Google Scholar] [CrossRef]
- Pilavachi, P.A.; Roumpeas, C.P.; Minett, S.; Afgan, N.H. Multi-criteria evaluation for CHP system options. Energy Convers. Manag. 2006, 47, 3519–3529. [Google Scholar] [CrossRef]
- Afgan, N.H.; Pilavachi, P.A.; Carvalho, M.G. Multi-criteria evaluation of natural gas resources. Energy Policy 2007, 1, 704–713. [Google Scholar] [CrossRef]
- Wang, J.J.; Jing, Y.Y.; Zhang, C.F. Weighting methodologies in multi-criteria evaluations of combined heat and power systems. Int. J. Energy Res. 2009, 33, 1023–1039. [Google Scholar] [CrossRef]
- Saaty, T.L.; Peniwati, K. Group Decision Making: Drawing out and Reconciling Differences; RWS Publications: Pittsburgh, PA, USA, 2008. [Google Scholar]
- Hokkanen, J.; Lahdelma, R.; Salminen, P. Multicriteria decision support in a technology competition for cleaning polluted soil in Helsinki. J. Environ. Manag. 2000, 60, 339–348. [Google Scholar] [CrossRef]
- Lv, Y.J. Weight calculation method of fuzzy analytical hierarchy process. Fuzzy Syst. Math. 2002, 16, 80–86. [Google Scholar]
- Su, W.H. Study on Multicriteria Comprehensive Evaluation Theories and Methodologies. Ph.D. Thesis, Xiamen University, Xiamen, Fujian, China, 2000. [Google Scholar]
- Wang, H.C.; Jiao, W.L.; Lahdelma, R.; Zou, P.H. Development of multicriteria index system and weighting optimization for a district heating system. In Proceedings of the 1st International Symposium and 10th Balkan Conference on Operational Research, Thessaloniki, Greece, 22–25 September 2011.
- Lahdelma, R.; Hokkanen, J.; Salminen, P. SMAA—Stochastic multiobjective acceptability analysis. Eur. J. Oper. Res. 1998, 106, 137–143. [Google Scholar] [CrossRef]
- Lahdelma, R.; Salminen, P. SMAA-2: Stochastic multicriteria acceptability analysis for group decision making. Oper. Res. 2001, 3, 444–454. [Google Scholar] [CrossRef]
- Lahdelma, R.; Miettinen, K.; Salminen, P. Ordinal criteria in stochastic multicriteria acceptability analysis (SMAA). Eur. J. Oper. Res. 2003, 147, 117–127. [Google Scholar] [CrossRef]
- Tervonen, T.; Lahdelma, R. Implementing stochastic multicriteria acceptability analysis. Eur. J. Oper. Res. 2007, 178, 500–513. [Google Scholar] [CrossRef]
© 2014 by the authors; licensee MDPI, Basel, Switzerland. This article is an open access article distributed under the terms and conditions of the Creative Commons Attribution license (http://creativecommons.org/licenses/by/4.0/).
Share and Cite
Wang, H.; Jiao, W.; Lahdelma, R.; Zhu, C.; Zou, P. Stochastic Multicriteria Acceptability Analysis for Evaluation of Combined Heat and Power Units. Energies 2015, 8, 59-78. https://doi.org/10.3390/en8010059
Wang H, Jiao W, Lahdelma R, Zhu C, Zou P. Stochastic Multicriteria Acceptability Analysis for Evaluation of Combined Heat and Power Units. Energies. 2015; 8(1):59-78. https://doi.org/10.3390/en8010059
Chicago/Turabian StyleWang, Haichao, Wenling Jiao, Risto Lahdelma, Chuanzhi Zhu, and Pinghua Zou. 2015. "Stochastic Multicriteria Acceptability Analysis for Evaluation of Combined Heat and Power Units" Energies 8, no. 1: 59-78. https://doi.org/10.3390/en8010059
APA StyleWang, H., Jiao, W., Lahdelma, R., Zhu, C., & Zou, P. (2015). Stochastic Multicriteria Acceptability Analysis for Evaluation of Combined Heat and Power Units. Energies, 8(1), 59-78. https://doi.org/10.3390/en8010059