Article

Stochastic Multicriteria Acceptability Analysis for Evaluation of Combined Heat and Power Units

1
Department of Energy Technology, Aalto University School of Engineering, P.O. Box 14100, FI-00076, 02150 Espoo, Finland
2
School of Municipal & Environmental Engineering, Harbin Institute of Technology, Harbin 150090, Heilongjiang, China
3
School of Civil and Environmental Engineering, Jilin Jianzhu University, Changchun 130118, Jilin, China
*
Author to whom correspondence should be addressed.
Energies 2015, 8(1), 59-78; https://doi.org/10.3390/en8010059
Submission received: 27 October 2014 / Accepted: 10 December 2014 / Published: 24 December 2014

Abstract

:
Combined heat and power (CHP) is a promising technology that can contribute to energy efficiency and environmental protection. More CHP-based energy systems are planned for the future. This makes the evaluation and selection of CHP systems very important. In this paper, 16 CHP units representing different technologies are taken into account for multicriteria evaluation with respect to the end users’ requirements. These CHP technologies cover a wide range of power outputs and fuel types. They are evaluated from the energy, economy and environment (3E) points of view, specifically including the criteria of efficiency, investment cost, electricity cost, heat cost, CO2 production and footprint. Uncertainties and imprecision are common both in criteria measurements and weights, therefore the stochastic multicriteria acceptability analysis (SMAA) model is used in aiding this decision making problem. These uncertainties are treated better using a probability distribution function and Monte Carlo simulation in the model. Moreover, the idea of “feasible weight space (FWS)” which represents the union of all preference information from decision makers (DMs) is proposed. A complementary judgment matrix (CJM) is introduced to determine the FWS. It can be found that the idea of FWS plus CJM is well compatible with SMAA and thus make the evaluation reliable.

1. Introduction

Combined heat and power (CHP) not only generates electricity, but also simultaneously produces district heat from the heat that would otherwise be wasted in the condensing unit of the power plant. This is a typical “cascade utilization” [1] or “step utilization” [2] of primary energy, which can promote energy conservation and alleviate climate change [3,4,5]. CHP plays an indispensable role and is thus far from out-of-date; the share of energy supply from CHP will increase in the near future, as more CHP and CHP-based energy systems are planned and constructed, especially in China. Similarly, the European Commission also stated that CHP is one of the very few technologies which can contribute to the energy efficiency issue and meet to the more rigid environmental policy standards in the European Union [6].
According to the International Energy Agency (IEA) [7], heating and cooling accounted for about 46% of global energy use in 2012. In the meantime, CHP is the main technology for producing district heat [8]. In China, about 62.9% of district heat is produced by CHP [9] and this percent is even higher in some European countries, for example, 72% in Finland in 2012 [10]. On the other hand, about half of all final energy use in Europe is heat; furthermore, heat demand almost equals the amount of waste heat from power generation, which suggests very substantial scope for efficiency gains via an integrated treatment [11]. For these reasons, CHP is reported to be a leading technology to simultaneously respond to market demand and environmental concerns [12].
There are many kinds of CHP units with different features devoted to different applications. Some of the features are complex and may vary dramatically. The classical evaluation or optimization methods for those CHP units are based on single objective analyses of thermoeconomic performance on energetic and exergetic criteria [13,14,15] or economic performance [16,17,18]. Indeed, system evaluation, construction and operation should be primarily based on the economic indicators, but other factors should also be taken into account for improving sustainability and acceptability. These factors include the aforementioned issues of energy efficiency and environmental protection. That is to say, different CHP units should be evaluated synthetically from the energy, economy and environment (3E) [19] points of view in order to determine the most qualified system with high confidence or to make the CHP unit more competitive. To conclude, the integrated evaluation of CHP units is a demanding task of multiple targets instead of a single objective. Multicriteria decision analysis (MCDA) [20,21] is a general term for methods that provide a systematic quantitative approach to support decision making in problems involving multiple criteria and alternatives. The aim is to help the decision maker (DM) make more consistent decisions by taking into account the important objective and subjective factors, especially end users’ requirements. MCDAs are attractive given the multi-dimensional and complex nature of sustainability assessments, which typically involve a range of conflicting criteria featuring different forms of data and information [22]. Meanwhile, various kinds of uncertainties e.g., the stochastic uncertainty of the criteria performance values (PVs) and fuzzy uncertainty related to subjective judgments and characteristic of the DMs [23,24] as well as policy and technology uncertainties [25] are very common and should be addressed explicitly [22,26].
Many researchers have developed several MCDA methods to integrate technical, economic, and environmental considerations in choosing the optimal CHP units or power plants. Afgan and Carvalho [27] adopted the weighted sum method to evaluate ten renewable power plants against the four major criteria of energy resources, environment capacity, social indicators and economic indicators. They [27] developed an “information deficiency method” which can deal with the uncertainty of weight information to some extent and can indicate the dominance order between two successive alternatives using probability. In addition, they also sprinkled this idea into the evaluation of CHP units [28] and natural gas resources [29]. In particular, Pilavachi et al. [28] evaluated 16 CHP units using the “information deficiency method”. However, Wang et al. [30] argued that the weighting method which subjectively gives priority to one of the criteria with the others being equal [27,28,29] cannot reflect the true situation of the end users’ preferences. Therefore, they introduced a different method named “combination weighting” [30], which in fact is a combination of an analytic hierarchy process (AHP) and the entropy method. AHP is a structured technique for analyzing complex decisions and group decision making [31]; it was developed by Saaty in the 1970s and has been extensively studied and refined since then. In addition, the multicriteria method, which is based on gray relational analysis [30], was also developed for evaluating CHP units. It is widely acknowledged that multicriteria evaluation results depend greatly on the weight vectors. Different weight vectors may lead to totally different conclusions. This is why many researchers paid attention to developing more rational weighting methods.
Handling the uncertainties in MCDA is necessary, especially in the energy sector, because if the uncertainties are not treated carefully, the MCDA results can have high uncertainty. Hyde et al. [21] proposed a reliability-based stochastic method, which enables the DM to examine the robustness of the solution. This method involves defining the uncertainty in the input values using probability distributions, performing a reliability analysis by a Monte Carlo simulation and undertaking a significance analysis using the Spearman rank correlation coefficient. They applied it to a renewable energy case study based on the PROMETHEE MCDA method. Zarghami and Szidarovszky [23] introduced a new approach based on stochastic and fuzzy linguistic quantifiers to obtain the uncertain optimism degree of the DM. They merged it into the ordered weighted averaging (OWA) operator, and then gave the expected value and the variance of the combined goodness measure for each alternative, which are essential for robust decision making. Troldborg et al. [22] defined probability distributions for each of the criteria PVs and then ran it through a Monte Carlo simulation to provide a probabilistic ranking of the alternatives. They found that MCDA results can be highly uncertain because of uncertain input information. To conclude, it is a natural way to model uncertainty using probability distribution functions. In this study, the uncertainties in criteria PVs and the weighting are also approached using a probability distribution function and a Monte Carlo simulation. However, we propose MCDA based on the concept of “feasible weight space” (FWS) instead of deterministic weight vectors since the weights should incorporate the DMs’ preference information to the greatest possible extent. FWS is not a totally new concept, but it is compatible and really helpful in our MCDA method. In fact, FWS is a union of all weight vectors derived from DMs who give consistent preference information. It is much more reasonable than having deterministic weight vectors for the purpose of MCDA in this regard. In this paper, we use the “complementary judgment matrix (CJM)” method to obtain the FWS. In addition, we combine these approaches with the stochastic multicriteria acceptability analysis (SMAA) for evaluating CHP units with uncertainties both in the criteria PVs and the weighting.
In this paper, 16 CHP units representing different technologies are taken into account for multicriteria evaluation. These CHP technologies include internal combustion engines, e.g., Otto and diesel, gas turbines (GT), steam turbines (ST) and combined cycles (CC) all covering a wide range of power output. The 16 CHP units are evaluated from the 3E points of view, specifically including the criteria of overall efficiency, investment cost, maintenance cost, electricity cost, heat cost, CO2 production and footprint. The data for these systems have been collected by a literature review [29,31]. SMAA is used for the evaluation of the 16 CHP units. The uncertainties of criteria PVs and weight vectors are treated using a probability distribution function and a Monte Carlo simulation which make FWS plus CJM well compatible with SMAA. The method presented in this paper is for the evaluation of CHP units, but it can be extended for the evaluation of other complex energy systems.

2. Combined Heat and Power Units and Evaluation Criteria

2.1. Combined Heat and Power Units

There are many CHP units devoted for different applications in communities and industries. In this paper, the 16 CHP units to be evaluated are from a literature review [29,31]. The technologies, parameters and fuel types of these CHP units cover a wide range described below:
  • S1: compression engines diesel 200 kWe (industry).
  • S2: compression engines diesel 20 MWe (industry).
  • S3: gas engines—Otto cycle 1 kWe (household).
  • S4: gas engines—Otto cycle 13 MWe (industry).
  • S5: GT 500 kWe (industry).
  • S6: GT 225 MWe (industry).
  • S7: micro-turbines (CHP) 10 kWe (industry).
  • S8: micro-turbines (CHP) 500 kWe (industry).
  • S9: combined cycle gas turbines (CCGT) 8 MWe (industry).
  • S10: CCGT 750 MWe (industry).
  • S11: ST 500 kWe (coal) (hot water) (industry).
  • S12: ST 500 kWe (fuel oil) (hot water) (industry).
  • S13: ST 500 kWe (natural gas) (hot water) (industry).
  • S14: ST 150 MWe (coal) (hot water) (industry).
  • S15: ST 150 MWe (fuel oil) (hot water) (industry).
  • S16: ST 150 MWe (natural gas) (hot water) (industry).
The features of the 16 CHP units are shown in Table 1 [29]. It can be found that the electrical output and power to heat ratio vary dramatically between different CHP units. Efficiency ranges from 73% to 90%. Installation cost reflects the initial investment; maintenance cost, electricity cost and heat cost are operating costs. Fuel cost is not included in this table, because electricity cost and heat cost are calculated based on it according to the power and heat outputs of different CHP units. CO2 production and footprint are the environmental criteria.
Table 1. The features of the 16 combined heat and power (CHP) units.
CHPElectrical output (kWe)Power to heat ratioEfficiency (%)Installation cost (€/kWe)Maintenance cost (c€/kW·he)Electricity cost (c€/kW·he)Heat cost (c€/kW·hth)CO2 production (kg/MW·he)Footprint (m2/kWe)
S12001.008550015.647.74623.530.02
S220,0001.23881,5000.52.304.84545.960.011
S310.4585500232.8217.85758.170.3
S413,0000.90882,5000.73.814.84479.800.014
S55000.45805000.815.937.74805.560.015
S6225,0000.70901,2000.24.374.72539.680.0045
S7100.29751,500133.849.611,186.210.05
S85000.60851,1000.510.127.74627.450.02
S98,0000.96731,0000.85.785.18559.360.03
S10750,0001.25905000.21.734.724000.025
S115000.25822,0000.52.230.512,042.680.06
S125000.25822,0000.458.232.181,615.850.05
S135000.25822,0000.428.357.741,219.510.027
S14150,0000.60851,1000.250.770.511,050.980.06
S15150,0000.60851,1000.22.822.18831.370.05
S16150,0000.60851,1000.155.984.72627.450.027

2.2. Properties and Measurements of Criteria

According to Table 1, seven criteria reflecting the 3E aspects were selected for assessing the 16 CHP units. These criteria include efficiency, installation cost, maintenance cost, electricity cost, heat cost, CO2 production and footprint, which are listed in Table 2.
Table 2. Number and property of evaluation criteria.
CriteriaEfficiencyInstallation costMaintenance costElectricity costHeat costCO2 productionFootprint
Criteria No.C1C2C3C4C5C6C7
Property 1
Uncertainty±5%±10%±10%±10%±10%±10%±10%
1 Property “▲” means the larger the better, i.e., positive or benefit criteria; property “▼” means the smaller the better, i.e., negative or cost criteria.
In this table, all criteria are numbered consecutively and their properties are indicated, i.e., efficiency is a positive criteria which means that the larger the better but the remaining criteria are all negative criteria characterized by the smaller being the better. This table also shows the uncertainties of each criterion. This is necessary because uncertainties are very common in criteria measurements based on the fact that the parameters describing the features of CHP units are not deterministic, especially when the system is correlated with its surroundings and different boundary conditions, e.g., changing power and heat demands. The uncertainty of techno-economic indices is considered to be within 10% [32]. An uncertainty of ±10% has also been used for the environmental criteria. However, this study adopts an uncertainty of ±5% for the efficiency criterion because it is usually more reliable to compute the total energy efficiency of the CHP units at full load.
The original criteria PVs should be normalized prior to the evaluation. Assume xij stands for the criteria PVs and then the positive criteria can be normalized as:
x ¯ i j = x i j x i j x i j + x i j
But the negative criteria are normalized as:
x ¯ i j = x i j + x i j x i j + x i j
where x ¯ i j is the normalized measurement of alternative xi in relation to criterion j, and xij+ and xij are the maximum and minimum values of alternative xi corresponding to criterion j.

3. Weighting Method Based on a Complementary Judgment Matrix

The weighting process usually incorporates the subjectivity of DMs and thus can be uncertain or imprecise to some extent. This has led to a variety of methods on how to assess weights for multicriteria evaluation [31]. This study introduces the concept of FWS in combination with CJM.

3.1. Complementary Judgment Matrix

CJM is an MCDA method based on pairwise comparisons wherein the DM can specify his/her preferences both between criteria and/or between alternatives with respect to each criterion, by allocating two nonnegative comparison values to make their sum equal 1 [33]. Namely, the two comparison values add up to a complementary relationship rather than a reciprocal one in AHP. CJM is a method developed based on the structure of AHP, therefore the main procedure for CJM is similar to that for AHP. First, a CJM, A, should be constructed via consultation and/or a questionnaire using the binary grading values shown in Table 3 [34].
Table 3. Binary grading value of a complementary judgment matrix (CJM).
Descriptionaijaji
ith criterion is equally important compared with jth0.50.5
ith criterion is a little more important compared with jth0.60.4
ith criterion is important compared with jth0.70.3
ith criterion is very important compared with jth0.80.2
ith criterion is extremely important compared with jth0.90.1
A CJM with n criteria can be written as:
A = [ a 11 a 12 ... a 1 n a 21 a 22 ... a 2 n a n 1 a n 2 ... a n n ]
where aij is the preference proportion of the ith criterion compared with the jth criterion. Assume that the weights of the ith and jth criteria are wi and wj, respectively. Then aij would take the form:
a i j = w i w i + w j
It is clear that aij has the following two properties: aii = 0.5 and aij = 1 − aji, i, j = 1, 2, …, n. In addition, the following definitions are quite important for the use of CJM.
Definition 1. A CJM, A = (aij)n×n, has ordinal consistency if any one of the following relationships hold true:
a i k > 0.5,  a k j > 0.5 a i j > 0.5 or  a i k > 0.5,  a k j > 0.5 a i j > 0.5
Equation (5) means that if criterion i is decided to be more important than k and criterion k is more important than j, then criterion i should be more important than j to reach ordinal consistency.
Definition 2. A CJM, A = (aij)n×n, has complementary consistency if the following relationship holds true [34]:
aikakjaji = akiajkaij
This complementary consistency of a CJM is based on the definition and properties of aij.
Generally, it is difficult to keep A consistent, because Equation (6) or even Equation (5) is not easy to satisfy. Therefore, an inconsistency check [35] is necessary prior to eliciting weight vectors. However, if the inconsistency only varies slightly and can be deemed “satisfactorily consistent”, then the CJM is still acceptable and can be used to calculate the weight vector by means of the weighted least square method [35]. The advantage of this check is that we can determine where (between each pair of comparison) the inconsistency is and the extent of it so that we can ask the DM to rethink about his preferences in a CJM if necessary. In addition, the CJM method is also very helpful in case of too many criteria making the DMs struggle when giving the preference information directly. DMs just need to compare every two of the criteria, which is very straightforward.
For this inconsistency check, we assume that:
ω i j = a i j w i w i + w j
where ωij is the errors of the elements in the CJM A. They can be seen as statistically random variables with mean value expectations of zero. Basically, the more important a criterion is, the lower its error should be. Following this reasoning, we can define the objective function as the sum of the weighted square of ωij and then minimize it subject to the weight constraints. Based on this, we can check the inconsistency extent and then calculate the weight vectors if the CJM is satisfactorily consistent. The problem can be expressed as:
min    T = i = 1 n j = 1 n [ ( w i + w j ) ω i j ] 2 = i = 1 n j = 1 n ( a i j w i + a i j w j w i ) 2 s.t.  w i > 0    a n d    i = 1 n w i = 1 , i , j = 1 , 2 , ... , n
The solution to this problem can be found in [35]. Then the weight vectors are calculated using the weighted least square method and the weight vector can be obtained consequently.

3.2. Feasible Weight Space

In principle, a general weight space can be expressed as:
W = { w R n : w j 0 , j = 1 n w j = 1 }
where w represents weight vectors with nonnegative values and the summation of them is 1. This means that the general weight space is a union of all weight vectors. Follow this logic; a deterministic weight vector can be represented as a specific point in this space. Furthermore, in a real life MCDA problem like the one addressed in this paper, we have seven criteria, which means that the corresponding general weight space is a hyper-space or a simplex. In such a hyper-space, only one point is essentially not enough to represent the preferences of a group of DMs. This is the main motivation for the authors to propose FWS, which can be seen as a sub-space of the general weight space. FWS is not a totally new concept, but it narrows the weight space by assuming the weight vectors as random variables or variables with certain probability distributions that span only in the feasible sub-space. This means that the sample weight vectors are taken in random or with other probability distributions from the FWS in the Monte Carlo simulation. Therefore, FWS can concentrate on the weight vectors that are most probably used in real life.
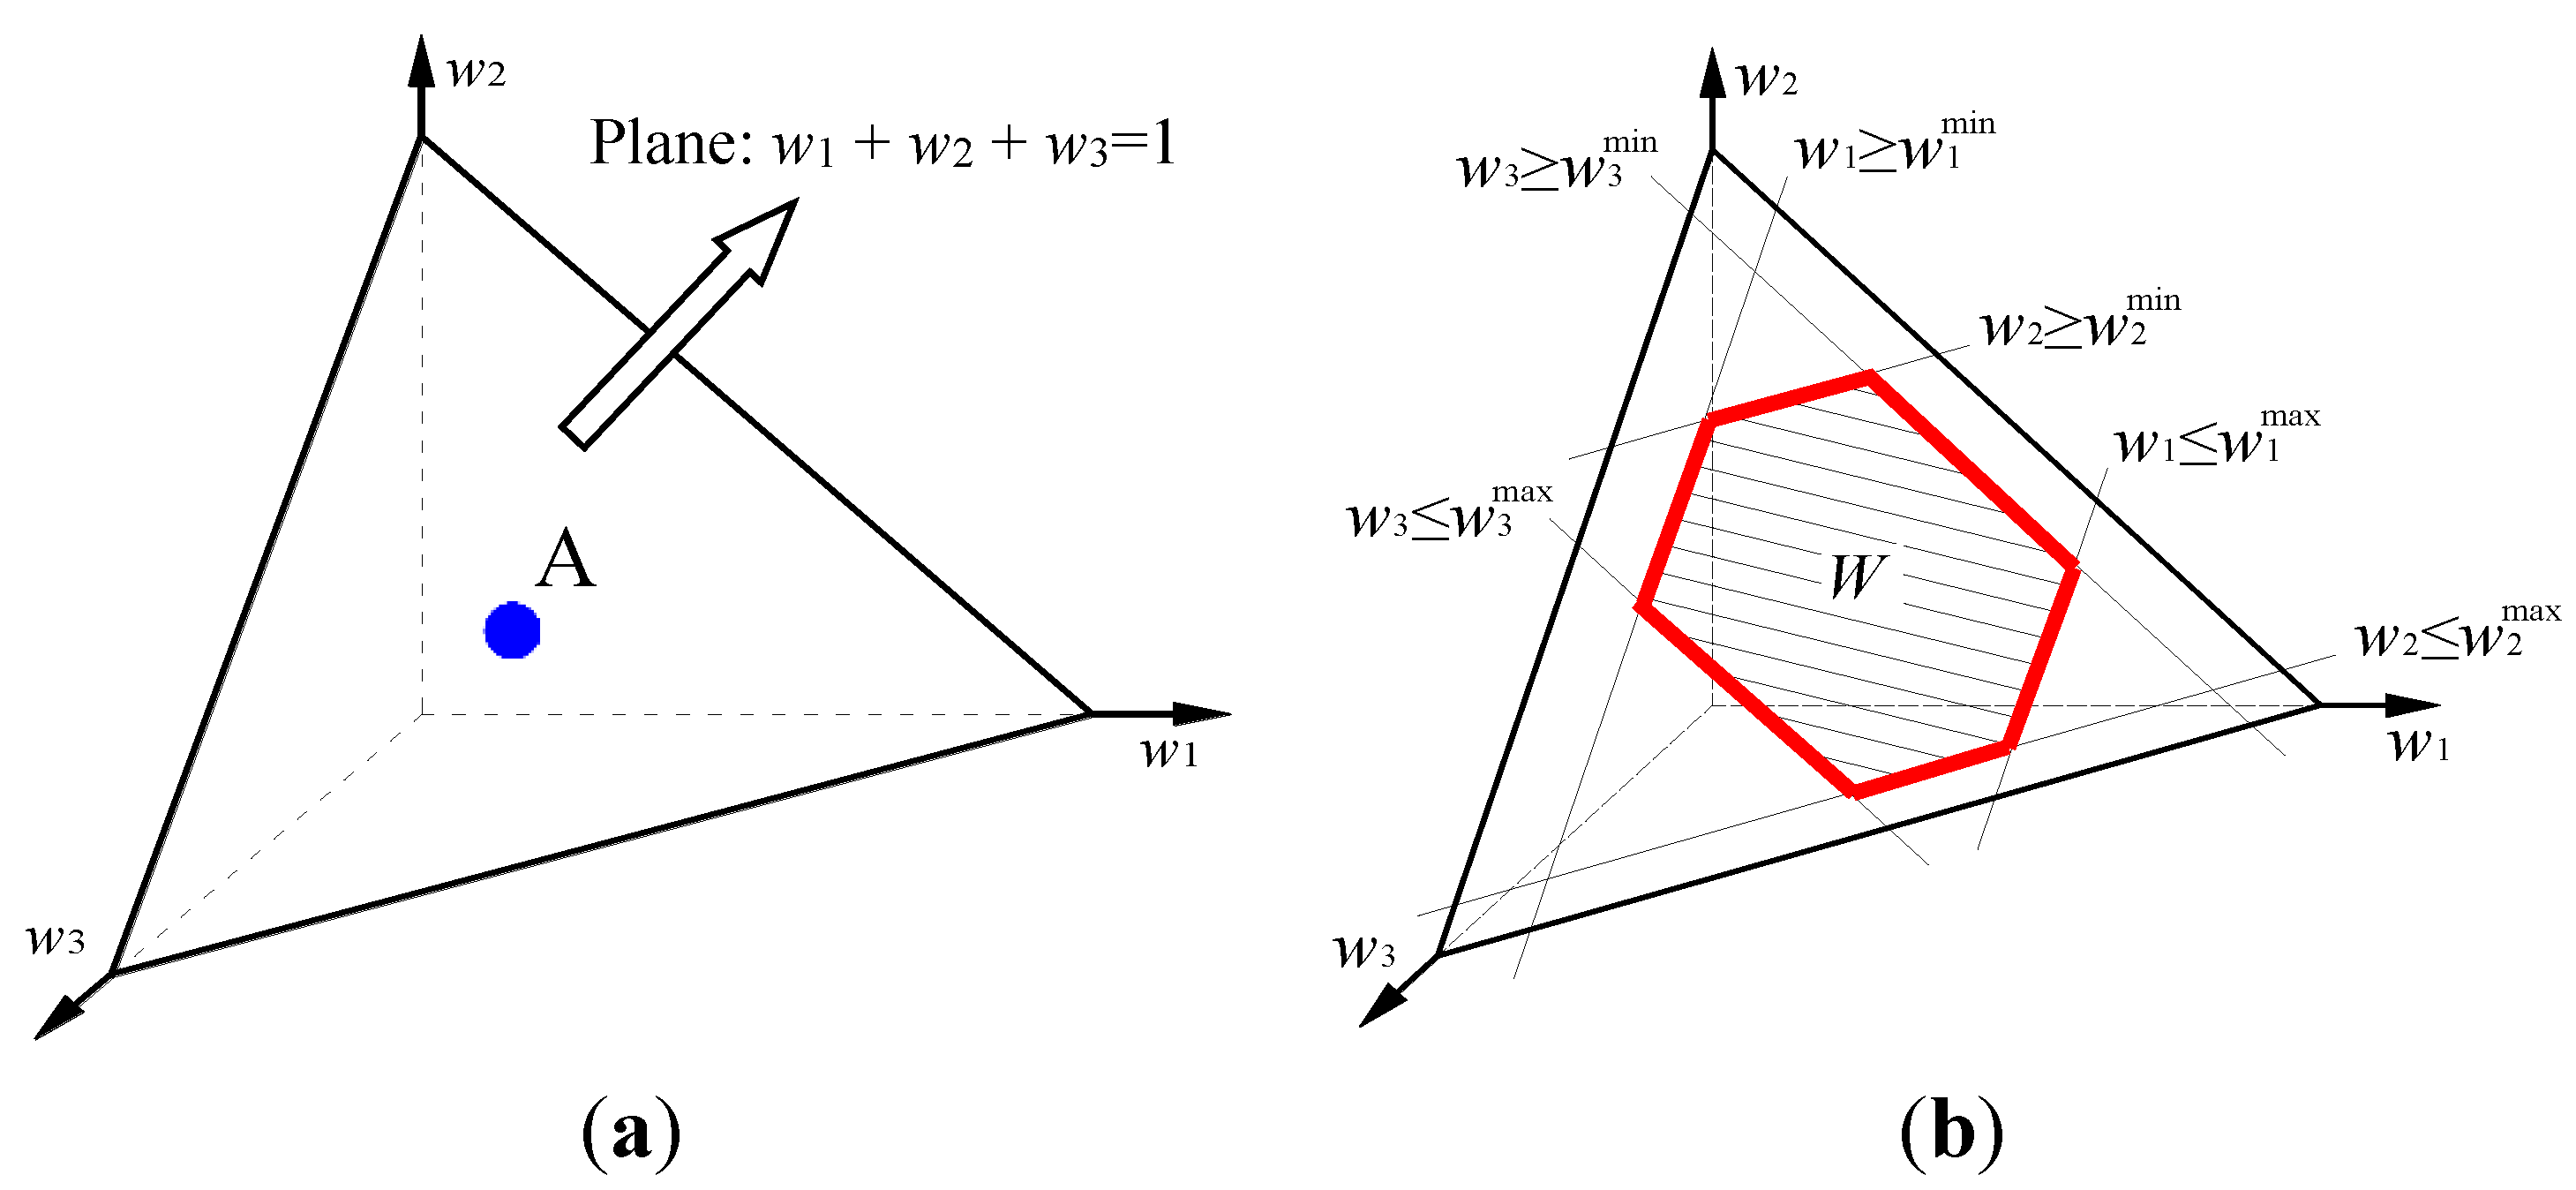
For example, in a three criteria problem, the general weight space is apparently a plane shown in Figure 1a; a deterministic weight vector wA is represented by one point A on this plane. However, a possible FWS with interval constraints on each criterion can be demonstrated as a polygon shaded area on the same plane. This FWS can be expressed as in Equation (8) and shown in Figure 1b:
W = { w R n : w j 0 , w j min w j w j max , j = 1 n w j = 1 }
Figure 1. (a) General weight space and a deterministic weight vector A of a three criteria case; and (b) a feasible weight space (FWS) with interval constraints on each criterion.
Energies 08 00059 g001
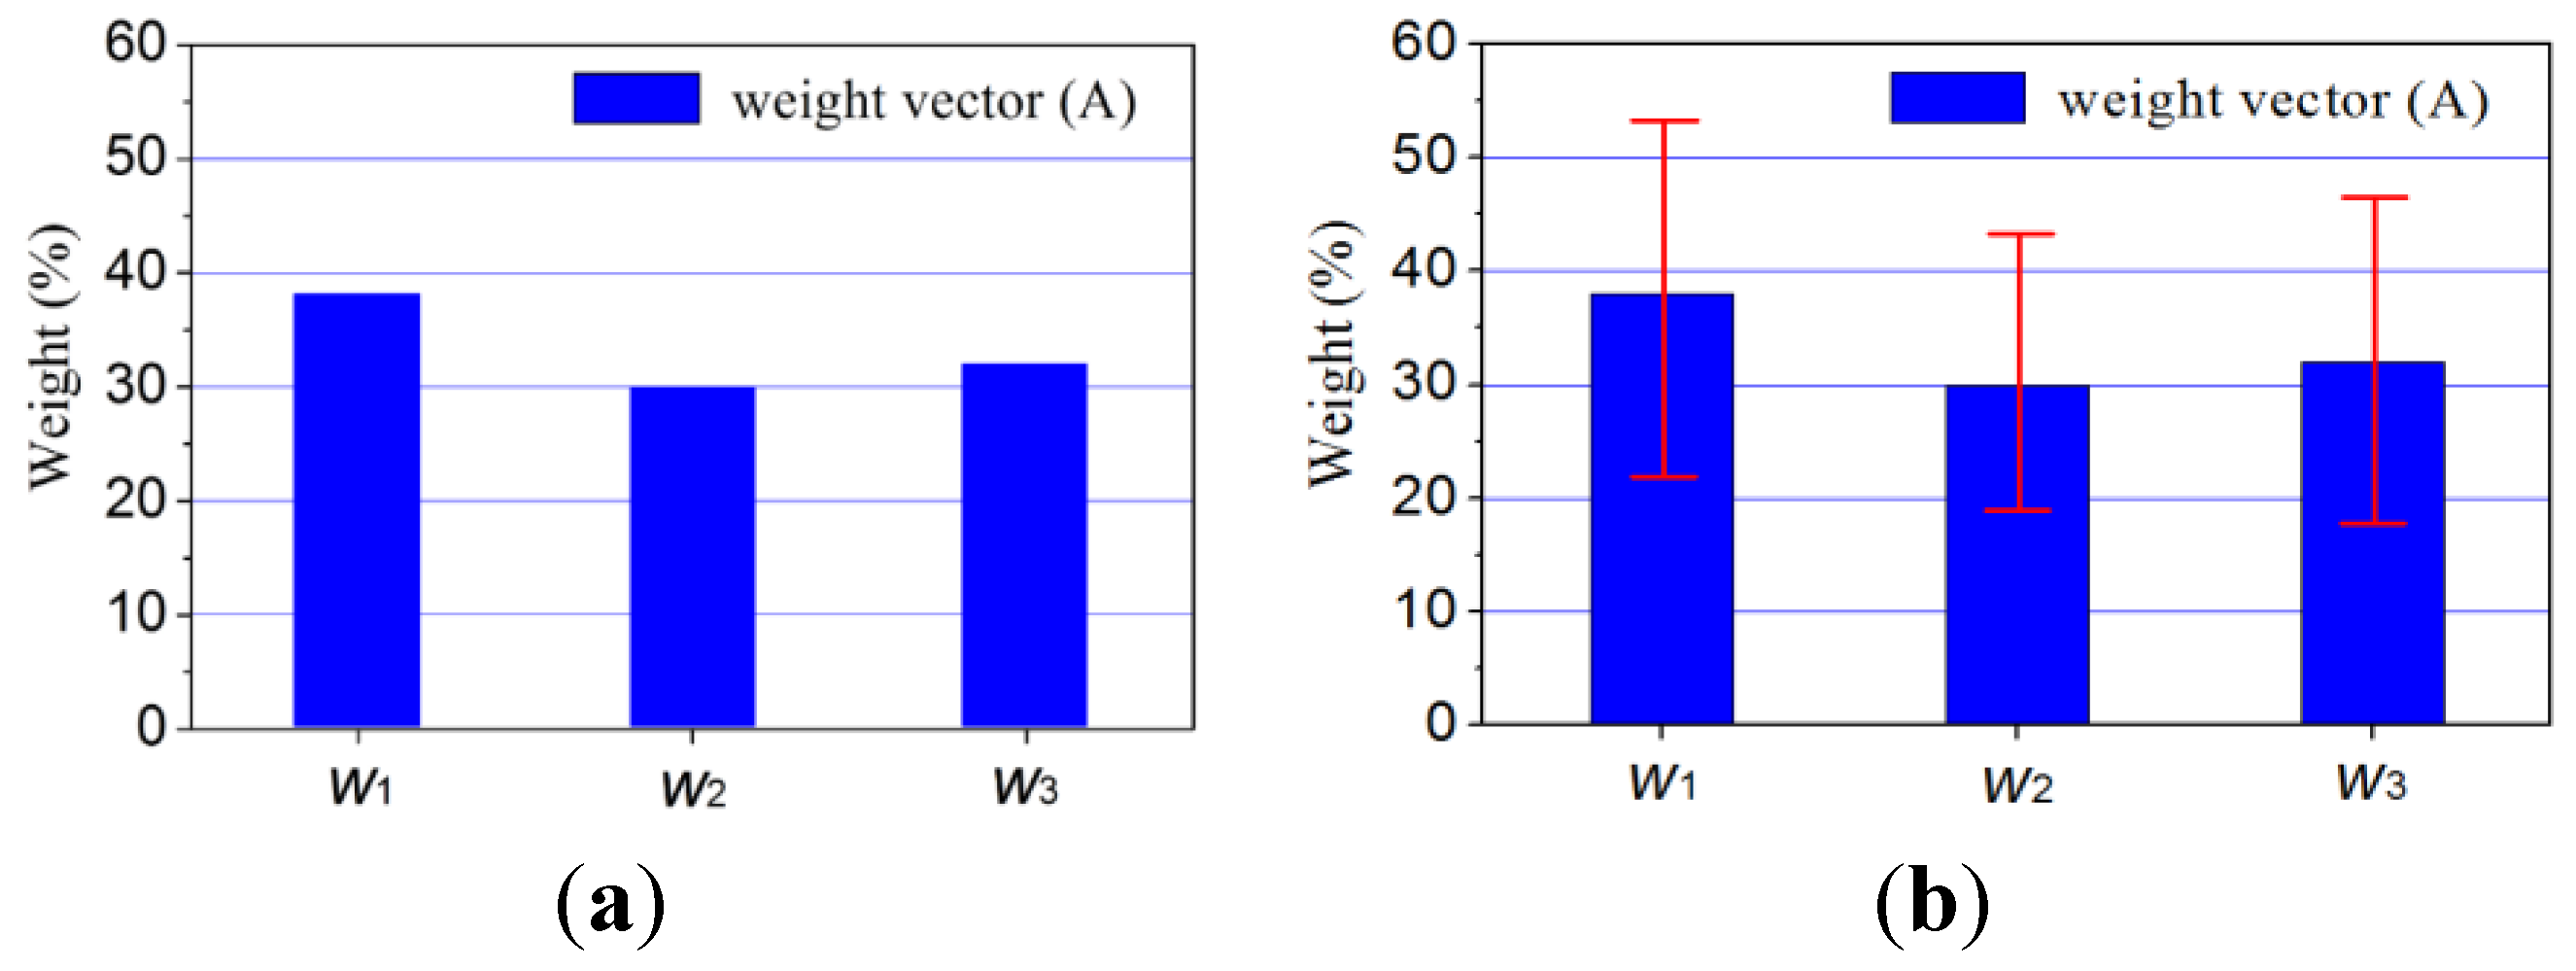
We can also use bars to indicate the deterministic weight vector A, shown in Figure 2a and the FWS in Figure 2b. Specifically, the upper and lower whiskers in Figure 2b represent the maximum and minimum constraints of weight values, but they cannot reach the maximum simultaneously because of the normalization property in Equation (9). In conclusion, a CJM is used to elicit the weight vector and then the FWS extends the weight vector from only one point in the weight space to a sub-space. For group decision making, it is necessary to get this sub-space to cover all DMs’ preference information. DMs give their CJMs and then the inconsistency check is implemented to get satisfactorily consistent CJMs or to determine whether a second round of judgment is needed for some of the DMs. Subsequently, all “consistent” CJMs are used to calculate the weight vectors and then we can obtain the FWS by merging all these weight vectors. However, if there are too few DMs in some situations, we can set an interval for each criterion based on the calculated weight vector as shown in Figure 2b.
Figure 2. Bar representation of: (a) a deterministic weight vector A; and (b) an FWS with interval constraints on each criterion.
Energies 08 00059 g002

4. Stochastic Multicriteria Acceptability Analysis

The evaluation of CHP units is an MCDA problem with multiple criteria and uncertain or imprecise information both in terms of criteria PVs and weighting. In this study, SMAA is adopted to handle this problem; for more details on the original SMAA model, please refer to [36,37,38]. SMAA is a family of models developed based on the utility function theory for quantitative and qualitative problems. In this paper we only use the SMAA-2 [37] model.

4.1. The Stochastic Multicriteria Acceptability Analysis-2 Model

Consider an MCDA problem having m alternatives A = {x1, x2, x3, …, xm}, which needs to be evaluated in terms of n criteria. Assume that the DM’s preference structure can be represented by a utility function, which maps the different alternatives to the utility values for u(xi, w). The SMAA-2 method introduces a rank acceptability index to describe the overall acceptability of each alternative. A ranking function is presented to compute the rank of each alternative from the best rank in Equation (1) to the worst rank (m) as [37]:
rank ( ξ i , w ) = 1 + k ρ [ u ( ξ k , w ) > u ( ξ i , w ) ]
where ρ(true) = 1 and ρ(false) = 0, u(•) is the utility function, SMAA-2 uses ξ to denote criteria PVs with a stochastic distribution of fX(ξ), and w has a stochastic distribution of fW(w). Then the SMAA-2 is based on analyzing sets of favorable rank weights, Wir(ξ), which are defined as:
W i r ( ξ ) = { w W : rank ( ξ i , w ) = r }
where W takes the form of Equation (9).
A weight vector, w Wir(ξ), assigns utilities for the alternatives so that alternative xi obtains rank r. The rank acceptability index, bir, is then defined as the expected volume of the set of favorable rank weight space for each alternative. This is done as follows:
b i r = X f X ( ξ ) W i r ( ξ ) f W ( w ) d w
The rank acceptability index is a measure of the variety of different valuations that assign alternative xi with a rank r. In reality, rank acceptability means the percentage of all Monte Carlo simulations among which a given alternative i obtains rank r. The SMAA-2 method extends the original SMAA model by considering all ranks in the analysis based on a holistic acceptability index in order to examine the overall acceptability of each alternative. A holistic acceptability index is defined to consider all rank acceptability indices as follows:
a i h = r = 1 m α r b i r
where αr are meta-weights, which indicate the contribution of each rank acceptability index to the evaluation of an alternative. It is natural that the first ranks contribute most and the worst ranks contribute very little to the holistic acceptability index. Therefore the meta-weights α can be obtained by a descending vector:
α = { α R m , 1 α 1 α 2 α m 0 }
The central weight vector, wic, is defined as the expected center of gravity of the favorable weight space. The central weight vector is computed as an integral of the weight vector over the criteria and weight distributions by:
w i c = X f X ( ξ ) W i 1 ( ξ ) f W ( w ) w d w b i 1
The central weight vector is the best single vector representation of the preferences of a typical DM supporting xi, given the assumed weight distribution, which can be found in Section 5.2. wic is actually the average of the finite used weight vectors favoring alternative i in the Monte Carlo simulations.
The confidence factor, pic, is defined as the probability that a particular alternative is the most preferred alternative when a particular central weight vector is chosen. Namely, only the first rank acceptability bi1 correspond to the confidence factor, other ranks don’t have confidence factors at all. It is computed as an integral over the criteria distributions by:
p i c = ξ X : rank ( ξ , w i c ) = 1 f X ( ξ )
The confidence factor measures whether the criteria data are accurate enough to discern the alternatives using the central weight vector. It can be described as the proportion of stochastic criterion space that determines the best alternative for the given central weight vector.
SMAA-2 uses Monte-Carlo simulation to calculate the above multi-dimensional integrals. Therefore, these important statistic variables, including rank acceptability indices, holistic acceptability indices, central weight vectors and confidence factors are obtained to facilitate the evaluation of CHP units.

4.2. Handling the Uncertainties

4.2.1. Uncertainties in Criteria Measurements

The uncertainties of quantitative criteria can be expressed as a specific probability distribution around the expected value, shown in Table 2. The most commonly used distributions are uniform and normal distributions [36]. In this paper, we adopt the uniform distribution to represent imprecise measurements.

4.2.2. Uncertainties in Weighting

More attention should be paid on the uncertainties in weighting. This study uses 3-criterion cases to interpret the way to handle uncertainties in weighting. The same technique can be extended for handling the weight uncertainties in higher dimensions.
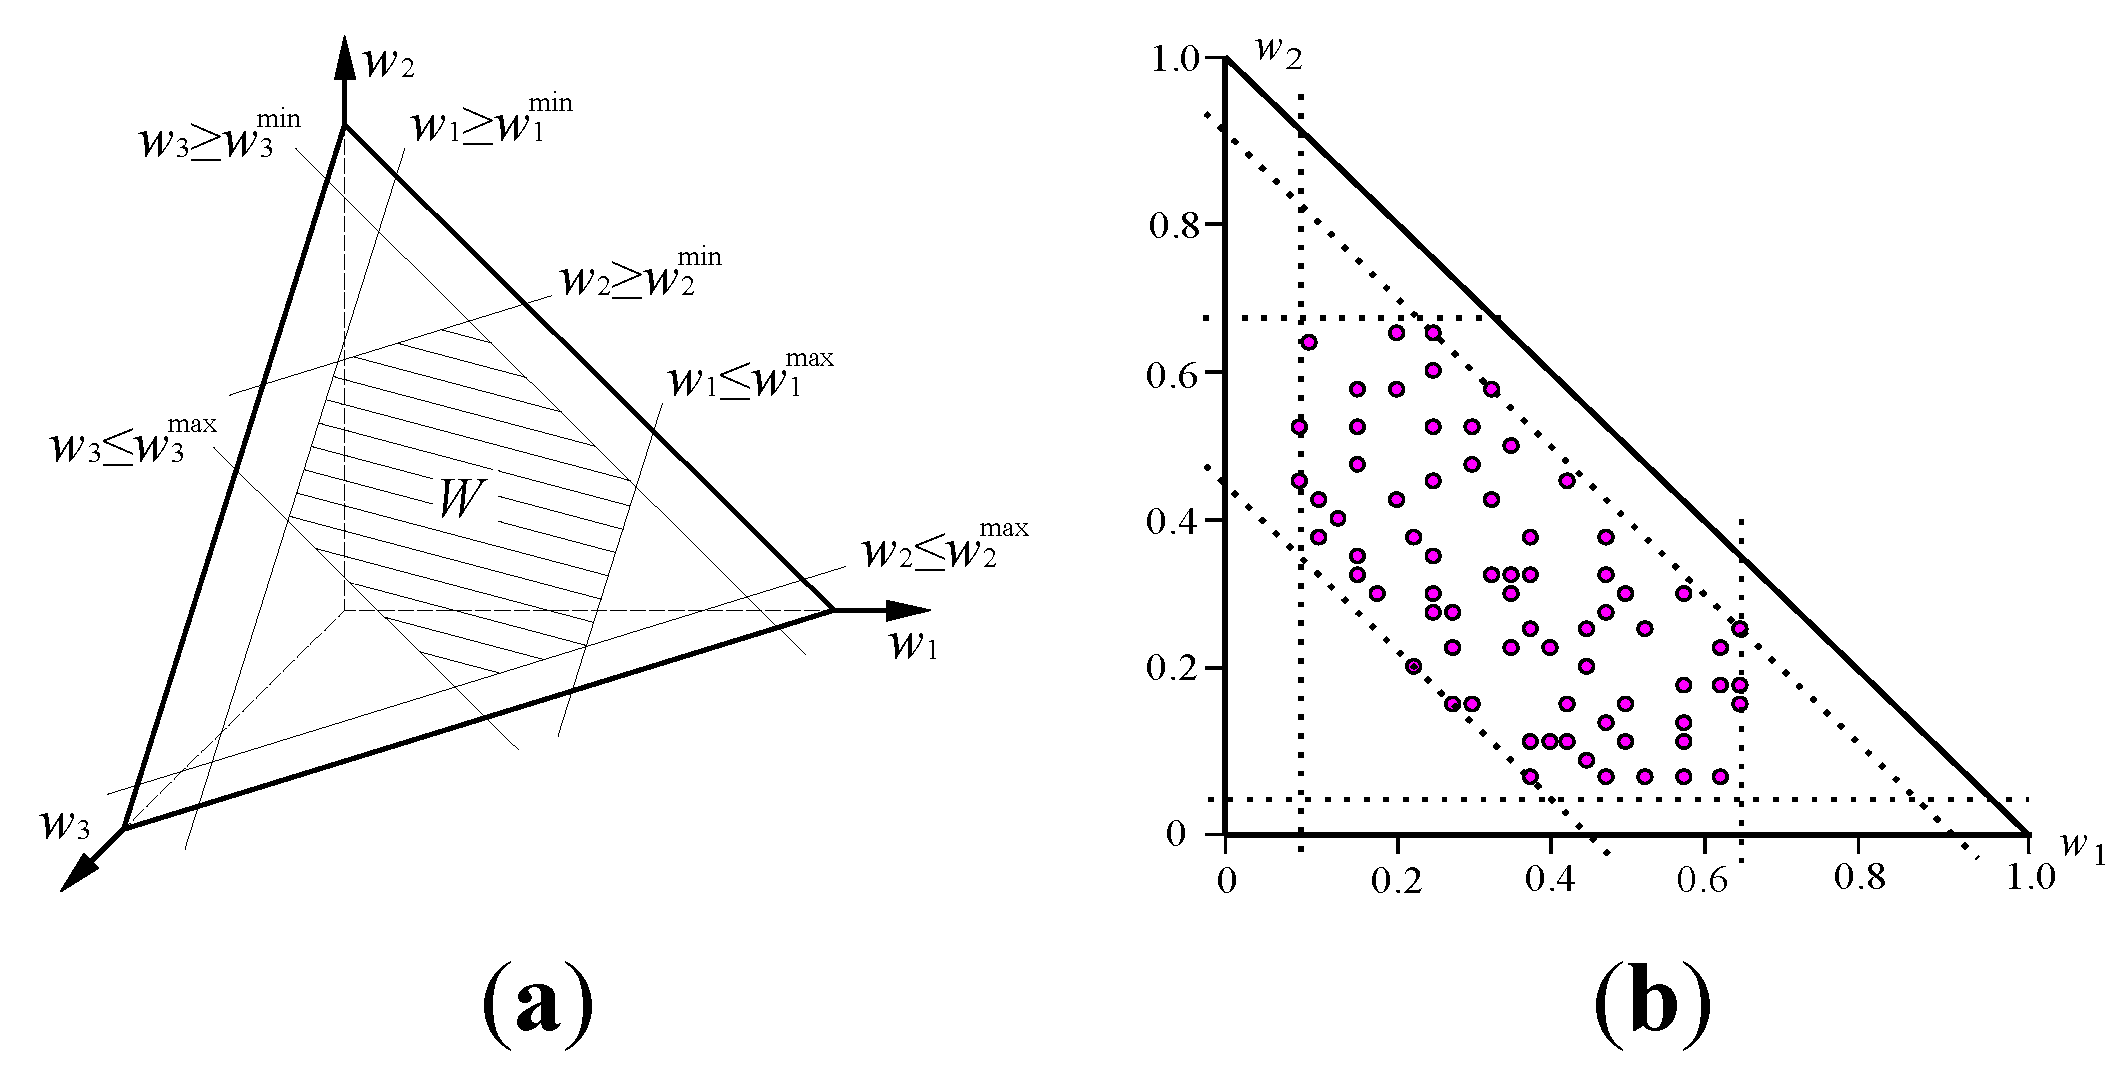
In the most extreme case, no weight information is available. However, a uniform or normal distribution can be assumed. In this study, the FWS is a (n − 1)-dimensional Simplex by Equation (9). For example, the FWS with no weight information in 3-criterion problems is a plane shown in Figure 3. It is assumed that a uniform weight distribution represents imprecise weight information.
Figure 3. (a) FWS with no weight information of a 3-criterion case using uniform distribution; and (b) projection onto w1-w2 plane.
Energies 08 00059 g003
The weight intervals of an FWS with interval constraints can be expressed as wj [wjmin, wjmax]. They may result from direct preference statements of the DMs or from the CJMs. The intervals can be represented as a distribution by restricting the uniform weight distribution with linear inequality constraints based on the intervals. The restricted distribution weights can easily be generated by modifying the above procedure to reject weights that do not satisfy the interval constraints. Figure 4 illustrates the resulting weight distribution in a 3-criterion case.
This study assumes a uniform distribution when using the SMAA-2 model to generate imprecise criteria PVs and weights within a FWS. In fact, the distribution function for generating imprecise information has little effect on the statistic results of variables when using the SMAA model [37]. The idea presented here still provides the possibility to better understand and improve the preference distribution and weight elicitation in further weighting and MCDA studies.
Figure 4. (a) FWS with interval weight information of a 3-criterion case using uniform distribution; and (b) projection onto w1-w2 plane.
Energies 08 00059 g004
For the evaluation of CHP units, we have obtained one “consistent” CJM based on which the weight vector is calculated and shown in Figure 5 as bars. Then we assume an interval of ±50% to obtain an FWS, which covers a wider range of the weight space. During the Monte Carlo simulations (usually more than 10,000 iterations), sample weight vectors are only taken from this FWS. This technique is more advanced than trying to enumerate possible weight combinations for covering more preferences.
Figure 5 shows that efficiency is the dominant factor, with a weight of 31.4% followed by electricity cost and CO2 production with a weight percentage of 16.7%. In addition, the rest of the criteria have weight percentages lower than 1/7; of these criteria, installation cost and maintenance cost are important, heat cost is less important, while the weight of footprint is small. It can be concluded that the ordinal sequence for these criteria weights is: C1 > C4 = C6 > C2 = C3 > C5 > C7. However, an arbitrary weight vector in this FWS may have a different ordinal sequence because of the uncertainties. This FWS is used in the SMAA-2 model for the evaluation of CHP units.
Figure 5. FWS with ±50% interval constraints using uniform distribution on each criterion for evaluation of CHP units.
Energies 08 00059 g005

5. Results and Discussion

Two different kinds of criteria weights shown in Table 4 are used in the SMAA-2 model. These weight types are marked as (a) and (b) in the following analyses. The reasons for choosing type (a) weight are that we want to reduce the subjectivity effect to a minimum level by searching the whole general weight space represented by Equation (9), and comparing the conclusions based on the two different weighting methods. We use 100,000 Monte-Carlo iterations in the simulation, which gives error limits less than 0.01 [39].
Table 4. Two types of weights used in the evaluation of CHP units.
Weight typeNo.Description
No weight information(a)The FWS is the general weight space with seven criteria, i.e., a six-dimensional simplex
Interval constraints of weights(b)The FWS shown in Figure 5

5.1. Results

The confidence factors, holistic acceptability and rank acceptability indices using the two types of weights are presented in Table 5 and Table 6. In these tables, the CHP units with ah > 50% and/or pc > 20% appear in boldface.
Table 5. Confidence factors (pc) and holistic (ah) and rank acceptability indices (br) in percentages using type (a) weight bound.
CHPpcahb1b2b3b4b5b6b7
S16.230.70.48.87.86.97.59.212.6
S27.139.91.15.621.815.914.516.79.5
S302.50000.10.10.10.1
S44.222.70.31.13.88.06.27.411.7
S56.316.30.11.02.52.02.22.83.9
S623.962.410.347.617.211.06.93.71.9
S701.90000000
S80.721.900.10.72.14.68.415.6
S90.514.700.20.61.32.03.25.2
S1099.492.580.112.83.91.80.80.30.2
S1111.010.90.10.30.40.71.01.83.4
S12010.1000.10.10.20.61.4
S1305.60000000.1
S1453.140.85.410.012.213.413.912.210.0
S1511.540.31.67.414.718.618.815.510.8
S164.839.00.65.114.218.121.218.113.5
CHPb8b9b10b11b12b13b14b15b16
S114.414.07.15.43.31.61.000
S25.74.63.70.800000
S30.20.52.04.55.23.37.615.161.0
S410.710.99.213.16.46.02.51.21.4
S56.111.118.717.612.717.41.900
S61.00.30.1000000
S70000.31.83.57.160.227.1
S824.022.212.75.63.10.80.100
S98.611.319.515.110.19.59.93.40.2
S100.100000000
S114.85.510.113.215.116.612.57.17.3
S122.94.98.916.928.523.77.63.80.3
S130.30.71.74.413.417.649.89.22.6
S147.87.84.32.60.30.1000
S157.03.81.50.300000
S166.32.30.60.100000
Table 6. Confidence factors (pc) and holistic (ah) and rank acceptability indices (br) in percentages using type (b) weight bound.
CHPpcahb1b2b3b4b5b6b7
S1027.1001.36.29.514.525.4
S2051.602.073.314.86.42.90.6
S303.80000000
S4027.7001.211.910.612.218.5
S5013.40000000
S62.570.01.895.82.20.1000
S700.00000000
S8020.70000.21.03.09.4
S907.80000000
S1099.199.598.21.800000
S1108.90000000
S1209.90000000
S1304.20000000
S14033.800.15.817.421.222.818.9
S15037.100.18.525.426.421.312.6
S16036.500.17.623.924.923.314.6
CHPb8b9b10b11b12b13b14b15b16
S127.915.10000000
S2000000000
S3000.24.64.910.423.855.60.3
S422.423.00.2000000
S500.269.117.911.81.0000
S6000000000
S700000000.399.7
S830.755.70000000
S900.18.025.911.727.312.215.00
S10000000000
S110012.419.629.027.17.74.20
S120010.131.339.716.71.80.30
S130000.72.917.454.424.60
S149.84.10000000
S154.51.10000000
S164.70.80000000
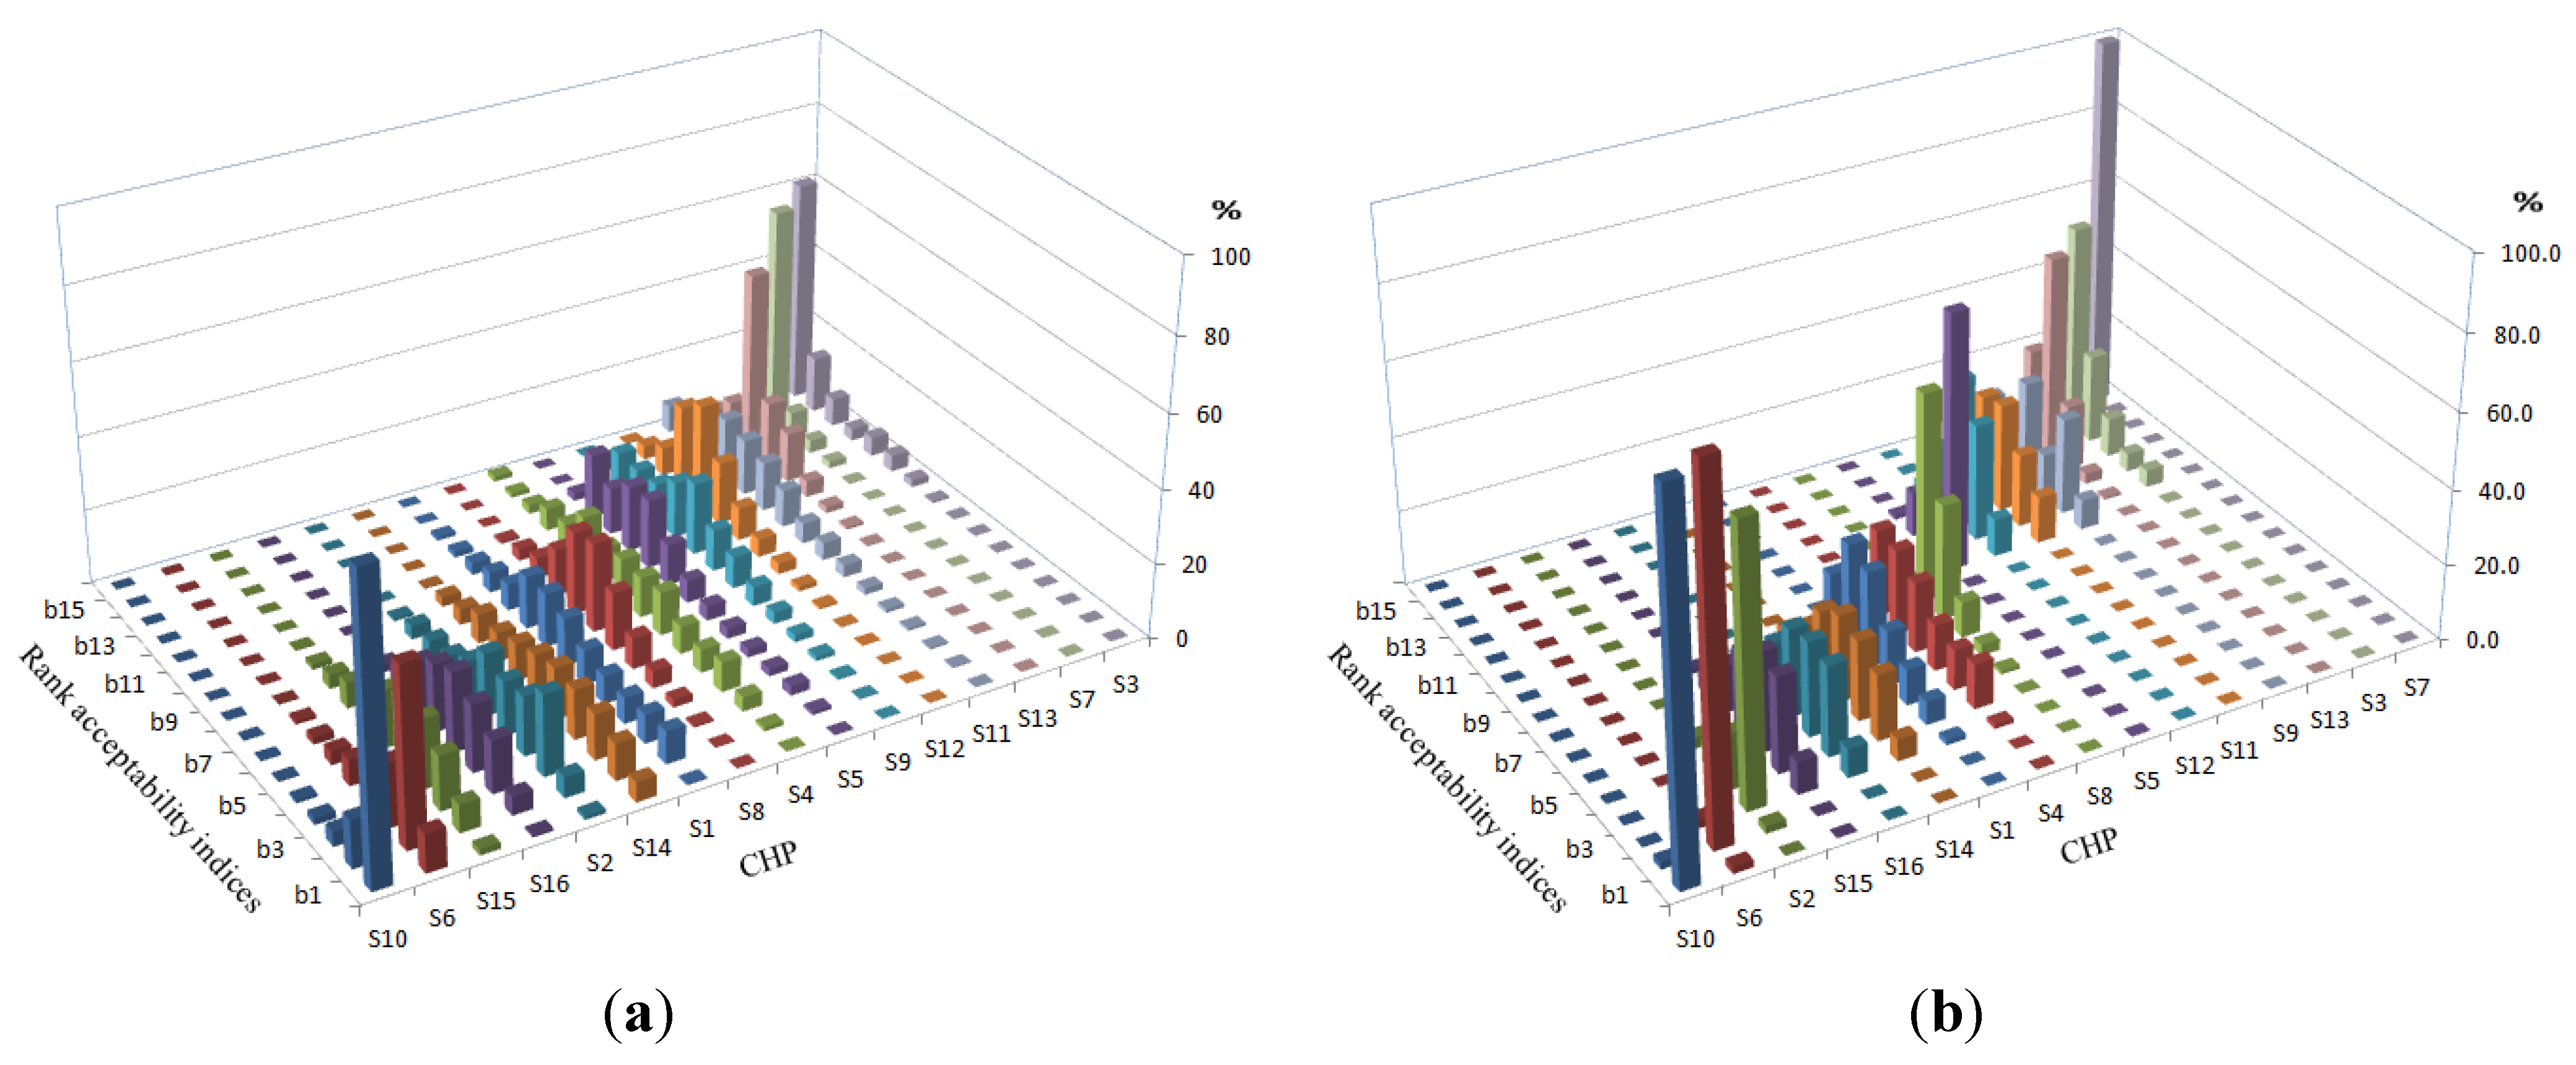
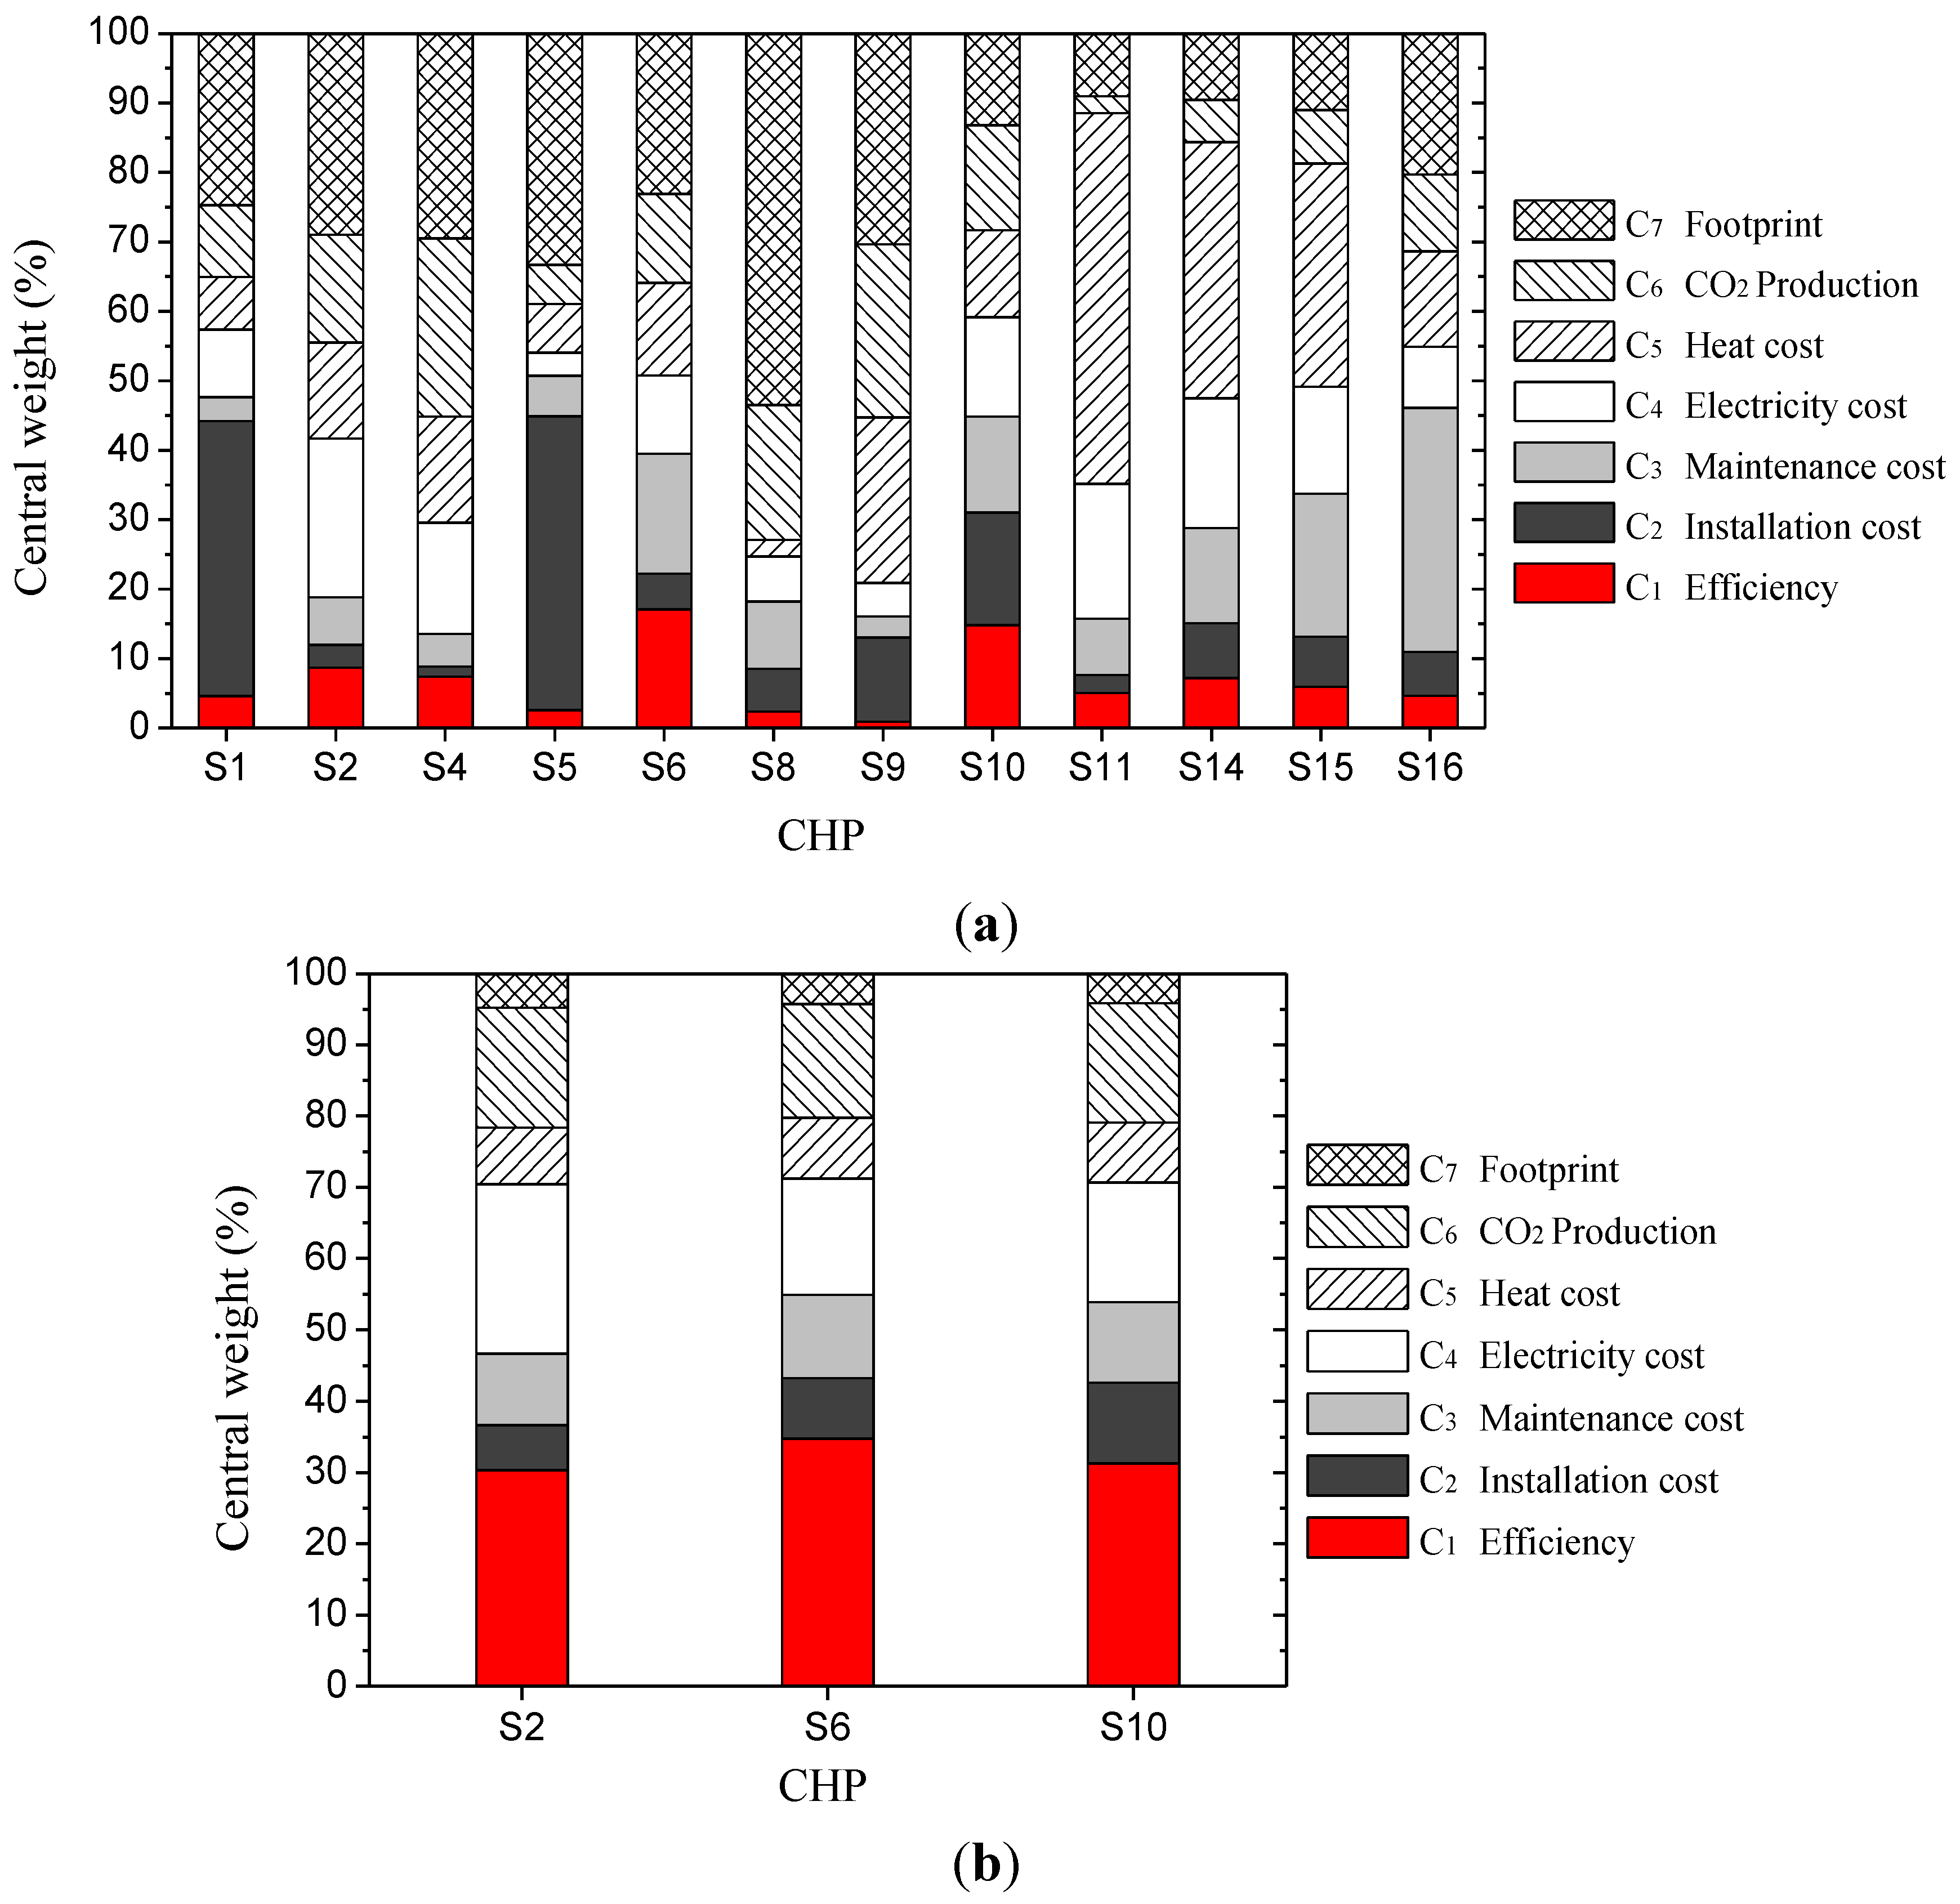
In addition, all rank acceptability indices are also illustrated graphically in Figure 6 for better discrimination, while central weight vectors are shown in Figure 7. Notice that the central weight vector is not defined for a CHP unit that has a confidence factor of zero.
According to the SMAA-2 results using type (a) weight information, CHP units S3, S7, S12 and S13 can be firstly rejected as most qualified alternatives because of their zero confidence factors, which means that they never obtain the first rank. However, S10 has a very good confidence factor of 99.4%, followed by S14 (53.1%) and S6 (23.9%). The rest of the alternatives have confidence factors in the range of 0.5%–11.5%, which is also deemed so small that they can be eliminated as the best alternative. As can be seen, even with no weight information, the SMAA-2 method already shows good discrimination. Next, the rank acceptability indices are examined. The rank acceptability indices of S10 are apparently quite good for the best ranks (80.1% for rank 1, 12.8% for rank 2, and they already add up to 92.9%), and zeros for the worst ranks (after rank 9 here). Nevertheless, the confidence factor and holistic acceptability of S10 are the best among all the alternatives. Therefore, S10 has the best opportunity to be the most qualified CHP unit for industry use. By looking at the central weights in Figure 7a, S10 favors almost evenly all the seven criteria. Actually, according to the SMAA-2 results, S10 competes greatly with most of the other CHP units even when the others’ central weights are finally used. This means that even using other alternatives’ central weights, S10 still has good chance of being the best alternative. S6 and S14 have a small chance to be the most preferred CHP units when the weights are quite close to their central weights, shown in Figure 7a. If the real weight vector changes a bit more, then the S6 and S14 would be very likely to lose the first rank.
Figure 6. Rank acceptability indices (br): (a) for evaluation of CHP units with no weight information; and (b) with interval constraints of weights.
Energies 08 00059 g006
By looking at the SMAA-2 results using type (b) weight in Table 6, a better discrimination compared to type (a) is obtained since there are only three alternatives left, all others being eliminated because of the zero confidence factor. This is because S10 clearly dominates other CHP units by having an outstanding confidence factor of 99.1% and a holistic acceptability index of 99.4%, which indicates that other CHP units hardly have any chance of being the best choice even considering the uncertainties of criteria and weights. Only S6 competes a little with S10 of being the optimal CHP unit when using its central weight exactly shown in Figure 7b.
It can be concluded that no matter what kind of weights are used, S10, the CCGT 750 MWe is much more likely to be the optimal CHP unit for industry use than any of the other choices. However, GT 225 MWe has small chance of reaching the status of best alternative CHP unit only if efficiency, maintenance cost and footprint are emphasized at the same time.
Figure 7. Central weights (wc): (a) favoring different CHP units with no weight information; and (b) with interval constraints of weights.
Energies 08 00059 g007

5.2. Discussion

We also can give a full ranking sequence of all 16 CHP units according to SMAA-2 outputs by the holistic rank acceptability indices, the so called utility function. However, this is not encouraged because it may lead to some kind of misunderstanding of the evaluation results. DMs may have intuitions by looking at the ranking sequence that the best alternative dominates all the others. But the truth is that ranking sequence is subject to uncertainties very heavily, which necessitates the interpretation of the evaluation results coupled with the uncertainties of criteria PVs and weighting. In this study, the SMAA method is adopted to facilitate the understanding of the evaluation by rank acceptability indices and confidence factors. SMAA can help DMs know what kind of weight information will favor what kind of best alternatives by giving the probabilities. In addition, it also helps reveal inefficient alternatives. Risk analysis can also be done by taking many DMs’ preferences into consideration at the same time. Further, if we combine the SMAA with the FWS, then the evaluation can be more reliable in essence. These are the reasons that we propose the use of FWS in multicriteria evaluation of CHP units and also in other MCDA problems.
This study shows some improvements in MCDA methods and the handling of uncertainties for multicriteria evaluation of CHP units. However, this is not enough, because there are a variety of CHP units devoted for different industrial, residential or even household applications, covering a very wide range of electricity outputs. Therefore, for different real-life situations, we need more detailed evaluations for specific purposes. That is to say, an application-oriented MCDA based on our methods and concepts can be more meaningful.

6. Conclusions

In this paper, 16 CHP units representing different technologies are taken into account for multicriteria evaluation from the 3E points of view including the criteria of efficiency, investment cost, maintenance cost, electricity cost, heat cost, CO2 production and footprint. Data of these CHP units were collected by a literature review and this problem has been addressed by some previous studies. However, we notice that the evaluation can be improved to some extent. First, uncertainties and imprecision are common both in criteria PVs and weights, therefore the SMAA model is adopted in this paper. Moreover, the FWS which represents the union of preference information from DMs is proposed. A CJM is introduced to determine the FWS. Subsequently, two different types of FWSs are used for the evaluation of CHP units. The first one is the general weight space which reduces subjectivity to a minimum level and the second one is the FWS with interval constraints on criteria.
The SMAA results show that no matter what kind of weights are used, the CCGT 750 MWe has the best chance of being the optimal CHP unit in terms of 3E. GT 225 MWe has small chance to reach best alternative only if efficiency, maintenance cost and footprint are emphasized at the same time. Other CHP units are dominated by the above two systems, but this doesn’t mean that other CHP units are not needed anymore, because the features of CHP units are correlated with their surroundings and boundary conditions. Moreover, we need different electricity outputs from different CHP units devoted for industrial and/or residential purposes. This is why an application-oriented MCDA for specific applications based on the presented methods can be more meaningful. We conclude that the idea of FWS plus CJM is well compatible with SMAA and can make evaluation results reliable. The presented method can be extended to other complex energy systems as well.

Acknowledgments

This study is funded by the Aalto University project STEEM—Sustainable Transitions of European Energy Markets.

Author Contributions

Haichao Wang and Wenling Jiao performed the simulation and analysis; Risto Lahdelma provided instructions on the SMAA model; Haichao Wang wrote the paper and Chuanzhi Zhu contributed to part of the writing and editing work of the manuscript; and Pinghua Zou provided some useful materials of CHP plants in China.

Abbreviations

AHP
Analytical hierarchy process
CC
Combined cycle
CCGT
Combined cycle gas turbine
CHP
Combined heat and power
CJM
Complementary judgment matrix
DM
Decision maker
FWS
Feasible weight space
GT
Gas turbine
MCDA
Multicriteria decision analysis
SMAA
Stochastic multicriteria acceptability analysis
ST
Steam turbine

Letter Symbols

A
Complementary judgment matrix
aij
Element of a judgment matrix
aih
Holistic acceptability index of alternative i
pic
Confidence factor of alternative i, %
W
Weight space
Wir
Favorable ranking weights
w
Weight
w
Weight vector
wic
Central weight vector

Subscripts and Superscripts

e
Electricity
th
Thermal
c
Cent

Conflicts of Interest

The authors declare no conflict of interest.

References

  1. Xu, J.Z.; Sui, J.; Li, B.Y.; Yang, M.L. Research, development and the prospect of combined cooling, heating, and power systems. Energy 2010, 11, 4361–4367. [Google Scholar] [CrossRef]
  2. Ge, Z.H.; Hu, X.W.; Yang, Z.P. The application of energy step utilize in co-generation. J. North China Electr. Power Univ. 2010, 1, 66–68. (in Chinese). [Google Scholar]
  3. Conde Lázaro, E.; Ramos Millán, A.; Reina Peral, P. Analysis of cogeneration in the present energy framework. Fuel Process. Technol. 2006, 87, 63–68. [Google Scholar]
  4. Wang, H.C.; Jiao, W.L.; Lahdelma, R.; Zou, P.H.; Zhan, S.H. Atmospheric environmental impact assessment of a combined district heating system. Build. Environ. 2013, 64, 200–212. [Google Scholar] [CrossRef]
  5. Lund, H.; Siupsinskas, G.; Martinaitis, V. Implementation strategy for small CHP-plants in a competitive market: The case of Lithuania. Appl. Energy 2005, 82, 211–227. [Google Scholar] [CrossRef]
  6. Rong, A.; Hakonen, H.; Lahdelma, R. An efficient linear model and optimisation algorithm for multi-site combined heat and power production. Eur. J. Oper. Res. 2006, 168, 612–632. [Google Scholar] [CrossRef]
  7. International Energy Agency (IEA). Energy Technology Perspectives. 2012. Available online: http://www.iea.org/w/bookshop/add.aspx?id=425 (accessed on 27 December 2013).
  8. Frederiksen, S.; Werner, S. District Heating and Cooling; Studentlitteratur AB: Lund, Sweden, 2013; pp. 1–16. [Google Scholar]
  9. Huang, J. Comprehensive Evaluation for the Setup of Peak Heating Using Gas Fired Boiler. Master’s Thesis, Beijing University of Civil Engineering and Architecture, Beijing, China, 2008. [Google Scholar]
  10. Statistics Finland. Energy, 2012. Available online: http://www.stat.fi/til/ene_en.html (accessed on 4 January 2014).
  11. Sustainable Transition of European Energy Markets. STEEM Project Description. Available online: http://energytech.aalto.fi/fi/research/energy_efficiency_and_systems/energy_economics_and_power_plant_engineering/steem/ (accessed on 27 December 2013).
  12. Rong, A.; Lahdelma, R. Efficient algorithms for combined heat and power production planning under the deregulated electricity market. Eur. J. Oper. Res. 2007, 176, 1219–1245. [Google Scholar] [CrossRef]
  13. Balli, O.; Aras, H. Energetic and exergetic performance evaluation of a combined heat and power system with the micro gas turbine (MGTCHP). Int. J. Energy Res. 2007, 31, 1425–1440. [Google Scholar] [CrossRef]
  14. Ertesvag, I.S. Exergetic comparison of efficiency indicators for combined heat and power (CHP). Energy 2007, 32, 2038–2050. [Google Scholar] [CrossRef]
  15. Fryda, L.; Panopoulos, K.D.; Kakaras, E. Integrated CHP with autothermal biomass gasification and SOFC-MGT. Energy Convers. Manag. 2008, 49, 281–290. [Google Scholar] [CrossRef]
  16. Biezma, M.V.; San Cristobal, J.R. Investment criteria for the selection of cogeneration plants—A state of the art review. Appl. Therm. Eng. 2006, 26, 583–588. [Google Scholar] [CrossRef]
  17. Hinojosa, L.R.; Day, A.R.; Maidment, G.G.; Dunham, C.; Kirk, P. A comparison of combined heat and power feasibility models. Appl. Therm. Eng. 2007, 27, 2166–2172. [Google Scholar] [CrossRef]
  18. Hawkes, A.D.; Leach, M.A. Cost-effective operating strategy for residential micro-combined heat and power. Energy 2007, 32, 711–723. [Google Scholar] [CrossRef]
  19. Zheng, Z.; Fu, L.; Di, H.; Jiang, Y. Comprehensive evaluation of urban heating types with analytic hierarchy process. Heat. Vent. Air Cond. 2009, 8, 96–98. (In Chinese) [Google Scholar]
  20. Clemen, R.T. Making Hard Decisions—An Introduction to Decision Analysis, 2nd ed.; Duxbury Press/Wadsworth Publishing Company: Belmont, CA, USA, 1996. [Google Scholar]
  21. Hyde, K.; Maier, H.R.; Colby, C. Incorporating uncertainty in the PROMETHEE MCDA method. J. Multi-Crit. Decis. Anal. 2003, 12, 245–259. [Google Scholar] [CrossRef]
  22. Troldborg, M.; Heslop, S.; Hough, R.L. Assessing the sustainability of renewable energy technologies using multi-criteria analysis: Suitability of approach for national-scale assessments and associated uncertainties. Renew. Sust. Energy Rev. 2014, 39, 1173–1184. [Google Scholar] [CrossRef]
  23. Zarghami, M.; Szidarovszky, F. Stochastic-fuzzy multi criteria decision making for robust water resources management. Environ. Res. Risk Assess. 2009, 23, 329–339. [Google Scholar] [CrossRef]
  24. Durbach, I.N.; Stewart, T.J. Modeling uncertainty in multi-criteria decision analysis. Eur. J. Oper. Res. 2012, 223, 1–14. [Google Scholar] [CrossRef]
  25. Tylock, S.M.; Seager, T.P.; Snell, J.; Bennett, E.R.; Sweet, D. Energy management under policy and technology uncertainty. Energy Policy 2012, 47, 156–163. [Google Scholar] [CrossRef]
  26. Angilella, S.; Corrente, S.; Greco, S. Stochastic multiobjective acceptability analysis for the Choquet integral preference model and the scale construction problem. Eur. J. Oper. Res. 2015, 240, 172–182. [Google Scholar] [CrossRef]
  27. Afgan, N.H.; Carvalho, M.G. Multi-criteria assessment of new and renewable energy power plants. Energy 2002, 27, 739–755. [Google Scholar] [CrossRef]
  28. Pilavachi, P.A.; Roumpeas, C.P.; Minett, S.; Afgan, N.H. Multi-criteria evaluation for CHP system options. Energy Convers. Manag. 2006, 47, 3519–3529. [Google Scholar] [CrossRef]
  29. Afgan, N.H.; Pilavachi, P.A.; Carvalho, M.G. Multi-criteria evaluation of natural gas resources. Energy Policy 2007, 1, 704–713. [Google Scholar] [CrossRef]
  30. Wang, J.J.; Jing, Y.Y.; Zhang, C.F. Weighting methodologies in multi-criteria evaluations of combined heat and power systems. Int. J. Energy Res. 2009, 33, 1023–1039. [Google Scholar] [CrossRef]
  31. Saaty, T.L.; Peniwati, K. Group Decision Making: Drawing out and Reconciling Differences; RWS Publications: Pittsburgh, PA, USA, 2008. [Google Scholar]
  32. Hokkanen, J.; Lahdelma, R.; Salminen, P. Multicriteria decision support in a technology competition for cleaning polluted soil in Helsinki. J. Environ. Manag. 2000, 60, 339–348. [Google Scholar] [CrossRef]
  33. Lv, Y.J. Weight calculation method of fuzzy analytical hierarchy process. Fuzzy Syst. Math. 2002, 16, 80–86. [Google Scholar]
  34. Su, W.H. Study on Multicriteria Comprehensive Evaluation Theories and Methodologies. Ph.D. Thesis, Xiamen University, Xiamen, Fujian, China, 2000. [Google Scholar]
  35. Wang, H.C.; Jiao, W.L.; Lahdelma, R.; Zou, P.H. Development of multicriteria index system and weighting optimization for a district heating system. In Proceedings of the 1st International Symposium and 10th Balkan Conference on Operational Research, Thessaloniki, Greece, 22–25 September 2011.
  36. Lahdelma, R.; Hokkanen, J.; Salminen, P. SMAA—Stochastic multiobjective acceptability analysis. Eur. J. Oper. Res. 1998, 106, 137–143. [Google Scholar] [CrossRef]
  37. Lahdelma, R.; Salminen, P. SMAA-2: Stochastic multicriteria acceptability analysis for group decision making. Oper. Res. 2001, 3, 444–454. [Google Scholar] [CrossRef]
  38. Lahdelma, R.; Miettinen, K.; Salminen, P. Ordinal criteria in stochastic multicriteria acceptability analysis (SMAA). Eur. J. Oper. Res. 2003, 147, 117–127. [Google Scholar] [CrossRef]
  39. Tervonen, T.; Lahdelma, R. Implementing stochastic multicriteria acceptability analysis. Eur. J. Oper. Res. 2007, 178, 500–513. [Google Scholar] [CrossRef]