The objective of the modularization was to find the optimal configuration of these design variables. Conventional power-plants, such as gas turbines and diesel engines are designed to deliver a specific power output at specific heat source and heat sink temperatures, such as flame and ambient temperatures. Inspired by this approach, two-dimensional optimization was introduced; these are normal (design) wellhead temperature (Tg0) and ambient temperature (Ta0). The 11 design variables then were a product of the sizing for the design-point (Tg0-Ta0).
4.1. Component Sizing for Normal-Design: Thermodynamic Optimization
In order to size the components, the thermodynamic cycle must be determined first. Thus, a thermodynamic optimization was carried out to maximize the net power output. The normal (design) condensation temperature is defined as:
In low temperature power-plants, lowering condensation temperature benefits power output [
19]. An initial temperature difference (ITD) of 14 K was selected as the lower bounding value for practical application [
20].
Isobutane can be categorized as a dry fluid (
i.e., negative slope of saturated vapor line); hence, at design condition, saturated vapor is the best turbine inlet parameter [
21]. The optimal evaporation temperature (OET) as normal (design) evaporation temperature is obtained by solving:
The analytical OET results had an accuracy of 2.3%, compared to the numerical OET [
21]. The design pinch-point was 5 K for both the evaporator and recuperator. The normal wellhead temperature varied from 120 °C to 170 °C, and the normal ambient temperature varied from −10–40 °C, with a step of 10 °C, and 12 random points (6 × 6 grid + 12). The sizing results for each normal (design) wellhead temperature are listed in
Table 2. The net efficiency is defined as ratio of net power (gross power deducted by feed-pump and fan power) to the heat input.
Table 2.
Thermodynamic design of ORC cycles, showing range of optimal sizing results.
Table 2.
Thermodynamic design of ORC cycles, showing range of optimal sizing results.
| Tg0 | 120 | 130 | 140 | 150 | 160 | 170 |
|---|
| Evaporation temperature (sat.) (°C) | 80–87 | 85–93 | 91–101 | 99–111 | 111–122 | 115–121 * |
| Condensation temperature (°C) | 4–54 | 4–54 | 4–54 | 4–54 | 4–54 | 4–54 |
| Geofluid mass flow rate (kg·s−1) | 31.3–95.7 | 24.8–68.8 | 20.2–51.1 | 16.7–38.7 | 12.9–28.1 | 10.3–21.8 |
| Isobutane mass flow rate (kg·s−1) | 15.6–50.2 | 14.8–43 | 13.9–37.4 | 13–32.8 | 12.5–27.1 | 12.8–27.1 |
| Gross power (kW) | 1000 | 1000 | 1000 | 1000 | 1000 | 1000 |
| Net efficiency (%) | 5.1–13.9 | 5.9–14.5 | 6.7–15.2 | 7.6–16 | 8.8–18.1 | 8.8–20.6 |
After determining the optimum thermodynamic cycle conditions, the components were sized. The size of the rotating components (i.e., feed-pump, turbine) was derived using the thermodynamic parameters. The heat exchangers were sized as follows.
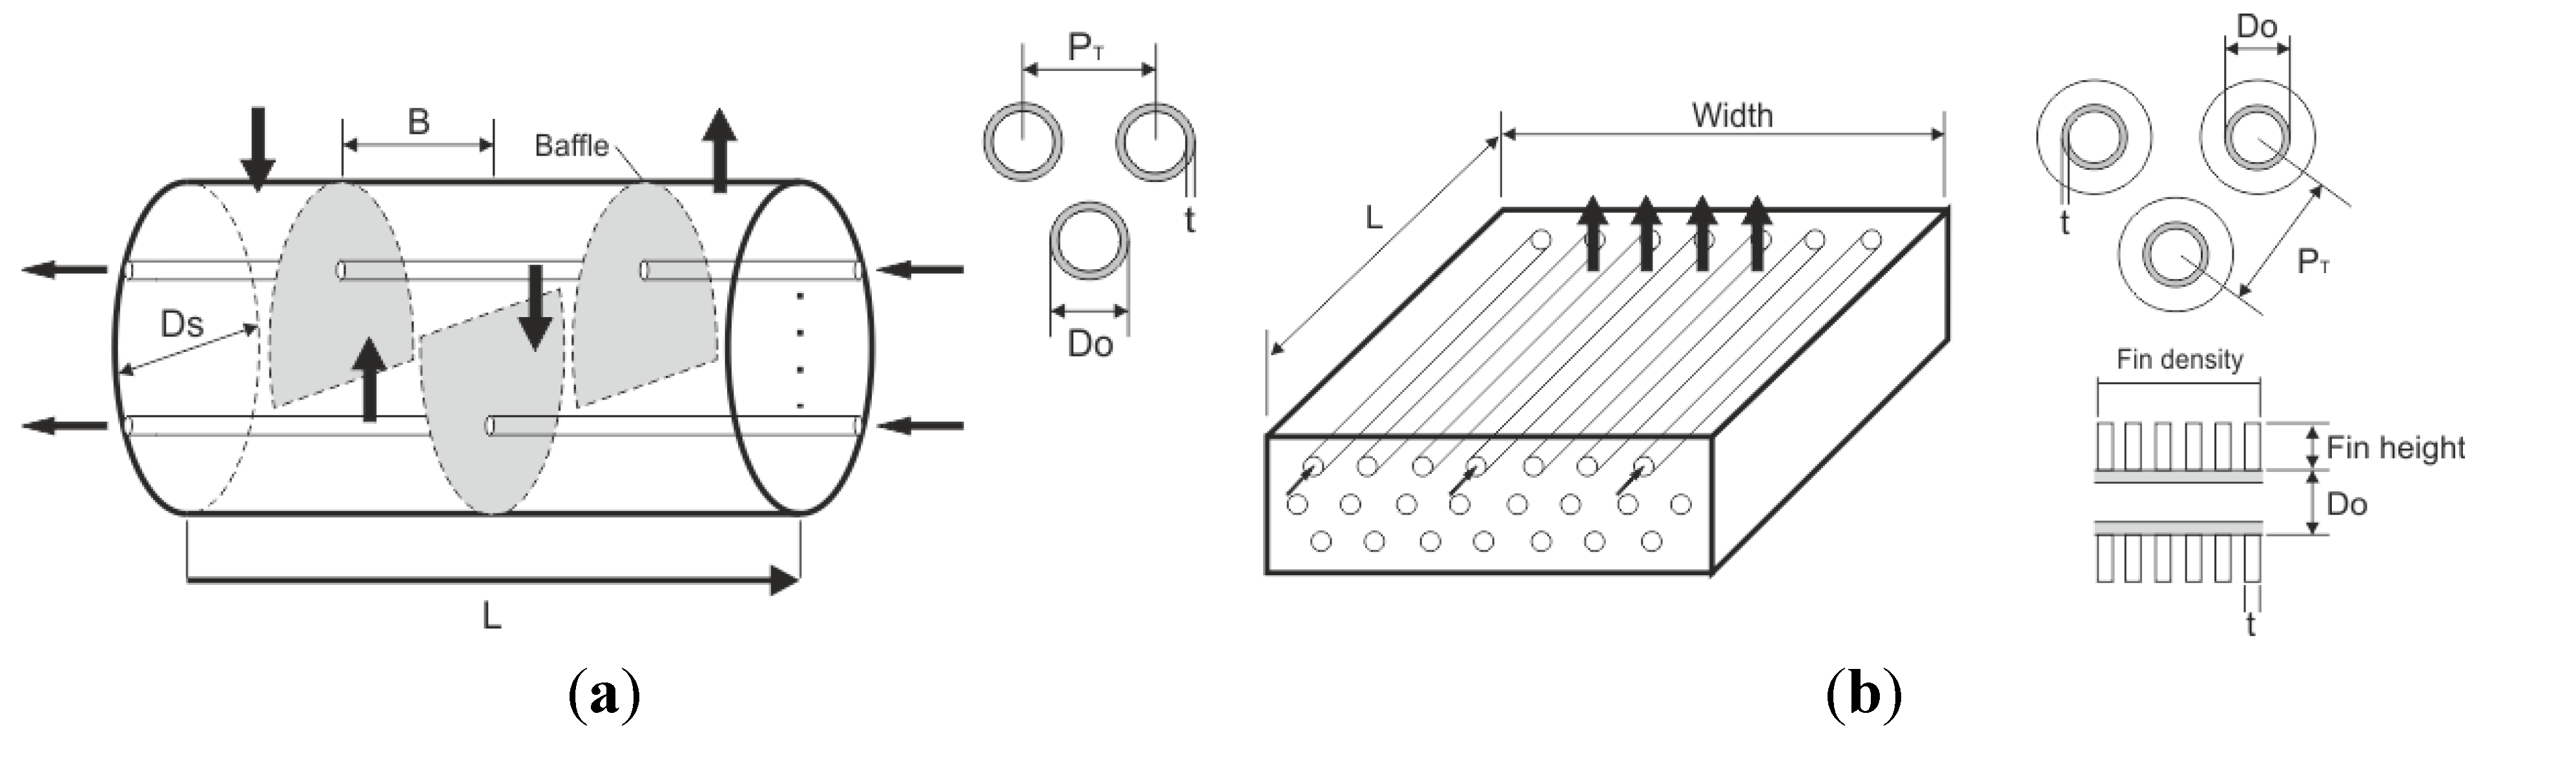
Evaporator: Evaporation was realized using two parallel evaporators, with one shell/one tube pass configuration. During very low load (<50%) operation, one of the evaporators was fully closed. Both evaporators were sized by determining the shell diameter, and the number of tubes was calculated using “tube counts” based on standardized design parameters described in
Table 1. The baffle-spacing was constrained below the shell diameter and maximum-spacing in order to avoid instability caused by vibration. After calculating overall heat transfer coefficients and the total heat transfer area, tube length was computed. By setting the allowable pressure drop on the shell side, the optimum design (or equivalently, shell diameter) with smallest area was selected. This design procedure was also applied to the recuperator.
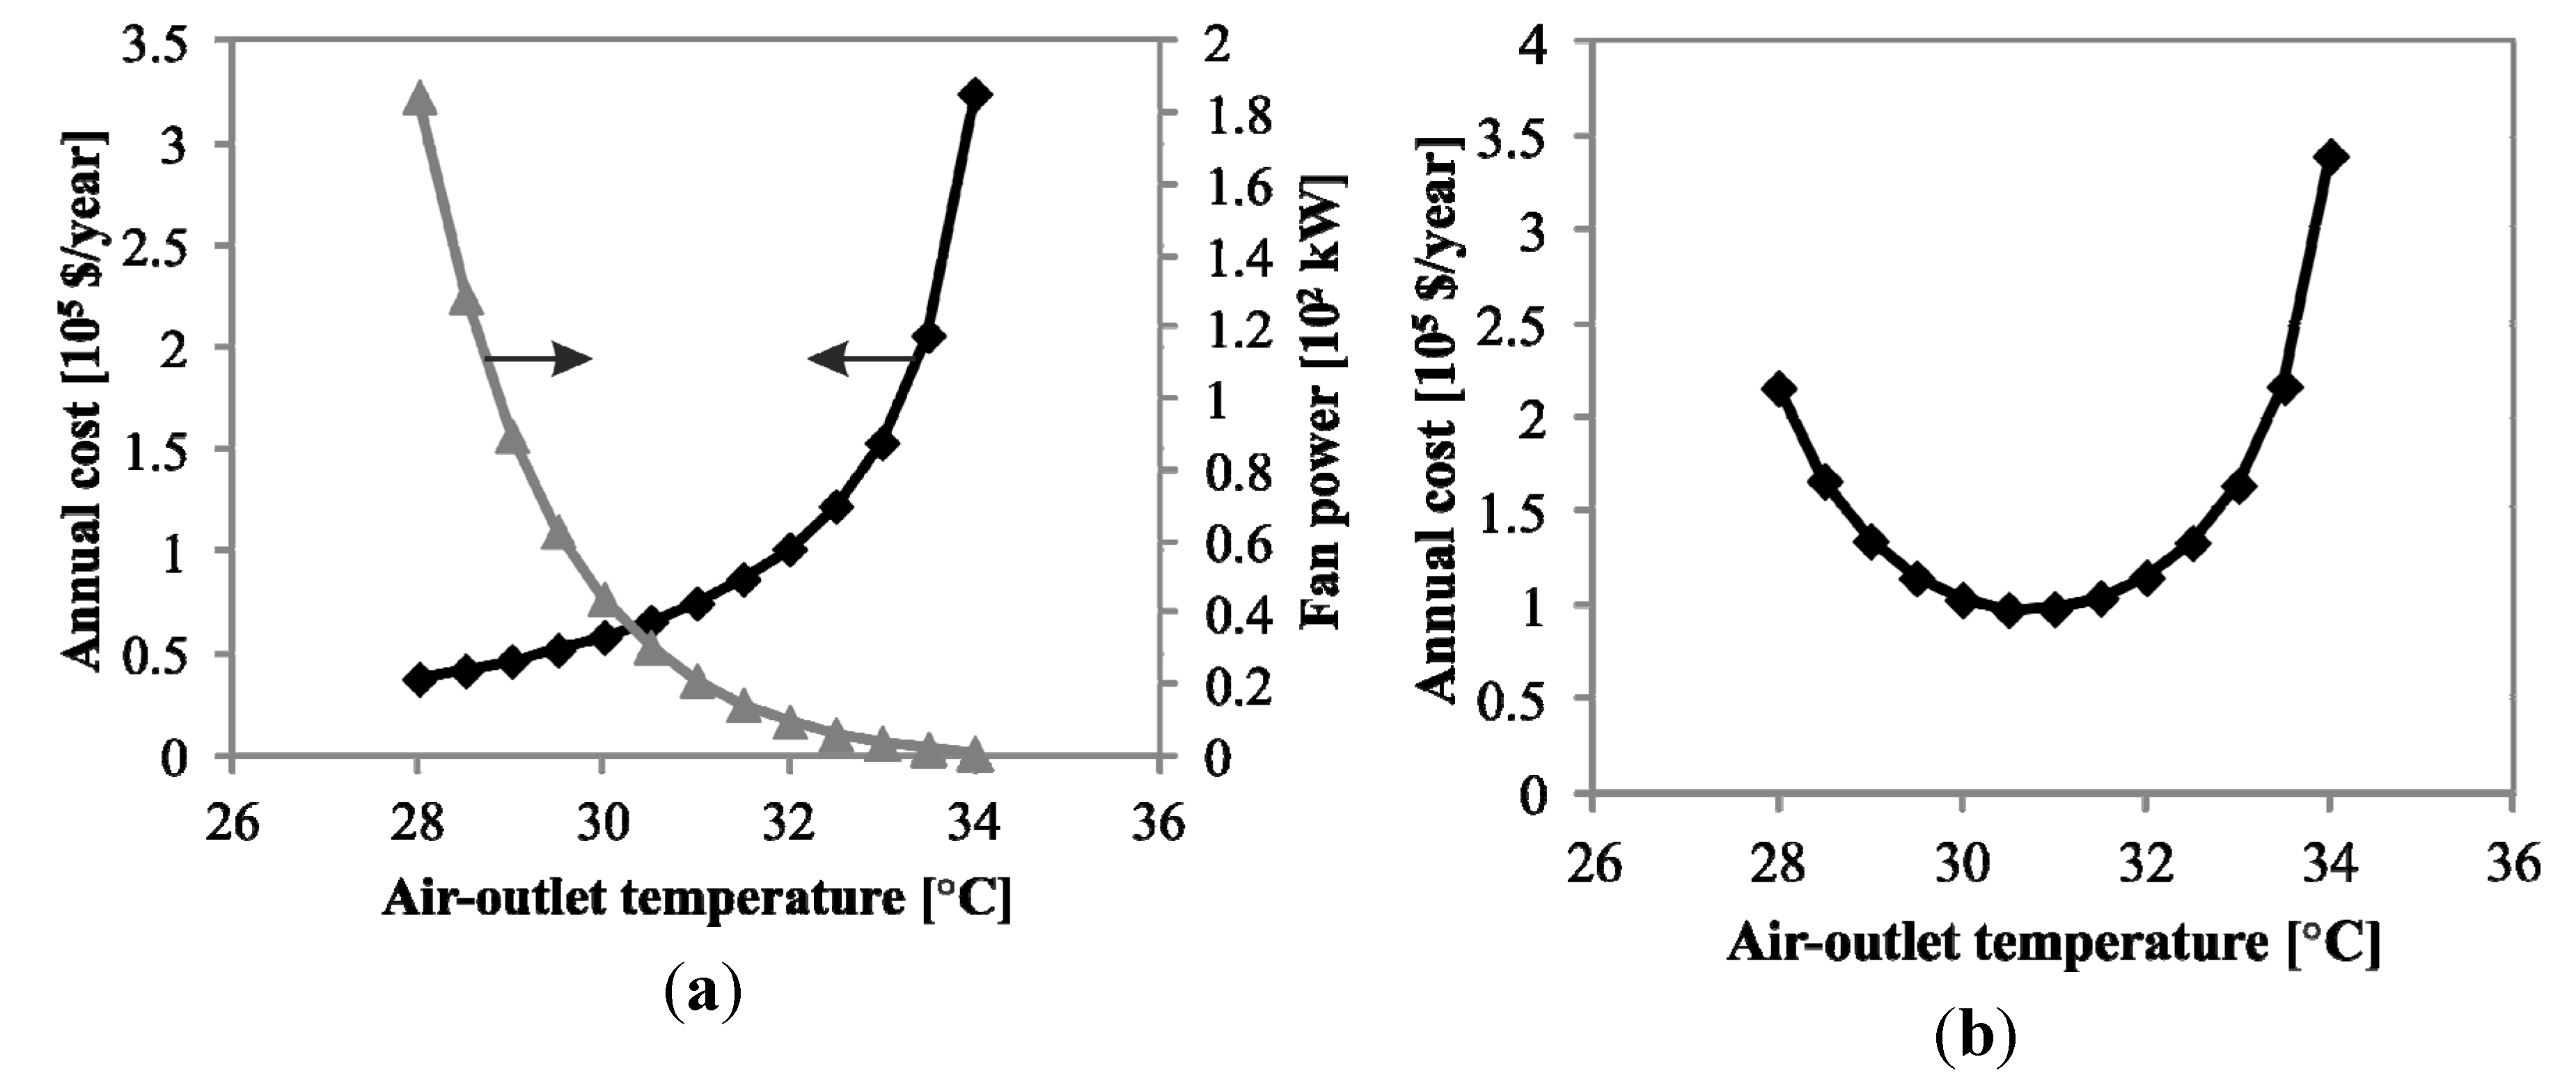
Condenser: An important preliminary step in the condenser design process is outlet air temperature. This parameter has a major effect on exchanger economics [
12]. Increasing the outlet air temperature reduces the amount of air required, which reduces the fan power and, therefore, operating cost. However, it also reduces the air-side heat-transfer coefficient and the mean temperature difference in the exchanger, which increases the size of the unit and, therefore, the capital cost. Consequently, optimization with respect to outlet air temperature (or equivalently, air flow rate) was considered an important aspect of air-cooled condenser design.
The optimum condenser air-outlet temperature (or equivalently, pinch-point) was calculated by minimizing the annual cost function. First derivative of this function with respect to air-outlet temperature determines the minimum annual cost. It can be written as follows:
Air-cooled heat exchanger investment cost
Ccd and fan investment cost
CF are described in
Table 3. The annualization factor,
CRF (Capital Recovery Factor) is defined as:
Heat transfer coefficient and pressure drop were computed from the ratio of design mass flow rate to the reference, which was mass flow rate at air velocity of 3.5 m·s
−1, as recommended in the literature [
12]. The maintenance cost was assumed to be 1% of the fin/tube heat exchangers cost and 3% of fan-motor cost [
22].
CF (capacity Factor) of 0.7,
y of 30 years,
i of 12%, and electricity price
Cel of 0.15 $·kWh
−1 were assumed.
Increasing the outlet air temperature increases heat transfer area required and conversely, reduces fan power consumption, as shown in
Figure 6a. This trade-off resulted in an optimum annual cost of 130-20 (
Tg0-
Ta0) at air-outlet temperature of 30.4 °C, approximately 10 K above the inlet air temperature (
Figure 6b). Once the optimum air-outlet temperature was established, the heat transfer area (or equivalently, number of cells) and fan capacity were determined.
Table 3.
Component cost as function of size.
Table 3.
Component cost as function of size.
| Component | Cost correlation | Reference |
|---|
| Evaporator | (Carbon-shell/Stainless-tube) | [22] |
| Recuperator | (Carbon-shell/Carbon-tube) | [22] |
| Air-cooled condensers | | [23] |
| Fans | | [23] |
| Feed-pump | | [24] |
| Turbine + generator | | [25] |
| Labor | | - |
Figure 6.
Size optimization based on annual cost of condensers at 130-20 (Tg0-Ta0) design-point.
Figure 6.
Size optimization based on annual cost of condensers at 130-20 (Tg0-Ta0) design-point.
4.2. Off-Design Mapping
The off-design performance of the plant may be assessed using the Second Law of thermodynamics by comparing the actual net-power output to the maximum theoretical power that could be produced (energy) from the given geothermal fluid. This involves determining the energy-rate carried into the plant with the incoming geofluid [
10]. In order to proportionally evaluate the off-design performance of each design-point, the geofluid mass flow rate at off-design conditions is computed using constant energy rate of 2000 kW at ISO standard ambient temperature of 15 °C:
In order to obtain optimal operating point under off-design conditions, a three-variable control strategy was used. First, evaporation pressure was controlled by the turbine nozzle-opening μ
T. Second, superheating/turbine inlet temperature was controlled by pump-speed
np (isobutane mass flow rate), and third, condensation temperature by the fan-speed
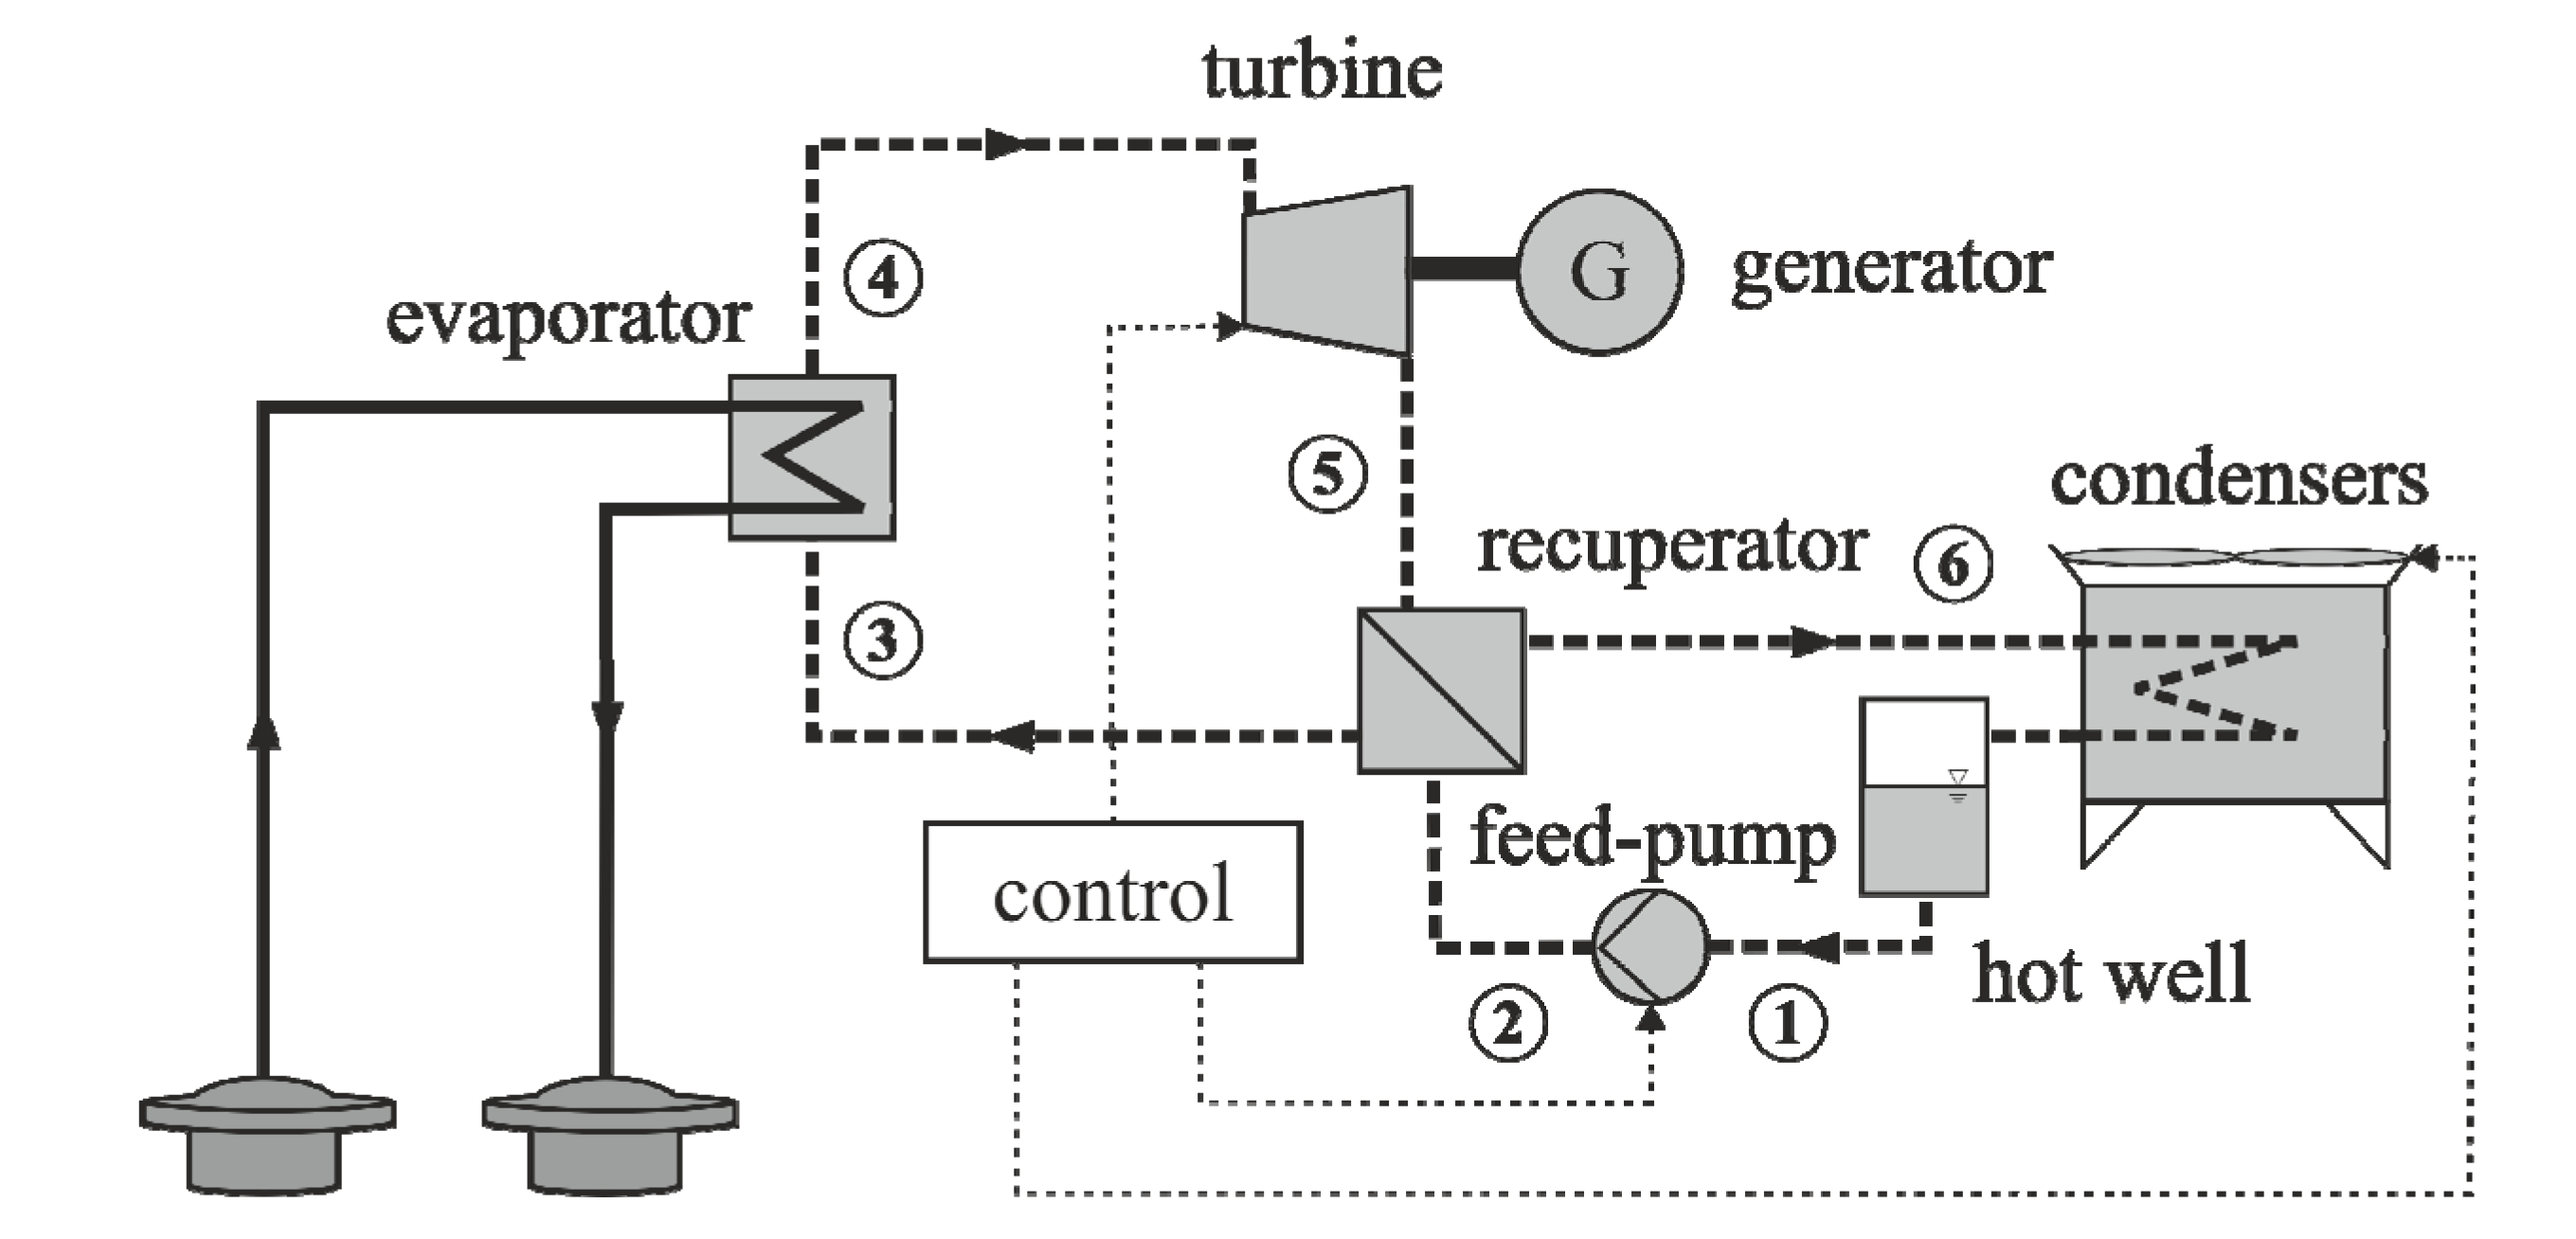
nF (air volumetric flow rate). Constant sub-cooling was imposed by making use of the static pressure head between the pump and the liquid hot-well (
Figure 1). Using this control strategy for a modular ORC system, the net power output was maximized while keeping the injection temperature above scaling temperature to avoid scaling, which is described as:
Scaling temperature is a site-specific problem. It depends on the chemical composition of the geothermal fluid most commonly silica and calcite, and temperature and pressure of the fluid. If the injection temperature of the geofluid falls below this temperature, there is the risk that scales might form in the heat exchanger or the piping system. A minimum bound of 70 °C was selected for this study, based on several works for mid-enthalpy geothermal resources [
2,
3,
26].
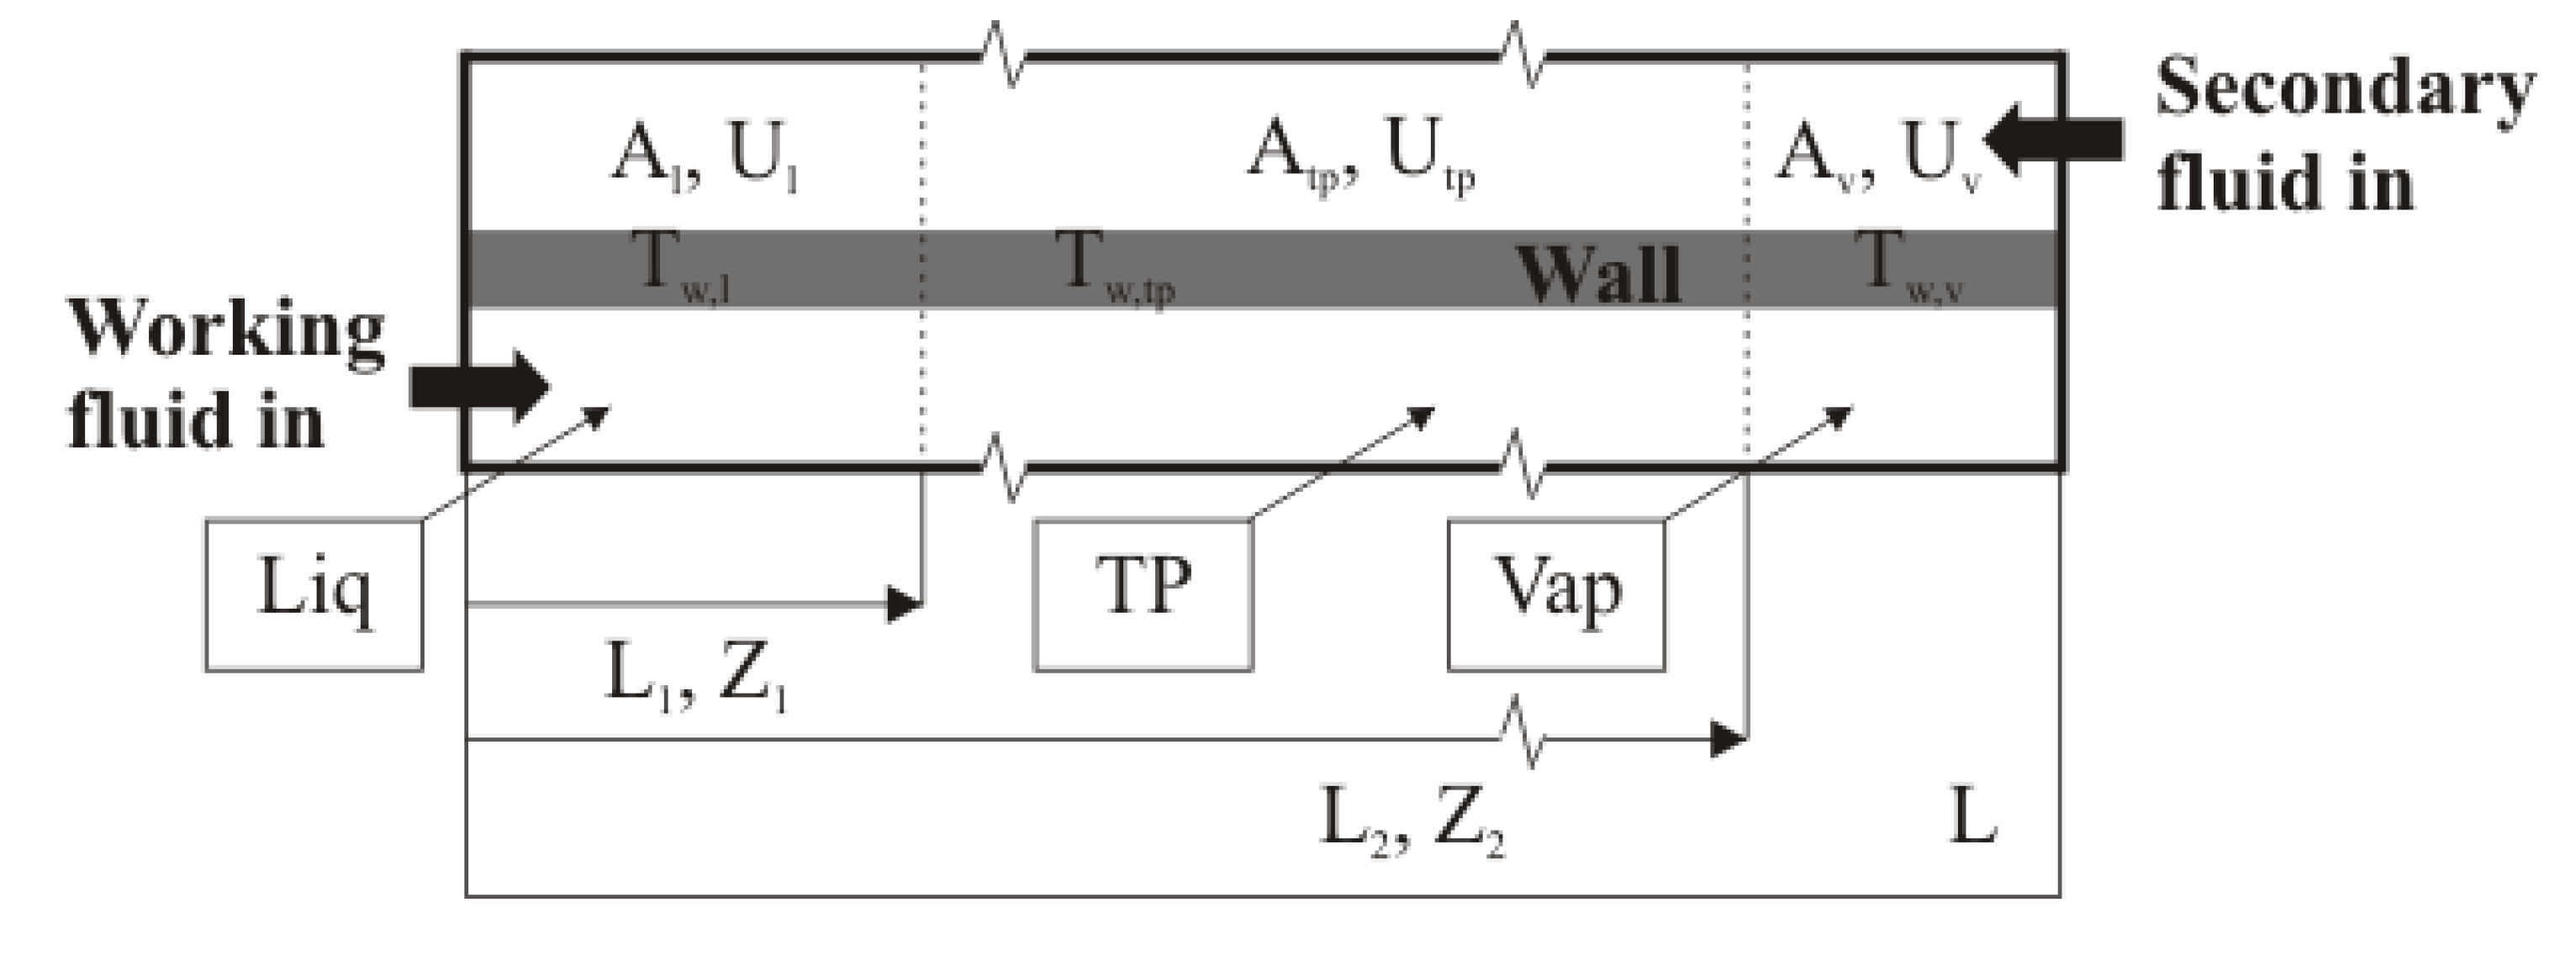
The off-design simulation procedure was realized using a set of three heat balance equations, which were solved by using the Trust-Dogleg Region solver. The heat balance equations are:
Where
f1 was determined using the three-zone recuperator model,
f2 the evaporator model, and
f3 the condenser model. Pressure drop in the evaporator was minimized to maintain evaporation temperature drop below 5 K. The equations were solved for given operation parameters to simulate the power-cycle. In order to find the optimum operation parameters for each operating condition, CMA-ES was implemented [
27].
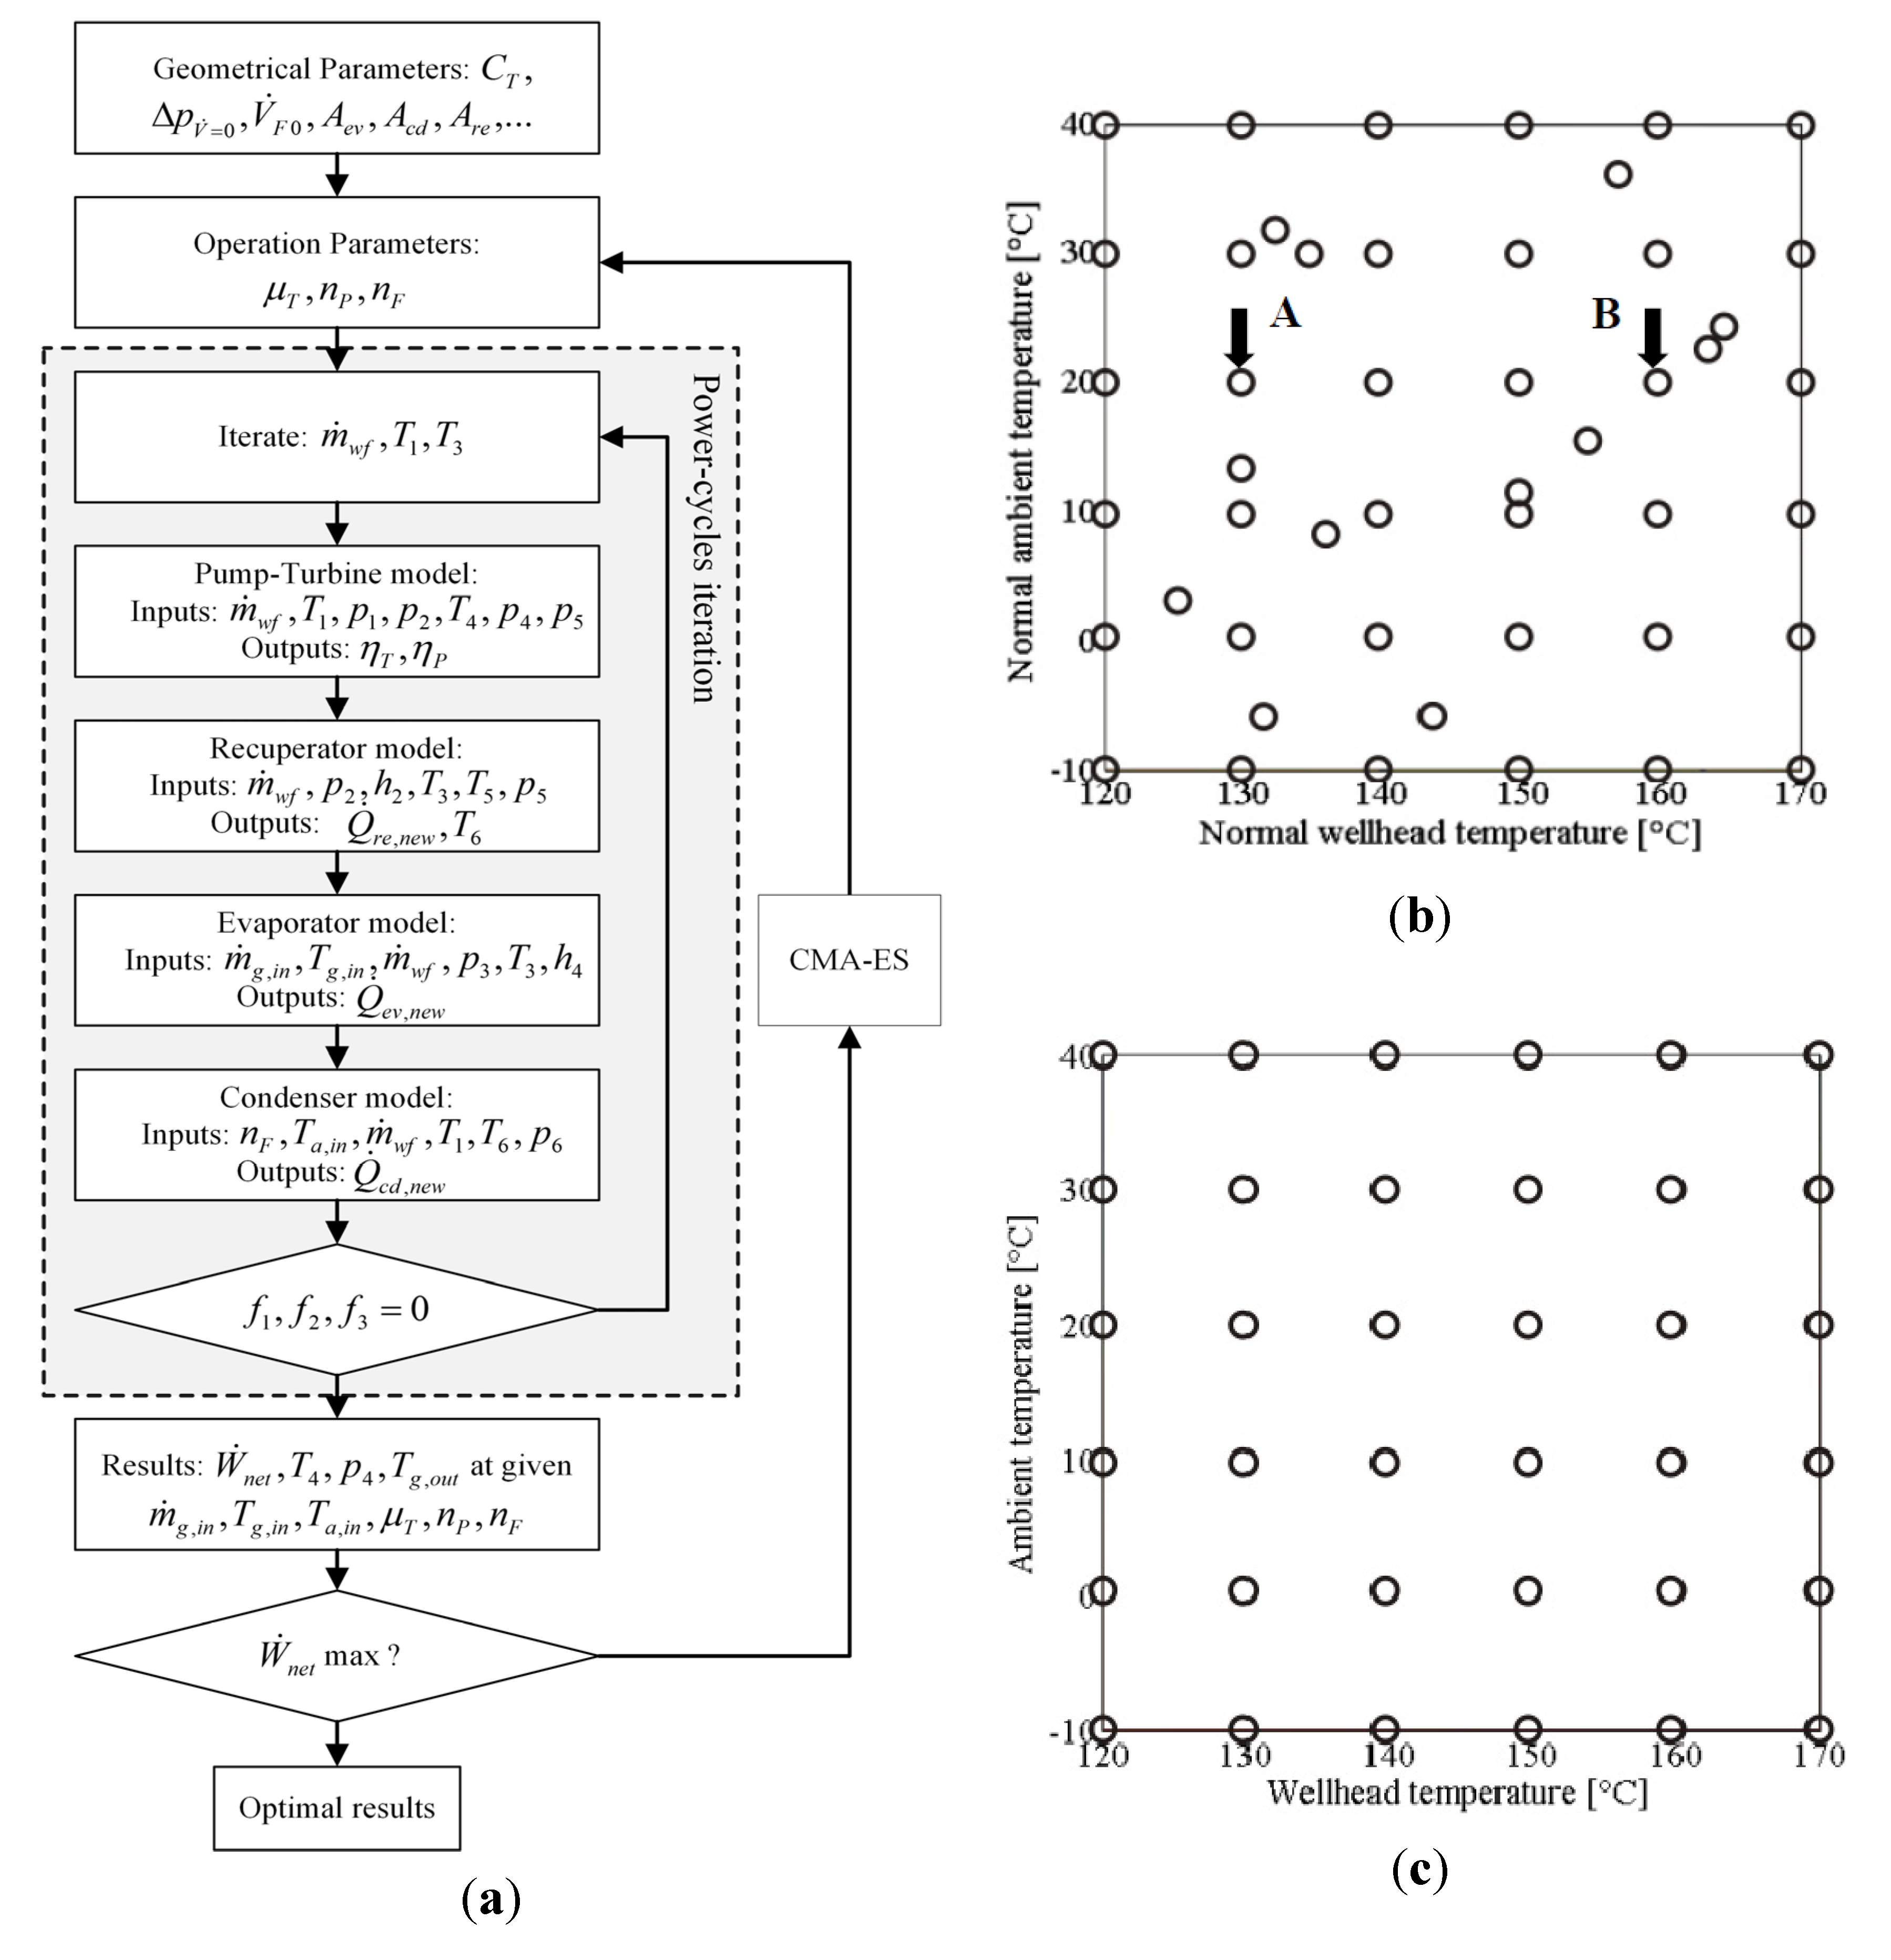
After sizing the components for a design-point, the control variables turbine nozzle, pump and fan rotational speed are optimized to achieve maximum net power output during off-design operating conditions (
Figure 7a). The system is assumed to be steady-state for the cycle simulation. The net power output of the plant at 36 off-design wellhead and ambient temperatures (
Figure 7c) was evaluated. Gridfit algorithm [
28] was then used to interpolate the profiles to produce a 2-D net power output surface contour, as shown in
Figure 8.
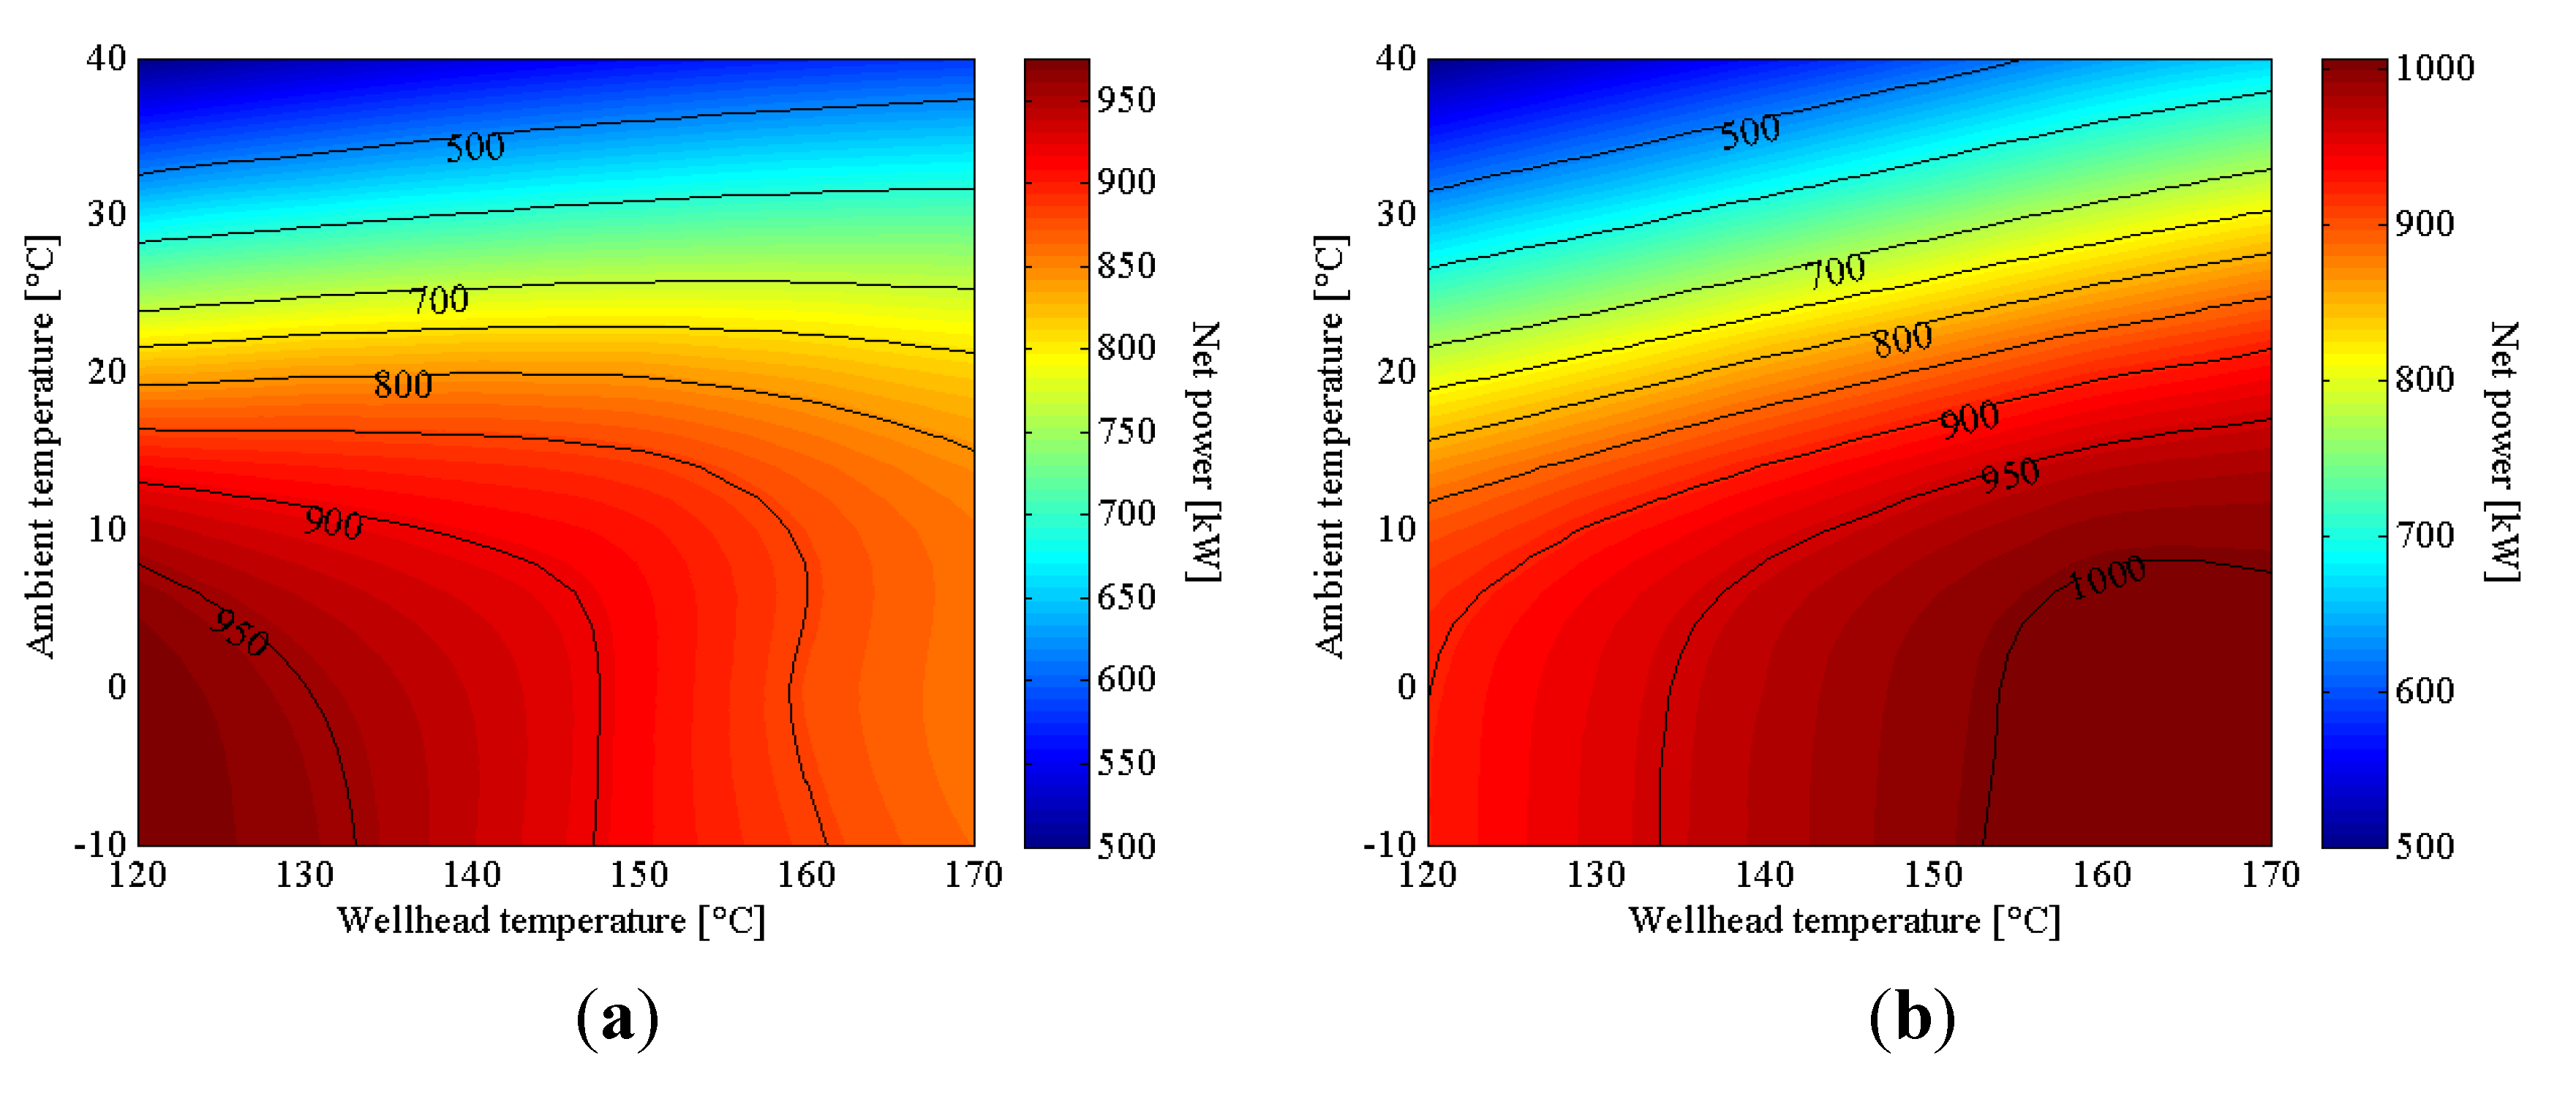
Both design points had constant exergy input, which translated to higher geofluid mass flow rate at lower wellhead temperatures, as previously described in Equation (20). The maximum net power output (978 kW) occurred at
Tg,in = 120 °C,
Ta,in = −10 °C for 130-20 (Point A,
Figure 7b). While maximum net power output (1025 kW) occurred at
Tg,in = 160 °C,
Ta,in = −10 °C for 160-20 (Point B,
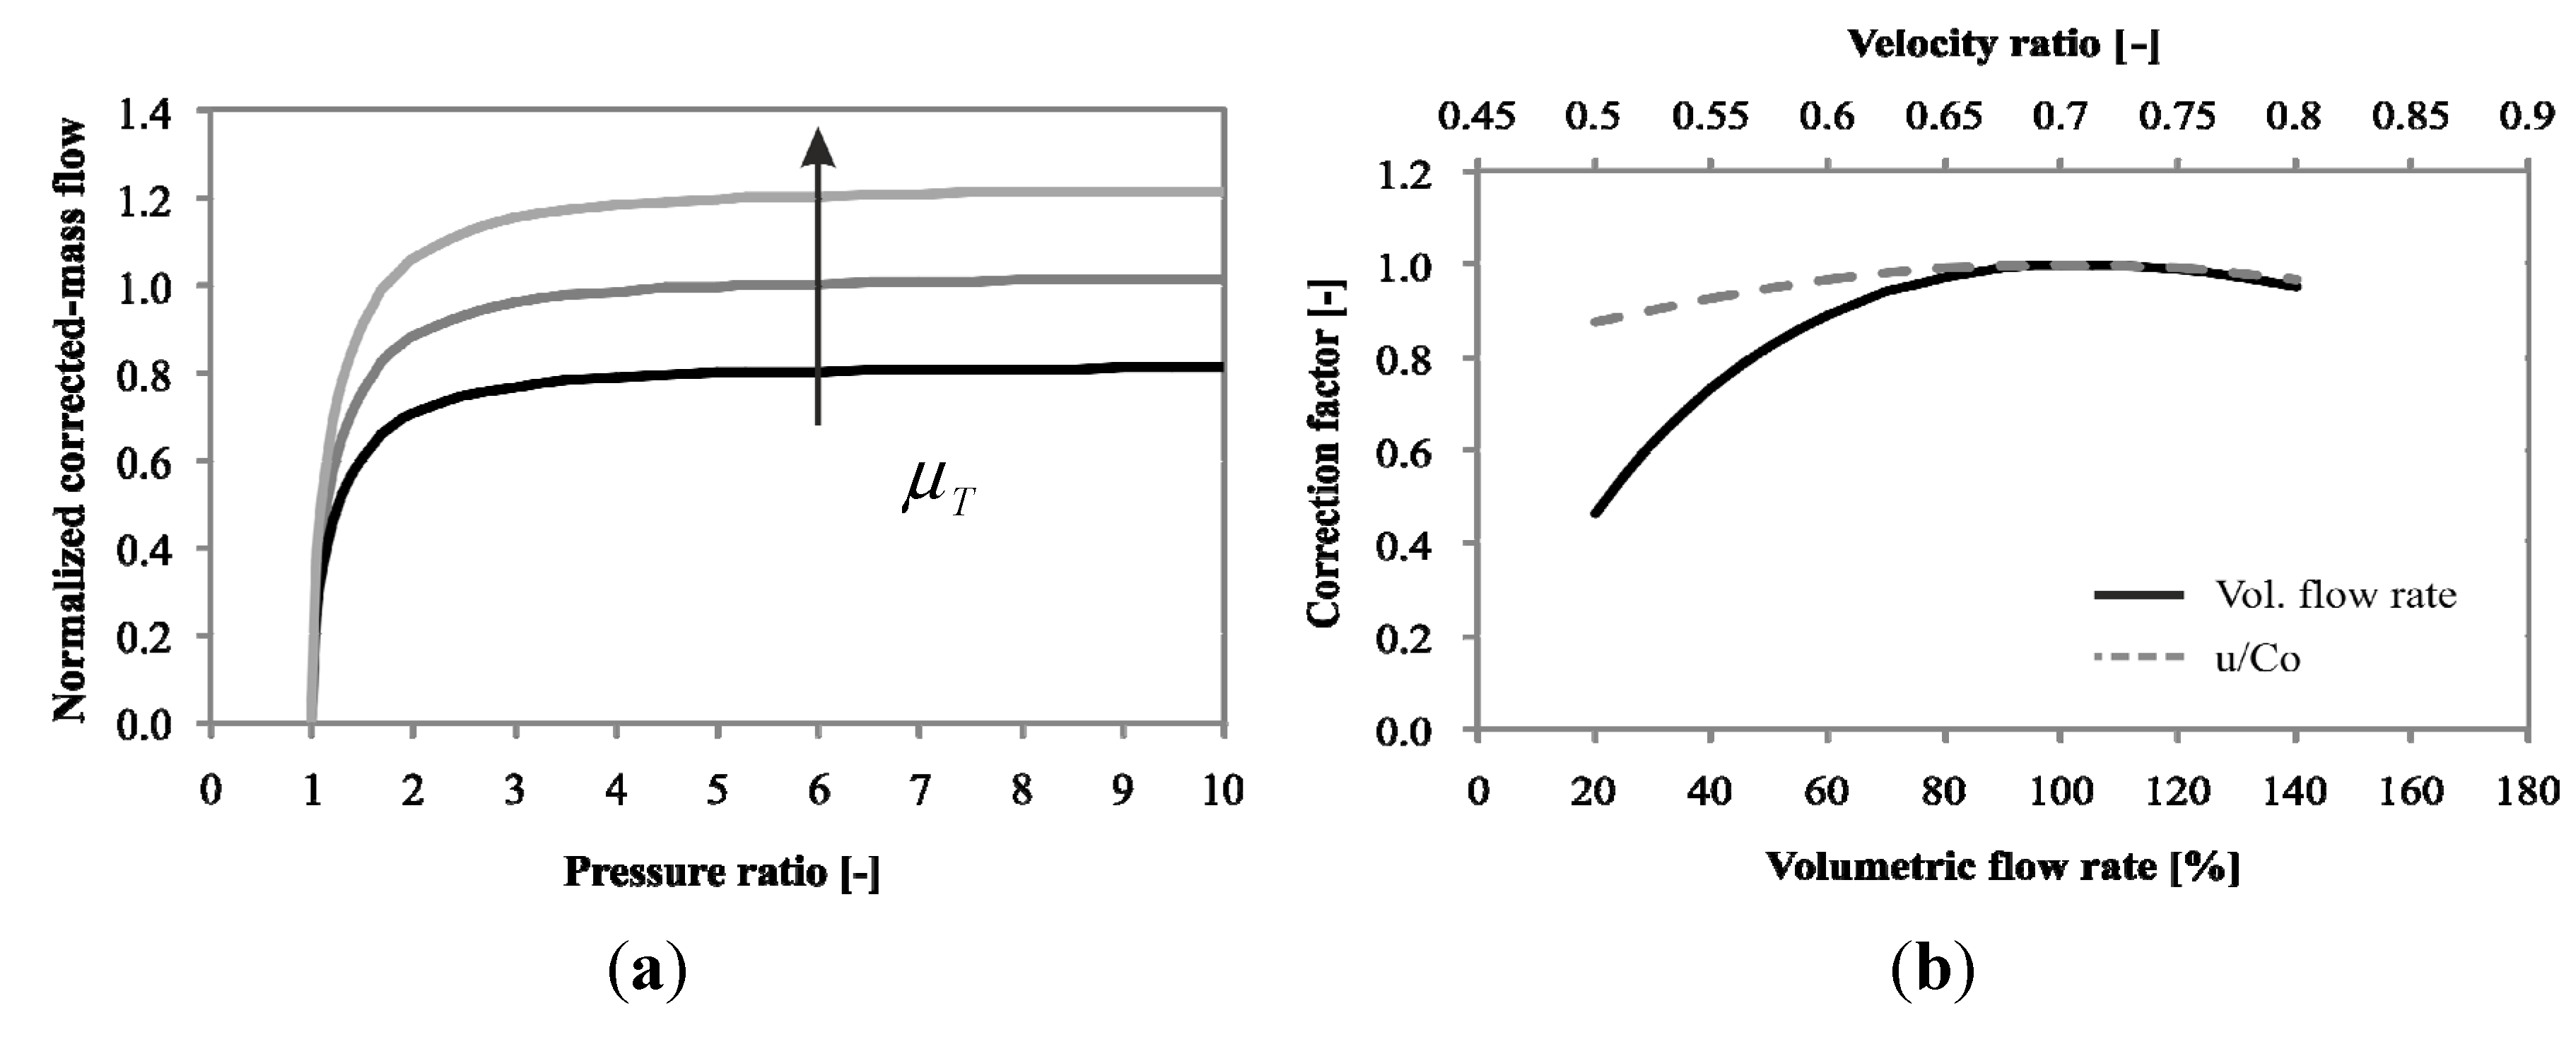
Figure 7b). It can be observed contradictory net power-output trend between the two design points. For 130-20, by increase of geofluid temperature, the net power output decreases, especially at lower ambient temperature. In contrary, for 160-20, the net power output showed an opposite trend. This was affected mainly on the turbine isentropic efficiency characteristic at off-design. The nominal (design) isentropic enthalpy drop was lower and the nominal volumetric flow rate was higher for 130-20. Hence, if the plant was operated at higher wellhead temperature which has higher enthalpy drop and lower flow rate, the turbine isentropic efficiency would steeply deteriorated (see
Figure 5b).
It is also important to note the different net-power dependencies on ambient temperature. When investigating at a constant Tg,in at the optimum point, the net power output decreased by 65.1% for 130-20 and 44.5% for 160-20 between −10 °C and 40 °C.
Figure 7.
(a) Off-design optimization procedure for a design-point (Tg0-Ta0) and operating condition (,Tg,in, Ta,in); (b) Design-point grid; and (c) Off-design grid.
Figure 7.
(a) Off-design optimization procedure for a design-point (Tg0-Ta0) and operating condition (,Tg,in, Ta,in); (b) Design-point grid; and (c) Off-design grid.
Figure 8.
Off-design maps of net power output for (a) 130-20; (b) 160-20.
Figure 8.
Off-design maps of net power output for (a) 130-20; (b) 160-20.
4.3. Annual Simulation and Thermo-Economic Selection
The system is assumed to be at steady-state for the annual simulations, and the heat loss in each component is neglected. The cycle performance is calculated in each time step of 1 h. The steady-state approximation is considered to be reasonably accurate since ambient temperature change is slower than the heat exchanger dynamics in the system. Thermal-economic optimization then was conducted to measure the trade-off between annual energy utilization and cost. Specific component costs are described in
Table 3; however, the cost correlations listed are not the exact economic values, since cost can vary strongly depending on market. Nonetheless, the values presented here used as a means to convert geometric design parameters into economic value, and correlations are taken from actual literatures [
22,
23,
24].
The turbine cost was taken from a model developed by Barber-Nichols [
25]. The correlations are corrected to current cost by using the Chemical Engineering Plant Cost Index (CEPCI) [
29]. The parameters,
A,
DF,
NF,
PF,
PT, and
PP in
Table 3 were determined directly from the sizing results. The turbine pitch (average wheel) diameter,
Dpitch, was derived from a universal functional relationship, for optimum stage efficiency [
30] as:
Two economic criteria were computed: specific investment cost (SIC) and mean cash flow (MCF). SIC is a typical parameter used in thermal-economic optimization, and is defined as:
where
is mean annual net power output calculated as the averaged sum of annual energy production for each wellhead temperature (in kWh) divided by 7008 h. MCF measures the productivity of the power-plant, and is computed as:
where Revenue =
×
Cel and the three later terms are particularly annualized cost of electricity,
i.e., investment cost, annual operation and maintenance costs of the overall plant which are assumed to be 4% of the investment cost [
31], and well cost. Well cost accounted for the geofluid-pumping and drilling costs, which are arbitrary values dependent on site-specific characteristics. It was assumed a well cost equal to zero since it will only shift the MCF to a lower value, and result in an unchanged optimum design-point. The three climates temperate, tropical and dry—chosen for annual simulation were sampled from existing geothermal sites: Upper-Rhine Graben, Germany (temperate climate), Kamojang, Indonesia (tropical climate), and Birdsville, Australia (dry climate). The temperature distributions of each climate are shown in
Table 4.
Table 4.
Ambient temperature distribution of three climates during generic year.
Table 4.
Ambient temperature distribution of three climates during generic year.
| Temperature [°C] | Temperate climate (
Tav = 11.6 °C) | Tropical climate (
Tav = 19.9 °C) | Dry climate (
Tav = 25.1 °C) |
|---|
| Number of hours | % hours | Number of hours | % hours | Number of hours | % hours |
|---|
| −10 | 266 | 3.0 | 0 | 0 | 0 | 0 |
| 0 | 2438 | 27.8 | 0 | 0 | 17 | 0.2 |
| 10 | 2926 | 33.4 | 351 | 4.0 | 1195 | 13.6 |
| 20 | 2159 | 24.6 | 7934 | 90.6 | 3139 | 35.8 |
| 30 | 726 | 8.3 | 475 | 5.4 | 3154 | 36.0 |
| 40 | 245 | 2.8 | 0 | 0 | 1254 | 14.3 |
The annual energy production was calculated using the hourly variation of Ta.in at each site. This calculation only includes cost, which varies significantly according to the component size. The remaining costs, such as piping, instrumentation and working fluid, were excluded.
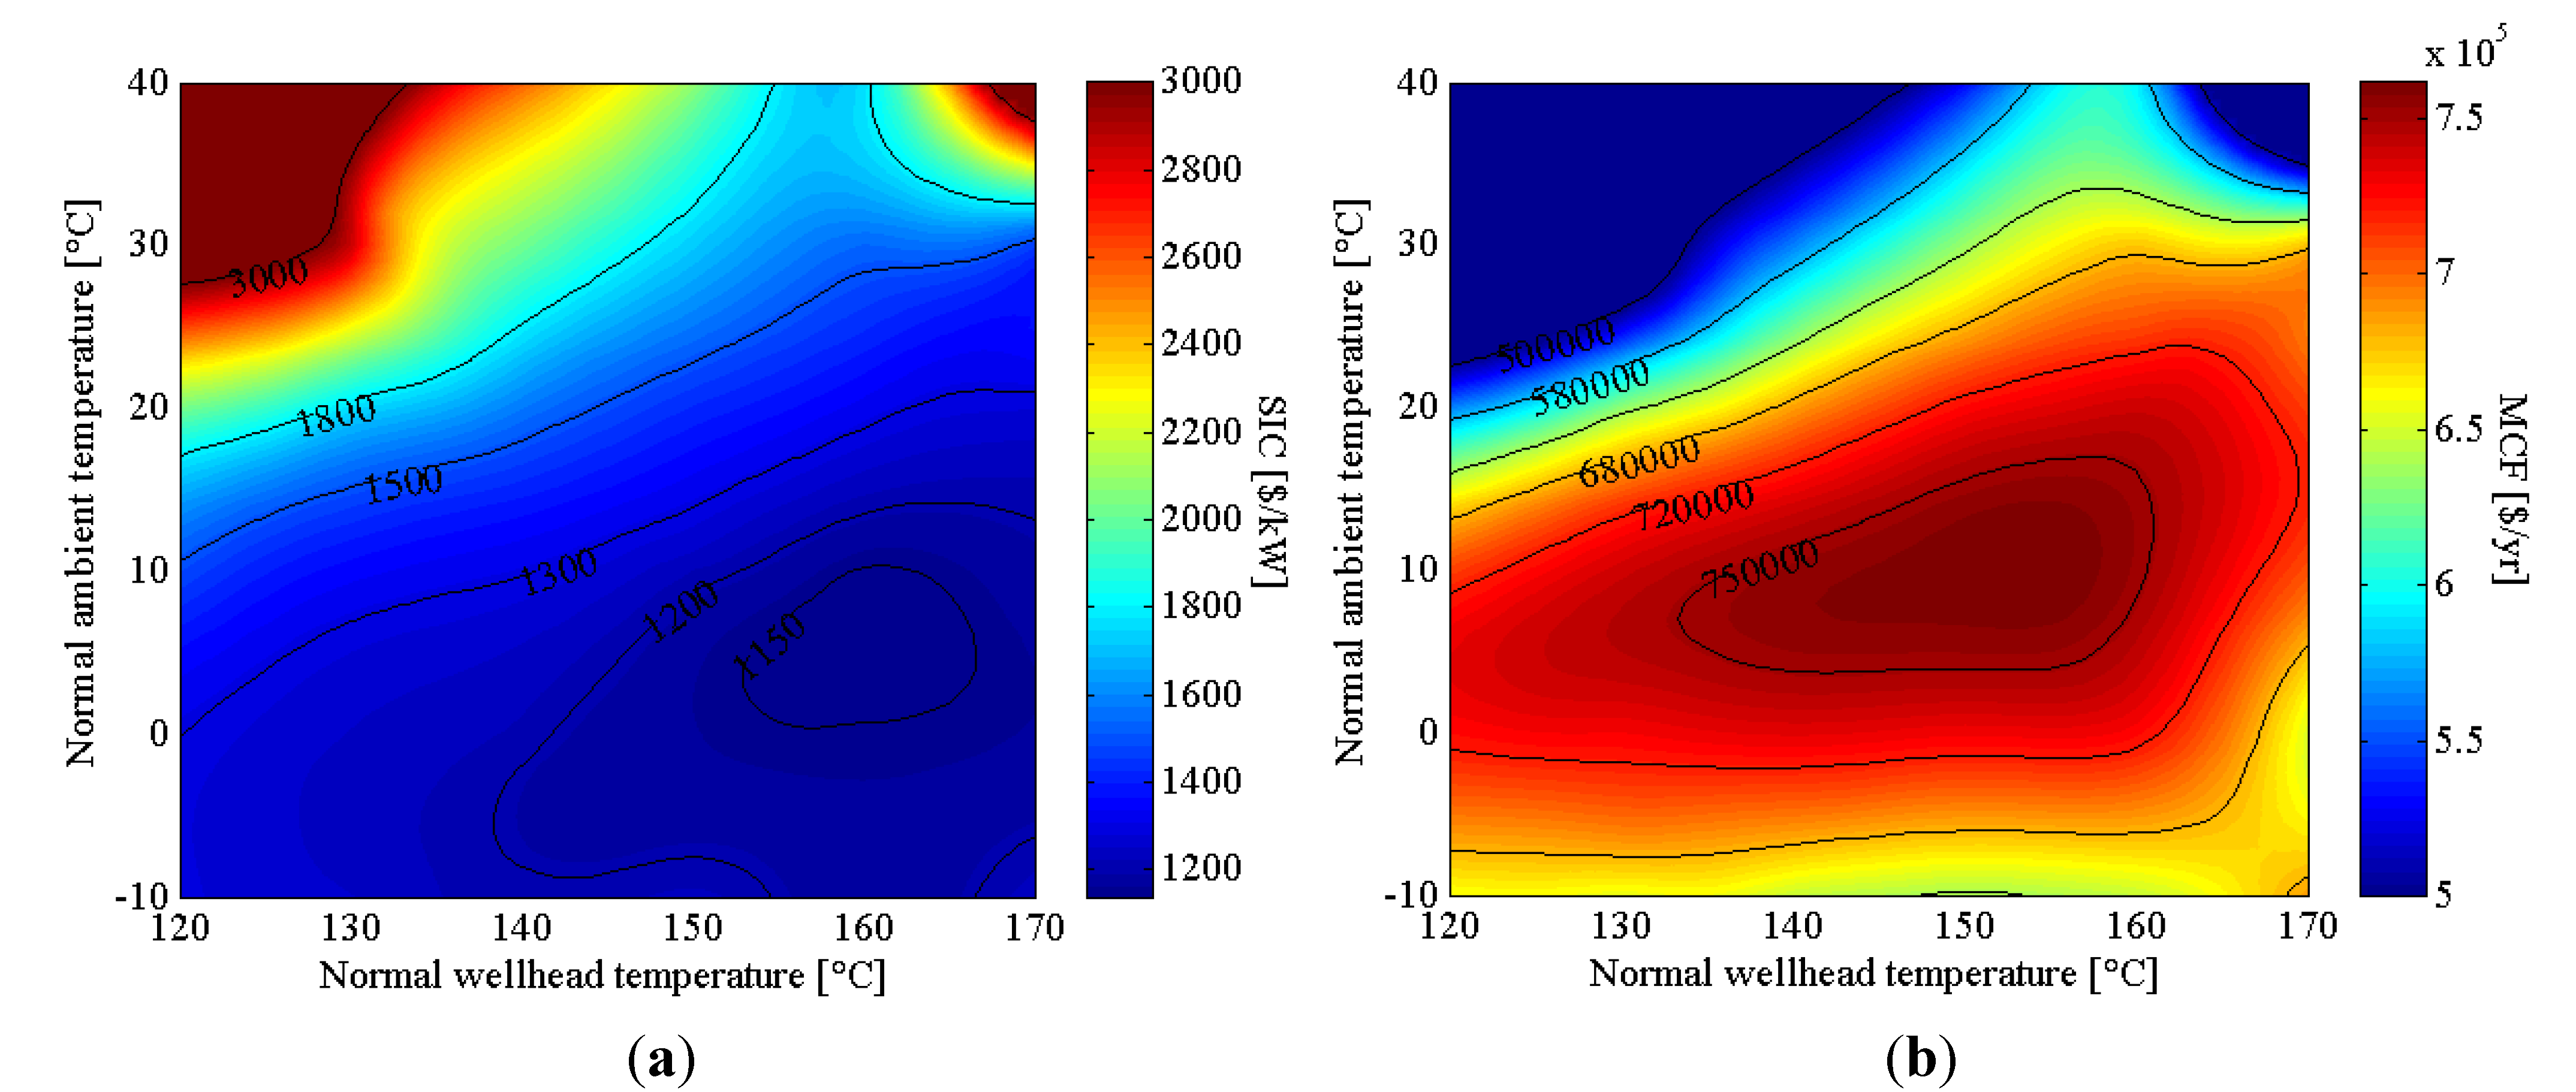
Under the conditions assumed for the temperate climate, the optimum points of SIC and MCF optimization was different (
Figure 9). SIC minimization yielded 160-6, with a cost value of 1133 $·kW
−1, while MCF maximization yielded 153-10, with a cost value of 761,350 $·year
−1. The SIC and MCF showed large variation, ranging from 1133 $·kW
−1 to 5296 $·kW
−1, and 92,224 $·kW
−1 to 761,350 $·kW
−1, respectively.
Figure 9.
Design-point based on minimizing SIC (a) and maximizing MCF (b) in temperate climate.
Figure 9.
Design-point based on minimizing SIC (a) and maximizing MCF (b) in temperate climate.
Comparing the two objective functions, SIC minimization resulted in values 5.1%–7.1% lower, relative to plants based on maximizing MCF. By maximizing MCF, values were 2.1%–10.8% higher compared to when SIC was minimized. The temperate climate had the lowest SIC minimum and highest MCF maximum, followed by the tropical and then the dry climate. The optimization results are reported in
Table 5. Using SIC minimization, the optimum normal wellhead temperature was constant at
Tg0 of 160 °C across the three climates, and optimum
Ta0 followed lower temperatures of 6 °C, 10 °C and 10 °C. While in MCF maximization, optimum
Tg0 was 153 °C, 163 °C and 163 °C, and
Ta0 followed average temperatures of 10 °C, 22 °C and 23 °C, respectively.
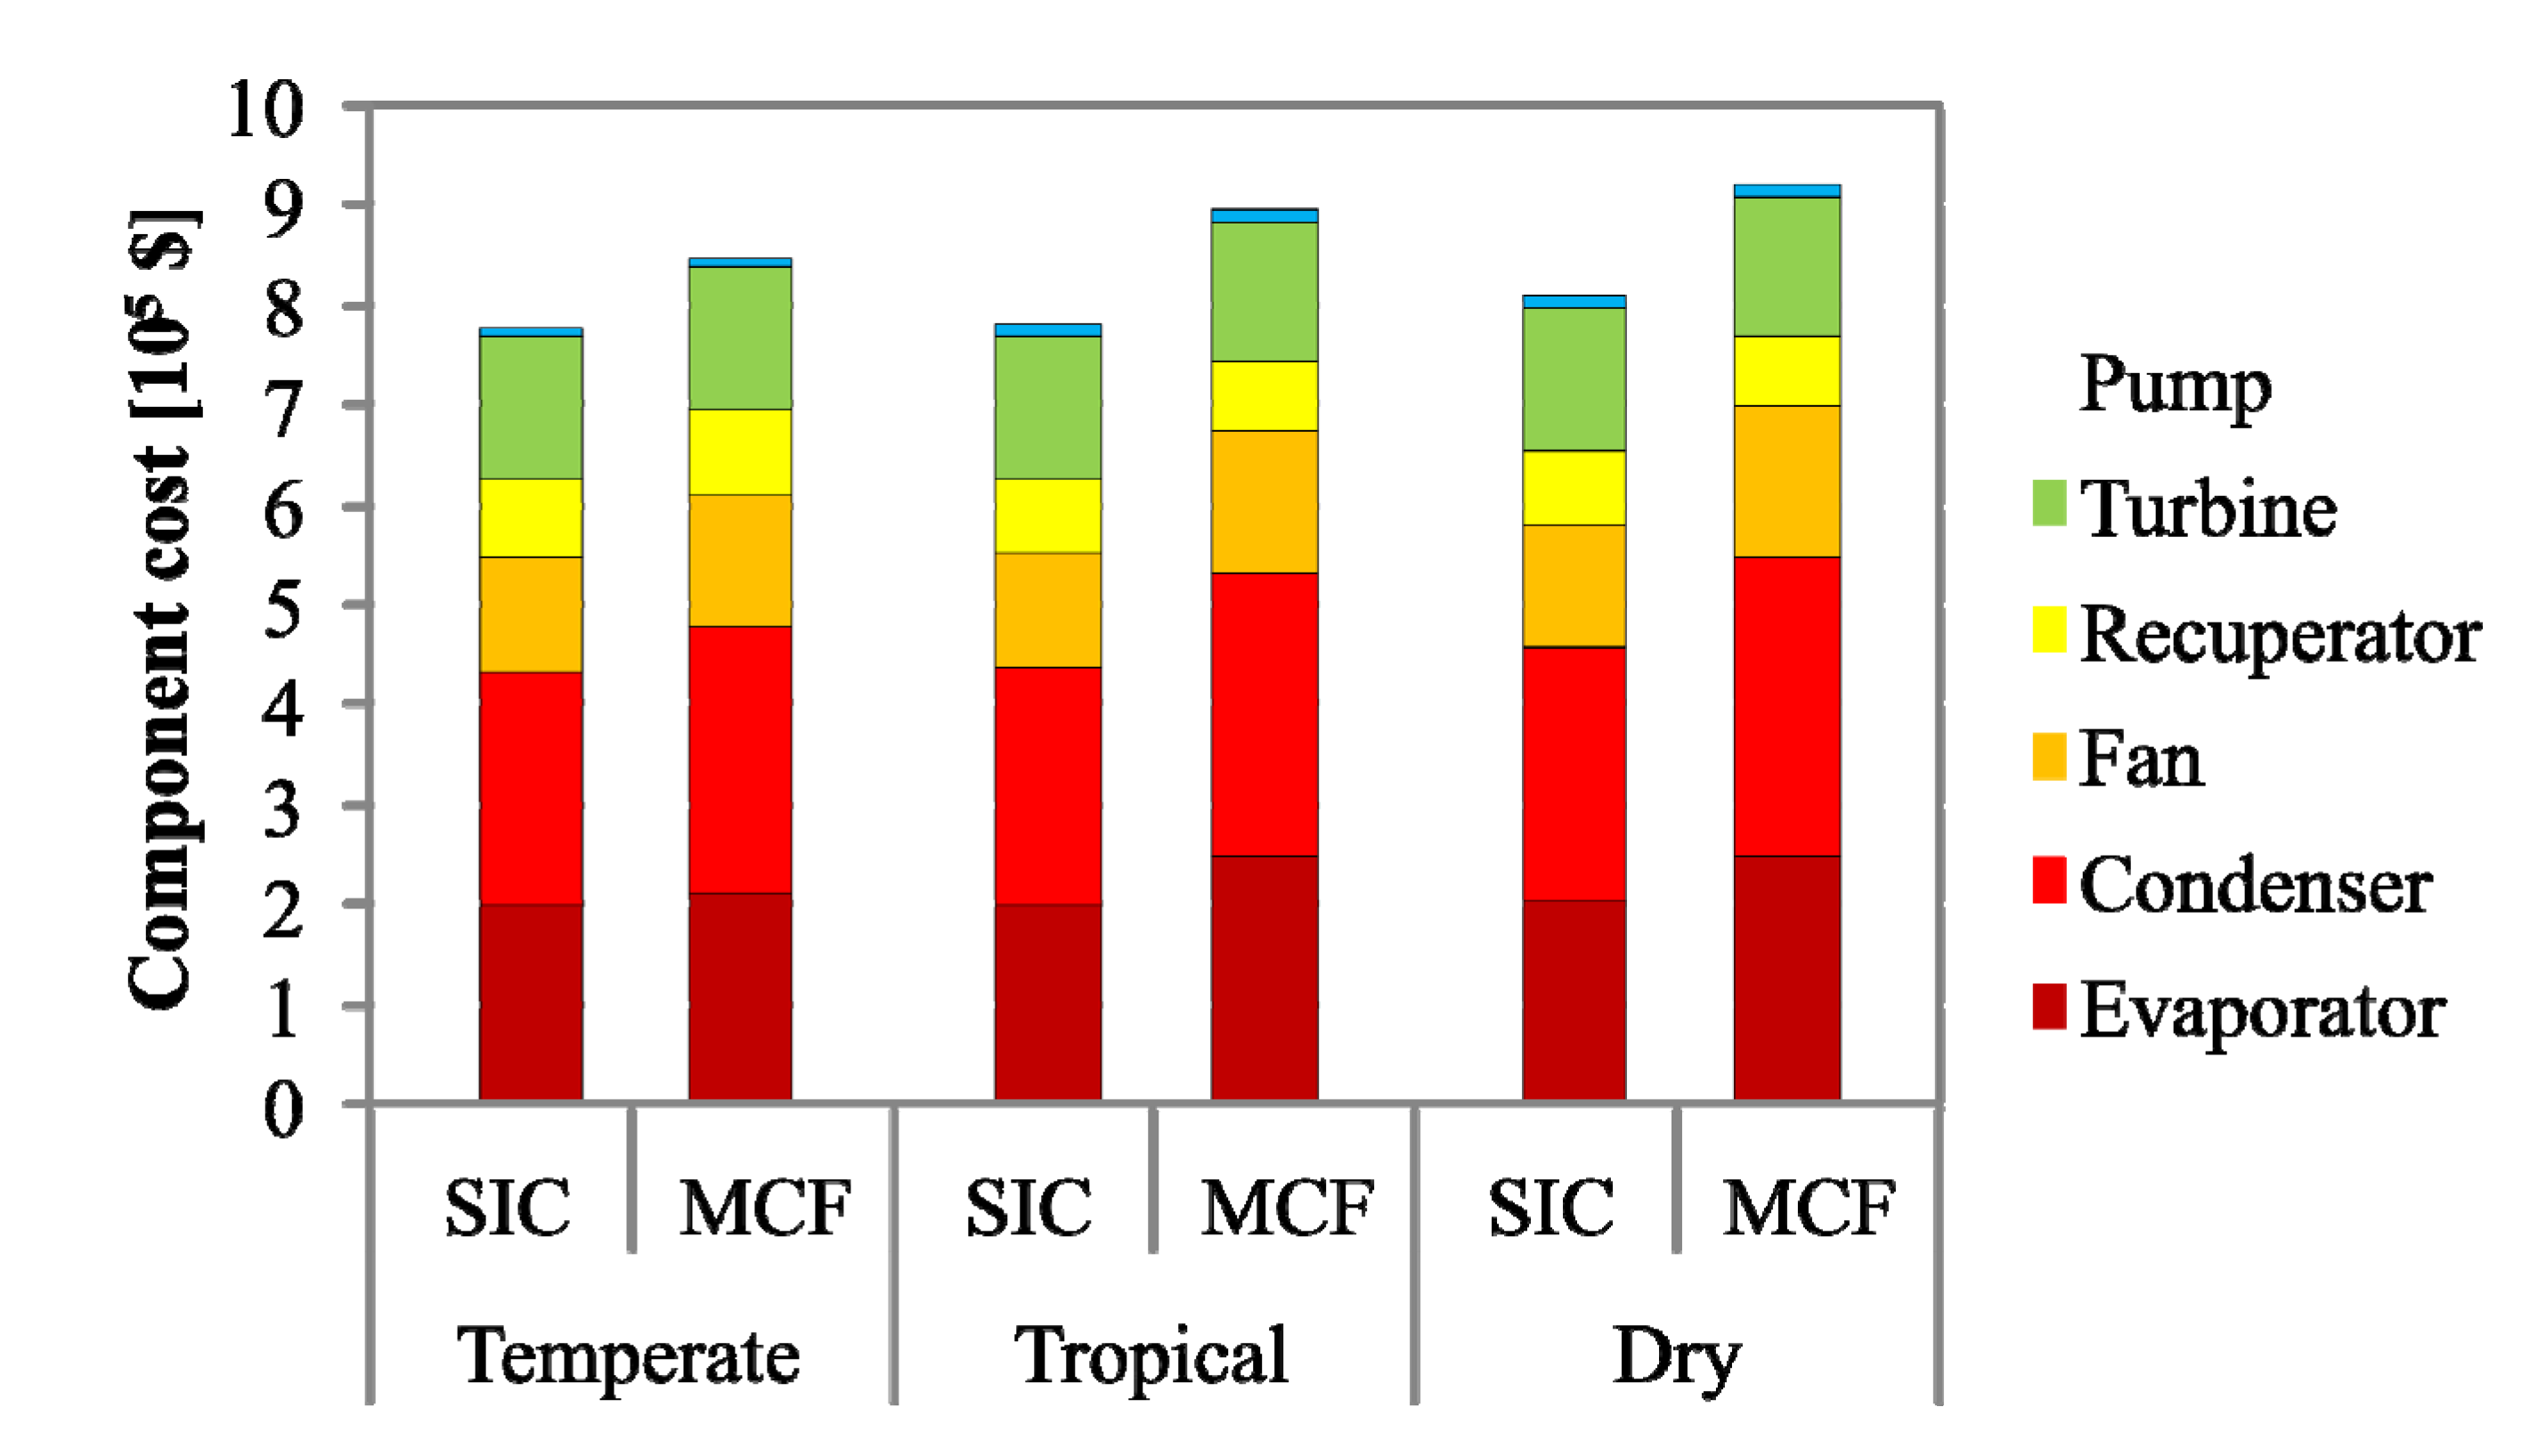
Figure 10 shows relative component costs among the three climates.
Table 5.
SIC and MCF for each optimal design-point and climate type.
Table 5.
SIC and MCF for each optimal design-point and climate type.
| Sizing | Design-point [°C] | SIC [$·kW−1] | MCF [$·year−1] |
|---|
| Tg0 | Ta0 |
|---|
| Temperate climate | | | | |
| SIC minimization | 160 | 6 | 1,133 | 745,770 |
| MCF maximization | 153 | 10 | 1,198 | 761,350 |
| Tropical climate | | | | |
| SIC minimization | 160 | 10 | 1,303 | 642,070 |
| MCF maximization | 163 | 22 | 1,403 | 683,120 |
| Dry climate | | | | |
| SIC minimization | 161 | 10 | 1,520 | 524,230 |
| MCF maximization | 163 | 23 | 1,601 | 580,800 |
Figure 10.
Relative component cost comparison between SIC and MCF optimization under three different climate types.
Figure 10.
Relative component cost comparison between SIC and MCF optimization under three different climate types.
SIC minimization resulted in a investment cost that was 8.2%–13% lower than plants designed using maximized MCF. The cooling-system cost (condenser heat exchangers, fans) dominated the total investment cost. For plants with minimized SIC, the cooling-system cost was 12.5%–16.7% lower than those designed using maximized MCF. In contrast, MCF maximization resulted in a higher mean annual net-power 3.4%–12.7%. This improvement was based on the optimal number of cells and fan capacity, which maintain low condensation pressure and, in turn, result in higher power.


