The Optimal Price Ratio of Typical Energy Sources in Beijing Based on the Computable General Equilibrium Model

Abstract
: In Beijing, China, the rational consumption of energy is affected by the insufficient linkage mechanism of the energy pricing system, the unreasonable price ratio and other issues. This paper combines the characteristics of Beijing's energy market, putting forward the society-economy equilibrium indicator R maximization taking into consideration the mitigation cost to determine a reasonable price ratio range. Based on the computable general equilibrium (CGE) model, and dividing four kinds of energy sources into three groups, the impact of price fluctuations of electricity and natural gas on the Gross Domestic Product (GDP), Consumer Price Index (CPI), energy consumption and CO2 and SO2 emissions can be simulated for various scenarios. On this basis, the integrated effects of electricity and natural gas price shocks on the Beijing economy and environment can be calculated. The results show that relative to the coal prices, the electricity and natural gas prices in Beijing are currently below reasonable levels; the solution to these unreasonable energy price ratios should begin by improving the energy pricing mechanism, through means such as the establishment of a sound dynamic adjustment mechanism between regulated prices and market prices. This provides a new idea for exploring the rationality of energy price ratios in imperfect competitive energy markets.1. Introduction
Beijing's resources are scarce. With the rapid development of the economy, Beijing's energy consumption is growing rapidly, and the environment is deteriorating. Beijing's economic and social development has been troubled by the energy resource problem, which is one of the most important factors. Over the years, although Beijing's energy price reform has achieved a certain degree of effectiveness, the reform process is slow and there are still many problems. A binding target—to decrease the carbon emission intensity by 18%—was promoted during Beijing's “12th Five-Year” period; a reasonable energy pricing policy is one of the keys to achieving this goal.
The energy price ratio, a proportional relationship of the prices among various forms of conventional energy, which can reflect the relative price relationship between different energies, is an important indicator with which to investigate the structure of energy prices [1]. Reasonable energy price ratios should balance economic, environmental and social factors, which not only can reflect the scarcity of energy and the cost of development and utilization, but also can consider the environmental abatement cost and the social affordability.
Currently, the coal and crude oil prices in Beijing are market-oriented, while the Government regulates the prices of secondary energy sources like electricity, gas and oil products at a relatively low level in order to control the price levels to ensure social stability [2]. This causes serious cost burdens and operating losses for the power plants and oil refineries in the middle stream. In the past two years, due to the continual rises in coal and oil prices, many power plants and refineries have decreased their output in order to reduce production costs, sometimes causing electricity and oil shortages [3]. Serious price conflicts now exist between various types of energy, especially between “market coal” and “planned power”.
In this context, it seems particularly important to try to discover the rational energy price ratios for different types of energy. Some studies have been done about energy price. Electricity price could be forecasted by wavelet transform method, linear Autoregressive Integrated Moving Average (ARIMA) method, nonlinear neural network method and Hybrid Principal Component Analysis Network method, and so on [4,5]. The Organization of Petroleum Exporting Countries (OPEC) plays an important role in the oil price [6] and oil and natural gas have a substation in North American and Southern Canada [7]. Furthermore, in China, the prices of coal and oil are highly correlated, but have no causal relationship [8–10]. The crude oil price in Japan, Scandinavia and Germany is non-stationary, while the electricity price is steady [11,12] and there is a long-run equilibrium relationship between the British oil price and the British gas price [13]. What is more, scholars and experts have studied the price ratio of electricity and coal [14,15], and those who have studied the price ratio of coal and electricity in the United States, Beijing and Shanghai have proposed that the price ratios of electricity and gas in Beijing and Shanghai are unreasonable, as the electricity prices are too low [16–18]. On the whole, these studies have only analyzed the correlation among the changes of several energy prices, while the evaluation of the energy price ratio standard has not been proposed directly.
Reference [19] conducted preliminary research on the energy price ratio. It pointed out that there are two methods to evaluate the reasonableness of an energy price ratio: the economy standard and the international standard. The economy standard is a method that firstly assumes that the necessary costs for each alternative energy source to complete a task are equal; then it introduces the corresponding energy consumption indicators; and finally a reasonable energy price ratio can be derived in reverse. The international standard is a basic form of balancing foreign and domestic energy prices, ensuring that the foreign and domestic energy prices remain roughly the same and that the domestic energy price ratios remain basically equal to the average international levels. Considering the use of the economy standard, it is necessary to find an “intermediary” that can consume coal, oil, gas, electricity and other energy sources simultaneously, but this can be relatively difficult. In addition, because the energy structure, energy consumption patterns and consumer price affordability vary in different countries or areas, therefore, Beijing's rational energy price ratio level cannot be fully reflected by the international standard. Thus, more research into the suitable standard of Beijing's rational energy price ratios needs to be carried out.
In the light of the above, based on the computable general equilibrium (CGE) model, this paper considers the rational price ratio of typical energy sources in Beijing under the standard for maximizing the equilibrium indicator of the economy and the environment. The remainder of this paper is organized as follows: Section 2 consists of a brief description of Beijing's energy pricing policy; Section 3 introduces the economy and society equilibrium indicator maximization model taking into consideration the migration cost; Section 4 presents the empirical analysis of Beijing's rational energy price ratio; and Section 5 presents the conclusion and policy recommendations.
2. Beijing's Energy Pricing Policy and an Optimized Price Ratio Model Based on CGE Model
2.1. Beijing's Energy Pricing Policy
The pricing methods for Beijing's major energy sources, such as coal, electric power, oil and natural gas, are different. Beijing's coal price has headed down the market road, while the prices of electricity, natural gas and oil are still mainly guided by the Government. However, the “market net back value” has been used in the natural gas price experimental unit.
Before the 1980s, China's coal price was determined by the Government as part of a long planned economy period. After the 1990s, marketization reform was gradually implemented. In 2004, a price linkage mechanism between coal and electricity was proposed, that is, the variation of electricity price was linked with the change of coal price. In 2007, the Government liberalized the steam coal price, but the intervention of export quotas and controversial issues was reserved. In nearly 30 years of reform and development, a trend towards planned and unplanned prices converging gradually was reflected in the evolution of Beijing's coal pricing mechanism and the coal price remained relatively stable.
“Market coal” and “planned power” still exist in China, and electricity tariffs can be divided into feed-in tariffs, transmission and distribution tariffs and sales tariffs. The feed-in tariff in Beijing has experienced capital and interest cost pricing, operational period electricity pricing and the benchmarking electricity pricing.
According to the Adjustment Measures for Feed-In Tariffs of Local Power Plants published by the Beijing Municipal Commission of Development and Reform on 24 August 2005, and the Adjustment Measures for North China Electricity Price published by the National Development and Reform Commission (NDRC) on 29 November 2011, feed-in tariffs, transmission and distribution tariffs and sales tariffs in Beijing were also determined by the Government [20]. Since 1 July 2012, the residential multi-step tariff pricing reform implemented in Beijing, according to the Measures for Beijing Residential Multi-Step Tariff Pricing Reform published by the Beijing Development and Reform Commission on 15 June 2012. However, the price linkage mechanism between coal and electricity was not in place, and the average growth level of electricity tariffs is very low, so this cannot actually reflect the growth level of coal prices. Also, while the price ratio of electricity and coal remains unreasonable, the power generation business continues to run at a deficit.
According to the oil products pricing system of “crude oil price plus cost”, which was officially published by the NDRC in January 2007, crude oil prices in three different places—Brent, Dubai and Mi-nas—were taken as the standard average price, while the domestic oil product retail base price was composed of various factors such as the benchmark average price, refining costs, proper profit spaces, domestic customs duty, and oil product circulation costs. According to the Implementation of Oil Price and Tax Reform published by the NDRC on 18 December 2008, and the Oil Price Management (Tentative) published by the NDRC on 7 May 2009, the crude oil price in Beijing could be determined independently by enterprises by referring to international market prices, while the NDRC could adjust the prices of oil products like gasoline, diesel and aviation kerosene when the moving average prices of crude oil in these three international markets changed by over 4% for 22 continuous working days [21,22]. The oil products prices were still mainly determined by the Government. Considering the domestic average processing costs, taxes, reasonable circulation link costs and proper profits, the corresponding cost parameters could be adjusted in a timely manner by the NDRC according to the reality of the economic situation.
Beijing's current natural gas pricing mechanism involves the price being determined by the central Government and Beijing Governments based on the natural gas supply process, and sub-division control has been carried out. The upper floating range of the natural gas base wellhead price was 10%, and its lower floating range was unlimited. Following the notice issued by the Beijing Municipal Commission of Development and Reform on 30 March 2007, the sales price of natural gas is linked to the alternative energy prices in principle [23]. Based on the factory benchmark price, the flotation range of the gas price is 10%, while the floating range is unlimited.
2.2. CGE Model Structure
The CGE model is a numerical simulation model that considers the linkages among all the markets, including the linkages of many economic agents with the optimal behaviour and the linkages between economic agents and markets. The CGE model puts all the economic agents and all the markets into a unified framework, reflecting the universal links between each component of the real economic system [24]. The CGE models in this paper are composed of five kinds of equations: price equations, production equations, income equations, expenditure equations and macroeconomic closure equations. The general laws of three economic subjects' behaviors are described by the first four kinds of equations used in the CGE model from different aspects. The theoretical basis of the CGE model—the Walras General Equilibrium Theory—is reflected by the macro closure equations, and the system constraints are defined in it.
The price equations define the demand price for commodities produced and sold domestically, the output value of domestic commodities, the price of aggregate intermediate input in activities, the income and the cost of activities. The endogenous price variable links to other prices (endogenous or exogenous) and non-price variables: the lower-case Latin letters a and c represent activities and commodities, respectively:
The relationships between product input and product output are described by production equations. There are 42 sectors in this model, including 4 energy sectors. The model assumes that the production function has constant returns to scale, and that the activity output of each sector follows a nested constant elasticity of substitution (CES) production function [25]:
The income and expenditure blocks of the model define the three subjects—households, enterprises and government—and they also describe their income sources and expenditure behaviours respectively. The model assumes that each household maximizes a “Stone-Geary” utility function subject to a consumption expenditure constraint. The total government spending is the sum of government expenditure on consumption and transfers, which is divided into Beijing government and central government. Enterprises allocate their incomes to purchase commodities for consumption and for transfers to other institutions:
Government consumption:
Household consumption:
Investment demand:
In the trade block, the Armington function applies to commodities that are both imported and produced domestically, and the CET function applies to commodities that are both exported and sold domestically. The model also assumes that the world prices for import and export commodities are exogenous.
The CGE model includes three macroeconomic balances: the government balance, the external balance (the current account of the balance of payments, which includes the trade balance) and the savings–investment balance. For the government balance, the government savings are a flexible residual, while all the tax rates are fixed. For the external balance, the real exchange rate is flexible, while the foreign savings (the current account deficit) are fixed. For the savings–investment balance, the real investment quantities are fixed [15].
2.3. Migration Cost Model
In this module, the migration costs of each typical energy source in Beijing are estimated.
2.3.1. The Emission of CO2 and SO2
The major air pollutants, CO2 and SO2 are generated through the process of energy utilization. It is estimated that 70% of CO2 emissions come from coal combustion and the rest come from the combustion of oil, natural gas and other fossil fuels, while 90% of SO2 emissions come from coal combustion and the rest come from oil [26]. Therefore, in this paper, the total amount of CO2 and SO2 emissions are analysed from the three energy—coal, oil and natural gas, and the CO2 and SO2 emissions of various energy are calculated by multiplying the corresponding emission factors by the energy consumption and the total SO2 emissions are obtained by the same method, as shown in Table 1.
In Table 1, , and are the total amounts of CO2 emissions of coal, oil and natural gas, respectively; and the total amounts of SO2 emissions of coal and oil respectively; QQc, QQo and QQg are the consumptions of coal, oil and natural gas, respectively; , and are the CO2 emission factors of coal, oil and natural gas, respectively; Bc and Bo are the SO2 emission factors of coal and oil, respectively. In Beijing, desulfurization equipment has been installed in most power plants, and ηSO2 is the desulfurization rate.
2.3.2. Emission Reduction Costs
Emission reduction costs are the costs of certain features, such as carbon capture, desulphurization technologies, which can be used to reduce the impact of air pollutants on the environment, and the total emission reduction cost of CO2 and SO2 are analysed respectively.
There are several alternative technological ways to reduce CO2 and SO2 emissions costs effectively. For CO2 emission reduction, these include using plant designs that offer more efficient power generation conversion of fossil fuels and more efficient capture and disposal of CO2 [27]. For SO2 emission reduction, coal desulphurization is an important means of controlling sulphur dioxide pollution; this mainly includes clean coal technology, the circulation fluid bed combustion technique, and flue gas desulphurization technology [28]. Most scholars use marginal abatement cost to represent the CO2 emission reduction, and the forms of marginal abatement cost include quadratic, logarithmic, power and exponential function [29]. There are lots of factors affecting the marginal abatement cost, such as technology progress (carbon capture technology), government subsidies and government administrative regulation. Therefore, the paper adopts a quadratic curve to represent marginal abatement cost referring to Gao's study [30], as shown in Equation (16):
For SO2, the China pollution charge Collection Standards and Calculation Methods report provides the pollution charge collection standards of each pollution equivalent of SO2. Therefore, this paper assumes the fee to be the SO2 marginal emission reduction cost, which is represented by MCSO2.
The total emission costs of CO2 and SO2 in various energy are shown in Table 2.
In Table 2, , and are the total emission reduction costs of CO2 in coal, oil and natural gas, respectively; and are the total emission reduction costs of SO2 in coal and oil, respectively.
2.4. The Society-Economy Equilibrium Indicator Maximization Taking into Consideration the Mitigation Cost
This paper assumes that kij represents the different price ratios between energy i and energy j, and is the base scenario of the price ratio between energy i and energy j. Through setting different kij levels, and based on the CGE model, we can obtain respectively the changes in real Gross Domestic Product (GDP), Consumer Price Index (CPI) and fossil energy consumption compared with the base scenario under various price fluctuations of electricity and natural gas. Then, according to the results shown in Figures 1 and 2, the changes in CPI, GDP and energy consumption compared with the base scenario under various price fluctuations can be calculated.
The so-called society-economy equilibrium indicator maximization taking into consideration the mitigation cost is the macroeconomic indicator of real GDP variation maximization after deducting the emission reduction cost variation, which is described by the variable R here. The mathematical model is shown by Equation (17):
3. Simulation
3.1. Basic Data
3.1.1. Macro SAM
The latest input-output table is from 2010; therefore, the data of the social account matrix (SAM) in this paper were compiled on the basis of the input-output table for 2010 and updated to 2013. The data and sources of the macro SAM are summarized as follows: the data of activities, commodities, import and export comes from the Beijing Input-output Table for 2010 [31]; the data of revenue and expenditure of government comes from the Beijing's Fiscal data 2011 in the National Bureau of Statistics of China [32]; the data of quantity of import and export commodities, revenue and expenditure of households, enterprises, and government comes from the Beijing Statistical Yearbook 2011 [33].
The RAS method and cross-entropy method are widely used to balance the SAM [34]. In this paper, the cross-entropy method was used to balance the micro SAM in the General Algebraic Modeling System (GAMS) software environment. The macro SAM of 2013 is shown in Table 3.
3.1.2. The Set of the Parameters in the CGE Model
The key parameters in this paper are specified based on previous studies [35–37]. The settings are as follows: the substitution elasticity between total factor input and total intermediate input is 0.1; the same elasticity value 0.9 is adopted by the substitution elasticities of the CES production function of all the sectors; the substitution elasticities of the CES production function under the next four layers are 0.3, 1.3, 1.01, 0.98 referring to the literatures [38,39]; the expenditure elasticities of market demand for commodities in agriculture, industry and services by household are respectively 0.5, 1.0 and 1.2; and the Frisch parameter is −3. The sectoral elasticity values are adopted from the literature [40].
3.1.3. Energy Prices
As the energy sectors have not been divided in a detailed way in the Chinese input–output table, the unit energy prices calculated by the estimation of the average retail price seem more reasonable than the prices calculated by the SAM. The average retail prices of the different energy sources can be estimated as follows:
The average sales price of oil can be obtained by weighting the gasoline price and the diesel price according to the consumption ratio of gasoline and diesel in 2013; that is, 1:1.92.
The average retail price of gas is estimated by weighting the industrial natural gas and residential natural gas prices according to the natural gas consumption ratio in 2013; that is, 3.8:1.
The average retail price of coal is an average sales coal price for the commercial use of state-owned coal enterprises. Additionally, the standard coal price is converted by raw coal's calorific value, assuming 5000 kcal/kg here. The average retail prices of different forms of energy are shown in Table 4.
According to the above, the ratio of electricity price: oil price: gas price: coal price is 6.3:8.6:2.9:1.
3.1.4. Emission Factors and Emission Reduction Costs
According to the database of emission factors provided by the Intergovernmental Panel on Climate Change (IPCC) [45], CO2 and SO2 emission factors are calculated after the conversion of fuel calorific values as shown in Tables 5 and 6, and the model to calculate CO2 emission factors is shown by Equation (19):
According to China's regulation of environmental protection [49], the desulphurization rate of the coal-fired units should generally exceed 90% in order to guarantee the achievement of SO2 emission standards. Therefore, in this model ηSO2 is 90%.
For CO2, the coal-fired and gas-fired power plants in Beijing employs carbon capture and storage technology (CCS) to reduce the CO2 emissions, and the government implements favorable policies, such as the reduction of enterprise income tax and value-added tax, to encourage enterprises to achieve energy conservation and emissions reduction, and uses administrative regulation measures to further ensure the environmental protection effect. Referring to the research of Gao [30], a and b are set by 0.0565 and 1.6896, respectively. The reduction emission rate of CO2 in 2013 reached 4.2% [50], so considering comprehensive coefficient function, the marginal reduction cost of CO2 is US$40.5/t. What's more, for the coal-fired power plant, the marginal reduction cost of CO2 reached US$15–70/t, and it would be US$100/t adding the transportation and storage cost [51]; for the gas-fired power plant, the total cost of carbon capture, transportation and storage is between US$16/t and US$92/t [52], therefore, after conversion according to the 2013 exchange rate, this paper sets MCCO2 = 250 yuan/t.
For SO2, the China pollution charge Collection Standards and Calculation Methods report provides the pollution charge collection standards of each pollution equivalent of SO2. Therefore, this paper assumes that MCSO2 = 630 yuan/t.
3.1.5. The Energy Consumption Pattern and Urban Development Forecast in Beijing
Due to the deteriorating air quality in Beijing, the city's coal consumption is in the gradually decrease, however, the consumptions of natural gas, oil and electricity all have some different degrees of rises. In 2013, the city's total coal consumption was accounted for 21% of the total energy consumption, and the proportions of total oil consumption and natural gas consumption were 34% and 15%; the total electricity consumption in 2013 was 91.3 billion kW·h, which was accounted for 25% in the city's total energy consumption, and the proportion of renewable energy was 5%. It can be seen that the proportion of the coal, oil, natural gas and electricity in the total energy consumption was 0.84:1.36:0.6:1, which is significantly lower than the average national level and world's level. Overall, coal is no longer the primary energy consumption in Beijing, and the electricity consumption has ended its rapid growth for nearly 10 years, which will enter a more moderate growth period, and oil and electricity will have been dominant in energy consumption structure.
According to the Beijing's development direction and development policy, energy supply and demand structure, industrial structure and way of energy consumption would be adjusted urgently. In order to create a blue sky to Beijing, the local government enacts a policy named “Beijing Clean Air Action Plan from 2013 to 2017”, and some specific measures are as follows: Firstly, four gas thermoelectric center would be endeavor to put into use within 2014, and coal consumption will be cut 2.6 million tons in the whole year. By 2017, the city's total coal consumption will be cut down by 13 million tons compared with 2012, which is controlled within 10 million tons, and the proportion of coal consumption accounted for the total energy consumption will be dropped to 10%; Secondly, the total amount of motor vehicles will be controlled within 5.6 million, and 300 polluting enterprises will be ordered to move out of Beijing; Thirdly, the “replace coal and oil by electricity” policy will be actively promoted, by 2017, the proportion of electricity consumption from other provinces will be up to 70%, and the total electricity consumption will be accounted for 40%. At the same time, Beijing will comprehensively use natural gas to generate electricity, and five large coal-fired power plants will be shut down, which will be replaced by gas-fired power plants. Fourthly, the industry structure will be transformed, and gradually developed the innovative and high technology industries and strategic emerging industry, in order to encourage the enterprises' green operation and promote the adjustment of industry structure. By the year 2015 and 2017, the proportion of tertiary industry will be up to 78% and 79%, respectively. Overall, the future urban development in Beijing will be still on the rise, and its energy consumption patterns will gradually be transformed to clean energy. On the basis of macro-SAM of Beijing in 2013, a new SAM table in 2017 considering energy consumption pattern and urban development will be predicted to further analyze its reasonable energy price ratio, which can be shown as Table 7.
3.2. Empirical Analysis
According to China's energy prices for 2013, the price ratios among different energy sources are: electricity price: coal price 6.3:1, natural gas price: oil price 1:3; and natural gas price: coal price 2.9:1. The emission reduction costs of CO2 and SO2 are 251 yuan/t and 630 yuan/t, respectively. These are simulated respectively based on the CGE model.
3.2.1. Electricity and Coal
The base scenario of the electricity price: coal price is 6.3:1, and from this we can assume the existence of eight different price ratio scenarios. In fixing the coal price, the eight change rates of electricity prices are calculated according to the eight price ratio scenarios and the fixed coal price. After this, the eight change rates can be used to simulate how the economic system will react, which is equal to the simulation influence of price ratio fluctuations. Finally, we can obtain the changes in GDP, CPI and energy consumption under a new equilibrium relative to the base scenario. According to Tables 1 and 2, the changes in CO2 and SO2 emissions can be obtained, and the equilibrium indicator R can also be calculated according to Equation (17).
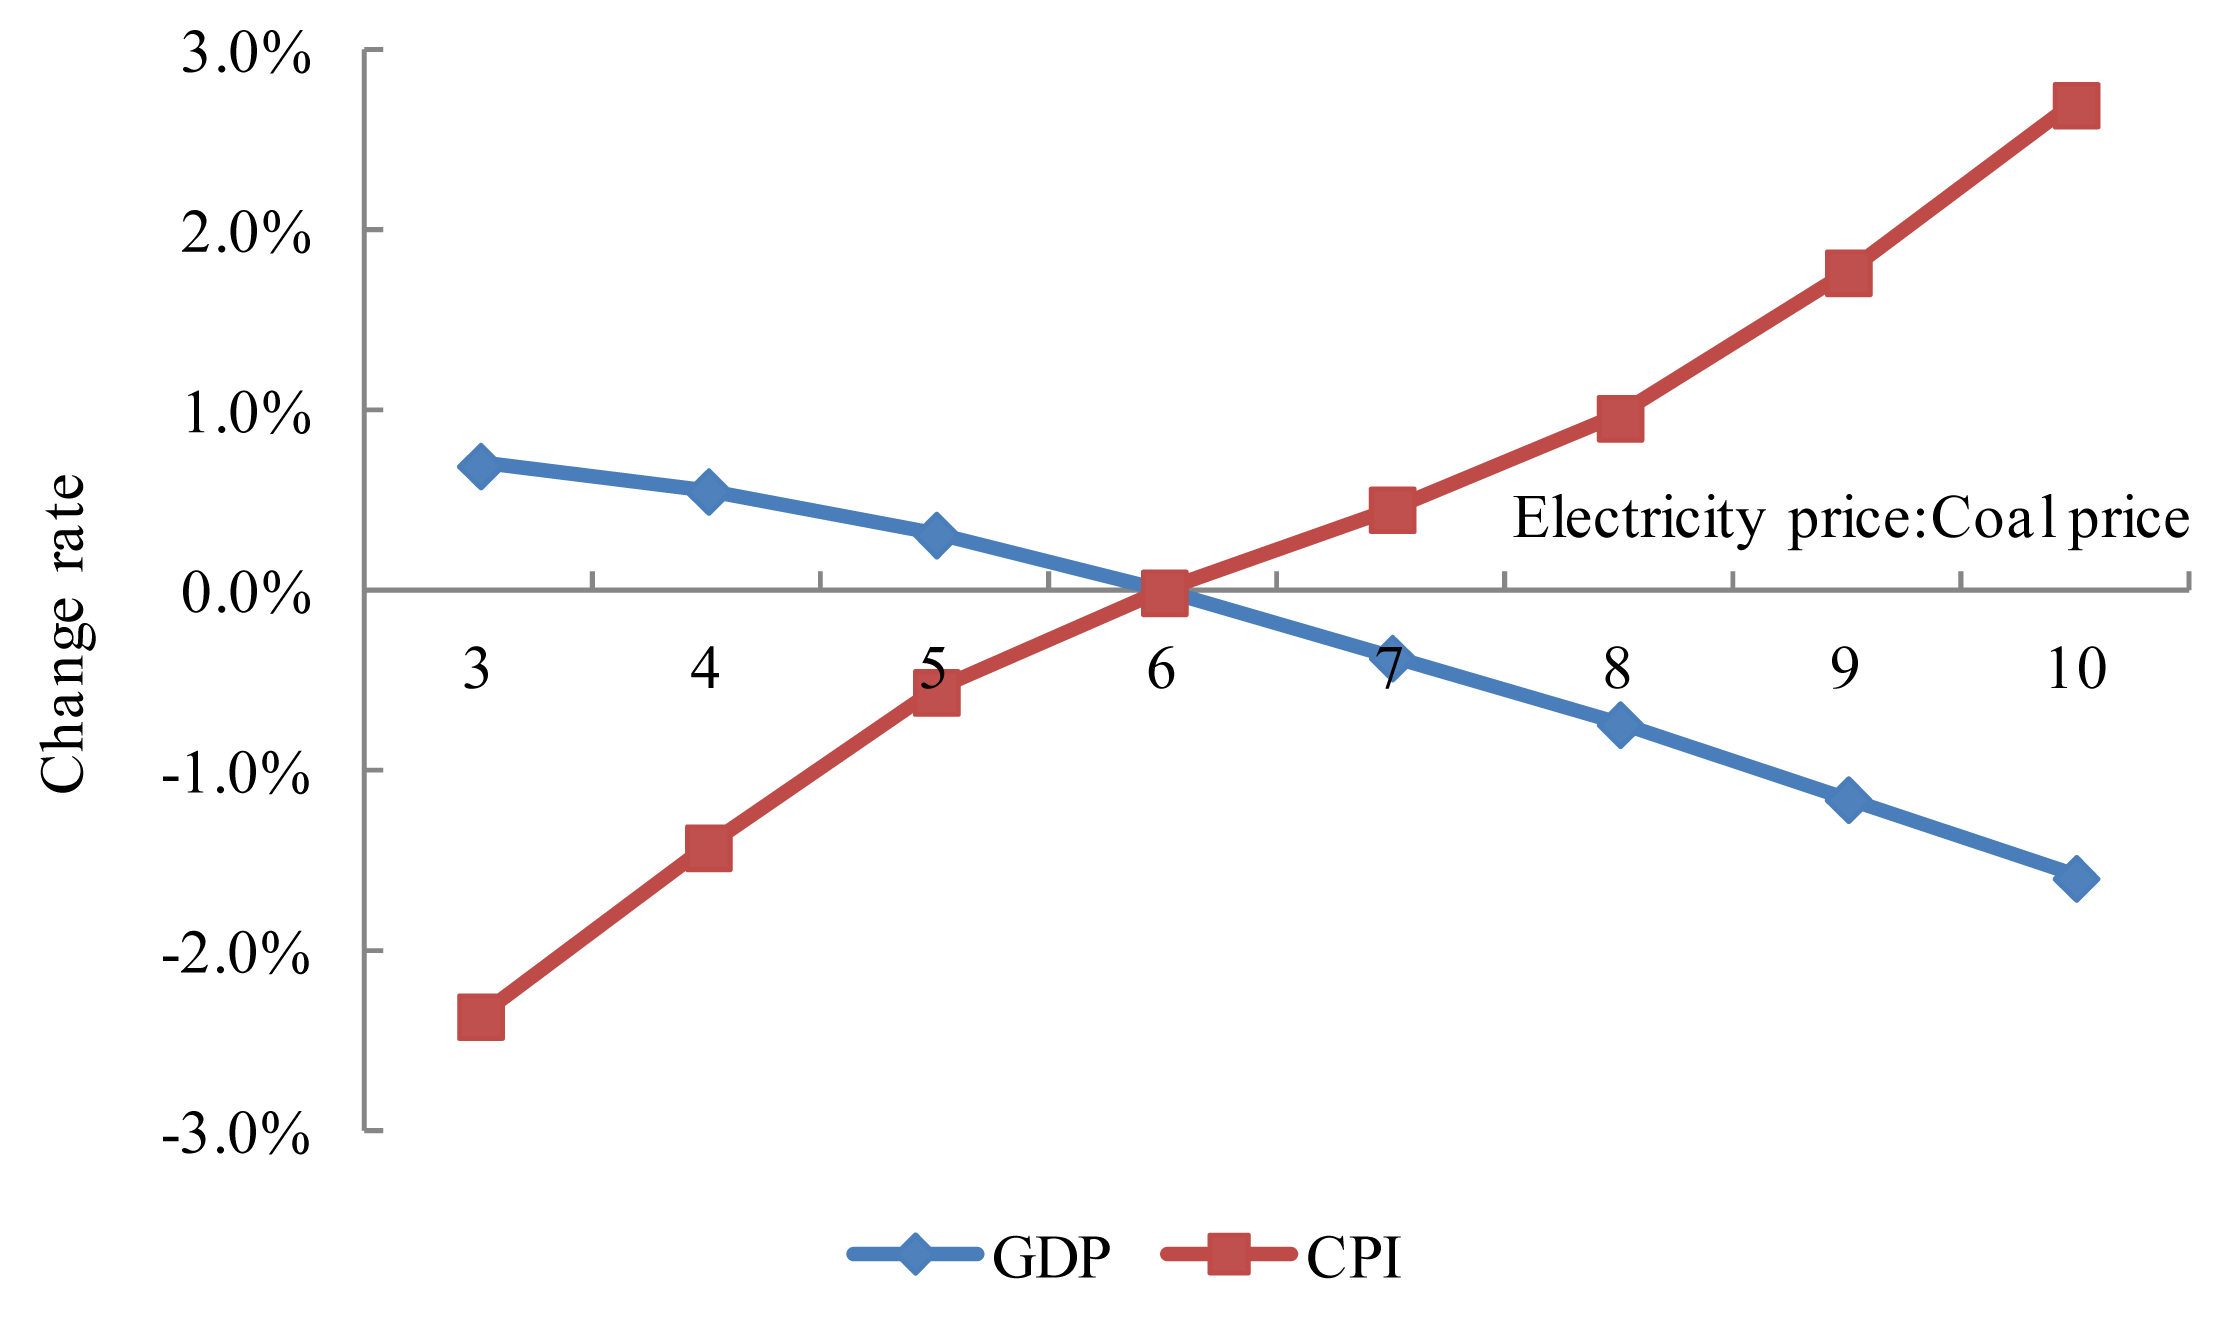
As can be seen from Figure 1, an increase in the price ratio between electricity and coal can cause a negative impact on the macroeconomy. Heavy industries and high energy-consumption industries are greatly affected by electricity price fluctuations. The increase in the price ratio between electricity and coal raise the production costs of these high energy-consumption industries, and reduce corporate profits and further affect enterprises' productive enthusiasm, and the GDP will decline to some extent with the increase in the price ratio. At the same time, through inter-sectoral linkages, the increase in the price ratio promotes the increase in terminal product prices, and this will further aggravate the risk of inflation. With the gradual increase of the price ratio between electricity and coal, the CPI change rate tends to rise, and the inflation pressure will gradually expand for an acceptable range of consumers, inflecting that the increase of price ratio has a negative impact on GDP and CPI, so that only the price ratio is within a reasonable limit, the economy can be developed sustainably and the inflation pressure can be rational.
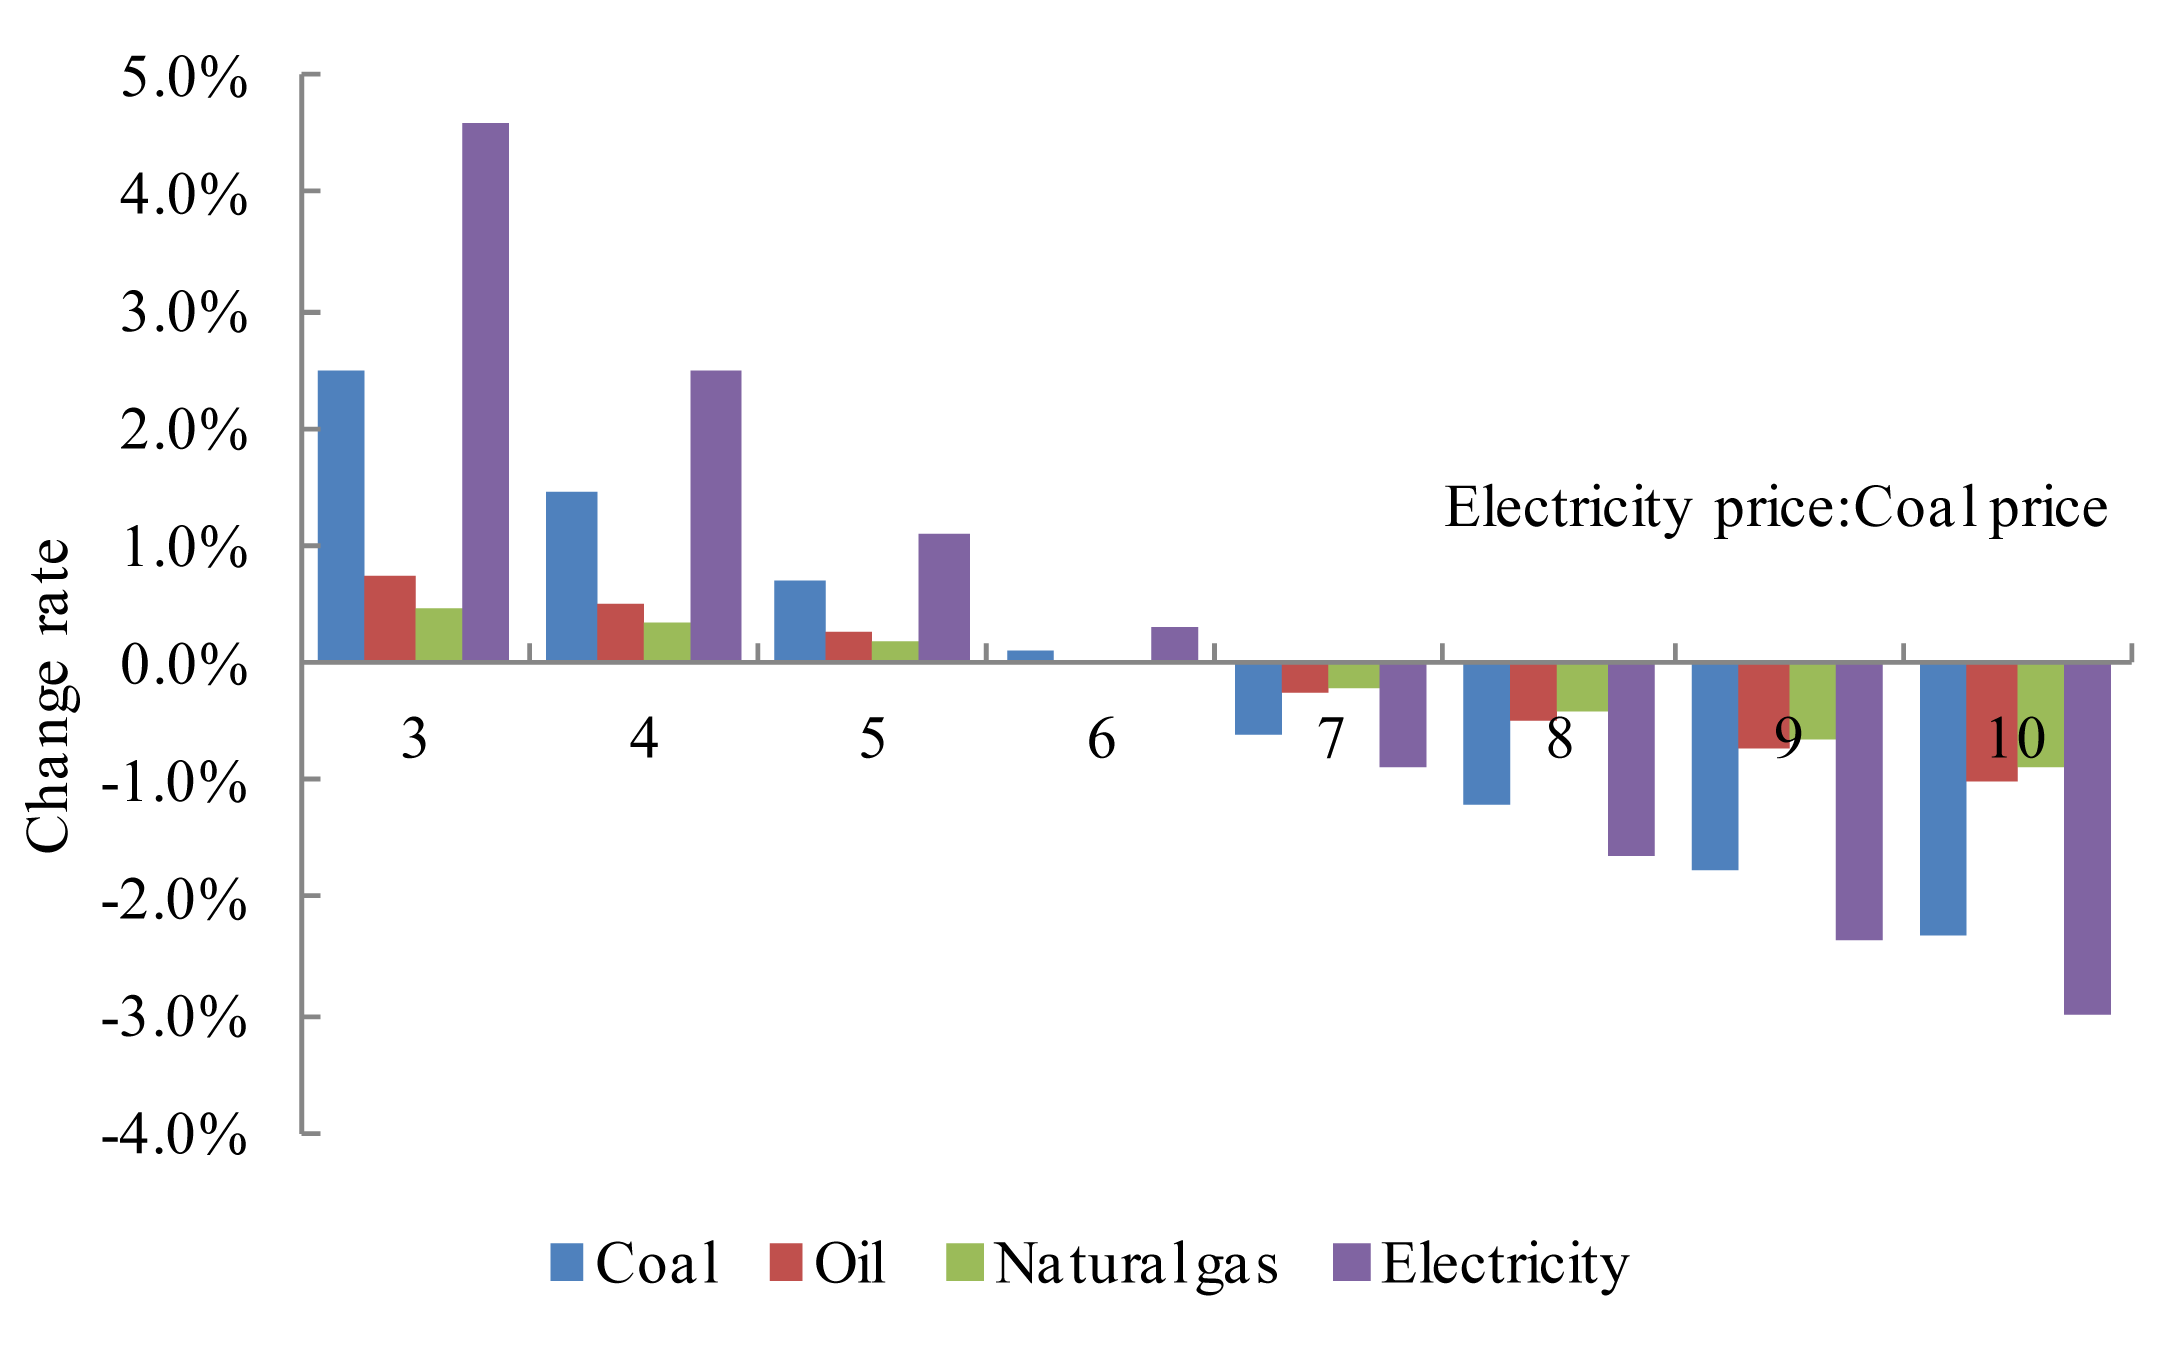
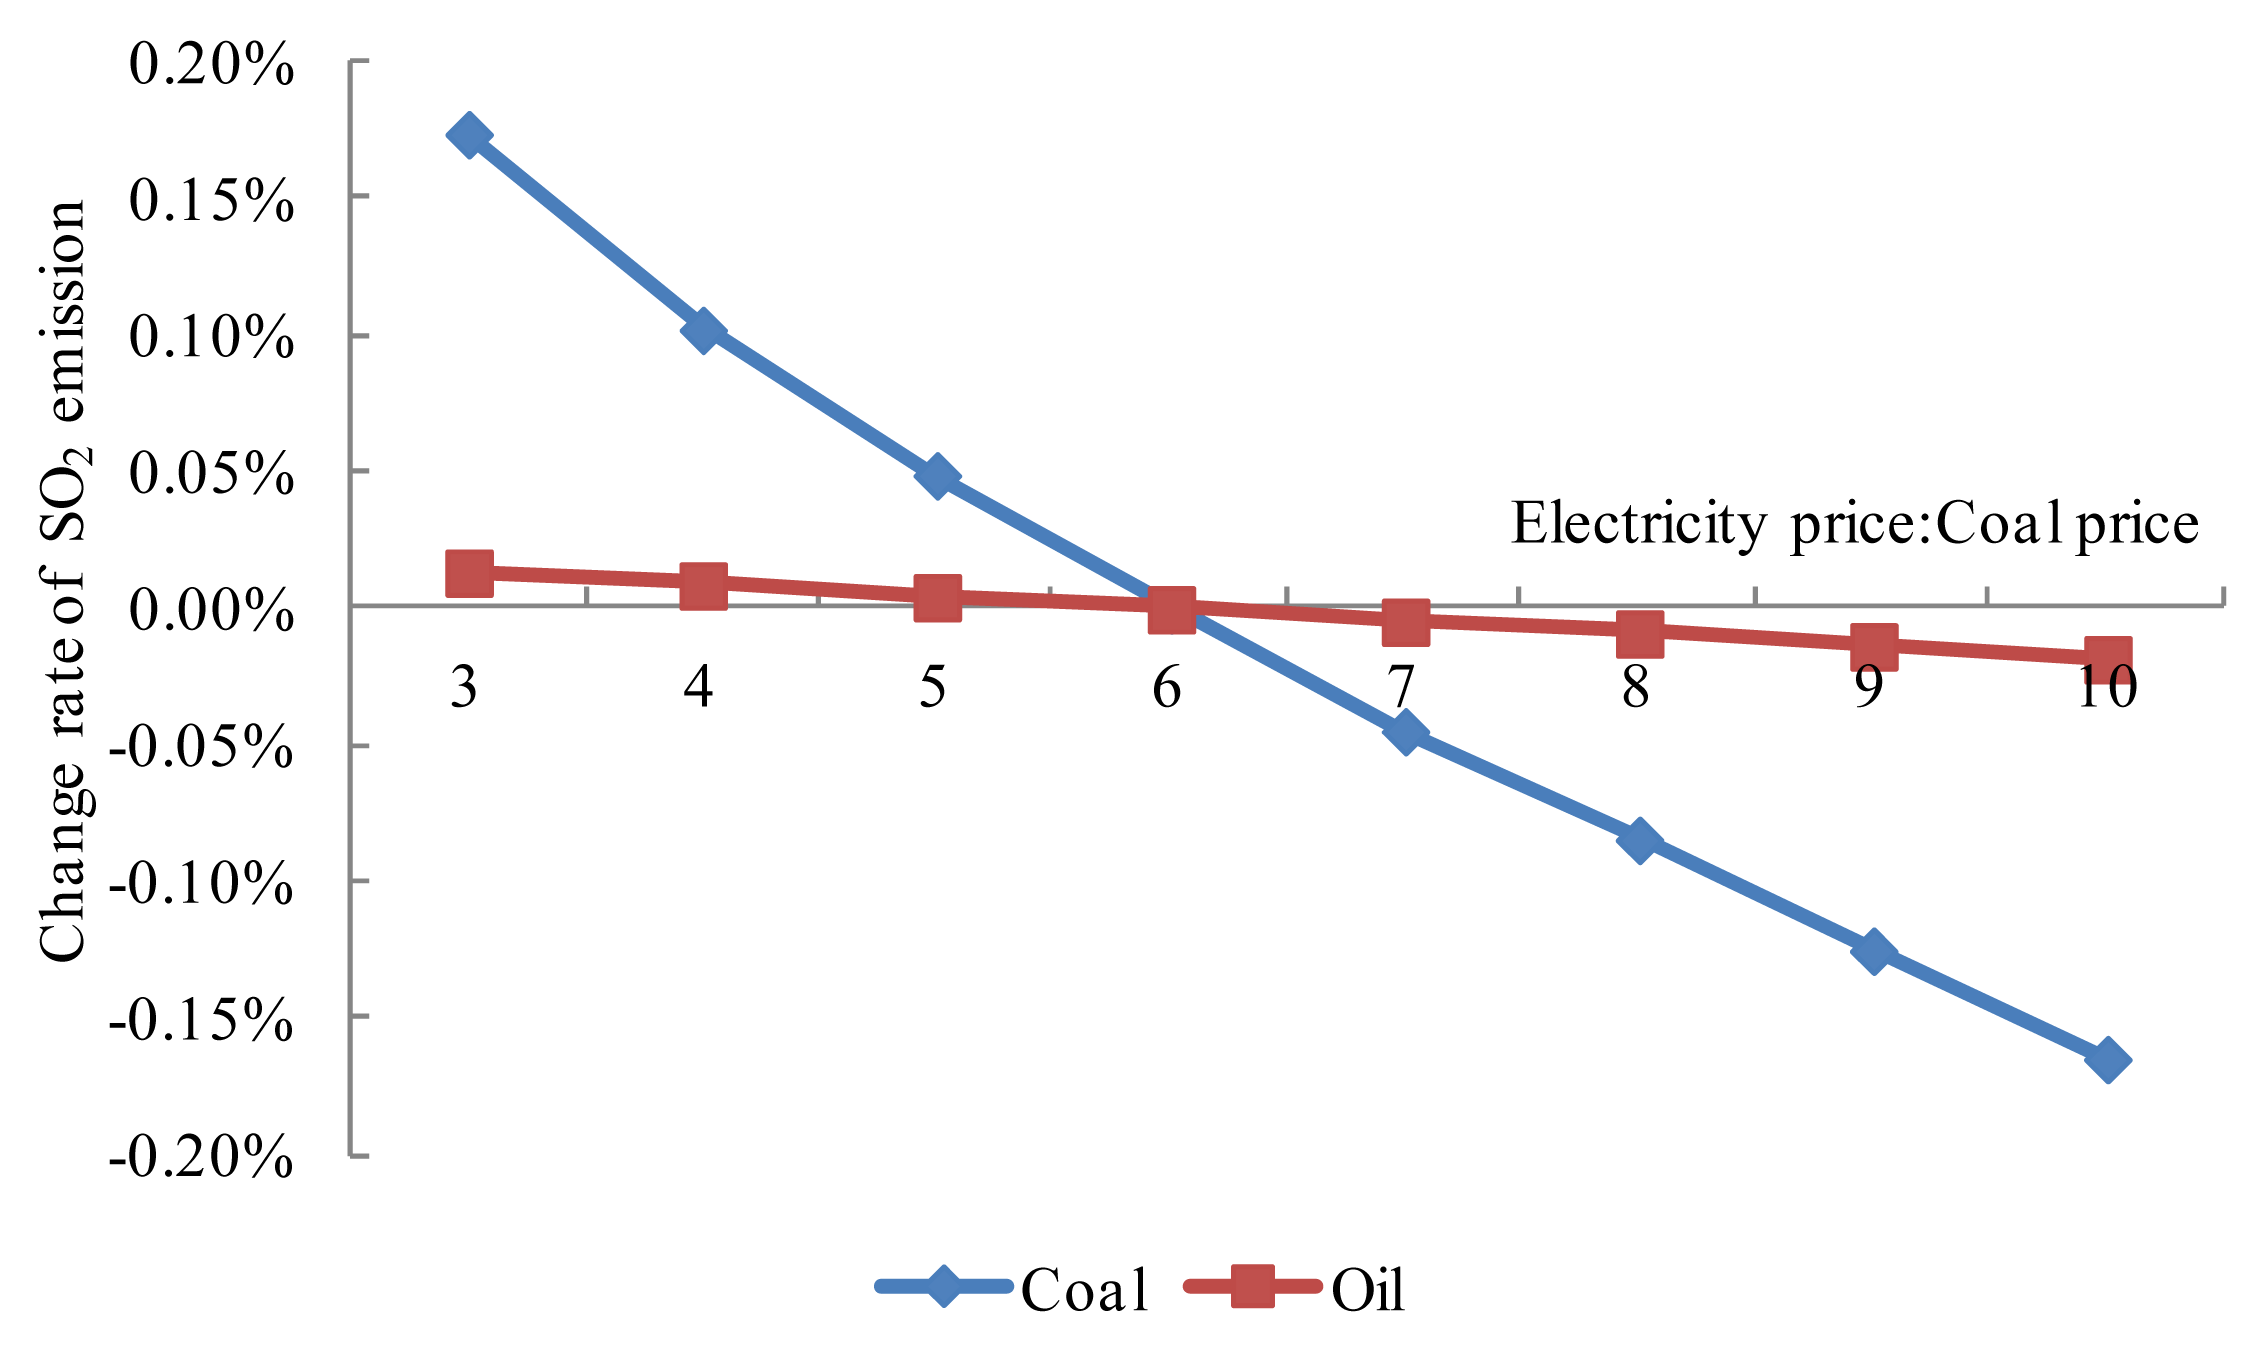
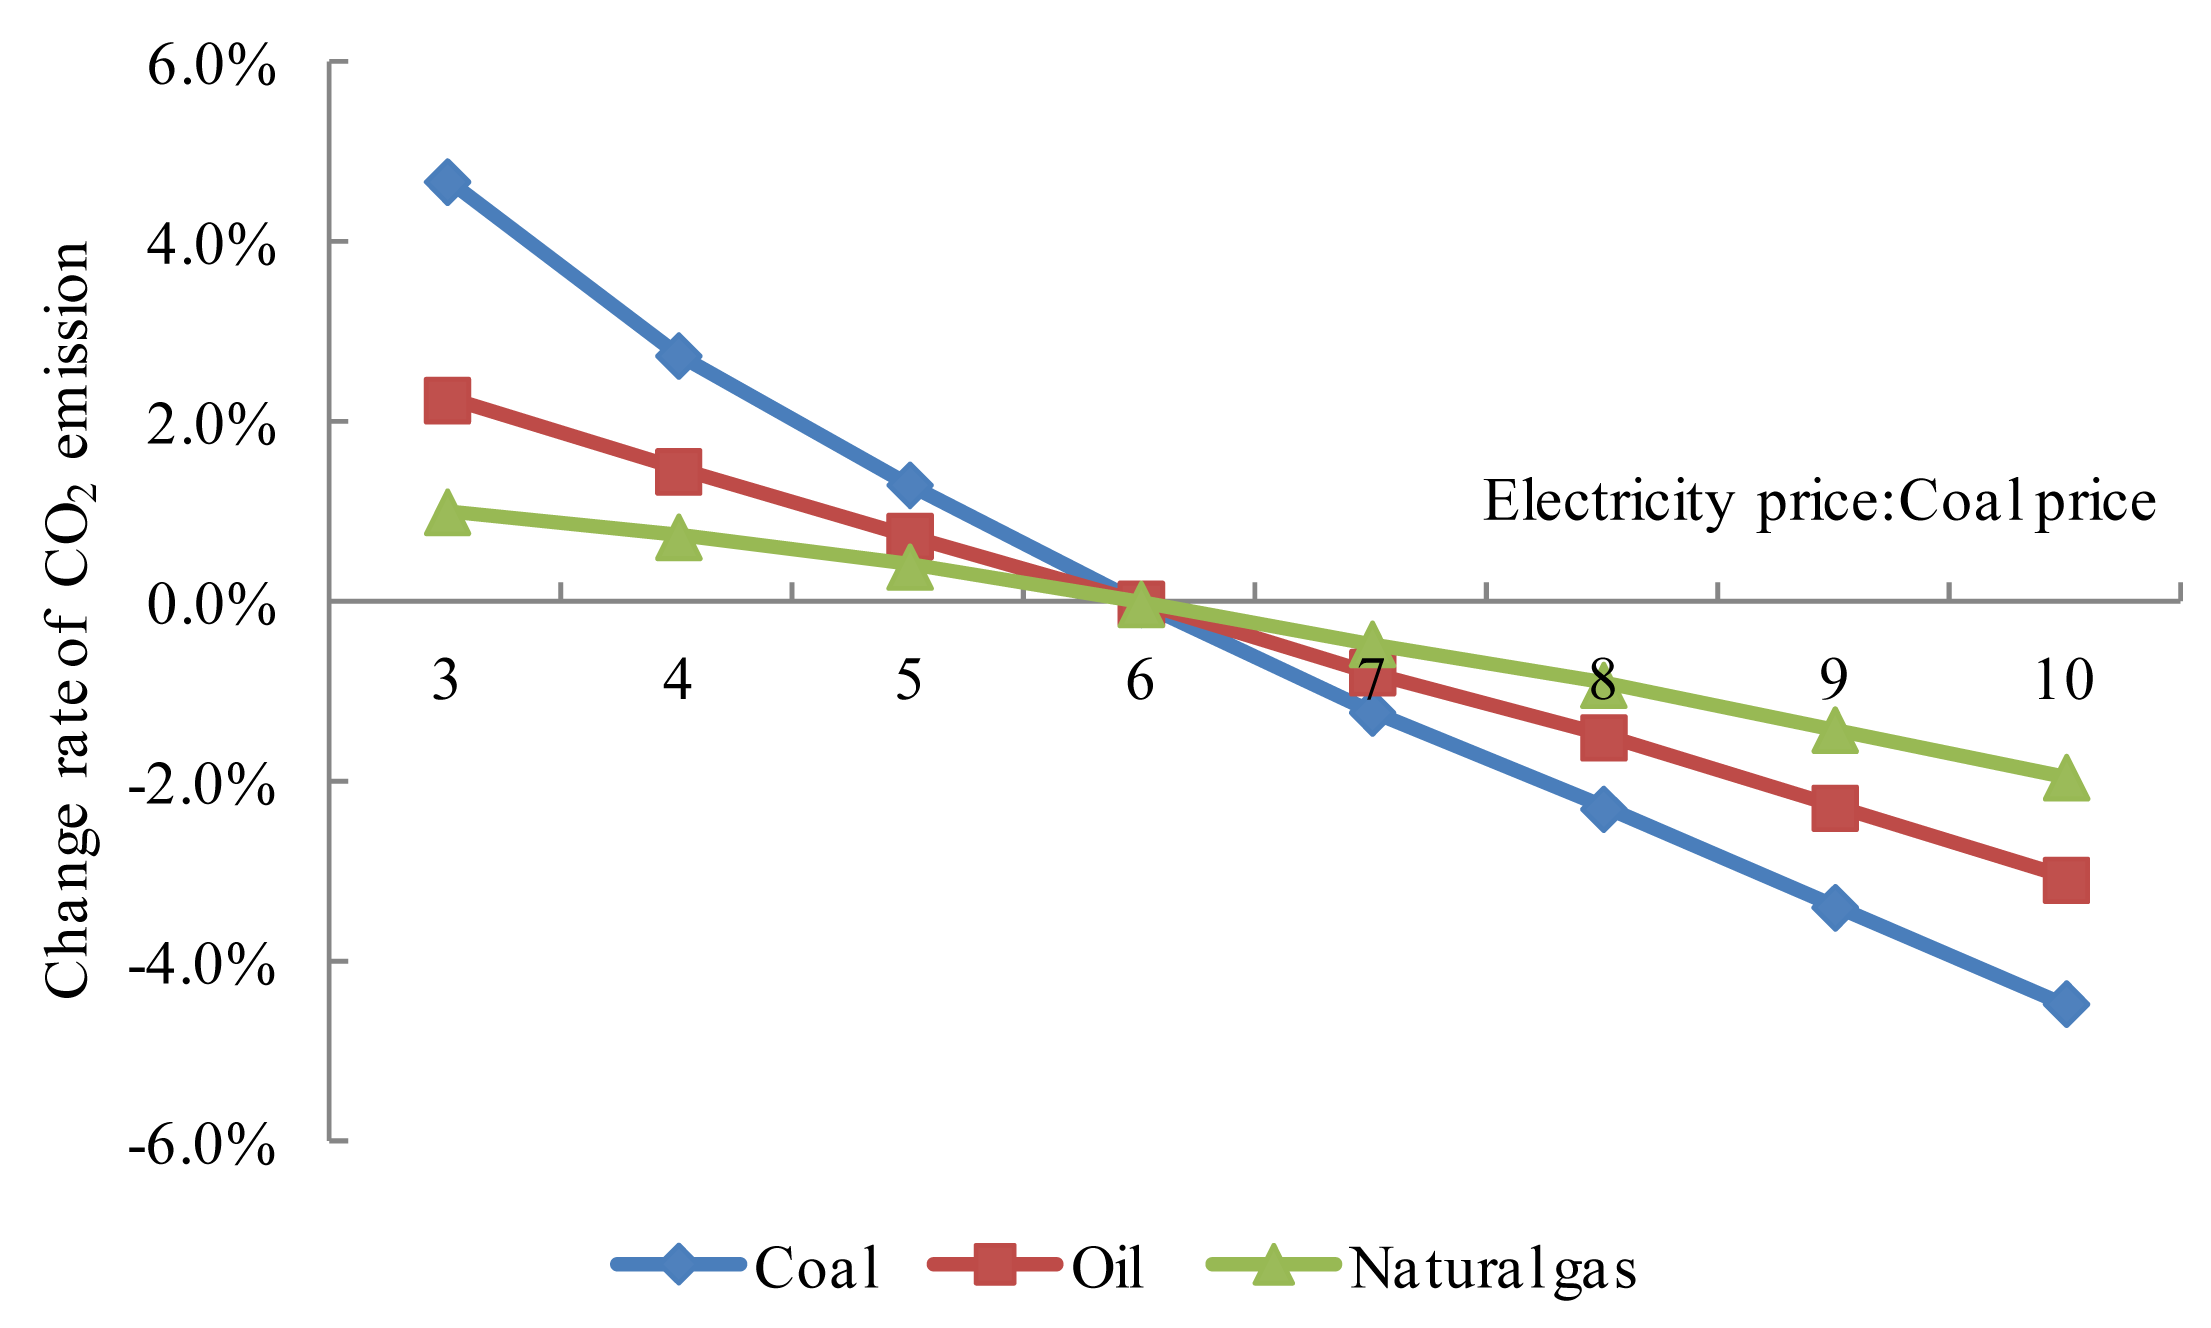
As shown in Figure 2, with an increase in the price ratio between electricity and coal, the consumption of coal, oil, natural gas and electricity will decrease gradually. When the price ratio is 10:1, the price ratio increase has the greatest impact on electricity, which is decreased by 3% and then on coal, inflecting that with the increase of price ratio, these two energy related to the change of price ratio will have a higher decrease and various energy consumption would be different due to different energy substitution elasticities. From the perspective of decreased trend, the impact of energy demand changes caused by the increase of price ratio on the decline of energy consumption is higher than the impact of substitution elasticity. In addition, a decrease in the energy consumption leads directly to a decline in the CO2 and SO2 emissions in various energy, and the CO2 emissions produced by coal is within the largest decrease, followed by oil and natural gas, and the SO2 emissions produced by coal is also within the largest decrease, which are all related to the characteristics of fossil energy and energy substitution elasticities.
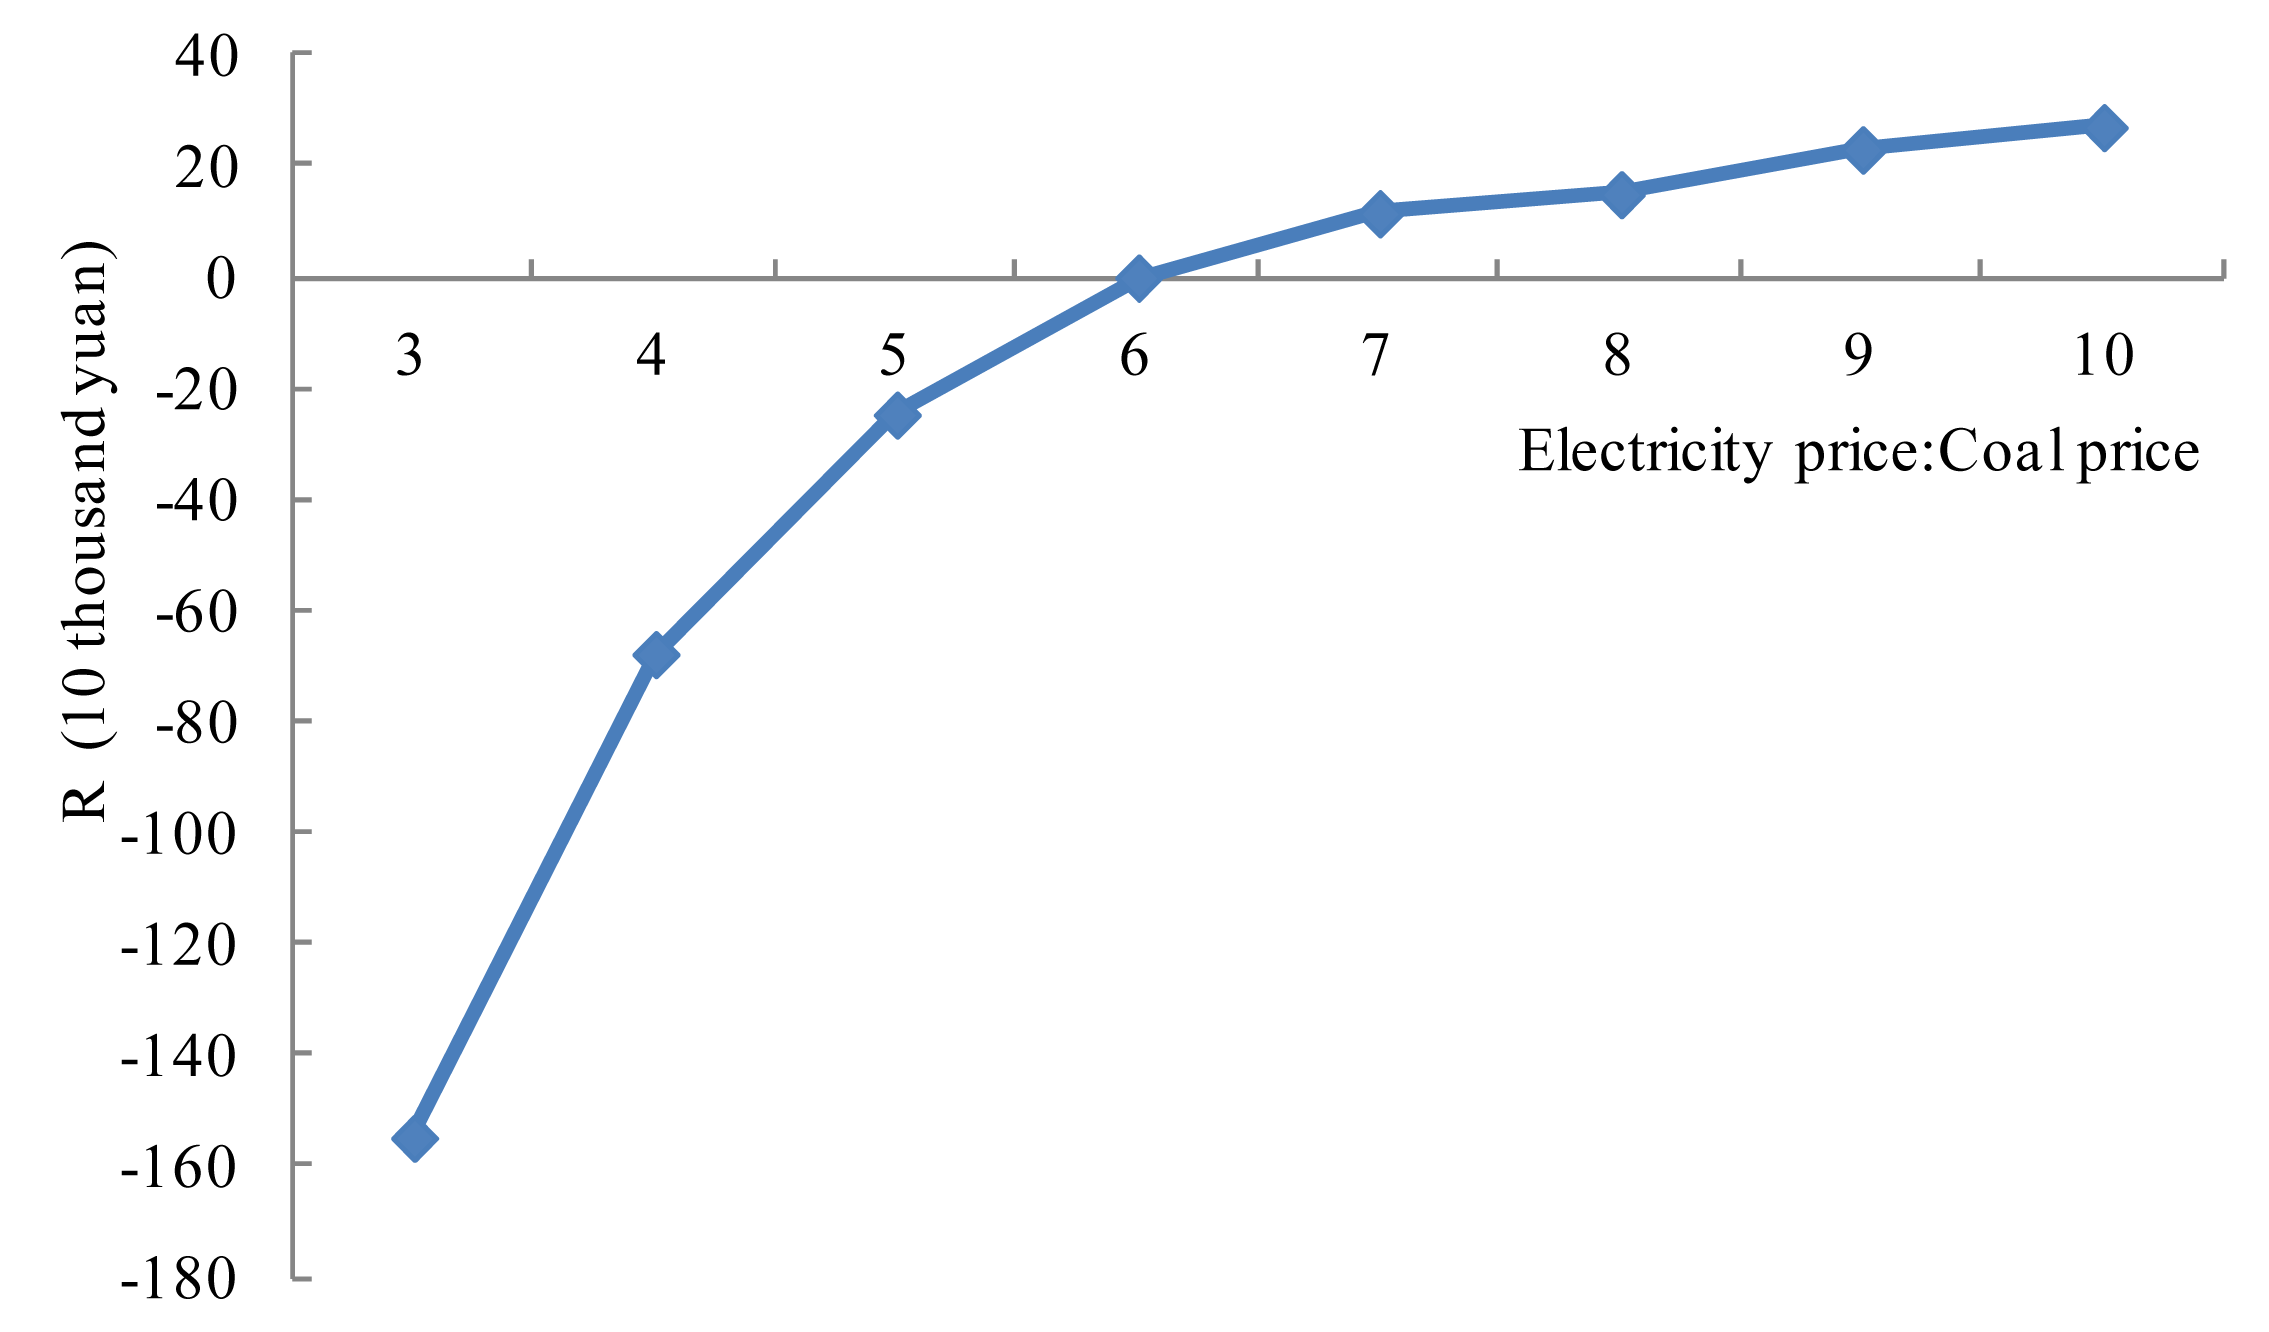
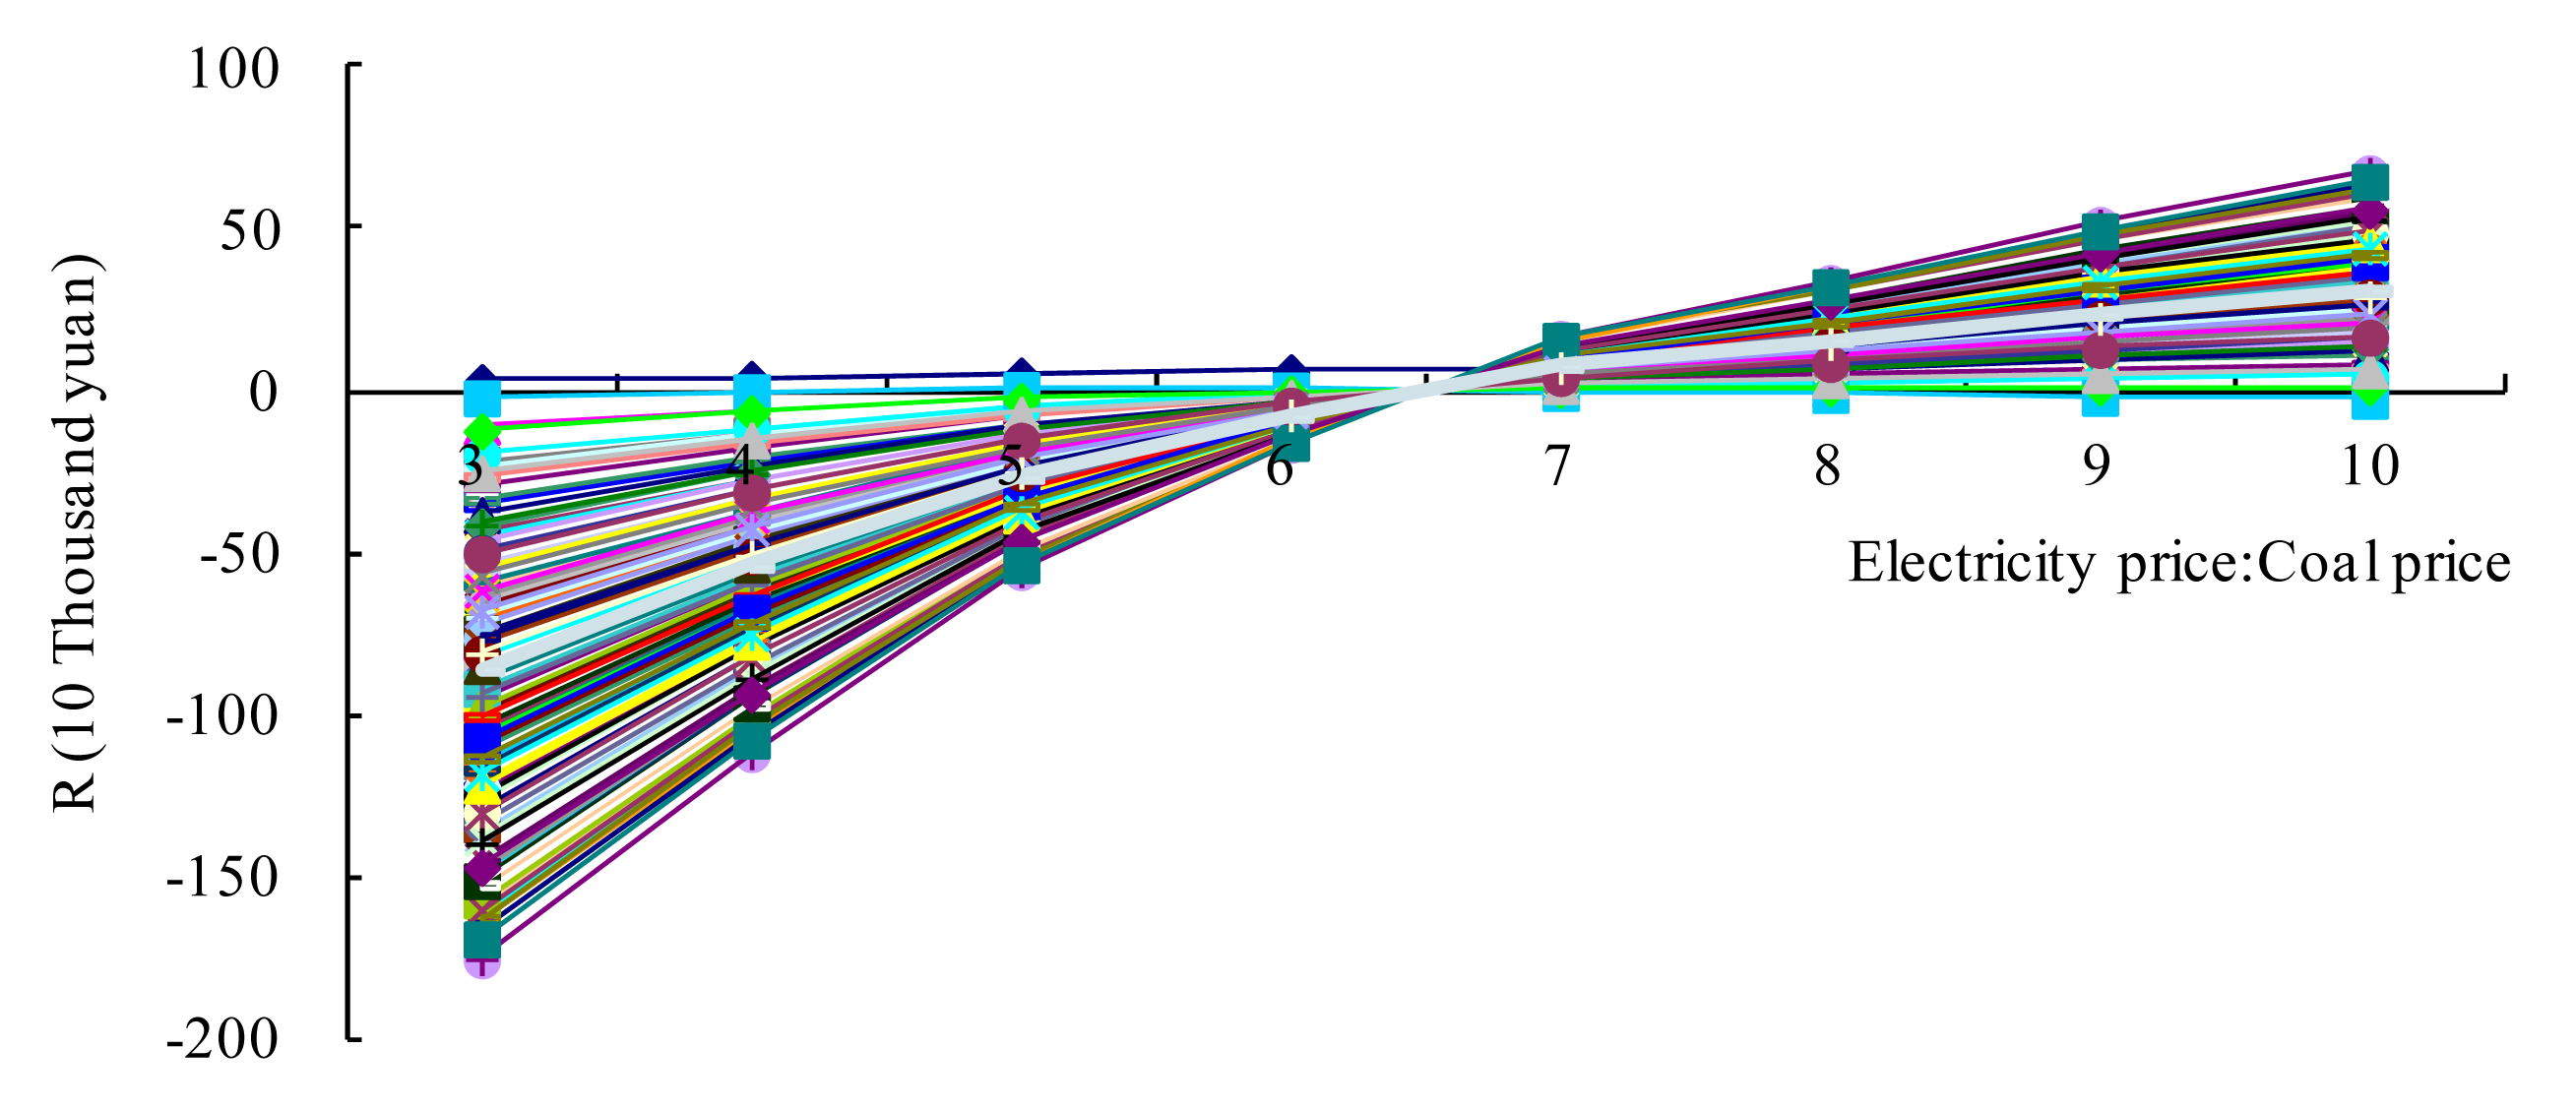
From the ΔGDP trend, the macroeconomy displays negative growth with the rise in the price ratio between electricity and coal, and here it is defined as a negative economic effect caused by the price ratio increase. From the trend of the total cost C of emission reduction, it declines with the decrease in CO2 and SO2 emissions. If such expense C is taken as a negative environmental effect, −C can be considered as a cost saving caused by the decrease in CO2 and SO2 emissions, and here the rise of −C is defined as a positive environmental effect. Thus, according to Equation (17), the equilibrium indicator R increases with the rise in the price ratio (see Figure 3, 4 and 5) under the influence of these two effects.
This shows that when the CO2 and SO2 emission reduction costs are 250 yuan/t and 630 yuan/t, respectively, the positive environmental effect is greater than the negative economic effect caused by the rise in the price ratio, which can provide a reference for the energy price policy and improving the price ratio appropriately can be beneficial to the comprehensive influence of economy and emission reduction. However, the price ratio cannot rise infinitely due to the constraint of CPI. Therefore, considering the combined impact of the price ratio, this paper uses the equilibrium indicator R maximization to determine the reasonable price ratio range. Given that the residents' price affordability is not unchangeable, under the different CPI constraints, the value of equilibrium indicator R is different and the corresponding rational price ratio is also different. This paper assumes three CPI constraints to determine the distribution of the rational price ratio. As shown in Table 8, the distribution of the rational price ratio is 7.3:1–9.3:1.
The energy price ratio considering energy consumption pattern and urban development in Beijing is analyzed. From Table 7 we can see that, with the increasing development of city and the improvement of people's life quality and requirements on environmental quality, in the future, the proportion of natural gas and renewable energy power generation accounted for final energy consumption will gradually rise, and the proportion of fossil fuels such as coal and oil, which would produce large amount of pollutants, will gradually decline, and the proportion of secondary industry in the industrial structure will also be a corresponding decline, so that electricity will become the major consuming energy to the citizens and commercial enterprises. Nowadays, the electricity production still gradually relies on fossil fuels in recent years and the electricity price is of exogenous characteristic in China, while the oil price and coal price are determined by the market, however, with the implementation of government's pollution control policies, the energy price ratio between electricity and coal, oil will not change in a large extent.
Taking the price ratio between electricity and coal as an example, the distribution of the rational price ratio is 8:1–10:1 within the above different CPI constraints. In the future, with the gradually mature renewable energy generation technology, the clean electricity will certainly replace the highly polluting energy such as coal and oil, then the price ratio would be increase, that is, if the coal price is fixed, the increase rate of electricity price will be higher, reflecting that when the future energy consumption pattern is being optimized, the future energy prices and energy price ratio will gradually tend to be more reasonable; What's more, along with the decrease of proportion of secondary industry and the reduction of high energy-consuming enterprises, the change of price ratio between electricity and coal will not have much impact on GDP and CPI will increase in some extent, however, with the improvement of living standards and development of urban environment, consumers' satisfaction will not have a great decrease, which is beneficial to create a more harmonious and healthy society.
3.2.2. Natural Gas and Oil, and Natural Gas and Coal
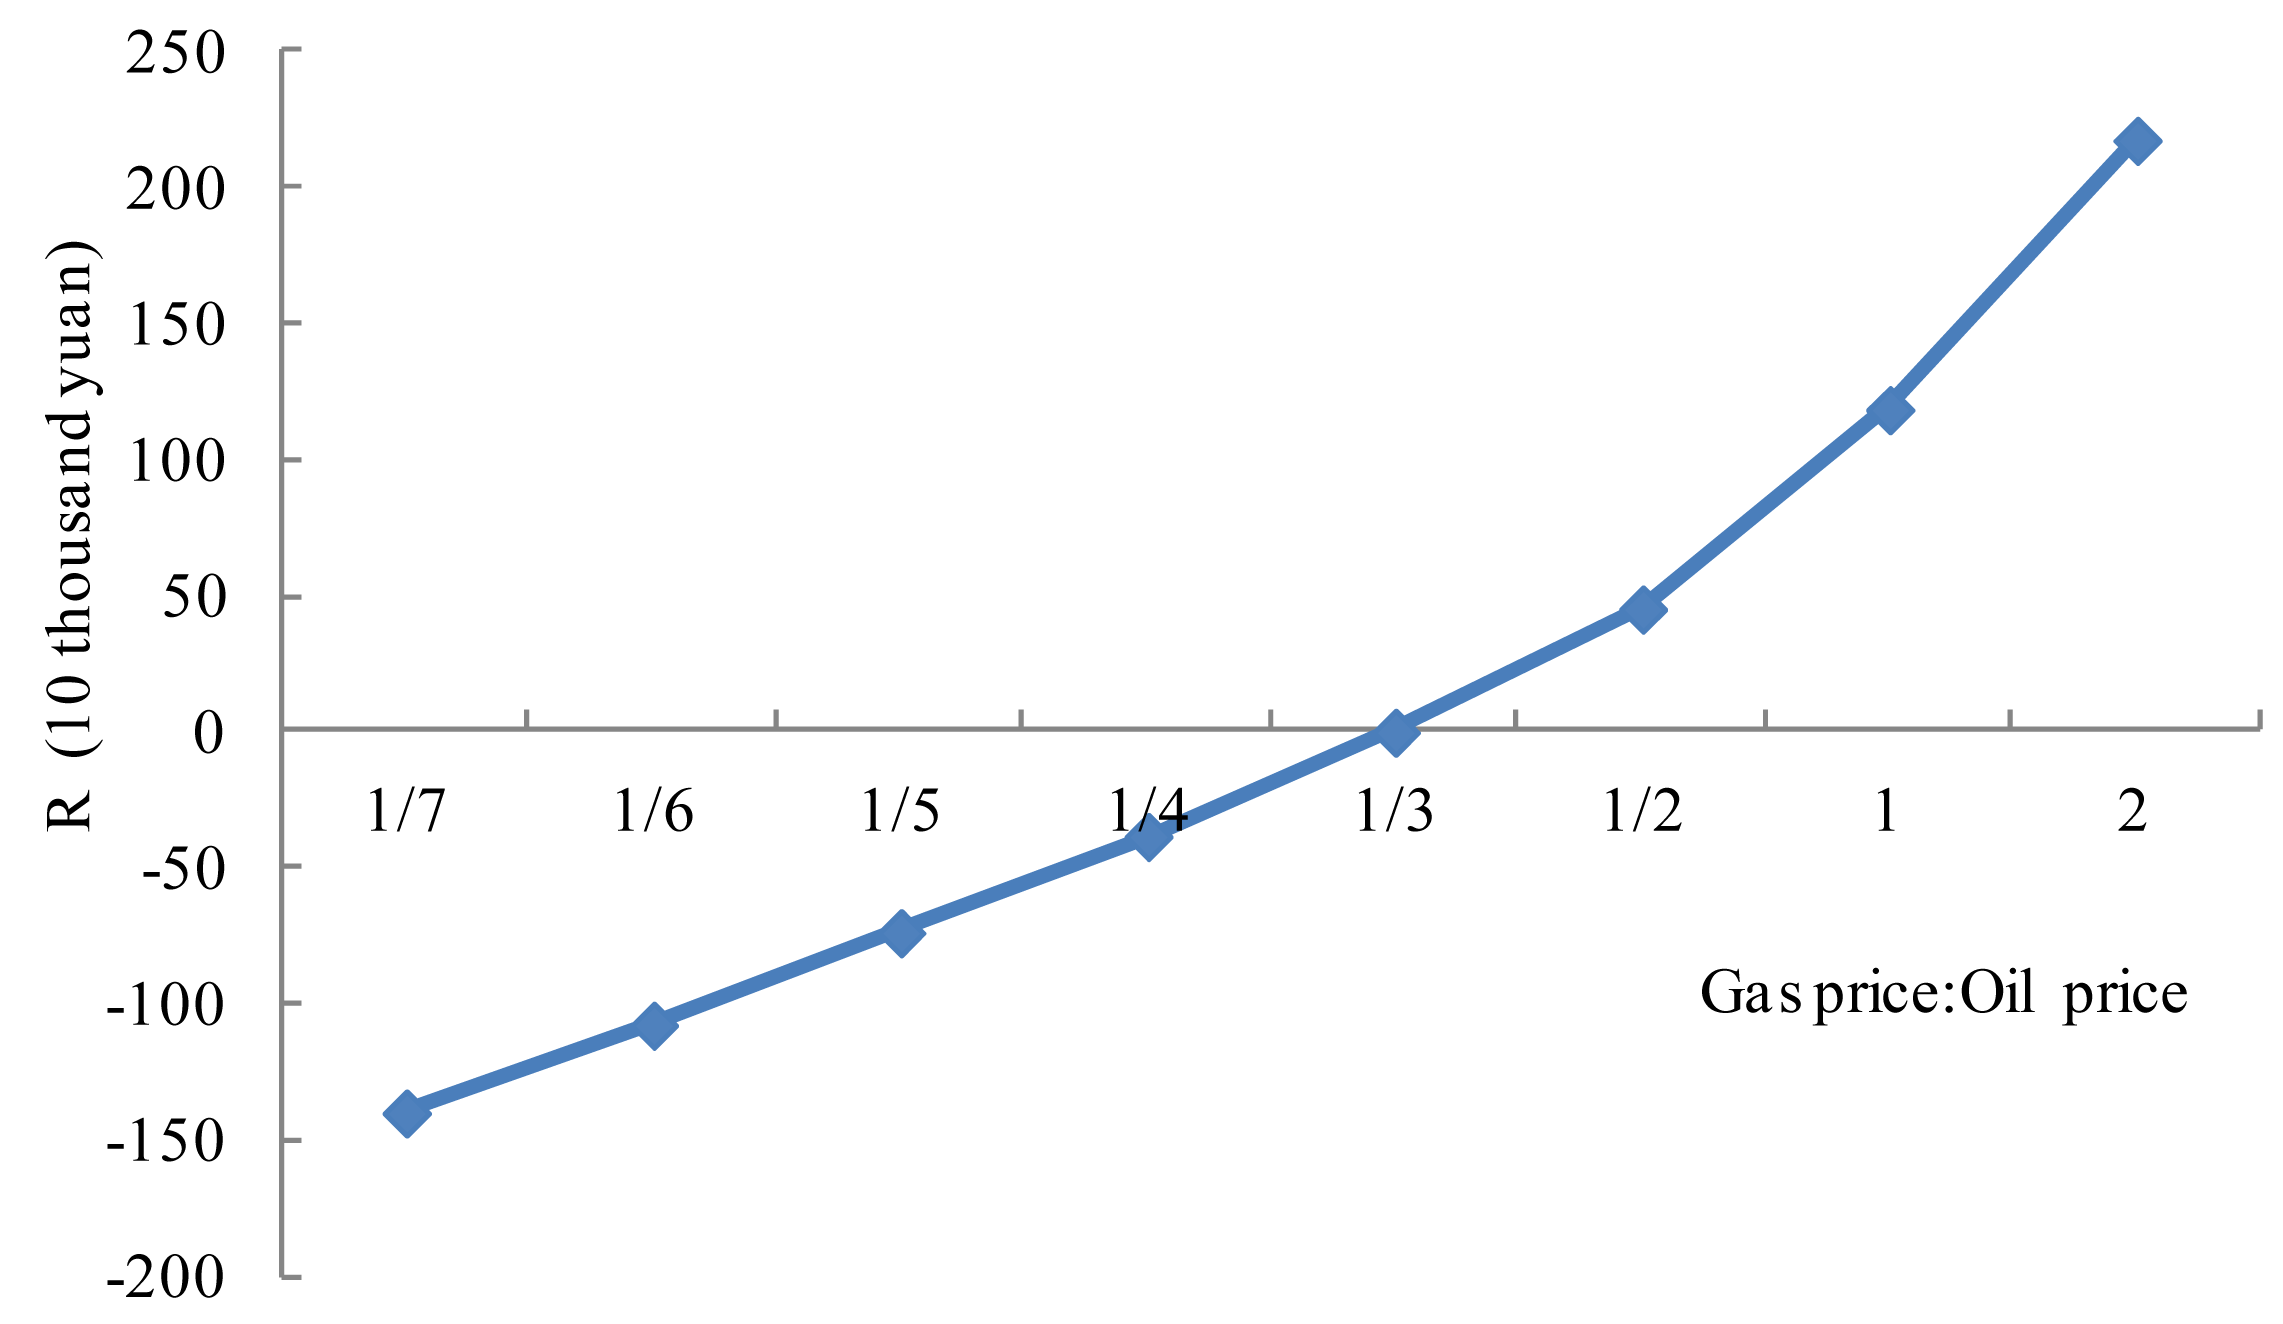
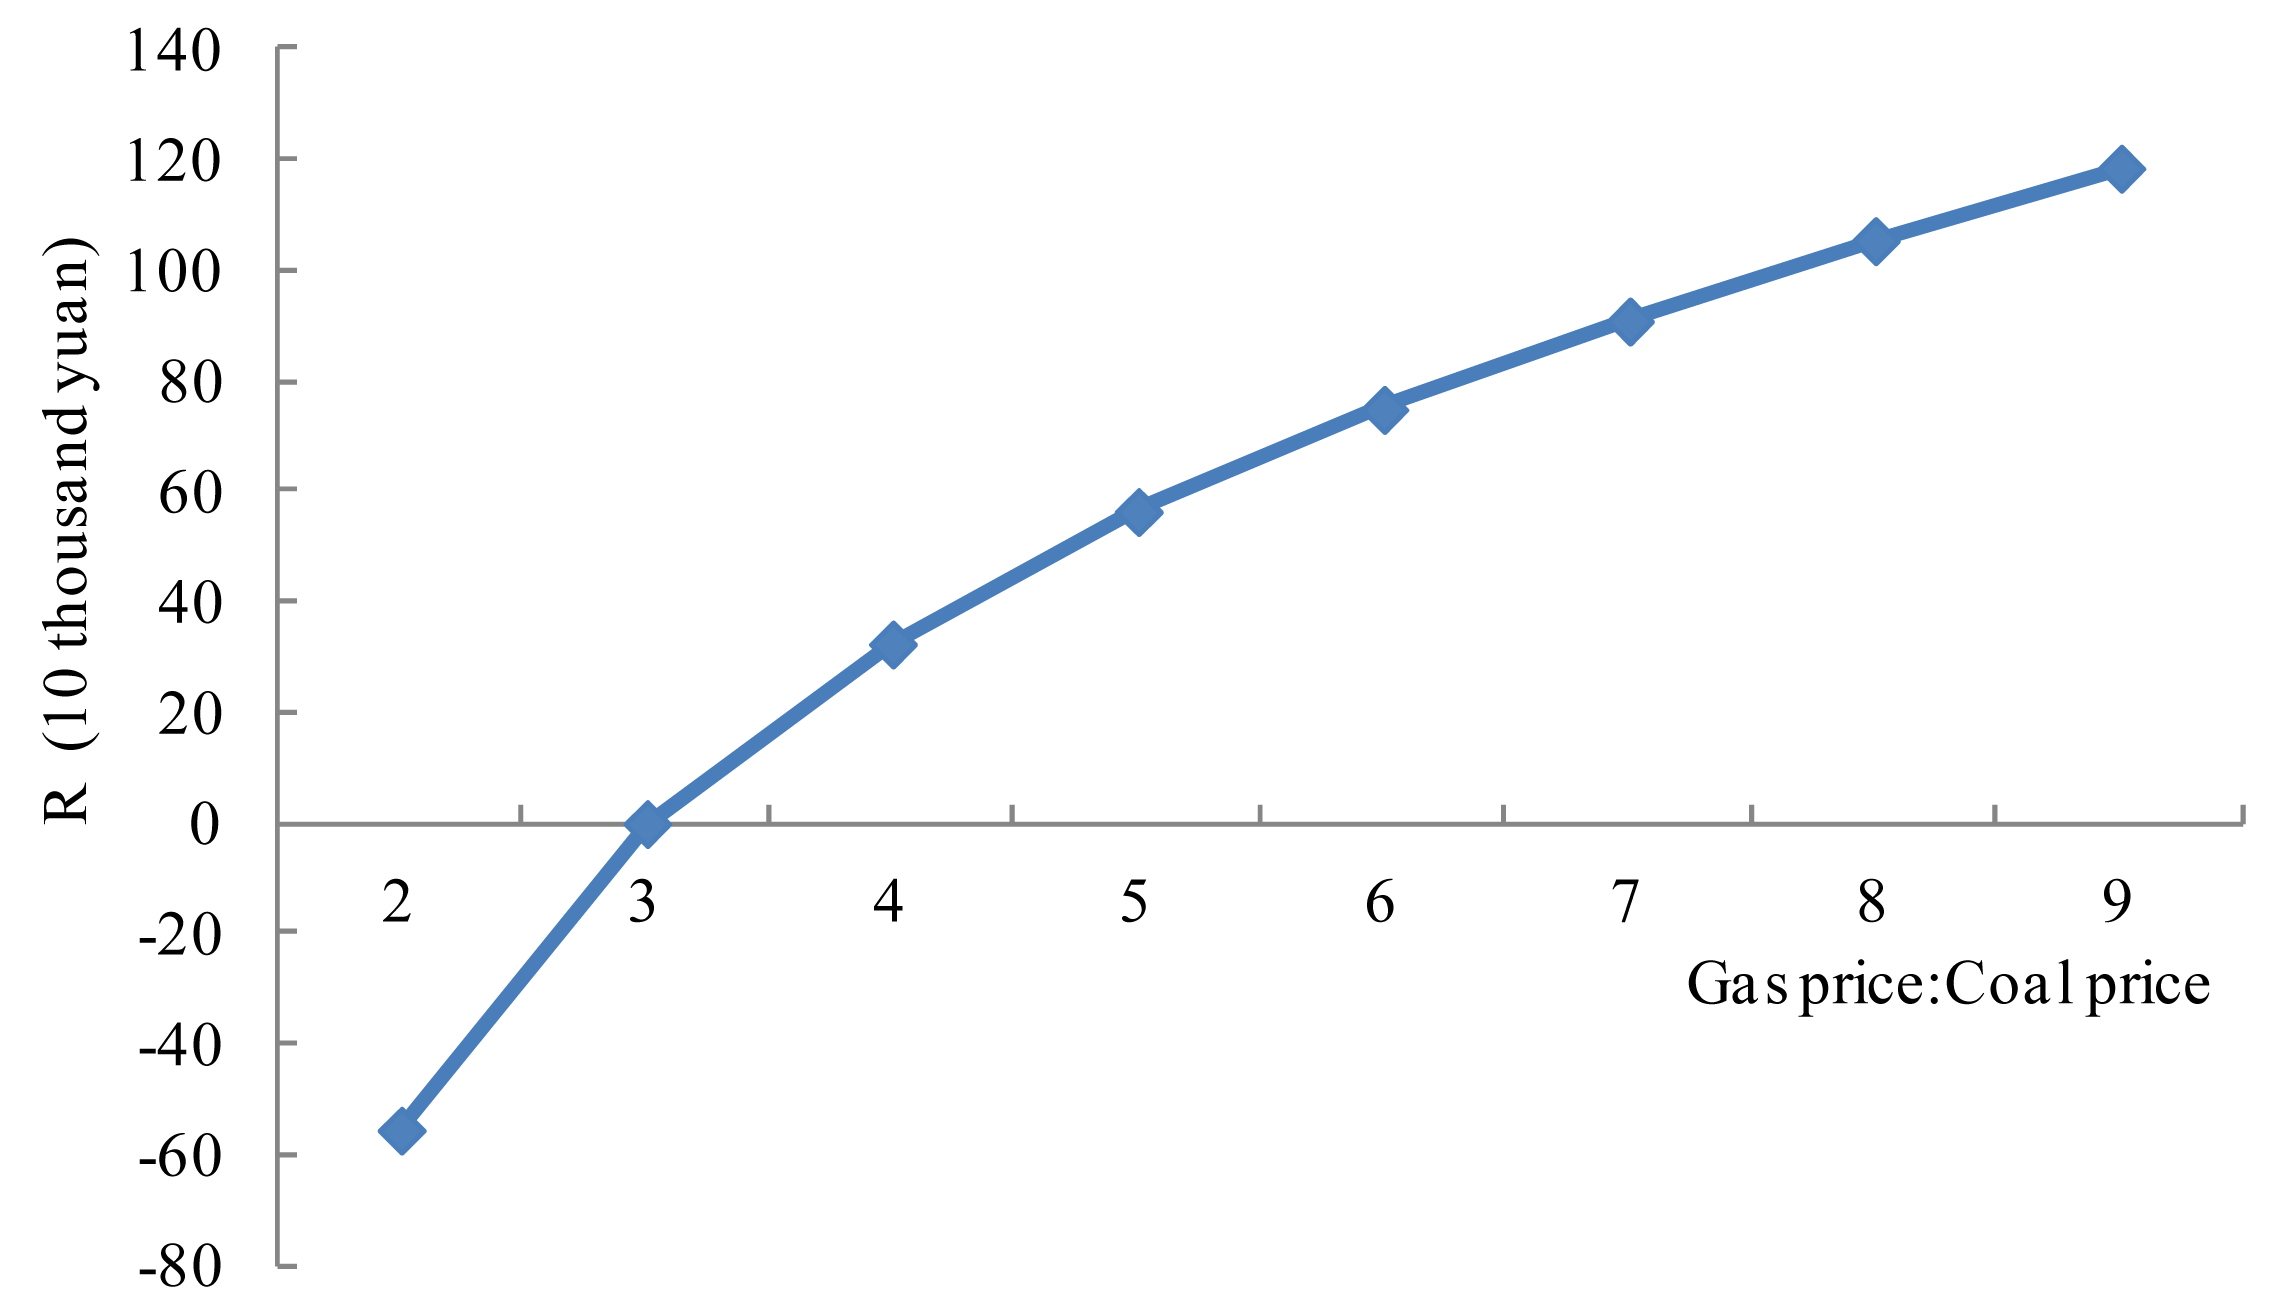
The second and third groups are natural gas and oil, and natural gas and coal. Fixing the oil price and coal price, respectively, and using the same approach as with the first group, we obtain the two different change rates for the natural gas price. Based on the CGE model, we can obtain the simulated results for each group's price ratio fluctuations. These two groups of price ratios are actually studies of the impact of natural gas price changes on the economy and the environment, but the difference is that the reference benchmark of setting natural gas price change rates is different, in that one group takes the fixed oil price as a benchmark and another group takes the fixed coal price as a benchmark. Therefore, we can discuss the two groups together.
With the increase in the price ratio of gas and oil kgo and the price ratio of gas and coal kgc, the change rates of GDP and CPI increase gradually, while there are slight declines in the change rates of energy consumption and CO2 and SO2 emissions. Overall, there will be a limited impact of the natural gas price changes on the economy, inflation and the environment, mainly because it has the smallest proportion of natural gas in Beijing's energy consumption structure. In 2013, natural gas consumption accounted for 5.9% of the primary energy consumption, so the economic development still shows relatively low dependence on natural gas. Using the same method as for the first group, the distributions of the rational price ratios of natural gas and oil, and natural gas and coal, can be determined, as shown in Figures 6 and 7. Compare the curves in Figures 6 and 7, one convex and one concave, indicating that under certain other conditions, the adjustment of the price ratio of gas and oil would make a better contribution to R relative to the price ratio of gas and coal, the rational distributions of kgo and kgc become 1:5–1:1 and 4:1–7:1, respectively.
The literature [19] used international standards as a reference to determine Beijing's reasonable energy price ratios. In this paper, based on the coal price, we draw a simple comparison between the two results, as shown in Table 9.
The optimal energy price ratios obtained in this study are from the perspective of economy and environmental endurance, while the international standard emphasizes the balance of energy utilization in Beijing and abroad. Although the two methods originate from different perspectives and have merits and demerits respectively, in the light of the results, the two methods both show that Beijing's current price ratios for electricity and coal, and natural gas and coal are a little low. Therefore, electricity and natural gas prices should be further adjusted to balance the relationship between economic growth and the environment.
3.3. Sensitivity Analysis
In the model to determine rational energy price ratios, the emission reduction costs vary, caused by the differences in emission reduction technologies, industry types and emission reduction targets, as well as other factors. More importantly, the emission reduction costs play a crucial role in the final results as important parameters. Therefore, taking the analysis of the result of the price ratio between electricity and coal as an example, we perform a Monte Carlo simulation of the model with the different CO2 and SO2 emission reduction costs. The natural gas price ratios are no longer described with a similar analysis method. Because of insufficient costs data to fit, and because the triangular distribution can be seen as a rough approximation of the other distribution, the paper assumes that CO2 and SO2 emission reduction costs obey triangular distribution with parameters shown in Table 10.
Based on Table 10, 180 results of CO2 and SO2 emission reduction costs respectively can be obtained through 180 uses of the Monte Carlo simulation. On this basis, according to Equation (17), the distributions of the equilibrium indicator R at every can be obtained.
As shown in Figure 8, the equilibrium indicator R shows different trends with different costs. The determination of rational energy price ratios is influenced by the mitigation cost, which should be based on different regions, different energy saving technology and cost.
4. Conclusions
This paper establishes the society–economy equilibrium indicator maximization model taking into consideration the economic development and mitigation cost and analyses the optimized price ratio in different situations, and then explores the impact of Beijing's energy price ratio fluctuations on the economy and the environment, and Beijing's reasonable energy price ratio. Although this model has some weaknesses in the treatment of mitigation cost, it provides a new idea for exploring the rationality of energy price ratios in imperfect competitive energy markets. It combines the energy system with the society-economy-environment system, which has some reference value in the determination of rational energy price ratios.
Reasonable energy price ratios should not only reflect the scarcity of energy and the cost of development and utilization, but should also consider the environmental abatement cost and the social affordability. Currently, the regulated prices of Beijing's final energies, such as electricity and gas are too low, and these cannot fully reflect either the average or the marginal costs, leading to an unreasonable energy price ratio.
Beijing should consider improving the energy pricing mechanisms, such as the establishment of a sound dynamic adjustment mechanism between regulated prices and market prices, as well as a more reasonable energy price ratio to be formed by appropriate regulation. These would be preferable to liberalizing the retail prices for electricity or natural gas. Using the empirical analysis, the influence on the economy and the environment of the price ratio fluctuations between electricity and coal is greater than the price ratio fluctuations between natural gas and oil, or between natural gas and coal. Therefore, electricity price reform is particularly important for the establishment of reasonable energy prices.
From the CPI results, it is apparent that the inflation is much more sensitive to electricity prices than natural gas prices. Thus, the NDRC should proceed much more cautiously with electricity price reform than natural gas price reform, and consider social and environmental factors comprehensively.
The price increase in resources and other relevant factors means that the burden of the increase will fall on midstream and downstream businesses and on residential expenditure, however, with the transformation of energy consumption pattern and the further urban development in Beijing, the residents' living standards will be improved, the urban environment quality will be developed and the energy price ratio will gradually move towards a more reasonable level balanced with energy supply and demand. Therefore, to achieve the reform of energy price, they should be supplemented by increases and improvements in resource taxes: on the one hand, the timely introduction of resource taxes can achieve internalization of external costs, so that those who profit from higher prices of resources can undertake social responsibilities correspondingly; on the other hand, tax reduction can relieve the impact of increases in upstream prices on midstream and downstream businesses and on residents.
Acknowledgments
The work described in this paper was supported by the National Natural Science Foundation of China (Grant No. 71273089) and Beijing Natural Science Foundation of China (Grant No. 9122022).
Conflicts of Interest
The authors declare no conflict of interest.
References
- Deng, H.X.; Hu, Y.F. Research on the relationship between reasonable energy pricing and energy saving. Appl. Energy Technol. 2002, 5, 1–3, In Chinese. [Google Scholar]
- Yang, Y.C. The impact of energy price control policy on china's export comparative advantages. J. Shijiazhuang Univ. Econ. 2010, 33, 12–15. [Google Scholar]
- He, Y.X.; Zhang, S.L.; Yang, L.Y. Economic analysis of coal price-electricity price adjustment in China based on the CGE model. Energy Policy 2010, 38, 6629–6637. [Google Scholar]
- Voronin, S.; Partanen, J. Price forecasting in the day-ahead energy market by an iterative method with separate normal price and price spike frameworks. Energies 2013, 6, 5897–5920. [Google Scholar]
- Hong, Y.Y.; Wu, C.P. Day-ahead electricity price forecasting using a hybrid principal component analysis network. Energies 2012, 5, 4711–4725. [Google Scholar]
- Mirchi, A.; Hadian, S.; Madani, K.; Rouhani, O.M.; Rouhani, A.M. World energy balance outlook and OPEC production capacity: implications for global oil security. Energies 2012, 5, 2626–2651. [Google Scholar]
- Reynolds, D.B.; Kolodziej, M. North American natural gas supply forecast: The Hubbert method including the effects of institutions. Energies 2009, 2, 269–306. [Google Scholar]
- Ma, H.Y.; Les, O. The integration of major fuel source markets in China: Evidence from panel cointegration tests. Energy Econ. 2010, 32, 1139–1146. [Google Scholar]
- He, L.Y.; Li, Y. Characteristics of China's coal, oil and electricity price and its regulation effect on entity economy. Procedia Earth Planet. Sci. 2009, 1, 1627–1634. [Google Scholar]
- Hang, L.M.; Tu, M.Z. The impacts of energy prices on energy intensity: Evidence from China. Energy Policy 2007, 35, 2978–2988. [Google Scholar]
- Tadahiro, N.; Hamori, S. Causality-in-mean and causality-in-variance among electricity prices, crude oil prices, and yen–US dollar exchange rates in Japan. Res. Int. Bus. Financ. 2012, 26, 371–386. [Google Scholar]
- Egil, F. Causal modeling and inference for electricity markets. Energy Econ. 2011, 33, 404–412. [Google Scholar]
- Theodore, P.; Emilie, R. Oil and gas markets in the UK: Evidence from a cointegrating approach. Energy Econ. 2007, 29, 329–347. [Google Scholar]
- Hassan, M. Electricity prices and fuel costs: Long-run relations and short-run dynamics. Energy Econ. 2009, 31, 503–509. [Google Scholar]
- Chi, K.; Arne, O.; Horowitz, I. Bi-directional causality in California's electricity and natural-gas markets. Energy Policy 2006, 34, 2060–2070. [Google Scholar]
- James, W.M.; David, A.B. Market integration among electricity markets and their major fuel source markets. Energy Econ. 2009, 31, 482–491. [Google Scholar]
- Zhu, C.Z. Research on the relationship between electricity and gas. Chin. Consult. Eng. 2003, 4, 28–29. [Google Scholar]
- Ma, X.G.; Zhang, S.R. Analysis of the reasonable price ratio of electricity to gas in consumption. Energy Res. Inf. 2000, 16, 1–8. [Google Scholar]
- Lu, X.Y.; Zheng, H.Q.; Yang, K.F. Analysis on the rationality of China's energy price ratio according to the selected international standards. China Energy 2009, 31, 39–42. [Google Scholar]
- Beijing Municipal Commission of Development and Reform. Adjustment Measures for Feed-in Tariffs of Local Power Plants. Available online: http://www.bjpc.gov.cn/tztg/200508/t47981.htm (accessed on 24 August 2005). In Chinese.
- The Central People's Government of the People's Republic of China. Implementation of Oil Price and Tax Reform. Available online: http://www.gov.cn/zwgk/2008-12/19/content_1182128.htm (accessed on 19 December 2008). In Chinese.
- The Central People's Government of the People's Republic of China. Oil Price Management (Tentative). Available online: http://www.gov.cn/zwgk/2009-05/08/content_1308543.htm (accessed on 8 May 2009). In Chinese.
- Beijing Municipal Commission of Development and Reform. Measures for Beijing Residential Multi-Step Tariff Pricing Reform. Available online: http://www.bjpc.gov.cn/tztg/201206/t3195861.htm (accessed on 15 June 2012). In Chinese.
- Ma, Y.Q. Construct and Application of Beijing CGE. Master's Thesis, Jilin University, Changchun, Jilin, China, 7 August 2007; pp. 12–18, In Chinese. [Google Scholar]
- Robinsona, S.; Antonio, Y.N.; Raúl, H.O.; Jeffrey, D.L.; Devarajana, S. From stylized to applied models: Building multi-sector CGE models for policy analysis. N. Am. J. Econ. Financ. 1999, 10, 5–38. [Google Scholar]
- Nazari, S.; Shahhoseini, O.; Sohrabi, K.A.; Davari, S.; Paydar, R.; Delavar-Moghadam, Z. Experimental determination and analysis of CO2, SO2 and NOx emission factors in Iran's thermal power plants. Energy 2010, 35, 2992–2998. [Google Scholar]
- Ralph, E.H.; Rogner, H.H.; Gregory, K. Carbon emission and mitigation cost comparisons between fossil fuel, nuclear and renewable energy resources for electricity generation. Energy Policy 2003, 31, 1315–1326. [Google Scholar]
- Cai, L. Environmental protection and flue gas desulfurization technology in power plant. J. Electr. Power Vocab. Technol. 2009, 1, 6–9. [Google Scholar]
- Xia, Y.; Fan, Y. Study on emission reduction strategy based on evolutive CO2 abatement cost curve. China Soft Sci. 2012, 3, 12–22, In Chinese. [Google Scholar]
- Gao, P.F.; Chen, W.Y.; He, J.K. The analysis of marginal abatement cost in China. J. Tsinghua Sci. Technol. 2004, 44, 1192–1195, In Chinese. [Google Scholar]
- The 2010 Input-Output Table with 42 Sectors in Beijing. Available online: http://www.docin.com/p-673804497.html (accessed on 22 January 2014). In Chinese.
- The Beijing's Fiscal Data 2011 in the National Bureau of Statistics of China. Available online: http://data.stats.gov.cn/workspace/index;jsessionid=93AD1D45ACB3190FF53C942F850AE30B?m=fsnd (accessed on 22 January 2014). In Chinese.
- The Beijing Statistical Yearbook 2011. Available online: http://www.bjstats.gov.cn/nj/main/2011-tjnj/index.htm (accessed on 22 January 2014). In Chinese.
- Qin, C.C. Study about balance of social accounting matrix. J. Quant. Tech. Econ. 2007, 1, 31–37. [Google Scholar]
- Zhai, F. Impacts of the Doha Development Agenda on China: The Role of Labor Markets and Complementary Education Reforms; World Bank Policy Research Working Paper; World Bank: Washington, DC, USA, 2005. [Google Scholar] [CrossRef]
- Willenbockel, D. Structural Effects of a Real Exchange Rate Revaluation in China: A CGE Assessment; Munich Personal RePEc Archive (MPRA), Munich University Library: Munich, Germany, 2006. Available online: http://mpra.ub.uni-muenchen.de/920/ (accessed on 25 November 2006).
- He, Y.X.; Yang, L.F.; He, H.Y.; Luo, T.; Wang, Y.J. Electricity demand price elasticity in China based on computable general equilibrium model analysis. Energy 2011, 36, 1115–1123. [Google Scholar]
- Zheng, X.L.; Bao, Q.; Guan, H. Dynamic estimation on inter-fuel substitution elasticity in China's manufacturing sector. Energy Technol. Econ. 2012, 24, 33–38, In Chinese. [Google Scholar]
- Huang, L.; Zhou, Y. Energy output and substitution elasticity analysis based on trans-log production function. J. Hehai Univ. (Nat. Sci.) 2008, 36, 134–138, In Chinese. [Google Scholar]
- Lin, B.Q.; Mou, D.G. The impact of energy price increases on macro-economy: An analysis based on CGE method. Econ. Res. J. 2008, 11, 88–100. [Google Scholar]
- Electricity sales Price Table of Beijing. Available online: http://wenku.baidu.com/view/734cd760783e0912a2162a6c.html (accessed on 2 December 2011). In Chinese.
- The National Oil Market Management Information System. Available online: http://oilsyggs.mofcom.gov.cn/ (accessed on 22 January 2014). In Chinese.
- Beijing Price Monitoring Center. Available online: http://www.ccpn.gov.cn/ (accessed on 22 January 2014). In Chinese.
- China Energy Investment Net. Available online: http://ccei.org.cn (accessed on 22 January 2014). In Chinese.
- Intergovernmental Panel on Climate Change (IPCC). Emission Factors, 2006. Available online: http://www.doc88.com/p-594324607032.html (accessed on 17 September 2012). In Chinese.
- The General Calculation Principles of the Comprehensive Energy Consumption (GB/T 2589-2008). Available online: http://www.360doc.com/content/10/1015/16/3945968_61256789.shtml (accessed on 15 October 2010). In Chinese.
- Provincial Greenhouse Gas List Compilation Guidelines (NDRC [2011]1041). Available online: http://www.docin.com/p-587267505.html (accessed on 21 January 2013). In Chinese.
- Energy Statistics Manual. Available online: http://www.docin.com/p-81488876.html (accessed on 19 September 2010). In Chinese.
- The Method of Operation and Management for Desulfurization with Gridding Price in Coal-Fired Units and Desulfurization Facilities. Available online: http://www.zhb.gov.cn/gkml/hbb/gwy/200910/t20091030_180711.htm (accessed on 29 May 2007). In Chinese.
- The Top Ten Events of Beijing's Energy Conservation in 2013. Available online: http://www.cecol.com.cn/news/20140122/011945822.html (accessed on 22 January 2014). In Chinese.
- Xu, G. The Comprehensive Evaluation and Multi-Objective Planning of Energy Power Systems with CO2Emissions. Ph.D. Thesis, Graduate University of Chinese Academy of Sciences, Beijing, China, 28 December 2007. [Google Scholar]
- Chao, Q.C.; Chen, W.Y. The Summary of Carbon Capture and Storage Technology and Its Impact on China. Adv. Earth. Sci. 2006, 21, 291–298. [Google Scholar]
- International Energy Agency (IEA). Energy Prices and Taxes Quarterly Statistics Second Quarter 2010. Available online: http://www.oecd-ilibrary.org/energy/energy-prices-and-taxes/volume-2010/issue-2_energy_tax-v2010-2-en (accessed on 22 January 2014).


| Energy | Total amount of CO2 emissions | Total amount of SO2 emissions |
|---|---|---|
| Coal | ||
| Oil | ||
| Natural gas | - |
| Energy | The total emission reduction cost of CO2 | The total emission reduction cost of SO2 |
|---|---|---|
| Coal | ||
| Oil | ||
| Natural gas | - |
| Account | ACT | COM | LAB | CAP | HH | ENTR | LGOV | CGOV | OP | ROW | S-I | DSTK | Total |
|---|---|---|---|---|---|---|---|---|---|---|---|---|---|
| ACT | - | 63,722 | - | - | - | - | - | - | - | - | - | - | 63,722 |
| COM | 40,712 | - | - | - | 6,701 | - | 3,099 | 2,068 | 17,860 | 10,169 | 9,523 | 1,880 | 92,013 |
| LAB | 10,450 | - | - | - | - | - | - | - | - | - | - | - | 10,450 |
| CAP | 10,061 | - | - | - | - | - | - | - | - | - | - | - | 10,061 |
| HH | - | - | 10,450 | - | - | 66 | 418 | - | - | - | - | - | 10,934 |
| ENTR | - | - | - | 10,061 | - | - | - | - | - | - | - | - | 10,061 |
| LGOV | 1,125 | - | - | - | 310 | 209 | - | 3,102 | - | - | - | - | 4,746 |
| CGOV | 1,374 | 773 | - | - | 7 | 515 | 1,205 | - | - | 1,329 | - | - | 5,204 |
| OP | - | 18,971 | - | - | - | - | - | - | - | - | - | - | 18,971 |
| ROW | - | 8,547 | - | - | - | - | - | - | - | - | - | - | 8,547 |
| S-I | - | - | - | - | 3,915 | 9,271 | 23 | 34 | 1,111 | −2,951 | - | - | 11,404 |
| DSTK | - | - | - | - | - | - | - | - | - | - | 1,880 | - | 1,880 |
| Total | 63,722 | 92,013 | 10,450 | 10,061 | 10,934 | 10,061 | 4,746 | 5,204 | 18,971 | 8,547 | 11,404 | 1,880 | 247,993 |
Note: ACT—activities; COM—commodities; LAB—labor; CAP—capital; HH—households; ENTR—enterprises; LGOV—local government; CGOV—central government; OP—other province; ROW—rest of the world; S-I—savings investment; DSTK—stock changes.
| Energy | Average retail price | Conversion factor | Average retail price after conversion (US$/t) | Source |
|---|---|---|---|---|
| Electricity | 0.632 yuan/kW·h | 1 kW·h = 8.6 × 10⁻⁵ t | 1186.64 | Electricity sales price Table of Beijing 2013 [41] |
| Oil | 8.32 yuan/L | 1 L = 8.346 × 10⁻⁴ t | 1609.70 | The national oil market management information system [42] |
| Natural gas | 3.03 yuan/m3 | 1 t = 1.111 × 10³ m3 | 543.08 | Beijing Price Monitoring Center [43] |
| Coal | 580.00 yuan/t | 1 × 10⁷ kcal = 1 t | 187.31 | ccei.org.cn [44] |
Note: The exchange rate between RMB and US Dollars of 2013 is 6.193 yuan/US$.
| Energy | Convert coefficient to standard coal | Carbon content of unit calorific value | Carbon oxidation rate | Emission factor | |
|---|---|---|---|---|---|
| Coal | 20,908 kJ/kg | 0.7143 kg ce/kg | 26.37 (t-C/TJ) | 0.94 | 1.9003 kgCO2/kg |
| Oil | 41,816 kJ/kg | 1.4286 kg ce/kg | 20.1 (t-C/TJ) | 0.98 | 3.0202 kgCO2/kg |
| Natural gas | 38,931 kJ/m3 | 1.3300 kg ce/m3 | 15.3 (t-C/TJ) | 0.99 | 2.1622 kgCO2/m3 |
Note: 1. The lower calorific value of one kilogram standard coal (1 kg ce) is equal to 29,307 (kJ), and the data of coal and oil are represented by the raw coal and crude oil, respectively; 2. The data of first two columns in the above table refers to The General Calculation Principles of the Comprehensive Energy Consumption (GB/T 2589-2008) [46]; 3. The data of next two columns in the above table refers to Provincial Greenhouse Gas List Compilation Guidelines (NDRC[2011]1041) [47].
| Emission source | SO2 | Unit |
|---|---|---|
| Oil | 0.0018 | kg SO2/kg |
| Natural gas | - | kg SO2/kg |
| Coal | 0.0704 | kg SO2/kg |
Note: China's fuel calorific values came from Energy Statistics Manual 2008 [48].
| Account | ACT | COM | LAB | CAP | HH | ENTR | LGOV | CGOV | OP | ROW | S-I | DSTK | Total |
|---|---|---|---|---|---|---|---|---|---|---|---|---|---|
| ACT | - | 61,844 | - | - | - | - | - | - | - | - | - | - | 61,844 |
| COM | 42,621 | - | - | - | 6,223 | 0 | 1,778 | 1,185 | 18,519 | 9,562 | 7,152 | 1,795 | 88,834 |
| LAB | 3,030 | - | - | - | - | - | - | - | - | - | - | - | 3,030 |
| CAP | 13,611 | - | - | - | - | - | - | - | - | - | - | - | 13,611 |
| HH | - | - | 3,030 | - | - | 5,419 | 475 | - | - | - | - | - | 8,924 |
| ENTR | - | - | - | 13,611 | - | - | - | - | - | - | - | - | 13,611 |
| LGOV | 646 | - | - | - | 91 | 101 | - | 3,057 | - | - | - | - | 3,895 |
| CGOV | 1,938 | 443 | - | - | 362 | 539 | 838 | - | - | 1,667 | - | 370 | 6,156 |
| OP | - | 16,650 | - | - | - | - | - | - | - | - | - | 860 | 17,510 |
| ROW | - | 9,897 | - | - | - | - | - | - | - | - | - | - | 9,897 |
| S-I | - | - | - | - | 2,247 | 7,552 | 804 | 1,913 | −1,009 | −1,331 | - | - | 10,176 |
| DSTK | - | - | - | - | - | - | - | - | - | - | 3,025 | - | 3,025 |
| Total | 61,844 | 88,834 | 3030 | 13,611 | 8924 | 13,611 | 3895 | 6156 | 17,510 | 9897 | 10,176 | 3025 | |
| No. | CPI constraint | R value range | The rational price ratio corresponding to Max (R) |
|---|---|---|---|
| 1 | −1% ≤ CPI ≤ 1% | −6.77 ≤ R ≤ 1.50 | 7.3:1 |
| 2 | −2% ≤ CPI ≤ 2% | −15.71 ≤ R ≤ 2.31 | 8.3:1 |
| 3 | −3% ≤ CPI ≤ 3% | −23.56 ≤ R ≤ 2.72 | 9.3:1 |
| Energy ratio | Baseline | CGE simulation results | International level a | U.S. b |
|---|---|---|---|---|
| Electricity price: coal price | 6.3:1 | 7.3:1∼9.3:1 | 13:1 | 15:1 |
| Gas price: coal price | 2.9:1 | 4:1∼7:1 | 4:1 | 5:1 |
Note:
awith the average price ratio of Organization for Economic Co-operation and Development (OECD), represents the international average. The price ratios are calculated according to 2007 energy price statistics of OECD.bthe price ratios are calculated according to 2007 energy price statistics of the United States. Data source: IEA, Energy Prices and Taxes Quarterly Statistics second quarter 2010 [53].| Uncertainties | Probability distribution | Parameters | ||
|---|---|---|---|---|
| Minimum (yuan/t) | The most probable value (yuan/t) | Maximum (yuan/t) | ||
| CO2 emission reduction cost | Triangular distribution | 125 | 250 | 375 |
| SO2 emission reduction cost | Triangular distribution | 315 | 630 | 945 |
© 2014 by the authors; licensee MDPI, Basel, Switzerland This article is an open access article distributed under the terms and conditions of the Creative Commons Attribution license ( http://creativecommons.org/licenses/by/3.0/).
Share and Cite
He, Y.; Liu, Y.; Xia, T.; Du, M.; Guo, H. The Optimal Price Ratio of Typical Energy Sources in Beijing Based on the Computable General Equilibrium Model. Energies 2014, 7, 2961-2984. https://doi.org/10.3390/en7052961
He Y, Liu Y, Xia T, Du M, Guo H. The Optimal Price Ratio of Typical Energy Sources in Beijing Based on the Computable General Equilibrium Model. Energies. 2014; 7(5):2961-2984. https://doi.org/10.3390/en7052961
Chicago/Turabian StyleHe, Yongxiu, Yangyang Liu, Tian Xia, Min Du, and Hongzhen Guo. 2014. "The Optimal Price Ratio of Typical Energy Sources in Beijing Based on the Computable General Equilibrium Model" Energies 7, no. 5: 2961-2984. https://doi.org/10.3390/en7052961
APA StyleHe, Y., Liu, Y., Xia, T., Du, M., & Guo, H. (2014). The Optimal Price Ratio of Typical Energy Sources in Beijing Based on the Computable General Equilibrium Model. Energies, 7(5), 2961-2984. https://doi.org/10.3390/en7052961