A Proposal for Typical Artificial Light Sources for the Characterization of Indoor Photovoltaic Applications

Abstract
: There are currently no international norms which define a method for characterizing photovoltaic solar cells for indoor applications. The current standard test conditions are not relevant indoors. By performing efficiency simulations based on the quantum efficiency of typical solar cells and the light spectra of typical artificial light sources, we are able to propose the first step for developing a standard by determining which light sources are relevant for indoor PV characterization and which are not or are redundant. Our simulations lead us to conclude that indoor light sources can be divided into three different categories. For the characterization of photovoltaic solar cells in indoor environments, we propose that solar cells be measured under one light source from each group.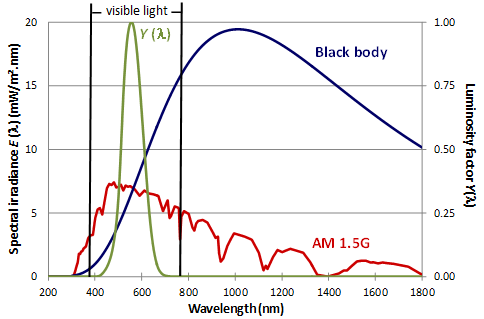
1. Introduction
Nowadays, wireless communication networks focused on indoor applications (cameras, router nodes, sensor networks, …) use batteries as their source of energy. However, batteries have a limited lifetime and have to be replaced regularly. The lifetime of the battery is often the limiting factor for the lifetime of the device. Often, the cost of replacing the battery outweighs the cost of the device itself. Also from an environmental perspective, battery waste should be minimized whenever possible. Moreover, during the last decade battery technology has not improved significantly in terms of energy density and size, especially for low power applications. However, if the device itself were able to harvest energy from renewable resources in the environment, the lifetime of the device could be extended many times over.
Photovoltaic (PV) solar energy can be an efficient natural energy source. Indoor photovoltaic applications have been prominent on the market since the first half of the 1970s. The electrical energy spent for lighting purposes can be partly recycled by powering devices with photovoltaic solar cells. Indeed, the radiation (visible and non-visible) emitted from artificial light sources can be used for the production of electricity. Mainly amorphous silicon is used for this purpose in watches and calculators. The latter has been the most successful indoor PV application to date, reaching annual sales of 10 million units by 1990, and thus avoiding the use of millions of alkaline batteries. This volume of solar cell sales represented at the time approximately 10% of the global photovoltaic shipments [1]. Since then, the solar calculator market has saturated while the outdoor PV market has boomed. Therefore, in order for the indoor PV market to grow, it is necessary for it to find applications in other devices such as router nodes, cameras and sensor networks. The feasibility of PV for indoor low power applications has already been demonstrated, e.g., for wireless sensor nodes [2–4] and under certain conditions for phone chargers [5], computer mice [6] and indoor positioning systems [7,8].
Although crystalline Si cells still dominate the PV market, second generation solar cells, i.e., thin film technologies, are rapidly entering the market. The different PV cells for applications on Earth are rated by their power output under standard test conditions [9], i.e., an illumination intensity of 103 W/m2 under the global AM 1.5G spectrum. Although these conditions are seldom achieved in practice (except in the lab), this characterization provides a reasonable guideline for comparing different solar cell types under outdoor conditions. However, the standard test conditions are not relevant for indoor applications. Typically, the light intensity under artificial lighting conditions found in offices and factories is less than 5 W/m2 as compared to 100–1000 W/m2 under outdoor conditions, depending on the type of light source and its distance [10]. Moreover, the spectrum can be totally different from the outdoor solar spectrum. The spectrum depends not only on the type of light source, but also on the presence of reflected and diffused light. Unfortunately, there are no international norms which determine a way of characterizing solar cells for indoor applications.
In this paper we will focus on the influence of the type of artificial light source on photovoltaic solar cells. We will compare—by simulation—typical artificial light sources with absorption spectra for different types of solar cells. From this comparison, we will propose which artificial light sources can be meaningful for the characterization of solar cells for indoor use. More specifically:
There are dozens of different types of artificial light sources. First, we discuss which artificial light sources are to be taken into account for this study and could be utilized as a standard for the indoor characterization;
We determine the performance of different types of solar cells under indoor illumination by efficiency simulations based on the quantum efficiencies of the solar cells and the light spectra of the different light sources;
Based on our results, we group the light sources into different categories. In this way, we can formulate a proposal for typical artificial light sources for the characterization of indoor photovoltaic applications.
Before we go into details, it is also important to understand what this paper does not aim to achieve. We do not want to formulate a detailed characterization standard for indoor PV, nor do we want to predict the exact power production of a certain solar cell under a certain light source. We only want to propose a first step towards developing a standard by determining which light sources are relevant for indoor PV characterization and which are not or are redundant.
2. Indoor Light Sources
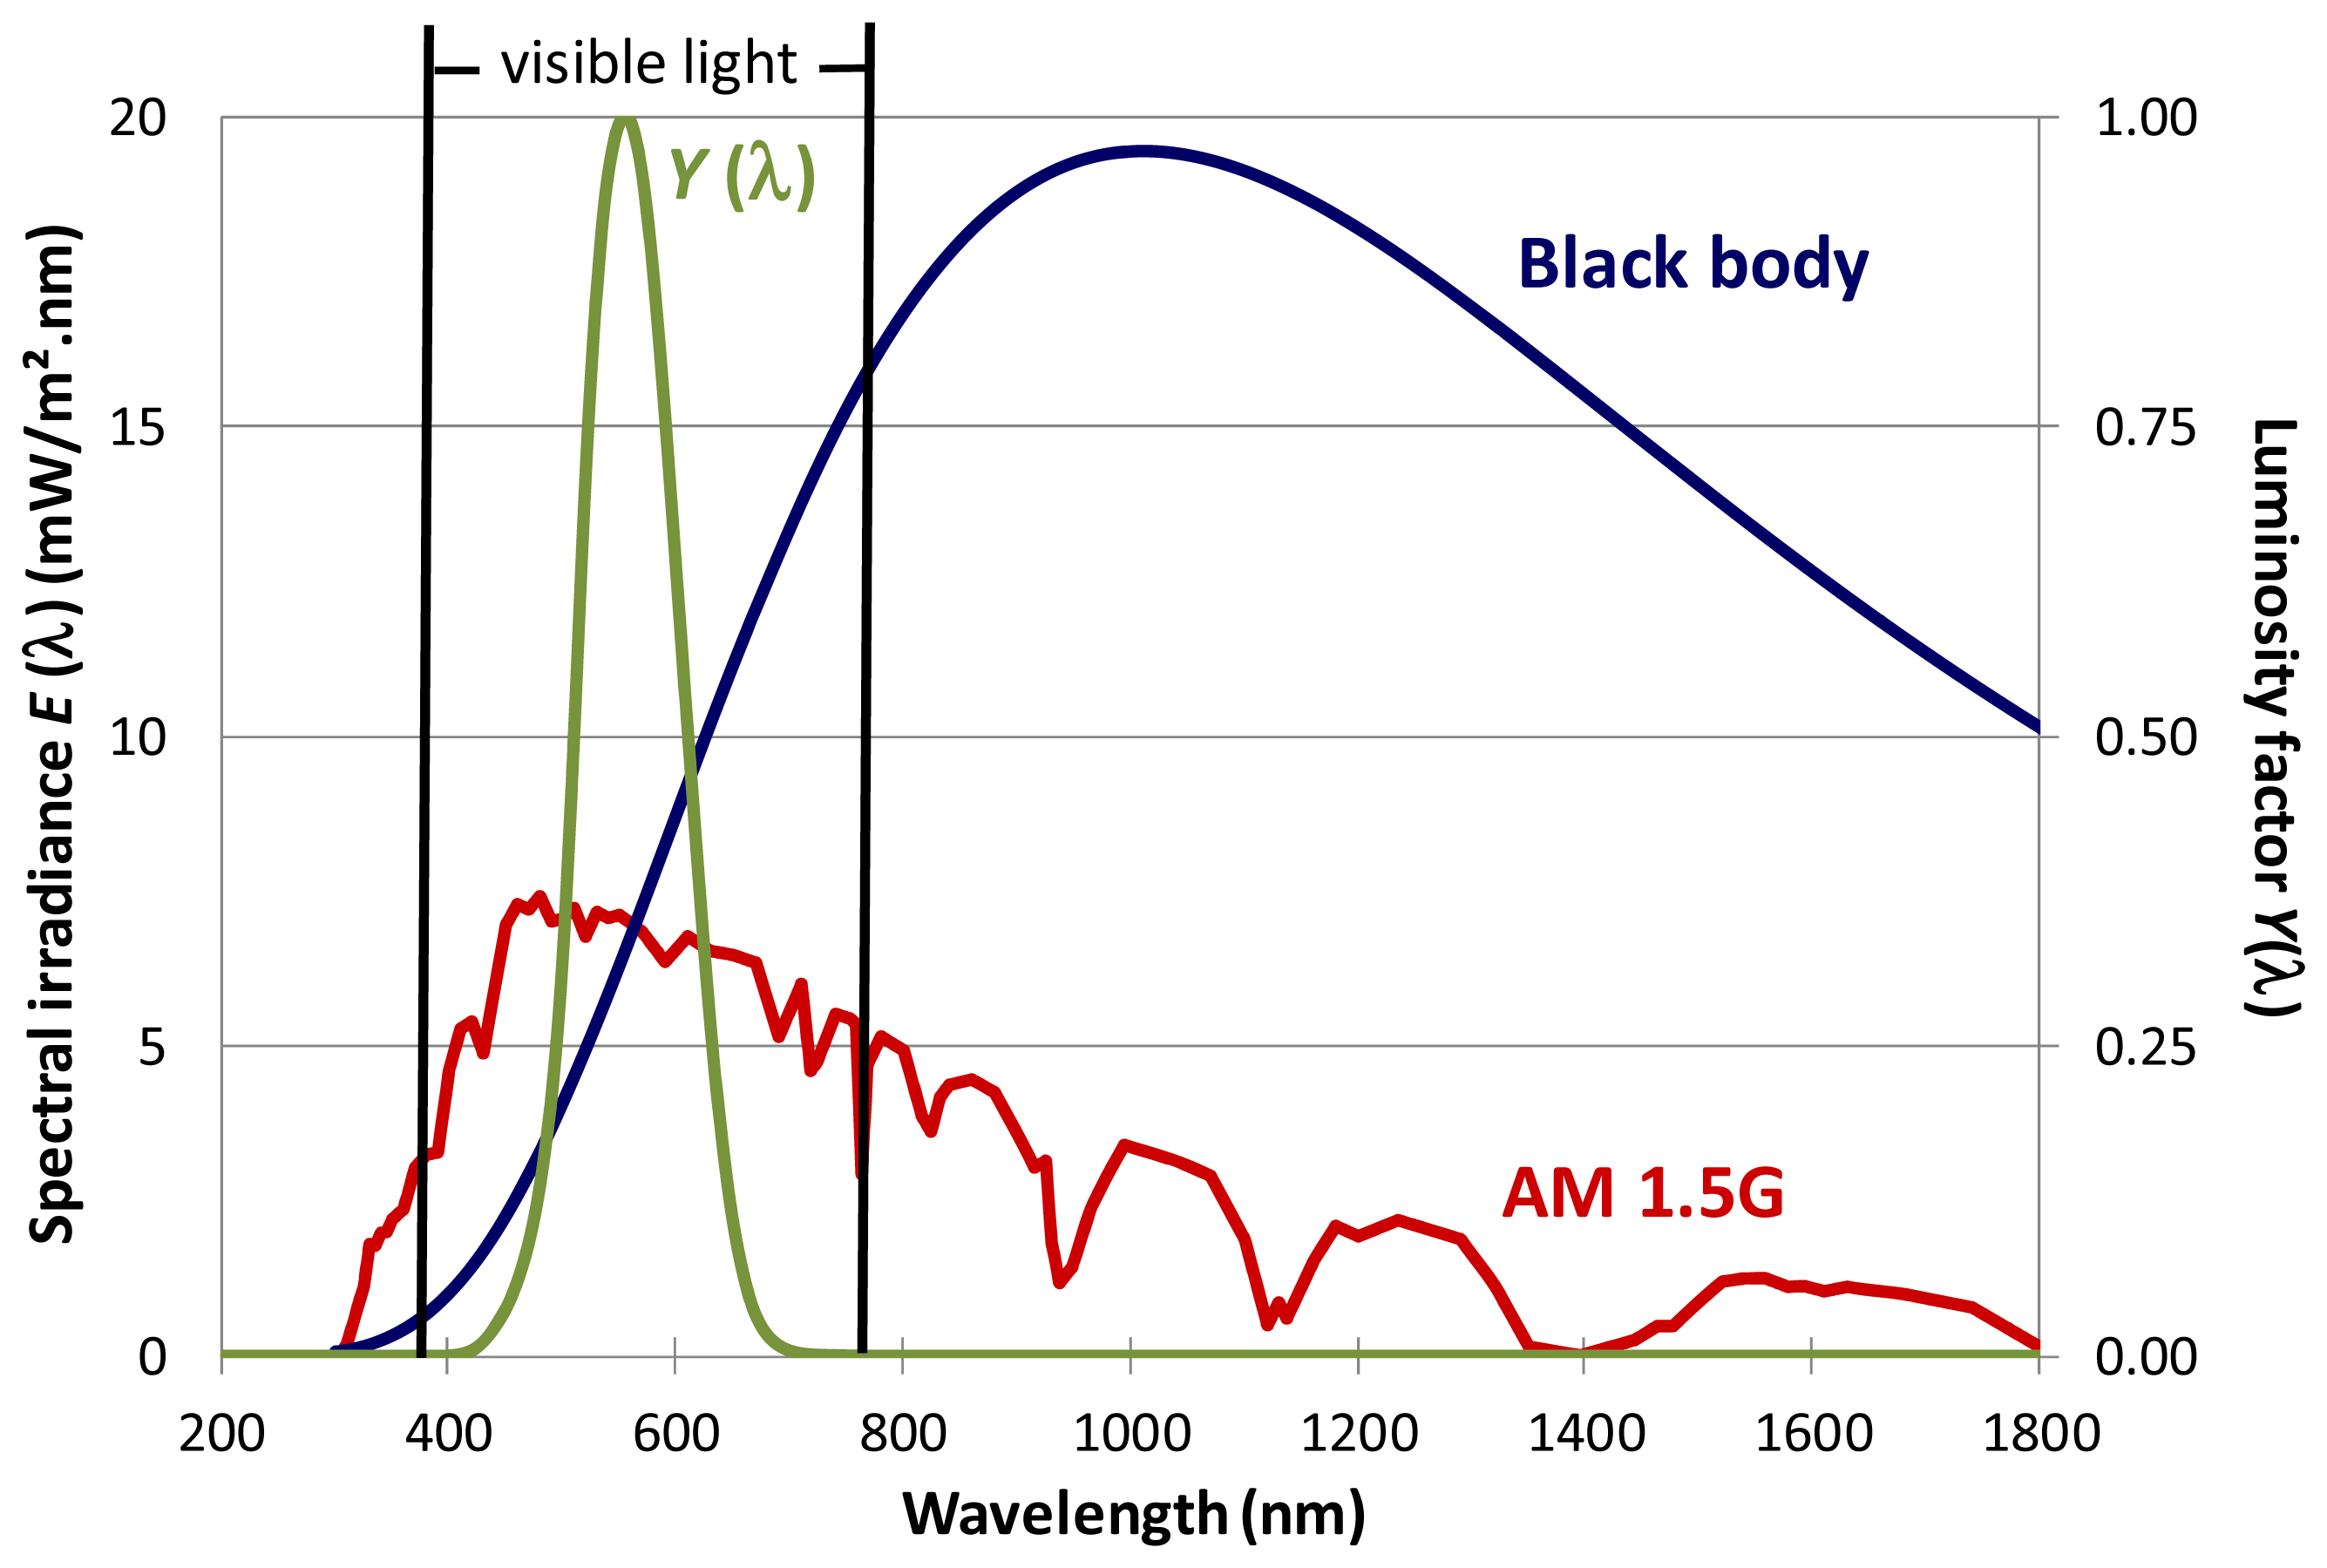
A broad spectrum of solar radiation reaches the Earth. Indeed, the standard outdoor solar spectrum AM 1.5G is defined within the range from 280 nm to 4000 nm. Figure 1 shows a part of the spectral irradiance of the solar spectrum AM 1.5G. The total power density E of the radiation can easily be determined by summing the contributions at each wavelength λ of the spectral irradiance Eλ:
However, the total power density E for the radiation of an artificial light source does not indicate how weak or strong we perceive the light source to be. Indeed, the human eye is only capable of detecting light within a narrow wavelength region: from 380 (violet) to 780 nm (red). Moreover, the sensitivity of the human eye is not constant within this range: it peaks around 555 nm. Although the sensitivity of the eye differs from person to person, an empirical, internationally accepted standard curve as a function of the wavelength has been proposed. This standard sensitivity curve is called the luminosity factor Y(λ) (Figure 1). Using this factor, the irradiance (in W/m2) can be converted into the corresponding quantity illuminance Ev, which takes into account the sensitivity of the human eye:
The illuminance Ev is expressed in lumen (lm) per m2 or lux. The coefficient Km is equal to 683 lm/W and is part of the empirical definition of the lumen. This coefficient Km is called the maximum spectral efficacy and is chosen such that an irradiance of 1 kW/m2 of the global solar spectrum AM 1.5G corresponds to 100 klux [11].
The radiation in an indoor environment logically depends on the type of light source present. However, the radiation is influenced by many other factors [1]. Direct and diffuse daylight can enter the indoor room through a window. The glass properties and glass coating can alter the spectrum of the outdoor light. The location of the PV cell in the room, its orientation, indoor obstacles, etc. can all influence the performance. Indoor lit objects will absorb radiant energy, which they can re-emit at different wavelengths. Radiation in the room is reflected. Recent investigations have shown that there can be a spectral bias introduced due to albedo from common surfaces [12,13]. Certainly in indoor environments, whether the PV cell is positioned vertically or horizontally, the albedo irradiation can change the spectral distribution of the incident irradiation on the surface of the photovoltaic solar cell, which in turn affects the performance. When taking this into account, it has been seen that surface materials can have a significant effect on not only the absolute amount of reflected light, but also in its spectral distribution. We refer to [13] for an analysis of the effects of spectral bias due to the specular reflectivity of commonly occurring surface materials (both man-made and natural) and their albedo effects on PV materials. It was for example demonstrated that the albedo of paint, wood and brick produces a large difference between different PV technologies, based primarily on their colors. In this paper, we make abstraction of all those influences: indeed, we only want to focus on the influence of one variable, i.e., the type of artificial light source.
Of course, a lot of different light sources exist and the question arises which light sources are “typical”. The International Commission on Illumination (CIE) is responsible for publishing binding standards for different types of light sources, called illuminants. A standard illuminant represents a mathematical table of relative energy versus wavelength, used for colorimetric calculations. It is a (theoretical) source of visible light with a set spectrum, determined by convention and therefore provides a worldwide basis for comparing images under different lighting.
Which illuminants are useful standards for indoor illumination? We consider some typical, widely used, light sources for indoor environments (residential and commercial) and relate them to an appropriate illuminant (standard).
First, we will propose a standard for the common incandescent light bulb. An incandescent lamp consists of a balloon of (usually) glass in which a filament is placed that is heated to high temperatures by the Joule effect. To a first approximation the filament can be considered as a black body radiator. In incandescent lamps, the filament usually consists of tungsten heated to a temperature of 2000 to 3000 K. The CIE has agreed upon a standard for the incandescent light bulb, called “illuminant A”. This illuminant is intended to represent typical, domestic, tungsten-filament lighting. Its relative spectral power distribution is that of a Planckian radiator at a temperature of approximately 2856 K [14].
In other words, a typical light bulb can be characterized by a black body at temperature T = 2856 K. Technically, illuminant A is only defined over the spectral region from 300 nm to 830 nm. However, solar cells often absorb longer wavelengths. Therefore, we will not use illuminant A itself to represent the spectrum of the incandescent light bulb, but we will use Planck's law for a black body at a temperature of 2856 K. In the 300–830 nm range, the difference between Planck's law at this temperature and illuminant A never exceeds 1%.
The illuminants are defined relative to each other. If we want to compare the same lighting conditions, we have to scale all light sources to an equal illumination for the human eye to obtain a correct comparison. We choose a value of 500 lux because it is recommended for general offices. Where the main task is less demanding, e.g., a corridor, a lower level (e.g., 100 lux) is sufficient. The required illumination can also be higher (1000 lux) in e.g., production rooms in industry where detailed work is necessary and in operation theatres in hospitals. For the goal of this paper, the value itself is not important, as long as it is equal for all light sources. The spectral irradiance of the incandescent lamp (i.e., Planck's spectrum for T = 2856 K), scaled to 500 lux, can be found in Figure 1.
As we already mentioned, photovoltaic solar cells for applications on Earth are characterized by their power output under the standard test condition [9], using the global AM 1.5G spectrum. We will use this outdoor spectrum as reference in our indoor study and therefore also scale it to an illumination of 500 lux to obtain a fair comparison (Figure 1).
A second widely used lamp is the halogen lamp of which the balloon is filled with a halogen (usually iodine) to increase the lifetime of the filament. The temperature of the filament is however about the same as for an incandescent lamp. Therefore, a halogen lamp can also be approximated by the same black body as the incandescent lamp.
In the same way as a standard for the incandescent light bulb was defined, a standard for the fluorescent tube was decided upon by the CIE. Fluorescent lamps are gas-discharge lamps that use electricity to excite mercury vapor. The excited mercury atoms produce short-wave ultraviolet light that in turn causes a phosphor to fluoresce, producing visible light. Because there are a lot of different types of fluorescent tubes, twelve illuminants were defined, named F1 to F12 (sometimes named FL1 to FL12) [14]:
F1 to F6 represent “standard” fluorescent tubes. These consist of two semi-broadband emissions of antimony and manganese activations in calcium halophosphate phosphor;
F7–F9 are broadband fluorescent lamps with multiple phosphors;
F10–F12 consist of three narrowband emissions (caused by ternary compositions of rare-earth phosphors).
We note that these illuminants also include the compact fluorescent lamp (CFL), also called energy-saving light. The CIE indicates that illuminants F2, F7 and F11 should take priority over others when a few typical fluorescent lamp illuminants are to be selected. They are the fluorescent tubes most commonly used in the industry. Therefore, as typical standards for fluorescent lighting, we choose the following illuminants:
F2: a cool white fluorescent lamp with a correlated color temperature (CCT) of 4230 K. They make up the majority of office illumination. CCT is the color temperature of a black body radiator which to human color perception most closely matches the light from the lamp;
F7: a broad-band fluorescent lamp (CCT = 6500 K). This spectrum is intended to represent average daylight;
F11: a narrow tri-band fluorescent lamp (CCT = 4000 K). They are mostly used as warehouse lighting.
Their spectra can be found in Figure 2, scaled to 500 lux. We must recall that the spectra are not real measurements but are theoretical sources of visible light, determined by convention. Notice that F7 is a “cooler” fluorescent tube than F2, because the intensity of the F7-spectrum is higher in the blue region of the visible light, whereas F2 peaks in the red region. F11 is characterized by more distinct peaks.
Another type of lamp commonly used in commercial and industrial environments is a high pressure discharge lamp: the pressure sodium lamp. It uses sodium in an excited state to produce light. Low pressure and high pressure sodium lamps exist. The low pressure type is a light source with one of the highest energy efficiencies, but their yellow light restricts applications to outdoor lighting such as street lamps. We will be focusing on the high pressure variant because it has a broader spectrum and can therefore also be used indoors. We also consider another type of high pressure discharge lamp with a broad spectrum: the metal halide lamp. It uses an electric arc in a gaseous mixture of vaporized mercury and metal halides to produce light.
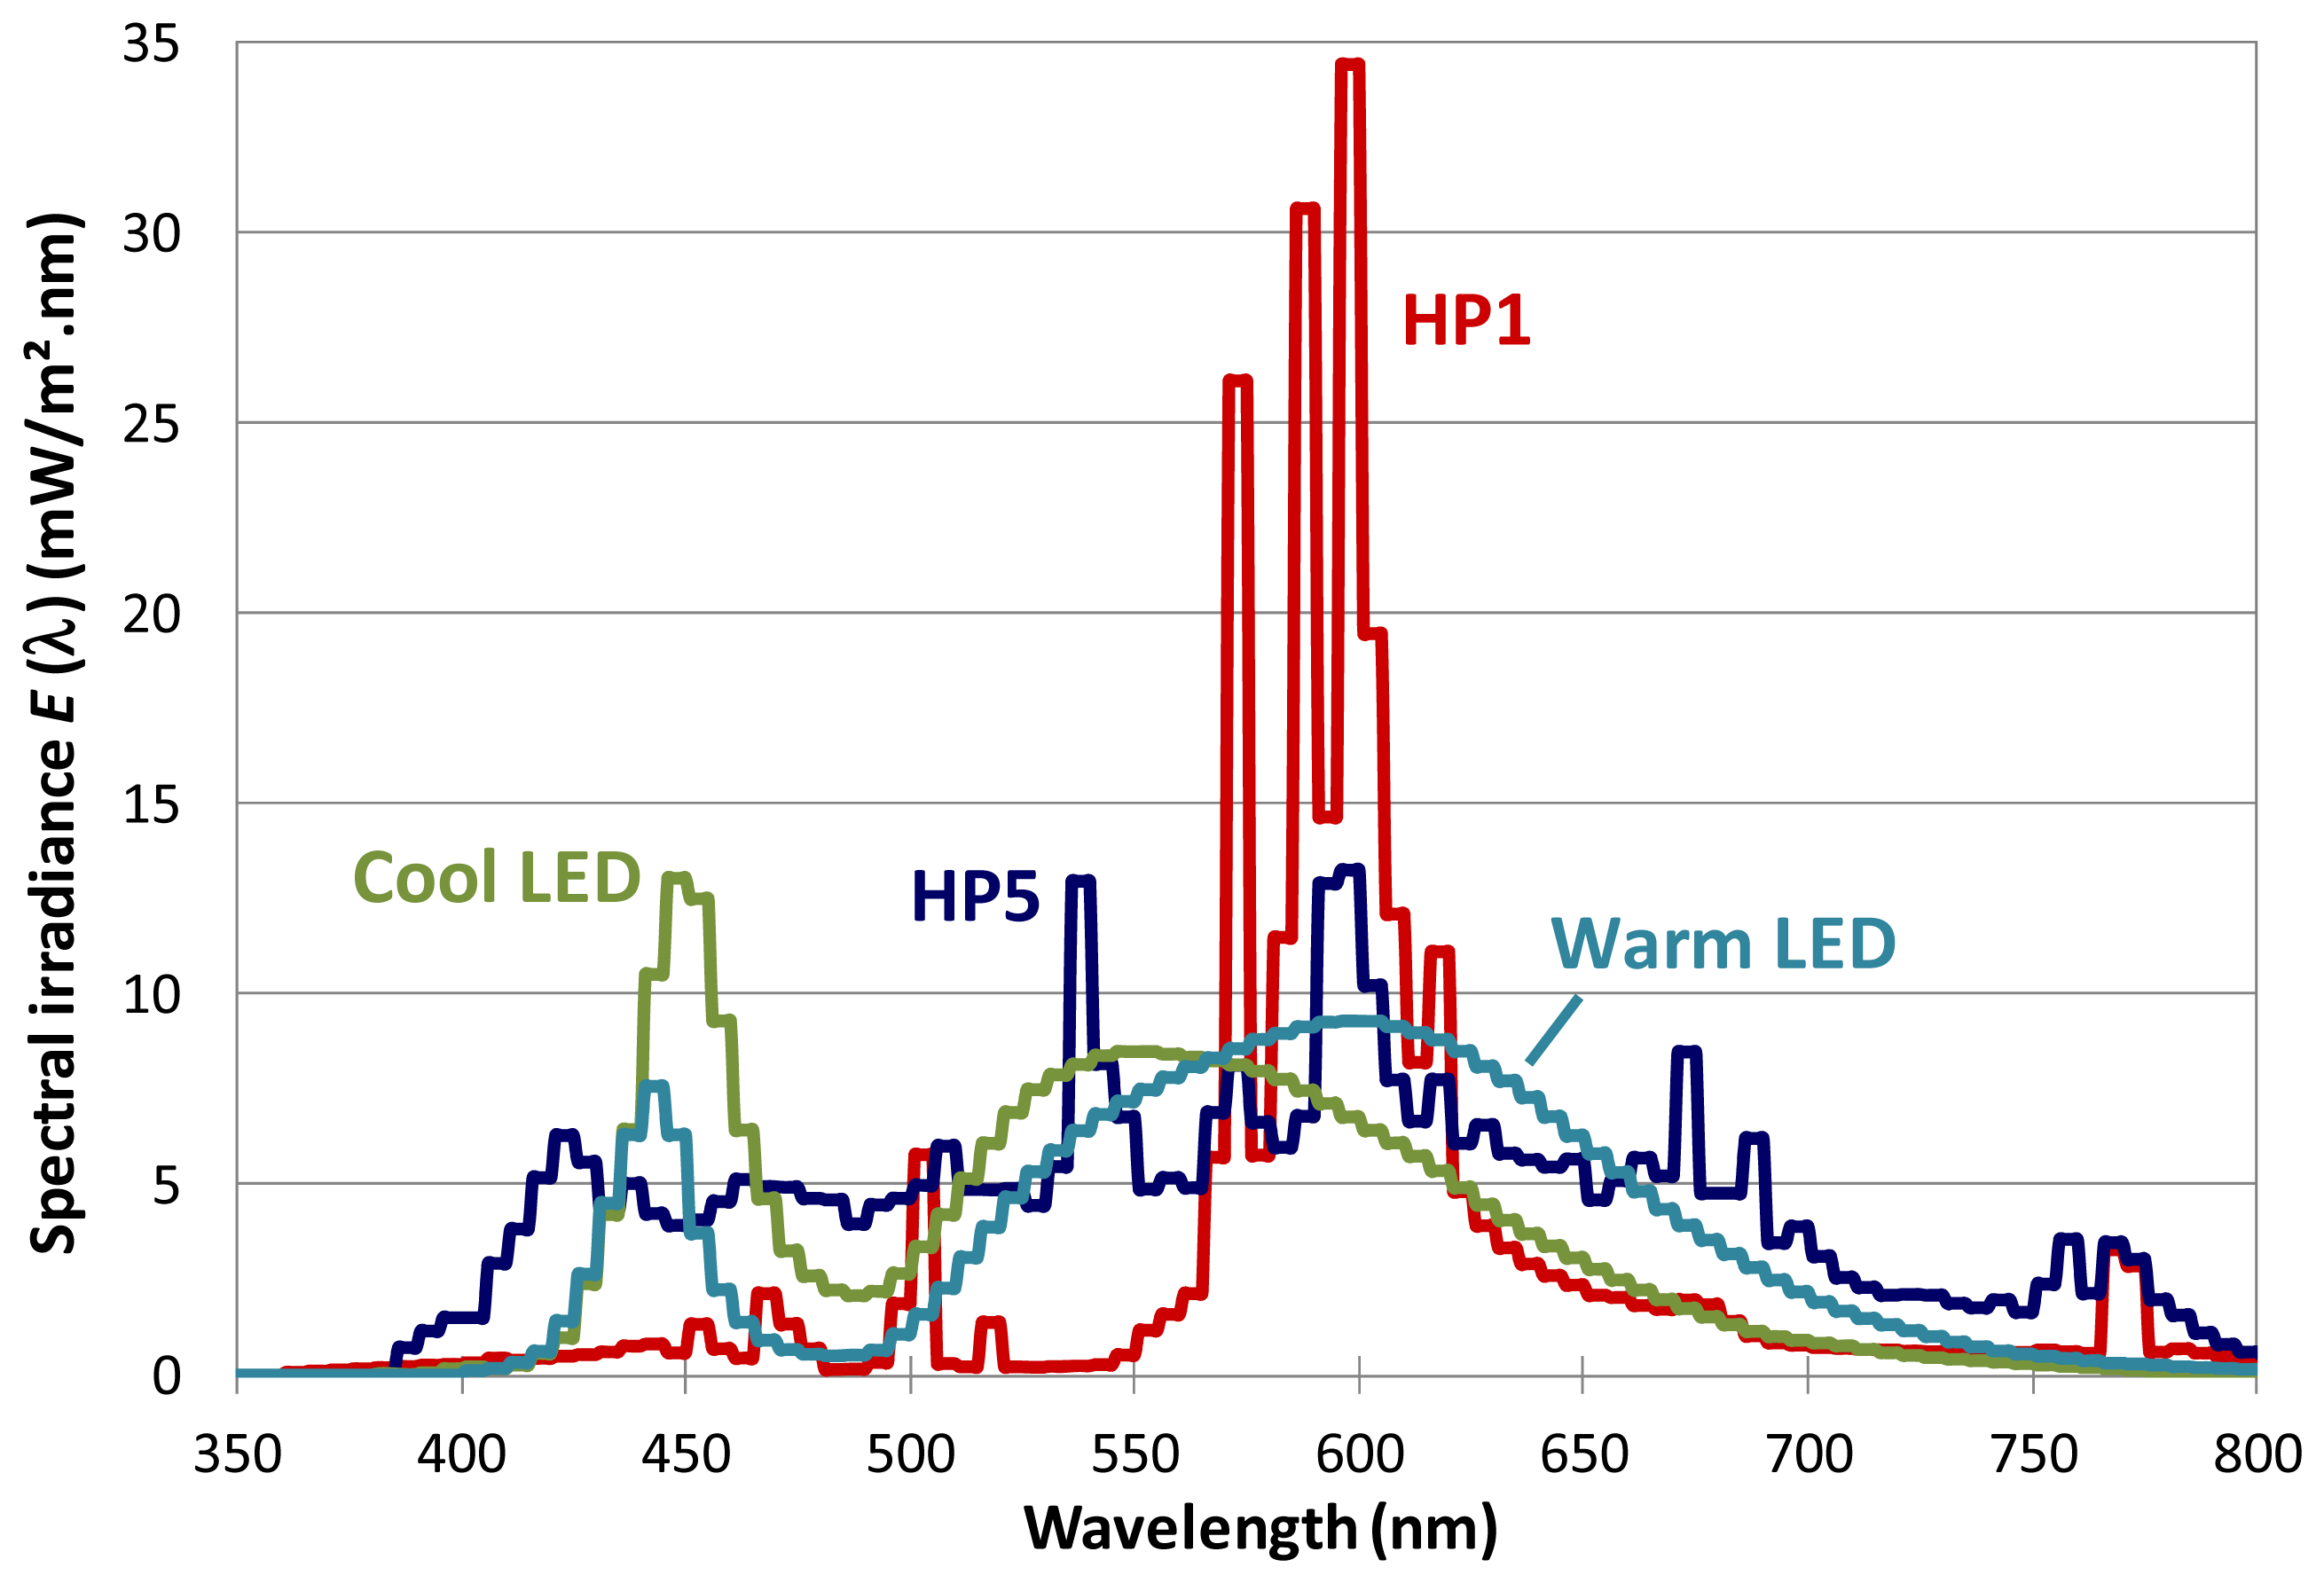
Determining the standard illuminant for these high pressure discharge lamps is straightforward. The CIE has published two illuminants for the sodium lamp (illuminant HP1 for a standard high pressure sodium lamp and illuminant HP2 for a color enhanced sodium lamp) and three illuminants for different types of the metal halide lamp (HP3 to HP5). We choose illuminant HP1 for the standard high pressure sodium lamp and illuminant HP5 for the standard metal halide lamp [14]. Figure 3 shows the spectra, again normalized to an intensity of 500 lux.
A light source that nowadays is gaining ground is the Light Emitting Diode (LED) light. An LED lamp is a solid-state lamp that uses the electroluminescence of a bandgap material to emit light. Because the emitted light has a photon energy that is approximately equal to the bandgap of the material, LEDs only emit light within a very small band of wavelengths (i.e., one color). To emit white light, necessary for indoor lighting applications, one can mix red, green and blue LEDs (RGB LEDs), but usually blue (or UV) LEDs are used, covered with a phosphor layer in which the highly energetic blue light is converted to white light. A promising development is the phosphor-free white LED by combining multiple quantum wells. These LEDs usually consist of stacked blue and green InGaN/GaN quantum wells inserted between n-GaN and p-GaN layer [15]. Usually, the spectrum resembles the LED lights with a phosphor layer, although other types can be fabricated [16]. To date, these phosphor-free types of LEDs are not yet commercially successful.
Because the LED technology is currently improving at a rapid rate [17], the CIE has not (yet) proposed standard illuminants for LED lighting. There do exist standards for different aspects of LED lighting, e.g.,:
the chromaticity specification;
lumen maintenance (lifetime) of LEDs;
testing methods and measurements;
color rendering of white LED light sources.
To date, there is no internationally accepted standard for the spectrum of LED lamps.
To determine the “typical” spectrum of an indoor LED light, we gather the spectra of current, commercially available, white LED lights for indoor use. We consider the available supply of some of the biggest LED suppliers worldwide (Nichia, Seoul Semiconductor and Philips Lumileds) and compare their spectra (e.g., [18–24]).
We notice that all relevant commercial indoor LED lights are blue LEDs covered with a phosphor layer. They always have two peaks. One small peak appears around 420–460 nm, caused by the bandgap of the semiconductor, usually InGaN. The other, broader peak, at 520–620 nm, is caused by the Stokes-shifted light emitted by the phosphor coating.
Depending on the correlated color temperature (CCT), one peak is higher than the other (or they have the same intensity). If the first small peak has a higher intensity, the LED lamp is cooler (higher CCT). If the broad peak is higher, the light color is warmer (lower CCT).
If we take all this into account, it is appropriate to only consider blue LED lights with a phosphor layer (and not RGB or multiple quantum wells LEDs) for our study. We will consider both types: a typical standard commercial cool and warm LED light (Figure 3). We obtained spectra of typical commercial cool and warm LEDs from the Optical Measurement Group (National Physical Laboratory), measured by Dr. Paul Miller.
To summarize, we will use for our simulations the following spectra, representing typical artificial light sources (Figures 1, 2 and 3):
A black body at T = 2856 K for incandescent and halogen lamps;
Illuminants F2, F7 and F11 for the different types of fluorescent tubes (including CFLs);
Illuminant HP1 for high pressure sodium lamps;
Illuminant HP5 for metal halide lamps;
A cool and warm spectrum for typical LED lights;
AM 1.5G spectrum (the outdoor standard spectrum) as a reference.
3. Photovoltaic Solar Cells
To determine which artificial light sources are suitable for the indoor characterization of photovoltaic solar cells, we consider solar cells from different categories. To make a fair comparison, we will, within each category, always consider one of the best performing solar cells (under standard test conditions), based on [25] (see Table 1).
The electrical power output Pout of a solar cell is determined by its current-voltage characteristic and is given by:
Based on the quantum efficiency QE(λ) of the solar cell, we can now simulate its response in different indoor environments. Indeed, the spectral location and the width of the absorption window are an important parameter influencing the power output of the solar cell, depending on the type of (artificial) light source in the indoor environment.
Because we want to focus on the influence of the artificial light source, we can idealize the cells and make abstraction of some other cell properties. First, we ignore the influence of the parasitic resistances. For example, the efficiency of chalcogenide solar cells drops significantly under low light intensities, present in indoor environments, compared to standard test conditions. The reason is the reduction of Voc and FF, mainly due to the shunt resistance [10]. Second, we ignore the possible red kink effect [33] which can occur at low illumination intensities, lowering the FF. It also has to be noted that, for certain types of solar cells, including silicon devices, the photocurrent does not scale linearly with the irradiance [34,35]. Depending on the processing conditions, some types of solar cells show a quantum efficiency behavior that is nonlinear with light intensity, particularly showing low quantum efficiency behavior at very low light intensities and improving at higher light intensities. For these types of cells, this effect can introduce an error in our simulations which we do not take into account.
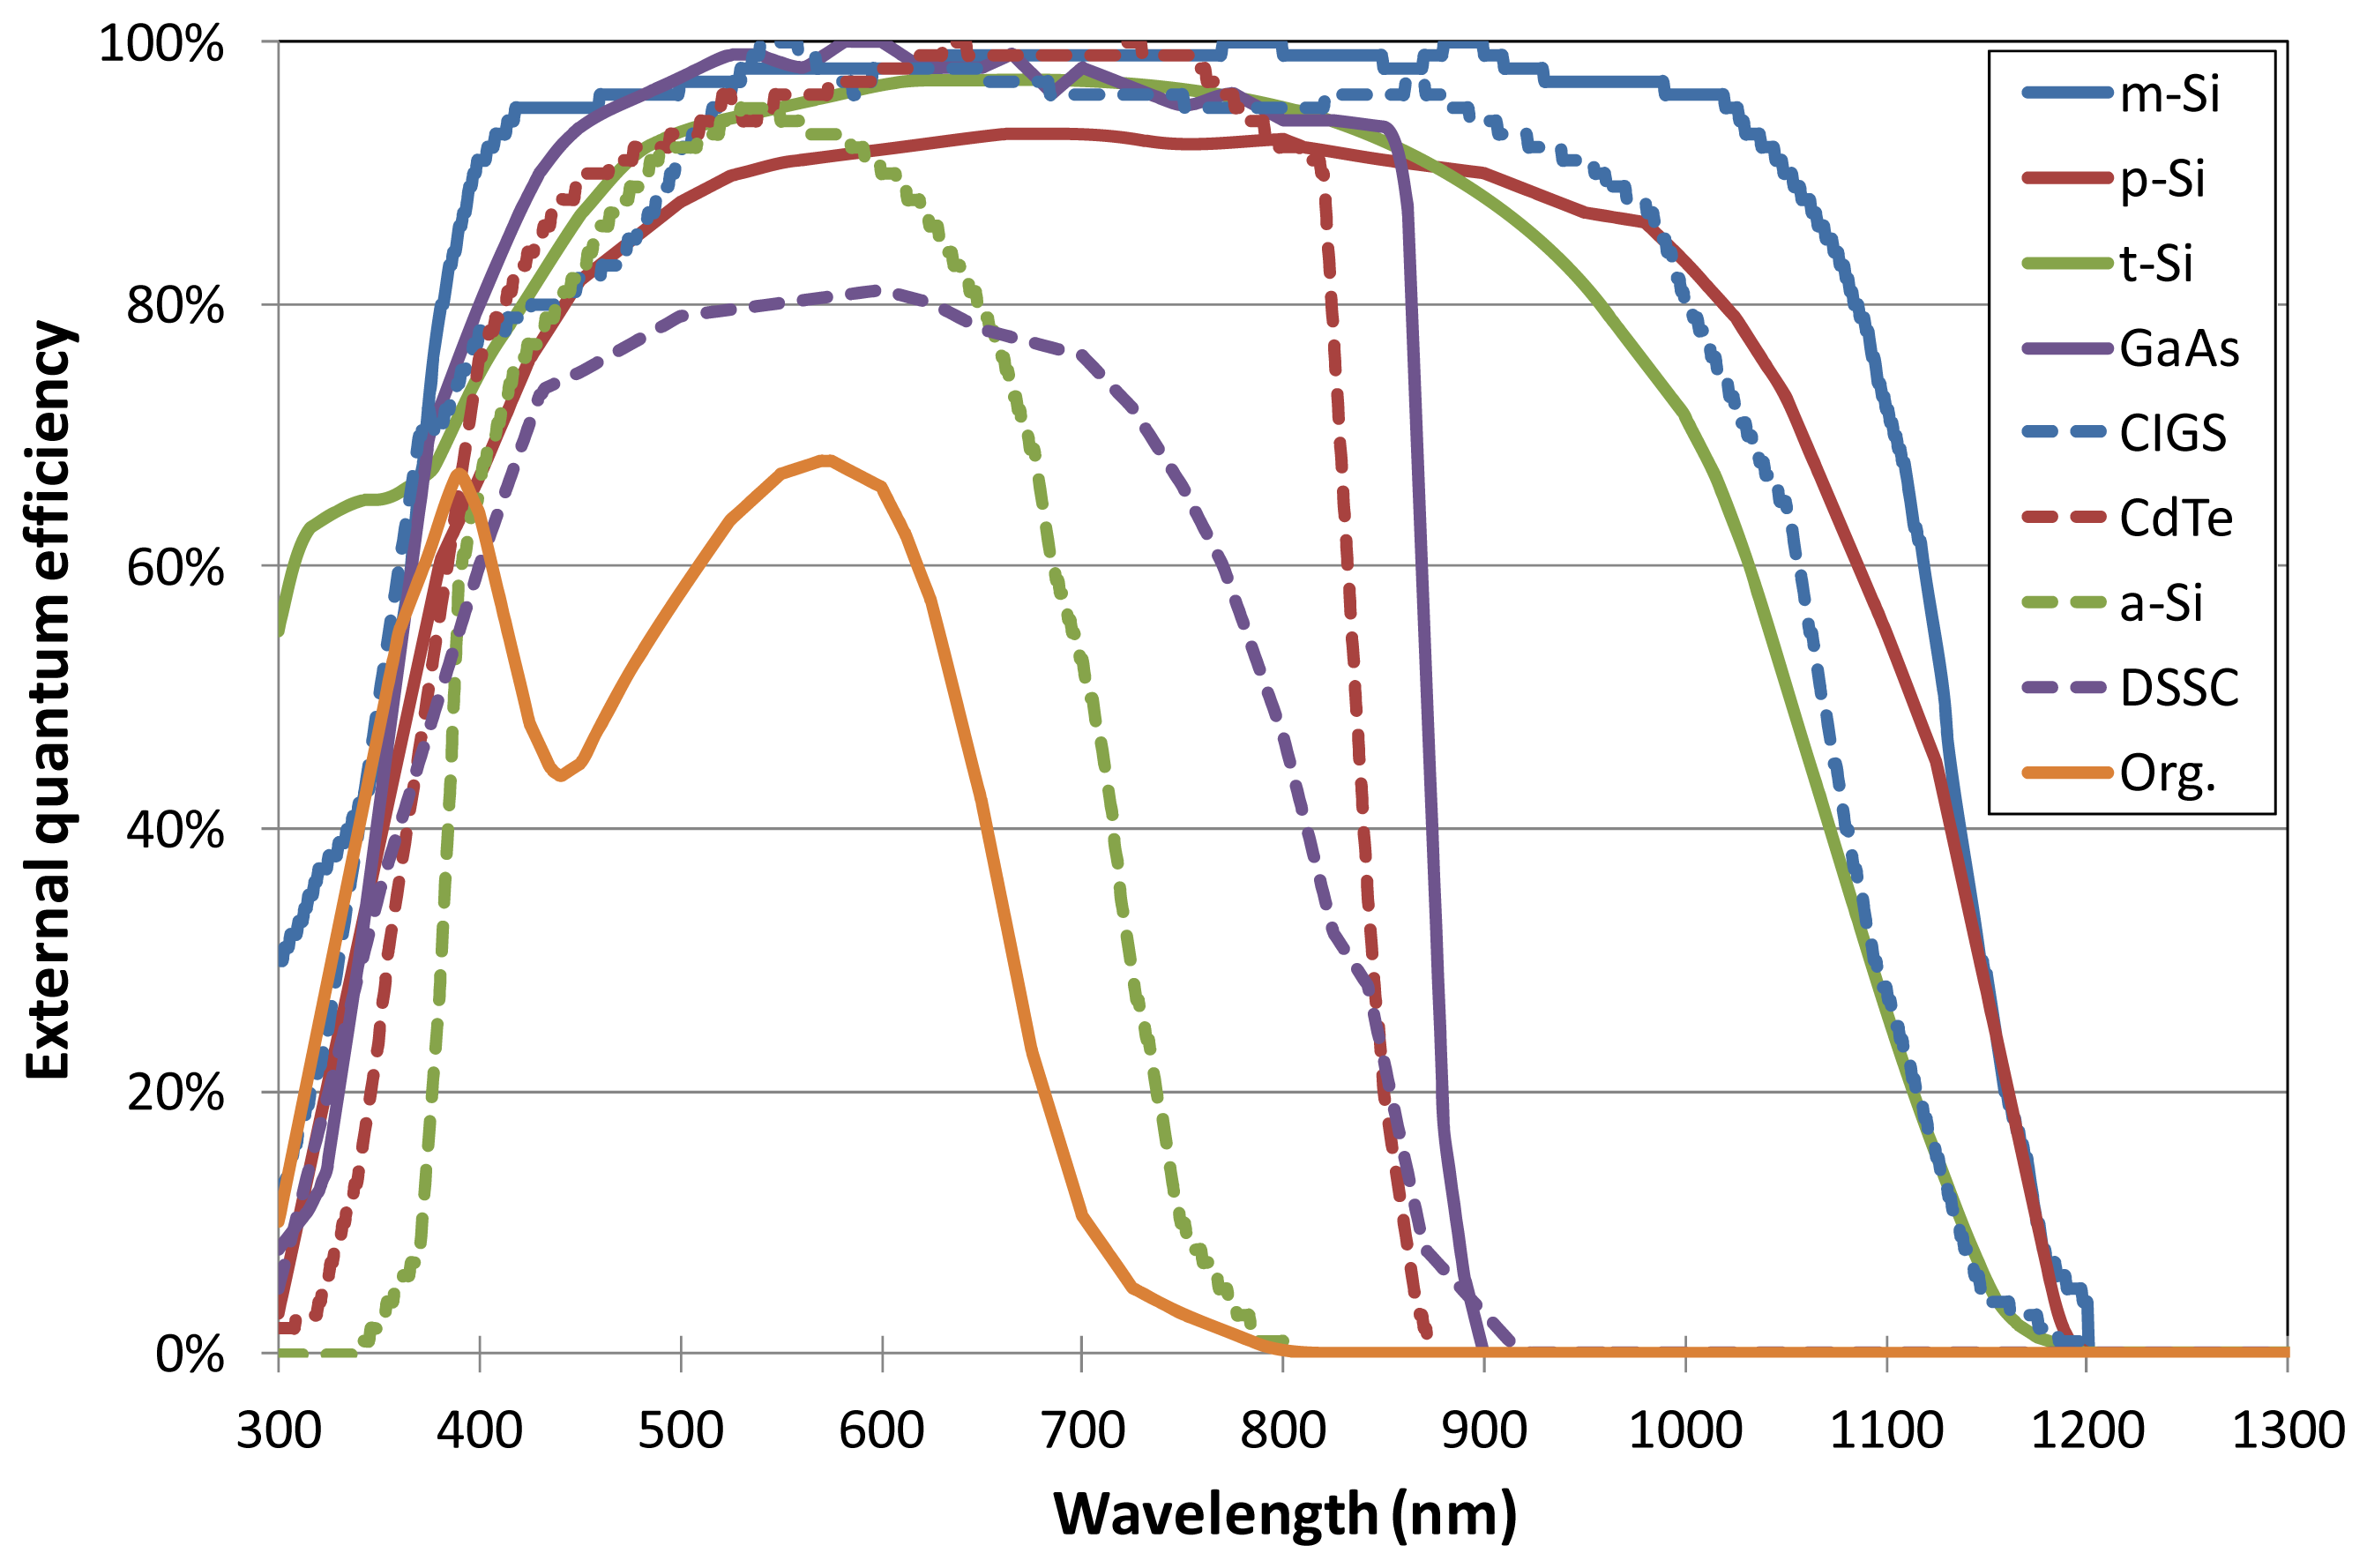
Because we only want to study the influence of the different indoor environments and because the open circuit voltage Voc can be dependent on the light intensity [36,37], we approximate the open circuit voltage Voc to the bandgap of the absorber, i.e., Voc equals Eg/q. Of course, this is an idealized, non-realistic situation, but it allows us to make abstraction of the other influences and thus—by relative comparison—study the influence of one parameter only: the (spectrum of the) artificial light source. The quantum efficiencies of the considered solar cells, as found in the references of Table 1, are given in Figure 4.
4. Results
First, we compare the indoor environments to the outdoor spectrum AM 1.5, i.e., we calculate the electrical output of the solar cell under a certain illumination, compared relatively to the output of that solar cell under the standard spectrum AM 1.5, scaled to 500 lux. We notice (Figure 5) that the black body (i.e., the incandescent or halogen lamp) is by far the best artificial light source for photovoltaic applications. For the crystalline silicon cells and the CIGS cell, the performance of the solar cell improves by a factor of about 3 compared to the AM 1.5 spectrum. This was to be expected. Indeed, Figure 1 shows that the black body at T = 2856 K has the highest intensity within the absorption windows of these solar cells (Figure 4). In contrast, the amorphous silicon and organic solar cell do not significantly improve compared to the outdoor AM 1.5 spectrum. The reason is mainly the narrow absorption window of those cells. It is also important to note that, although the absorption windows of the other solar cells (GaAs, CdTe, and DSSC) is only 100 to 200 nm broader than the amorphous silicon and organic solar cell, their relative performance is significantly better.
It is clear from Figure 5 that the incandescent and halogen lamp (represented by the black body) are a different category of light sources. The reason is that these old light sources were not optimized to the visible light for a human eye.
We now consider the performance of the solar cells under exposure of other, more modern, light sources (Figure 5), which are much more energy efficient than the incandescent or halogen lamp. Indeed, modern light sources emit light mostly within the visible region, making them very energy efficient: emitting light within the visible spectrum is the primary goal of light sources. However, e.g., the m-Si cell can absorb light to 1200 nm (Figure 4). It is therefore to be expected that all cells will perform worse than under the standard spectrum. Indeed, the wavelength range of AM 1.5 is much broader (Figure 1) than the visible spectrum for which modern light sources are optimized. Most solar cells absorb photons beyond the visible spectrum.
We can notice two different subdivisions, according to their performance relative to the standard spectrum. Illumination from the light sources HP5 and F7 results in a better performance compared to AM 1.5 than the other light sources, because the spectra of HP5 and F7 are more proportionally distributed over the visible light wavelengths than the other indoor spectra.
Please note that, when comparing solar cells to each other, the performance is relative to their own performance under the outdoor standard spectrum. For example, the organic cell reaches a performance of 90% relative to the AM 1.5 spectrum under F7 illumination whereas the monocrystalline silicon cell only reaches 44%. This certainly does not mean that the organic cell is a better solar cell than Si. It only indicates that the absorption window of the organic cell differs less from the visible spectrum than that of the silicon cell.
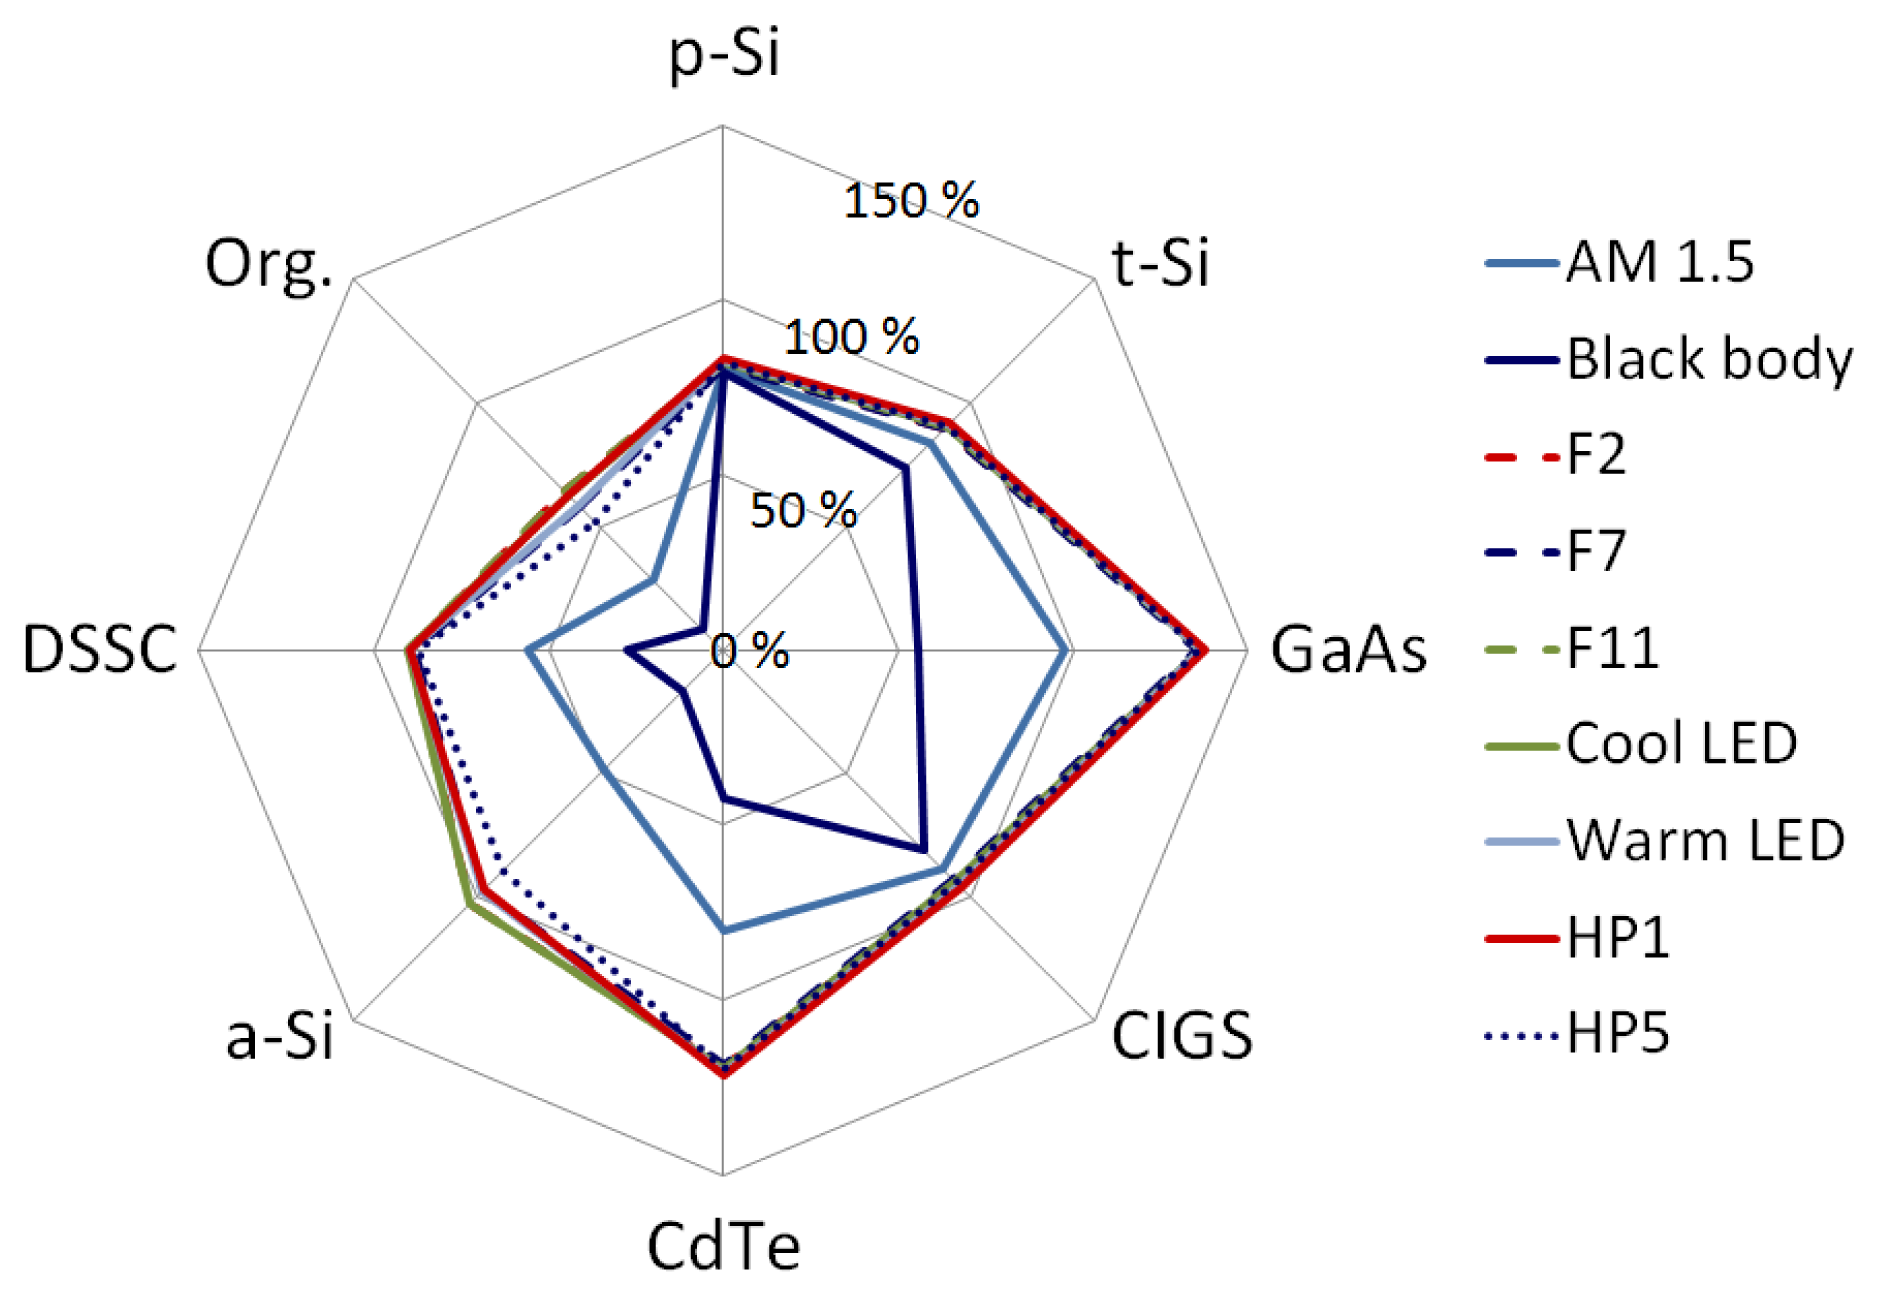
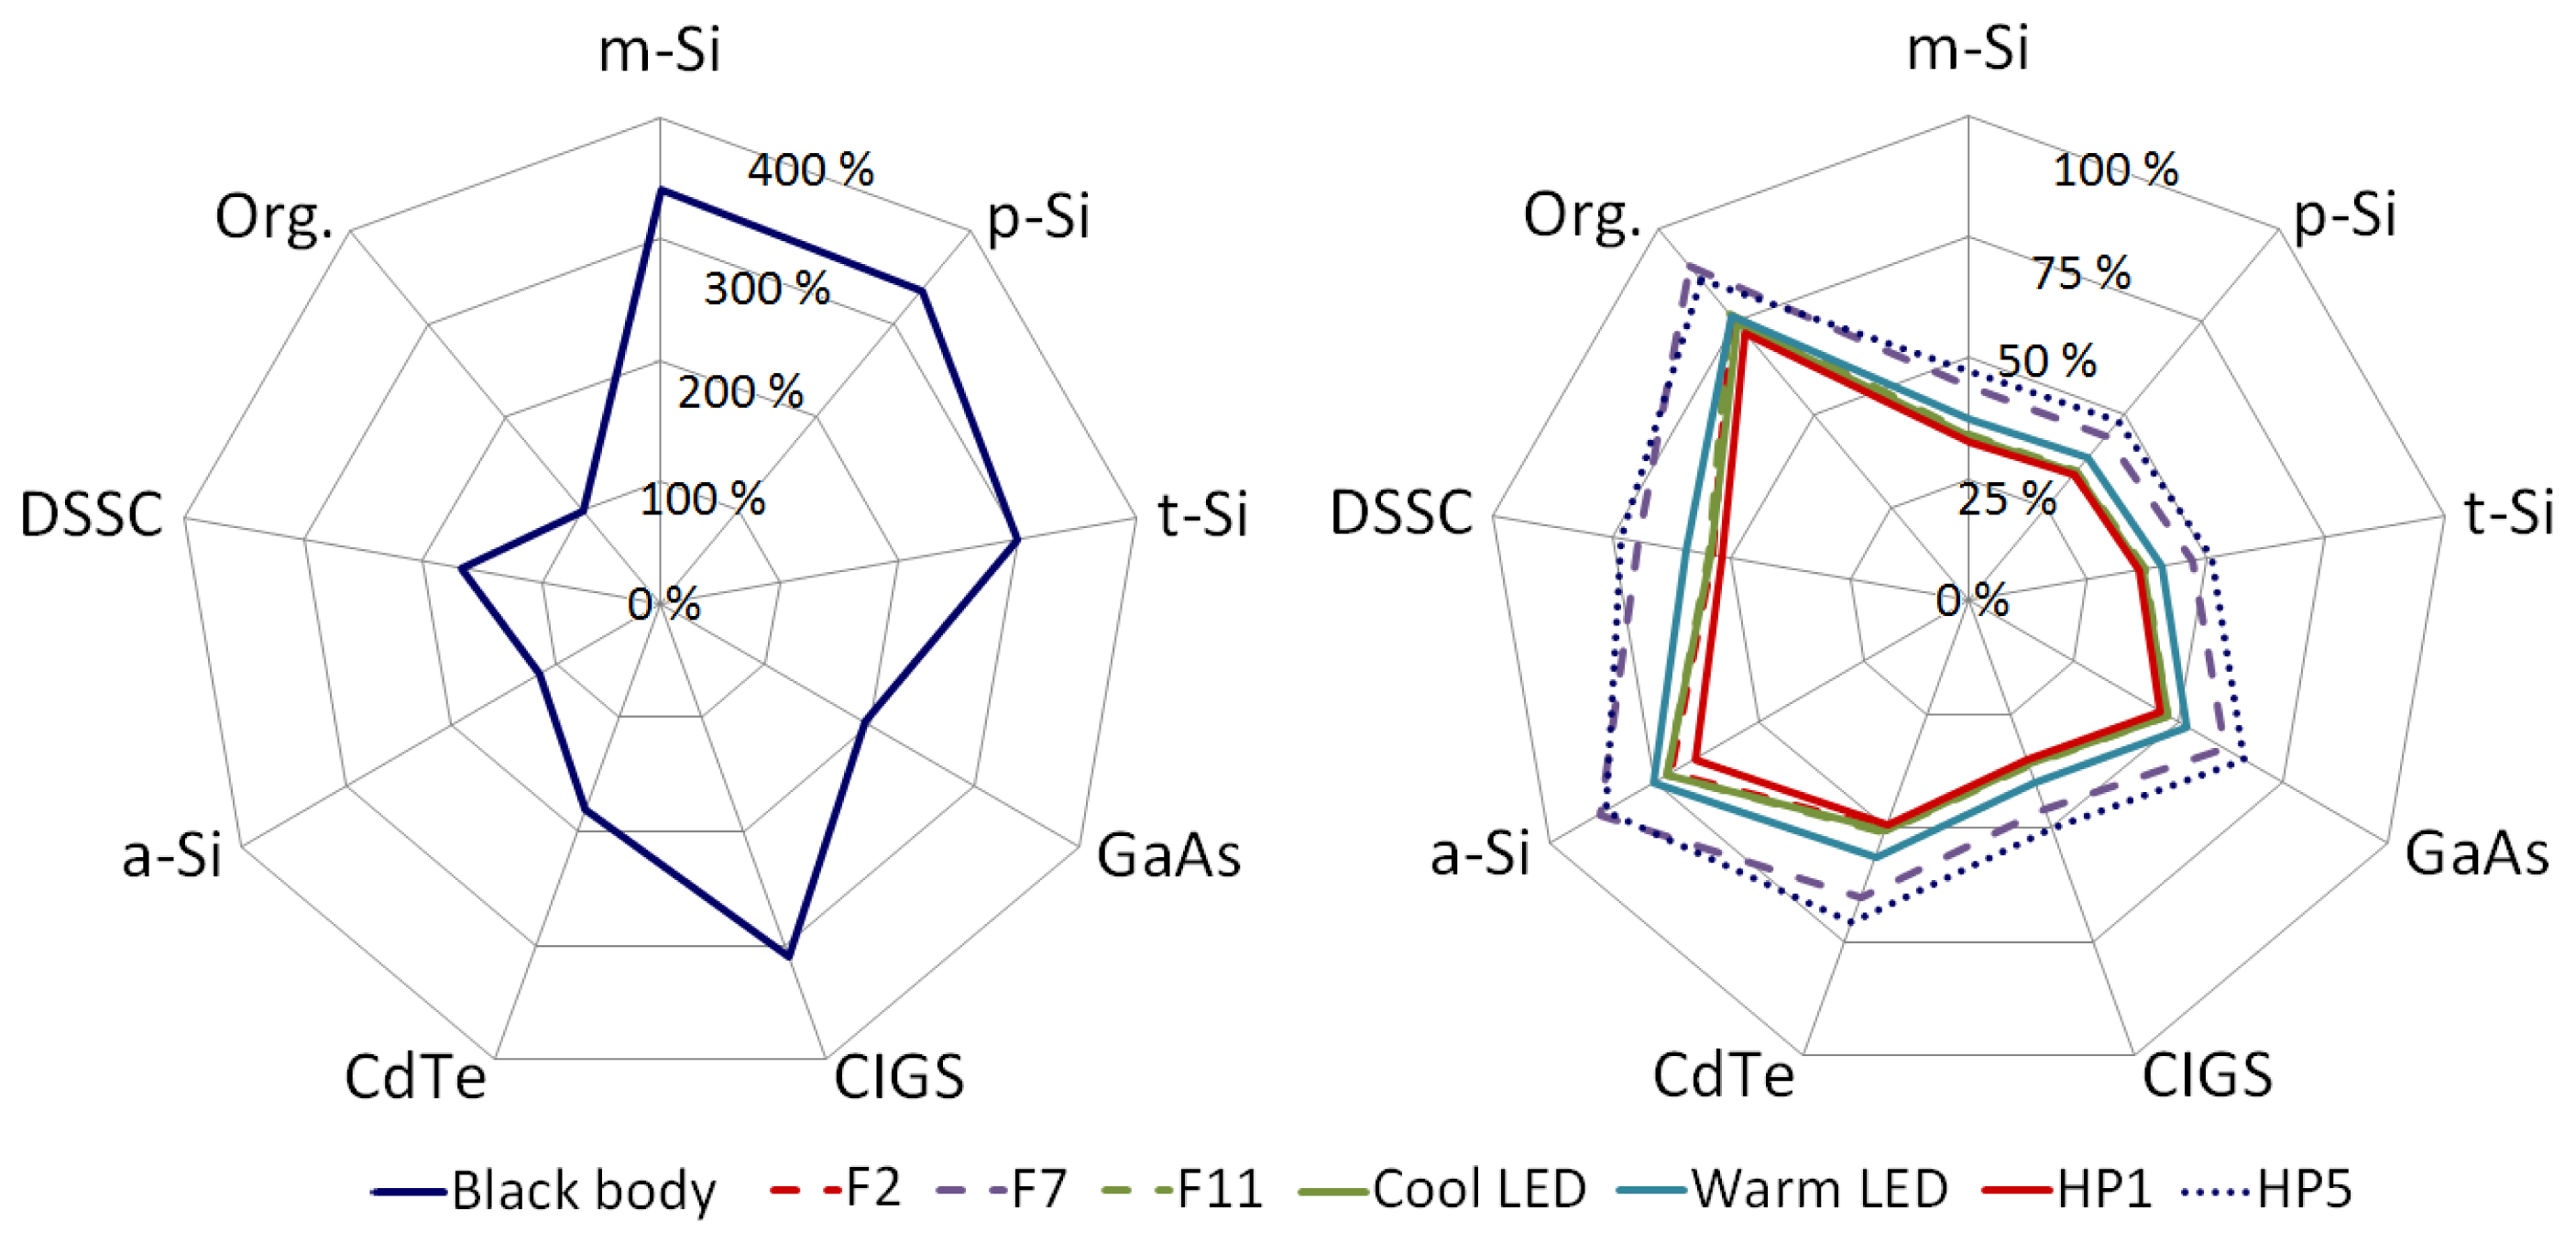
We now compare the performance of the different solar cells in different indoor environments to the performance of the monocrystalline silicon solar cell. We calculate the performance of the solar cell under a certain illumination, compared relatively to the performance of the monocrystalline silicon solar cell under that illumination (Figure 6). For example, the relative performance fGaAs to m-Si,F2 of the GaAs-cell compared to m-Si under F2 illumination is given by:
We immediately notice the aberrant nature of the AM 1.5 and black body spectrum because of their much broader spectra which were not optimized to the visible light. When we only consider the modern artificial light sources (by excluding the AM 1.5 and the black body), the performance of the cells does not differ much with each light source.
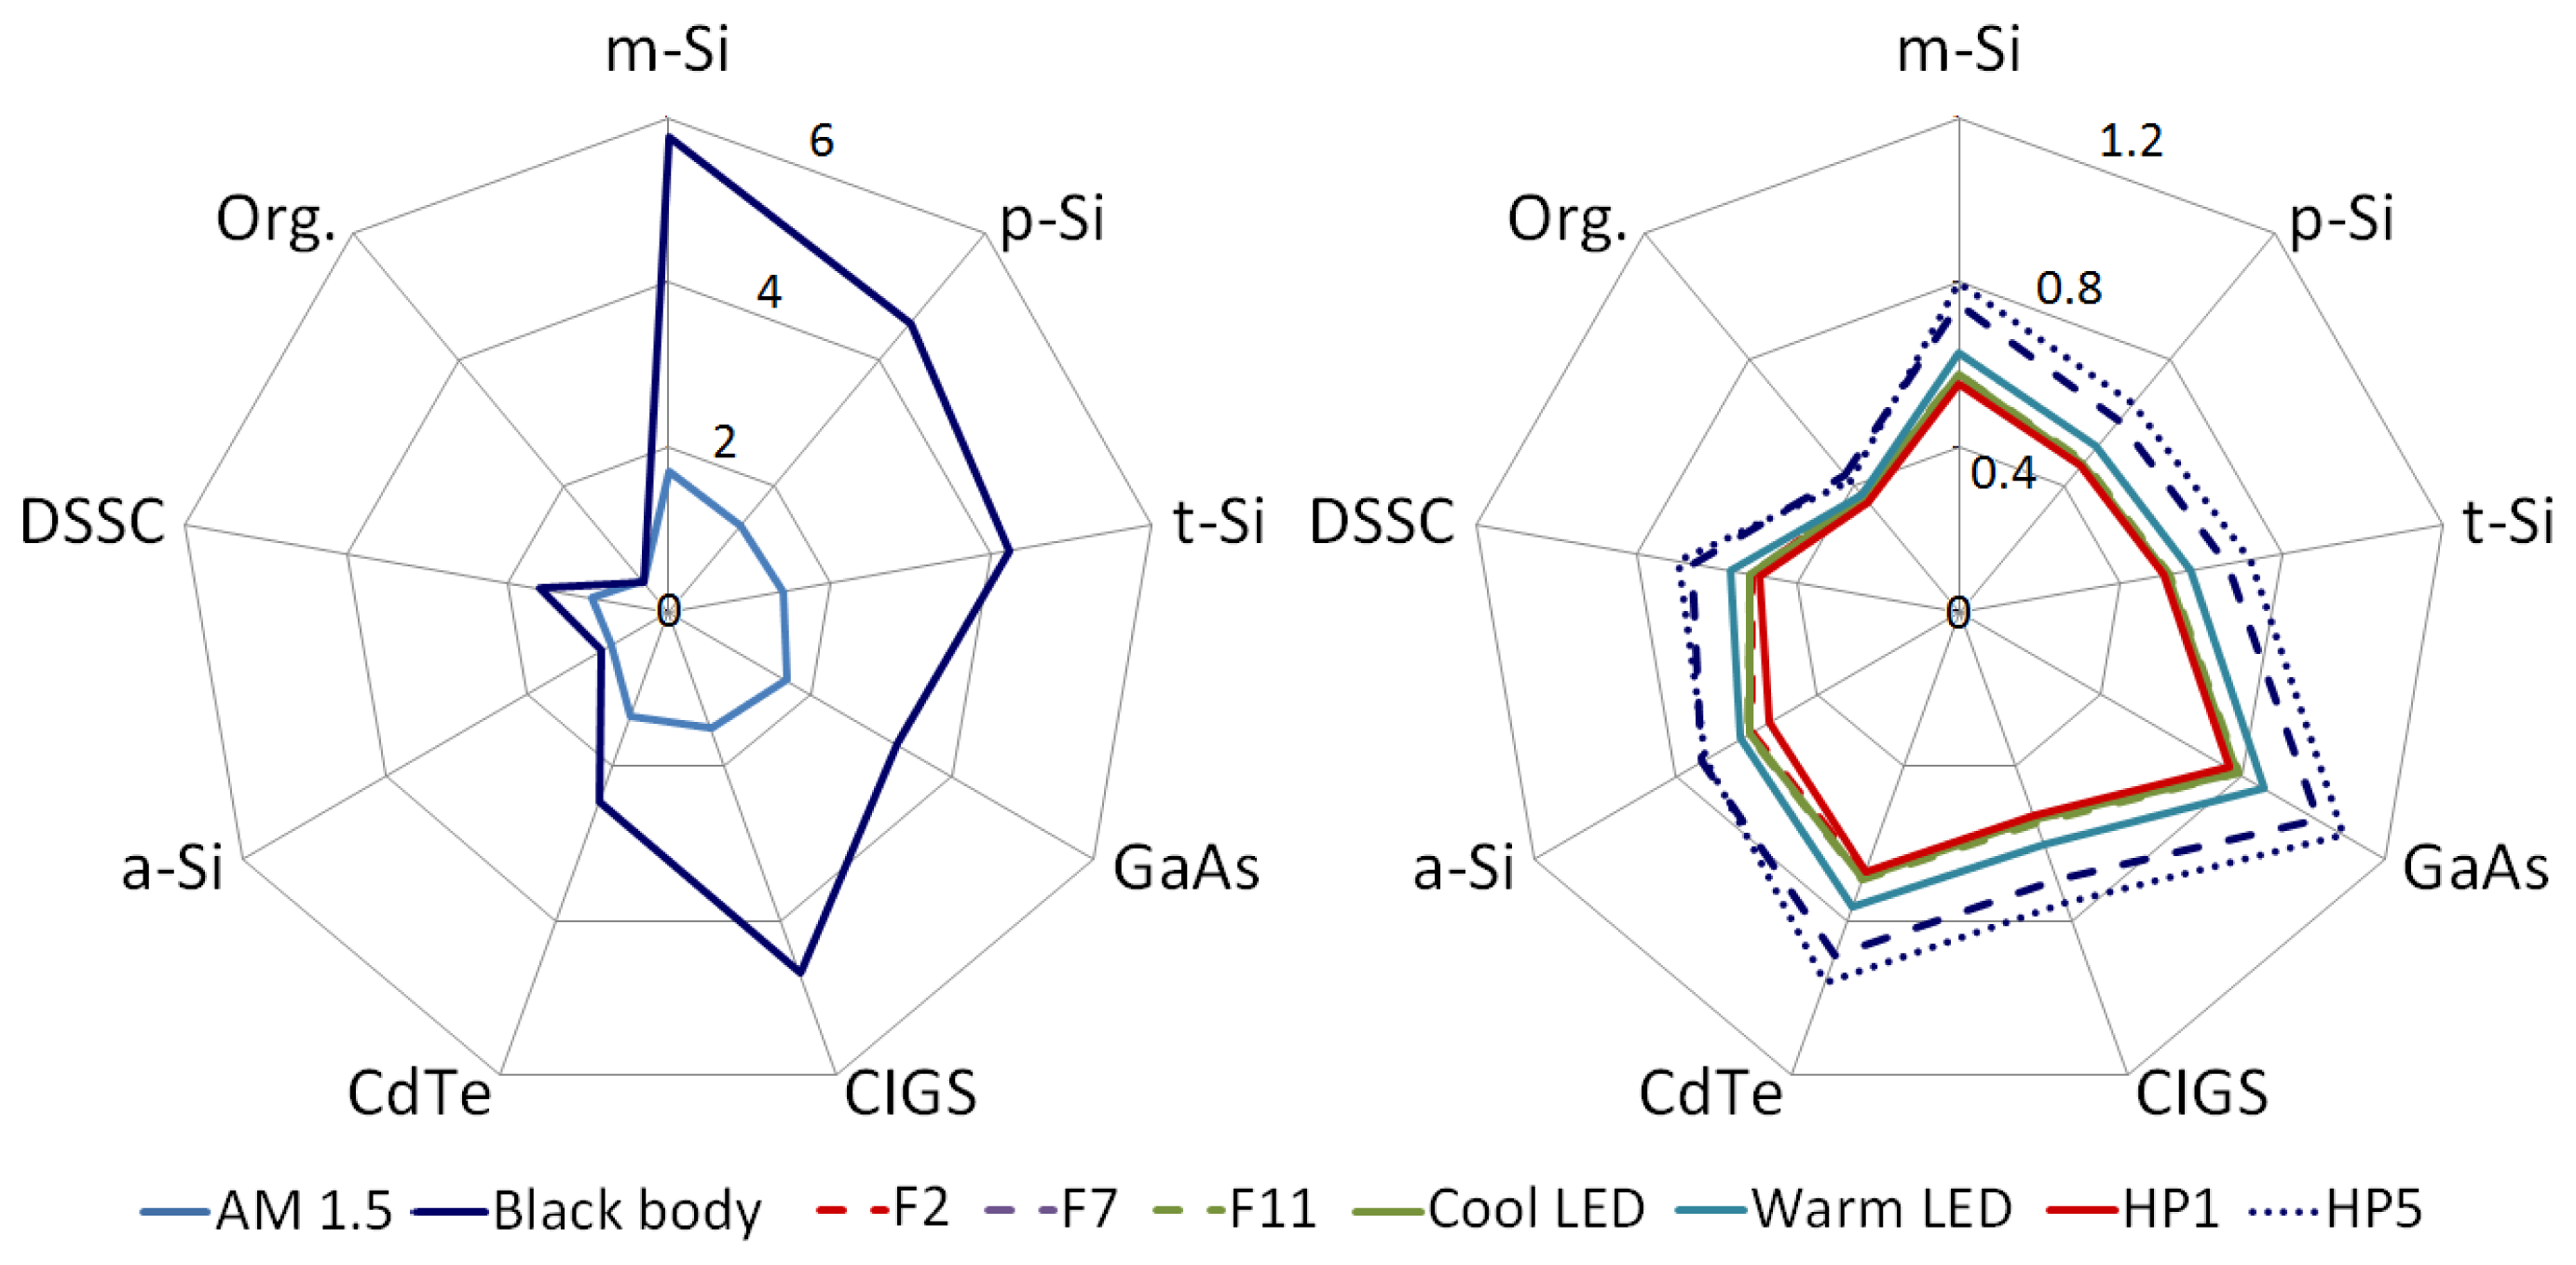
When we calculate the maximum electrical power production of the solar cells under an illumination of 500 lux, for the different indoor environments, the same conclusions can be drawn (Figure 7). We notice that the black body (i.e., the incandescent or halogen lamp) is by far the best artificial light source for photovoltaic applications, better than the outdoor spectrum (scaled at 500 lux). Again, HP5 and F7 are the better performing modern light sources (Figure 7).
In summary, we can conclude that we can divide the indoor light sources in three different groups (with the AM 1.5 spectrum as a fourth-outdoors-group)
Group 1: black body;
Group 2: HP5, F7;
Group 3: F2, F11, cool LED, warm LED, HP1.
In other words, for the characterization of photovoltaic solar cells in indoor environments, it is not necessary to measure their performance under all typical artificial light sources. It is sufficient to measure the cell under one light source from each group, for example a black body spectrum at T = 2856 K (an incandescent lamp), F7 (a broad-band fluorescent lamp) and F2 (a cool white fluorescent lamp).
It is important to note that the difference between the three groups is greater than the margin of error of the measurements we rely on. Indeed, the relative difference between the two groups closest to each other, group 3 to group 2, is at least 12% relative, but mostly more than 20%. Remember that we are for our simulations on the one hand relying on theoretical spectra set by convention (without margin of error) and on the other hand relying on measurement data of quantum efficiencies of the references in Table 1 which do not report significant margin of errors.
An energy efficient indoor light source does not emit (many) photons with wavelengths greater than 780 nm because the visible spectrum for the human eye is limited (Figure 1). Therefore, the ideal solar cell for indoor conditions does not absorb photons with wavelengths greater than 780 nm, i.e., has a bandgap of about 1.6 eV. Of course, the bandgap is not the only material characteristic influencing the efficiency of the solar cell.
It is no surprise that—taken into account the limitations and idealizations mentioned in Section 3—the least performing cell outdoors is also the worst performing cell indoors: the organic solar cell, mainly because of its low fill factor and low quantum efficiency (Figures 4 and 7). However, organic solar cells are not yet as technologically mature as, e.g., silicon solar cells. Due to intensive research, the efficiency of organic PV cells is improving rapidly. Taking into account the fact that the absorption window of organics can be optimized towards the visible spectrum [38,39], combined with their higher FF under low intensities [40] their performance indoors could improve in the future [41,42].
In addition to the organic cell, the p-Si cell, which performs well outdoors and under incandescent light, also performs poorly under illumination by modern light sources, due to its low QE combined with a bandgap that is too low for modern light sources.
The best cell outdoors and under incandescent light, i.e., the m-Si cell, is not the best cell under modern light sources, but achieves only moderate performance. The highest electrical power with modern indoor light sources is generated by the CdTe, GaAs and a-Si cells.
5. Related Work
For a thorough overview of indoor photovoltaics, we refer to the highly recommended book Designing indoor solar products by Randall [1]. Our paper is an extension of the excellent work of Virtuani et al. [11]. They applied the same model to determine the performance of Cu (In,Ga) Se2 solar cells under different indoor environments. The same results were qualitatively obtained: the cells perform better under incandescent/halogen illumination than AM 1.5, and worse under fluorescent illumination. Different authors discussed [6,43,44] and measured [45–48] the spectral mismatch between the absorption of solar cells and the spectrum of modern light sources.
Our article distinguishes itself from the others by focusing on the spectral differences between the artificial light sources and the reference AM 1.5, rather than on the low illumination intensity. Indeed, because our goal is to determine which light sources are relevant for a possible new standard for the indoor characterization of solar cells, it is the spectrum of the light sources that distinguishes the light sources, and not the low intensity, which is present for all light sources and will affect the cells equally over all light sources. We refer to [10,49–53] for details of the influence of low intensity on the characteristics of different types of solar cells. Moreover, we also considered all suitable artificial indoor light sources and selected relevant ones which could be utilized as a standard for the indoor characterization.
6. Conclusions
We compared different types of solar cells in different indoor environments. This was achieved by efficiency simulation based on the quantum efficiencies of the solar cells and the light spectra of typical artificial light sources. We concluded that we can divide the indoor light sources into three different categories, from best to worst from the perspective of photovoltaic performance of various PV technologies:
Group 1: black body;
Group 2: HP5, F7;
Group 3: F2, F11, cool LED, warm LED, HP1.
In other words, for the characterization of photovoltaic solar cells in indoor environments, it is not necessary to measure their performance under all typical artificial light sources. Therefore, we propose that solar cells be measured under one light source from each group for their characterization for indoors applications.
Acknowledgments
The authors would like to thank Paul Miller of the Optical Measurement Group (National Physical Laboratory, Teddington, UK) for his measurements on LED lamps, as well as Michael de Podesta (National Physical Laboratory, Teddington, UK) for his assistance.
Conflicts of Interest
The authors declare no conflict of interest.
References
- Randall, J.F. Designing Indoor Solar Products—Photovoltaic Technologies for Aes; John Wiley & Sons Ltd.: Chichester, UK, 2005. [Google Scholar]
- Hande, A.; Polk, T.; Walker, W.; Bhatia, D. Indoor solar energy harvesting for sensor network router nodes. Microprocess. Microsyst. 2007, 31, 420–432. [Google Scholar]
- Wang, W.S.; O'Donnell, T.; Wang, N.; Hayes, M.; O'Flynn, B.; O'Mathuna, C. Design considerations of sub-mW indoor light energy harvesting for wireless sensor systems. ACM J. Emerg. Technol. Comput. Syst. 2010, 6. [Google Scholar]
- Weddell, A.S.; Harris, N.R.; White, N.M. An Efficient Indoor Photovoltaic Power Harvesting System for Energy-Aware Wireless Sensor Nodes. Proceedings of the Eurosensors XXII, Dresden, Germany, 7–11 September 2008; pp. 1544–1547.
- Li, C.; Jia, W.; Tao, Q.; Sun, M. Solar Cell Phone Charger Performance in Indoor Environment. Proceedings of the IEEE 37th Annual Northeast Bioengineering Conference (NEBEC), Troy, NY, USA, 1–3 April 2011.
- Reich, N.H.; Veefkind, M.; van Sark, W.G.J.H.M.; Alsema, E.A.; Turkenburg, W.C.; Silvester, S. A solar powered wireless computer mouse: Industrial design concepts. Sol. Energy 2009, 83, 202–210. [Google Scholar]
- Randall, J.; Amft, O.; Bohn, J.; Burri, M. Luxtrace: Indoor positioning using building illumination. Pers. Ubiquitous Comput. 2007, 11, 417–428. [Google Scholar]
- Randall, J.; Amft, O.; Troster, G. Towards Luxtrace: Using Solar Cells to Measure Distance Indoors. In Location- and Context-Awareness, Proceedings of the First International Workshop LoCA 2005, Oberphaffenhofen, Germany, 12–13 May 2005; Strang, T., Linnhoff-Popien, C., Eds.; Springer: Berlin/Heidelberg, Germany, 2005; Volume 3479, pp. 40–51. [Google Scholar]
- Photovoltaic Devices—Part 3: Measurement Principles for Terrestrial Photovoltaic (PV) Solar Devices with Reference Spectral Irradiance Data; Standard No. IEC 60904-3 (ed. 2.0; International Electrotechnical Commission: Geneva, Switzerland; 9; April; 2008.
- Virtuani, A.; Lotter, E.; Powalla, M. Performance of Cu(In,Ga)Se2 solar cells under low irradiance. Thin Solid Films 2003, 431, 443–447. [Google Scholar]
- Virtuani, A.; Lotter, E.; Powalla, M. Influence of the light source on the low-irradiance performance of Cu(In,Ga)Se2 solar cells. Sol. Energy Mater. Sol. Cells 2006, 90, 2141–2149. [Google Scholar]
- Andrews, R.W.; Pearce, J.M. The effect of spectral albedo on amorphous silicon and crystalline silicon solar photovoltaic device performance. Sol. Energy 2013, 91, 233–241. [Google Scholar]
- Brennan, M.P.; Abramase, A.L.; Andrews, R.W.; Pearce, J.M. Effects of spectral albedo on solar photovoltaic devices. Sol. Energy Mater. Sol. Cells 2014, 124, 111–116. [Google Scholar]
- Colorimetry, 3rd ed.; Technical Report Number CIE 15:2004; International Commission on Illumination: Vienna, Austria, 2004.
- Park, I.K.; Kim, J.Y.; Kwon, M.K.; Cho, C.Y.; Lim, J.H.; Park, S.J. Phosphor-free white light-emitting diode with laterally distributed multiple quantum wells. Appl. Phys. Lett. 2008, 92. [Google Scholar] [CrossRef]
- Yamada, M.; Narukawa, Y.; Mukai, T. Phosphor free high-luminous-efficiency white light-emitting diodes composed of InGaN multi-quantum well. Jpn. J. Appl. Phys. 2002, 41, L246–L248. [Google Scholar]
- Pimputkar, S.; Speck, J.S.; DenBaars, S.P.; Nakamura, S. Prospects for LED lighting. Nat. Photonics 2009, 3, 179–181. [Google Scholar]
- Specifications for Warm White LED NF2L757ART-V1; Nichia Corporation: Tokushima, Japan, 2013; pp. 10–11.
- Specifications for Warm White LED NVSL119BT; Nichia Corporation: Tokushima, Japan, 2012; pp. 11–12.
- Specifications for White LED NSSW757AT-V1; Nichia Corporation: Tokushima, Japan, 2012; pp. 10–11.
- Specification SSC-SAW8KG0A; Seoul Semiconductor: Gyeonggi-do, Korea, 2013; p. 6.
- Seoul Semiconductor. Specification SSC-STW8Q14C; Seoul Semiconductor: Gyeonggi-do, Korea, 2012; p. 7. [Google Scholar]
- Luxeon 3535 2D Mid-Power LEDs; DS204; Philips Lumileds: San Jose, CA, USA, 2013; p. 8.
- Luxeon 5630 Mid-Power LEDs; DS201; Philips Lumileds: San Jose, CA, USA, 2013; p. 8.
- Green, M.A.; Emery, K.; Hishikawa, Y.; Warta, W.; Dunlop, E.D. Solar cell efficiency tables (version 40). Prog. Photovolt. 2012, 20, 606–614. [Google Scholar]
- Zhao, J.H.; Wang, A.H.; Green, M.A.; Ferrazza, F. 19.8% efficient “honeycomb” textured multicrystalline and 24.4% monocrystalline silicon solar cells. Appl. Phys. Lett. 1998, 73, 1991–1993. [Google Scholar]
- Petermann, J.H.; Zielke, D.; Schmidt, J.; Haase, F.; Rojas, E.G.; Brendel, R. 19%-efficient and 43 μm-thick crystalline Si solar cell from layer transfer using porous silicon. Prog. Photovolt. 2012, 20, 1–5. [Google Scholar]
- Bhattacharya, R.N.; Contreras, M.A.; Egaas, B.; Noufi, R.N.; Kanevce, A.; Sites, J.R. High efficiency thin-film CuIn1-xGaxSe2photovoltaic cells using a Cd1–xZnxS buffer layer. Appl. Phys. Lett. 2006, 89. [Google Scholar] [CrossRef]
- Wu, X.Z. High-efficiency polycrystalline CdTe thin-film solar cells. Sol. Energy 2004, 77, 803–814. [Google Scholar]
- Meier, J.; Spitznagel, J.; Kroll, U.; Bucher, C.; Fay, S.; Moriarty, T.; Shah, A. Potential of amorphous and microcrystalline silicon solar cells. Thin Solid Films 2004, 451, 518–524. [Google Scholar]
- Chiba, Y.; Islam, A.; Watanabe, Y.; Komiya, R.; Koide, N.; Han, L.Y. Dye-sensitized solar cells with conversion efficiency of 11.1%. Jpn. J. Appl. Phys. 2006, 45, L638–L640. [Google Scholar]
- Chiu, S.W.; Lin, L.Y.; Lin, H.W.; Chen, Y.H.; Huang, Z.Y.; Lin, Y.T.; Lin, F.; Liu, Y.H.; Wong, K.T. A donor-acceptor-acceptor molecule for vacuum-processed organic solar cells with a power conversion efficiency of 6.4%. Chem. Commun. 2012, 48, 1857–1859. [Google Scholar]
- Pudov, A.O.; Sites, J.R.; Contreras, M.A.; Nakada, T.; Schock, H.W. CIGS J-V distortion in the absence of blue photons. Thin Solid Films 2005, 480, 273–278. [Google Scholar]
- Mullejans, H.; Wagner, T.; Merli, F.; Jager-Waldau, A.; Dunlop, E.D. Changes in spectral response with temperature and irradiance. Thin Solid Films 2004, 451, 145–151. [Google Scholar]
- Reich, N.H.; van Sark, W.G.J.H.M.; Alsema, E.A.; Kan, S.Y.; Silvester, S.; van der Heide, A.S.H.; Lof, R.W.; Schropp, R.E.I. Weak Light Performance and Spectral Response of Different Solar Cell Types. Proceedings of the 20th European Photovoltaic Solar Energy Conference and Exhibition, Barcelona, Spain, 6–10 June 2005; pp. 10–13.
- Koster, L.J.A.; Mihailetchi, V.D.; Ramaker, R.; Blom, P.W.M. Light intensity dependence of open-circuit voltage of polymer: Fullerene solar cells. Appl. Phys. Lett. 2005, 86. [Google Scholar] [CrossRef]
- Snaith, H.J.; Schmidt-Mende, L.; Gratzel, M.; Chiesa, M. Light intensity, temperature, and thickness dependence of the open-circuit voltage in solid-state dye-sensitized solar cells. Phys. Rev. B 2006, 74. [Google Scholar] [CrossRef]
- Frère, P.; Raimundo, J.M.; Blanchard, P.; Delaunay, J.; Richomme, P.; Sauvajol, J.L.; Orduna, J.; Garin, J.; Roncali, J. Effect of local molecular structure on the chain-length dependence of the electronic properties of thiophene-based pi-conjugated systems. J. Org. Chem. 2003, 68, 7254–7265. [Google Scholar]
- Roquet, S.; Cravino, A.; Leriche, P.; Aleveque, O.; Frère, P.; Roncali, J. Triphenylamine-thienylenevinylene hybrid systems with internal charge transfer as donor materials for heterojunction solar cells. J. Am. Chem. Soc. 2006, 128, 3459–3466. [Google Scholar]
- Riedel, I.; Dyakonov, V.; Parisi, J.; Brabec, C.; Sariciftci, N.S.; Hummelen, J.C. Polymer Fullerene Networks for Photovoltaic Applications. Proceedings of the 17th European Photovoltaic Solar Energy Conference and Exhibition, Munich, Germany, 22–26 October 2001; pp. 24–28.
- Minnaert, B.; Veelaert, P. The Appropriateness of Organic Solar Cells for Indoor Lighting Conditions. Proceedings of SPIE Photonics Europe—Organic Photonics IV, Brussels, Belgium, 12–16 April 2010.
- Minnaert, B.; Veelaert, P. The suitability of organic solar cells for different indoor conditions. Adv. Sci. Technol. 2010, 74, 170–175. [Google Scholar]
- Girish, T.E. Some suggestions for photovoltaic power generation using artificial light illumination. Sol. Energy Mater. Sol. Cells 2006, 90, 2569–2571. [Google Scholar]
- Minnaert, B.; Veelaert, P. Efficiency simulations of thin film chalcogenide photovoltaic cells for different indoor lighting conditions. Thin Solid Films 2011, 519, 7537–7540. [Google Scholar]
- Randall, J.F.; Jacot, J. Is AM1.5 applicable in practice? Modelling eight photovoltaic materials with respect to light intensity and two spectra. Renew. Energy 2003, 28, 1851–1864. [Google Scholar]
- Randall, J.F; Jacot, J. The performance and modelling of 8 photovoltaic materials under variable light intensity and spectra. Proceedings of the World Renewable Energy Congress VII & Expo, Cologne, Germany, 29 June 2002–5 July 2002.
- Steim, R.; Ameri, T.; Schilinsky, P.; Waldauf, C.; Dennler, G.; Scharber, M.; Brabec, C.J. Organic photovoltaics for low light applications. Sol. Energy Mater. Sol. Cells 2011, 95, 3256–3261. [Google Scholar]
- Monokroussos, C.; Bliss, M.; Qiu, Y.N.; Hibberd, C.J.; Betts, T.R.; Tiwari, A.N.; Gottschalg, R. Effects of spectrum on the power rating of amorphous silicon photovoltaic devices. Prog. Photovolt. 2011, 19, 640–648. [Google Scholar]
- Virtuani, A.; Lotter, E.; Powalla, M.; Rau, U.; Werner, J.H. Highly resistive Cu(In,Ga)Se2 absorbers for improved low-irradiance performance of thin-film solar cells. Thin Solid Films 2004, 451, 160–165. [Google Scholar]
- Randall, J.F.; Droz, C.; Goetz, M.; Shah, A.; Jacot, J. Comparison of 6 Photovoltaic Materials across 4 Orders of Magnitude of Intensity. Proceedings of the 17th European Photovoltaic Solar Energy Conference, Munich, Germany, 22–26 October 2001; pp. 603–606.
- Reich, N.H.; van Sark, W.; Alsema, E.A.; Lof, R.W.; Schropp, R.E.I.; Sinke, W.C.; Turkenburg, W.C. Crystalline silicon cell performance at low light intensities. Sol. Energy Mater. Sol. Cells 2009, 93, 1471–1481. [Google Scholar]
- Reich, N.H.; van Sark, W.; Turkenburg, W.C. Charge yield potential of indoor-operated solar cells incorporated into product integrated photovoltaic (PIPV). Renew. Energy 2011, 36, 642–647. [Google Scholar]
- Riedel, I.; Parisi, J.; Dyakonov, V.; Lutsen, L.; Vanderzande, D.; Hummelen, J.C. Effect of temperature and illumination on the electrical characteristics of polymer-fullerene bulk-heterojunction solar cells. Adv. Funct. Mater. 2004, 14, 38–44. [Google Scholar]


| Type | Label | Voc(V) | Jsc(mA/cm2) | FF(%) | η (%) | References |
|---|---|---|---|---|---|---|
| Crystallline silicon | ||||||
| Monocrystalline Si | m-Si | 0.696 | 42.0 | 83.6 | 24.4 | [26] |
| Multicrystalline Si | p-Si | 0.650 | 37.4 | 76.2 | 18.5 | [25] |
| Thin film transfer Si | t-Si | 0.650 | 37.8 | 77.6 | 19.1 | [25,27] |
| III-V-cell | ||||||
| GaAs | GaAs | 1.122 | 29.7 | 86.5 | 28.8 | [25] |
| Thin film chalcogenide | ||||||
| CIGS | CIGS | 0.705 | 35.5 | 77.9 | 19.5 | [28] |
| CdTe | CdTe | 0.845 | 25.9 | 75.5 | 16.5 | [29] |
| Amorphous silicon | ||||||
| Amorphous silicon | a-Si | 0.859 | 17.5 | 63.0 | 9.5 | [30] |
| Dye sensitized solar cell | ||||||
| Dye sensitized solar cell | DSSC | 0.736 | 20.9 | 72.2 | 11.1 | [31] |
| Organic solar cell | ||||||
| DTDCTP:C70 | Org. | 0.950 | 12.1 | 56.0 | 6.4 | [32] |
© 2014 by the authors; licensee MDPI, Basel, Switzerland. This article is an open access article distributed under the terms and conditions of the Creative Commons Attribution license ( http://creativecommons.org/licenses/by/3.0/).
Share and Cite
Minnaert, B.; Veelaert, P. A Proposal for Typical Artificial Light Sources for the Characterization of Indoor Photovoltaic Applications. Energies 2014, 7, 1500-1516. https://doi.org/10.3390/en7031500
Minnaert B, Veelaert P. A Proposal for Typical Artificial Light Sources for the Characterization of Indoor Photovoltaic Applications. Energies. 2014; 7(3):1500-1516. https://doi.org/10.3390/en7031500
Chicago/Turabian StyleMinnaert, Ben, and Peter Veelaert. 2014. "A Proposal for Typical Artificial Light Sources for the Characterization of Indoor Photovoltaic Applications" Energies 7, no. 3: 1500-1516. https://doi.org/10.3390/en7031500
APA StyleMinnaert, B., & Veelaert, P. (2014). A Proposal for Typical Artificial Light Sources for the Characterization of Indoor Photovoltaic Applications. Energies, 7(3), 1500-1516. https://doi.org/10.3390/en7031500