Simulated Effects of Land Cover Conversion on the Surface Energy Budget in the Southwest of China


Abstract
: In this paper, the coupled WRF/SSiB model, accompanied by a Karst Rocky Desertification (KRD) map of the Guizhou Karst Plateau (GKP) of China, was applied to detect how the changed vegetation and soil characteristics over the GKP modify the energy balance at the land surface. The results indicated that land degradation led to reduced net radiation by inducing more upward shortwave and longwave radiation, which were associated with increasing surface albedo and temperature, respectively. The KRD also resulted in changed surface energy partitioning into sensible and latent heat fluxes. The latent heat flux at land surface was reduced substantially due to the higher surface albedo and stomatal resistance, the lower Leaf Area Index (LAI) and roughness length in the degradation experiment, while the sensible heat flux increased, mainly because of the higher surface temperature. Furthermore, the moisture flux convergence was reduced, owing to the lower atmospheric heating and the relative subsidence. However, compared with the reduced evaporation, the decrease in moisture flux convergence contributed much less to the reduced precipitation. Precipitation strongly affects soil moisture, vegetation growth and phenology, and thus evaporation and convective latent heating, so when precipitation was changed, a feedback loop was created.1. Introduction
During the past decades, the vegetation-climate interaction has been a focus of meteorology, climatology, geography and ecology studies. It is well known that the distribution of natural vegetation is governed by climatic factors, such as precipitation, temperature, solar radiation, and CO2 concentration [1–7]. Recently, with the increasing reports on rapid loss of vegetation cover in several areas, the desire to better understand the role of land surface processes on both near-surface climate and atmospheric circulations has stimulated substantial studies on the exchanges of energy, mass, and momentum between land surface and atmosphere through field measurements as well as numerical experiments [8–15].
Most former studies showed that changes in surface energy and water balance due to land cover change (LCC) are as important as atmospheric dynamics and composition, ocean circulation, and solar orbit perturbations in climate change [16–18]. However, the feedback of vegetation on regional climate is complicated because of spatio-temporal variation in climate and LCC. For example, Li and Xue [13] showed that LCC from vegetated land to bare ground over the Tibetan Plateau (TP) resulted in weaker surface thermal effects and vertical ascending motion, and thus a decrease in the summer precipitation in the southeastern TP. While in the study of Zuo et al. [14], when greater vegetation cover occurs over the southern TP due to the enhanced rainfall, surface heating was also reduced over the TP, accompanied with the descending motion anomaly. The altered monsoon circulation due to less atmospheric heating over southern TP further led to increased summer rainfall over the south of the Yangtze River valley and the north of the Yellow River valley in China, but reduced rainfall in the Yellow River basin. Additionally, Wang et al. [19] investigated the inter-decadal relationship between Tibetan vegetation and rainfall over eastern China in the boreal spring, and found that increased vegetation on the TP could enhance (reduce) spring rainfall in the north (south) of the Yangtze River.
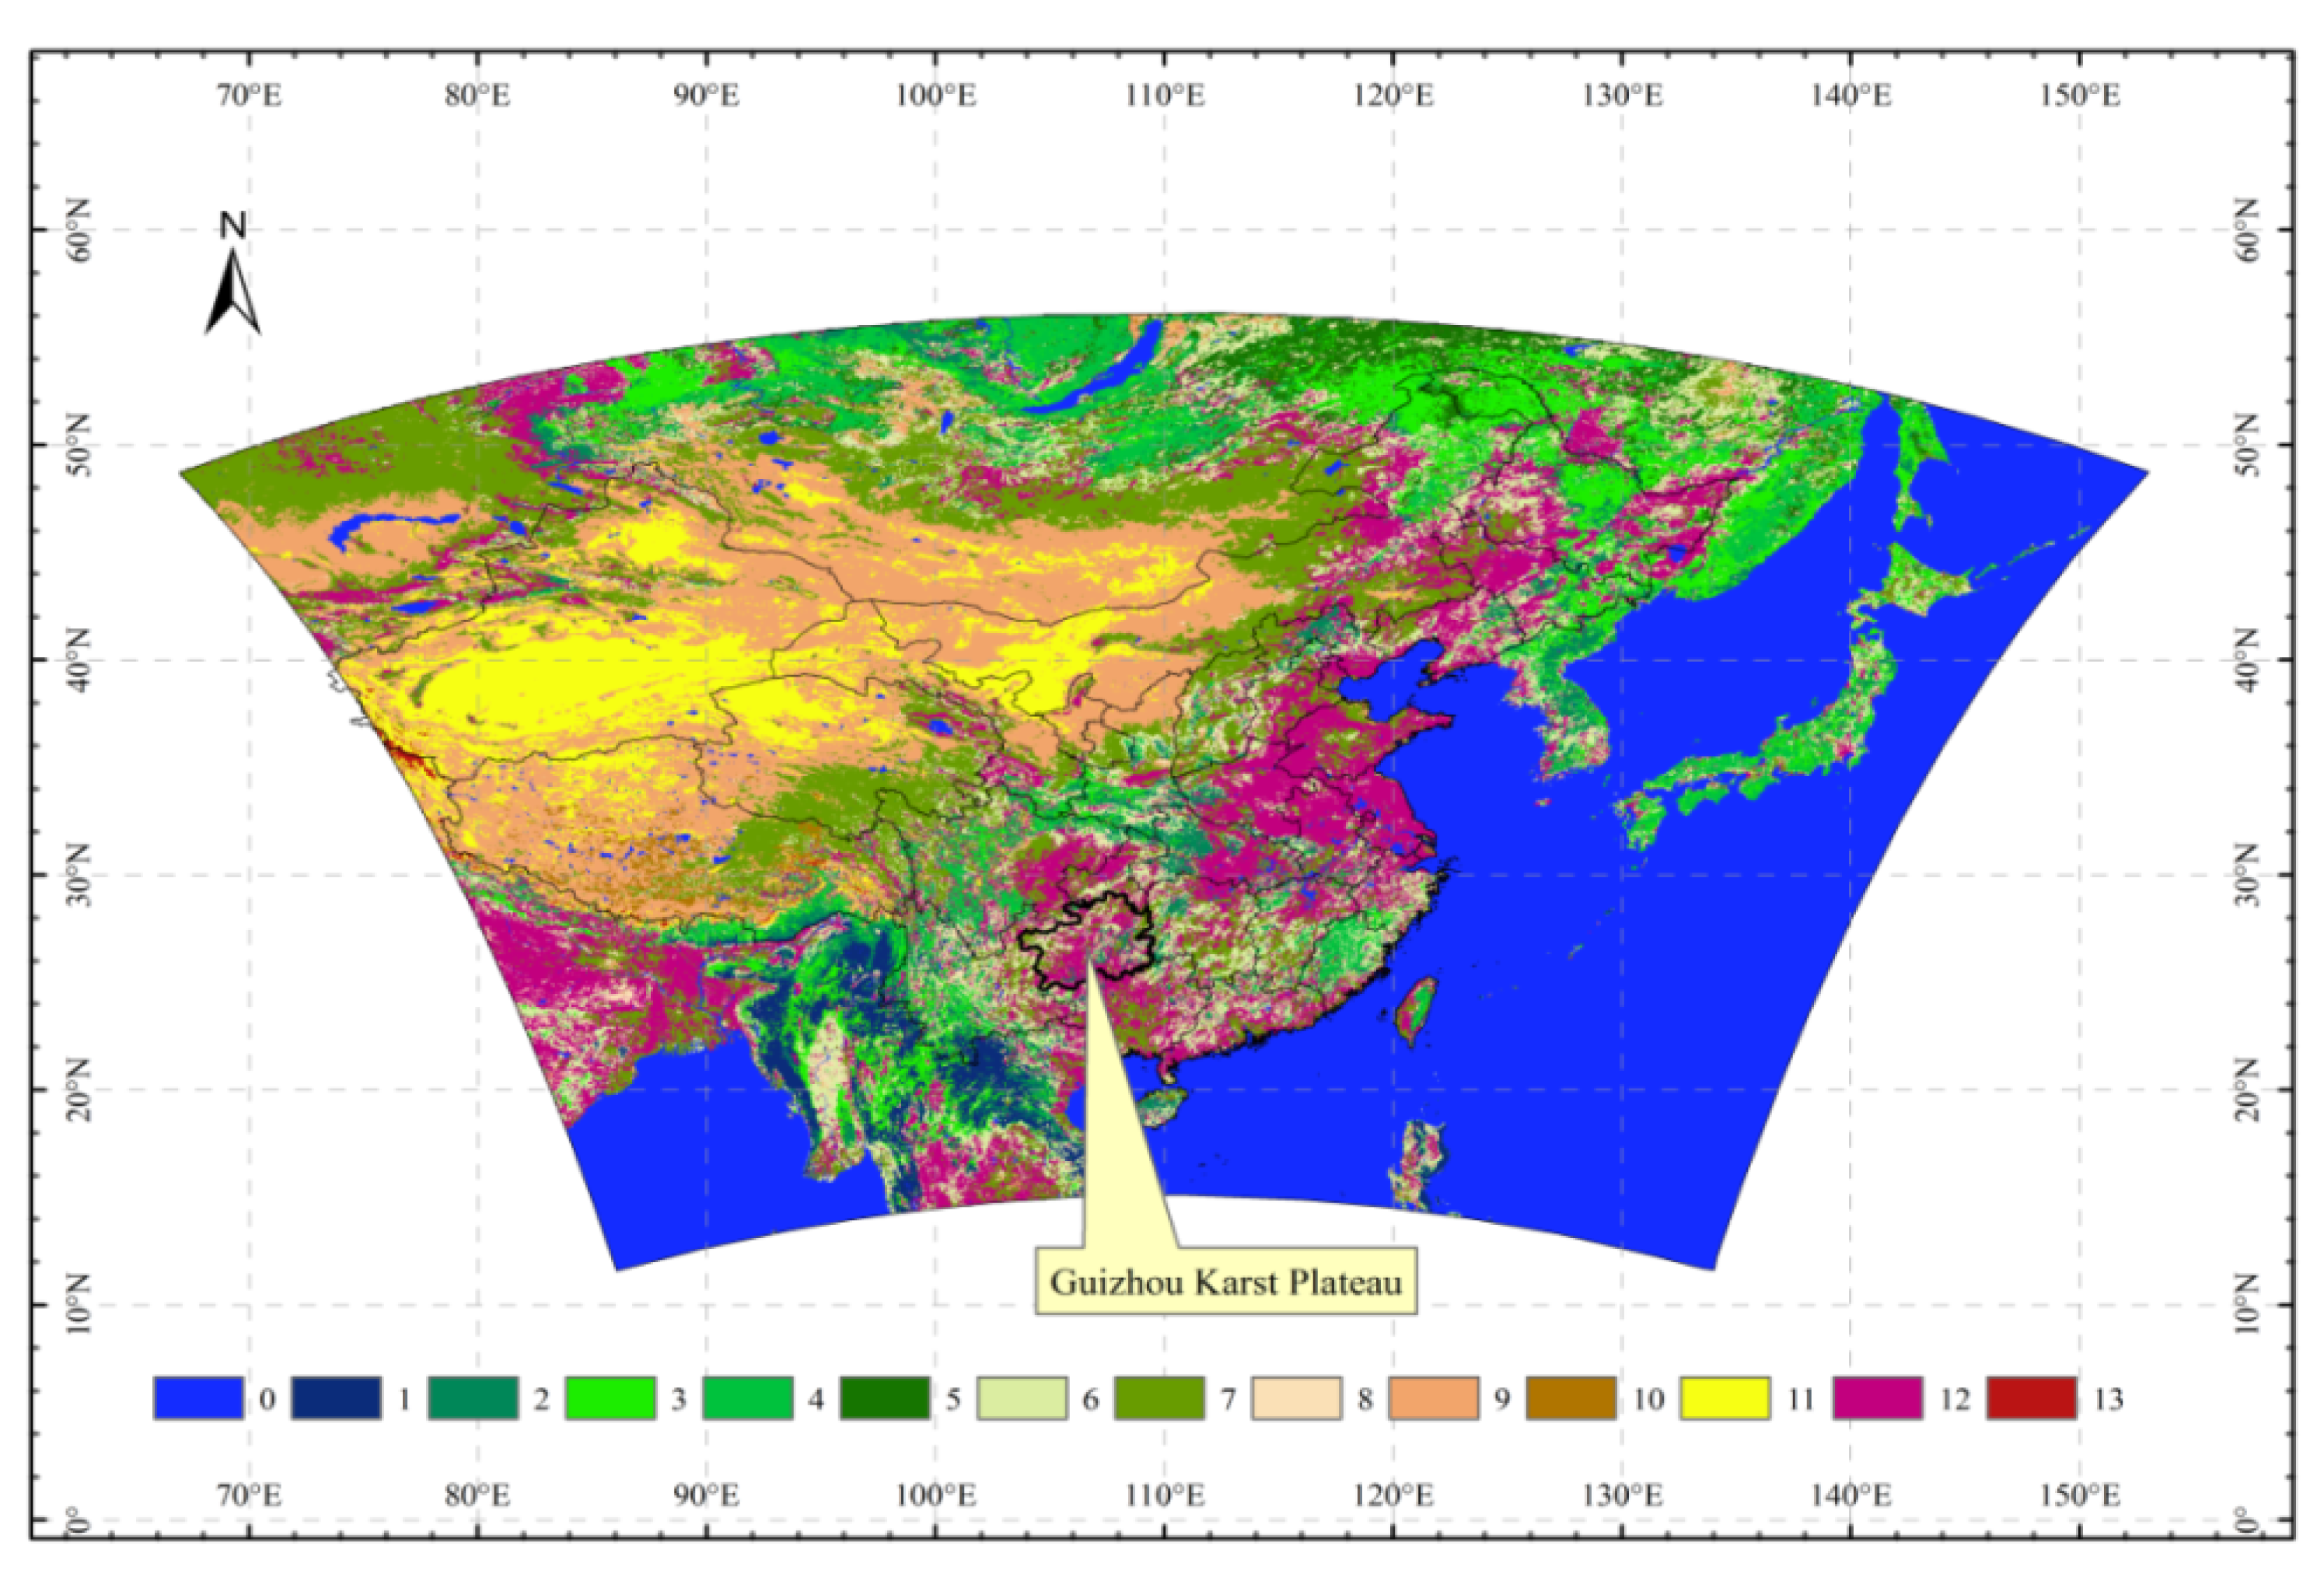
The Guizhou Karst Plateau (GKP), located in the southwest of China at 24°37′–29°13′ N and 103°36′–109°35′ E (Figure 1), was selected as the study area for its dramatic land degradation in the past decades. Due to the widely distributing bare limestone and the unsuitable land use in GKP since 1950s, Karst Rocky Desertification (KRD), defined as the transformation of vegetation and soil covered Karst landscape to exposed basement rocks [20], affects over 20% of the total area with a desertification rate of 2.5 × 10⁴ km2 per year [21], and thus has become the most serious environmental problem in the GKP. Based on both satellite images and field observation over GKP, Xiong et al. [22] used ArcGIS to extract the spatial pattern of KRD, and concluded that rocky desertification in GKP exhibits the three characteristics of severe degree, large area and high risk. Although the ecological effects of KRD have been detected [23,24], the potential feedback of KRD to regional climate by changing surface heating remains unknown. Actually, no matter what happened to regional climate after LCC, the modified water and energy balance is always the first-order effect of LCC, so our focus is mostly on the impact of land degradation on biophysical processes in GKP, and then on the consequent climate change in this region.
In this paper, based on the spatial distribution of KRD from Xiong et al. [22], and the Weather Research and Forecasting Model (WRF) [25] regional climate model (RCM) was applied to examine how land degradation, which has occurred and will continue in GKP, influences surface energy balance and regional climate. Sections 2 and 3 describe the WRF model and the Simplified Simple Biosphere (SSiB) model [26,27] used in this study and the experimental design. The simulated effects of land degradation on surface energy balance and regional climate are presented in Section 4. Finally, concluding remarks are given in Section 5.
2. Model Description
WRF with Advanced Research WRF (ARW) dynamic core Version 3.3 is an Euler non-hydrostatic with run-time, fully compressible meso-scale model with terrain following eta-coordinate, designed as the next numerical weather prediction and atmospheric simulation system. Multiple schemes are included in WRF model for atmospheric radiation, cloud microphysics, cumulus parameterization, land surface physics, and planetary boundary layer physics. WRF has been used for climate and meteorology simulation in East Asia and was proven to be of great value in modeling regional climate when compared with observations [28].
The Simplified Simple Biosphere Model (SSiB), a simplified version of the Simple Biosphere model (SiB) [29], is a biophysically based model of land-atmosphere interactions, and was coupled to provide the WRF with the land-atmosphere fluxes of latent and sensible heat, momentum and radiation. In the WRF/SSiB model, land surface properties are specified according to vegetation types. The SSiB vegetation map with 12 types (Figure 1) is originally derived from a global land cover map with the spatial resolution of 1 km [30]. A parameter set for each vegetation type is specified based on various sources. According to the former studies using SSiB original parameters to simulate land-atmosphere interactions in East Asia [9,28], and the data accessibility, the standard SSiB parameters were employed in this study.
The changed vegetation types leads to the changes in surface parameters, such as LAI, vegetation cover fraction, albedo, roughness length, soil depth. The morphological and physiological attributes of vegetation influences the amount of absorbed short-wave radiation as well as the aerodynamic resistance affecting turbulent exchanges of momentum, heat, and moisture between land surface and atmosphere [8]. It is important to understand how the hydrological processes and energy balance at the surface are altered as a result of specified land degradation, because these processes can cause simulated climate anomalies.
3. Experimental Design
There are two experiments to explore the impacts of LCC on surface energy budget: one used original SSiB vegetation map [27] that represents the natural vegetation distribution (Figure 1), called Case C, and the other, referred to as Case D, modified the former one according to Xiong et al. [22], which provides spatial information on the rocky desertification at finer patchy scale.
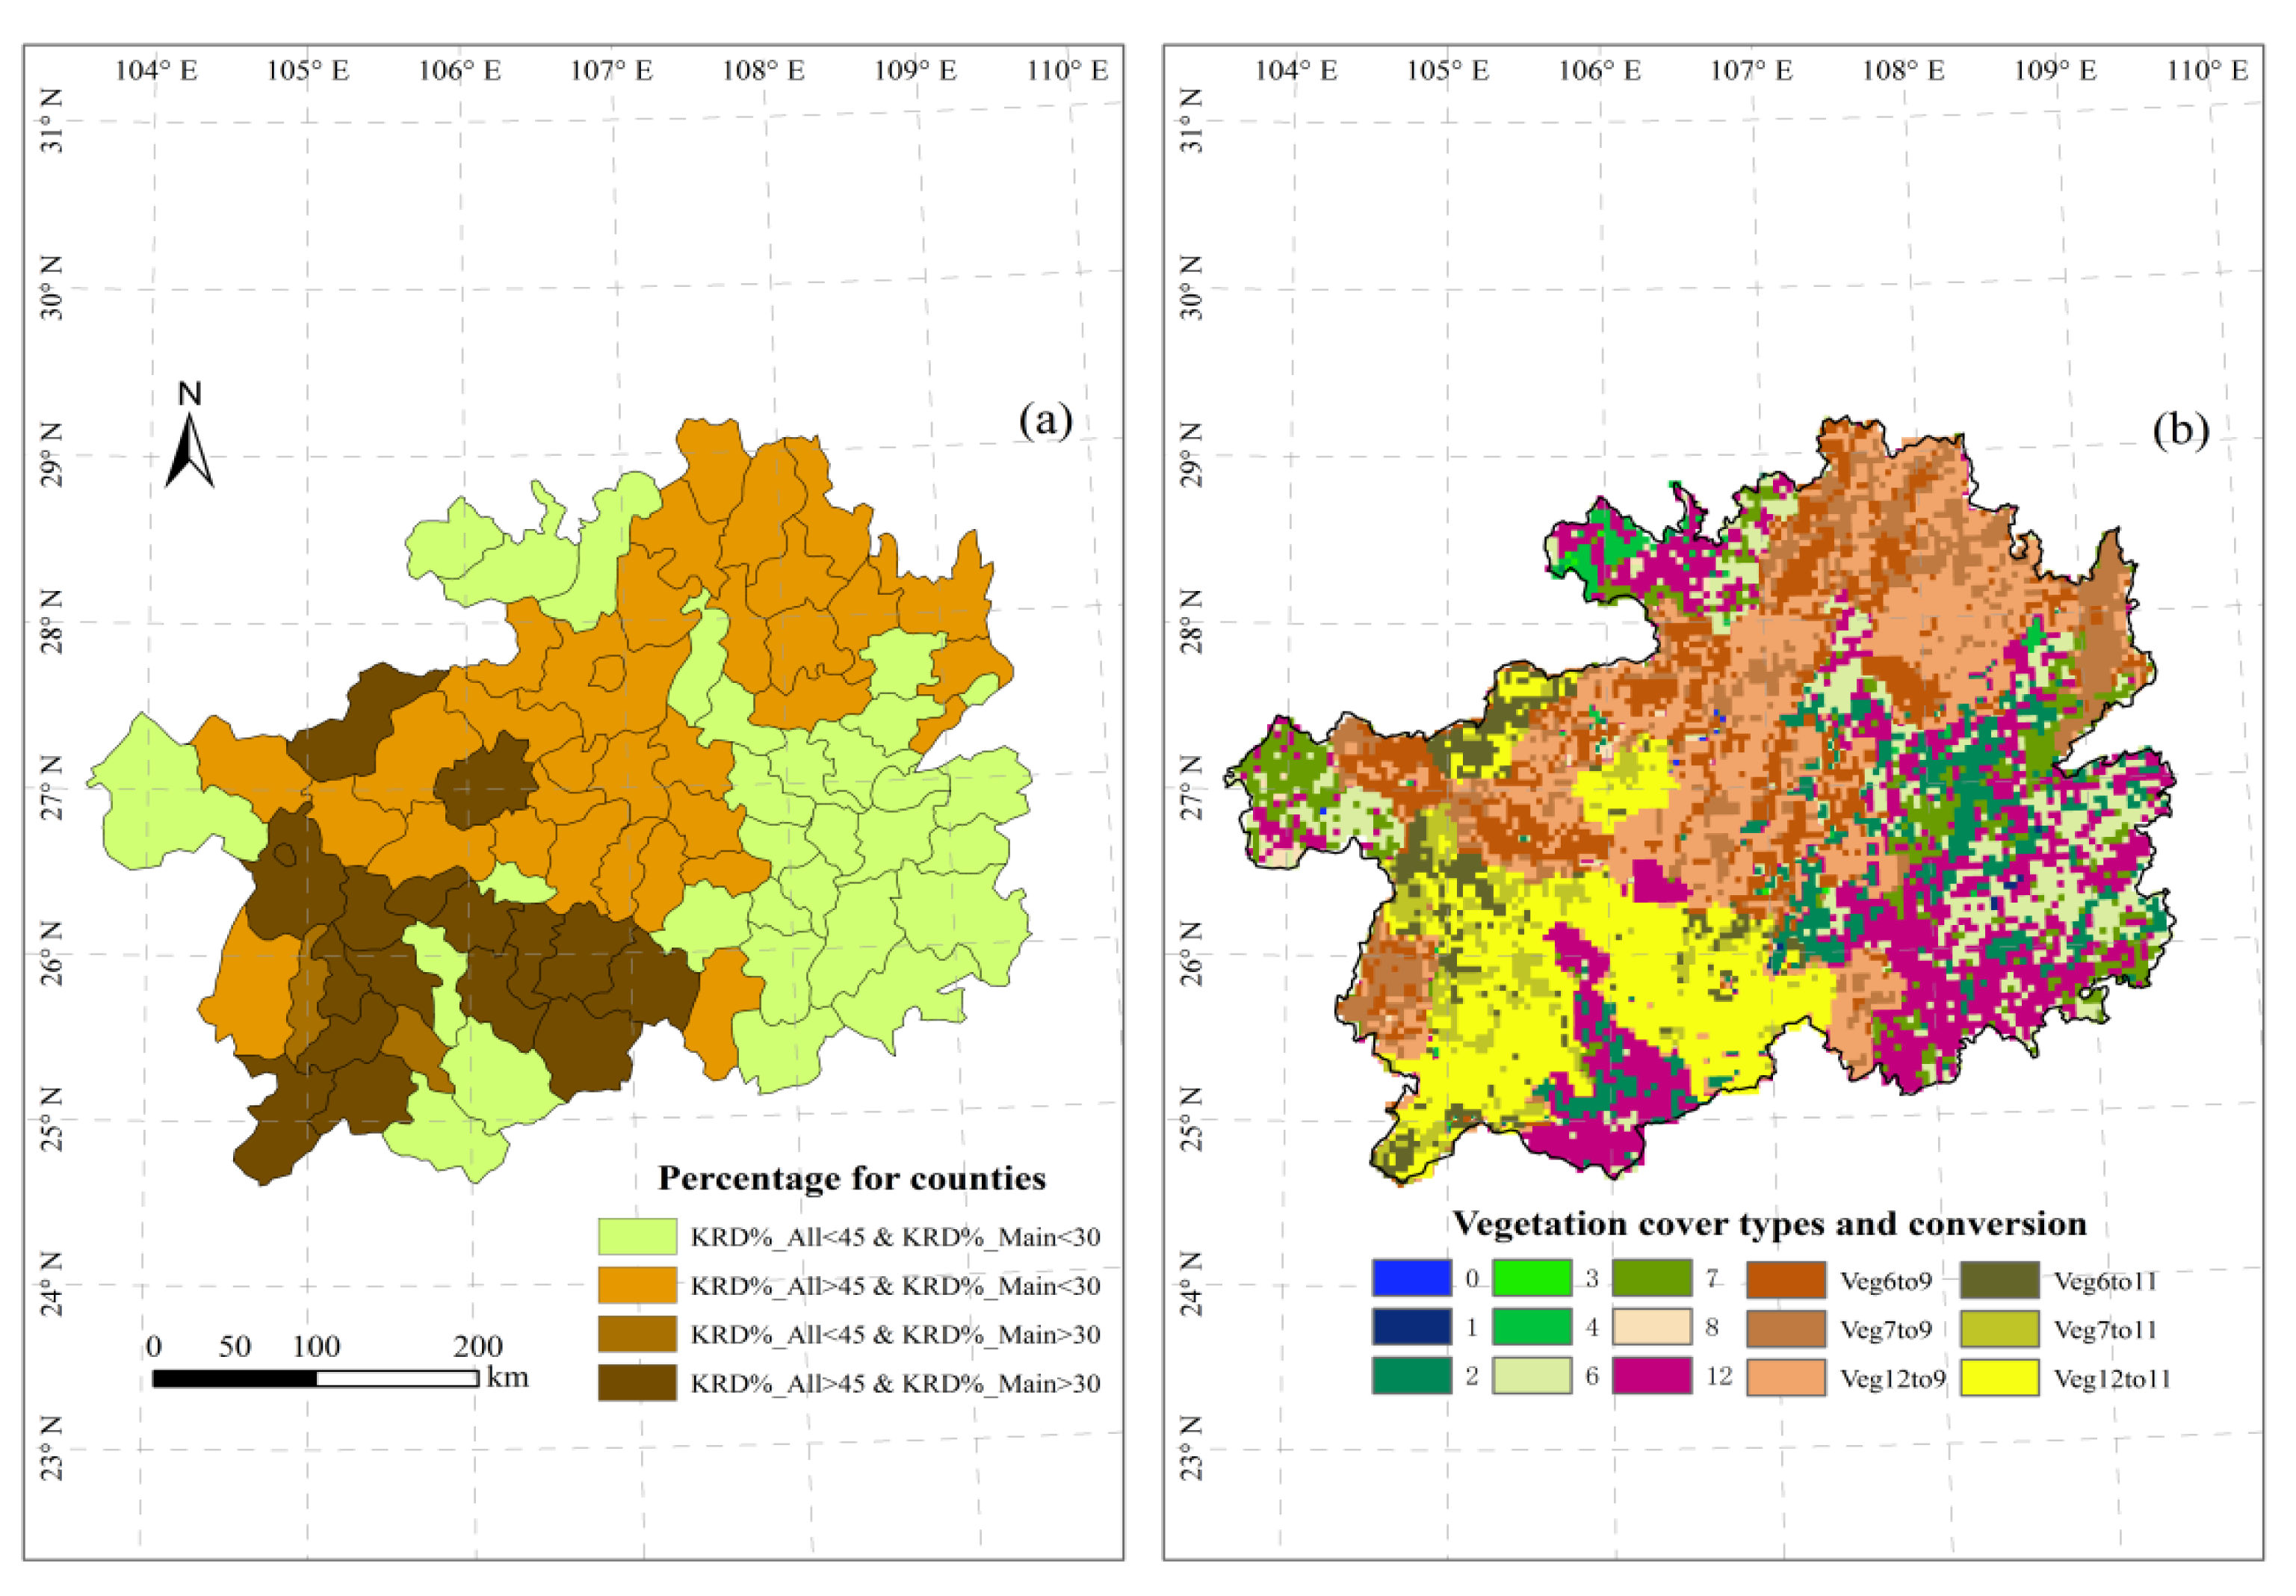
Based on Xiong et al. [22], the statistical results concerning the ratio of areas with different desertification degrees for every county of GKP are displayed in Figure 2a. In the counties with the KRD%_All larger than 45% and the KRD%_Main smaller than 30% in Figure 2a, the SSiB vegetation types in Figure 1 were modified to type 9 (broadleaf shrubs with bare soil) (Figure 2b), and when KRD%_Main larger than 30%, no matter whether KRD%_All larger than 45% or not, all the vegetation types in these counties were changed to type 11 (bare soil), as shown in Figure 2b, altering the prescribed vegetation and soil properties to that consistent with land degradation. For example, when crop was modified to broadleaf shrub with bare soil, the roughness length (m), leaf area index and vegetation cover fraction should be reduced from 0.51 to 0.06, 6.00 to 0.21, and 0.90 to 0.10, respectively. The scenario about the potential land cover conditions was determined based on the field work and the research of Zhou et al. [31], Wang et al. [32] and Ren [33], who studied the land cover change in the process of land degradation in the southwest of China. The changes in land cover types represent the condition that may occur if the current degradation processes continue. Finally, the control experiment (Case C) and the degraded experiment (Case D) were conducted. Ensemble summer (June, July and August, JJA) climate integrations of three years (1998, 2000 and 2004) were used to detect the consequences of the degraded land surface.
The WRF model domain, centered at 35° N and 110° E with dimensions of 196 × 154 horizontal grid points with spacing of 30 km (Figure 1), covers the areas of the upper level westerly jet (ULJ) and low-level jet (LLJ), the Tibetan Plateau (TP), the moisture sources from the South China Sea, the Bay of Bengal and the southeast trade wind, all of which are important for the development of East Asian summer monsoon [34]. Based on the comparisons of WRF/SSiB simulations between different physical parameterization schemes, the Yonsei University planetary boundary layer (YSUPBL) scheme, the CAM longwave and shortwave radiation scheme, the WRF single-moment 3-class (WSM3) microphysics scheme, the Kain-Fritsch cumulus scheme, and the SSiB land surface model were chosen as the main physical packages for this study. For example, WRF/SSiB model with WSM 3 microphysics scheme created larger R, smaller bias and RMSE for precipitation than Kessler, Ferrier, Purdue Lin and WSM 5 microphysics schemes (Table 1). Based on the comparison of R, bias and RMSE of precipitation and temperature between different radiation schemes, it can be found that the simulations of precipitation and temperature were more reasonable from the CAM longwave and shortwave radiation schemes than that from RRTMG, RRTM and MM5 schemes (Table 1). The initial conditions (for atmosphere, SSiB soil moisture and soil temperature), lateral boundary conditions, ocean surface boundary conditions (sea surface temperature (SST) and sea ice), and initial snow depth for the WRF are given by the NCEP DOE Reanalysis-2 [35], hereafter NCEP R-2, at 6-h intervals. SST and sea ice were reinitialized from NCEP R-2 at the beginning of each successive 6-h simulation.
4. Results and Discussion
Dynamic downscaling of the monsoonal climate for East Asia is a challenging task [34]. Generally, it is recognized that the final quality of the results from RCMs depends in part on the reality of the large-scale forcing provided by reanalyses. Thus, to realistically assess LCC impact, it is important to evaluate RCM's ability to simulate the climatic features at regional scales. In this study, WRF/SSiB outputs of precipitation, temperature and atmospheric variables from ensemble Case C over 18°–52° N, 86°–136° E were used for model evaluation. The Asian Precipitation-Highly-Resolved Observational Data Integration towards Evaluation of the Water Resource [36], called APHROD, and Global Telecommunication System (GTS) were employed as the observation datasets for precipitation and temperature, respectively. In addition, the Japanese 25-year Reanalysis (JRA-25) [37] was applied to analyze the simulation performance for circulation and other atmospheric variables.
Both WRF/SSiB and NCEP R-2 simulated the macro-spatial pattern of precipitation (not shown) and the most rainfall occurring in the south of China, especially in the south of Yangtze River. The rainfall belt and the center of maximum rainfall shown in observation were clearer in WRF/SSiB simulation than that in NCEP R-2, however, WRF/SSiB still produced more rainfall than observation (Table 2). Although the simulated surface temperature from WRF/SSiB was not improved over NCEP R-2 (Table 2), WRF/SSiB also presented spatial information for temperature in more details. Compared with NCEP R-2, WRF/SSiB cannot improve the simulation of atmospheric structure in the upper and middle troposphere (Table 2), which is consistent with several previous studies [28,34]. However, it indicated the improved simulation of water vapor flux at 700 hpa (Table 2), which is a crucial factor affecting the convective activity in East Asian summer monsoon, and thus led to the better simulation of JJA precipitation in East Asia.
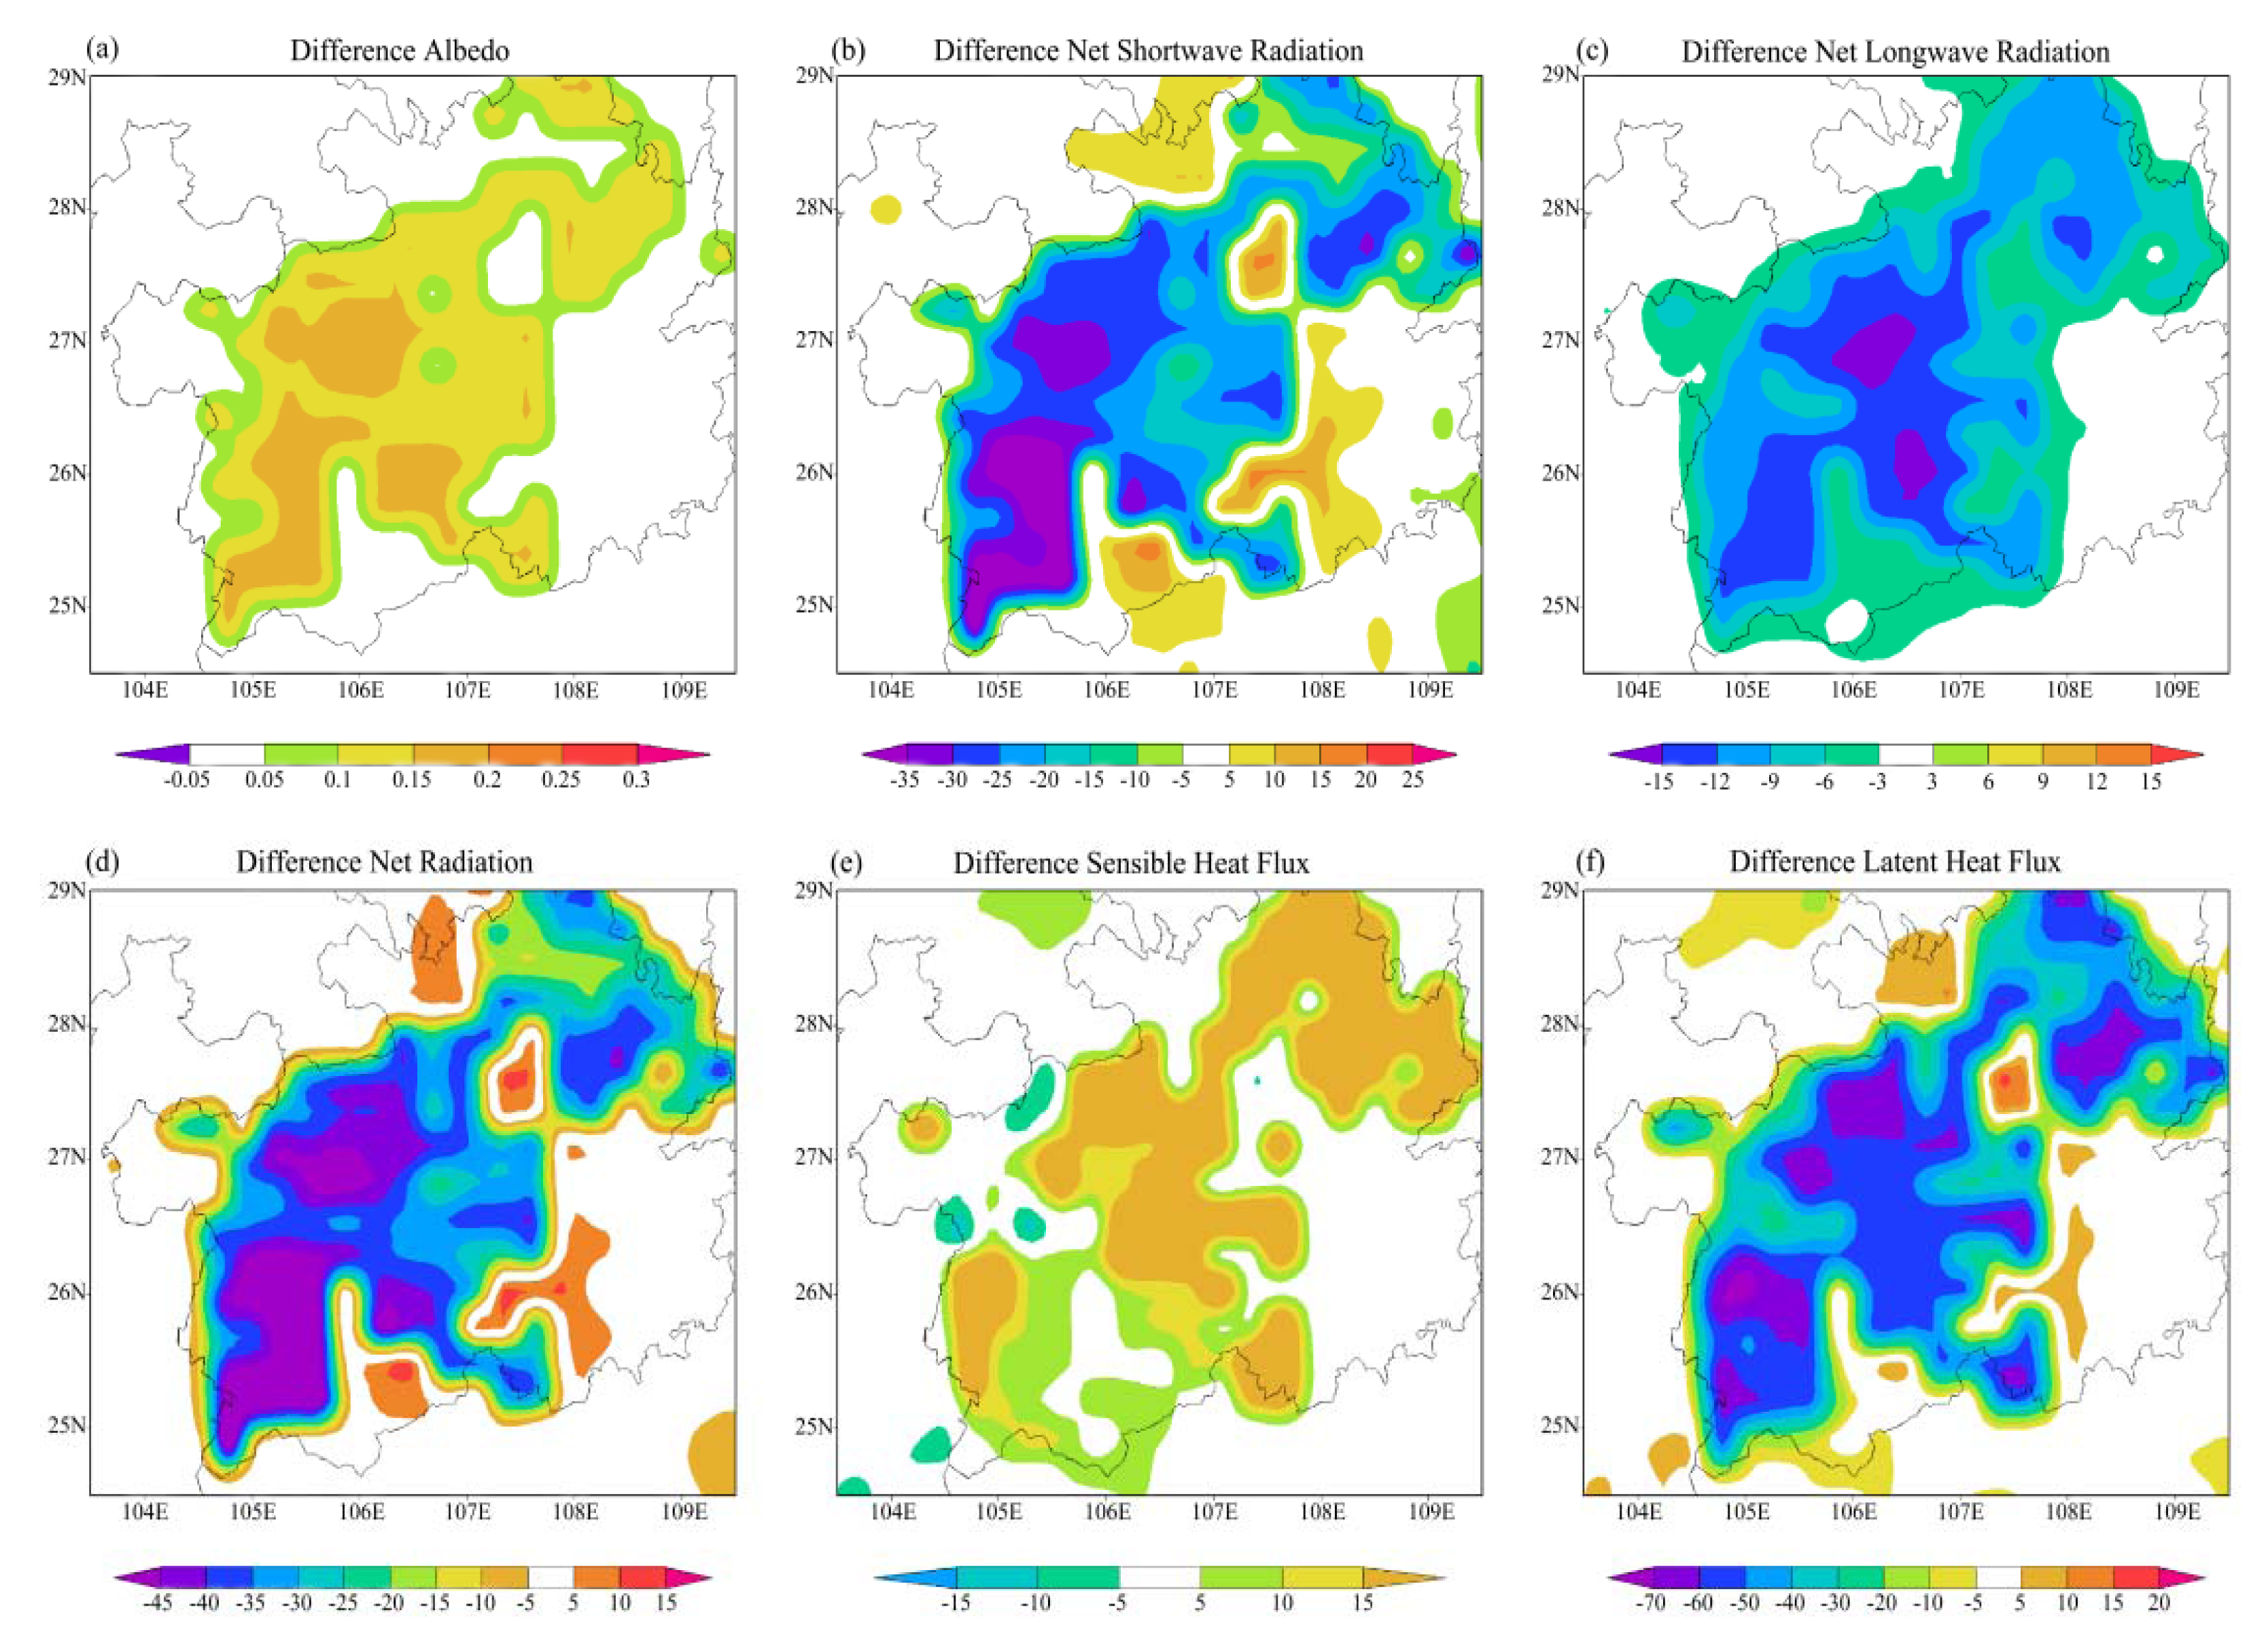
Table 3 shows the regional average of energy-balance components for degradation and control experiments and the differences between them over 24.5°–29° N, and 103.5°–109.5° E. As shown in Figure 3, the substantial changes of five components occurred in GKP.
Due to the higher albedo in the degraded area (Figure 3a, Table 3), more shortwave radiation is reflected from the surface (Figure 3b, Table 3), although the reduced cloudiness in the drier atmosphere (not shown) partially compensates for this loss by increasing downward shortwave radiation. The impact of surface albedo on the reflected shortwave radiation from the surface further influences the surface energy balance and the surface skin temperature, which is used to drive the upward longwave radiation from the surface. The net longwave radiation at the surface is reduced (Figure 3c) from −73.030 to −78.206 W m−2 (Table 3), mainly because the higher surface temperature in degradation experiment (Table 4) increases the outgoing longwave radiation. Meanwhile, the less cloud cover and water vapor in the degradation simulations lower the incoming longwave radiation at the surface. The reduction in the net shortwave and longwave radiation in Case D certainly results in the decrease in net radiation at the land surface (about 12.921 W m−2) (Figure 3d, Table 3).
The warmer surface in Case D also induces more sensible heat flux (about 5.813 W m−2) (Figure 3e, Table 3), which is different from the research of Xue and Shukla [38], but similar to Li et al. [39]. Xue and Shukla [38] concluded that the surface sensible heat flux was reduced when the shortwave radiation absorbed by the ground was reduced by a large. In Li et al. [39], surface sensible heat flux decreased around the Yellow River basin in response to the more vegetation cover and the lower surface temperature. However, in this study, the increase in sensible heat flux is less than the reduction in surface latent heat flux (Figure 3, Table 3). Due to the higher surface albedo and stomatal resistance, the lower LAI, roughness length and soil hydraulic conductivity in the degradation simulations, latent heat flux is reduced substantially from 116.251 to 97.508 W m−2 over the tested area (Figure 3f, Table 3). This reduction is similar to that found in Amazon deforestation experiments [40], Sahel desertification experiments [38], and Mongolian desertification experiments [41]. The decrease in evaporation is partially because of the reduced net radiation, but more importantly is contributed by changes in vegetation and soil properties. Actually, the above-mentioned higher temperature occurred mainly because of the reduced evaporative cooling. It is clear that, among all the components, changes in latent heat flux produced the most important impact on the regional energy balance.
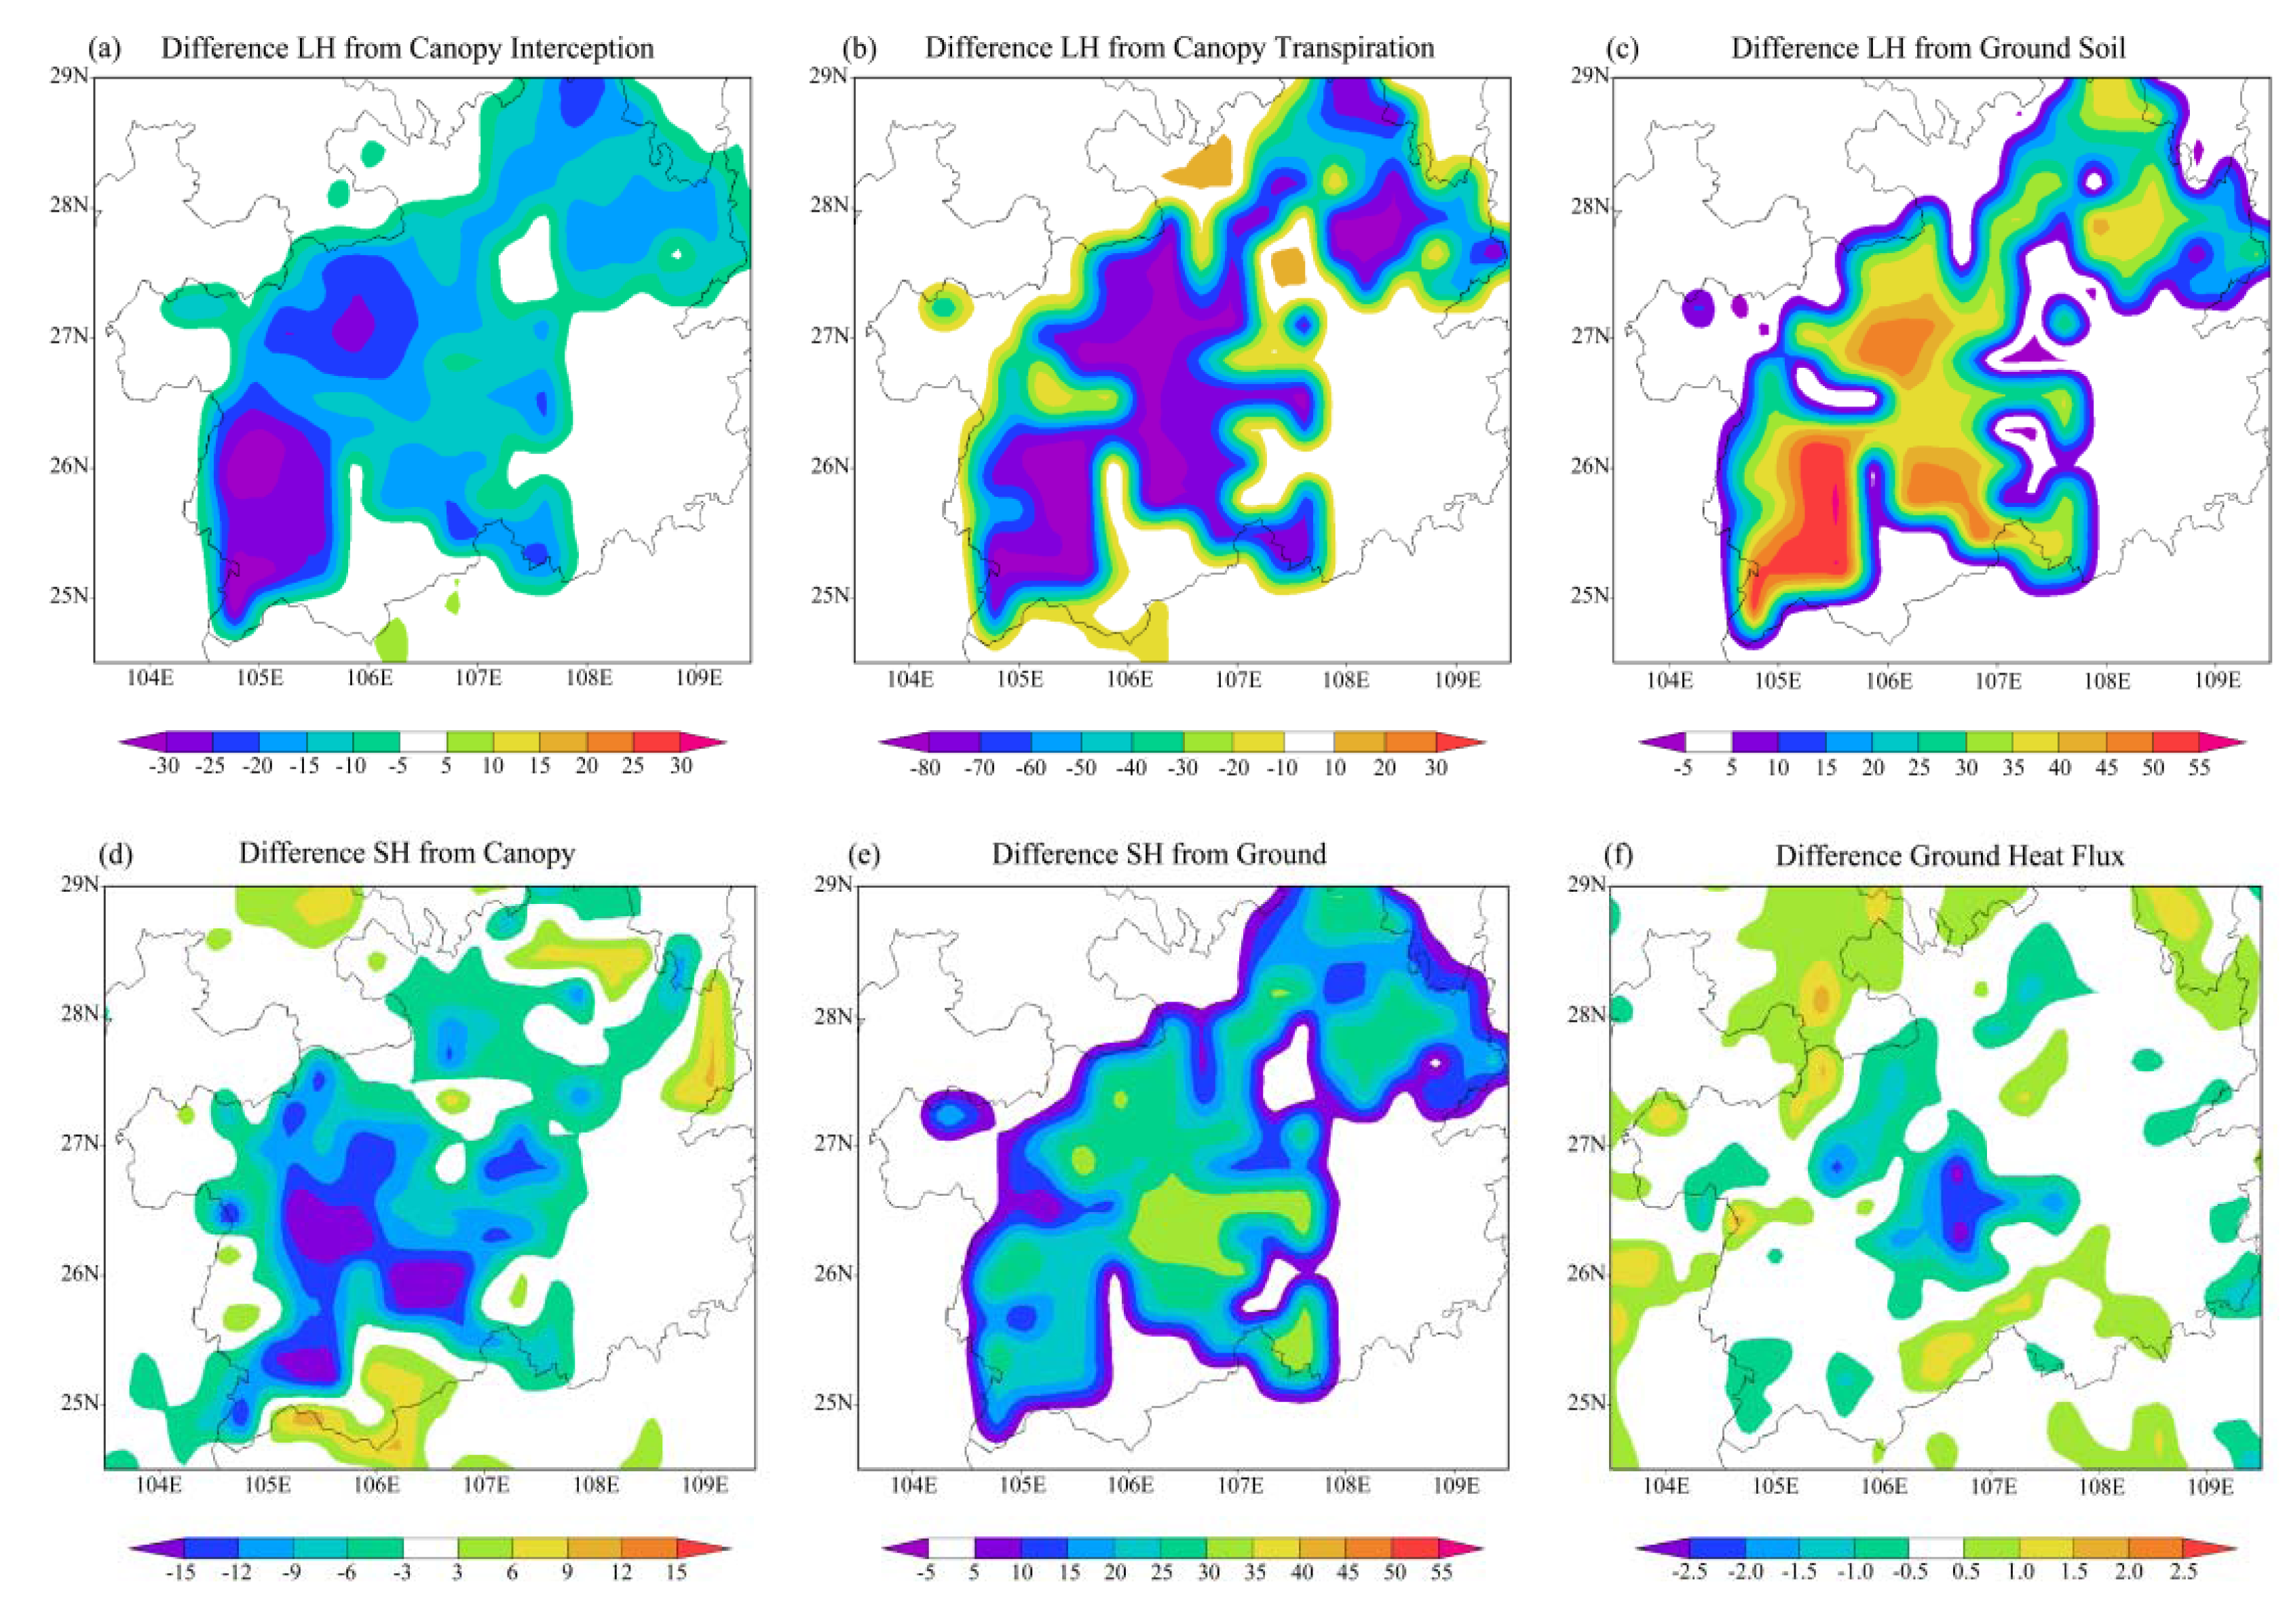
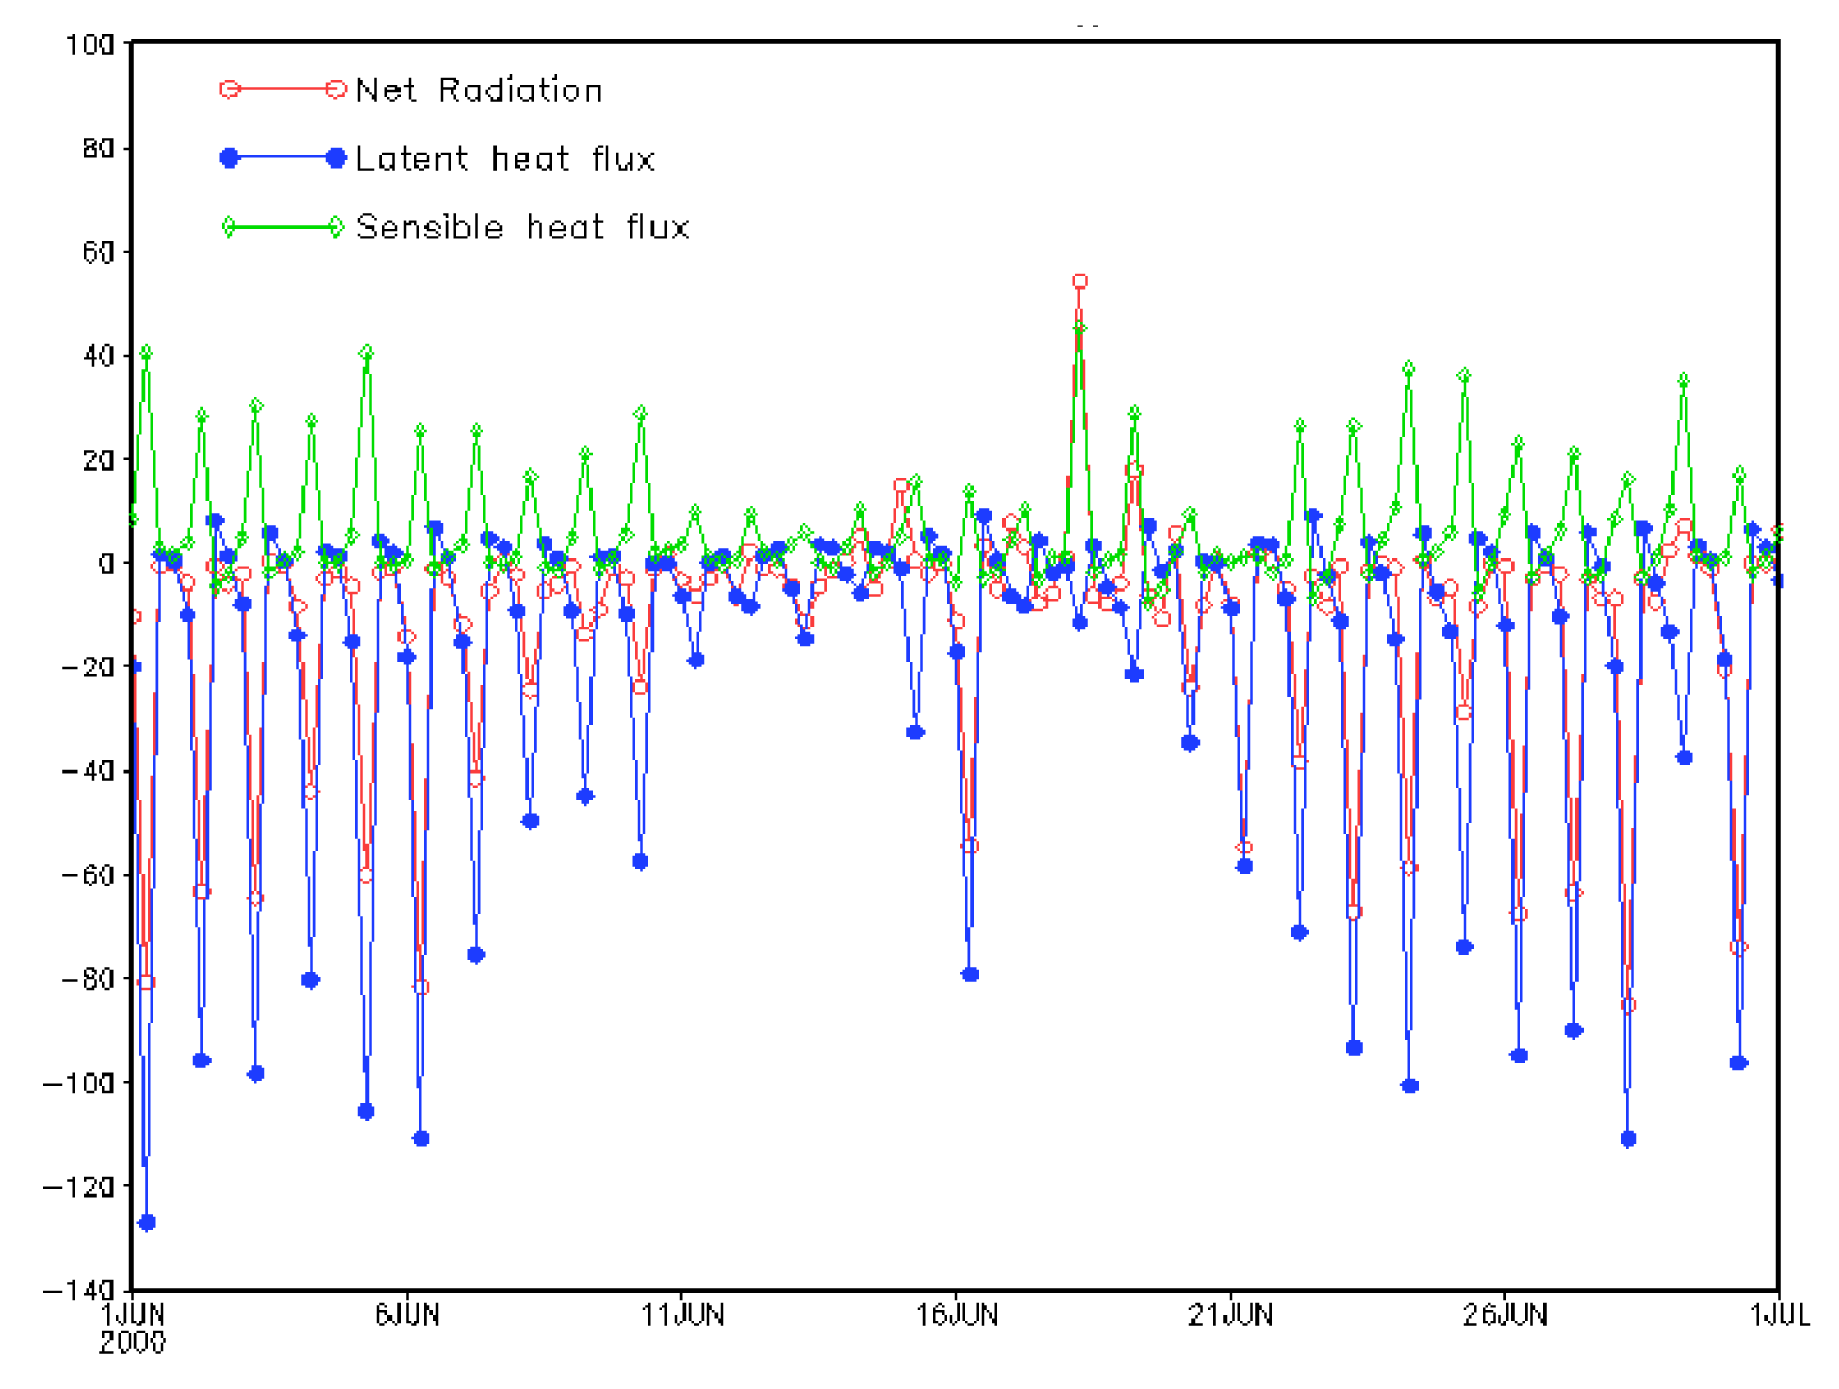
As shown in Figure 4, the decrease in latent heat flux from canopy transpiration (LHT) (Figure 4b) makes larger contribution to the reduced latent heat flux than that from canopy interception (LHI) (Figure 4a). Latent heat flux from ground soil (LHG, Figure 4c) increases, accompanied with the reduced total soil moisture contents from 0.93 to 0.67 m (Table 4). After land degradation, the mean areal LHT, LHI and LHG change from 59.196 to 36.997 W m−2, from 19.818 to 12.643 W m−2, and from 37.236 to 47.868 W m−2 (Table 3), respectively. The sensible heat flux from ground (SHG) increases substantially (Figure 4e), when KRD occurred, with the regional mean changing from 7.546 to 15.883 W m−2 (Table 3), while sensible heat flux from canopy (SHC) decreases (Figure 4d) from 13.922 to 11.398 W m−2 (Table 3). Both Figure 4f and Table 3 indicate that KRD leads to the reduced ground heat flux (GHF), but the difference is much smaller than other components. Additionally, Figure 5 shows that the differences in net radiation, latent heat flux and sensible heat flux peak around noon, and the same conclusion can be drawn for other energy-balance components.
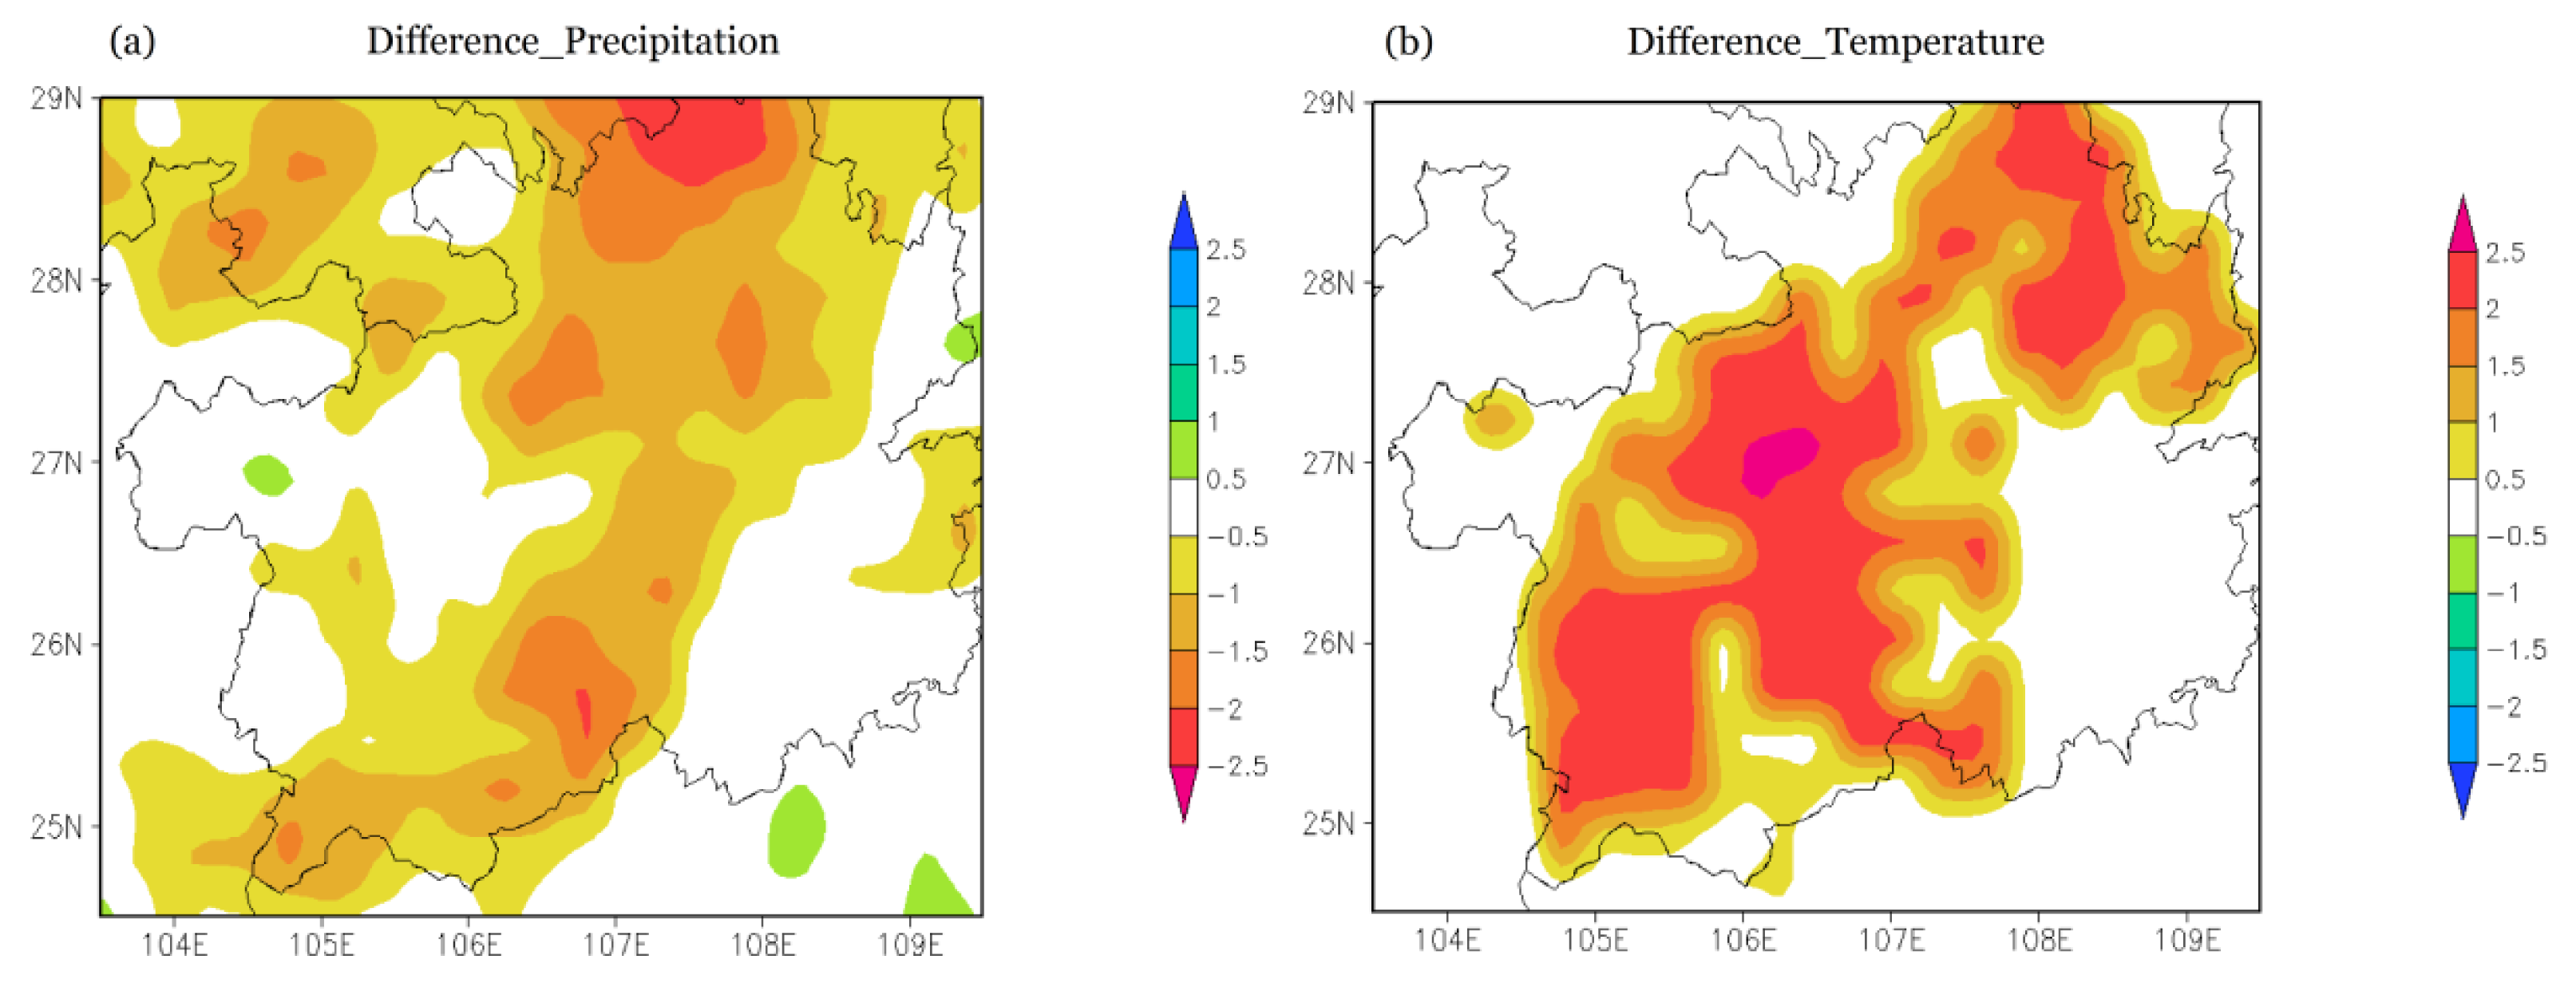
By and large, the above analysis shows that land degradation in GKP, and in particular vegetation degradation, modified the water and energy balance as well as the partitioning of available energy over sensible and latent heat fluxes. Moreover, after KRD, less moisture is transferred to the atmosphere through the boundary layer, owing to the significant reduction in evaporation. Table 4 shows that this results in lower atmospheric temperature because of less convective latent and atmospheric diabatic heating rates. Generally, less atmospheric heating is associated with relative subsidence (Table 4) and more horizontal divergence (i.e., less moisture flux convergence), which further caused the reduced VIMFC and rainfall (Figure 6a, Table 4).
5. Conclusions
The changing land use/cover pattern is considered one of the driving forces of climate change by its feedback to the climate system. This study indicated that the effects of KRD over the GKP (i.e., serious soil erosion, extensive exposure of basement rocks, drastic decrease in soil productivity and appearance of desert-like landscape) can significantly influence the regional climate by modifying the energy budget at the land surface. After land degradation, both net shortwave and longwave radiation were reduced. The increased surface albedo due to KRD led to the increase in reflected shortwave radiation and the decrease in net shortwave radiation. The higher surface temperature (Figure 6b) not only drove more upward longwave radiation and reduced the net longwave radiation, but also induced more sensible heat flux, where the substantial increase in sensible heat flux from the ground offset the decrease from the canopy. The reduced latent heat flux in KRD areas with higher stomatal resistance and lower LAI was mainly resulted from the decrease in latent heat flux from canopy transpiration.
Furthermore, less atmospheric heating from degraded land caused relative subsidence and less moisture flux convergence (MFC), however, the reduced MFC made much smaller contribution to the decrease in rainfall than the reduced evaporation. When precipitation is affected, a feedback loop was activated through soil moisture, vegetation growth and phenology.
Acknowledgments
This work was supported by the National Natural Science Foundation of China (Grant No. 41301089), the “Strategic Priority Research Program” of the Chinese Academy of Sciences (Grant No. XDA05090307), and the National Science and Technology Support Program of China (Grant No. 2012BAC19B10). The National Center for Atmospheric Research (NCAR) super computer has been used for the computation for this paper. We thank Fernando De Sales of University of California, Los Angeles (UCLA) for the helpful comments in this study.
Conflicts of Interest
The authors declare no conflict of interest.
References
- Nemani, R.R.; Keeling, C.D.; Hashimoto, H.; Jolly, W.M.; Piper, S.C.; Tucker, C.J.; Myneni, R.B.; Running, S.W. Climate-driven increases in global terrestrial net primary production from 1982 to 1999. Science 2003, 300, 1560–1563. [Google Scholar]
- Fang, J.Y.; Piao, S.L.; Zhou, L.M.; He, J.S.; Wei, F.Y.; Myneni, R.B.; Tucker, C.J.; Tan, K. Precipitation patterns alter growth of temperate vegetation. Geophys. Res. Lett. 2005, 32. [Google Scholar] [CrossRef]
- Piao, S.L.; Friedlingstein, P.; Ciais, P.; Peylin, P.; Zhu, B.; Reichstein, M. The footprint of temperature changes in the temperate and boreal forest carbon balance. Geophys. Res. Lett. 2009, 36. [Google Scholar] [CrossRef]
- Wu, S.H.; Yin, Y.H.; Zhao, D.S.; Huang, M.; Shao, X.M.; Dai, E.F. Impact of future climate change on terrestrial ecosystems in China. Int. J. Climatol. 2010, 20, 866–873. [Google Scholar]
- Li, S.C.; Zhao, Z.Q.; Wang, Y.; Wang, Y.L. Identifying spatial patterns of synchronization between NDVI and climatic determinants using joint recurrence plots. Environ. Earth. Sci. 2011, 64, 851–859. [Google Scholar]
- Gao, J.B.; Li, S.C.; Zhao, Z.Q.; Cai, Y.L. Investigating spatial variation in the relationships between NDVI and environmental factors at multi-scales: A case study of Guizhou Karst Plateau, China. Int. J. Remote Sens. 2012, 33, 2112–2129. [Google Scholar]
- Keenan, T.F.; Hollinger, D.Y.; Bohrer, G.; Dragoni, D.; Munger, J.W.; Schmid, H.P.; Richardson, A.D. Increase in forest water-use efficiency as atmospheric carbon dioxide concentrations rise. Nature 2013, 499, 324–327. [Google Scholar]
- Bounoua, L.; Defries, R.; Collatz, G.J.; Sellers, P.J.; Khan, H. Effects of land cover conversion on surface climate. Clim. Chang. 2002, 52, 29–64. [Google Scholar]
- Xue, Y.; Juang, H.M. H.; Li, W.P.; Prince, S.; DeFries, R.; Jiao, Y.; Vasic, R. Role of land surface processes in monsoon development: East Asia and West Afria. J. Geophys. Res. 2004, 109. [Google Scholar] [CrossRef]
- Ding, Y.H.; Li, Q.P.; Dong, W.J. A numerical simulation study of the impacts of vegetation changes on regional climate in China. Acta Meteorol. Sin. 2005, 63, 613–621. [Google Scholar]
- Wang, W.L.; Anderson, B.T.; Entekhabi, D.; Huang, D.; Su, Y.; Kaufmann, R.K.; Myneni, R.B. Intraseasonal interactions between temperature and vegetation over the boreal forest. Earth. Interact. 2007, 11. [Google Scholar] [CrossRef]
- Kang, H.S.; Xue, Y.; Collatz, G.J. Impact assessment of satellite-derived leaf area index datasets using a general circulation model. J. Clim. 2007, 20, 993–1015. [Google Scholar]
- Li, Q.; Xue, Y. Simulated impacts of land cover change on summer climate in the Tibetan Plateau. Environ. Res. Lett. 2010, 5. [Google Scholar] [CrossRef]
- Zuo, Z.Y.; Zhang, R.H.; Zhao, P. The relation of vegetation over the Tibetan Plateau to rainfall in China during the boreal summer. Clim. Dyn. 2011, 36, 1207–1219. [Google Scholar]
- Wang, Y.L.; Feng, J.M.; Gao, H. Numerical simulation of the impact of land cover change on regional climate in China. Theor. Appl. Climatol. 2013, 115, 141–152. [Google Scholar]
- Zhang, X.Z.; Tanga, Q.H.; Zheng, J.Y.; Ge, Q.S. Warming/cooling effects of cropland greenness changes during 1982–2006 in the North China Plain. Environ. Res. Lett. 2013, 8. [Google Scholar] [CrossRef]
- Pielke, R.A.; Avissar, R.; Raupach, M.; Dolman, A.J.; Xeng, Y.; Denning, S. Interactions between the atmosphere and terrestrial ecosystems: Influence on weather and climate. Glob. Chang. Biol. 1998, 4, 461–475. [Google Scholar]
- Pitman, A.J.; de Noblet-Ducoudré, N.; Cruz, F.T.; Davin, E.L.; Bonan, G.B.; Brovkin, V.; Claussen, M.; Delire, C.; Ganzeveld, L.; Gayler, V.; et al. Uncertainties in climate responses to past land cover change: First results from the LUCID intercomparison study. Geophys. Res. Lett. 2009, 26. [Google Scholar] [CrossRef]
- Wang, Y.X.; Zhao, P.; Yu, R.C.; Rasul, G. Inter-decadal variability of Tibetan spring vegetation and its associations with eastern China spring rainfall. Int. J. Climatol. 2009, 30, 856–865. [Google Scholar]
- Yuan, D.X. Rocky desertification in the subtropical karst of south China. Z. Geomrph. N. F. 1997, 108, 81–90. [Google Scholar]
- Wang, S.J.; Liu, Q.M.; Zhang, D.F. Karst rocky desertification in Southwestern China: Geomorphology, landuse, impact and rehabilitation. Land. Degrad. Dev. 2004, 15, 115–121. [Google Scholar]
- Xiong, K.N.; Li, P.; Zhou, Z.F. Typical Study on Karst Rocky-Desertification Using Remote Sensing and GIS–A Case Study in Guizhou Province; Geological Publishing House: Beijing, China, 2002. [Google Scholar]
- Xu, Y.Q.; Peng, J.; Shao, X.M. Assessment of soil erosion using RUSLE and GIS: a A case study of the Maotiao River watershed, Guizhou Province, China. Environ. Geol. 2009, 56, 1643–1652. [Google Scholar]
- Guo, Y.Q.; Su, W.C. Analysis of influencing factors on soil moisture content in karst areas: A case study in Guizhou province, China. Proceedings of the 2010 IEEE International Conference on Advanced Management Science, Chengdu, China, 9–11 July 2010; pp. 90–92.
- Skamarock, W.C.; Klemp, J.B.; Dudhia, J.; Gill, D.O.; Barker, D.; Duha, M.G.; Huang, X.; Wang, W. A Description of the Advanced Research WRF Version 3; NCAR/TN-475+STR NCAR TECH NOTE; National Center for Atmospheric Research: Boulder, CO, USA, 2008. [Google Scholar]
- Xue, Y.; Sellers, P.J.; Kinter, J.L.; Shukla, J. A simplified biosphere model for global climate studies. J. Clim. 1991, 4, 345–364. [Google Scholar]
- Xue, Y.; Zeng, F.J.; Mitchell, K.E.; Janjic, Z.; Rogers, E. The impact of land surface processes on simulation of the U.S. hydrological cycle: A case study of the 1993 flood using the SSiB land surface model in the NCEP Eta regional model. Mon. Weath. Rev. 2001, 129, 2833–2860. [Google Scholar]
- Sato, T.; Xue, Y. Validating a regional climate model's downscaling ability for East Asian summer monsoonal interannual variability. Clim Dyn. 2013, 41, 2411–2426. [Google Scholar]
- Sellers, P.J.; Mintz, Y.; Sud, Y.C.; Dalcher, A. A simple biosphere model (SiB) for use within general circulation model. J. Atmos Sci. 1986, 43, 505–531. [Google Scholar]
- Hansen, M.C.; Defries, R.S.; Townshend, J.R.G.; Sohlberg, R. Global land cover classification at 1 km spatial resolution using a classification tree approach. Int. J. Remote Sens. 2000, 21, 1331–1364. [Google Scholar]
- Zhou, Z.X.; Mao, Z.Z.; Yu, L.F.; Ding, G.J.; Xie, S.X.; Nie, C.J.; Chen, Z.Q. The study on degraded land and its vegetation restoration models of desertification in Guizhou. Guizhou. Sci. 2002, 20, 1–6. [Google Scholar]
- Wang, D.L.; Zhu, S.Q.; Huang, B.L. Changes of vegetation features of rocky desertification process in Karst area of Guizhou. J. Nanjing For. Univ. 2003, 27, 26–30. [Google Scholar]
- Ren, H. A review on the studies of desertification process and restoration mechanism of Karst rocky ecosystem. Trop. Geogr. 2005, 25, 195–200. [Google Scholar]
- Gao, Y.H.; Xue, Y.; Peng, W.; Kang, H.S.; Waliser, D. Assessment of dynamic downscaling of the extreme rainfall over East Asia using a regional climate model. Adv. Atmos Sci. 2011, 28, 1077–1098. [Google Scholar]
- Kanamitsu, M.; Ebisuzaki, W.; Woollen, J.; Yang, S.K.; Hnilo, J.J.; Fiorino, M.; Potter, G.L. NCEP-DOE AMIP-II Reanalysis (R-2). Bull. Am. Meteorol. Soc. 2002, 83, 1631–1643. [Google Scholar]
- Yatagai, A.; Kamiguchi, K.; Arakawa, O.; Hamada, A.; Yasutomi, N.; Kitoh, A. APHRODITE: constructing a long-term daily gridded precipitation dataset for Asia based on a dense network of rain gauges. Bull. Am. Meteorol. Soc. 2012, 93, 1401–1415. [Google Scholar]
- Onogi, K.; Tsutsui, J.; Koide, H.; Sakamoto, M.; Kobayashi, S.; Hatsushika, H.; Matsumoto, T.; Yamazaki, N.; Kamahori, H.; Takahashi, K.; et al. The JRA-25 reanalysis. J. Meteorol. Soc. Jpn. 2007, 85, 369–432. [Google Scholar]
- Xue, Y.; Shukla, J. The influence of land surface properties on Sahel climate. Part I: Desertification. J. Clim. 1993, 6, 2232–2245. [Google Scholar]
- Li, W.P.; Xue, Y. Numerical simulation of the impact of vegetation index on the interannual variation of summer precipitation in the Yellow River basin. Adv. Atmos. Sci. 2005, 22, 865–876. [Google Scholar]
- Nobre, C.A.; Sellers, P.J.; Shukla, J. Amazonian deforestation and regional climate change. J. Clim. 1991, 4, 957–988. [Google Scholar]
- Xue, Y. The impact of desertification in the Mongolian and the Inner Mogolian grassland on the regional climate. J. Clim. 1996, 9, 2173–2189. [Google Scholar]


| Cases | Microphysics | Long-wave radiation | Short-wave radiation | Factors | R | Bias | RMSE |
|---|---|---|---|---|---|---|---|
| 1 | WSM 3 | RRTM | MM5(Dudhia) | Precipitation | 0.70 | 1.68 | 4.07 |
| Temperature | 0.89 | −3.48 | 4.65 | ||||
| 2 | Kessler | RRTM | MM5(Dudhia) | Precipitation | 0.37 | −1.02 | 5.50 |
| 3 | Purdue Lin | RRTM | MM5(Dudhia) | Precipitation | 0.65 | 2.64 | 6.28 |
| 4 | WSM5 | RRTM | MM5(Dudhia) | Precipitation | 0.67 | 2.84 | 6.58 |
| 5 | Ferrier | RRTM | MM5(Dudhia) | Precipitation | 0.66 | 2.81 | 6.30 |
| 6 | WSM 3 | CAM | CAM | Precipitation | 0.65 | 1.91 | 4.33 |
| Temperature | 0.88 | −2.97 | 4.08 | ||||
| 7 | WSM 3 | RRTMG | RRTMG | Precipitation | 0.67 | 3.04 | 5.41 |
| Temperature | 0.89 | −2.24 | 3.65 |
R: Correlation coefficient; RMSE: Root Mean Square Error.
| Variables | Models | R | Bias | RMSE |
|---|---|---|---|---|
| Temperature | WRF/SSiB | 0.85 | −2.29 | 4.21 |
| NCEP R-2 | 0.86 | −1.93 | 3.62 | |
| Precipitation | WRF/SSiB | 0.78 | 1.57 | 3.16 |
| NCEP R-2 | 0.60 | 1.95 | 4.22 | |
| U200 | WRF/SSiB | 0.92 | −0.01 | 0.97 |
| NCEP R-2 | 0.99 | 0.04 | 0.31 | |
| H500 | WRF/SSiB | 0.86 | 0.76 | 5.81 |
| NCEP R-2 | 0.97 | 0.48 | 2.69 | |
| VQ700 | WRF/SSiB | 0.70 | −1.37 | 7.49 |
| NCEP R-2 | 0.65 | 2.89 | 11.38 |
U200: Zonal wind with zonal mean removed at 200 hpa (m/s); H500: Geopotential height with zonal mean removed at 500 hpa (gpm); VQ700: Water vapor flux at 700 hpa (g kg−1 m s−1); R: Correlation coefficient; RMSE: Root Mean Square Error.
| Parameters | Degradation | Control | Degradation-Control |
|---|---|---|---|
| Albedo | 0.224 | 0.175 | 0.049 |
| Rn | 124.265 | 137.186 | −12.921 |
| Rs | 202.471 | 210.216 | −7.745 |
| Rl | −78.206 | −73.030 | −5.176 |
| LH | 97.508 | 116.251 | −18.743 |
| LHI | 12.643 | 19.818 | −7.175 |
| LHT | 36.997 | 59.196 | −22.199 |
| LHG | 47.868 | 37.236 | 10.632 |
| SH | 27.281 | 21.468 | 5.813 |
| SHC | 11.398 | 13.922 | −2.524 |
| SHG | 15.883 | 7.546 | 8.337 |
| GHF | −0.524 | −0.534 | 0.010 |
Rn: Net Radiation; Rl: Net Longwave Radiation; Rs: Net Shortwave Radiation; LH: Latent Heat Flux; SH: Sensible Heat Flux; LHI: Latent Heat Flux from Interception; LHT: Latent Heat Flux from Transpiration; LHG: Latent Heat Flux from Ground Soil; SHC: Sensible Heat Flux from Canopy; SHG: Sensible Heat Flux from Ground; GHF: Ground Heat Flux; Unit: W m−2.
| Parameters | Degradation | Control | Degradation-Control |
|---|---|---|---|
| PPT | 5.992 | 6.626 | −0.634 |
| TEM | 22.690 | 21.962 | 0.728 |
| SMOIS | 0.670 | 0.930 | −0.260 |
| TEM_AVE | −6.257 | −6.221 | −0.036 |
| VW_AVE | 0.364 | 0.395 | −0.031 |
| HD_AVE | −0.395 | −0.439 | 0.044 |
| VIMFC | 0.433 | 0.463 | −0.030 |
PPT: Daily Precipitation (mm/day); TEM: Surface Temperature (°C); SMOIS: Total Soil Moisture Contents (m); TEM_AVE: Average Atmospheric Temperature from 850 hpa to 200 hpa (°C); VW_AVE: Average Vertical Wind from 850 hpa to 200 hpa (10−4 m s−1); HD_AVE: Average Horizontal Divergence from 850 hpa to 200 hpa (10−6 s−1); VIMFC: Vertically Integrated Moisture Flux Convergence from 1000 hpa to 200 hpa (mm/day).
© 2014 by the authors; licensee MDPI, Basel, Switzerland This article is an open access article distributed under the terms and conditions of the Creative Commons Attribution license ( http://creativecommons.org/licenses/by/3.0/).
Share and Cite
Gao, J.; Wu, S. Simulated Effects of Land Cover Conversion on the Surface Energy Budget in the Southwest of China. Energies 2014, 7, 1251-1264. https://doi.org/10.3390/en7031251
Gao J, Wu S. Simulated Effects of Land Cover Conversion on the Surface Energy Budget in the Southwest of China. Energies. 2014; 7(3):1251-1264. https://doi.org/10.3390/en7031251
Chicago/Turabian StyleGao, Jiangbo, and Shaohong Wu. 2014. "Simulated Effects of Land Cover Conversion on the Surface Energy Budget in the Southwest of China" Energies 7, no. 3: 1251-1264. https://doi.org/10.3390/en7031251
APA StyleGao, J., & Wu, S. (2014). Simulated Effects of Land Cover Conversion on the Surface Energy Budget in the Southwest of China. Energies, 7(3), 1251-1264. https://doi.org/10.3390/en7031251