1. Introduction
Islanding refers to the continued operation of a photovoltaic power generation system when the utility grid supplying power malfunctions and the photovoltaic power generation system does not detect the malfunction or promptly disconnect. Therefore, protection devices for detecting and terminating islanding operations must be adopted to avoid damaging the power generation system and harming users [
1]. Because of the increasing number of distributed power supply systems, systems that use renewable power sources (e.g., photovoltaic power generation systems, wind power generation systems, and fuel cell generation systems) are connected to the power network in parallel. A malfunctioning utility grid can lead to interactions between the various distributed power systems and extend the duration of islanding operations, increasing the likelihood of damage. Thus, protection devices must be capable of detecting and terminating islanding phenomena as promptly as possible.
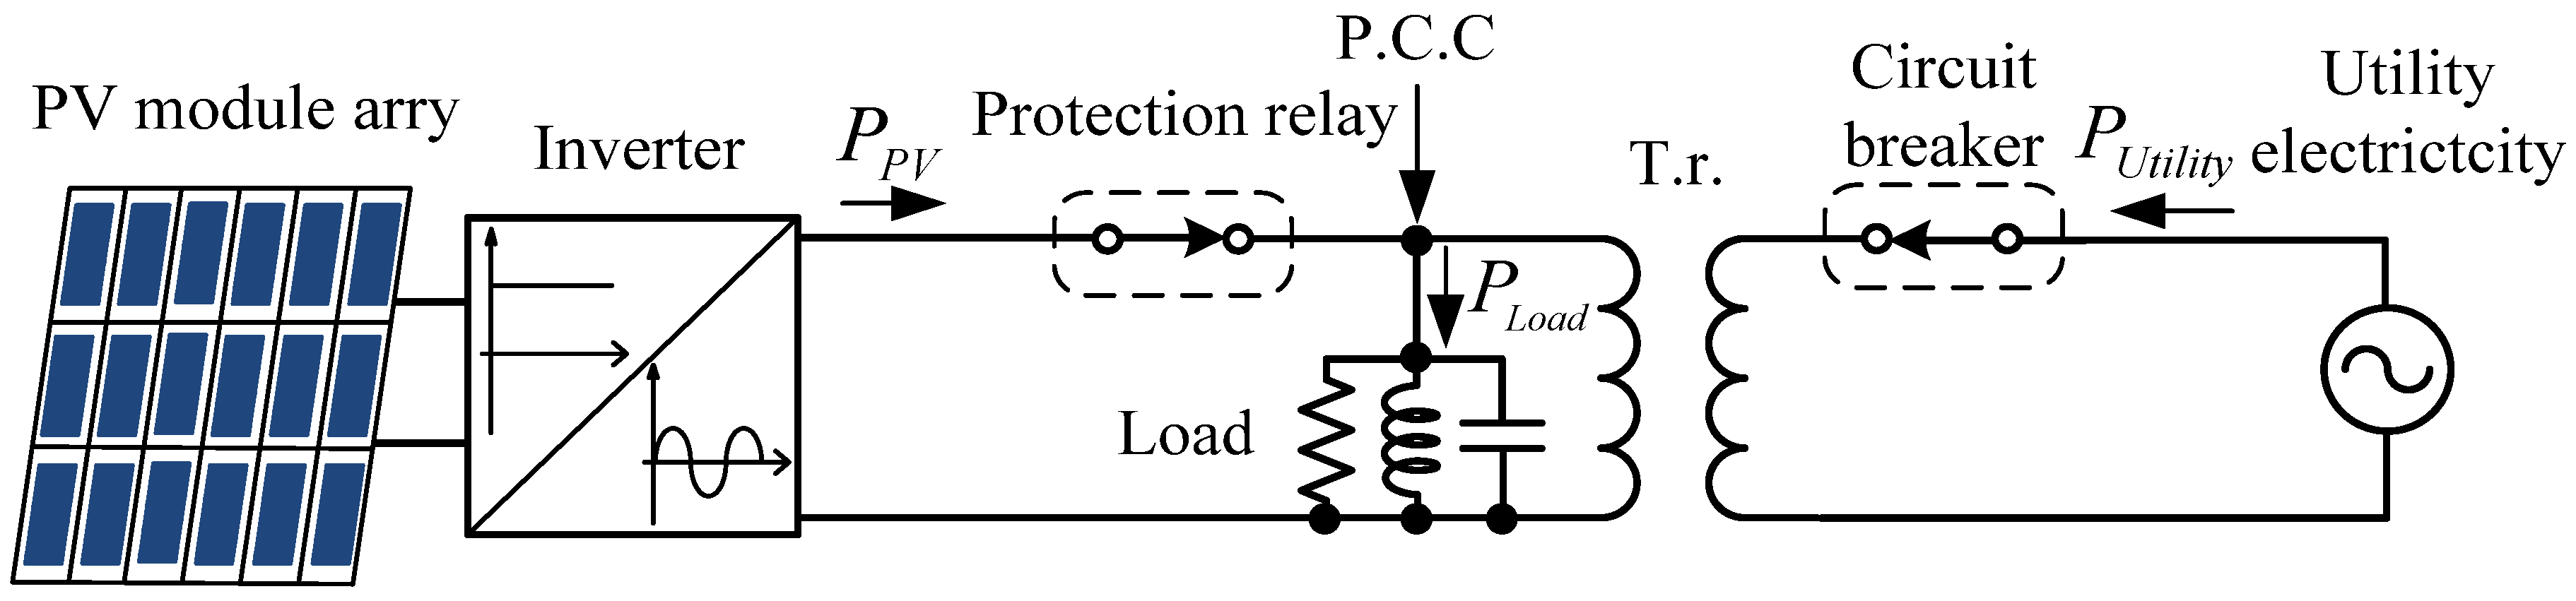
Figure 1 shows a diagram of the parallel connection between a photovoltaic power generation system and a utility grid. During normal operations, the real power and reactive power required by the loads are supplied by the photovoltaic power generation system and utility grid. Consequently, the power at the point of common coupling (P.C.C) is balanced [
2]. When the utility grid is disconnected and islanding phenomena is observed, the power at the point of common coupling is unbalanced because the utility grid has ceased to supply power. Thus, the voltage and frequency at the point of common coupling becomes abnormal. Under these circumstances, the photovoltaic power generation system can be disconnected from the loads using four types of protection relays, including over voltage, under voltage, over frequency, and under frequency [
3]. However, when the output power of the photovoltaic power generation system nearly equals the power consumption of the loads, the power at the point of common coupling remains balanced. The frequency and voltage patterns output by the photovoltaic power generation system are similar to of a normally functioning utility grid, preventing the protection relays from function correctly. Therefore, additional islanding detection methods are required for terminating islanding operations under these circumstances.
Figure 1.
Photovoltaic and utility grids connected in parallel.
Figure 1.
Photovoltaic and utility grids connected in parallel.
Conventional islanding detection methods can be divided into passive and active detection methods [
4,
5,
6,
7,
8,
9,
10]. Passive detection methods primarily monitor the voltages, frequencies, and phases at the load-end to identify the occurrence of islanding operations, and include the phase jump detection method [
5], voltage harmonic detection method [
6], power changing rate detection method [
7], and passive grid impedance measurement method [
8]. However, when the difference between the power output of the photovoltaic power generation system and the total power consumption is limited, variations in the system voltage or frequency are not sufficiently apparent for relay detection. Therefore, the disadvantage of passive detection methods is that they possess a non-detection zone, which hinders the immediate and effective detection of islanding phenomena during utility grid outages [
8].
Active detection methods involve inputting an interference signal into the utility grid and observing whether the system voltage or frequency is affected. Under normal conditions, interference should not influence the stability of the utility grid. However, when islanding operations occur, the utility grid is unavailable as a reference. Therefore, regardless of whether the total system output power and the total load power consumption are balanced, actively initiated interference upsets the balance and generates significant voltage and frequency variations to detect islanding operations. Active detection methods include the active frequency drift, slip mode frequency shift, active voltage drift, load variation methods [
9], and active grid impedance measurement method [
8]. Nonetheless, a number of external factors may generate interference in the power system. In this situation, interference from an active detection method can cause islanding detection errors. Recently, there are many AI methods based on artificial neural network (ANN) techniques are proposed for the islanding detection of photovoltaic power generation systems [
11,
12]. Using an artificial neural network-based algorithm can recognize existent patterns on the system output waveform and then can make it possible to obtain an accurate response about islanding operations. However, the ANN training process is very complex, because it involves essential issues such as the definition of the ANN architecture, the size of training data memory, sampling time and selection of representative training set for the studied problem. Therefore, this study uses a cerebellar model articulation controller (CMAC) neural network for islanding detection. This method not only reduces the training time, but also features detection tolerance. Therefore, this network not only promptly disconnects the photovoltaic power generation system from loads when the utility grid is not in a parallel connection, but determines whether the malfunctioning signal from the utility grid end is caused by an interference of power quality or an islanding operation.
2. CMAC Neural Network
The CMAC neural network proposed by Ablus [
13] in the 1970s follows the neural structure of the human cerebellum and possesses the characteristics of rapid learning and quick responses. In a CMAC neural network, associated memory is activated by the input signals triggering similar memory cells. A weighting value is saved in the memory address. When a signal is input, a memory set is activated after the memory addresses are quantified, coded, and combined. An output that corresponds to the input signal is produced after the weighting values in the activated memory addresses are summed. If the input signal contains noise, the original signal activation may be only partial. Thus, some characteristics of the original input signal remain after summing the weighting values of the activated memory. By establishing a threshold value, the input signal can be correctly determined if the degree of distortion is limited. Furthermore, the difference between distorted and ideal output signals can be used to adjust the weighting values of the activated memory addresses, generating a more realistic output from the re-inputted distorted signals.
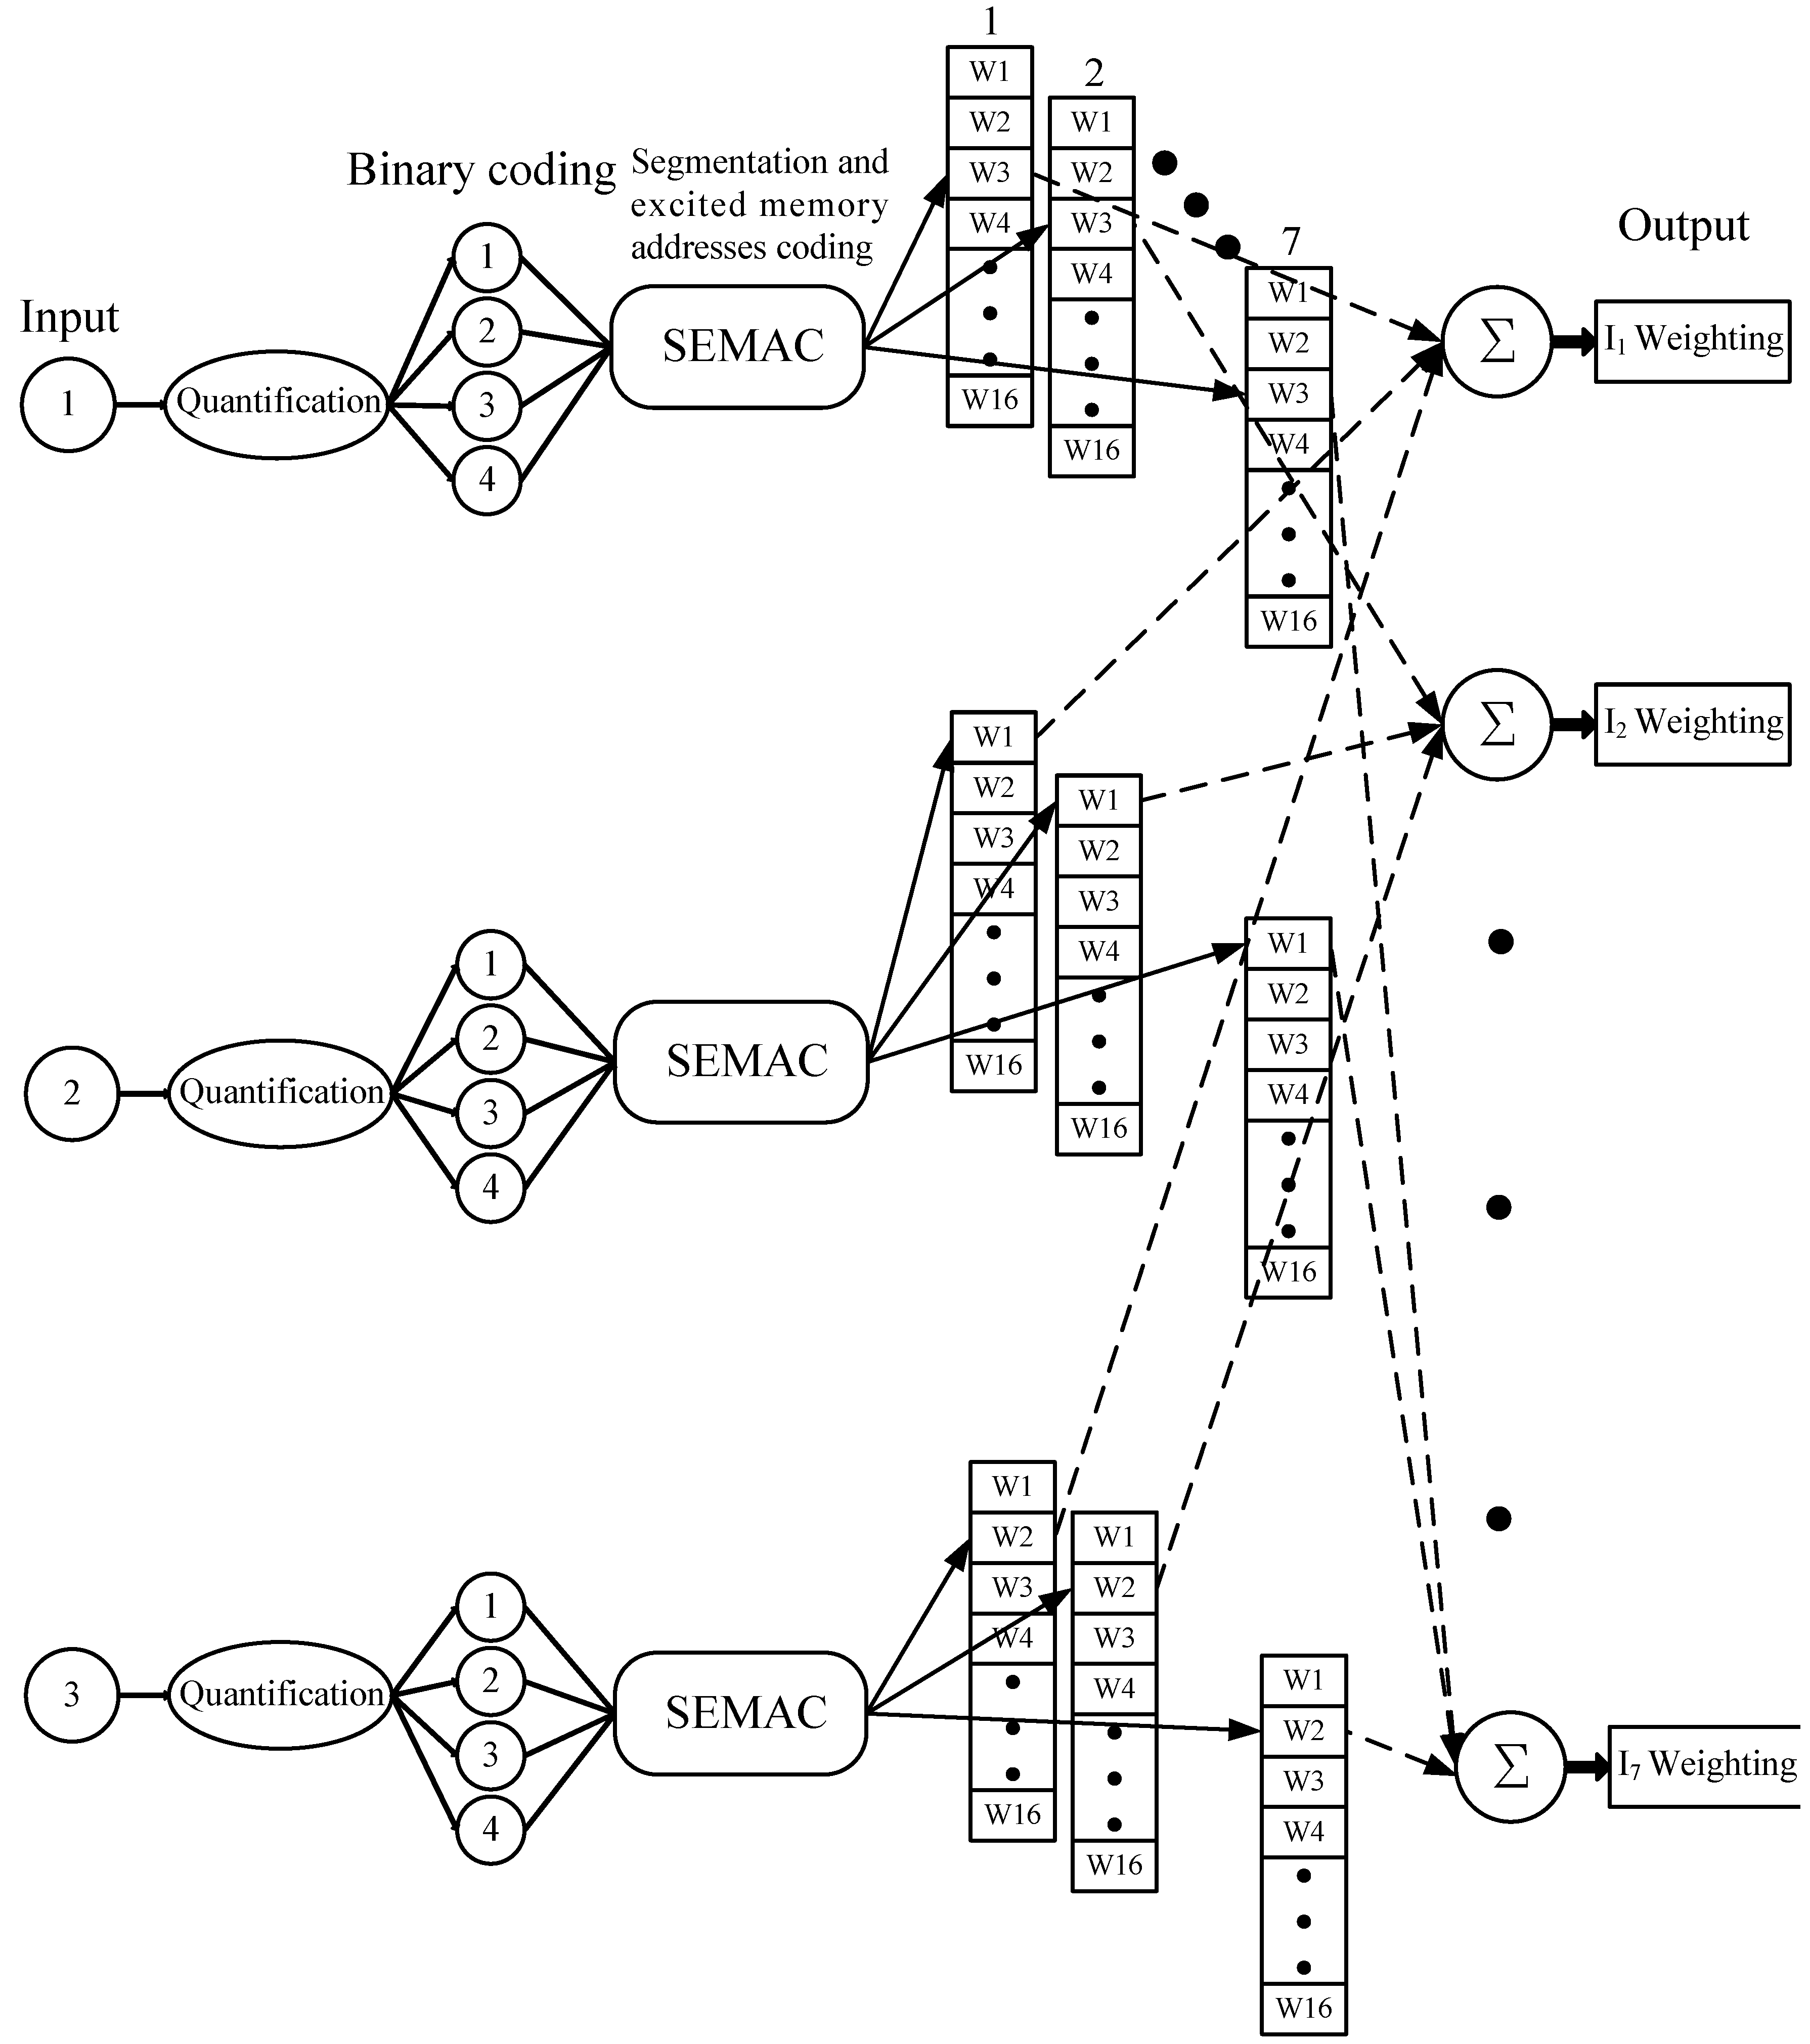
Figure 2 is a schematic diagram of the CMAC neural network architecture, where the input signals are quantified and coded and the activated address codes are classified. Next, the activated addresses are summed to obtain an output value for categorizing the islanding operation. Various training samples are used to activate and train the corresponding memory. For example, the training samples of
i (
i = 1–7) only activate and train the
ith layer, which reduces the total training time [
14].
Figure 2.
Schematic of the CMAC neural network architecture.
Figure 2.
Schematic of the CMAC neural network architecture.
2.1. Quantification
The input signal values were divided equally into a specific number of quantification levels between the maximum and minimum input signals. Fine-grain quantification levels provide comparatively more fine-grain quantification coding, but require greater memory. In this study, the interval between the maximum and minimum values was divided into levels ranging between 0 and 15. A quantification value of 15 was assigned when the value was greater than the maximum value, and a quantification value of 0 was assigned when the value was smaller than the minimum value. If the value was between the maximum and minimum values, quantification of the value was based on the corresponding quantification level.
2.2. Coding the Activated Address and Computing the CMAC Neural Network Output
The input signal values were converted into binary codes according to their corresponding quantification levels. After coding, the codes were combined and classified, and the memory addresses were activated. For example, the input signals in this study included the voltages, frequencies, and phases, with the quantified levels of (5, 3, 9). Binary conversion provided codes (0101b, 0011b, 1001b), which were then combined into a 12-bit code (010100111001b). Because four bits comprise a group, the 12-bit code can be divided into three groups. The three codes for the activated addresses, listed in sequence from the least significant bit (LSB) to the most significant bit (MSB), where
= 1001b = 9;
= 0011b = 3; and
= 0101b = 5. If the initial weighting value of all memories is 0, the sum of
,
, and
is 0. Therefore, the output of the CMAC neural network is expressed as Equation (1):
In Equation (1), y represents the output value; represents the number of the activated memory addresses; represents the weighting values of the activated memories; and represents the memory addresses.
2.3. Adjustment of the Memory Weighting Values
In this study, the target output of the CMAC neural network was set as 1. The supervised learning method was used because the goal of the output was specific. The steepest descent method [
15] was also employed to adjust the weighting values, as shown in Equation (2):
where
represents the new weighting values after adjusting the activated memories;
represents the original weighting values before adjusting the activated memories;
represents the learning gain (
); and
is the target value.
2.4. Detection Tolerance
The islanding detection method proposed in this study has excellent interference immunity. Using the 12-bit code of the input signal described in
Section 2.2 as an example, if the original code (010100111001b) is changed to (010101011001b), the activated address (
,
,
) becomes (9, 5, 5) from (9, 3, 5), where only
is erroneous, and
and
can be normally outputted. Therefore, the detection method possesses tolerance. If the number of groups increases, the code can be saved separately in additional positions. This reduces the influence of incorrect adjacent bit detections, improving the overall accuracy.
2.5. Evaluation of Training
During the CMAC neural network training process, an evaluation value can be used to determine whether training can be terminated. The evaluation value is calculated using Equation (3):
where
F represents the evaluation value. When
F is smaller than the predetermined error value, the training process is complete.
2.6. Training a CMAC Neural Network
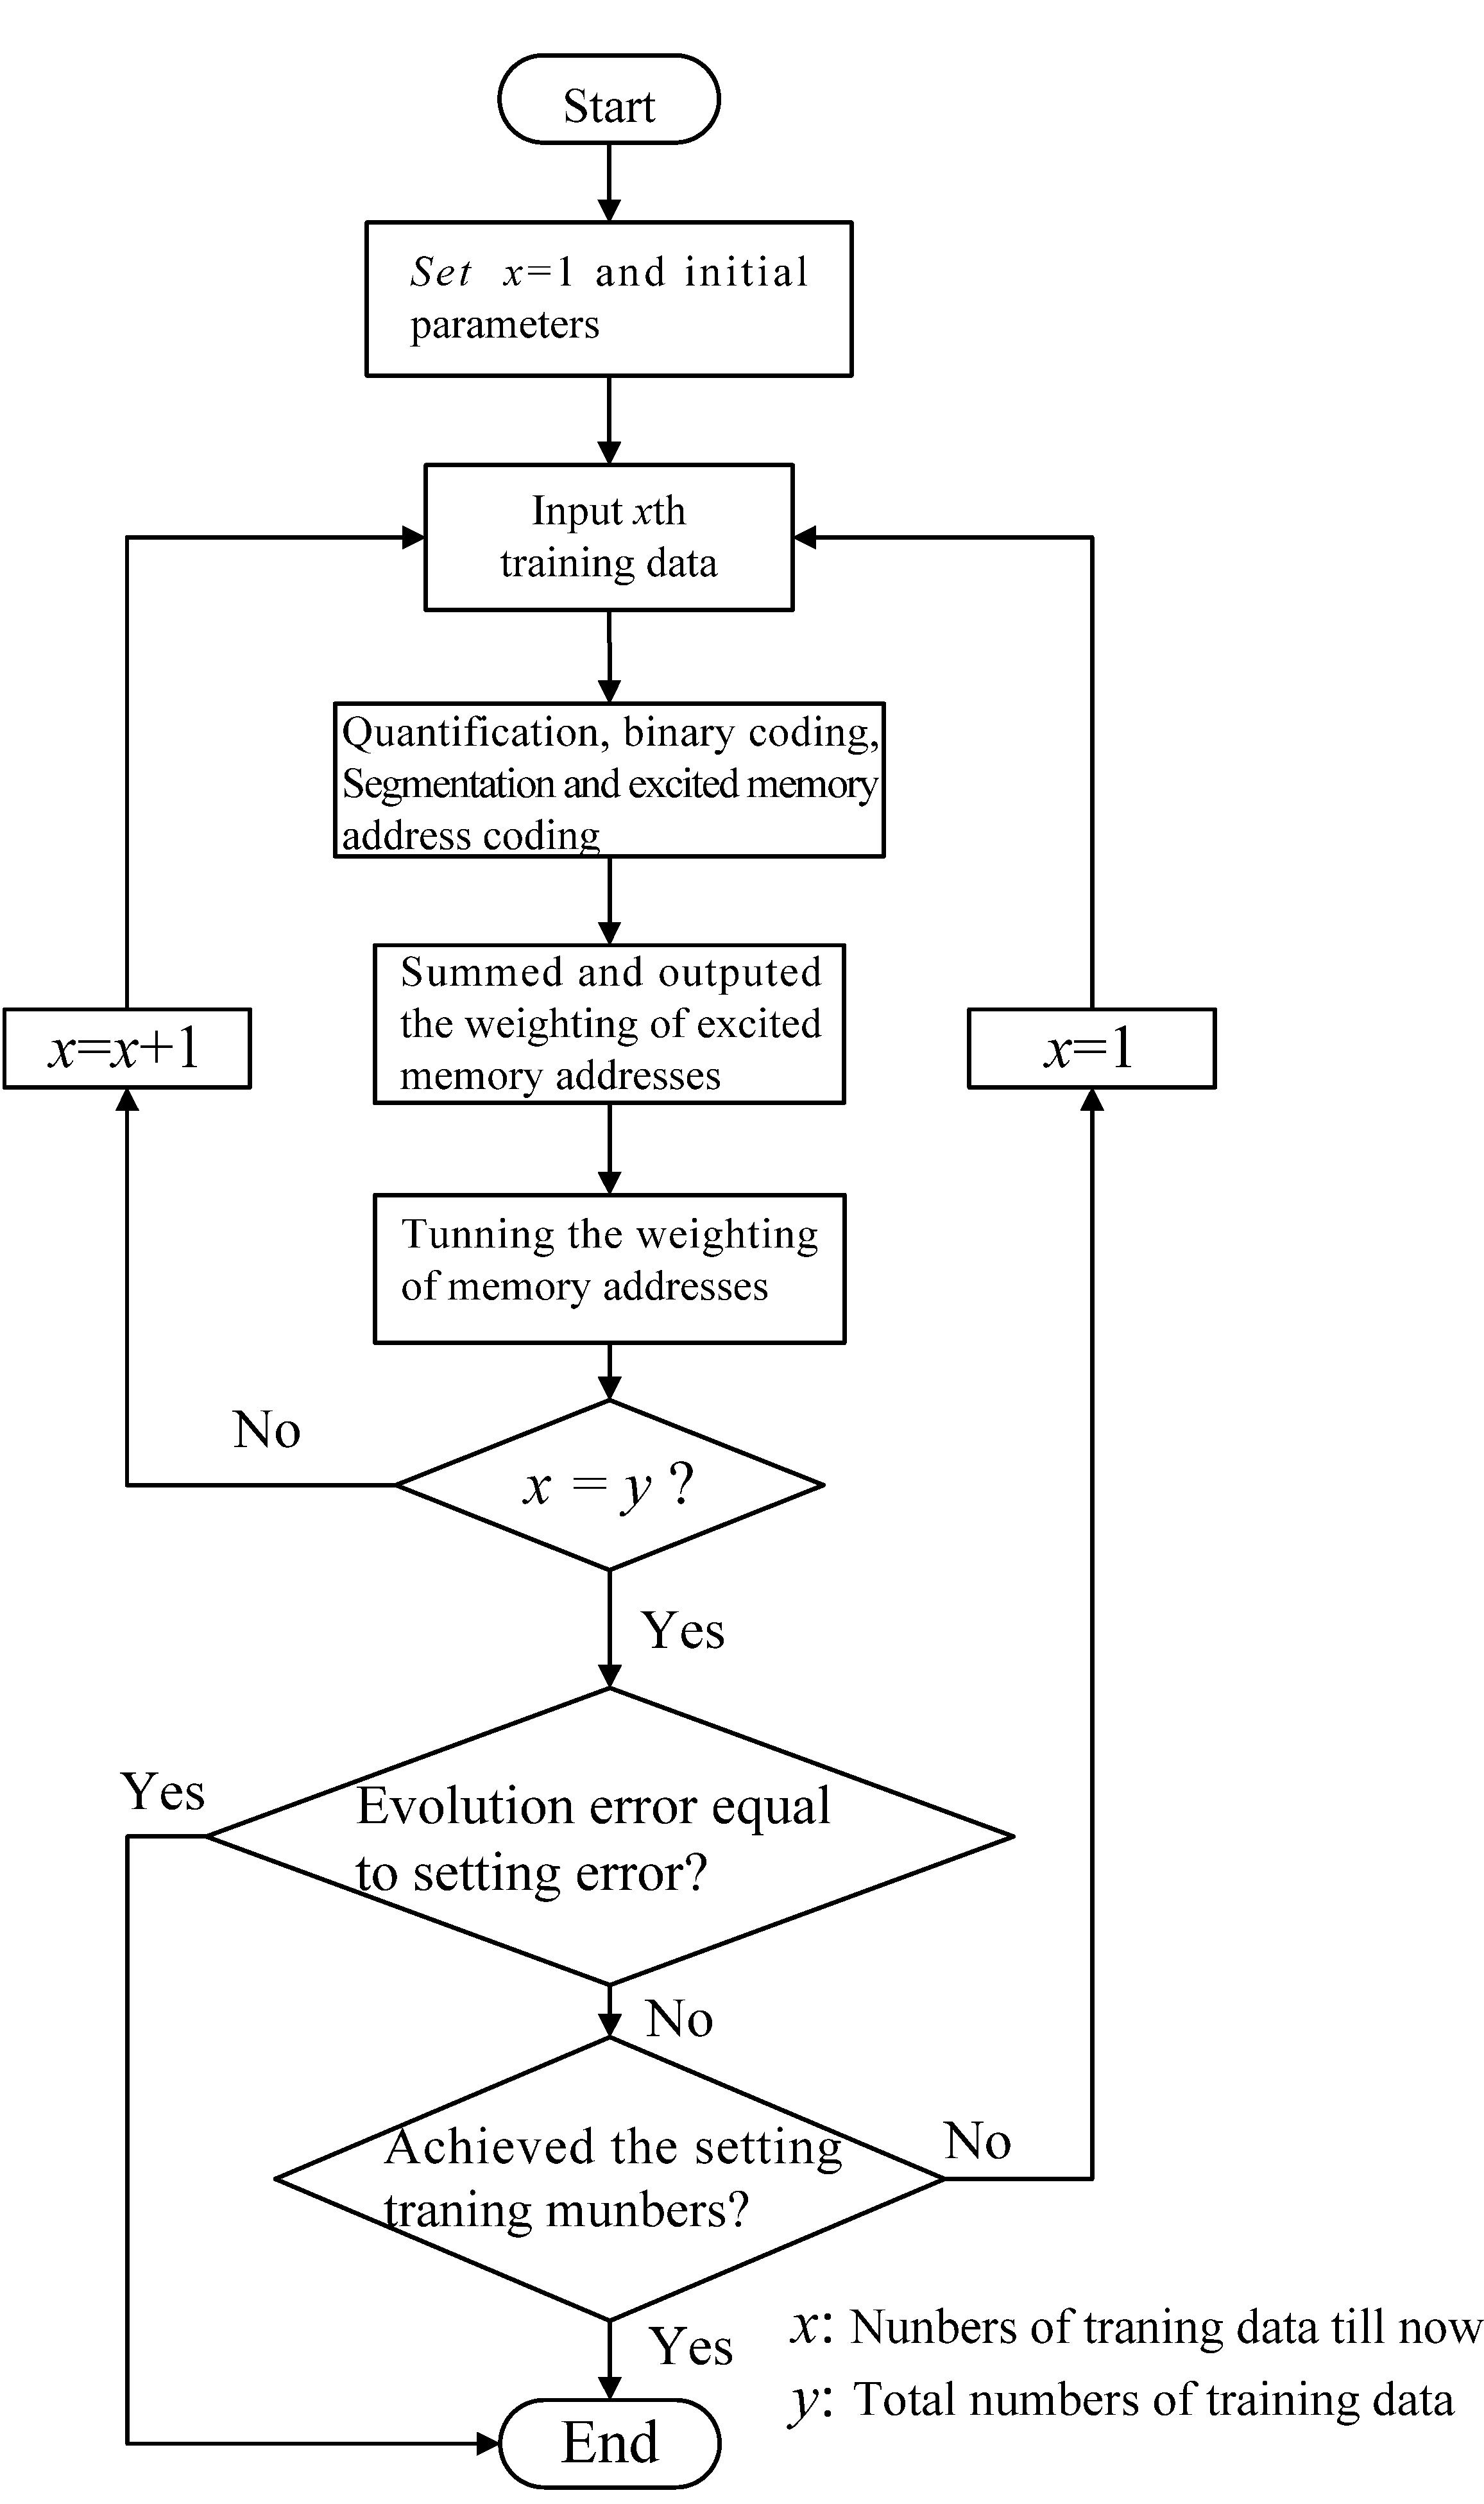
Figure 3 shows the training process of a CMAC neural network. The training samples are input for quantification, code combination, code classification, and to activate the corresponding memory addresses. Subsequently, the weighting values in the activated addresses are summed and adjusted according to Equation (2). When all the training samples have been applied, an assessment of whether the evaluation value has reached the predetermined error value is conducted. If the evaluation value is found to have reached the predetermined value, the training process can be terminated. Otherwise, whether the required number of training sessions has been conducted is assessed; if the required number was reached, the training process is terminated.
3. Islanding Detection Using a CMAC Neural Network
The islanding detection method proposed in this study uses the voltage, frequencies, phase differences, and current at the point of common coupling in the grid connection between the photovoltaic power generation system and utility grid as characteristics of an islanding operation. A description of these characteristics is provided below:
- (1)
Voltage: Peak value of the maximum voltage at the point of common coupling;
- (2)
Voltage frequency: Frequency of the voltage at the point of common coupling;
- (3)
Phase difference: Difference in phase between the voltage and current at the point of common coupling.
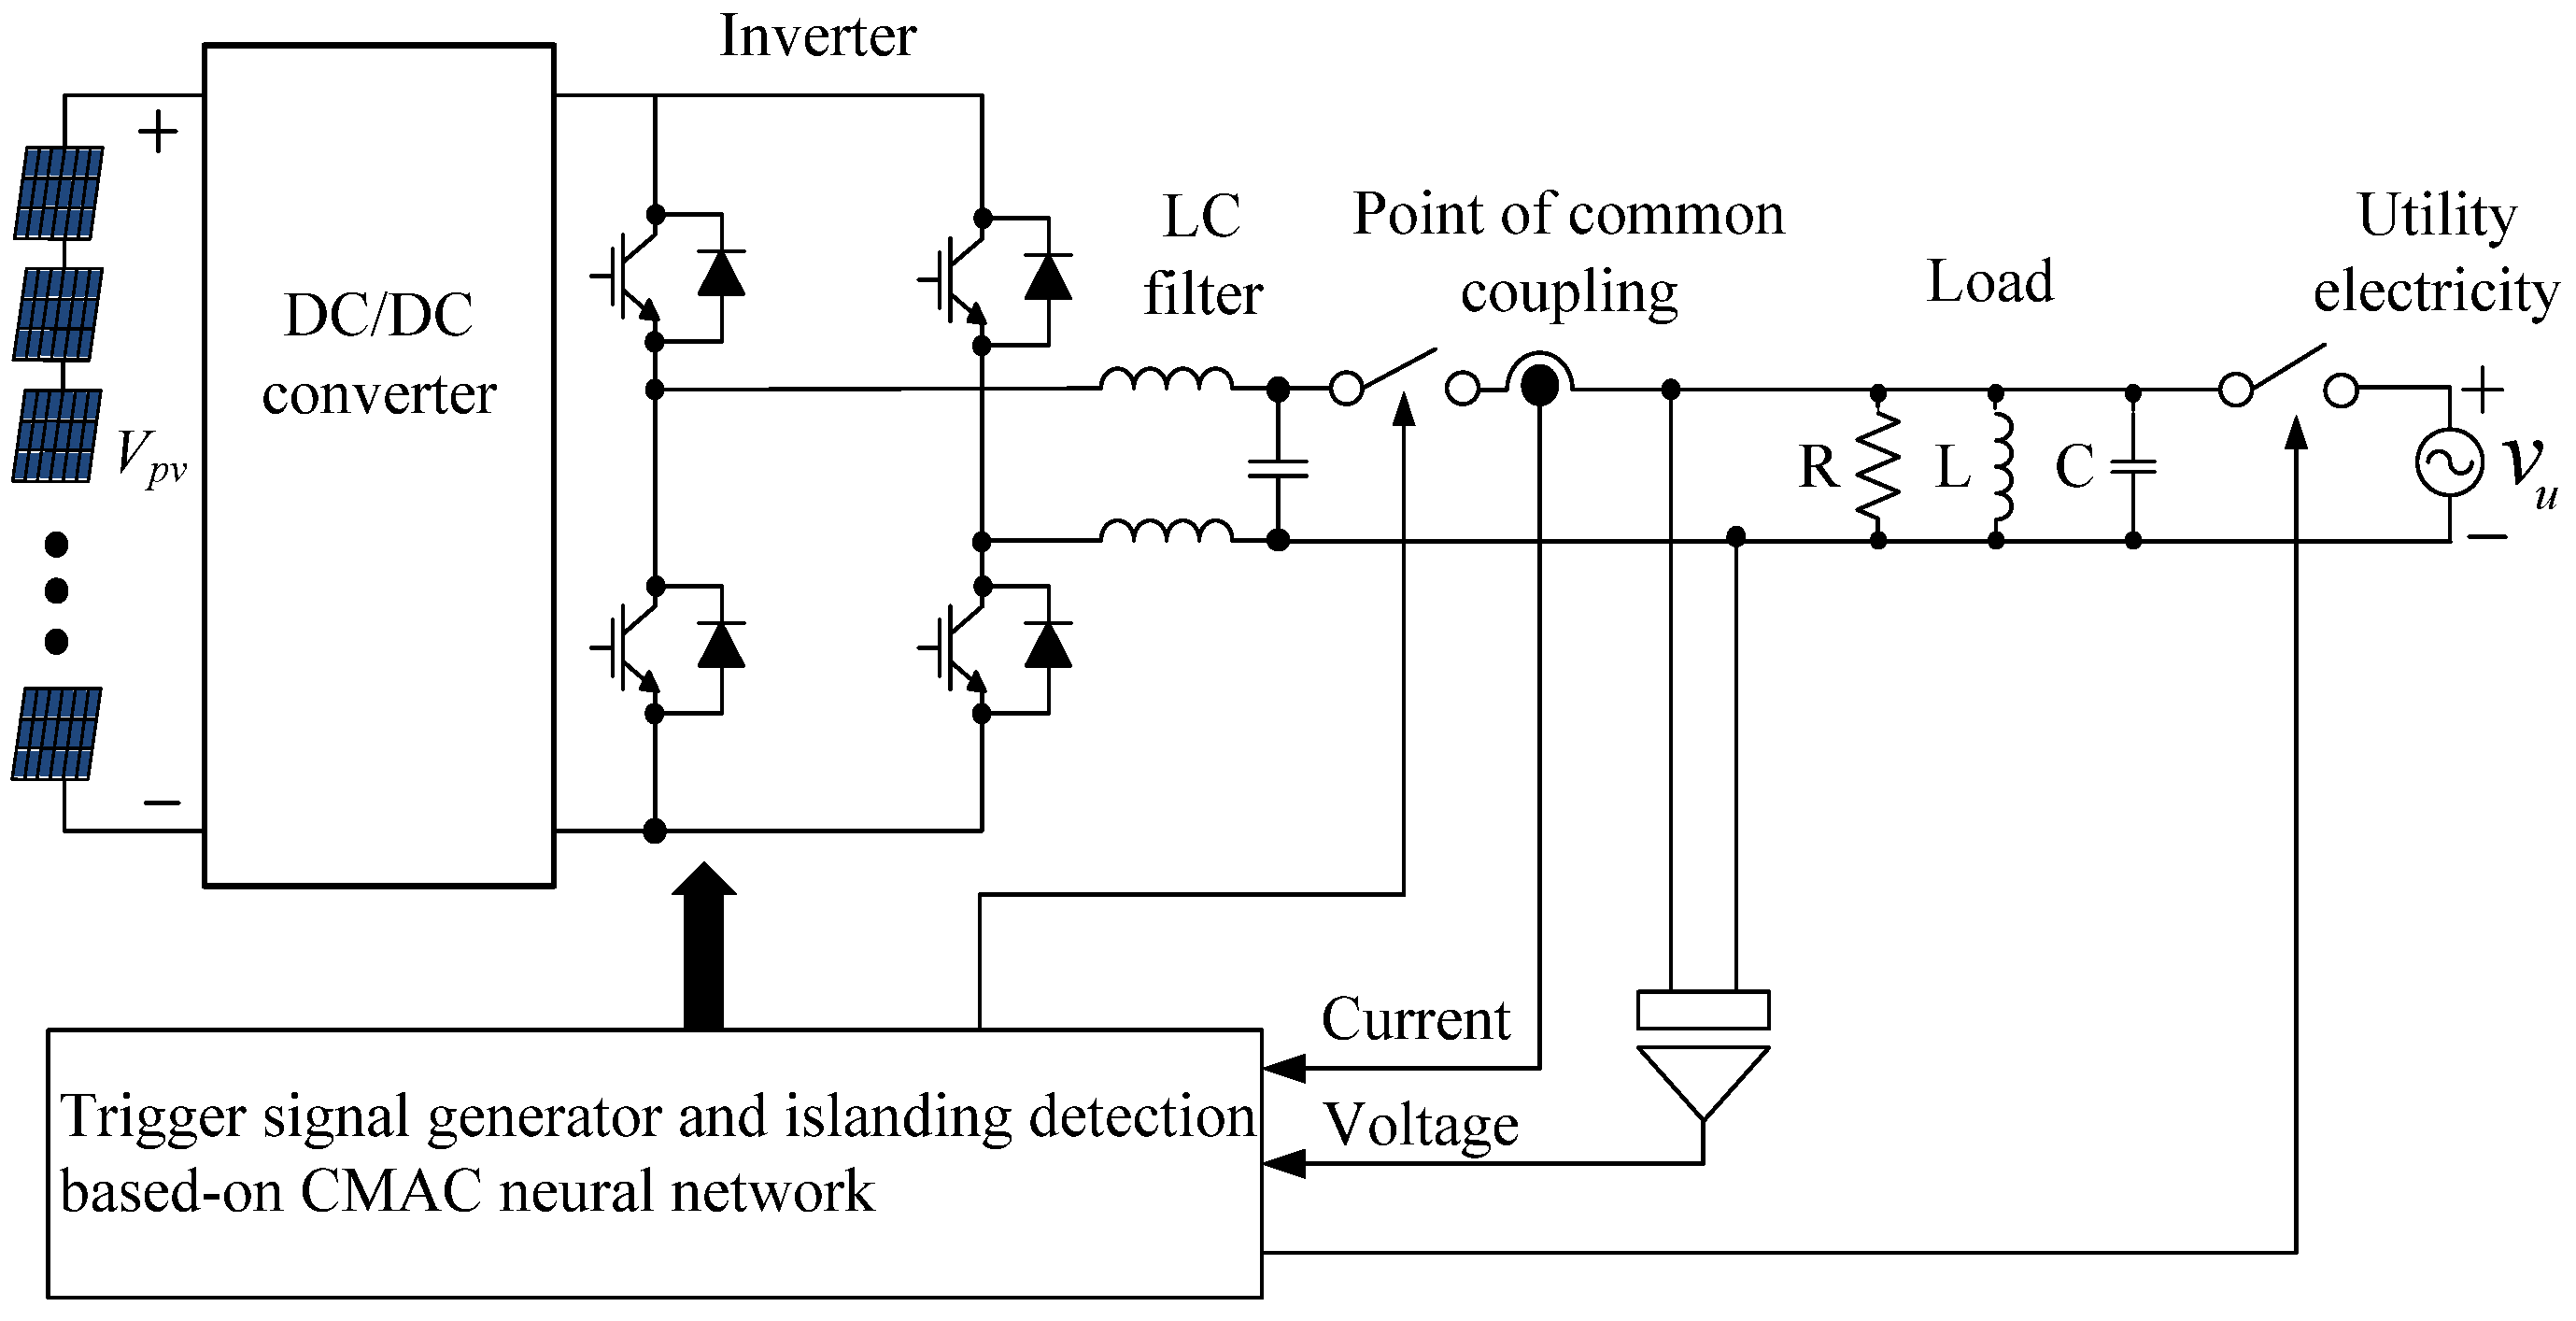
Figure 4 shows the architecture of the proposed islanding detection system, which includes a photovoltaic module array, DC/DC convertor, inverter, LC filter, islanding detection controller, utility grid, and loads. In
Figure 4,
Vpv represents the output voltage of the photovoltaic module array.
Nevertheless, both natural and manmade factors cause variations in the voltage and power harmonics, such as swells, dips, and flickers, which lead to islanding detection system malfunctions. Therefore, this study employs a CMAC neural network to detect islanding under various power qualities and to distinguish between power quality interferences and islanding operations in the photovoltaic power generation system.
The factors that influence power quality are listed below [
16]:
- (1)
Voltage swell: According to IEEE Std. 1159–1995 [
16], voltage swell indicates that the effective value of the utility grid ranges between 1.1 p.u and 1.8 p.u. for longer than a 0.5 cycle;
- (2)
Voltage dip: According to IEEE Std. 1159–1995 [
16], voltage dip indicates that the effective value of the utility grid ranges between 0.1 p.u and 0.9 p.u. for a duration of a 0.5 cycle to 1 min;
- (3)
Power harmonics: Power harmonics indicate that the utility grid system has been found to possess a third, fifth, or seventh harmonic component, and these harmonic components are defined as 10%, 7%, and 5% of the base frequency, respectively;
- (4)
Voltage flicker: In this study, voltage flickers were simulated by synthesizing a low-frequency voltage source (15 Hz and 20 Hz) with the standard voltage of 60 Hz, as expressed in Equation (4):
where 220, 10.33, and 7.22 respectively represent the effective value of voltages with a frequency of 60, 20, and 15 Hz.
Figure 3.
Flowchart of the islanding detection training process for CMAC neural networks.
Figure 3.
Flowchart of the islanding detection training process for CMAC neural networks.
Figure 4.
Architecture of the proposed islanding detection system.
Figure 4.
Architecture of the proposed islanding detection system.
The input signals of the proposed islanding detection mechanism based on a CMAC neural network were the voltages, frequencies, and phase differences between the voltage and current. The voltage and frequency detection requirements are defined in the international standards for islanding operations.
Table 1 lists the standards specified in IEEE Std. 1547 [
17] and specifications of the proposed method for islanding voltage detection, and
Table 2 shows the standards specified in IEEE Std. 1547 and specifications of the proposed method for islanding frequency detection. As indicated in the
Table 2, the normal operation frequency range is between 59.3 Hz and 60.5 Hz. The standards shown in
Table 1 and
Table 2 were used in this study to determine the trip time during islanding detection, which was defined as the period where the voltage and frequency were abnormal.
Table 1.
The IEEE Std. 1547 and specifications of the proposed method for islanding voltage detection.
Table 1.
The IEEE Std. 1547 and specifications of the proposed method for islanding voltage detection.
| Voltage (%) | Maximum trip time (s) |
|---|
| IEEE Std. 1547 | The proposed method |
|---|
| V < 50 | 0.16 | 0.001875 |
| 50 ≤ V < 88 | 2 | N/A |
| 88 < V < 110 | Normal range | Normal range |
| 110 < V < 120 | 1 | N/A |
| V ≥ 120 | 0.16 | 0.005608 |
Table 2.
The IEEE Std. 1547 and specifications of the proposed method for islanding frequency detection.
Table 2.
The IEEE Std. 1547 and specifications of the proposed method for islanding frequency detection.
| Frequency (Hz) | Maximum trip time (s) |
|---|
| IEEE Std. 1547 | The proposed method |
|---|
| f < 59.3 | 0.16 | 0.00133 |
| 59.3 < f < 60.5 | Normal range | Normal range |
| 60.5 < f | 0.16 | 0.00138 |
Because of the various load characteristics, the current may precede or lag behind the voltage at the point of common coupling. This phenomenon is known as phase difference. The ideal phase difference size is not specified in the IEEE Std. 1547 islanding detection standards. However, the Taiwan Power Company’s technical guidelines for renewable power generation systems connected in parallel state that the power generated by renewable power-generating equipment at the point of common coupling should be maintained at between 85% of the phase lag and 95% of the phase advance. The phase difference between the voltage and current should range between −31.78° and 18.19°; otherwise, the operation can be considered an islanding operation.
In this study, the operations exhibited seven states, namely, voltage swell, voltage dip, power harmonics injection, normal operations, islanding operation over the range of normal operations, islanding operation below the range of normal operations, and voltage flicker. In addition, the 360 data entries for the seven states were divided into 235 entries of training data and 125 entries of testing data. The 235 pieces of training data were used to train the CMAC neural network, as explained in
Section 2.6. Following computation, the weighing values of the islanding operation detection network were obtained. The parameters used for training the CMAC neural network are listed below:
- (1)
Number of quantification levels: 16;
- (2)
Number of bits per group: 4;
- (3)
Number of groups: 3;
- (4)
Learning constant ( β ):1;
- (5)
Number of training session: 10.
After training the CMAC neural network, the system proceeds detects the state of islanding operations. The steps of the detection process are as follows:
- Step 1:
Read the weighting values of the CMAC neural network after completing training;
- Step 2:
Read the test sample data;
- Step 3:
Quantify the data, combine and classify the
codes, and then activate the address codes;
- Step 4:
Sum the weighting values of the activated
addresses and output the resulting value;
- Step 5:
Determine the output weighting value. The closer the value is to 1, the more likely the operation is the corresponding state of the islanding operation;
- Step 6:
Output the results of islanding detection.
4. Simulation Results
To identify an islanding operation or system power quality issue, the voltage swell, voltage dip, power harmonics, and voltage flicker were adopted as variables for islanding detection. This study also employed the states shown in
Table 3 for detecting islanding operations.
Table 4 shows 14 test data entries of various islanding operation states. The test data were output by the CMAC neural network and categorized into the states listed in
Table 3. As shown in
Table 5, the states of the 14 test data entries were correctly determined. Considering the eighth entry in
Table 4 for example,
Table 4 indicates that this entry was in the I
1 islanding operation state. Meanwhile, the results in
Table 5 show that regarding the output of the eighth entry, the output in the I
1 state possessed the highest weighting value (0.7618). Therefore, the data was determined to be in the I
1 state. To demonstrate that the framework is immune to interference, variances of ±5% in voltage peak value, ±0.5% in frequency, and ±10% in phase difference were separately added to the test samples, as shown in
Table 6. The detection results in
Table 7 show that the states could be detected after the variances were added. Therefore, the state of an islanding operation can be correctly determined regardless of whether variance is included.
To demonstrate the superiority of the proposed CMAC neural network in photovoltaic system islanding detection,
Table 8 shows the islanding detection results with difference neural networks. It indicates that the proposed method has a short learning time and more learning accuracy and recognized accuracy than the multilayer perceptions (MLP) method with different perceptions.
Table 3.
States for detecting islanding operation.
Table 3.
States for detecting islanding operation.
| State | Description | Test range of voltage (V) | Test range of voltage frequency (Hz) | Test range of phase difference (Degree) |
|---|
| I1 | Voltage swell | 277.938–572.271 | 59.1848–60.4438 | −31.6–19.4 |
| I2 | Voltage dip | 157.355–280.805 | 59.2636–60.8026 | −30.3249–17.6751 |
| I3 | Voltage containing power harmonics | 273.315–342.098 | 59.7185–60.3985 | −170.29732–179.7027 |
| I4 | Normal operation | 279.646–342.677 | 59.302–60.57 | −34.8554–17.8086 |
| I5 | Islanding operation over the range of normal operations | 347.506–3554.61 | 60.671–1018.64 | 20–180.688 |
| I6 | Islanding operation below the range of normal operations | 0.334–278.949 | 0.4–59.34 | −180.555–−32 |
| I7 | Voltage flicker | 270.19–345 | 57.3–64.69 | −174.12–178.5 |
Table 4.
Test data for detecting islanding.
Table 4.
Test data for detecting islanding.
| Test No. | Voltage peak (V) | Frequency (Hz) | Phase difference (Deg.) | State of islanding operation |
|---|
| 1 | 528.698 | 59.9808 | −20.7360 | I1 |
| 2 | 161.074 | 59.9760 | 5.5000 | I2 |
| 3 | 273.324 | 59.7700 | −92.6530 | I3 |
| 4 | 311.106 | 59.9808 | −19.5264 | I4 |
| 5 | 615.778 | 59.9800 | −19.0656 | I5 |
| 6 | 3.428 | 60.0096 | −45.0144 | I6 |
| 7 | 321.108 | 58.8780 | 3.4270 | I7 |
| 8 | 341.559 | 58.997 | −21.3333 | I1 |
| 9 | 190.405 | 59.3000 | −17.0000 | I2 |
| 10 | 278.975 | 59.8174 | −78.8108 | I3 |
| 11 | 305.856 | 60.0096 | −0.0288 | I4 |
| 12 | 603.338 | 60.0096 | −19.9584 | I5 |
| 13 | 2.756 | 60.0096 | −27.3024 | I6 |
| 14 | 304.875 | 59.8382 | −0.0454 | I7 |
To further demonstrate that the proposed islanding detection method can correctly determine the states of islanding operations and disconnect photovoltaic power generation systems from loads within a predetermined time, this study adopted simulation software PSIM [
18] to simulate the islanding detection of a Kyocera KC40T photovoltaic power generation system [
19]. This system has a rated voltage of 208 V (in a serial connection of 12 modules), rated output current of 2.48 A, and rated output power of 516 W.
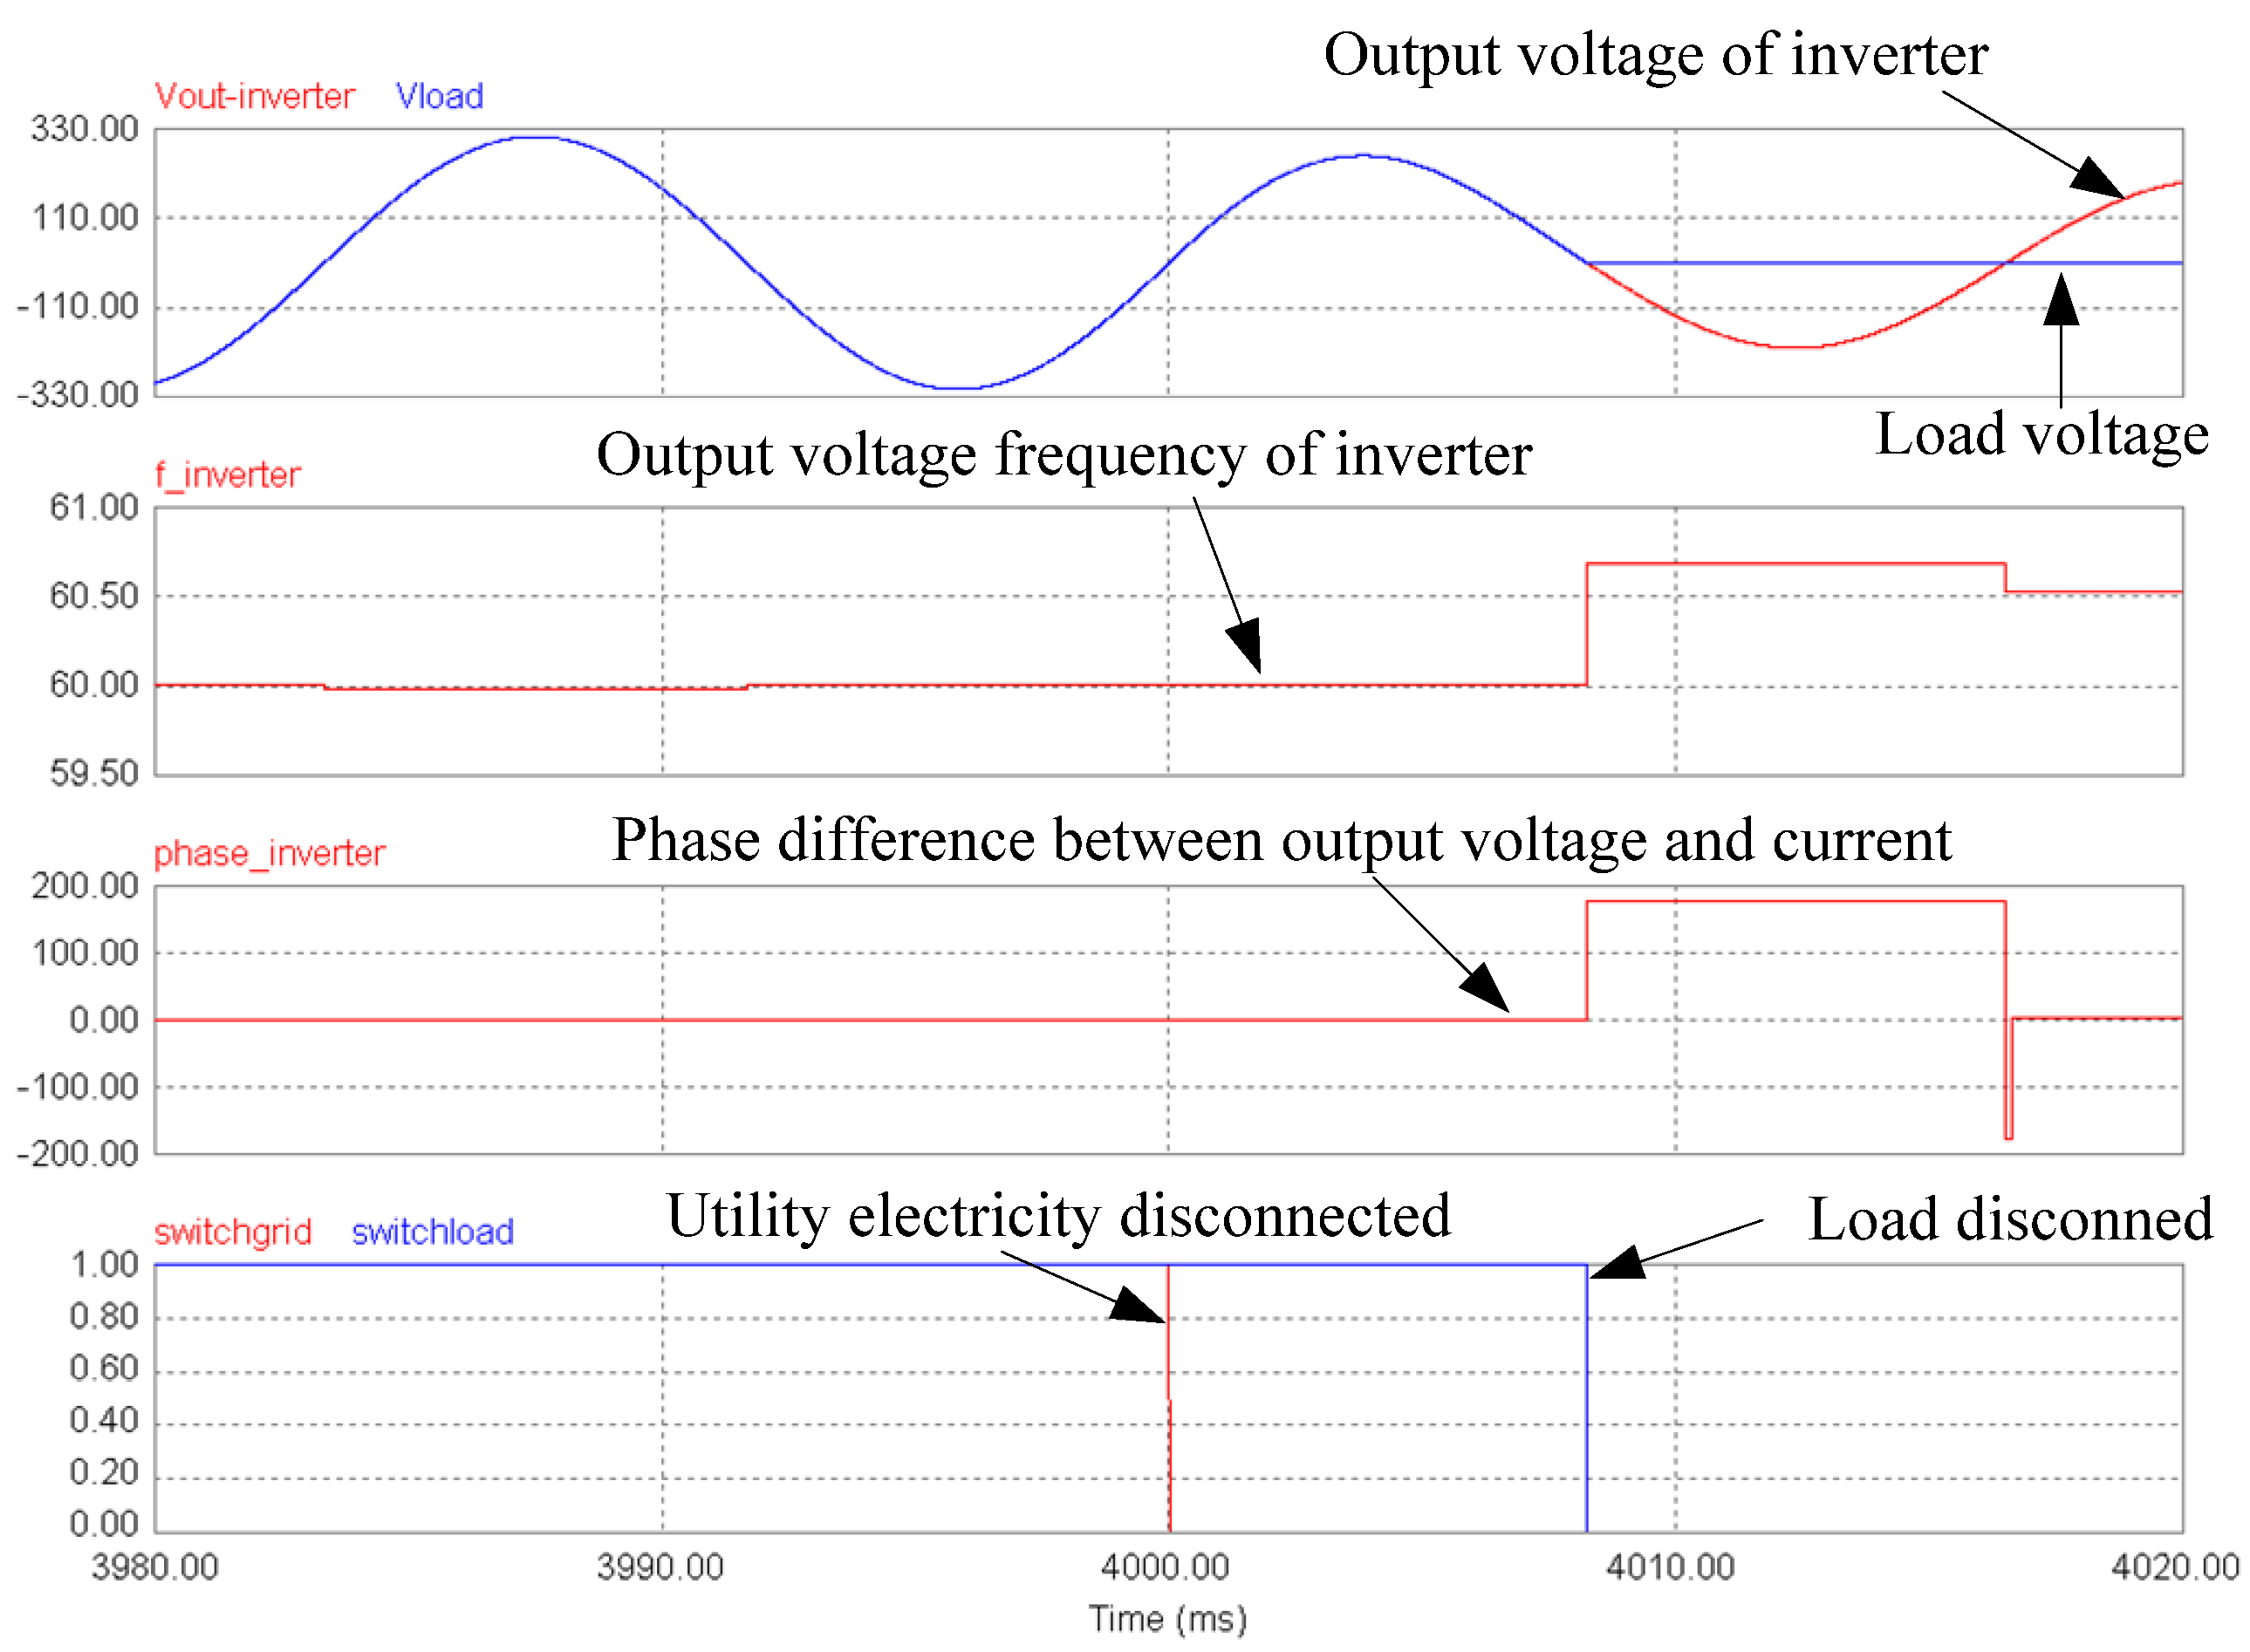
Figure 5 shows the circumstances where the output of a power regulator is connected in parallel to the utility grid, and the utility grid disconnects from the system at second 4. The proposed detection system successfully identified islanding operations within a 0.5 cycle (approximately 8.3 ms) and disconnected the loads. The trip time met the standards for islanding operations published by the U.S.’s Sandia National Laboratories [
20]. The maximum trip cycle was one (approximately 16 ms).
Table 5.
Results of the islanding detection method based on a CMAC neural network.
Table 5.
Results of the islanding detection method based on a CMAC neural network.
| Test No. | Output weight for various fault type | Known fault type | Diagnosed results |
|---|
| I1 | I2 | I3 | I4 | I5 | I6 | I7 |
|---|
| 1 | 0.9989 | 0.7111 | 0.1875 | 0.6000 | 0.7503 | 0.8750 | 0 | I1 | I1 |
| 2 | 0.4284 | 1.0976 | 0.1875 | 0.6001 | 0.7508 | 0.7500 | 0.4284 | I2 | I2 |
| 3 | 0 | 0.2889 | 0.9375 | 0 | 0 | 0 | 0.1432 | I3 | I3 |
| 4 | 0.8568 | 0.7111 | 0.1875 | 1.0000 | 0.7503 | 0.8750 | 0.4284 | I4 | I4 |
| 5 | 0.8568 | 0.7111 | 0.1875 | 0.6000 | 1.0000 | 0.8750 | 0 | I5 | I5 |
| 6 | 0.4284 | 0.3555 | 0.1875 | 0.4000 | 0.5004 | 1.0000 | 0 | I6 | I6 |
| 7 | 0.3333 | 0.4835 | 0 | 0.6001 | 0.2504 | 0 | 0.8568 | I7 | I7 |
| 8 | 0.7618 | 0.3555 | 0 | 0.1999 | 0.2499 | 0.2500 | 0 | I1 | I1 |
| 9 | 0 | 0.7085 | 0 | 0.2001 | 0.2504 | 0 | 0.4284 | I2 | I2 |
| 10 | 0.3333 | 0.2889 | 0.9375 | 0 | 0 | 0 | 0.1432 | I3 | I3 |
| 11 | 0.4284 | 0.8390 | 0.1875 | 1.0002 | 0.7508 | 0.6250 | 0.8568 | I4 | I4 |
| 12 | 0.8568 | 0.7111 | 0.1875 | 0.6000 | 1.0000 | 0.8750 | 0 | I5 | I5 |
| 13 | 0.8568 | 0.7111 | 0.1875 | 0.6000 | 0.7503 | 1.0625 | 0 | I6 | I6 |
| 14 | 0 | 0.4835 | 0.1875 | 0.6001 | 0.2504 | 0 | 1.0000 | I7 | I7 |
Table 6.
Test data for detecting islanding with added variance.
Table 6.
Test data for detecting islanding with added variance.
| Test No. | Voltage peak (V) | Frequency (Hz) | Phase difference (Deg.) | State of islanding operation |
|---|
| 1 | 555.133* | 59.6809* | −20.7360 | I1 |
| 2 | 161.074 | 59.6761* | 6.0500* | I2 |
| 3 | 273.324 | 59.4711* | −92.6530 | I3 |
| 4 | 311.106 | 59.6809* | −21.4791* | I4 |
| 5 | 646.567* | 59.9800 | −17.1590* | I5 |
| 6 | 3.599* | 60.0096 | −49.5158* | I6 |
| 7 | 305.052* | 59.1724* | 3.4270 | I7 |
| 8 | 324.481* | 58.997 | −21.3333 | I1 |
| 9 | 190.405 | 59.3000 | −18.7000* | I2 |
| 10 | 278.9755 | 60.1164* | −78.8108 | I3 |
| 11 | 305.856 | 60.0096 | −0.0260* | I4 |
| 12 | 633.505* | 59.7095* | −19.9584 | I5 |
| 13 | 2.756 | 60.0096 | −30.0326* | I6 |
| 14 | 320.119* | 60.1374* | −0.0454 | I7 |
| Variance | ±5% | ±0.5% | ±10% | |
Table 7.
Detection results for the test data with added variance.
Table 7.
Detection results for the test data with added variance.
| Test No. | Output weight for various fault type | Known fault type | Diagnosed results |
|---|
| I1 | I2 | I3 | I4 | I5 | I6 | I7 |
|---|
| 1 | 0.7618 | 0.3555 | 0 | 0.1999 | 0.5006 | 0.2500 | 0 | I1 | I1 |
| 2 | 0 | 0.7421 | 0 | 0.2001 | 0.2504 | 0.1250 | 0.4284 | I2 | I2 |
| 3 | 0 | 0.2889 | 0.7500 | 0 | 0 | 0 | 0 | I3 | I3 |
| 4 | 0.4284 | 0.3555 | 0 | 0.6000 | 0.2499 | 0.2500 | 0.4284 | I4 | I4 |
| 5 | 0.4284 | 0.8390 | 0.1875 | 0.6001 | 1.0005 | 0.6250 | 0.4284 | I5 | I5 |
| 6 | 0.4284 | 0.3555 | 0.1875 | 0.4000 | 0.5004 | 0.8125 | 0 | I6 | I6 |
| 7 | 0 | 0.4835 | 0 | 0.6001 | 0.2504 | 0 | 0.8568 | I7 | I7 |
| 8 | 0.7618 | 0.3555 | 0 | 0.6000 | 0.2499 | 0.2500 | 0.4284 | I1 | I1 |
| 9 | 0.4284 | 0.5805 | 0 | 0.1999 | 0.2499 | 0.2500 | 0 | I2 | I2 |
| 10 | 0.3333 | 0.2889 | 1.0000 | 0 | 0 | 0 | 0 | I3 | I3 |
| 11 | 0.4284 | 0.8390 | 0.1875 | 1.0002 | 0.7508 | 0.6250 | 0.8568 | I4 | I4 |
| 12 | 0.4284 | 0.3555 | 0 | 0.1999 | 0.4996 | 0.2500 | 0 | I5 | I5 |
| 13 | 0.4284 | 0.3555 | 0.1875 | 0.4000 | 0.5004 | 0.8125 | 0 | I6 | I6 |
| 14 | 0 | 0.4835 | 0.2500 | 0.6001 | 0.2504 | 0 | 0.8568 | I7 | I7 |
Table 8.
Accuracy comparison between CMAC and MLP neural network methods.
Table 8.
Accuracy comparison between CMAC and MLP neural network methods.
| Method | Learning epochs | Learning accuracy | Islanding detection accuracy |
|---|
| CMAC | 10 | 100% | 100% |
| MLP (4-7-10) | 1063 | 90.84% | 93.33% |
| MLP (4-8-10) | 1386 | 85.68% | 90% |
| MLP (4-9-10) | 1075 | 96.64% | 93.33% |
Figure 5.
Diagram of simulated islanding detection when the utility grid is disconnected at second 4.
Figure 5.
Diagram of simulated islanding detection when the utility grid is disconnected at second 4.
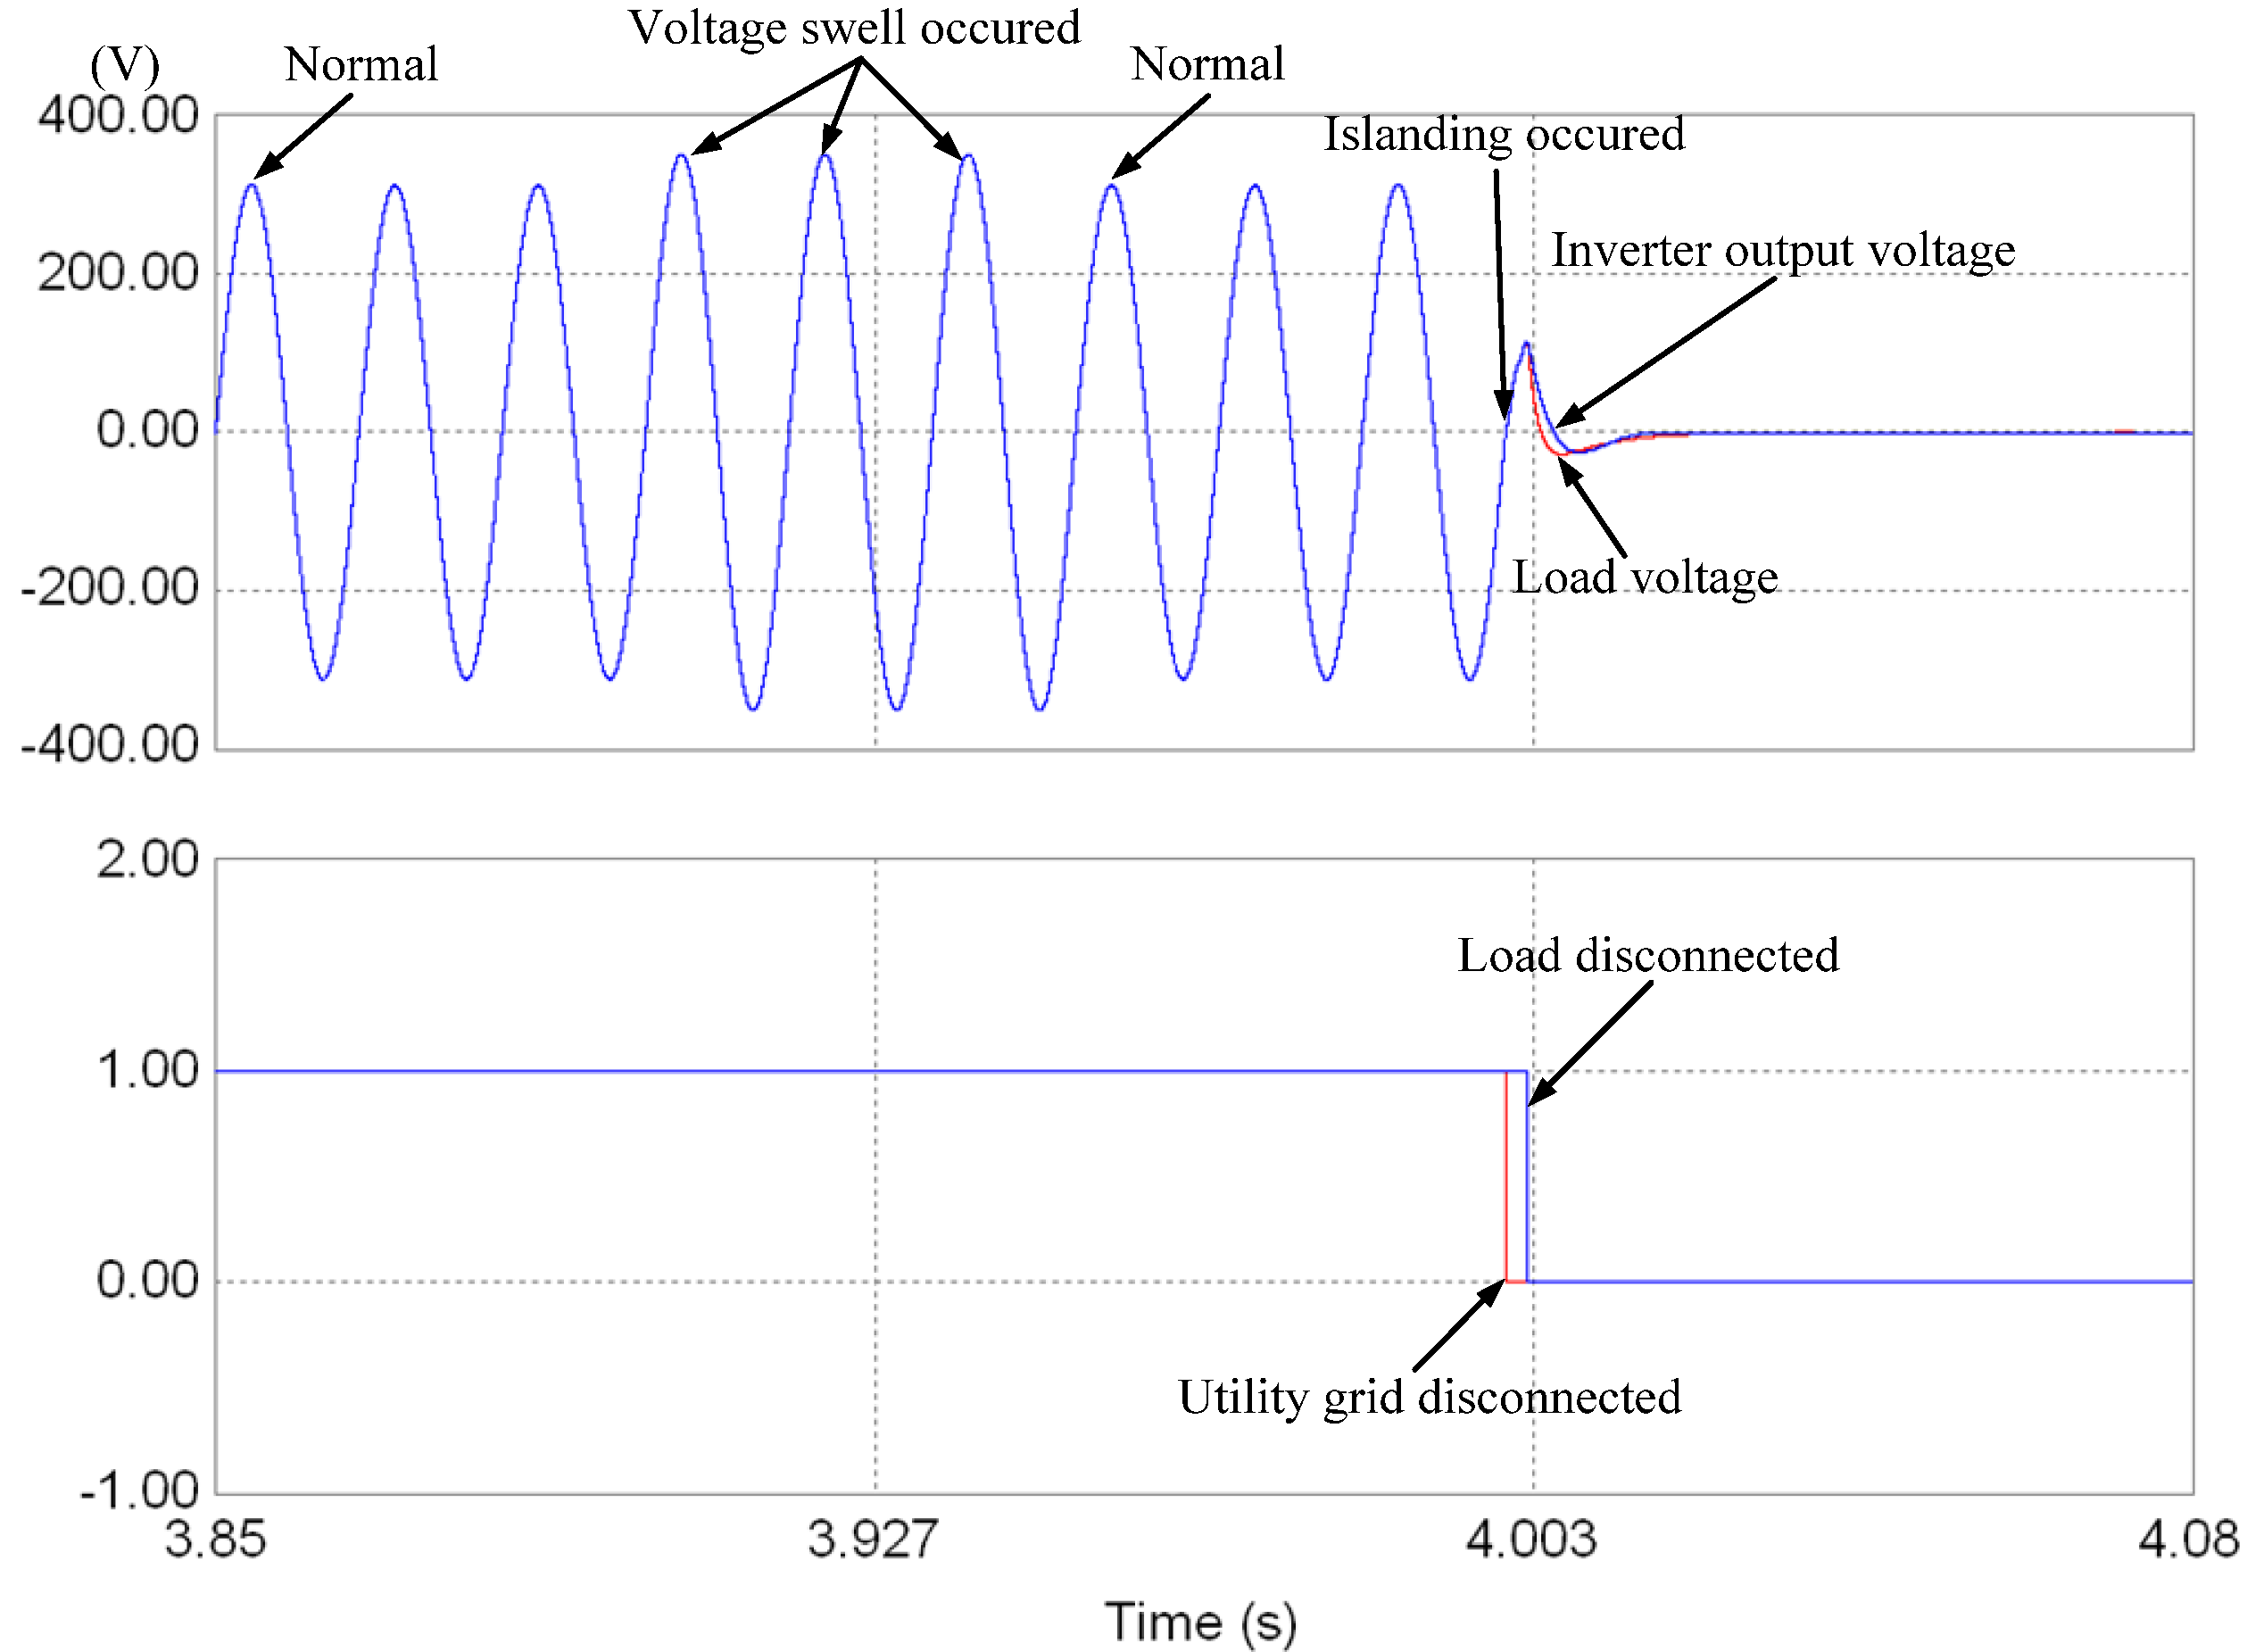
Figure 6 shows that three cycles of voltage swelling occurred in the system before the utility grid end outage at Second 4. The islanding detection method based on a CMAC neural network determined that the swell in voltage was caused by signal interference rather than an islanding operation. Therefore, the system did not disconnect the loads until 0.5 cycle after the islanding operation had occurred.
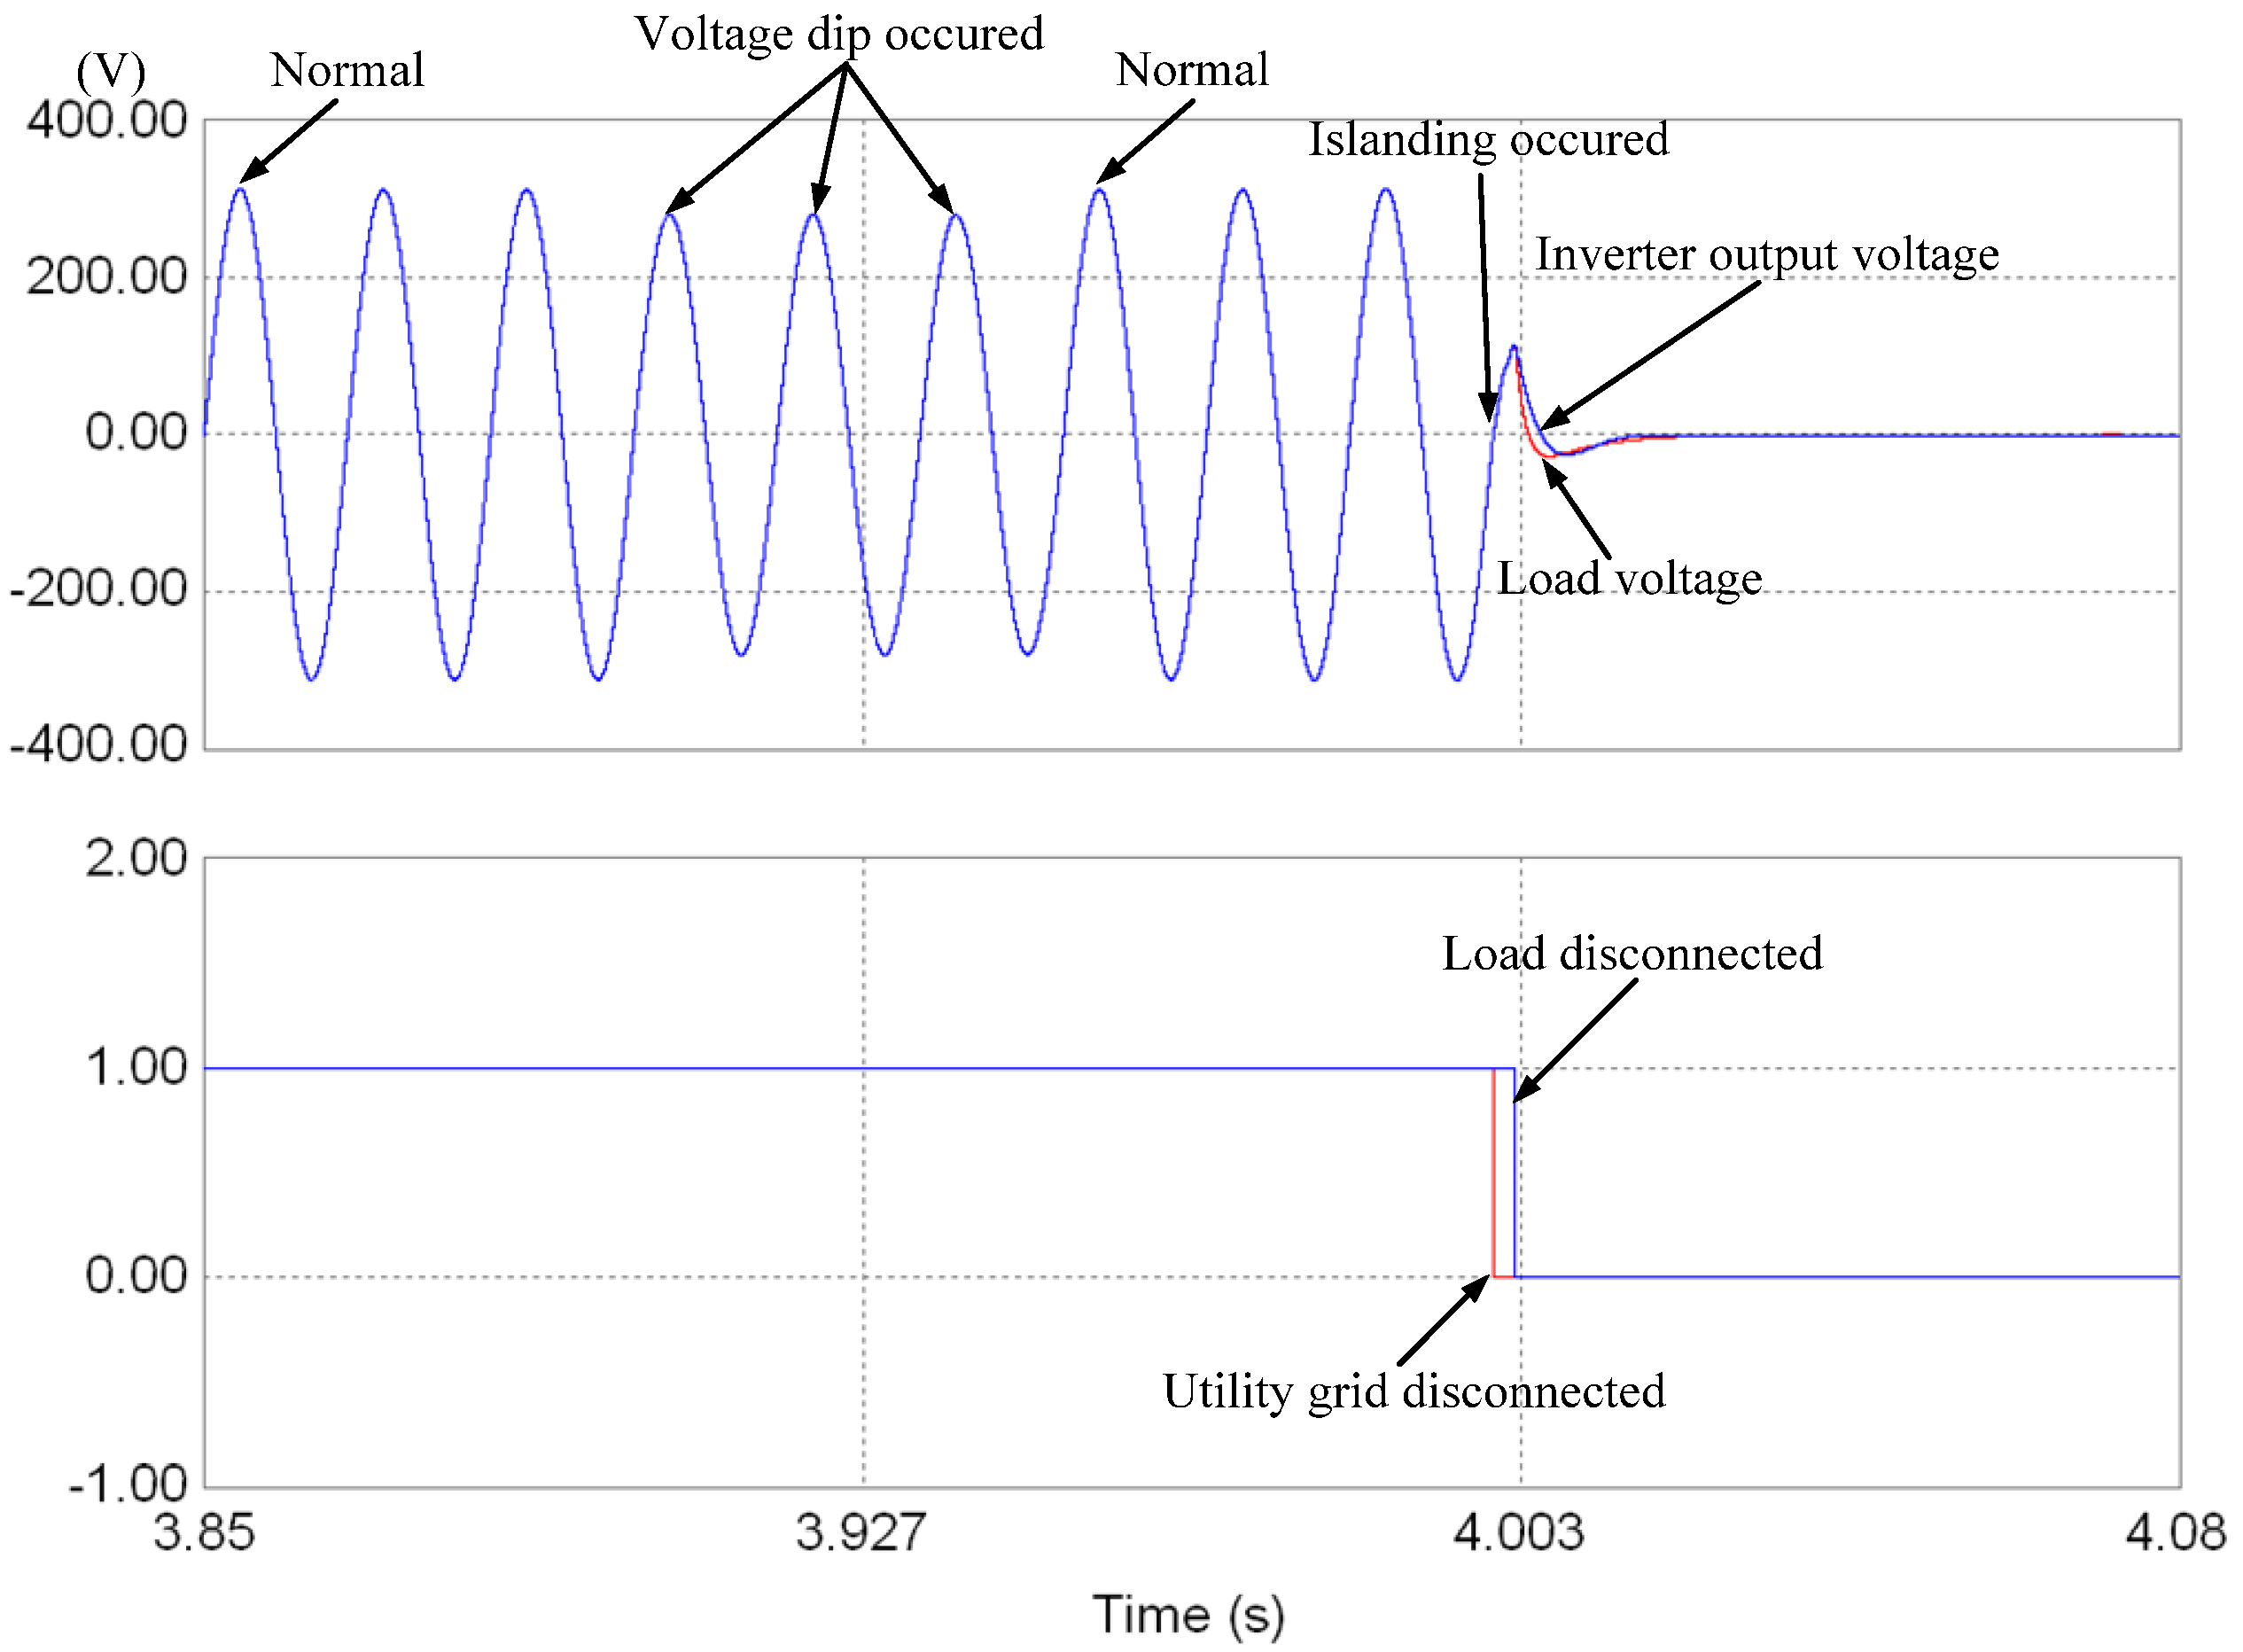
Figure 7 shows that a voltage dip occurred and the utility grid end was disconnected at approximately Second 4. These results indicate that the proposed method correctly determined that the voltage dip was caused by power interference. Therefore, the loads were not disconnected until a 0.5 cycle after the islanding operation had occurred.
Figure 6.
Diagram of simulated islanding detection during voltage swelling.
Figure 6.
Diagram of simulated islanding detection during voltage swelling.
Figure 7.
Diagram of simulated islanding detection during voltage dipping.
Figure 7.
Diagram of simulated islanding detection during voltage dipping.
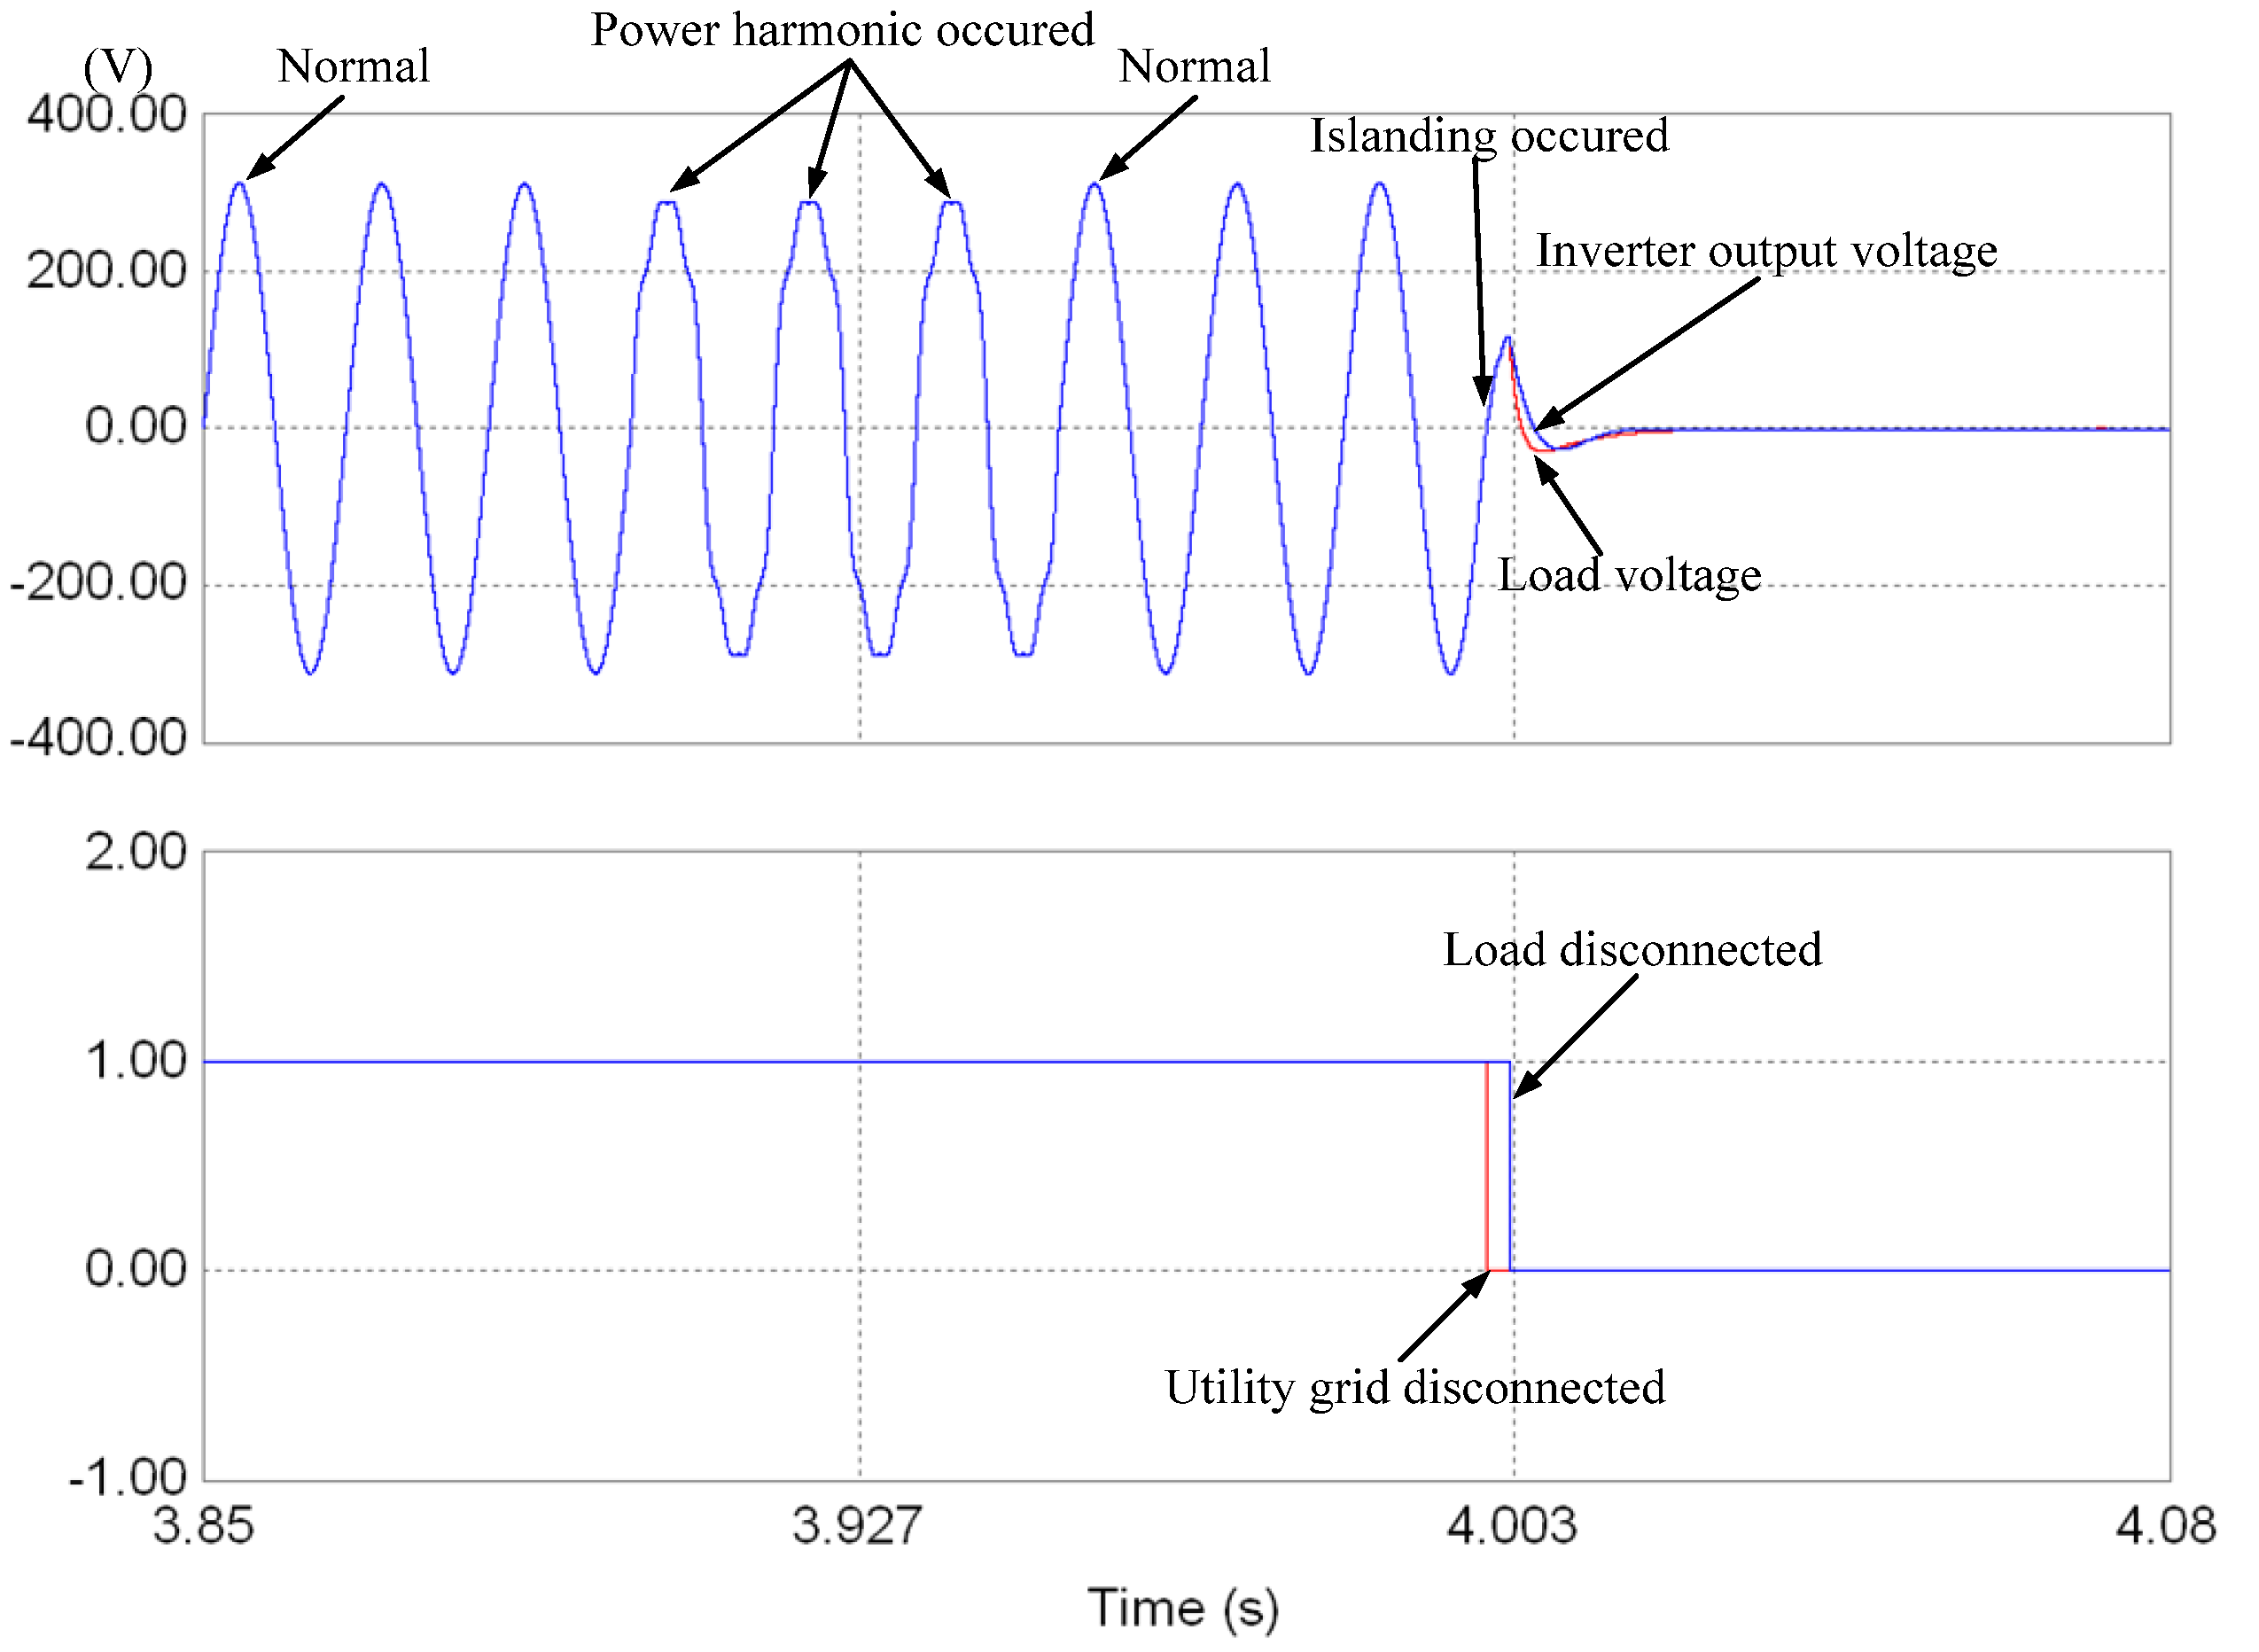
Figure 8 shows a simulation of harmonic component interference before an islanding operation; this was conducted to determine whether such interference influences islanding detection. The harmonic components comprised third, fifth, and seventh harmonics at 10%, 7%, and 5% of the base frequency, respectively. As shown in
Figure 8, an islanding operation occurred at Second 4. However, the interference from harmonic components before the islanding operation did not cause the detection method based on a CMAC neural network to malfunction.
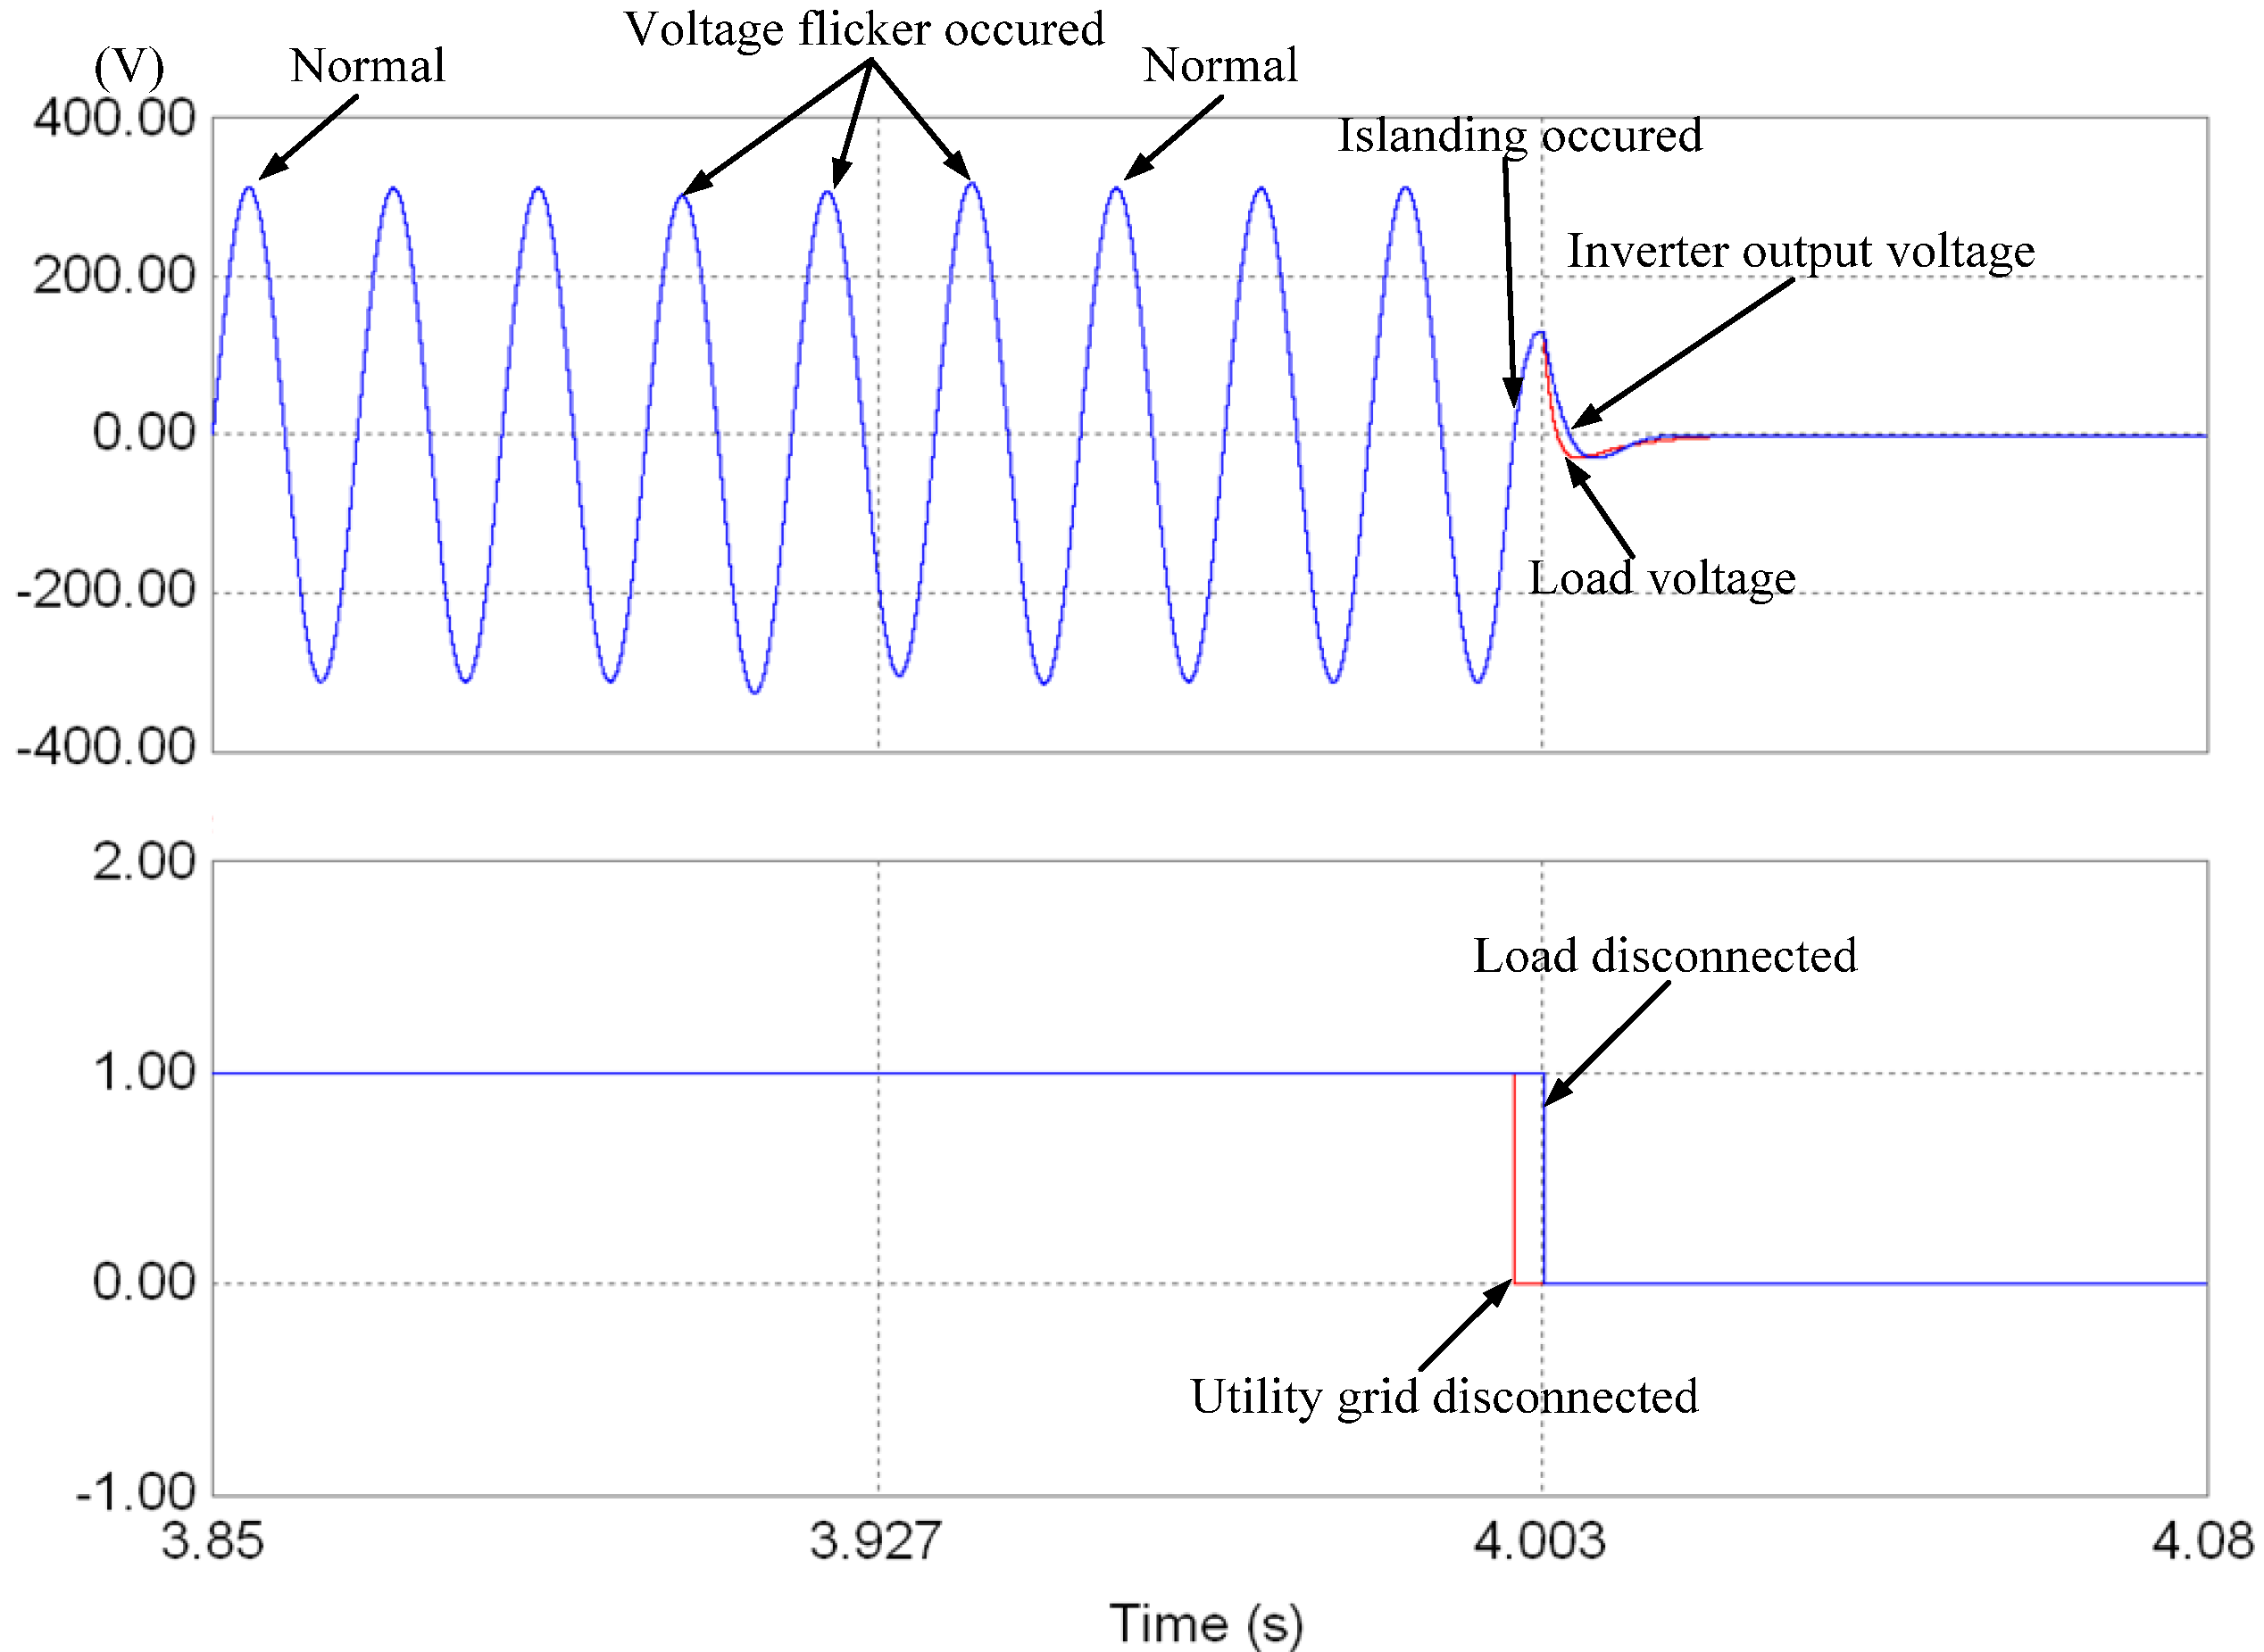
Figure 9 shows the detection of an islanding operation under the influence of voltage flickering. Voltage flickering was achieved by synthesizing 15 Hz and 20 Hz voltage flickers and a standard voltage of 60 Hz, where islanding operations occur at Second 4. The controller can disconnect loads within a 0.5 cycle.
Figure 8.
Simulation diagram of islanding detection influenced by power harmonics.
Figure 8.
Simulation diagram of islanding detection influenced by power harmonics.
Figure 9.
Simulation diagram of islanding detection influenced by voltage flickering.
Figure 9.
Simulation diagram of islanding detection influenced by voltage flickering.
5. Experimental Results
To provide further evidence that the proposed islanding detection method correctly detects islanding operations and promptly disconnects the power system from the parallel connection, this study empirically tested and analyzed the system. During the test, a programmable system-on-chip (PSoC) manufactured by Cypress [
21] was used to implement the islanding operation detection method based on a CMAC neural network. A Chroma 6530 AC power source has been employed in order to test the tolerance of the proposed CMAC Neural Network islanding detection method to grid voltage and frequency variations. Four islanding tests have been carried out in order to evaluate the performance of the proposed islanding detection method under diverse operation conditions, namely, voltage swell, voltage dip, distorted grid voltage, and voltage flicker. As shown in
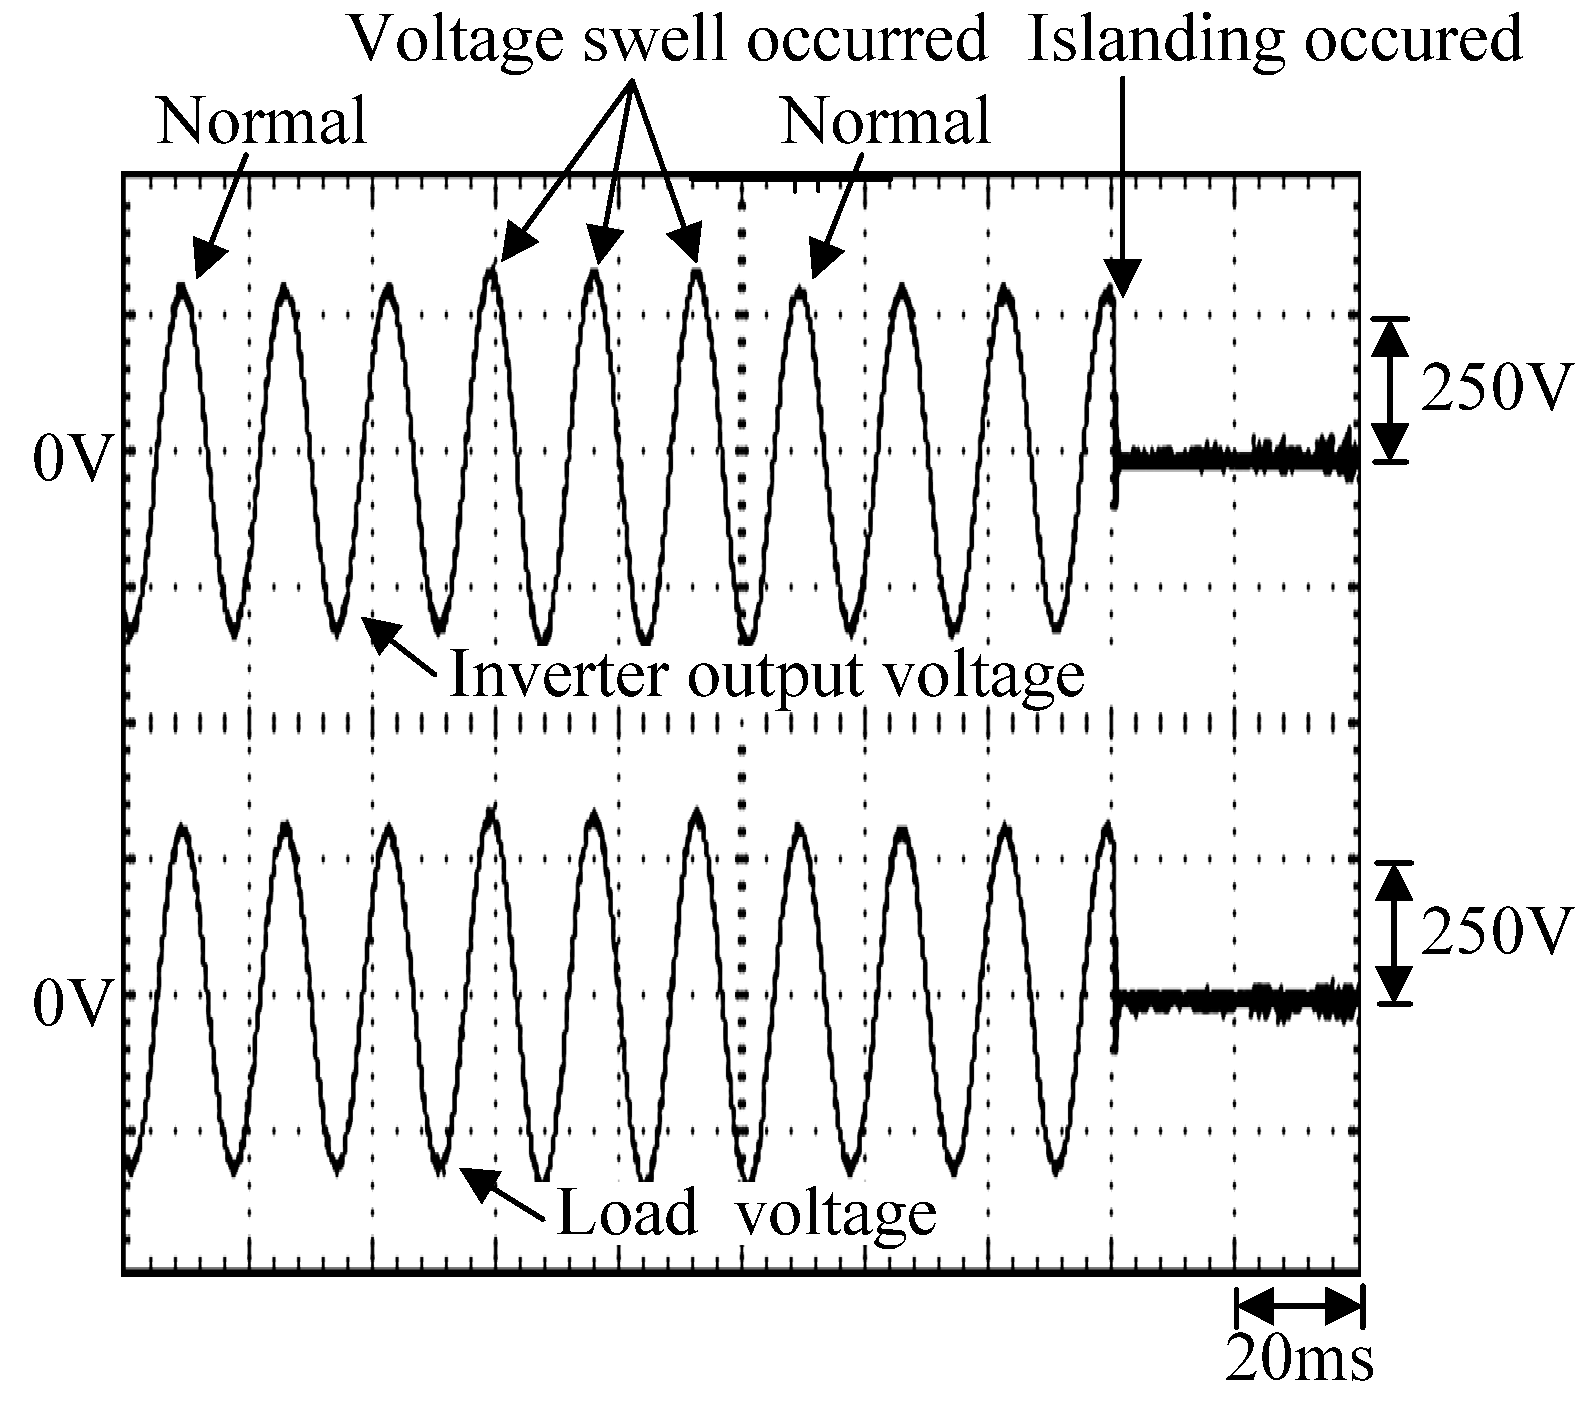
Figure 10, the system voltage operation was normal before the three cycles of voltage swelling. At Second 4, the utility grid was disconnected to induce an islanding operation. The results in
Figure 10 show that the islanding operation detection method based on a CMAC neural network can recognize when a voltage swell is caused by power quality interference rather than an islanding operation. Therefore, the system only disconnected the load from the photovoltaic power generation system within a 0.5 cycle (
i.e., precisely 0.003 s) after disconnection of the utility grid (
i.e., the islanding operation).
Figure 10.
Diagram of islanding detection (voltage swelling before utility grid disconnection).
Figure 10.
Diagram of islanding detection (voltage swelling before utility grid disconnection).
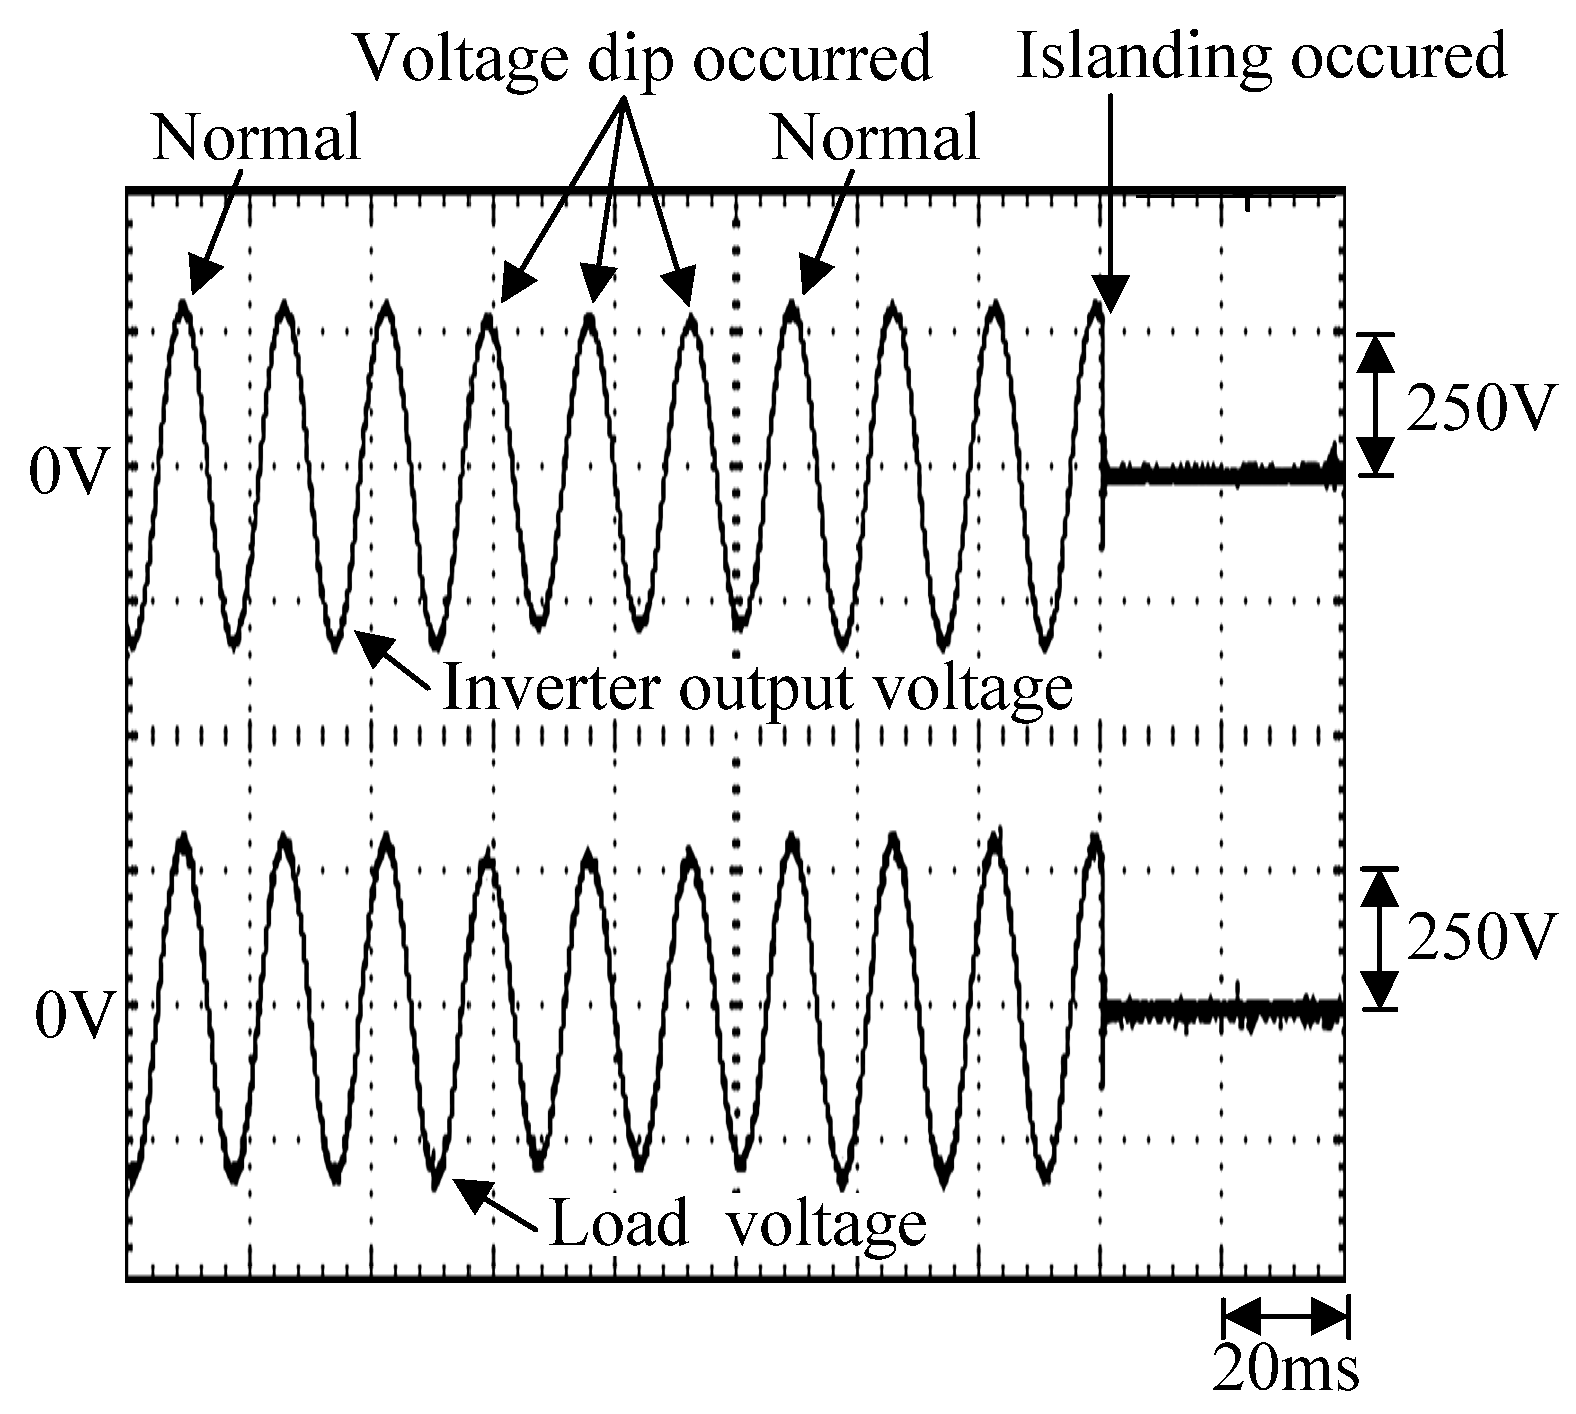
Figure 11 indicates that a voltage dip occurred in the system voltage. Furthermore, during the three voltage dip cycles, the islanding operation detection method based on a CMAC neural network did not disconnect the loads. The proposed method determined the occurrence of islanding operations and disconnected the loads from the photovoltaic power generation system within a 0.5 cycle (
i.e., precisely 0.003 s) after the utility grid was disconnected at Second 4 and islanding occurred.
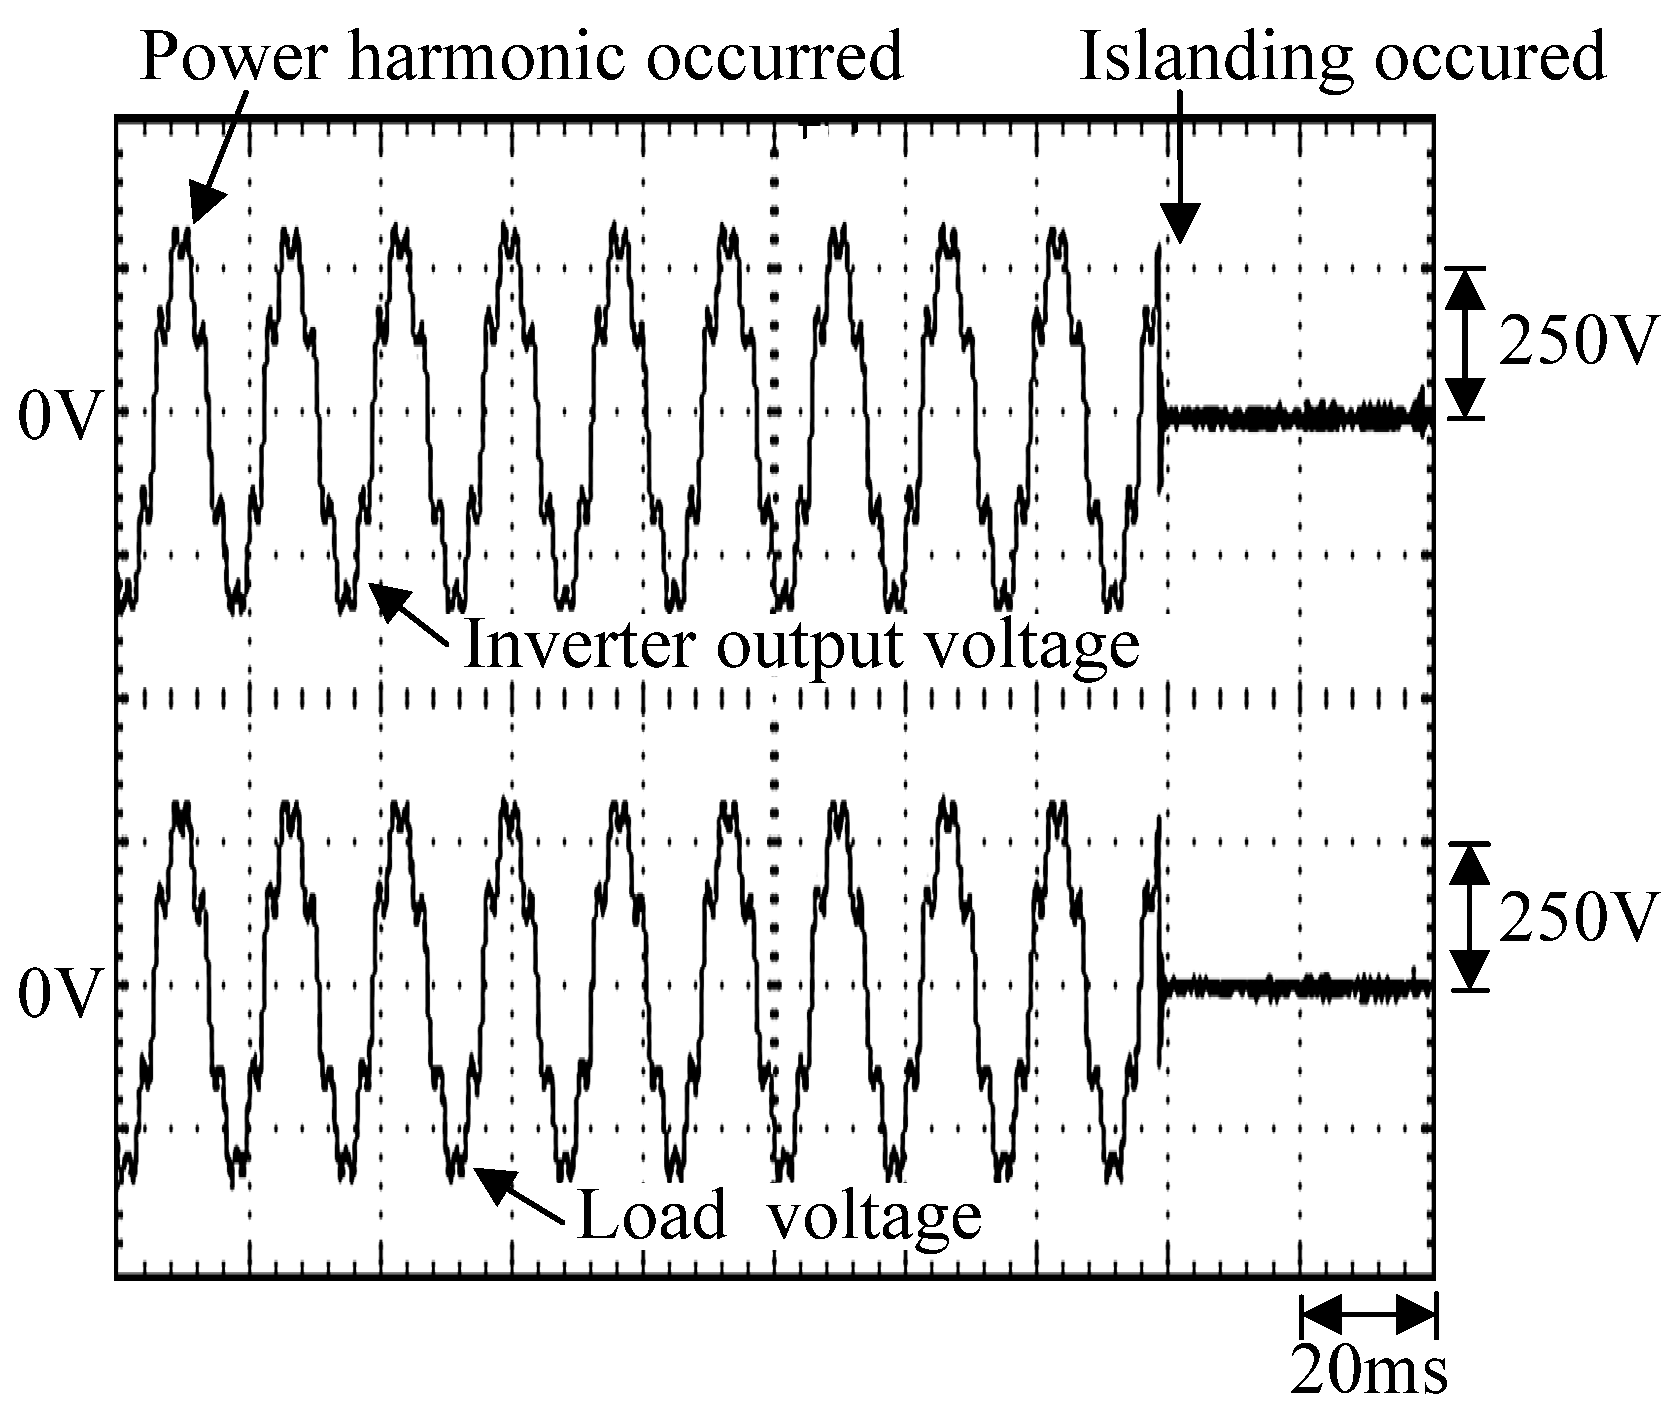
Figure 12 shows the conditions where the voltage waveforms contained harmonic components that interfered with the power quality. These conditions can be used to determine whether islanding detection technology is influenced by harmonic components. The harmonic components of voltage added to the power system were third, fifth, and seventh harmonics at 10%, 7%, and 5% of the fundamental frequency voltage, respectively. As
Figure 12 shows, the system operated normally before the three cycles of harmonic interference. At Second 4, the utility grid was disconnected and an islanding operation occurred. The proposed islanding detection method based on a CMAC neural network was not influenced by harmonic interference prior to the islanding operation and did not malfunction. Instead, the loads were disconnected from the photovoltaic power generation system within a 0.5 cycle (
i.e., precisely 0.003 s) after the utility grid was disconnected and the islanding phenomenon occurred.
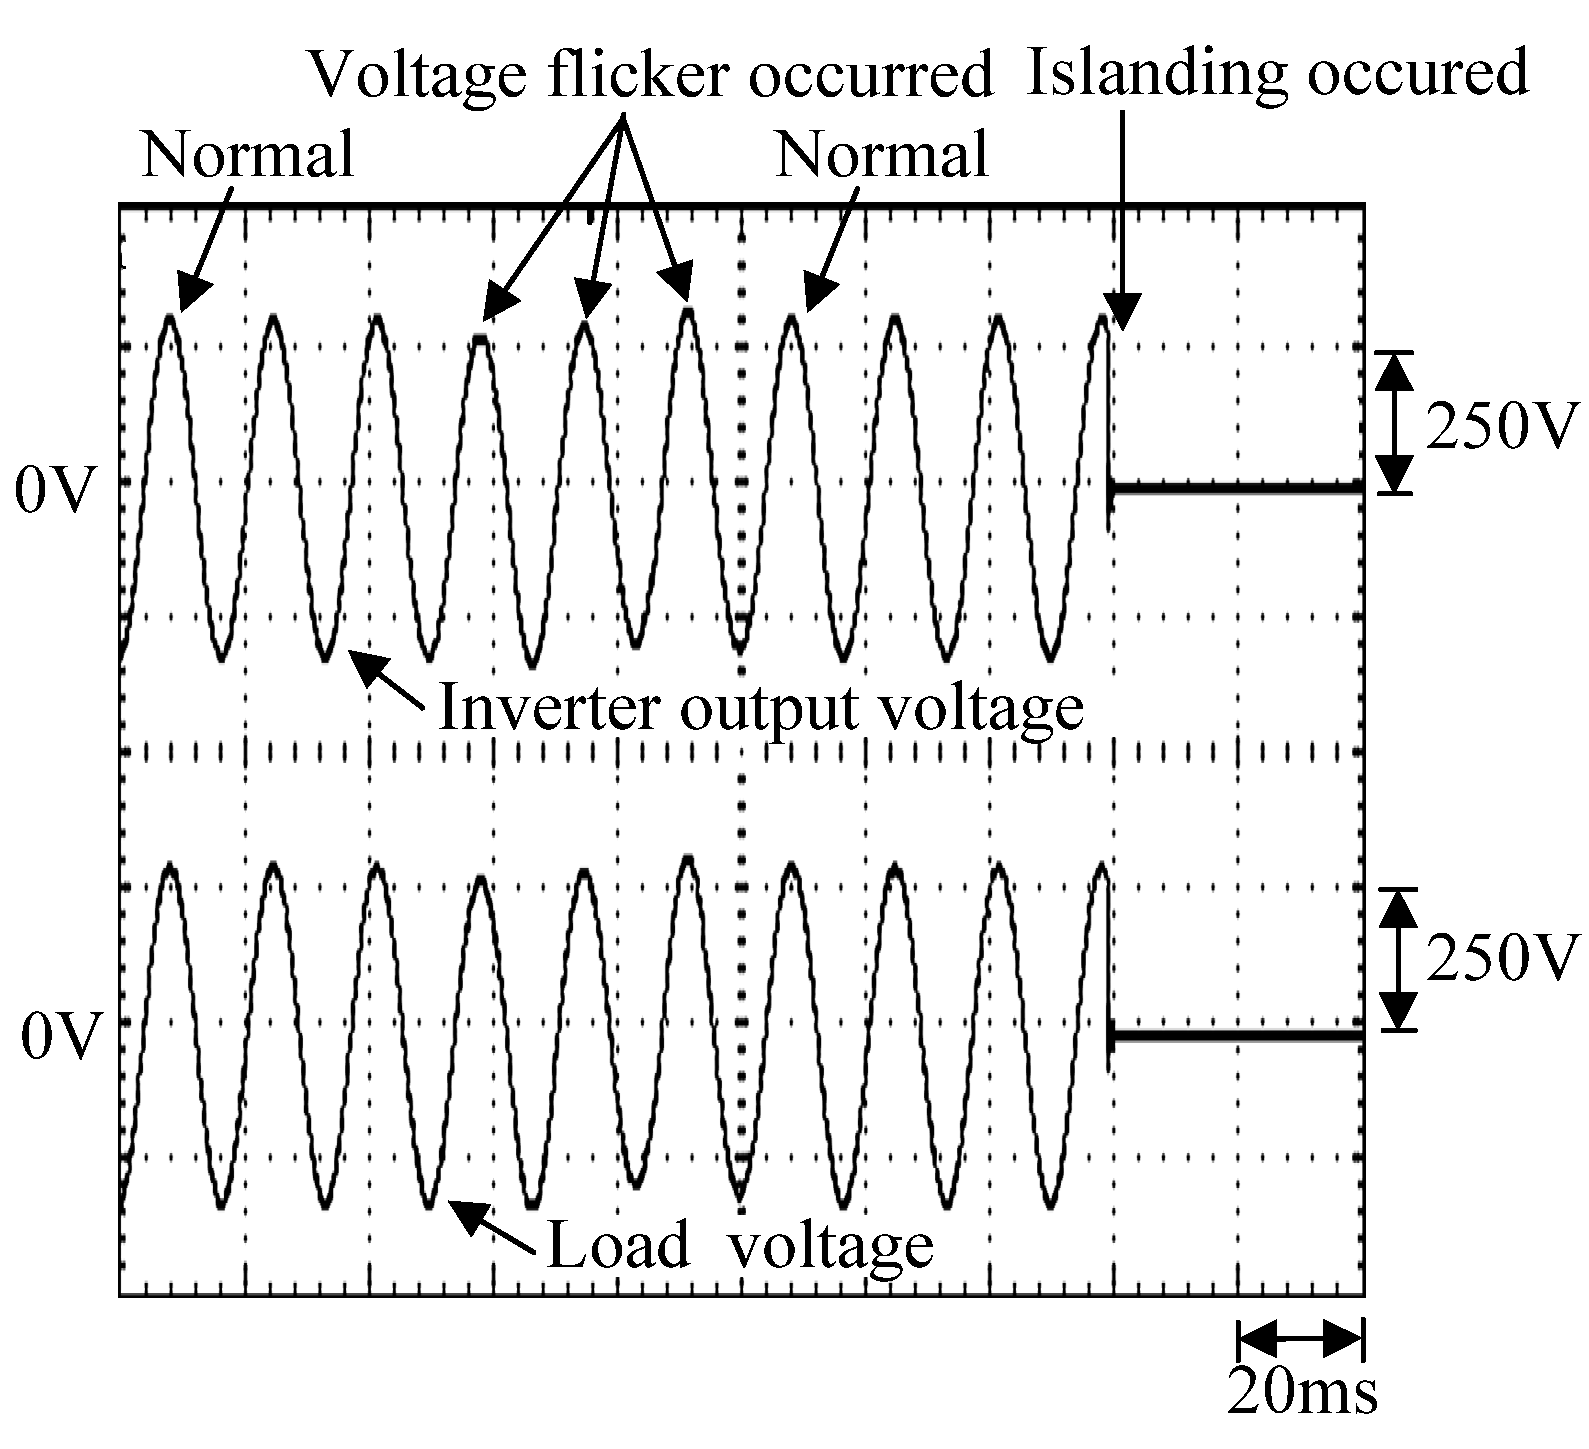
Figure 13 shows the detection of an islanding operation influenced by voltage flickering. The flicker voltage was obtained by synthesizing flicker voltages at 15 Hz and 20 Hz and the standard voltage of 60 Hz. The system operation was normal prior to the three cycles of voltage flickering. The islanding operation occurred at approximately Second 4. The islanding detection method based on a CMAC neural network effectively disconnected the loads from the photovoltaic power generation system within a 0.5 cycle.
Figure 11.
Diagram of islanding detection (voltage dipping before utility grid disconnection).
Figure 11.
Diagram of islanding detection (voltage dipping before utility grid disconnection).
Figure 12.
Diagram of islanding detection (harmonic components added to the system voltage before utility grid disconnection).
Figure 12.
Diagram of islanding detection (harmonic components added to the system voltage before utility grid disconnection).
Figure 13.
Diagram of islanding detection (voltage flickering before utility grid disconnection).
Figure 13.
Diagram of islanding detection (voltage flickering before utility grid disconnection).


