Influence of Maintenance Intervals on Performance and Emissions of a 192 kWel Biogas Gas Otto CHP Unit and Results of Lubricating Oil Quality Tests—Outcome from a Continuous Two-Year Measuring Campaign


Abstract
:1. Introduction
1.1. General Introduction
1.2. Fundamentals

| Parameter | Unit | Limiting Value |
|---|---|---|
| Wear | ||
| Iron | mg/kg | 21 |
| Chrome | mg/kg | 5 |
| Tin | mg/kg | 5 |
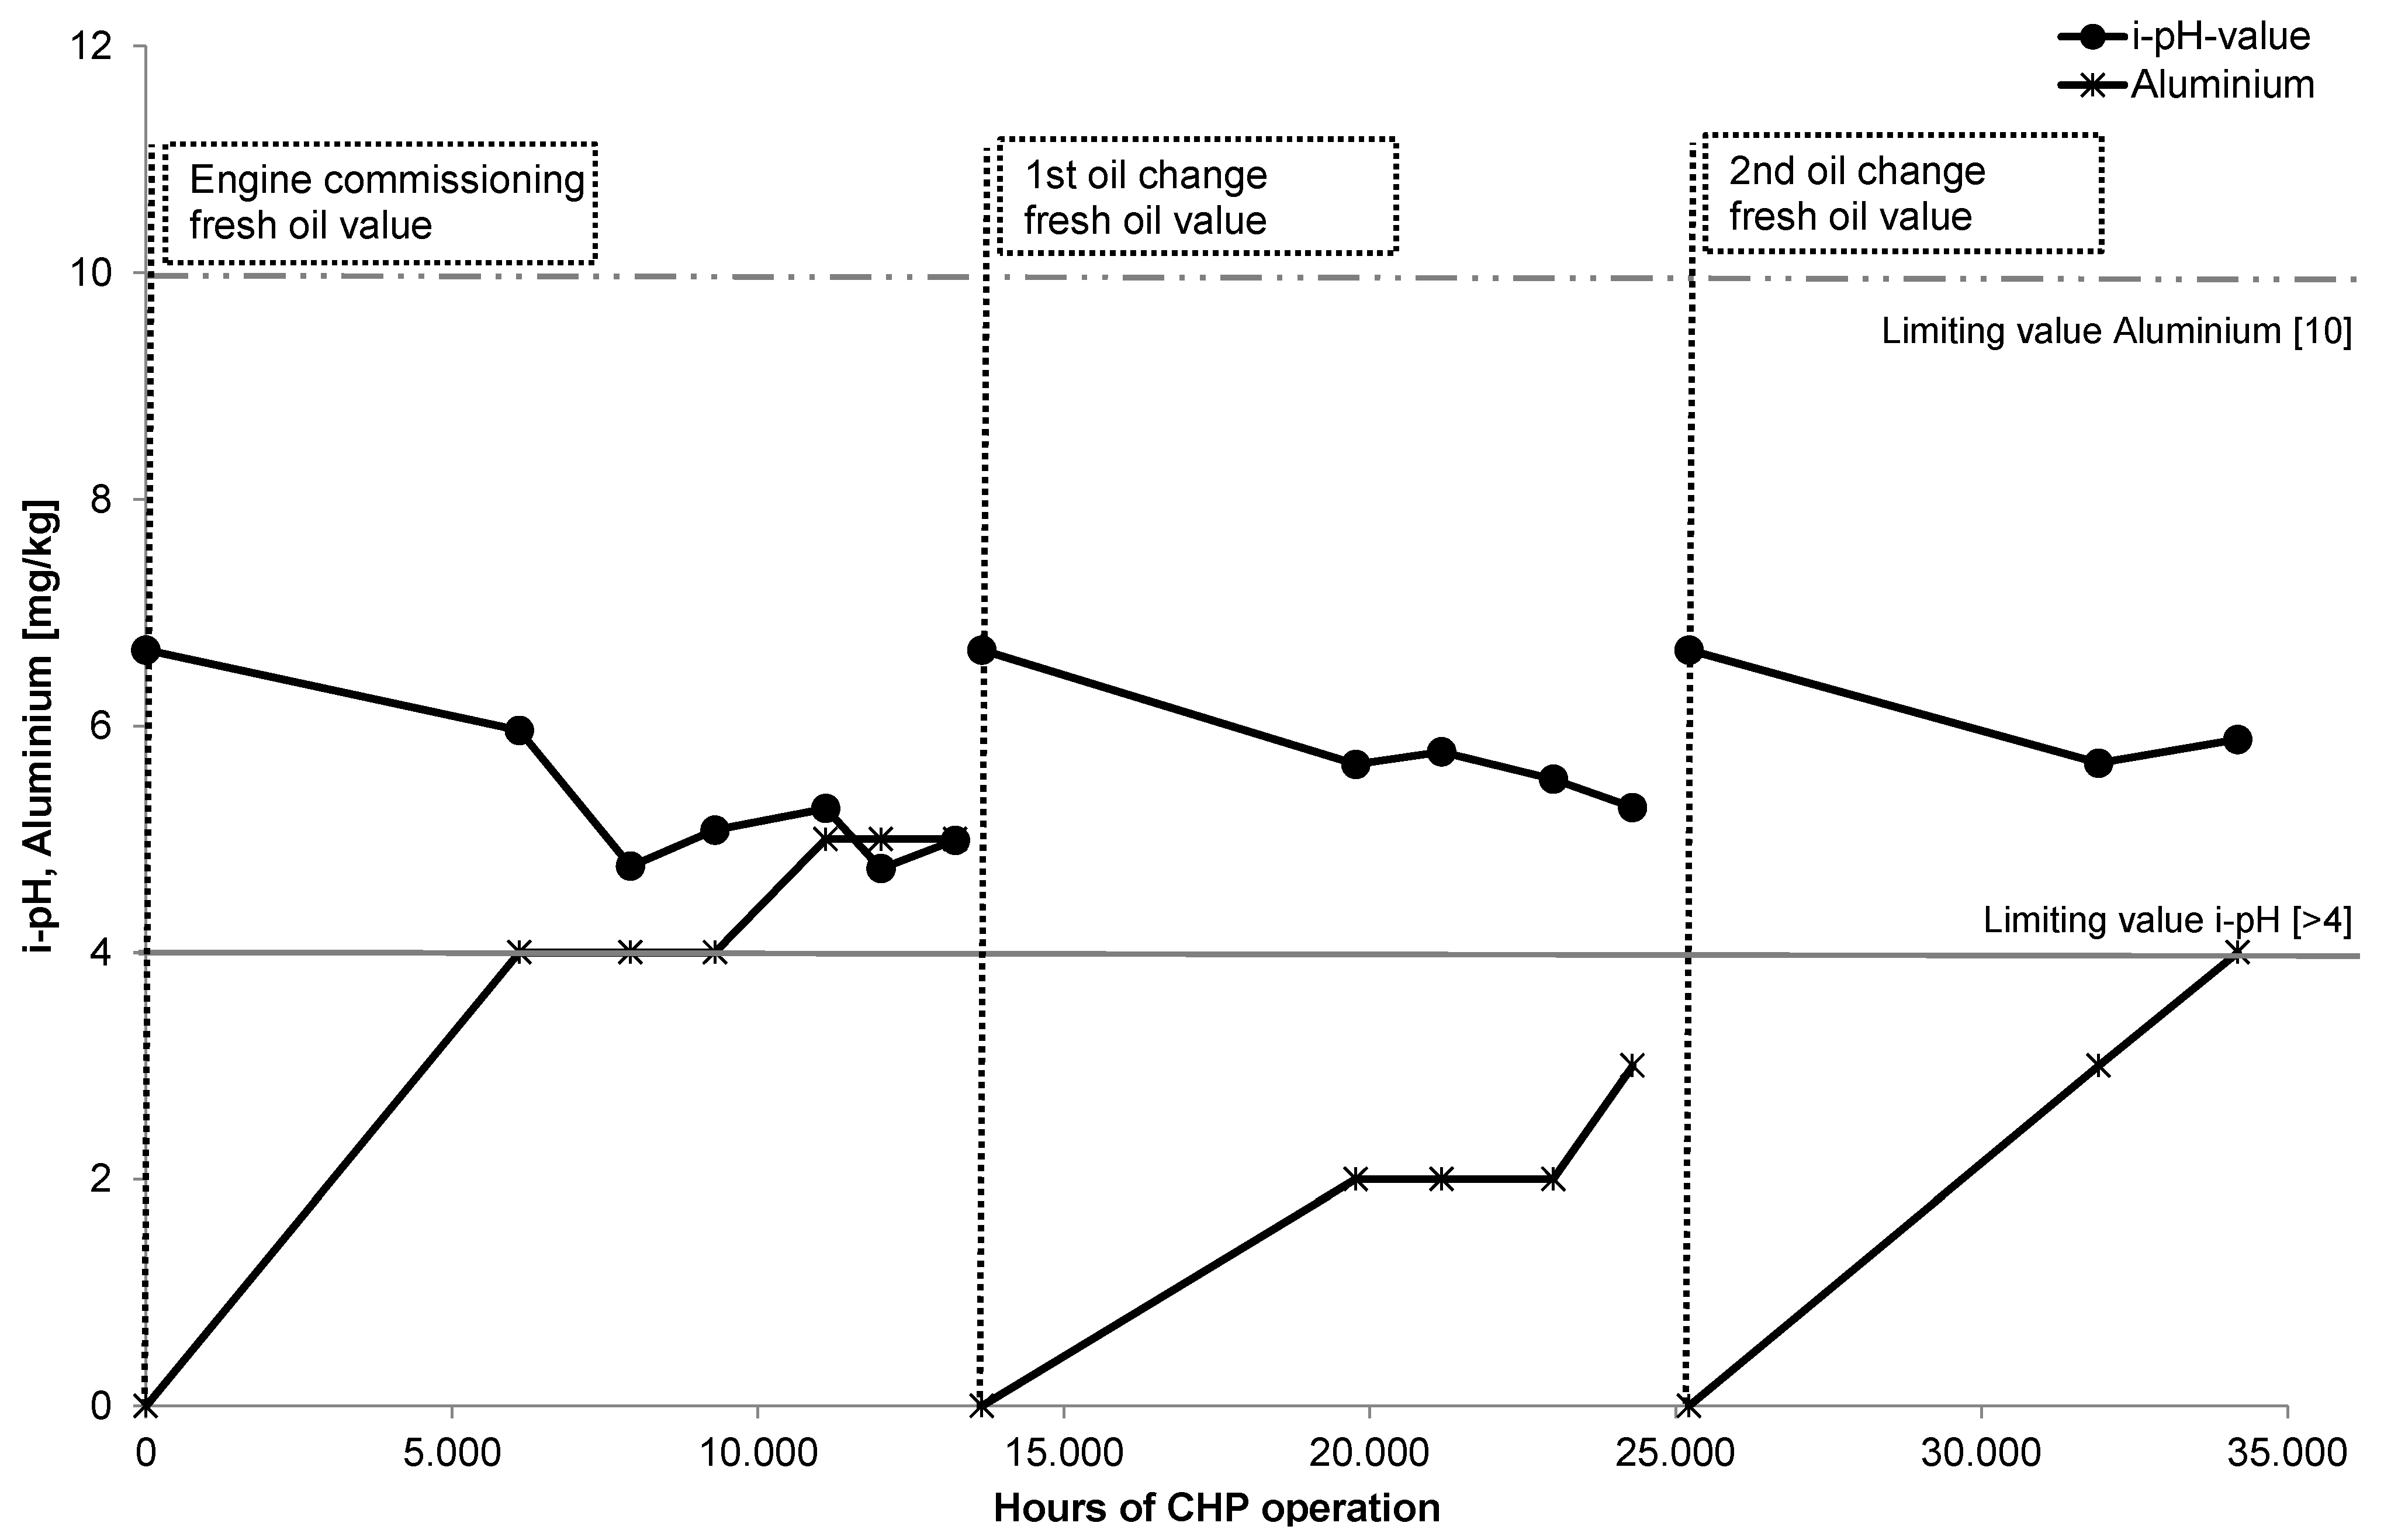
| Aluminum | mg/kg | 10 |
| Nickel | mg/kg | 3 |
| Copper | mg/kg | 15 |
| Lead | mg/kg | 20 |
| Molybdenum | mg/kg | 5 |
| Soiling | ||
| Silicon/Dust | mg/kg | 4–7 |
| Potassium | mg/kg | 25 |
| Sodium | mg/kg | Fresh oil + 25 |
| Water | m% | 0.2 |
| Glycol | ppm | 500 (pos) |
| Oil-condition | ||
| Viscosity at 40°C | mm²/s | SAE 40: min. 12 max. 18SAE 30: min. 9 max. 15 |
| Viscosity at 100°C | mm²/s | |
| Viscosity index | – | increase max 3 |
| Oxidation | A/cm | 20 |
| Nitration | A/cm | 20 |
| Sulfurization | A/cm | 25 |
| Additives | ||
| Calcium | mg/kg | ±20% compared to fresh oil |
| Magnesium | mg/kg | |
| Boron | mg/kg | |
| Zinc | mg/kg | |
| Phosphorus | mg/kg | |
| Barium | mg/kg | |
| Additional tests | ||
| TBN | mg KOH/g | >50% of fresh oil but >2 |
| TAN | mg KOH/g | Fresh oil value + 2.5 |
| i-pH | – | >4 |
| SAN | mgKOH/g | unverifiable |
| Soot | % | 1.5 |
2. Materials and Methods
| Technical specification | System specification | System parameter |
|---|---|---|
| Engine | CHP unit | MDE MB 3066 L4 |
| Engine type | 6 cylinder Gas Otto engine | |
| Electrical output power | 192 kW | |
| Thermal output power (engine + exhaust gas cooling) | 214 kW | |
| Thermal output power (gas mixture cooling) | 29 kW | |
| Biogas input power (at 55% CH4) | 499 kW | |
| Engine lubricating oil | Tectrol MethaFlexx HC Plus | |
| Emission limits | NOx-emissions (at 5% O2 in the dry exhaust) | <500 mg/Nm3 |
| CO2-emissions (at 5% O2 in the dry exhaust) | <1000 mg/Nm3 |
- electrical and thermal output of the CHP unit;
- utilization of thermal energy by the biogas plant and the district heating system;
- composition, flow, temperature and pressure of the biogas;
- composition and temperature of the exhaust gas;
- supplementary temperatures, pressures and further data from the CHP unit;
- additional data taken on demand for any extra information needed.
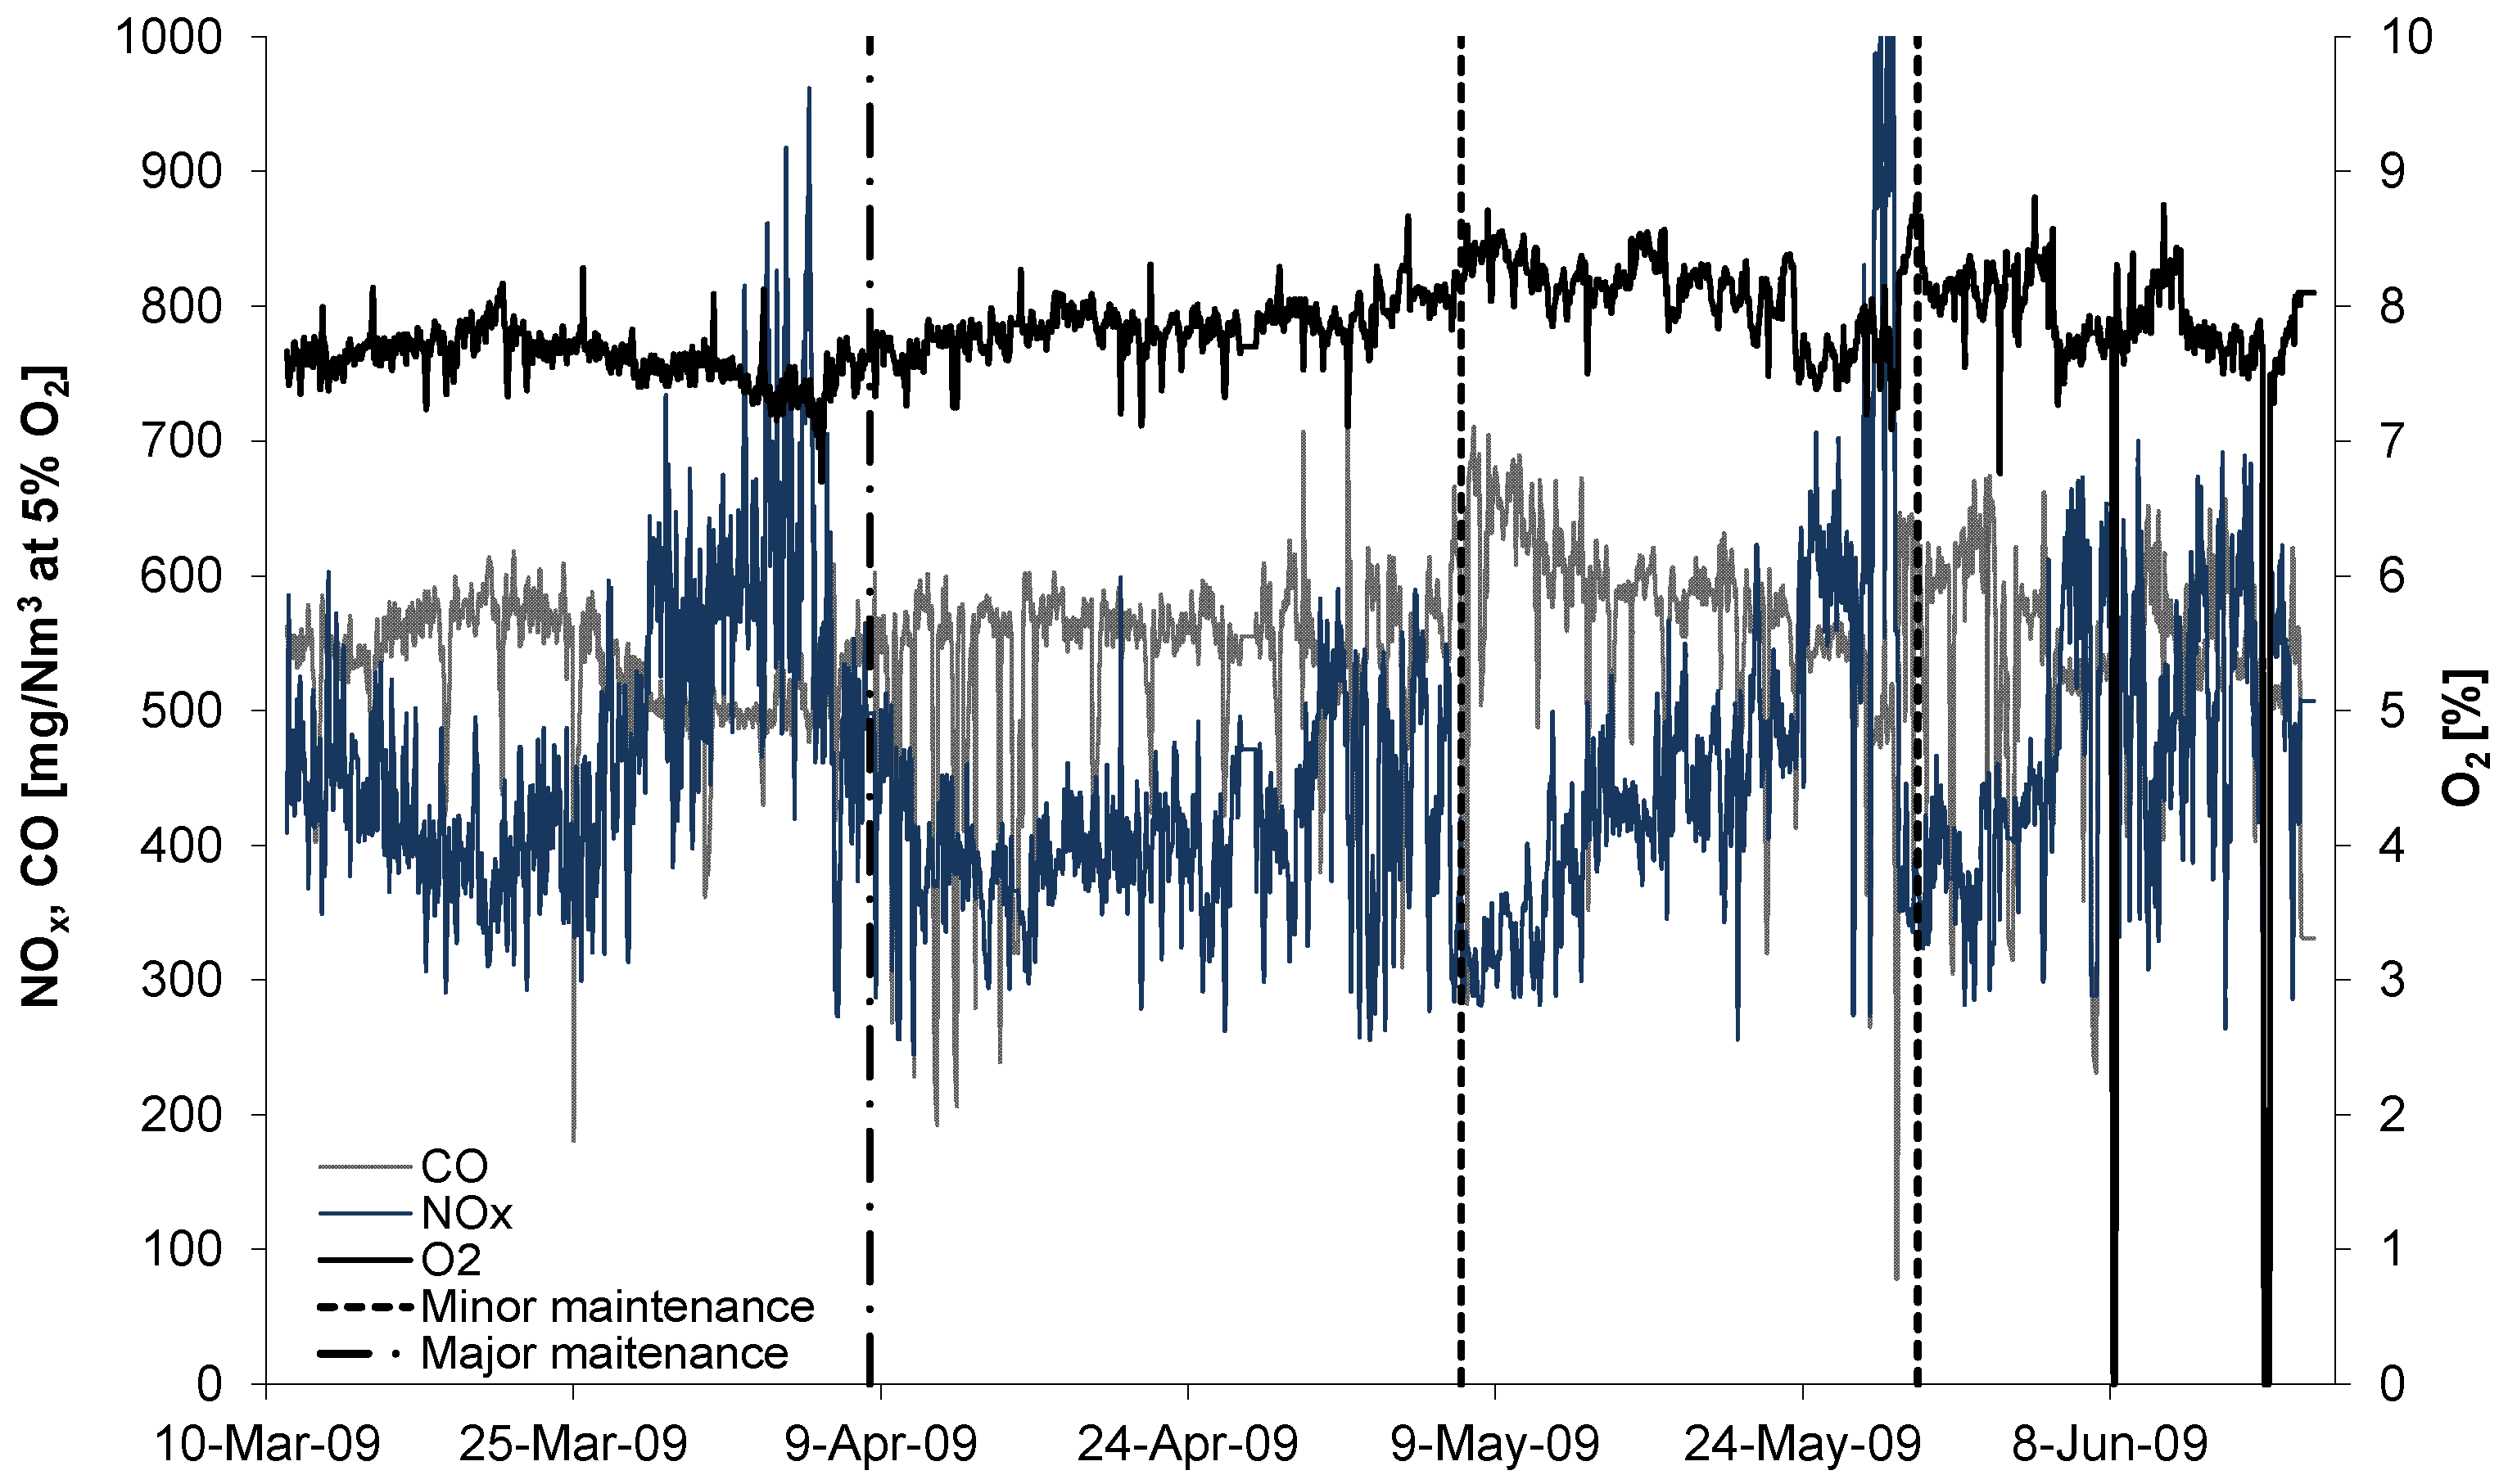
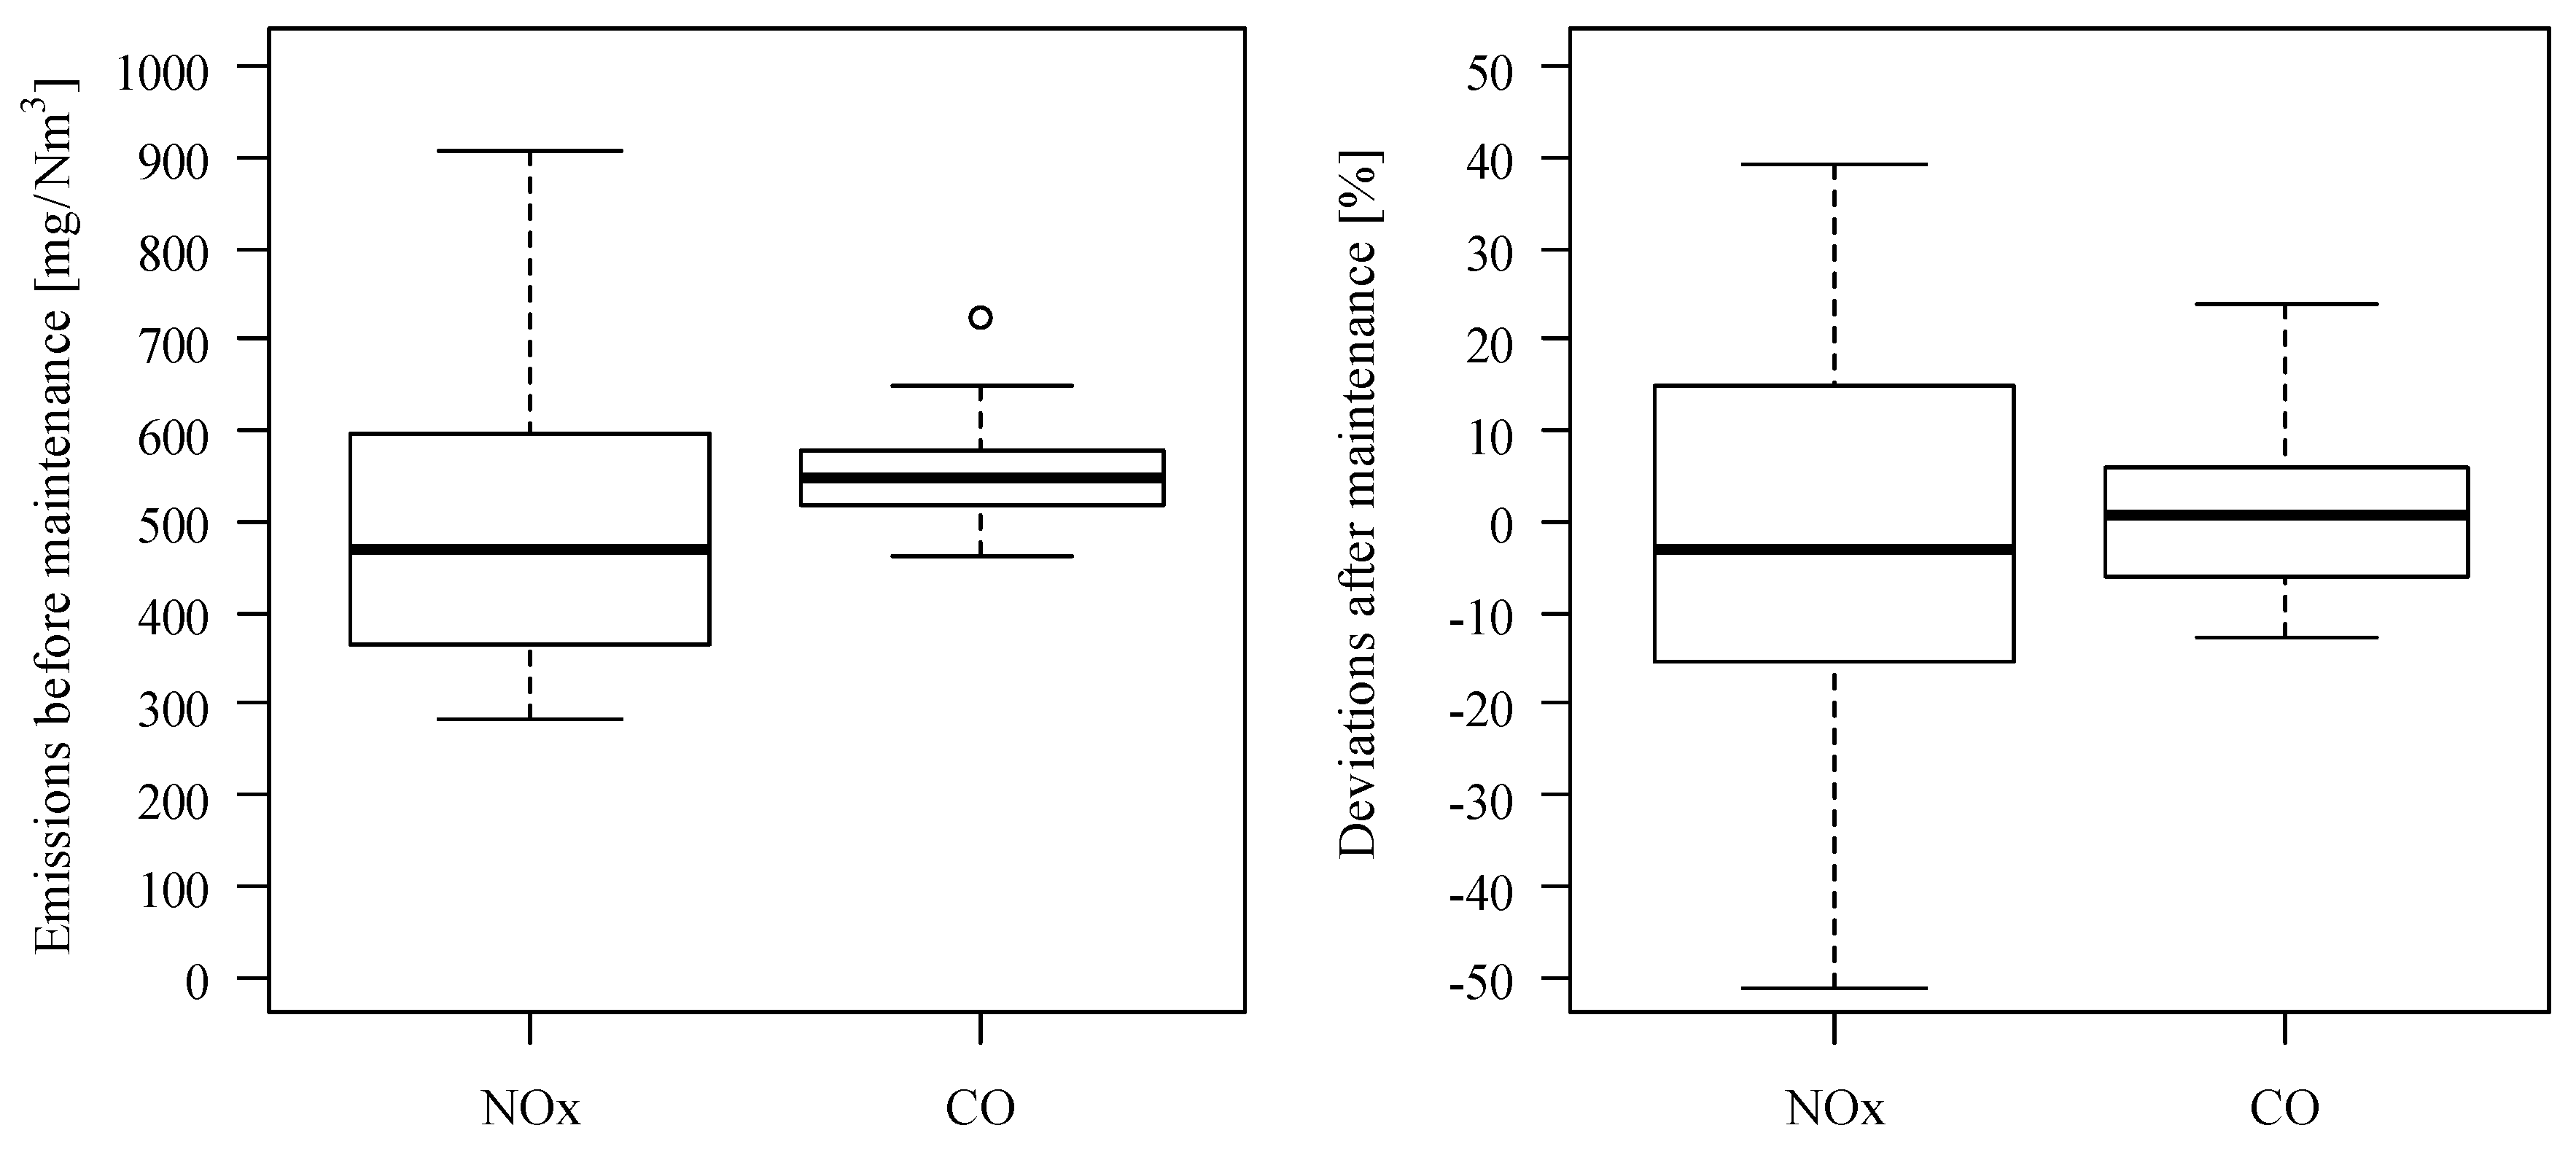
3. Results and Discussion
| Maintenance | Effects due to maintenance | ||
|---|---|---|---|
| Major/Minor | Concentration of NOx | Concentration of CO | Electrical efficiency |
| 8-Apr-09 | decrease (t) | increase (t) | ns |
| 7-May-09 | decrease | increase | decrease (PL) |
| 29-May-09 | decrease (t) | increase (t) | decrease (t) |
| 29-Jun-09 | nd | nd | constant |
| 27-Jul-09 | decrease | increase | decrease (little) |
| 20-Aug-09 | decrease (t) | increase (t) | ns |
| 23-Sep-09 | decrease | increase | nd |
| 14-Oct-09 | nd | nd | nd |
| 9-Nov-09 | constant | constant | nd |
| 3-Dec-09 | decrease (t) | increase (t) | nd |
| 22-Dec-09 | constant | constant | nd |
| 14-Jan-10 | increase | constant | nd |
| 3-Feb-10 | constant | constant | nd |
| 03-&04-Mar-10 | increase | constant | nd |
| 29-Mar-10 | constant | constant | nd |
| 29-Apr-10 | constant | constant | nd |
| 20-May-10 | constant | constant | increase (PL) |
| 15-Jun-10 | constant | constant | constant |
| 8-Jul-10 | decrease | increase | ns |
| 5-Aug-10 | constant | constant | increase |
| 1-Sep-10 | decrease (t) | constant | decrease (t) |
| 22-Sep-10 | constant | constant | constant (PL) |
| 20-Oct-10 | constant | constant | constant |
| 15-Nov-10 | constant | constant | constant |
| 3-Dec-10 | constant | constant | ns |
| 23-Dec-10 | constant | constant | ns |
| 24-Jan-11 | constant | constant | ns |
| 23-Feb-11 | decrease | increase | decrease |
| 22-Mar-11 | decrease | increase | decrease |
| 09-April-11(sp) | decrease | increase | decrease (little) |
| 15-Apr-11 | constant | constant | constant |
| 25-April-11(sp) | decrease | increase | ns |
| 9-May-11 | constant | constant | constant |
| 14-June-11 | nd | nd | constant (PL) |

| Number of analyses | 1 | 2 | 3 | 4 | 5 | 6 | 7 | 8 | 9 | 10 | 11 | 12 | |||
|---|---|---|---|---|---|---|---|---|---|---|---|---|---|---|---|
| Unit | Fresh oil values | Limiting values | |||||||||||||
| Date of laboratory analyses | – | – | – | 17-Apr-09 | 30-Jun-09 | 31-Aug-09 | 16-Nov-09 | 23-Dec-09 | 15-Feb-10 | 07-Dec-10 | 27-Jan-11 | 15-Apr-11 | 10-Jun-11 | 04-May-12 | 10-Aug-12 |
| Date of sample taking | – | – | – | 08-Apr-09 | 29-Jun-09 | 28-Aug-09 | 13-Nov-09 | 22-Dec-09 | 11-Feb-10 | 26-Nov-10 | 25-Jan-11 | 13-Apr-11 | 09-Jun-11 | 02-May-12 | 08-Aug-12 |
| Date of last oil change | – | – | – | – | – | – | – | – | – | 03-Mar-10 | 03-Mar-10 | 03-Mar-10 | 03-Mar-11 | 18-Jul-11 | 18-Jul-11 |
| Operation time since last oil change | h | – | – | 6,103 | 7,921 | 9,299 | 11,113 | 12,014 | 13,226 | 6,112 | 7,512 | 9,339 | 10,634 | 6,695 | 8,968 |
| Total CHP operation time | h | – | – | 6,103 | 7,921 | 9,299 | 11,113 | 12,014 | 13,226 | 19,775 | 21,175 | 23,002 | 24,297 | 31,913 | 34,186 |
| Oil change | – | – | – | No | No | No | No | No | No | Yes | No | No | No | Yes | No |
| Fresh oil supply | – | – | – | No | No | No | No | No | No | Yes | No | No | No | Yes | No |
| Wear | |||||||||||||||
| Iron | mg/kg | 0 | 21 | 3 | 2 | 2 | 3 | 3 | 3 | 2 | 2 | 2 | 3 | 2 | 3 |
| Chrome | mg/kg | 0 | 5 | 0 | 0 | 0 | 0 | 0 | 0 | 0 | 0 | 0 | 0 | 0 | 0 |
| Tin | mg/kg | 0 | 5 | 0 | 0 | 0 | 0 | 0 | 0 | 0 | 0 | 0 | 0 | 0 | 0 |
| Aluminium | mg/kg | 0 | 10 | 4 | 4 | 4 | 5 | 5 | 5 | 2 | 2 | 2 | 3 | 3 | 4 |
| Nickel | mg/kg | 0 | 3 | 0 | 0 | 0 | 0 | 0 | 0 | 0 | 0 | 0 | 0 | 0 | 0 |
| Copper | mg/kg | 0 | 15 | 3 | 4 | 5 | 7 | 7 | 8 | 2 | 2 | 2 | 4 | 2 | 3 |
| Leald | mg/kg | 0 | 20 | 1 | 0 | 1 | 0 | 1 | 1 | 0 | 0 | 0 | 1 | 0 | 0 |
| Molybdenum | mg/kg | 0 | 5 | 0 | 0 | 0 | 0 | 0 | 0 | 0 | 0 | 0 | 0 | 0 | 0 |
| PQ-Index | – | OK | – | OK | OK | OK | OK | OK | OK | OK | – | – | – | – | – |
| Soiling | |||||||||||||||
| Silicon/Dust | mg/kg | 7 | 4-7 | 2 | 2 | 2 | 2 | 2 | 1 | 2 | 3 | 3 | 4 | 2 | 3 |
| Potassium | mg/kg | 22 | 25 | 29 | 26 | 25 | 26 | 22 | 26 | 24 | 25 | 24 | 27 | 21 | 20 |
| Sodium | mg/kg | 3 | 28 | 1 | 2 | 2 | 3 | 1 | 4 | 5 | 6 | 5 | 4 | 9 | 6 |
| Water | % | 0.1 | 0.2 | 0.1 | 0.1 | 0.1 | 0.1 | 0.1 | 0.1 | 0.1 | 0.1 | 0.1 | 0.1 | 0.1 | 0.1 |
| Diesel fuel | % | 0 | 0 | 0 | 0 | 0 | 0 | 0,3 | 0 | 0 | 0 | 0 | 0 | 0 | |
| Biodiesel | % | 0 | 0 | 0 | 0 | 0 | 0 | 0,3 | 0 | 0 | 0 | 0 | 0 | 0 | |
| Vegetable oil | % | 0 | 0 | 0 | 0 | 0 | 0 | 1 | 0 | 0 | 0 | 0 | 0 | 0 | |
| Soot | % | 0.1 | 1.5 | 0.1 | 0.1 | 0.1 | 0.1 | 0.1 | 0.1 | 0.1 | 0.1 | 0.1 | 0.1 | 0.1 | 0.1 |
| Date of laboratory analyses | – | – | – | 17-Apr-09 | 30-Jun-09 | 31-Aug-09 | 16-Nov-09 | 23-Dec-09 | 15-Feb-10 | 07-Dec-10 | 27-Jan-11 | 15-Apr-11 | 10-Jun-11 | 04-May-12 | 10-Aug-12 |
| Date of sample taking | – | – | – | 08-Apr-09 | 29-Jun-09 | 28-Aug-09 | 13-Nov-09 | 22-Dec-09 | 11-Feb-10 | 26-Nov-10 | 25-Jan-11 | 13-Apr-11 | 09-Jun-11 | 02-May-12 | 08-Aug-12 |
| Date of last oil change | – | – | – | – | – | – | – | – | – | 03-Mar-10 | 03-Mar-10 | 03-Mar-10 | 03-Mar-11 | 18-Jul-11 | 18-Jul-11 |
| Operation time since last oil change | h | – | – | 6,103 | 7,921 | 9,299 | 11,113 | 12,014 | 13,226 | 6,112 | 7,512 | 9,339 | 10,634 | 6,695 | 8,968 |
| Total CHP operation time | h | – | – | 6,103 | 7,921 | 9,299 | 11,113 | 12,014 | 13,226 | 19,775 | 21,175 | 23,002 | 24,297 | 31,913 | 34,186 |
| Oil change | – | – | – | No | No | No | No | No | No | Yes | No | No | No | Yes | No |
| Fresh oil supply | – | – | – | No | No | No | No | No | No | Yes | No | No | No | Yes | No |
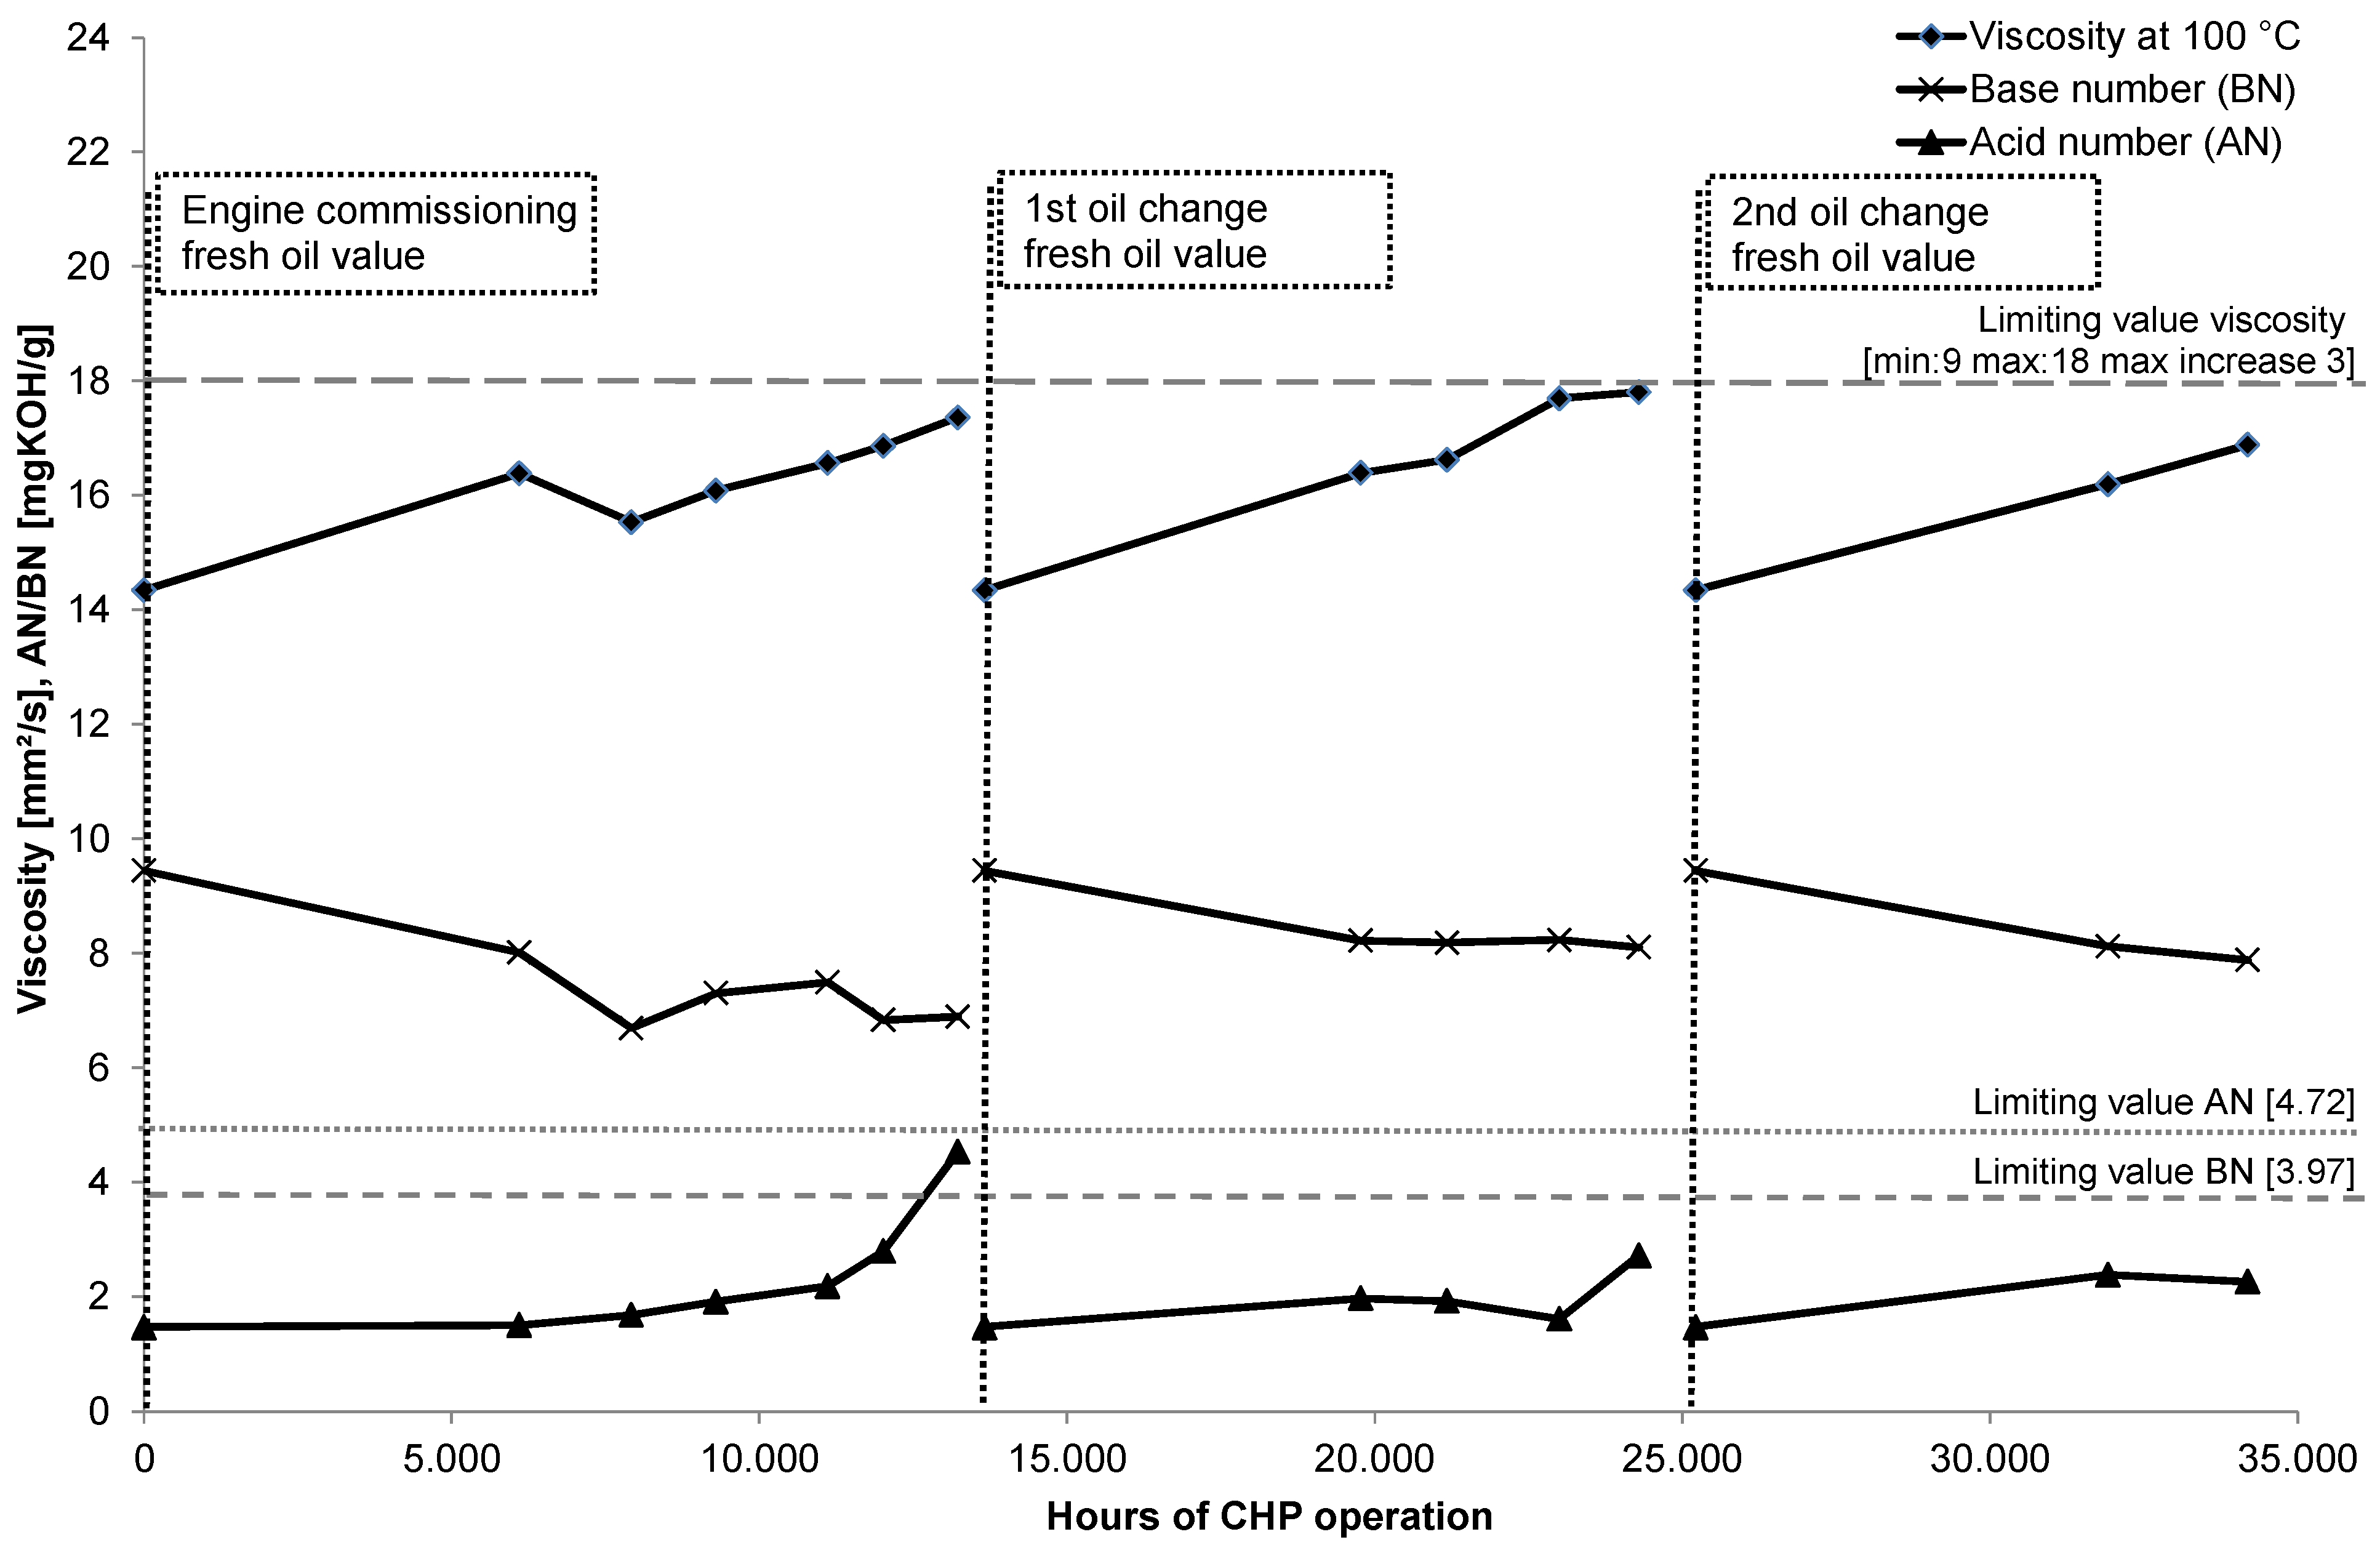
| Oil-condition | |||||||||||||||
| Viscosity at 40 °C | mm²/s | 134.33 | min 9; max 18 | 147.1 | 152.1 | 155.4 | 165.67 | 171.26 | 175.8 | 164.06 | 169.02 | 178.02 | 185.66 | 164.09 | 172.05 |
| Viscosity at 100 °C | mm²/s | 14.34 | 16.38 | 15.53 | 16.08 | 16.56 | 16.68 | 17.36 | 16.39 | 16.62 | 17.69 | 17.8 | 16.19 | 16.88 | |
| Viscosity index | 105 | max increase 3 | 118 | 104 | 108 | 105 | 104 | 106 | 105 | 103 | 108 | 104 | 102 | 104 | |
| Oxidation | A/cm | 0 | 20 | 12 | 15 | 14 | 15 | 21 | 18 | 9 | 14 | 18 | 18 | 16 | 10 |
| Nitration | A/cm | 0 | 20 | 1 | 1 | 1 | 2 | 1 | 1 | 1 | 1 | 1 | 1 | 1 | 1 |
| Sulfurization | A/cm | 0 | 25 | 0 | 0 | 0 | 3 | 0 | 0 | 0 | 0 | 0 | 0 | 0 | 0 |
| Phenolic anti-oxidant | % | 127.37 | – | 0 | 60.67 | 43.09 | 30.03 | 28.09 | 19.36 | 49.39 | 42.62 | 30.19 | 23.59 | 59.58 | 38.36 |
| Addivtives | |||||||||||||||
| Calcium | mg/kg | 2,594 | 2,075–3,112 | 2,515 | 2,416 | 2,397 | 2,549 | 2,498 | 2,517 | 2,530 | 2,767 | 2,841 | 3,147 | 2,813 | 2,995 |
| Magnesium | mg/kg | 1 | 0.8–1.2 | 3 | 3 | 2 | 3 | 3 | 2 | 0 | 3 | 3 | 5 | 6 | 7 |
| Boron | mg/kg | 1 | 0.8–1.2 | 1 | 1 | 0 | 1 | 1 | 1 | 1 | 1 | 1 | 1 | 2 | 2 |
| Zinc | mg/kg | 5 | 4–6 | 4 | 4 | 5 | 5 | 2 | 7 | 4 | 4 | 6 | 7 | 10 | 11 |
| Phosporus | mg/kg | 564 | 451–676 | 517 | 496 | 478 | 487 | 482 | 488 | 531 | 550 | 569 | 617 | 558 | 581 |
| Barium | mg/kg | 0 | 0 | 0 | 0 | 0 | 0 | 0 | 0 | 0 | 0 | 0 | 0 | 0 | 0 |
| Sulfat | mg/kg | 5,001 | 4,480 | 4,048 | 4,429 | 4,378 | 4,063 | 4,273 | 6,145 | 6,522 | 6,580 | 7,217 | 6,776 | 6,507 | |
| Additional tests | |||||||||||||||
| Base number (BN) | mgKOH/g | 9.44 | 4.72 | 8.01 | 6.69 | 7.3 | 7.49 | 6.83 | 6.89 | 8.22 | 8.18 | 8.23 | 8.1 | 8.12 | 7.88 |
| Acid number (AN) | mgKOH/g | 1.47 | 3.97 | 1.5 | 1.68 | 1.91 | 2.18 | 2.79 | 4.53 | 1.97 | 1.92 | 1.61 | 2.72 | 2.38 | 2.26 |
| i-pH-value | – | 6.67 | >4 | 5.96 | 4.76 | 5.08 | 5.27 | 4.74 | 4.99 | 5.66 | 5.77 | 5.53 | 5.28 | 5.67 | 5.88 |


4. Conclusions
Acknowledgments
Conflict of Interest
References
- Renewable Energy Technology Roadmap—20% by 2020; European Renewable Energy Council (EREC): Brussels, Belgium, 2008; Available online: http://www.erec.org/fileadmin/erec_docs/Documents/Publications/Renewable_Energy_Technology_Roadmap.pdf (accessed on 10 October 2012).
- Klimaziele im Blick. Available online: http://www.bundestag.de/dokumente/textarchiv/2010/29574565_kw18_sp_klimaschutzgesetz/index.html (accessed on 8 October 2012).
- Branchenzahlen 2011 und Branchenentwicklung 2012/2013. German Biogas Association: Freising, Germany, 2012. Available online: http://www.biogas.org/edcom/webfvb.nsf/id/DE_Branchenzahlen/$file/12-11-29_Biogas%20Branchenzahlen%202011-2012-2013.pdf (accessed on 14 December 2012).
- Wu, D.W.; Wang, R.Z. Combined cooling, heating and power: A review. Prog. Energy Combus. Sci. 2006, 32, 459–495. [Google Scholar] [CrossRef]
- Kazemi-Beydokhti, A.; Heris, S.Z. Thermal optimization of combined heat and power (CHP) systems using nanofluids. Energy 2012, 44, 241–247. [Google Scholar] [CrossRef]
- Aschmann, V.; Kissel, R.; Effenberger, M.; Eichelser, R.; Gronauer, A. Effizienzsteigerung, Emissionsminderung und CO2-Einsparung durch optimierte Motoreinstellungen bei Biogas-Blockheizkraftwerken zur dezentralen Stromversorgung [in German]; Bayerisches Landesamt für Umwelt (LfU): Augsburg, Germany, 2007; Available online: http://uok.bayern.de/portal/internalfile/download/EULV26_Endbericht_BHKW-Emis_1227178761128.pdf (accessed on 14 December 2012).
- Thomas, B.; Wyndorps, A. Efficiencies and emissions of a 192 kWel Otto engine CHP-unit running on biogas at the research station “Unterer Lindenhof”. Eng. Life Sci. 2012, 12, 306–312. [Google Scholar] [CrossRef]
- Aschmann, V.; Kissel, R.; Gronauer, A. Effizienz und Abgasverhalten von Biogasbetriebenen BHKW [in German]; Bayerische Landesanstalt für Landwirtschaft (LfL): Freising-Weihenstephan, Germany, 2007; Available online: http://www.biogas-infoboard.de/pdf/T-Band_Aschmann.pdf (accessed on 14 December 2012).
- Bauer, M.; Wachtmeister, G. Formaldehyd-Emissionen in Biogas-Verbrennungsmotoranlagen; Technische Universität München: München, Germany, 2010; Available online: http://www.lvk.mw.tum.de/download/lehrstuhl/Formaldehyd-Abschlussbericht_Teil_II.pdf (accessed on 16 December 2012).
- Ebertsch, G.; Fiedler, A. Formaldehyd im Abgas von Biogasmotoranlagen und Erdgas-Blockheizkraftwerken [in German]. Wasser Abfall 2010, 12/11, 14–20. [Google Scholar]
- Aschmann, V.; Kissel, R.; Gronauer, A. Umweltverträglichkeit biogasbetriebener Blockheizkraftwerke in der Praxis [in German]. Landtechnik 2008, 63, 77–79. [Google Scholar]
- Bayer. Landesamt für Umwelt (LfU). In Biogashandbuch Bayern-Materialienband [in German]; Kap. 2.2.2, Stand März 201; Bayerisches Landesamt für Umwelt (LfU): Augsburg, Germany, 2008; p. 13. [Google Scholar]
- Kampmann, H.J. Gas Otto-Motor oder Zündstrahl-Gas-Motor für Nutzungsmöglichkeiten und deren Einordnung. Available online: http://www.biogas-infoboard.de/pdf/H_Kampmann.pdf (accessed on 2 December 2012).
- Bundesministerium für Umwelt, Naturschutz und Reaktorsicherheit. In First General Administrative Regulation Pertaining the Federal Immission Control Act: Technical Instructions on Air Quality Control; Federal Ministry for Environment, Nature Conservation and Nuclear Safety: Berlin, Germany, 2002; pp. 96–98.
- IARC Classifies Formaldehyde as Carcinogenic to Humans; International Agency for Research on Cancer: Lyon, France, 2004; Available online: http://www.iarc.fr/en/media-centre/pr/2004/pr153.html (accessed on 27 November 2012).
- Neumann, T.; Hofmann, U. Studie zu Maßnahmen zur Minderung von Formaldehyd an mit Biogas betriebenen BHKW [in German]; Sächsisches Landesamt für Umwelt, Landwirtschaft und Geologie: Dresden, Germany, 2009; Available online: http://www.fif.mw.htw-dresden.de/forschung/Studie-Formaldehyd-BHKW.pdf (accessed on 5 October 2012).
- Moczigemba, T. Gerüche aus Abgasen bei Biogas-BHKW [in German]; Schriftenreihe des Sächsischen Landesamtes für Umwelt, Landwirtschaft und Geologie: Dresden, Germany, 2008; Available online: https://publikationen.sachsen.de/bdb/artikel/14910 (accessed on 5 October 2012).
- Gronauer, A.; Effenberger, M.; Kaiser, F.; Schlattmann, M. Biogasanlagen-Monitoring und Emissionsverhalten von Biogas-Blockheizkraftwerken—Abschlussbericht [in German]; Bayerische Landesanstalt für Landtechnik: Freising-Weihenstephan, Germany, 2003; Available online: http://www.lfu.bayern.de/energie/biogas/doc/biogasanlagen_monitoring.pdf (accessed on 10 December 2012).
- Aschmann, V.; Effenberger, M. Elektrische Wirkungsgrade von biogasbetriebenen BHKW [in German]. Landtechnik 2012, 2, 118–121. [Google Scholar]
- Effenberger, M. In vier Schritten die Schwächen aufdecken [in German]. Top Agrar 2012, 6, 8–11. [Google Scholar]
- Allianz Versicherungs AG (publ.). Bewertung des Gebrauchtölzustands von stationären Gasmotoren [in German]; Allianz Report für Risiko und Sicherheit: Allianz Versicherungs AG, Germany, 2004. [Google Scholar]
- Stationäre Gasmotoren—Beurteilung des Gebrauchtölzustands und Limitwerte [in German]; Oelcheck GmbH: Brannenburg, Germany, 2002; Available online: http://www.oelcheck.de/fileadmin/oelcheck/pdf/oelchecker/winter2002.pdf (accessed on 19 December 2012).
- Westner, G.; Madlener, R. The benefit of regional diversification of cogeneration investments in Europe: A mean-variance portfolio analysis. Energy Policy 2010, 38, 7911–7920. [Google Scholar] [CrossRef]
- Le Corre, O.; Saikaly, K.; Rosen, M.A. Effects on CHP plant efficiency of H2 production through partial oxydation of natural gas over two group VIII metal catalysts. Int. J. Hydrog. Energy 2012, 37, 10380–10389. [Google Scholar] [CrossRef]
- Mago, P.J.; Fumo, N.; Chamra, L.M. Performance analysis of CCHP and CHP systems operating following the thermal and electric load. Int. J. Energy Res. 2009, 33, 852–864. [Google Scholar] [CrossRef]
- Hinnells, M. Combined heat and power in industry and buildings. Energy Policy 2008, 36, 4522–4526. [Google Scholar] [CrossRef]
- Pourmovahed, A.; Opperman, T.; Lemke, B. Performance and Efficiency of a Biogas CHP System Utilizing a Stirling Engine. In Proceedings of International Conference on Renewable Energies and Power Quality, Las Palmas de Gran Canaria, Spain, 13–15 April 2011; Available online: http://www.icrepq.com/icrepq%2711/288-pourmovahed.pdf (accessed on 1 October 2012).
- Lemmer, A.; Bekker, M.; Oechsner, H.; Jungbluth, T. Forschungsbiogasanlage “Unterer Lindenhof” [in German]. Landtechnik 2008, 2, 80–81. [Google Scholar]
- Zacharias, F. Gasmotoren [in German]; Vogel-Verlag: Würzburg, Germany, 2001; p. 119. [Google Scholar]
© 2013 by the authors; licensee MDPI, Basel, Switzerland. This article is an open access article distributed under the terms and conditions of the Creative Commons Attribution license (http://creativecommons.org/licenses/by/3.0/).
Share and Cite
Naegele, H.-J.; Thomas, B.; Schrade, C.; Lemmer, A.; Oechsner, H.; Jungbluth, T. Influence of Maintenance Intervals on Performance and Emissions of a 192 kWel Biogas Gas Otto CHP Unit and Results of Lubricating Oil Quality Tests—Outcome from a Continuous Two-Year Measuring Campaign. Energies 2013, 6, 2819-2839. https://doi.org/10.3390/en6062819
Naegele H-J, Thomas B, Schrade C, Lemmer A, Oechsner H, Jungbluth T. Influence of Maintenance Intervals on Performance and Emissions of a 192 kWel Biogas Gas Otto CHP Unit and Results of Lubricating Oil Quality Tests—Outcome from a Continuous Two-Year Measuring Campaign. Energies. 2013; 6(6):2819-2839. https://doi.org/10.3390/en6062819
Chicago/Turabian StyleNaegele, Hans-Joachim, Bernd Thomas, Christine Schrade, Andreas Lemmer, Hans Oechsner, and Thomas Jungbluth. 2013. "Influence of Maintenance Intervals on Performance and Emissions of a 192 kWel Biogas Gas Otto CHP Unit and Results of Lubricating Oil Quality Tests—Outcome from a Continuous Two-Year Measuring Campaign" Energies 6, no. 6: 2819-2839. https://doi.org/10.3390/en6062819
APA StyleNaegele, H.-J., Thomas, B., Schrade, C., Lemmer, A., Oechsner, H., & Jungbluth, T. (2013). Influence of Maintenance Intervals on Performance and Emissions of a 192 kWel Biogas Gas Otto CHP Unit and Results of Lubricating Oil Quality Tests—Outcome from a Continuous Two-Year Measuring Campaign. Energies, 6(6), 2819-2839. https://doi.org/10.3390/en6062819