1. Introduction
The Wave Dragon is a floating, offshore Wave Energy Converter (WEC) of the overtopping type. Incoming waves are focused by two wing reflectors towards a doubly-curved ramp, by which they surge up into a reservoir placed above the mean water level. The power production takes place as the stored water is led back to the sea through a set of low-head hydro-turbines coupled to permanent magnet generators (
Figure 1). A commercial Wave Dragon unit suitable for North Sea conditions (yearly average wave power of 24 kW/m) is a 22,000 t reinforced concrete structure, occupying an area of around 150 m × 260 m. With 4 MW installed power, it can produce up to 12 GWh/year.
Figure 1.
Working principle of the Wave Dragon wave energy converter.
Figure 1.
Working principle of the Wave Dragon wave energy converter.
Wave Dragon has been developed during more than 20 years, following a Technology Readiness Assessment approach in which each new phase of development is justified by the good results achieved in the previous one, allowing a rational allocation of resources in the process.
The related research and development has been mainly carried out through physical tests, due to the geometrical complexity of the device, which made it difficult to establish reliable
ad hoc numerical models. Since the early phases the development of Wave Dragon, including proof of concept, geometry optimization, hydrodynamic characterization and preliminary power production assessment, were mainly based on wave tank testing of a 1:51.8 scale model [
1].
Based on these experimental results, in 2003 a 1:4.5 scale prototype was built and tested in Nissum Bredning, a benign location in Northern Denmark. The extended sea trials program allowed acquiring valuable operational experience in many aspects, as well as validating the analytical models resulting from the previous development phase and testing the power take-off (PTO) system and control strategy [
2].
Following the positive results of the prototype sea trials, Wave Dragon is currently being up-scaled to commercial size. With regard to this, the structural design of a 1.5 MW pre-commercial demonstrator unit to be deployed at the DanWEC test site in Hanstholm, Northern Denmark, [
3] is being carried out together with the related feasibility analysis. Respect to a 4 MW North Sea Wave Dragon the scale of the envisaged unit is 1:1.5. The up-scaling is largely based on the measurement campaign carried out on the prototype during the sea trials and experimental data acquired in previous phases of development. Features of the demonstrator are summarized in
Table 1.
Table 1.
Features of Wave Dragon DanWEC demonstrator.
Table 1.
Features of Wave Dragon DanWEC demonstrator.
| Weight | 6500 t |
| Platform dimensions | 76 m × 50 m |
| Reflector length | 84 m |
| Wingspan of reflectors | 170 m |
| Height | 12 m |
| Max crest level above MWL | approx. 3 m |
| Reservoir volume | approx. 1400 m3 |
| Average wave power resource | 6 kW/m |
| Water depth | 30 m |
| Rated power | 1.5 MW |
| Average Yearly Power Production | 2 GWh |
1.1. Wave Dragon Mooring System
For floating WECs a very important part of the design process deals with the mooring system. Overall, it has been estimated that moorings can contribute up to roughly 20% to the total cost of a WEC installation, compared to a few percent as it is in the case of traditional offshore structures [
4]. On the other hand WECs require lower safety factors. Overall, the need to explore solutions allowing for a cost-reduction of the mooring system respect to traditional offshore structures emerges as a priority in the design of any floating WEC.
Besides this, mooring systems can affect many WECs also in terms of power production. In the case of wave activated bodies in fact, the mooring system normally provides both a constraint and a reaction force to the motion of the body, which has to be taken into account in the control optimization and may even be used to improve the response of the WEC for the sake of power production. In these cases an integrated design procedure taking into account the mooring system should be adopted already in the early phases of development [
5].
In the case of Wave Dragon though, the power extraction mechanism is mostly independent of the hydrodynamic response to waves, hence stability is desirable rather than resonance. Due to this, the sole aim of the mooring system is station keeping and to reduce peak loads in the mooring lines and on the structure, hence reducing the design requirements. In this case, and given the large dimensions of the system, an efficient mooring design should provide enough compliance to reduce the second order wave forces on the structure, which are expected to be the main mooring loads.
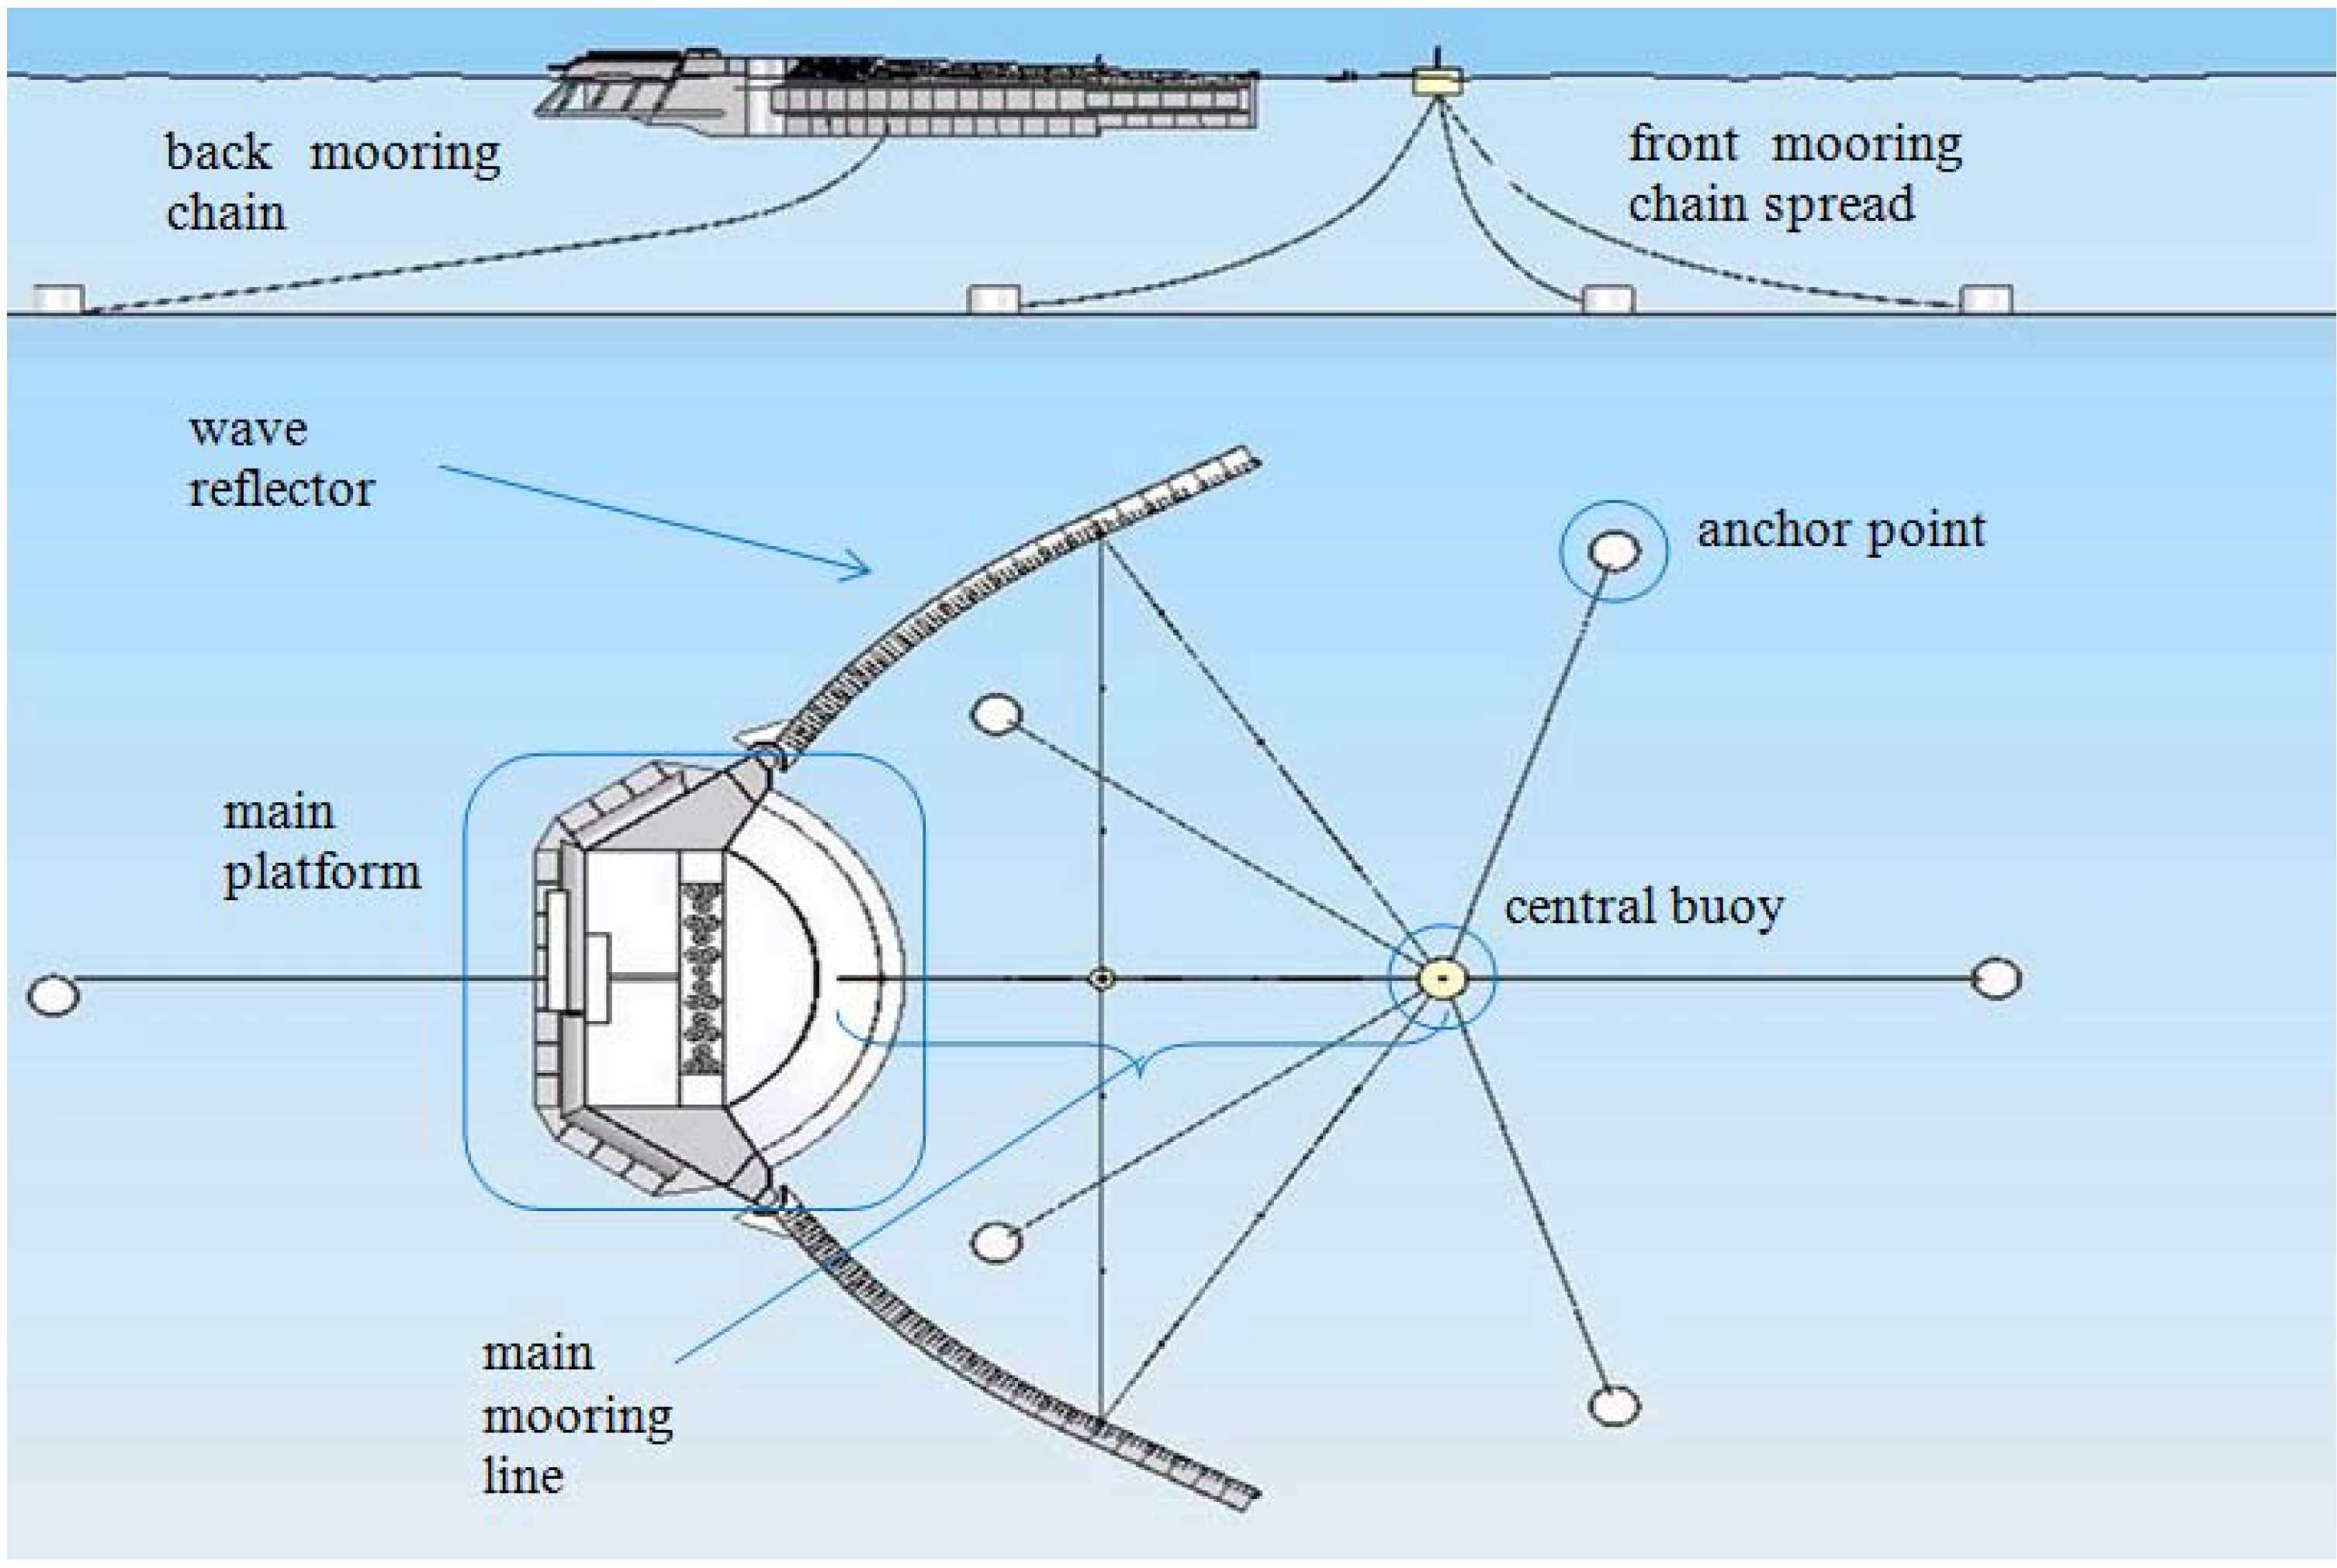
The conceptual mooring system proposed for Wave Dragon is a circular spread of slack chains anchored to a central CALM (Catenary Anchor Leg Mooring) buoy, to which the main platform and wave reflectors are connected (
Figure 2). This system allows de-coupling the vertical motions of Wave Dragon, which are actively controlled to optimize the power production, from the other modes of motions, which are restrained by the mooring system instead. The catenary solution is a well-known technology capable of absorbing peak loads, hence well suited for a large floating structure such as Wave Dragon. Other elements of the mooring system are an additional rear mooring line to prevent excessive rotations and cables preventing the reflectors from opening or closing too much.
Figure 2.
Conceptual mooring system of Wave Dragon.
Figure 2.
Conceptual mooring system of Wave Dragon.
Within the structural design of the Wave Dragon demonstrator for the DanWEC test site (WD-DanWEC), this generic layout is being adapted to the local conditions of deployment and a detailed mooring system has to be designed. Although being a site-specific solution, the results will also provide a sound basis for a mooring system design suitable for future deployments, since this is not expected to change substantially.
1.2. Background to this Study
1.2.1. Assessment of the Survivability Mode
In November 2010, the 1:51.8 scale model of a North Sea Wave Dragon was tested at the Hydraulic and Coastal Laboratories of Aalborg University (AAU), in order to assess the effectiveness a control strategy to be used in extreme storm conditions, aimed at reducing design loads on the structure and mooring system rather than power production optimization. This strategy is referred to as the survivability mode, consisting in lowering the floating level of the device to its minimum so that a large part of the wave energy overtops and passes over the device to the lee side. Moreover, as wave pressure decrease with the water depth, by floating in a lower position the device is exposed to lower wave-induced forces in the first place.
Results showed that by adopting such a survivability mode, extreme forces in the main mooring line can be reduced in the order of 20%. A correct floating position has also shown to be relevant for the force-reduction, as by ensuring the device is not trimmed to the back extreme loads could also be reduced by a similar percentage [
6].
1.2.2. Numerical Model for the Mooring Design
As described above, the conceptual mooring system of Wave Dragon is such that the device is connected through what is normally referred to as the “main mooring line” to a CALM buoy, which is then anchored to the sea bottom. We can refer to the CALM buoy + anchoring system as the “external components” of the mooring system. The anchoring system is, in its simplest conception, a circular spread of slack chains, but more complex systems shall be analyzed and alternative configurations assessed, in order to identify those ones allowing for a reduction in capital cost and well suitable to the local conditions. Typically a combination of chains and cables shall be considered, as well as the introduction of buoys and clump weights in the anchoring system.
Unlike with other components, mooring design cannot be based on direct experience, as both during the tank testing and the prototype trials in Nissum Bredning the relatively shallow waters did not allow a proper catenary system to be tested. In these cases the main mooring line was connected to a vertical pile instead. Therefore the mooring design for WD-DanWEC has to be carried out numerically.
The numerical model used is implemented within the software SESAM, allowing for panel model design through GeniE [
7], its hydrodynamic analysis through HydroD [
8] and the time-domain analysis of the composite system in DeepC [
9]. In autumn 2011 this numerical model has been used to perform a hydrodynamic characterization of Wave Dragon, using the experimental response data about motions and tension in the main mooring line obtained in the above mentioned tank tests to estimate the surge drag coefficient of the device. The study has been conducted in cooperation with the Centre of Ships and Oceanic Structures (CeSOS) at the Norwegian University of Science and Technology [
10]. The hydrodynamic parameters determined will be used in future to characterize an updated panel model more similar to the envisaged WD-DanWEC unit, allowing to assess alternative configurations of the external mooring system through time-domain analysis.
1.3. Experimental Assessment of Extreme Response and Force-Reduction Strategies
As previously discussed, it is deemed wise not to fully base the design procedure on the numerical analyses, as the geometrical complexity of the device makes the numerical modeling quite challenging. Therefore the numerical simulations will be targeted and calibrated on the results from the tank testing of a new physical model of Wave Dragon, at the scale of 1:50 respect to WD-DanWEC and geometrically more similar to it, especially with regard to the distribution of the buoyant elements of the platform.
The tests were aimed at assessing the response of the system to extreme waves typical of the DanWEC location. Extreme motions and tension in the main mooring line were recorded and the Force-Displacement (F-D) curves describing the compliance of the system in surge were derived for the cases tested. Sensitivity analyses were performed based on the mooring stiffness, in order to assess the effect of the system compliance on the extreme mooring tension, as well as on the incident wave steepness.
The objective was to quantify the extreme response magnitude of the system and to determine which strategy would be more effective in lowering the design loads in the main mooring line, reducing the capital cost of the project. The rationale was to assess this by providing surge natural frequencies of oscillation progressively outside the range of the second order wave forces. As expected, the more compliant the system the higher force-reduction could be achieved. Confirming previous findings this can be partly achieved also through the adoption of the survivability mode, although to a lower extent and just in cases of stiff mooring system.
The force-displacement (F-D) curve allowing for the lowest design loads in the main mooring line will be used as target in the numerical simulations, with the goal of reproducing it through alternative mooring configurations. The most economically convenient will then be considered as viable options, and experimentally assessed through further tank testing before the final configuration is chosen.
1.4. Content of the Paper
This paper presents the results of tank tests carried out in spring 2012 on a new 1:50 model of the WD-DanWEC at AAU. The setup of the tests and the data analysis procedure is first described. Results on motions and mooring tension response to extreme storm conditions typical of Hanstholm are then presented, together with the F-D curves describing the behavior of the system in the tested conditions. A detailed discussion on the results is then carried out, highlighting the most convenient configurations to be represented and tested numerically and the relevance of the different parameters considered throughout the study. Finally, main conclusions are drawn and further work outlined as required by the mooring design process.
2. Experimental Setup and Method
The new physical model tested is at 1:50 scale of the North Sea demonstrator, being 75 times smaller than a North Sea unit (
Figure 3). This is roughly 1.5 times smaller than the one previously used, allowing to decrease the undesired reflection effects in the AAU basin and the testing of larger waves and water depths.
The wave basin at AAU is a concrete tank with the dimensions 15.7 m × 8.5 m × 1.5 m. The paddle system is a piston type enabling generation of irregular waves. The wave generation software used for controlling the paddle system is Awasys, developed by AAU. On the opposite side of the basin an absorbing beach is placed to reduce the reflection of the waves. The data acquisition and analysis is performed through the software Wavelab 3, also developed by AAU. Data handling and analysis is complemented through either custom made or already available Matlab routines [
11].
Where not in a non-dimensional form or expressly else stated, results are presented at the model scale. They can be up-scaled using Froude scaling law as a geometrical, kinematic and dynamic similitude is maintained between the model and WD-DanWEC.
The floating level of the platform is described by the elevation of the ramp crest freeboard above the still water level,
Rc (m), which is influenced by the floating stability (heel and trim). At full-scale the mean position is set to the horizontal and maintained through active buoyancy control; during the tests the model was set horizontal in its static configuration and the target
Rc varied throughout the study by varying the air pressure in the chambers below the platform. The model has various air chambers, allowing for the control of floating position and stability. The tested setup is shown in
Figure 3; details about instrumentation and mooring components will be described in the following sections.
In operational conditions the Rc would be adapted to the incoming significant wave height, Hm0 (m) as derived from a frequency domain analysis, in order to have values of the non-dimensional crest level R(-) = Rc/Hm0 in between 0.5 and 1.5 as suitable to maximize the power production. In extreme conditions though, R should be kept as low as possible to let the waves pass over the WD, reducing the portion of the incoming wave energy interacting with the device and resulting in lower loads on the structure and in the mooring lines.
Figure 3.
Experimental setup of the 1:50 scale model tests of the North Sea Wave Dragon demonstrator (wave maker is on the left).
Figure 3.
Experimental setup of the 1:50 scale model tests of the North Sea Wave Dragon demonstrator (wave maker is on the left).
In these tests three different values of
Rc have been considered. They correspond to the operational highest and lowest values, plus one representing the survivability mode which corresponds to the lowest
Rc together with the reservoir full of water (
Table 2).
With respect to the previous physical model, a novel feature of interest is the joint connection between the reflectors and the main platform. Instead of using a ball joint, here a rotation hinge is adopted. In this way that motions of the reflectors in roll are avoided, while those in yaw and pitch are naturally limited by the reflectors own buoyancy.
Table 2.
Crest levels used in the tests.
Table 2.
Crest levels used in the tests.
| Rc | High | Low | Survivability mode |
|---|
| model scale (m) | 0.053 | 0.013 | 0.007 |
| WD-DanWEC scale (m) | 2.65 | 0.65 | 0.35 |
2.1. Mooring System
The conceptual mooring system described in
Section 1 is modeled according to the following rationale:
- •
Considering the external components of the Wave Dragon mooring system, their individual response to waves is non-linear, but when combined together one can assume the F-D curve of the resulting system to be linear.
- •
The main mooring line will have a very high stiffness and will be constantly tensioned during operational and especially extreme conditions.
Therefore the stiffness of the whole mooring system is determined by the composite stiffness of the external components. One can then reasonably model the whole mooring system through a linear spring, the stiffness being chosen conveniently to determine acceptable levels in the extreme mooring tension. As shown in
Figure 3 the modeled mooring system is therefore composed by three main elements:
Main mooring line (shown in red): modeled through a nylon rope on which is inserted a piece of rubber line calibrated to reproduce the desired stiffness. The elasticity of the nylon rope is considered negligible compared to the one of the rubber element. The line is directly attached to the force transducer measuring the tension.
Inner mooring system (shown in blue): composed by a central polystyrene buoy, to which the main mooring line and other steel wires are attached. The steel wires include two wires attached to the ramp of the platform and two wires attached to each reflector. At the middle point of the latter two 0.5 kg clump weights are attached in order to provide some pre-tension to the system and limit the opening of the reflectors during the tests. The steel wires are assumed to have infinite stiffness and are constantly tensioned during the tests.
Two back mooring lines (shown in green): these are used for the purpose of keeping the model in position in the intervals between two tests, when there are no waves. They are thin rubber lines with very low stiffness (around 20 N/m) anchored to the bottom and placed symmetrically to the longitudinal centreline. They become slack during the tests and add very little pre-tension to the system (in average around 5 N).
The stiffness of the main mooring line,
k (N/m), is modeled in order to provide the system composed by Wave Dragon and moorings with different surge natural period (
Ts), according to:
being
m the mass of the device and
Ma,0 the surge added mass when frequency is approaching 0 rad/s. The model mass is 52.32 kg, while
Ma,0 varies with the draft of the device. Its value has been derived through the hydrodynamic analysis in frequency domain of the device [
10], being very similar in the cases of
Rc low and
Rc survival (respectively 49.5 kg and 48.3 kg at model scale) while for
Rc high it is much lower (18.7 kg).
Ts depends therefore both on the mooring stiffness,
k, and on the floating level of the device, through
Ma,0.
The larger Ts becomes, the more likely it is that the second order wave forces—which are expected to be the main responsible for the extreme response in surge and mooring tension—do not act at the surge natural frequency of the system. This substantially reduces the extreme mooring tension, especially in larger waves. In other words the more compliant the mooring system is, or the lower the Rc, the lower the mooring tension is expected to be.
Mooring Lines Calibration
Three different values of k were tested, modeled in all cases through rubber lines. The stiffness values used were meant to determine at WD-DanWEC scale, in survivability conditions, Ts respectively in the order of 100, 50 s and an intermediate one. The springs used are referred to in the following as k strong, k mid and k soft.
The springs have been calibrated with dynamic loading, similarly to what happens in irregular waves. The stiffness was derived as gain of the linear trend-line fitting the resulting calibration curve. Hysteresis cycles appear in the calibration curves, due to the viscoelastic behavior of the material of the lines. More on this will be discussed in
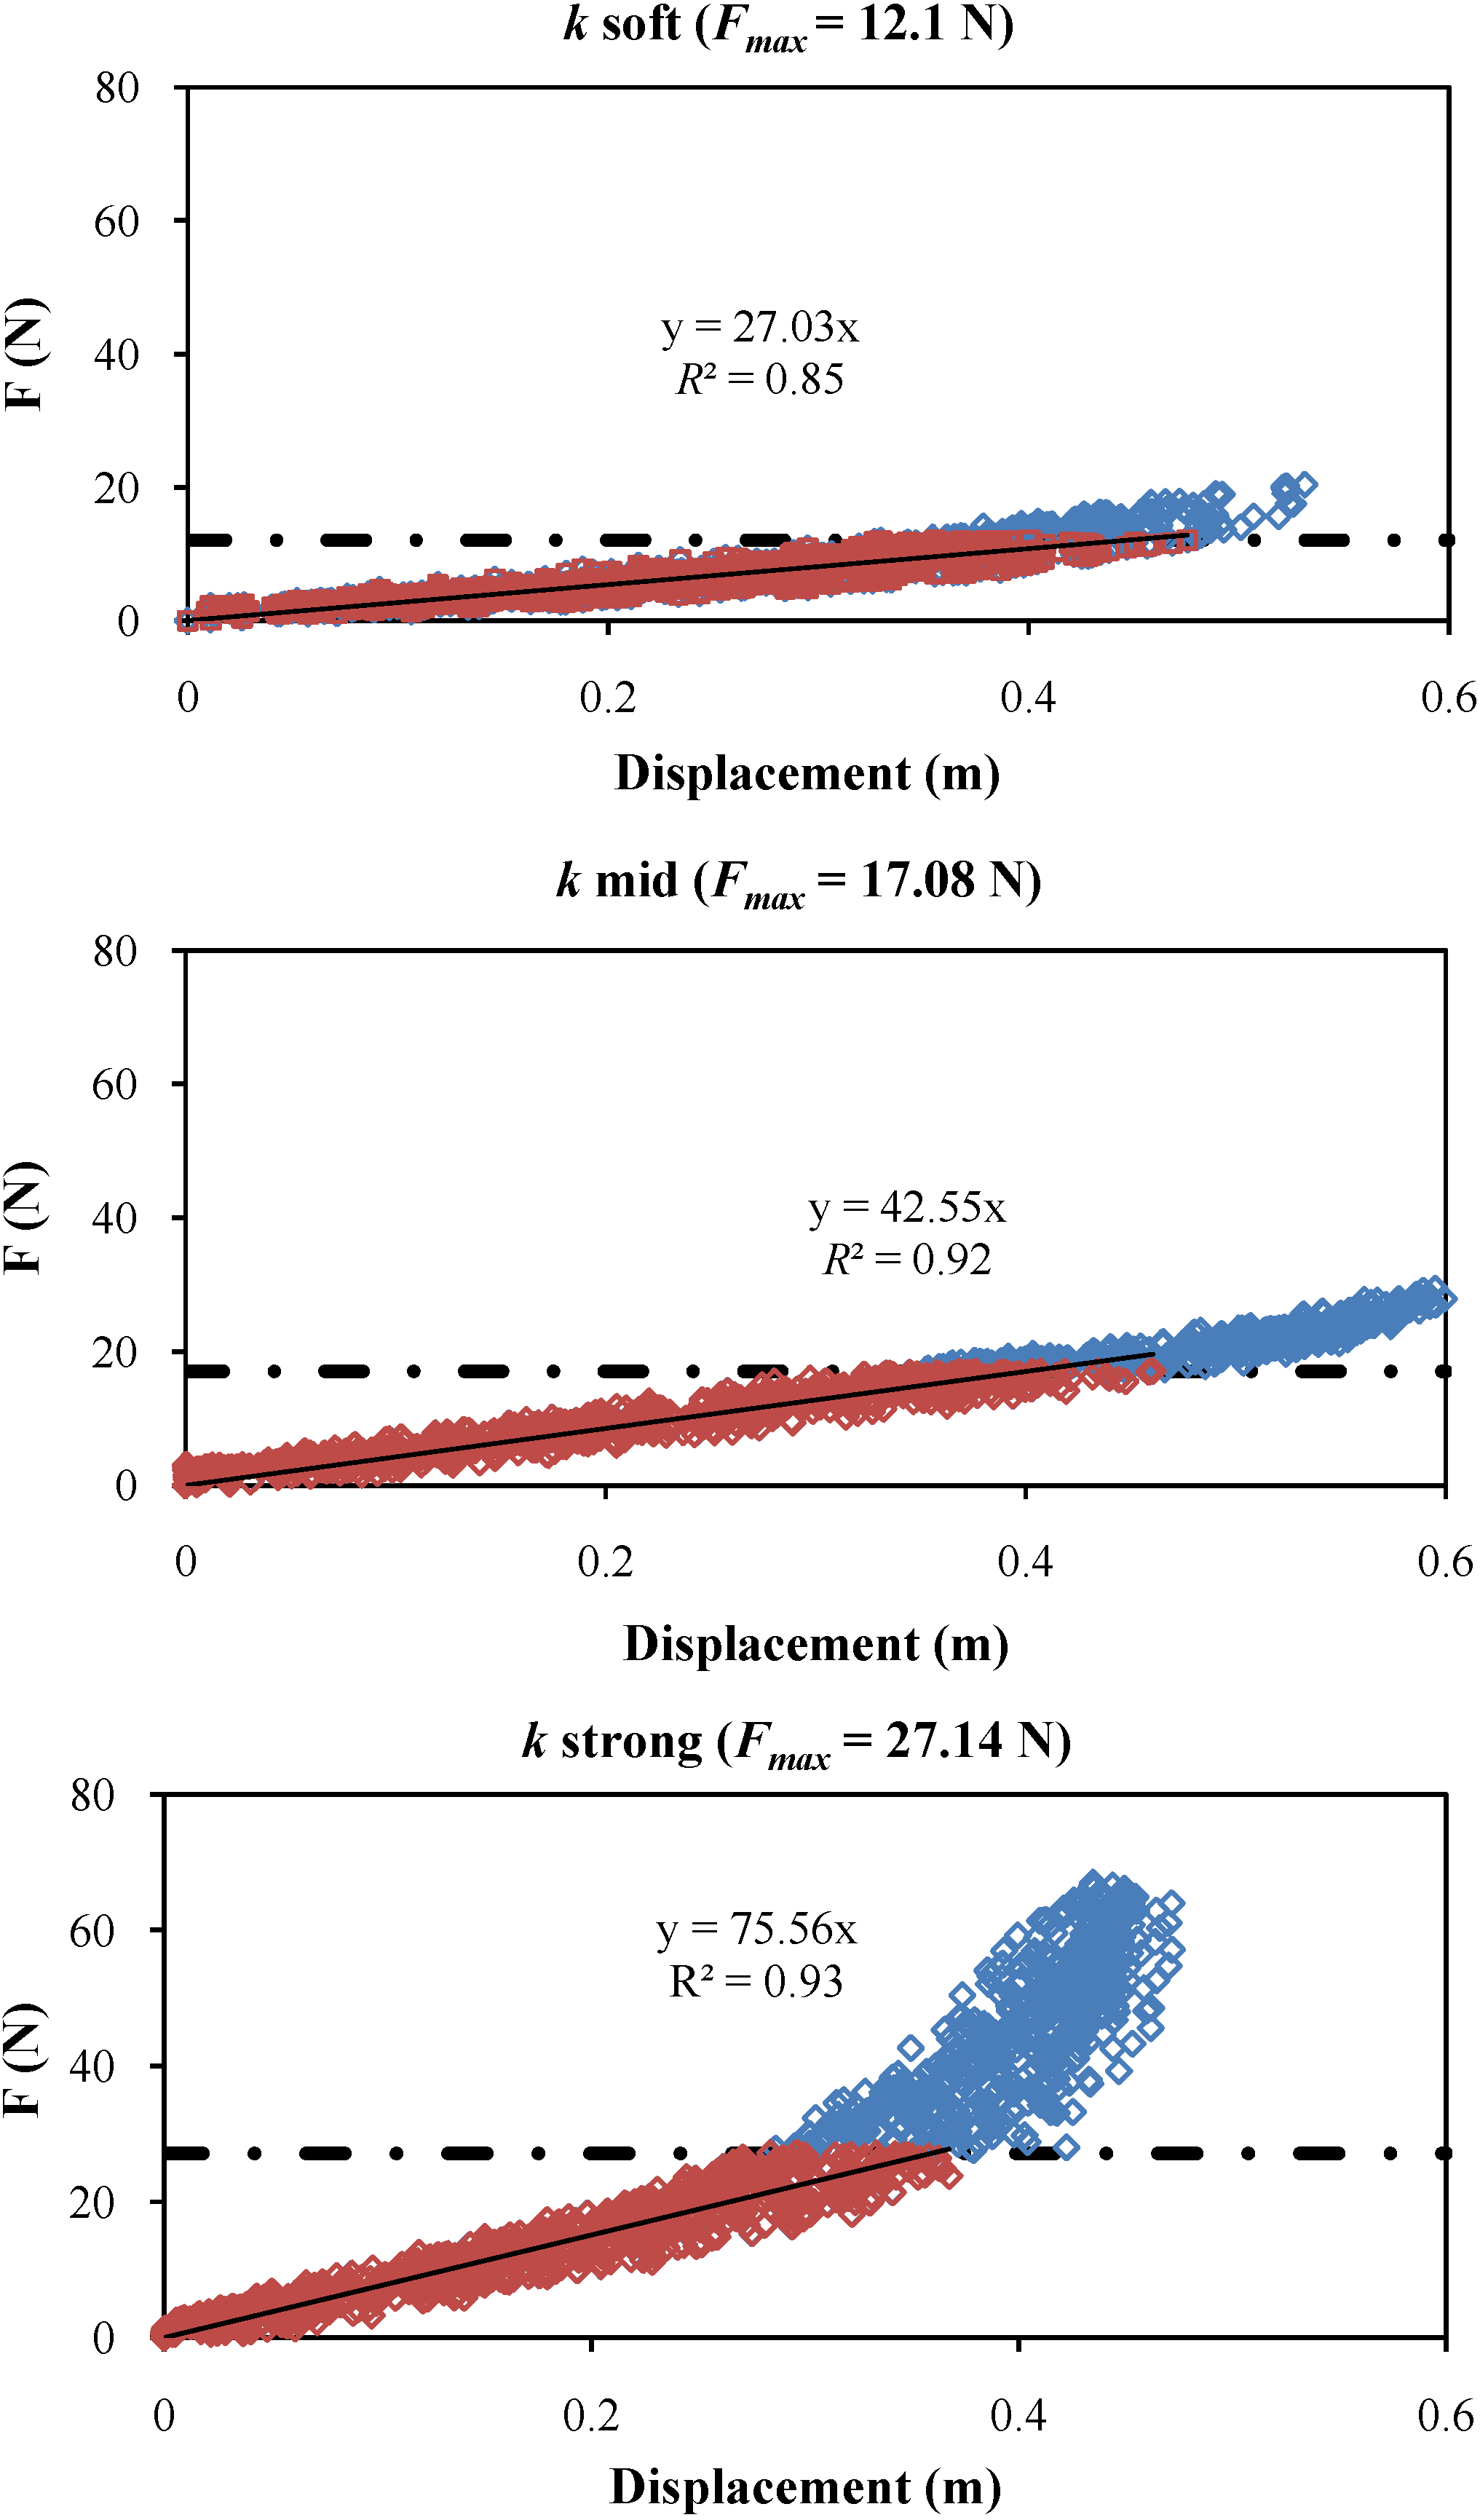
Section 4.1. It was also observed that the response of the springs start to become non-linear above a certain tension threshold, especially in the case of the most rigid one. As during the tests the non-linear range of tensions was never reached though, the mooring stiffness has been safely referred to the gain provided by the linear interpolation of the calibration curve limited to the range of tensions experienced, as shown in
Figure 4. Here all data available are shown in blue, while data relative to the tension range experienced during the tests (including pre-tension) are shown in red; the linear trend-line of the latter is shown, with the corresponding fitting equation and correlation coefficient; maximum tension experienced is shown as black line-dotted line.
Figure 4.
Calibration curves for the three springs used, in dynamic loading conditions.
Figure 4.
Calibration curves for the three springs used, in dynamic loading conditions.
These values have been confirmed by the F-D curve obtained in irregular waves, as shown in
Section 3.4. To distinguish between the two, the former—derived from the calibration—are referred to as “target” stiffness, the latter—experienced during the test—as “actual” stiffness. However, given their similarity, in the data analysis the mooring lines will be simply referred to as strong, mid or soft. Details on target and actual values of the mooring stiffness and the relative
Ts allowed are resumed in
Table 3.
Table 3.
Features of the spring used to model the main mooring line, for which target and actual values are reported. k (N/m) is the spring stiffness, Ts (s) is the surge natural period.
Table 3.
Features of the spring used to model the main mooring line, for which target and actual values are reported. k (N/m) is the spring stiffness, Ts (s) is the surge natural period.
| | Target k (N/m) | Actual k (N/m) | High Rc | Low/survival Rc |
|---|
| Target Ts (s) | Actual Ts (s) | Target Ts (s) | Actual Ts (s) |
|---|
| Model scale |
| k soft | 27.0 | 26.8 | 10.2 | 10.2 | 12.2 | 12.2 |
| k mid | 42.6 | 43.3 | 8.1 | 8.1 | 9.7 | 9.6 |
| k strong | 75.6 | 79.9 | 6.1 | 5.9 | 7.3 | 7.1 |
| WD-DanWEC scale |
| k soft | 6.76 × 10⁴ | 6.71 × 10⁴ | 72.2 | 72.4 | 86.0 | 86.4 |
| k mid | 1.06 × 10⁵ | 1.08 × 10⁵ | 57.5 | 57.0 | 68.6 | 68.0 |
| k strong | 1.89 × 10⁵ | 2.00 × 10⁵ | 43.2 | 42.0 | 51.4 | 50.0 |
2.2. Measuring System
Instrumentation used is highlighted in
Figure 3. The tension in the mooring lines has been measured by a Force Transducers (FT) to which this was directly attached. The FT was amplified 230 times and then low-passed at 8 Hz. A 2D array of seven Wave Gauges (WGs) placed in front of the model has been used to record the wave field and allow for a 3D wave analysis. Motions in the six Degrees of Freedom (DoF) have been measured using an Inertial Measurement Unit, called the MTi, which was placed on the platform of the model, at the back of the centerline. All signals are acquired at a sampling frequency of 25 Hz.
In the data analysis the motions considered have been surge, X (m), heave, Z (m), and pitch, θ (°). Surge is assumed positive in the wave direction, heave upwards and pitch as the model is tilted to the back. Motions were provided in the local reference system consistent with the wave basin orientation.
The MTi is provided with three accelerometers recording accelerations in the three directions, as well as with three gyroscopes recording angular velocity in three directions [
12]. The managing software of the MTi derives Euler angles of rotation (roll, pitch, yaw), while displacements in surge, sway and heave have to be derived by doubly integrating the acceleration time series. In this process the signals had to be low-passed filtered to remove noise and high-passed filtered to remove the drift deriving from the integration constants. The latter (with a cutoff frequency of 0.1 Hz) was problematic in the case of surge as it removed a significant part of the spectral energy, which is concentrated at low frequencies.
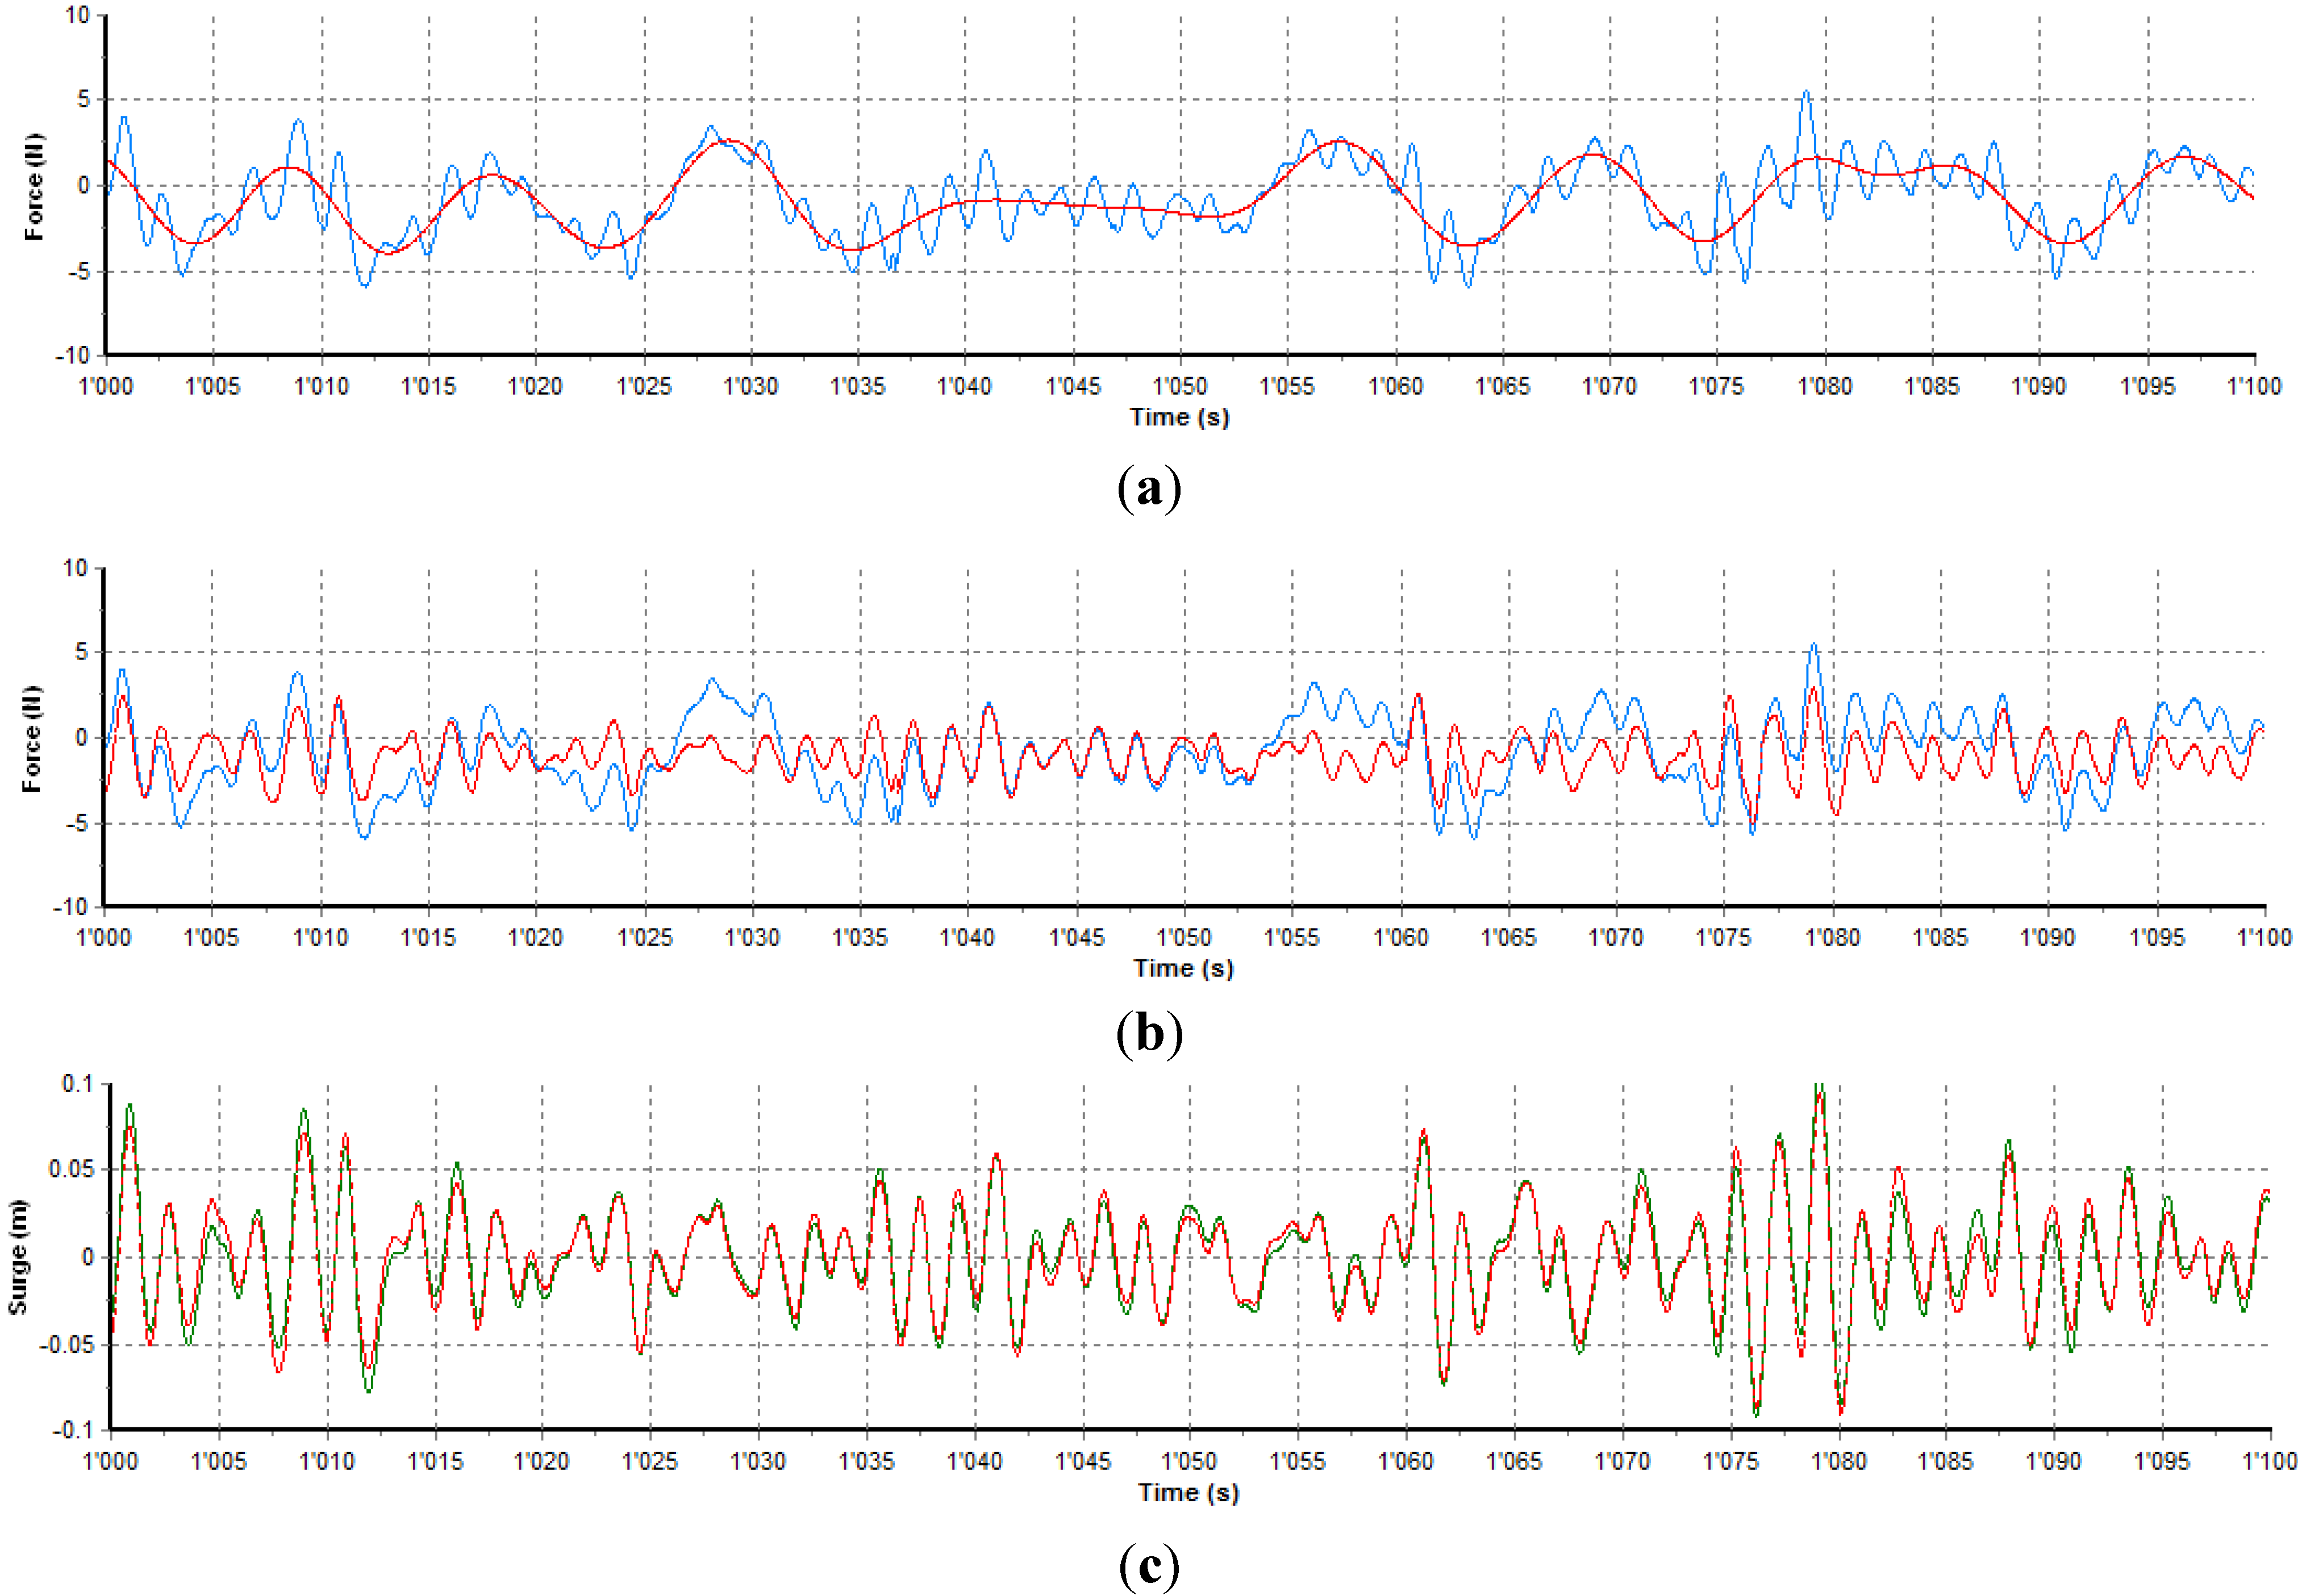
To bypass this problem, the low frequency part of the surge signal has been reconstructed in time domain from the corresponding part of the force signal, divided by the mooring stiffness. To increase the accuracy of the process, the mooring stiffness used was the gain of the linear trend-line of the F-D curve provided by the recorded high frequency components of surge and force. Considering the example shown in
Figure 5, the surge low frequency component was derived from the filtered signals (red lines) as (a) divided by the ratio (b)/(c). From
Figure 5c it is evident that the recorded surge signal included almost exclusively the high frequency components, since the original and filtered signals are very similar one to each other.
Figure 5.
Band-pass filtering of force and surge signals in time domain, for test with k mid, low Rc, Tr100 and Sp0. (a) Low frequency component (red) of the recorded force signal (blue); (b) high frequency component (red) of the recorded force signal (blue); and (c) high frequency component (red) of the recorded surge signal (green).
The reconstructed low frequency component of surge is then added in time domain to the recorded high frequency part to provide the overall surge response time series, on which the following data analysis is based.
As the MTi could not be placed at the Centre of Gravity (CoG) of the body, the pure heave component of the recorded vertical motions had to be derived by knowing the longitudinal distance of the MTi from the CoG and the pitch rotation. The Rc actually experienced during the tests is also derived from the target value by knowing the crest position respect to the CoG, the pitch rotation and the mean heave.
2.3. Wave Conditions
Extreme wave conditions typical of Hanstholm have been tested [
13], with return period (
Tr) of 10, 50 and 100 years. All waves have been generated as long-crested and irregular, according to a JONSWAP spectrum with peak enhancement factor of 3.3. Test duration has in all cases been 30 min, enough to provide a number of waves in the order of 1000, allowing for a statistical analysis of the data time series. Water depth in the basin was 0.61 m, corresponding to 30.5 m at full scale. In order to perform a sensitivity analysis on the effect of the peak wave steepness,
Sp(-) =
Hm0/
Lp, higher and lower
Sp respect to the standard cases have also been considered by varying the peak wave period respect to the central value (
Table 4). These are indicated as
Sp+1,
Sp0 and
Sp−1, referring respectively to augmented, standard and reduced wave steepness.
Table 4.
Wave conditions tested. Tr (years) is return period, Hm0 (m) is significant wave height from frequency domain analysis, Tp (s) is the peak wave period.
Table 4.
Wave conditions tested. Tr (years) is return period, Hm0 (m) is significant wave height from frequency domain analysis, Tp (s) is the peak wave period.
| Tr (years) | Hm0 (m) | Tp (s) |
|---|
| (Sp+1) | (Sp0) | (Sp−1) |
|---|
| Model scale (1:50) |
| 100 | 0.17 | 1.5 | 1.8 | 2.2 |
| 50 | 0.16 | 1.4 | 1.8 | 2.1 |
| 10 | 0.14 | 1.4 | 1.7 | 2.0 |
| WD-DanWEC scale—Hanstholm |
| 100 | 8.28 | 10.5 | 12.9 | 15.4 |
| 50 | 7.92 | 10.2 | 12.6 | 15.0 |
| 10 | 7.04 | 9.7 | 11.9 | 14.2 |
3. Results
A 3D wave analysis is performed to identify the incident component of the wave, which is considered in the data analysis. As the new model is 1.5 times smaller than the one previously used, a significant reduction in the reflection coefficient was observed in these tests compared with previous ones: from 30%–40% to 15% in average, reaching the maximum in cases with highest Rc and shortest Tp.
A time domain analysis of the force signal is performed to derive the extreme value of the tension peaks in the main mooring line. Traditionally with marine structures the maximum loads are estimated as the average value of the highest 1/250 fractile of the load cumulative density function (e.g., by having 1000 waves the estimated maximum load would be the average value of the four highest load peaks). By doing so, the variability of the estimate is notably reduced respect to the one associated to the absolute maximum.
In the data analysis a non-dimensional value of the extreme force is considered, called
F(-). This is derived by dividing
F1/250 by the hydrostatic force exerted by a head of water equal to
Hm0 on the cross-surface of Wave Dragon,
Ac (m
2) calculated as the device total width (from tip to tip of the reflectors) times the total height of the ramp:
where
ρ = 1000 kg/m
3 is the water density and
g = 9.81 m/s
2 the gravity acceleration. Although a simplification, the dummy force at the denominator well represents the dependency on
Hm0 of the wave pressure force acting on the cross-surface of the device. At the model scale
Ac = 0.58 m
2.
The average motion is expressed as the significant oscillation through the zero-moment of the response spectral distribution, e.g., as
. To describe the extreme motion the 1/250 fractile is considered, e.g.,
X1/250, based on the oscillations around the mean position for heave and pitch and based on the maximum excursion peaks for surge. For translational motions the mean and extreme oscillations are non-dimensioned by the significant wave height
Hm0 [Equations (3) and (4)] for the case of surge), while in the case of pitch oscillations they are taken in degrees:
In the following, non-dimensional extreme motion response will be referred to maximum excursions for surge and to a full oscillation height for heave and pitch, the oscillation amplitude being the half of it.
3.1. Extreme Tension in the Main Mooring Line
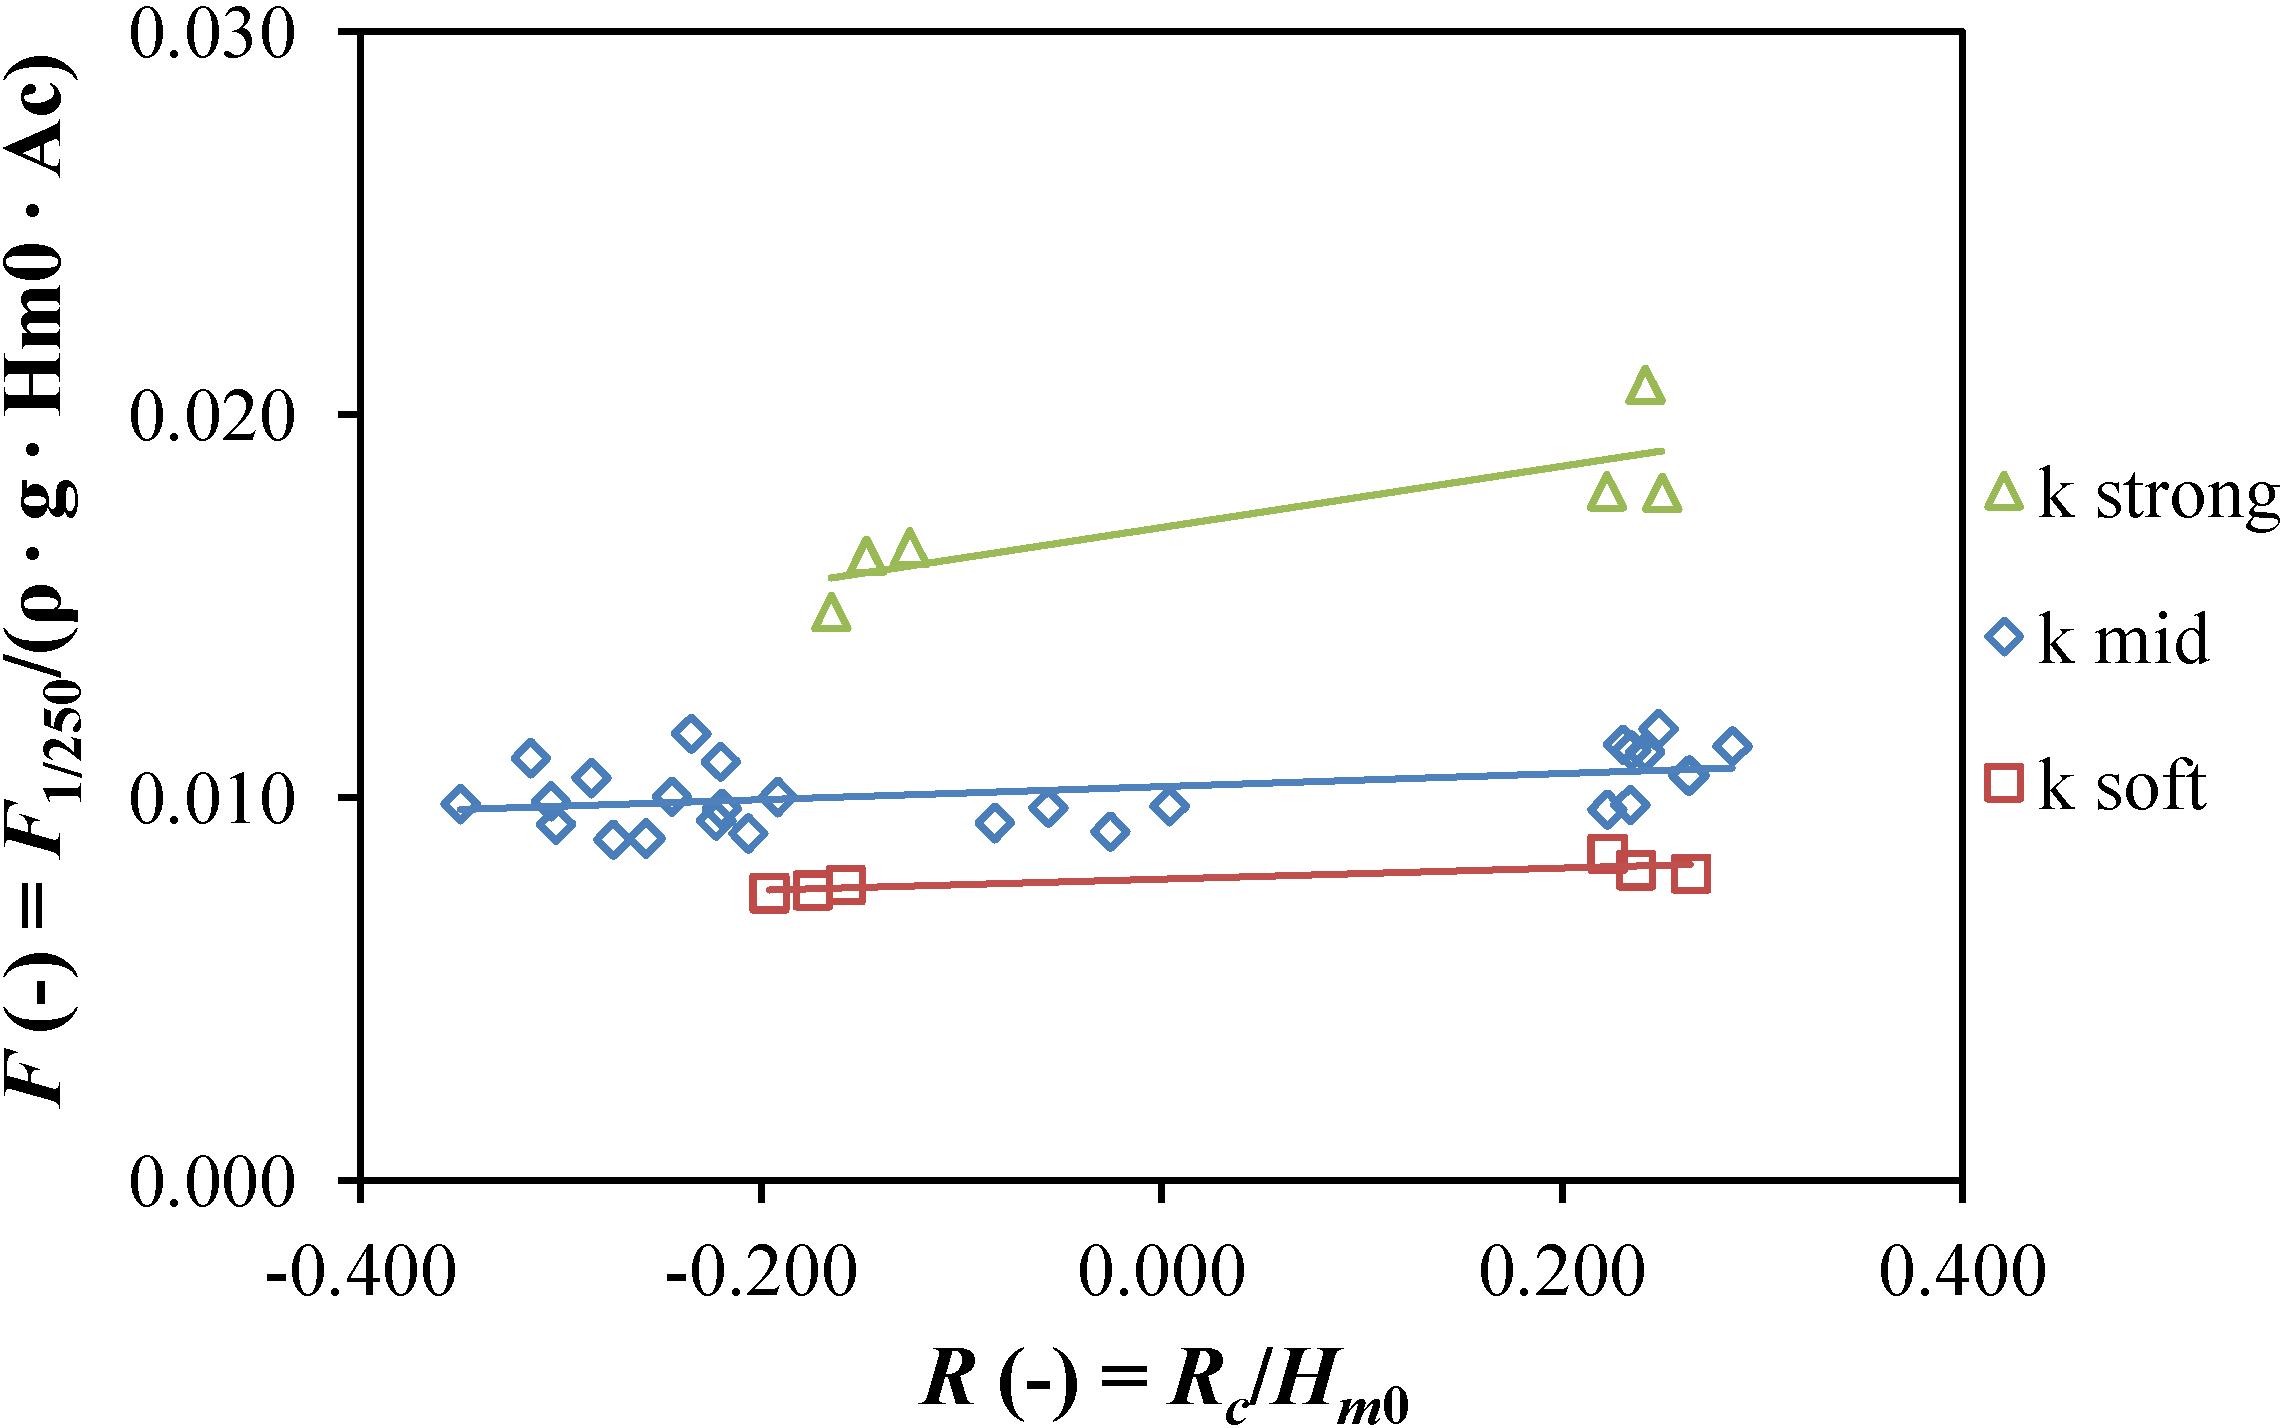
The extreme tension in the main mooring line is shown in
Figure 6 for different floating position and mooring compliance. Pre-tension provided by the rear mooring line is not accounted in the given figures.
Figure 6 shows that by using a more compliant system a reduction in the extreme mooring tension can be achieved. In the case of rigid moorings a reduction in the extreme mooring tension can be achieved also by decreasing the floating level, as was already shown in previous tests where the mooring stiffness was comparable to
k strong used here [
6]. This behavior, referred to as survivability mode, brings the opportunity for a reduction of the design requirements (and capital cost) of the mooring system with virtually no added cost, but it loses effectiveness as the compliance of the mooring system increase.
A third factor of interest is the mean pitch position, or trim. As previously found the ability of the device to naturally adopt a negative trim (
i.e., ramp lower than the rear) is a desirable behavior as it helps reducing the extreme mooring tension [
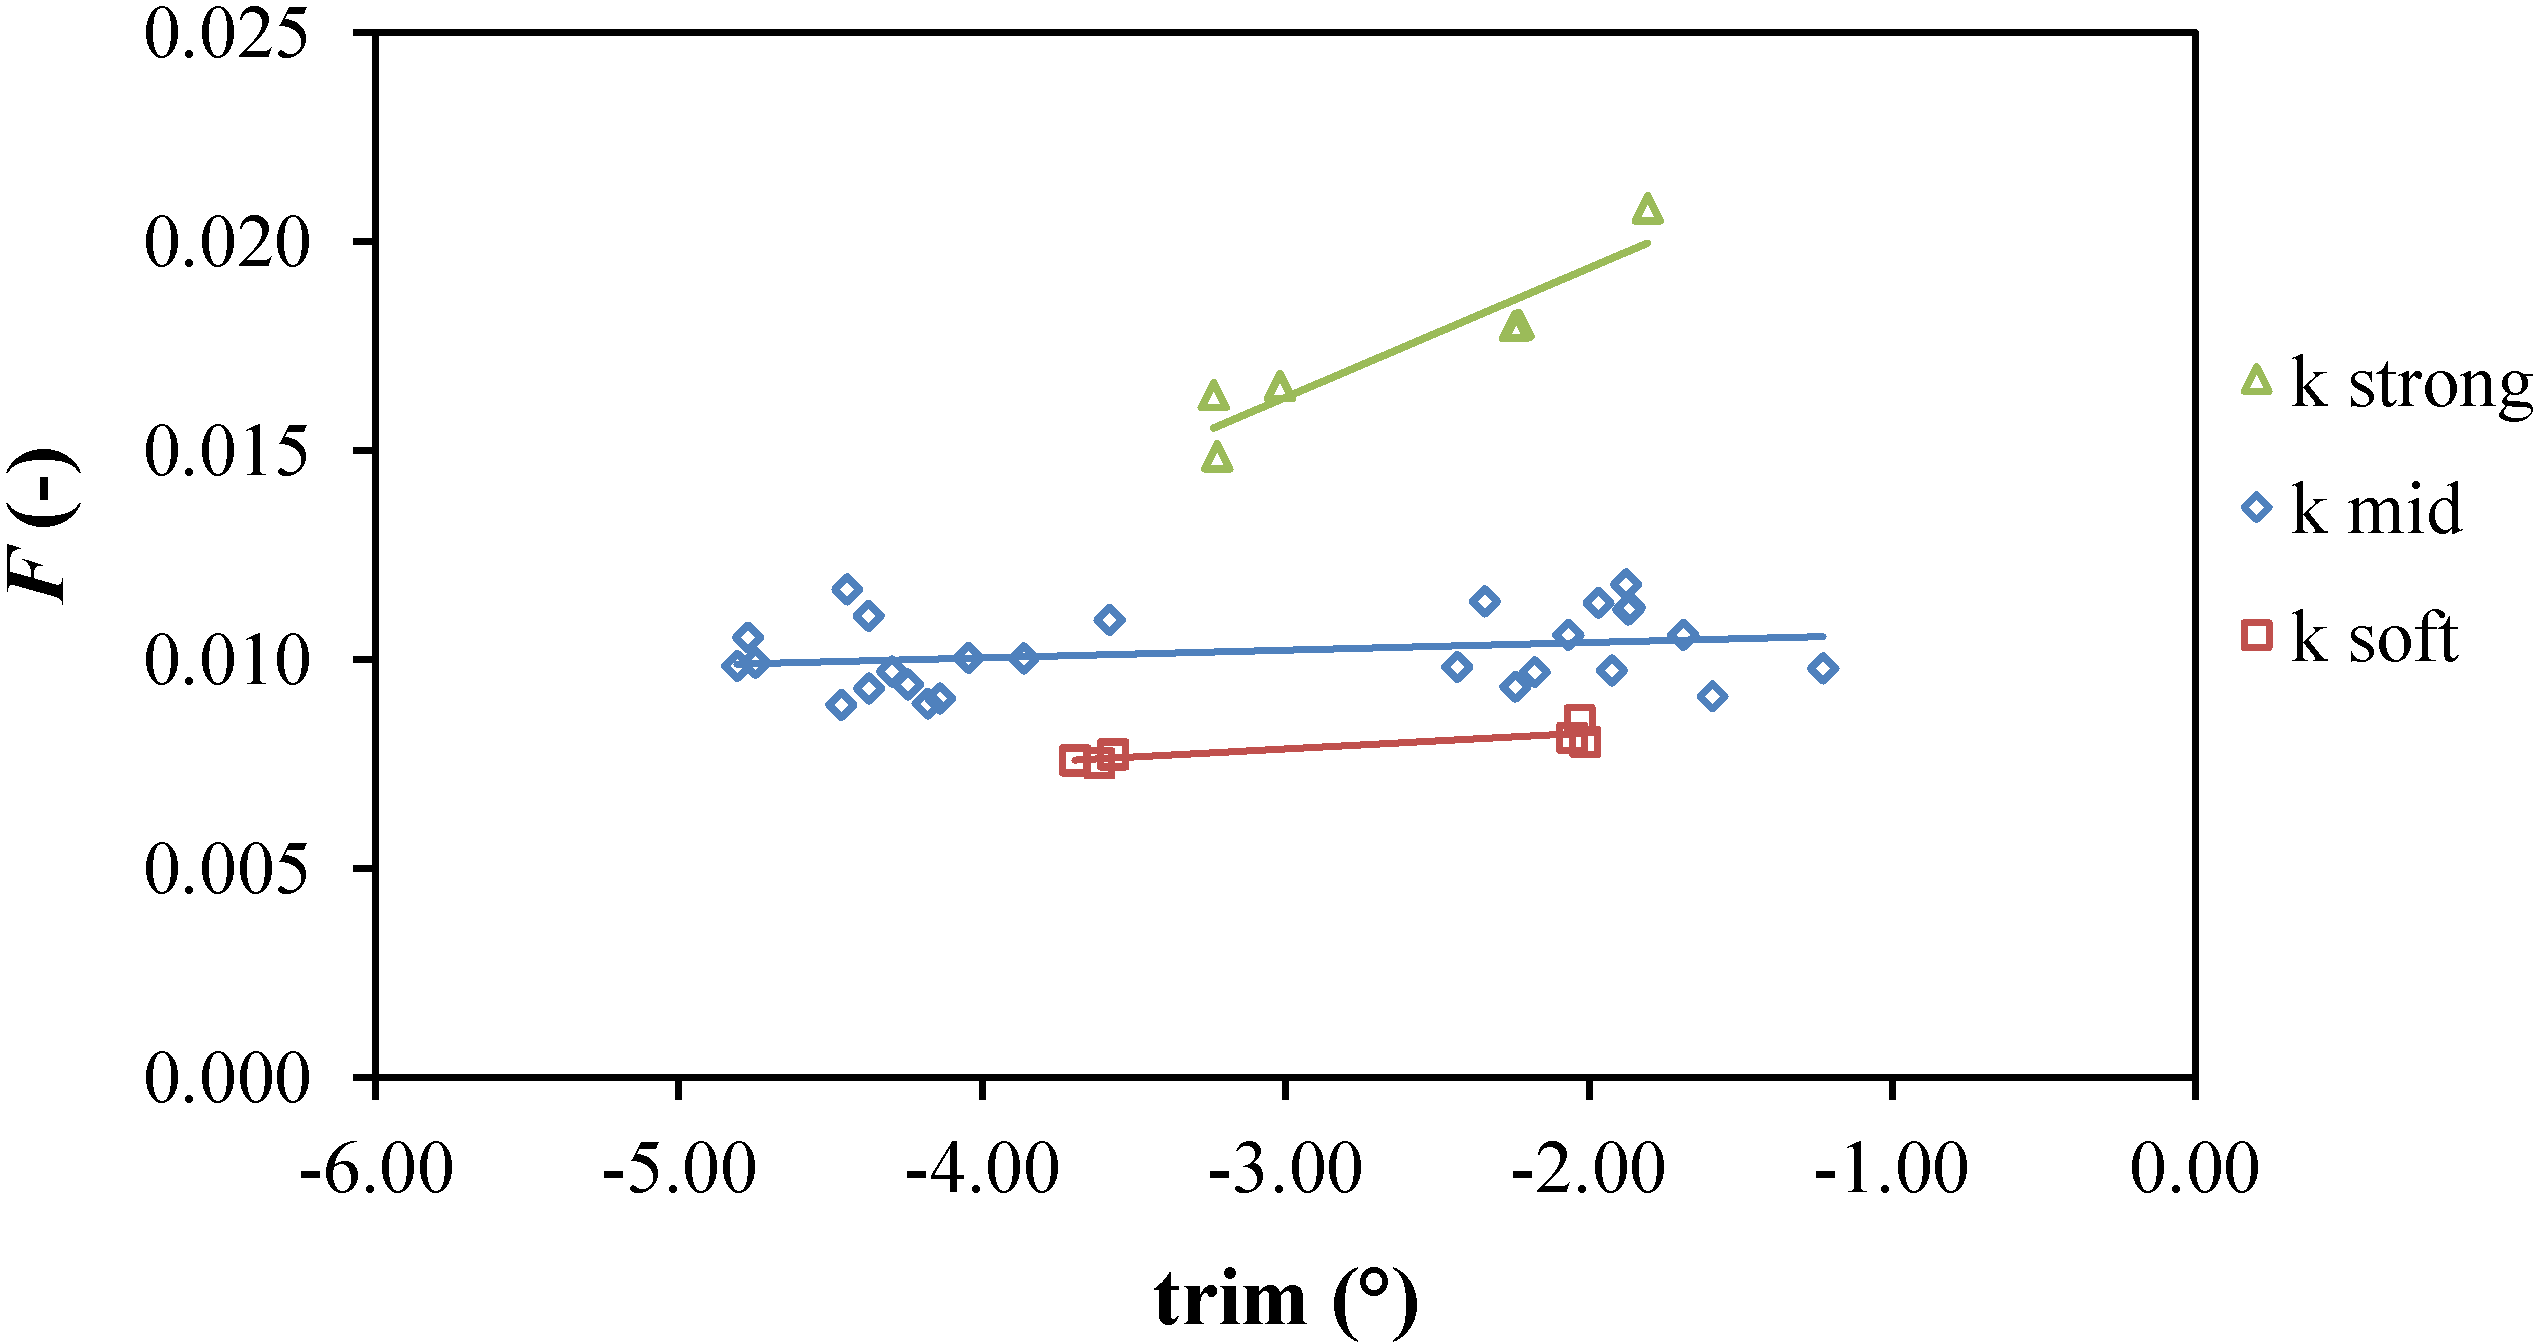
10]. In operational conditions, when power production would benefit from having zero trim instead, this tendency can be actively counteracted through the air pressure system. Respect to the previous physical model, which tended to trim backwards, the new model showed an opposite behavior, due to a more uniform distribution of the weight and buoyant element on the platform, therefore closer to the real one to be achieved at full scale. Trim values recorded during the tests were always negative, in the range of −2° to −5°. In these conditions a clear force reduction based on further decrease in trim was evident only in the case of
k strong (
Figure 7).
Figure 6.
Effect of the non-dimensional crest level, R(-), and of the mooring compliance on the non-dimensional extreme tension in the main mooring line, F(-).
Figure 6.
Effect of the non-dimensional crest level, R(-), and of the mooring compliance on the non-dimensional extreme tension in the main mooring line, F(-).
Figure 7.
Correlation between non-dimensional extreme mooring forces and mean pitch, or trim.
Figure 7.
Correlation between non-dimensional extreme mooring forces and mean pitch, or trim.
3.2. Extreme Motions
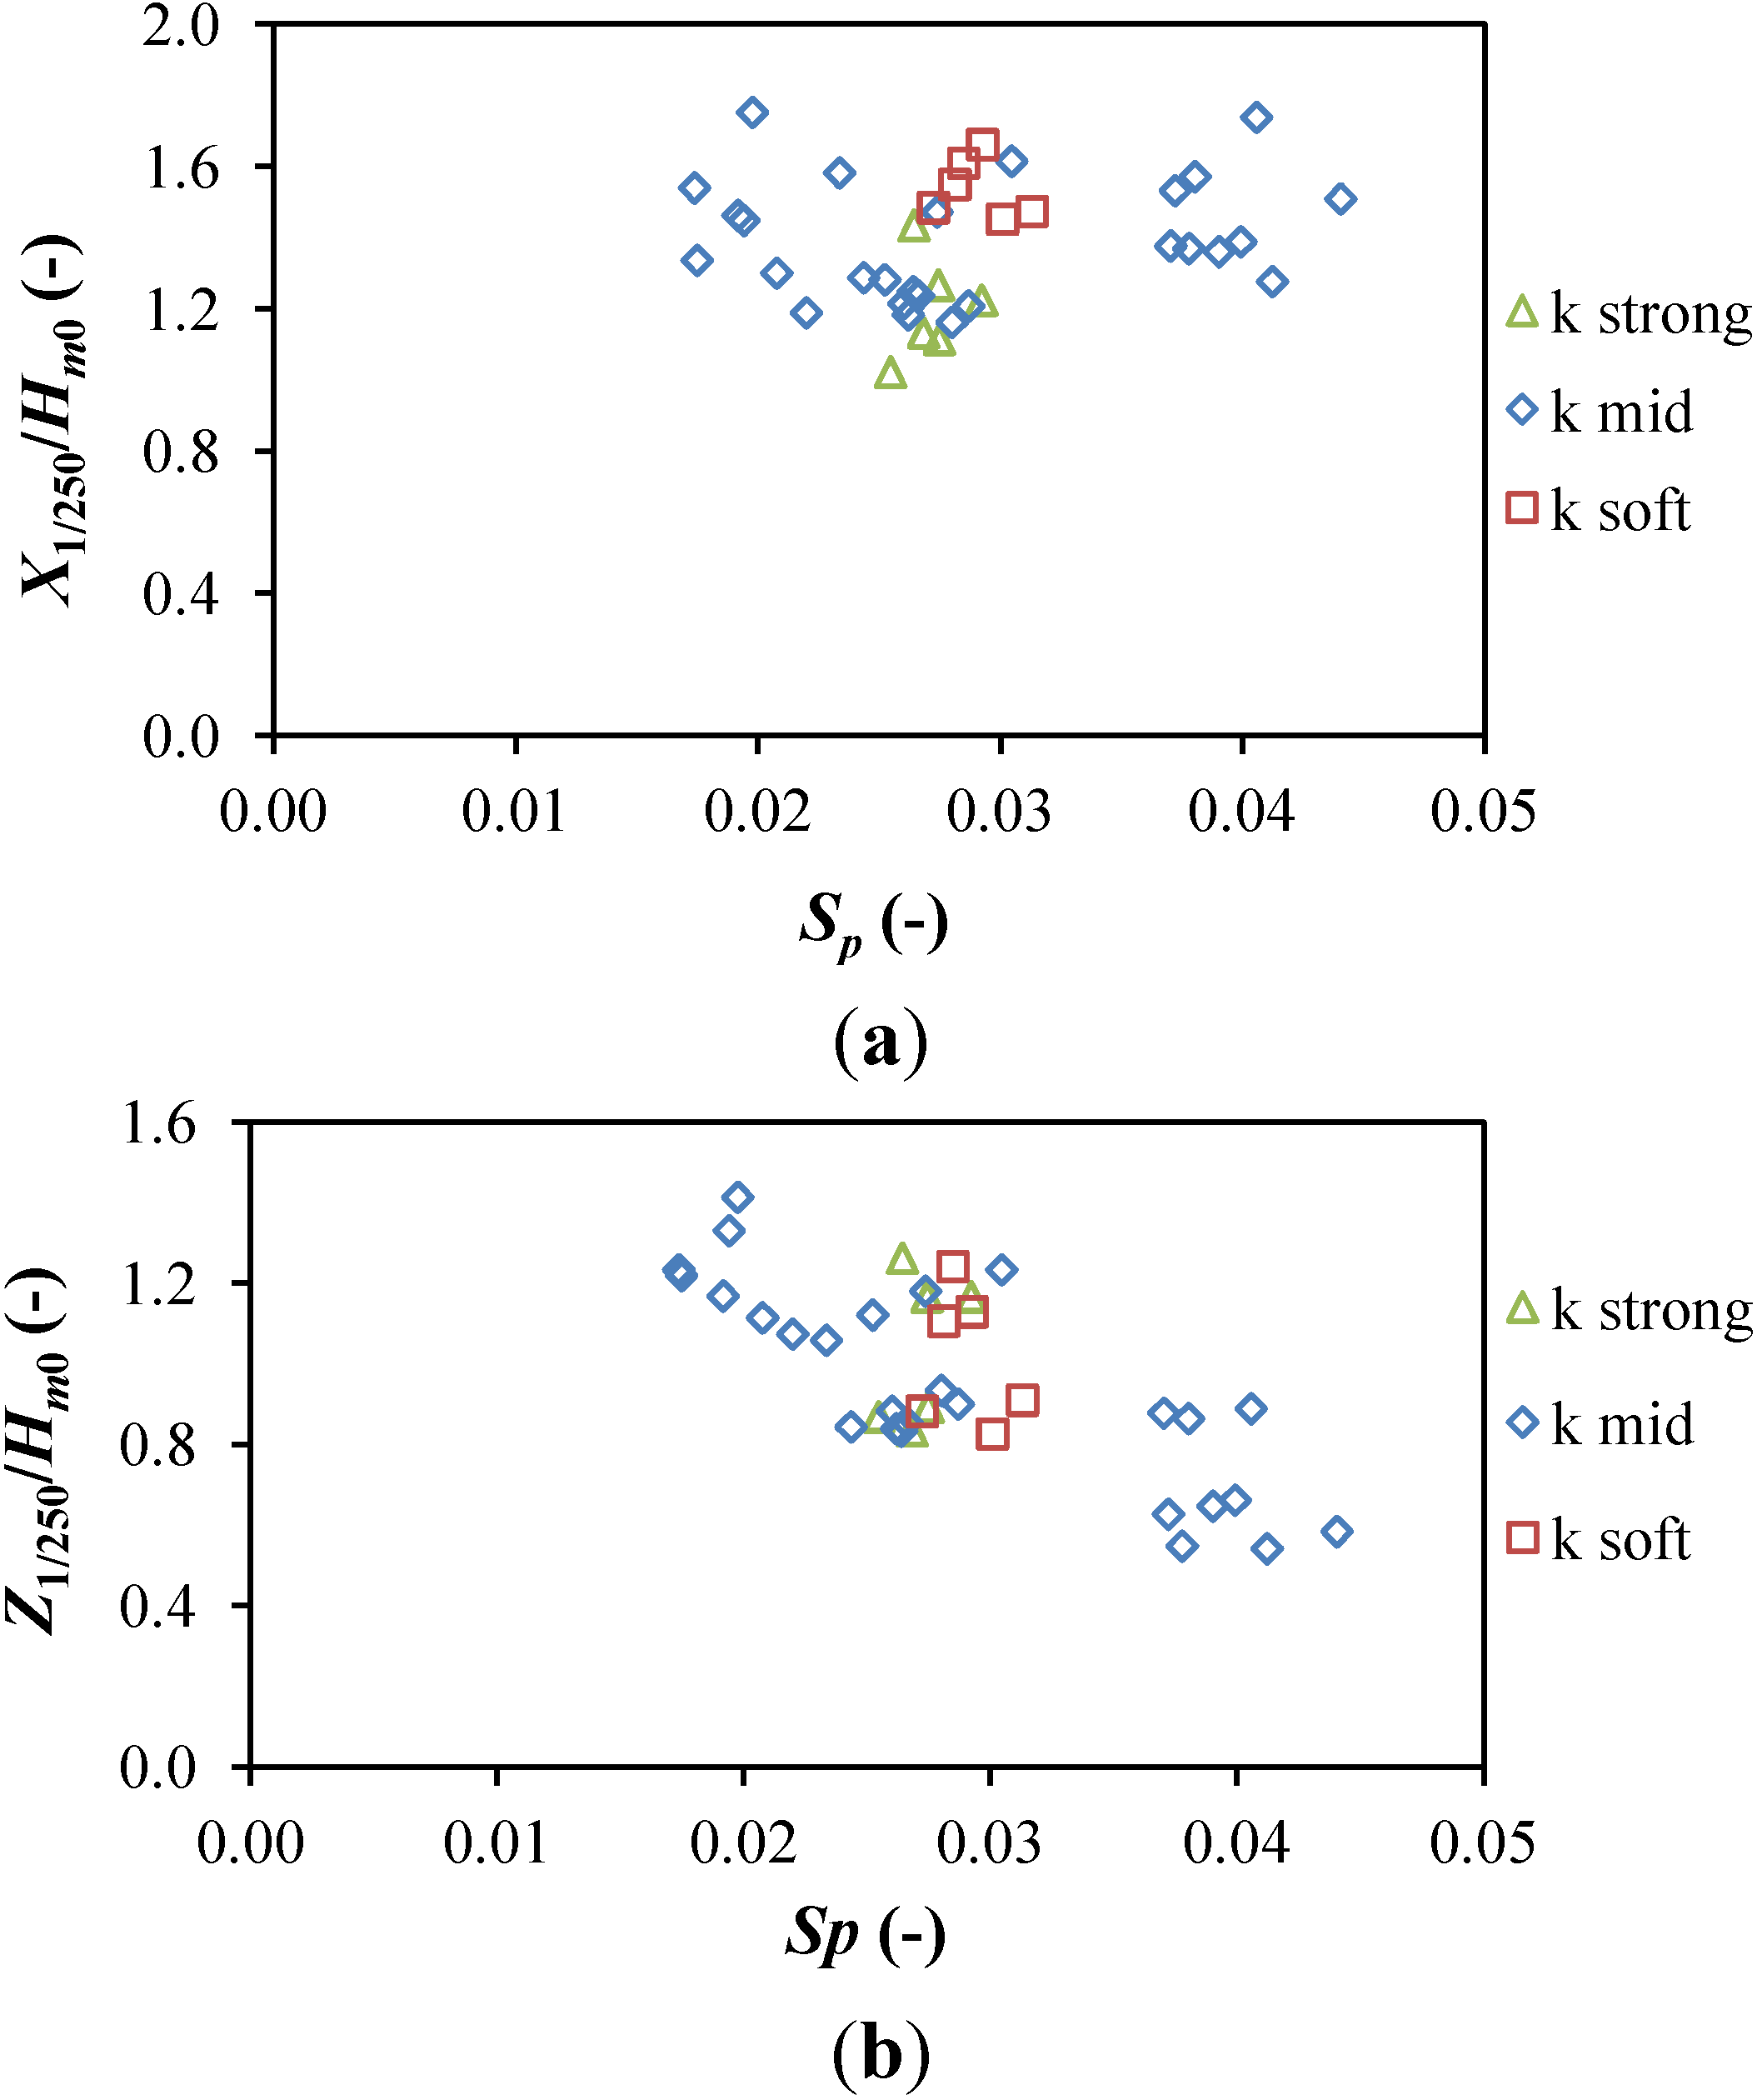
In
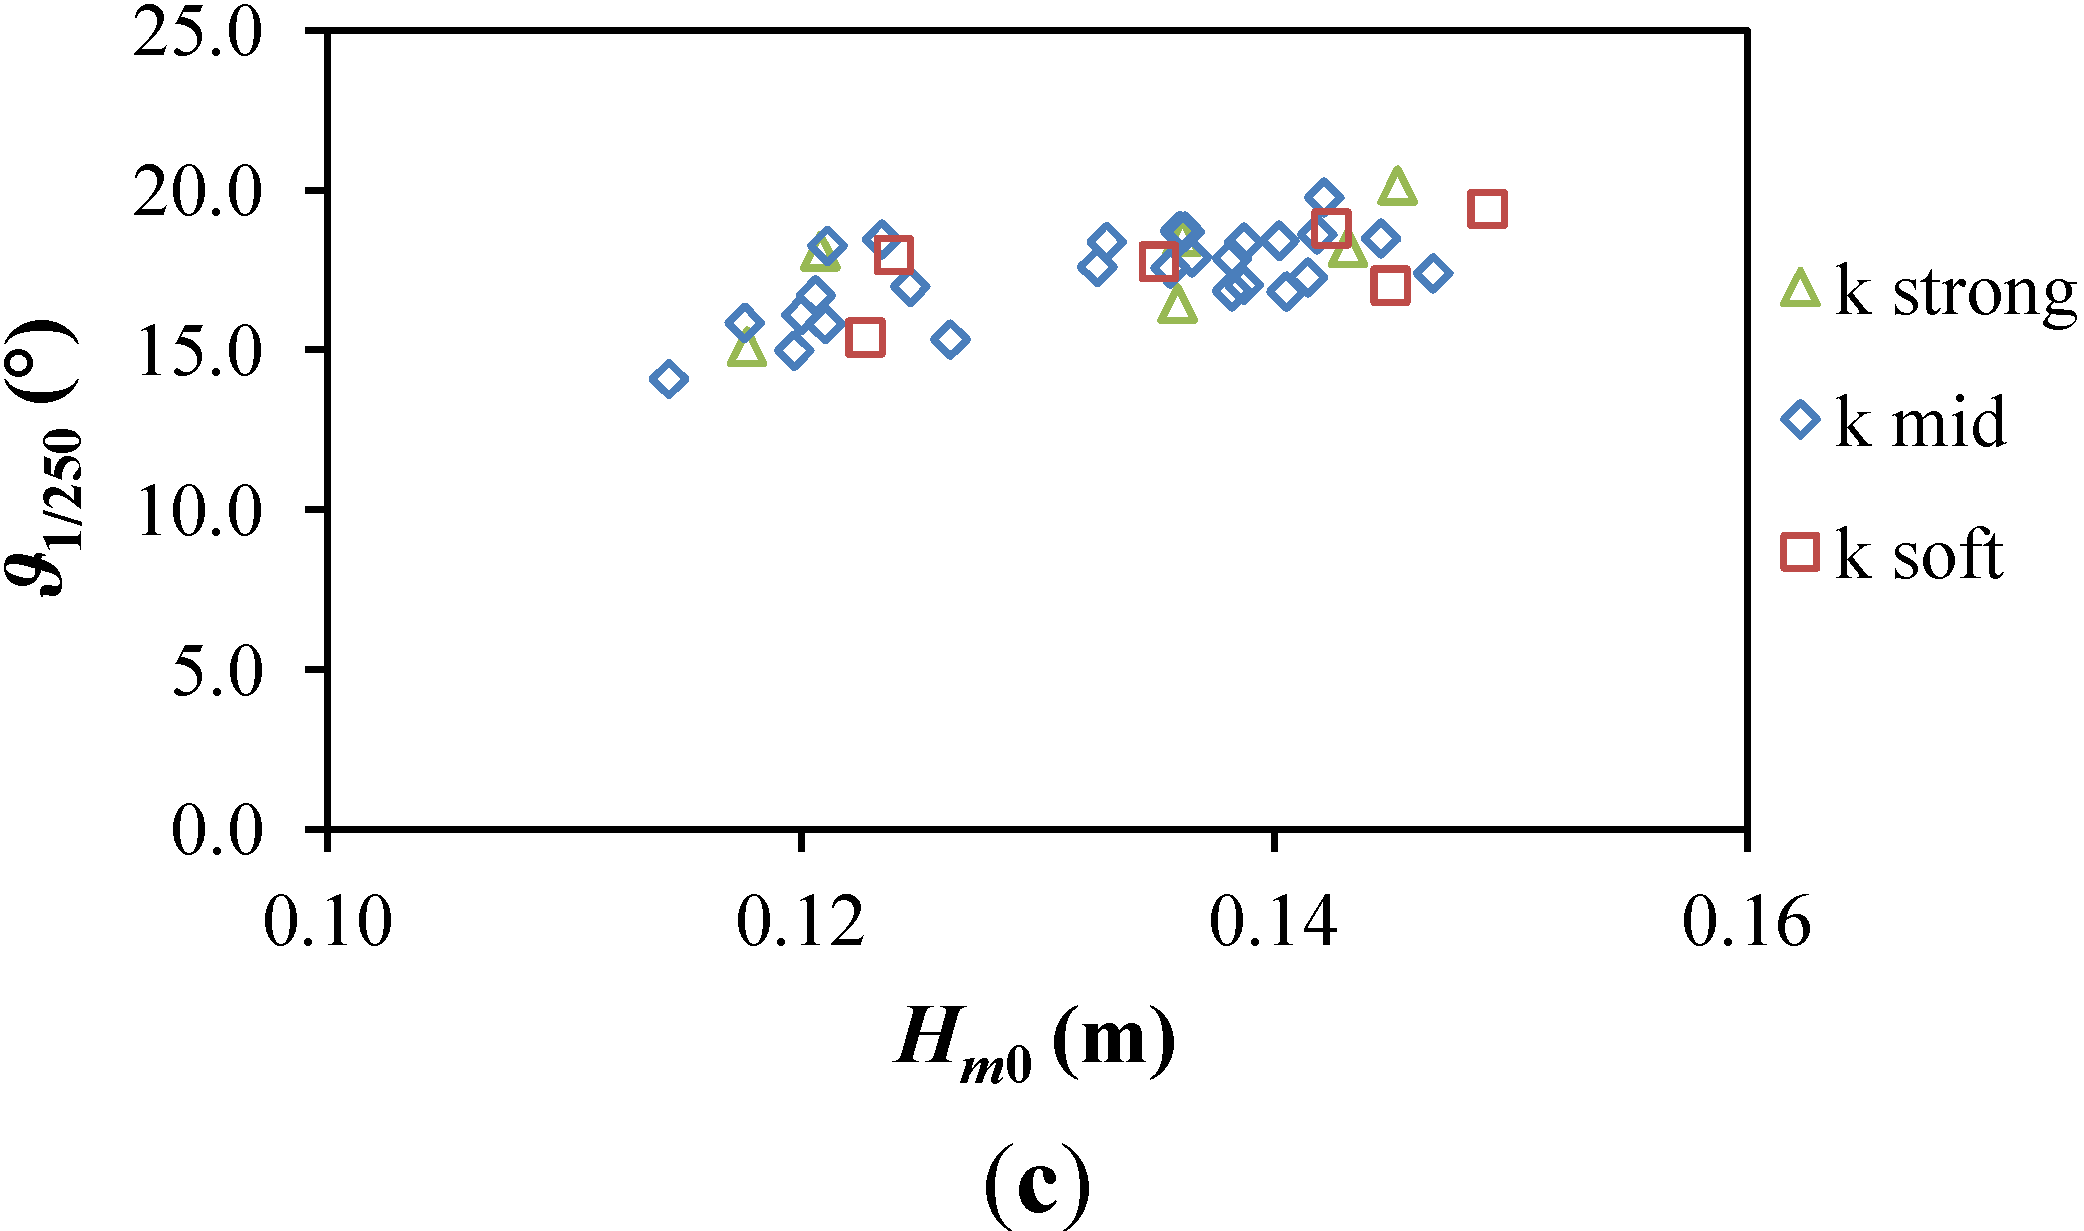
Figure 8, the extreme non-dimensional motion responses in surge and heave are plotted against
Sp(-), while the one in pitch is plotted against
Hm0 as this was able to show a clearer correlation. The extreme response in surge does not show a clear dependency on
Sp, while as expected it increases with the compliance of the system. The extreme response in heave clearly decreases with steeper waves instead, with no difference depending on the mooring compliance. In the case of pitch the extreme response increases with the incident
Hm0. The same trends are maintained when considering average responses in all three modes of motion considered.
Figure 8.
Extreme non-dimensional motions responses in (a) surge; (b) heave; and (c) pitch.
Figure 8.
Extreme non-dimensional motions responses in (a) surge; (b) heave; and (c) pitch.
3.3. Frequency Domain Analysis
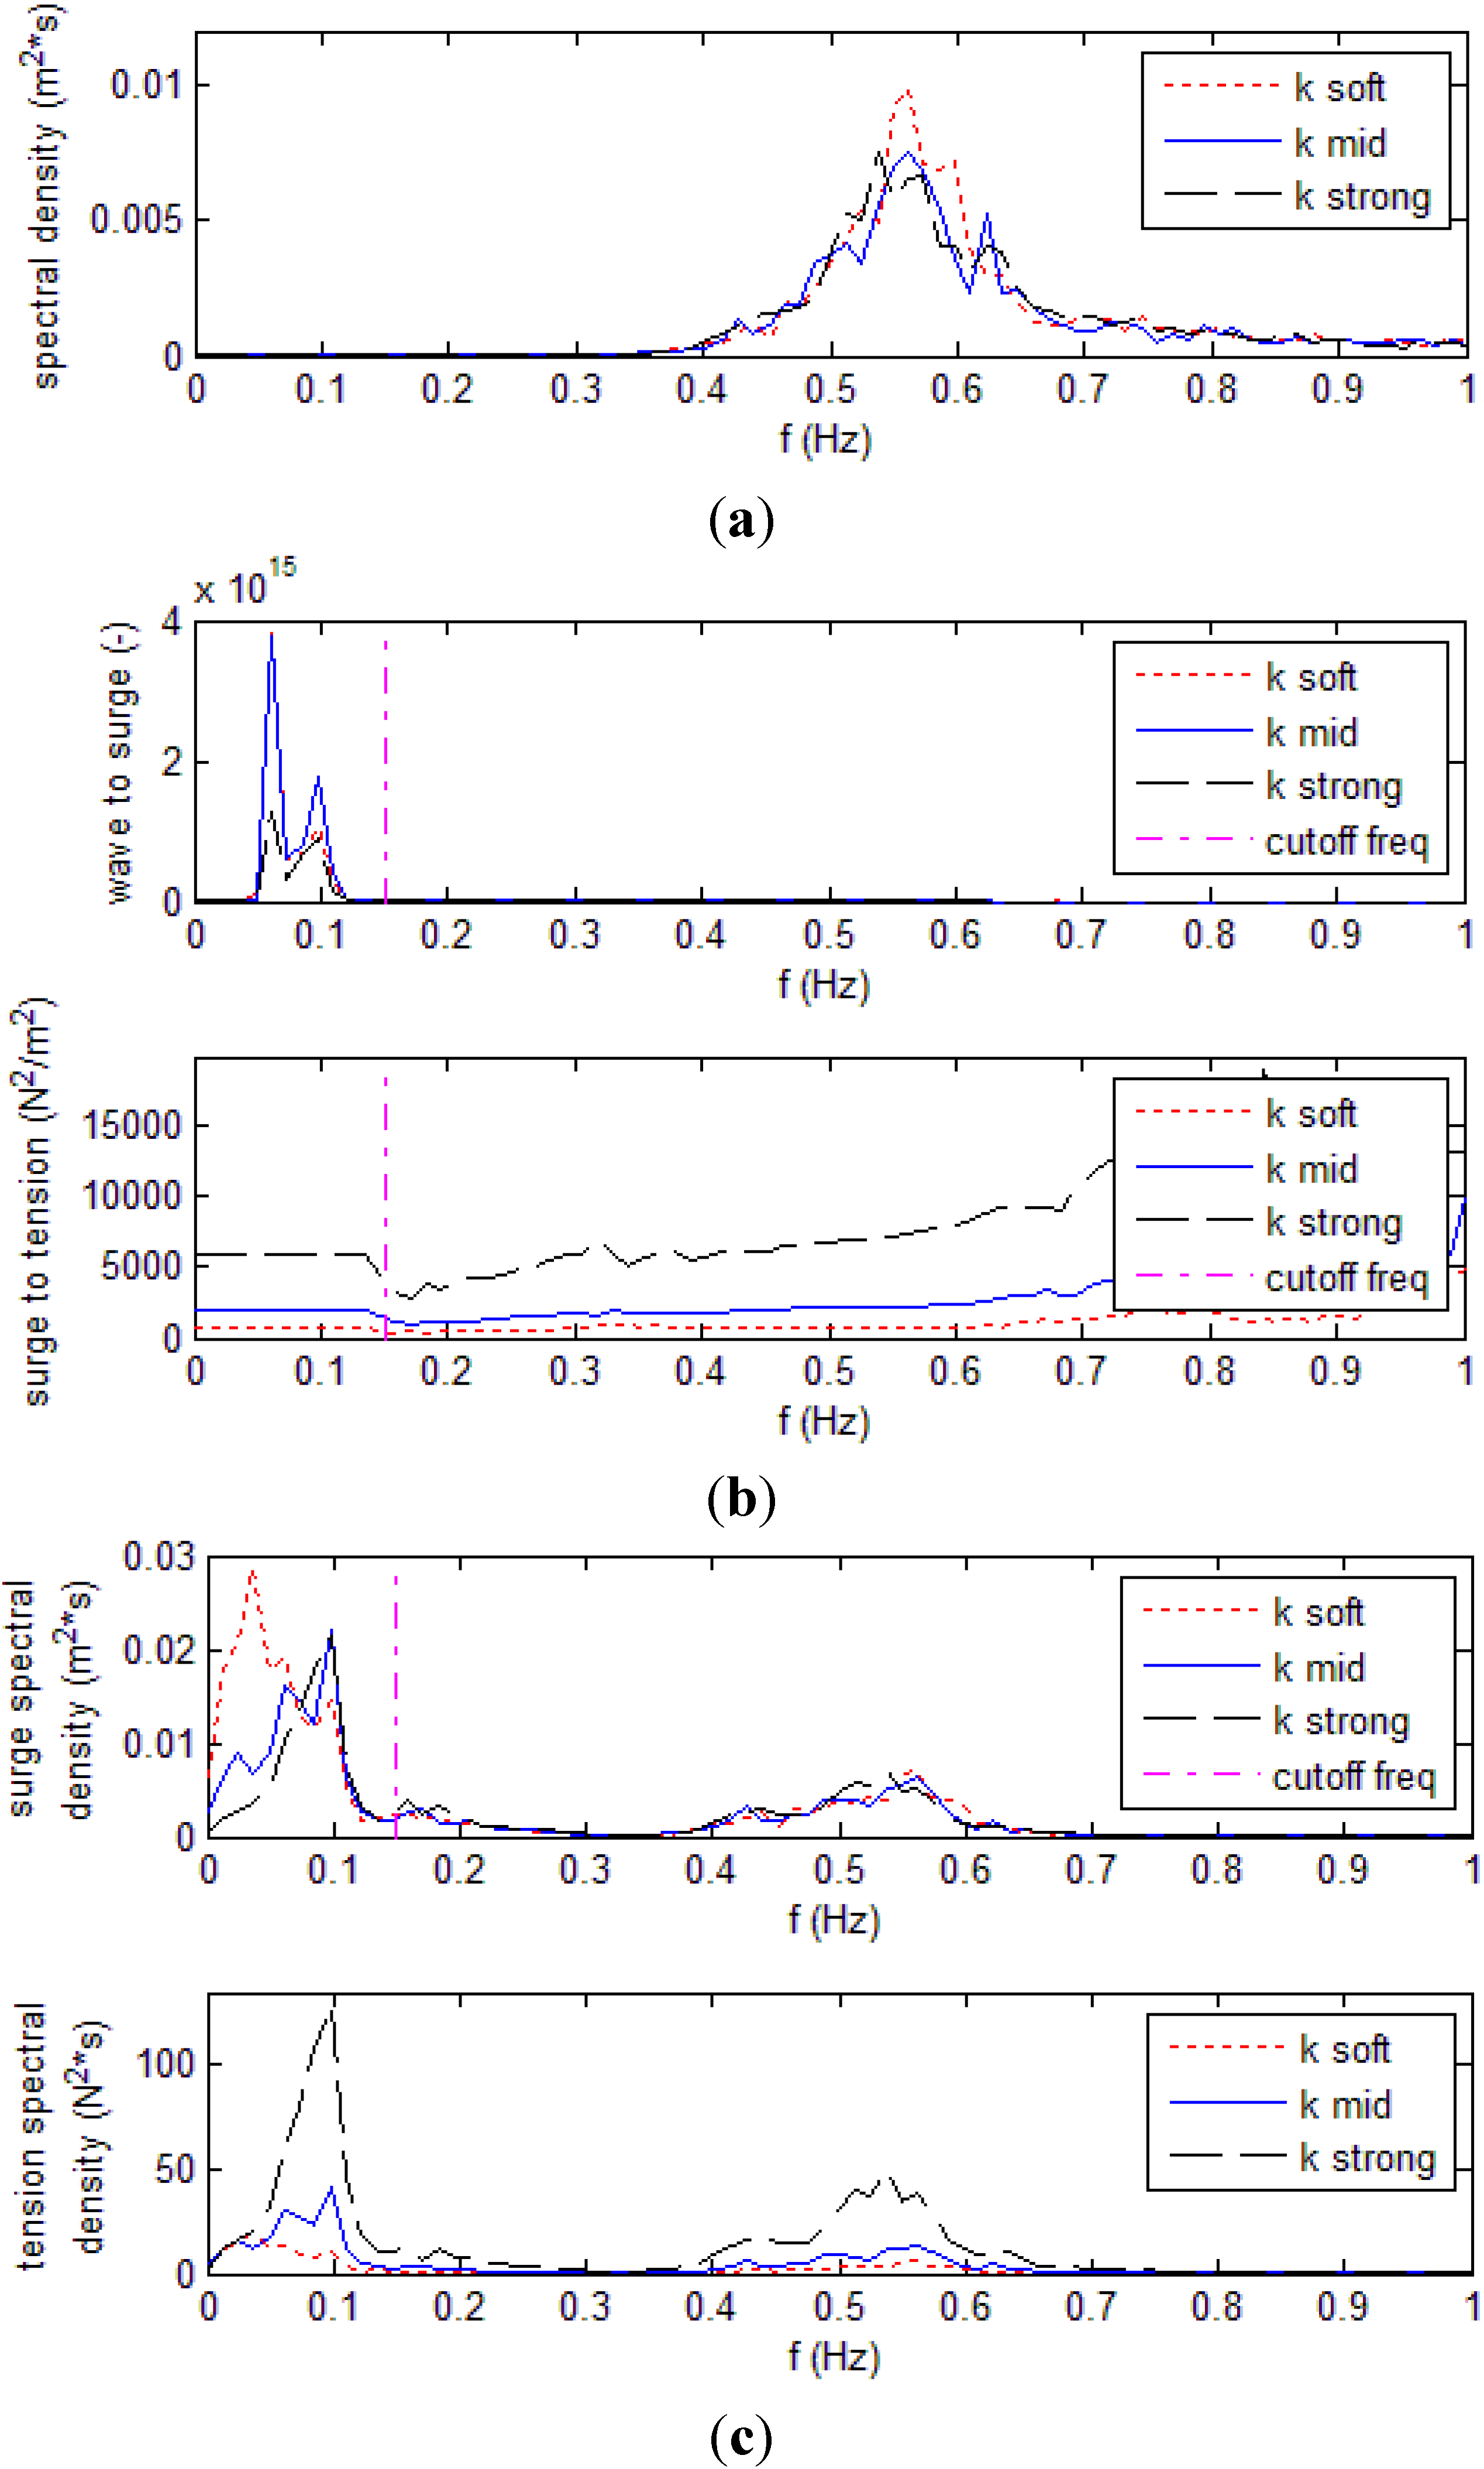
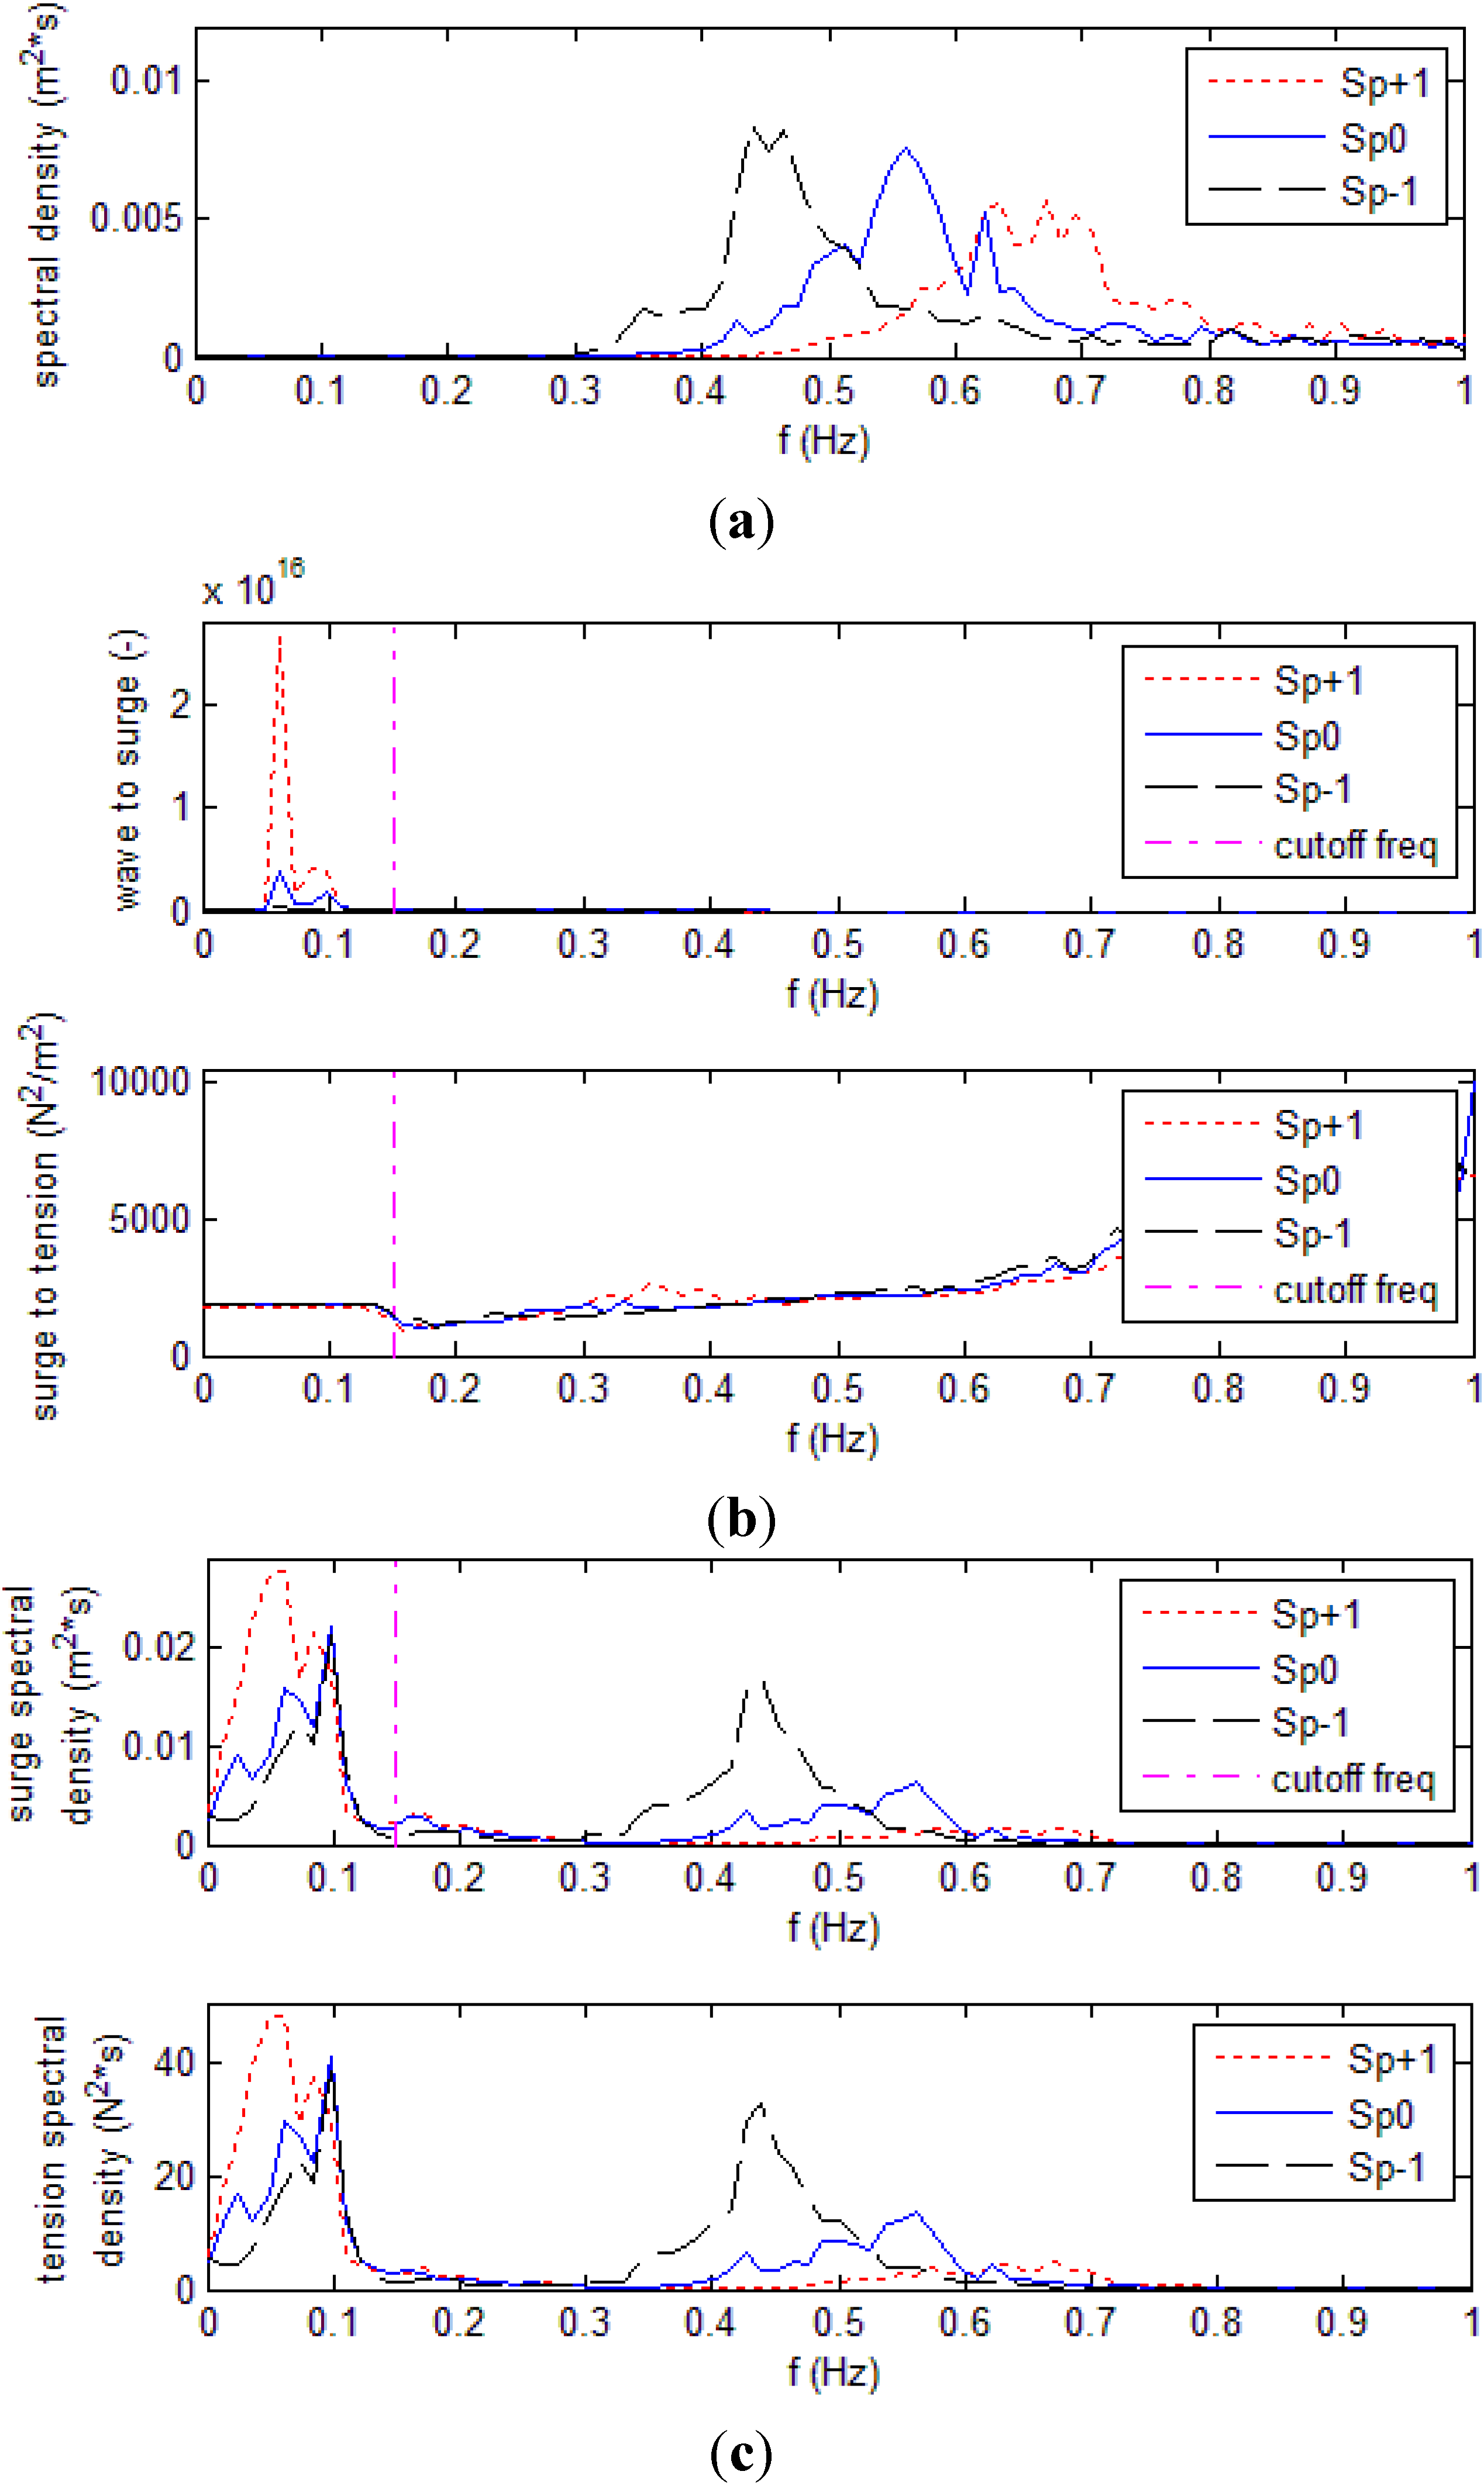
Spectral analysis is performed on the incident wave and on the system response in surge and mooring tension. Transfer functions from wave-to-surge and from surge-to-tension are calculated. A sensitivity analysis is carried out, considering cases with different mooring stiffness tested in design waves (
Tr100 and
Sp0) with low
Rc (
Figure 9).
As mentioned in
Section 2.2, the low frequency component of the surge signal has been derived in time domain by dividing the corresponding portion of the force signal by the mooring stiffness. This was needed as the motion signals had to be high-pass filtered to remove the drift deriving from the double integration, but in the process a large part of the response energy was cut from the surge one. Although the filter cutoff frequency used in the integration was 0.1 Hz, the distinction between high and low frequencies on which the signal was reconstructed was referred to a slightly higher frequency in order to account for the effect of the filter shape, which to a minor extent also modified the original signal above the cutoff frequency. A frequency of 0.15 Hz was therefore chosen in the reconstruction process, as this guaranteed the filtered signal magnitude to be 95%–100% of the original one. This is shown in
Figure 9 by a vertical line: below it the surge response was reconstructed from the force one, above the line it is the original signal derived from the integration of the recorded acceleration.
The transfer functions in
Figure 9b show how the wave energy is transferred to the system first through the wave-structure interaction, resulting in the surge motion of the device (wave-to-surge), and then how the surge motion of the device is translated into tension in the main mooring line (surge-to-tension).
In the first case the energy transfer mainly happens below the cutoff frequency, at the surge resonant frequency of the system (around 0.1 Hz), being particularly evident for more compliant systems. The surge energy is then transferred to the mooring system quite constantly, showing only a slight increase with the frequency. As a consequence, in both cases the spectral distributions of the response are mostly concentrated at low-frequencies, with peaks at the surge natural frequency and below due to the action of the second order wave drift forces (
Figure 9c). In terms of magnitude, more compliant systems allow a larger transfer of the wave energy to the surge and a lower one to the mooring system. As a result the low frequency surge response increases with the compliance of the system, while the opposite happens with the mooring tension. At high-frequencies, where the linear interaction with waves occurs, changes in the compliance of the system have no influence on the surge response, while the mooring tension increases for stiffer mooring systems also at these frequencies.
Figure 9.
Frequency domain analysis of the system in design waves (Tr100, Sp0), with low Rc and for the three springs tested. The cutoff frequency used in the surge signal reconstruction is shown by a vertical line at 0.15 Hz. (a) Incident wave spectra; (b) transfer functions from wave to surge and from surge to tension in the main mooring line; and (c) Spectral response of the system in terms of surge and tension in the main mooring line.
A sensitivity analysis is also performed on the influence of the wave steepness
Sp on the response spectral distributions.
Figure 10 shows the frequency domain analysis for tests with the same setup (low
Rc,
k mid) and wave conditions (
Tr100), but different
Sp. As shown by
Figure 10b, the energy transfer from wave to surge greatly increases as much as the waves become steeper. On the other hand,
Sp has no effect on the surge-to-tension transfer function, which shows the same trend as previously discussed. This results overall in a progressive shift of the spectral energy from high to low frequencies as the waves get steeper, both in the cases of surge and mooring tension.
Figure 10.
Frequency domain analysis of the system in design waves (Tr100), with low Rc and k mid. The cutoff frequency used in the surge signal reconstruction is shown by a vertical line at 0.15 Hz. (a) Incident wave spectra; (b) transfer functions from wave to surge and from surge to tension in the main mooring line; and (c) spectral response of the system in terms of surge and tension in the main mooring line.
3.4. Force-Displacement Curves
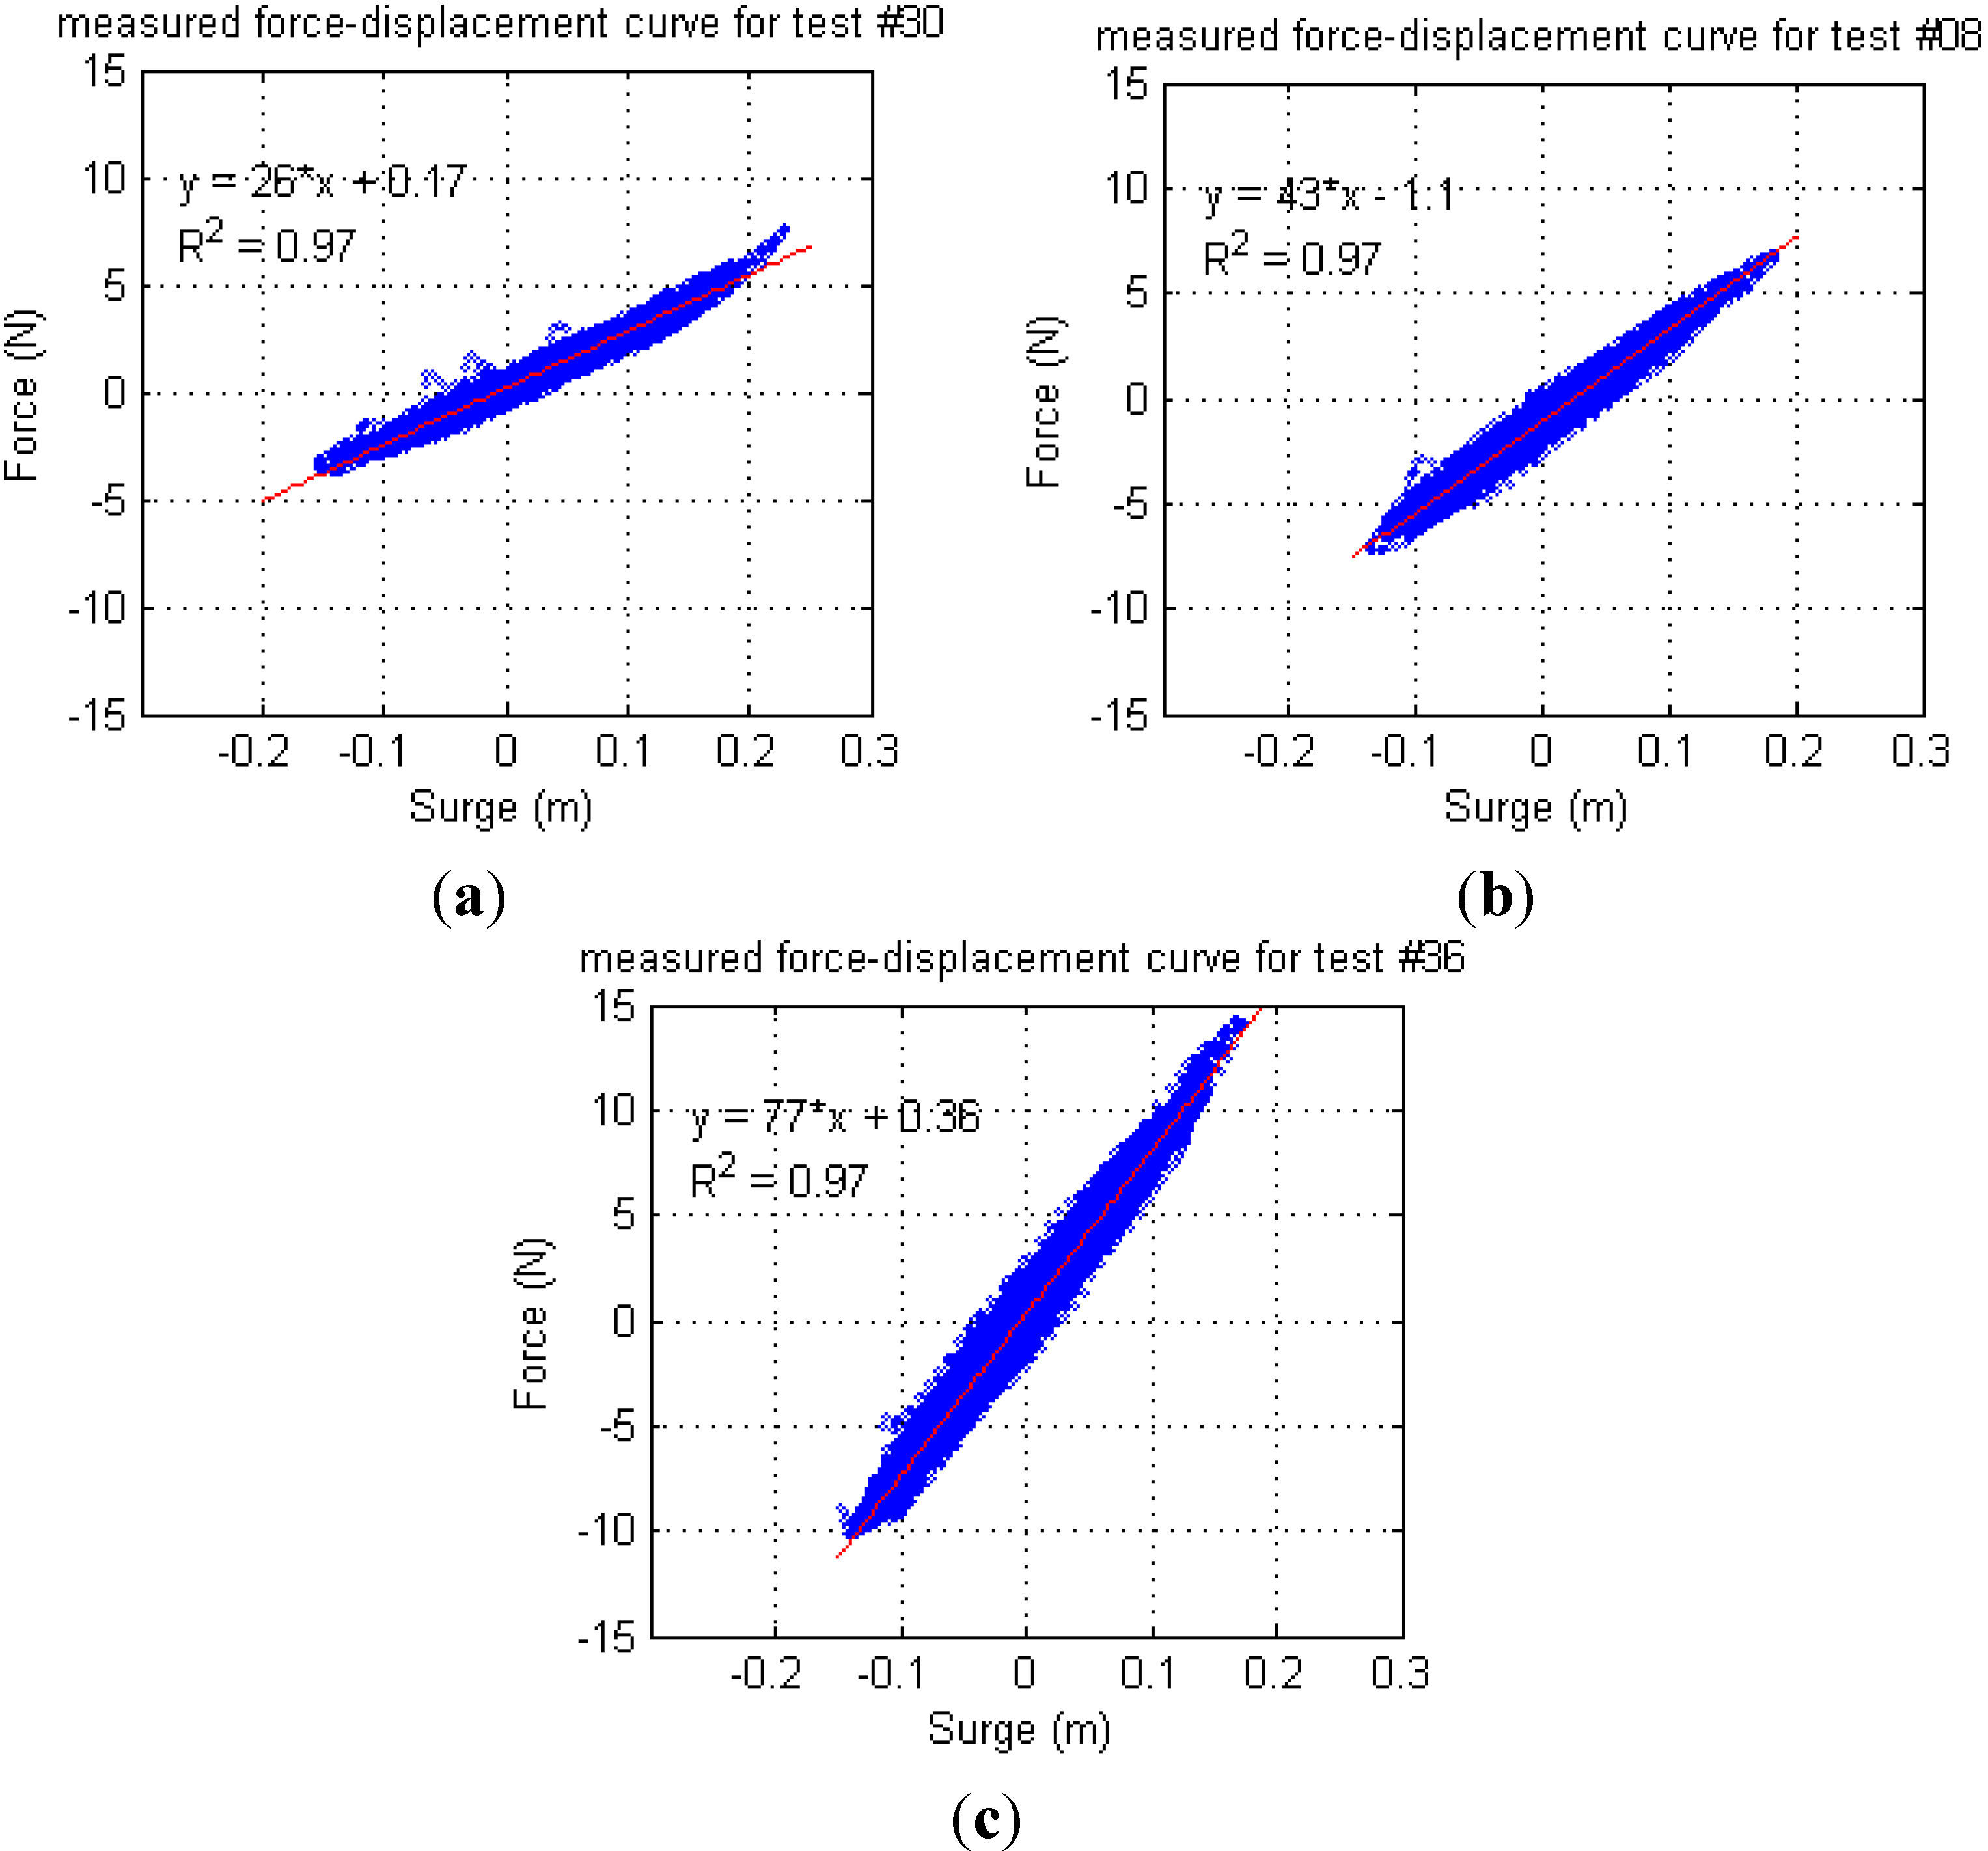
The F-D curves have been derived by plotting the recorded time series of the mooring line tension as a function of the displacement of the model in surge. Surge is positive in the direction of the wave and pre-tension of the system is not included in the force displayed. The gain of the linear trend-line represents the experienced stiffness of the system during the test, called the actual stiffness.
All values are very constant, showing relative errors (ratio between standard deviation and mean value) of 2%–4%. In every case the correlation coefficient between data and linear trend-line is above 95%. The mean values, including all wave states and
Rc tested for each
k, are shown in
Table 3. In all cases the values of target stiffness derived from the calibration are consistent with the actual ones provided by the F-D curves, the largest difference referring to
k strong. In this case the target values underestimate the actual stiffness by 5.7% and overestimate the actual surge natural period only by 2.7%, so that both qualitatively and quantitatively the same conclusions can be drawn independently on whether target or actual
k values are considered.
In
Figure 11 hysteretic cycles are evident. However, they are quite flat and follow the trend-line slope, so that the scatter of the data is still very low.
Figure 11.
F-D curves measured in design wave conditions (
Tr100,
Sp0), with low
Rc and different
k (same tests considered in
Figure 9). The linear fit is shown in red, the fitting equation and the correlation coefficient
R2 are displayed. (
a)
Rc low,
Tr100,
Sp0,
k soft; (
b)
Rc low,
Tr100,
Sp0,
k mid; and (
c)
Rc low,
Tr100,
Sp0,
k strong.
4. Discussion
4.1. Spring Behavior: Viscoelasticity and Non-Linearity
The springs have been modeled through pieces of rubber lines, which showed hysteretic loops when dynamically loaded, as shown in
Figure 11. This behavior is caused by a dynamic lag due to viscoelastic nature of the material used, which determines a phase shift between the load and the response. This kind of hysteresis is commonly referred to as rate-dependent and can become evident even in linear systems, as this is the case. The system keeps a memory of past excitation, as the output continues to respond for a finite time when the input goes to zero, although limited as it progressively disappears. The phase shift is frequency-dependent and is reduced as the input frequency goes to zero. As the load is applied more slowly and in a quasi-static way (as for the slowly varying second order response) this behavior tends to be less evident and becomes negligible, which supports the procedure used to derive the low-frequency component of the surge from the tension one based on a linear relationship between the two. The area of the hysteretic loop is proportional to the dissipation of mechanical energy of the system into heat during the loading cycle [
14].
On the other hand a non-linear behavior has emerged as the springs were loaded above a certain threshold, which depends on the thickness and length of the rubber line considered. The stiffer the spring was, the more evident was this behavior as shown in
Figure 4. Since the threshold was never reached during the tests, for the present application the mooring lines used can be considered as linear springs in all cases.
4.2. Influence of the Wave Steepness on the Response of the System
As mentioned in the
Section 3.3, the steepness of the incident waves is influencing the distribution of the surge and mooring tension spectral energy and therefore their average and extreme magnitudes. The steepness of the waves tested has been varied by keeping constant
Hm0 and varying
Tp (
Section 2.3). Under these premises steeper waves mean a lower wave power and more concentrated at the water surface. It has been shown that for steeper waves it is larger the wave-to-surge energy transfer taking place at low frequencies through non-linear interaction. This behavior is maintained also with regard to the mooring tension. As a consequence steeper waves, although less energetic in absolute terms, can induce larger extreme mooring tension (
Figure 8a).
4.3. Force-Reduction Effect
Three main parameters have shown to be able to decrease the extreme tension in the mooring line: a large compliance of the mooring system, a low floating position and a progressively negative trim. All of them act accordingly to the same principle by increasing the surge natural period of the system [Equation (1)]. The first does that as it corresponds to a lower k, while the second (the survivability mode) and third by increasing Ma,0.
Table 5 shows that the different strategies have not the same efficiency. Figures shown are derived from linear interpolation of the test results, with pre-tension not included. Extreme force is expressed both in non-dimensional form as
F(-) as well as
F1/250 (N). Force reduction
dF (%) is expressed as percentage from a reference configuration (shown in brackets).
Table 5.
Reduction achievable in the extreme mooring tension by means of different strategies. (a) Effect of an increased horizontal compliance, assessed in high Rc and survival Rc conditions; (b) Effect of a lower floating level (survivability mode), evident only in the case of k strong; and (c) Effect of adopting a further negative trim, evident only in the case of k strong.
| R = 0.2 (high Rc) | R = −0.2 (surv Rc) |
| Mooring line | F(-) | dF (%) (from k strong) | Mooring line | F(-) | dF (%) (from k strong) |
| k strong | 0.019 | - | k strong | 0.015 | - |
| k mid | 0.011 | −42.8 | k mid | 0.01 | −35.3 |
| k soft | 0.008 | −55.9 | k soft | 0.008 | −50.6 |
| Mooring line | F1/250 (N) | dF1/250 (%) (from k strong) | Mooring line | F1/250 (N) | dF1/250 (%) (from k strong) |
| k strong | 14.084 | - | k strong | 11.79 | - |
| k mid | 7.848 | −44.3 | k mid | 7.521 | −36.2 |
| k soft | 6.244 | −55.7 | k soft | 5.97 | −49.4 |
| (a) |
| k strong = 70–80 N/m | k strong = 70–80 N/m |
| R(-) | F(-) | dF (%) (from R = 0.2) | Trim (°) | F(-) | dF (%) (from trim = −2°) |
| 0.2 | 0.019 | - | −2° | 0.019 | - |
| 0 | 0.017 | −8.6 | −3° | 0.016 | −16.1 |
| −0.2 | 0.015 | −17.2 | −4° | 0.013 | −32.1 |
| R(-) | F1/250 (N) | dF1/250 (%) (from R = 0.2) | Trim (°) | F1/250 (N) | dF1/250 (%) (from trim = −2°) |
| 0.2 | 14.084 | - | −2° | 14.8 | - |
| 0 | 12.937 | −8.1 | −3° | 12.2 | −17.5 |
| −0.2 | 11.79 | −16.3 | −4° | 9.6 | −35.0 |
| (b) | (c) |
The most efficient strategy is to provide the mooring system with a large horizontal compliance, while the effect of the survivability mode and negative trim position is evident only when the compliance of the system is low. By reducing the stiffness of the main mooring line from strong to soft (as used in the study) an average reduction in the order of 50% can be achieved in the extreme tension, being slightly larger at high
Rc for which there is a larger potential for
Ts to increase (
Figure 6). This kind of reduction is achievable in any condition and can be adopted since the mooring design phases.
On the other hand, the survivability mode is relevant only for cases in which it has not been possible to provide the mooring system with a sufficiently large compliance already since the design stage (e.g., due to limited water depth at the deployment location). In these conditions it allows for average reductions in the mooring tensions in the order of 15%, being very safe to put in place and maintain as it is a passive control strategy Previous findings, based on tests with a comparatively scaled mooring stiffness of 133 N/m (even less compliant than
k strong used in these study), have shown that in these conditions reductions in the order of 20% are possible by adopting a survivability mode [
6].
The adoption of a further negative trim position has also shown to be efficient only in the case of low compliance. In these conditions force reductions in the order of 15% can be achieved per each additional degree of negative trim. However it seems difficult to be able to accurately control the trim with such a precision, especially in extreme conditions, and this effect seems to be correlated to the reduction floating level reduction. In general however a negative trim position is desirable in passive conditions and can be achieved by design through the adoption of a correct distribution of the mass and buoyant element of the device (as done with the new physical model tested herewith), requiring no active control to be maintained.
4.4. Magnitude of the Extreme Response
The most favorable setup in terms of extreme mooring tension is considered as design condition. According to what discussed in the previous section this corresponds to soft moorings. In these conditions the design values have been estimated by interpolation of the data relative to extreme mooring tension and extreme motions with
k soft. A value of
R = −0.2 is assumed, typical of survivability mode conditions. Design values can be compared to the maximum ones experienced during the tests, individually considered and including all tested conditions, showing that by using a design configuration aimed at minimizing the mooring tension a reduction in the extreme motions can also be achieved. In
Table 6, values in design conditions as well as maximum experienced ones including all tested conditions (individually considered) are shown, for the tension in the main mooring line and motion response at model and full scale.
Table 6.
Mooring tension and motion response in design conditions and maximum experienced. Reductions achievable (%) by adopting design conditions are also shown.
Table 6.
Mooring tension and motion response in design conditions and maximum experienced. Reductions achievable (%) by adopting design conditions are also shown.
| Extreme Response | Design conditions | Maximum from all tests | Reduction (%) |
|---|
| Model scale | WD-DanWEC scale | Model scale | WD-DanWEC scale |
|---|
| F1/250 (N) | 5.97 | 7.46 × 10⁵ | 16.9 | 2.11 × 10⁶ | −64.6 |
| Surge1/250 (m) | 0.20 | 10.2 | 0.24 | 12.0 | −15.6 |
| Heave1/250 (m) | 0.12 | 6.0 | 0.19 | 9.6 | −38.1 |
| Pitch1/250 (°) | 18.9 | 18.9 | 20.2 | 20.2 | −6.5 |
The extreme tensions experienced during the tests, considering all configurations, range from 5.3 to 16.9 N, corresponding to a full-scale range of 0.66–2.1 MN. The maximum value corresponds to wave with Tr100 tested in conditions of high Rc and k strong. By adopting the envisaged design conditions, F1/250 can be lowered 65% respect to these values.
With respect to the extreme motions,
Figure 8 shows that by considering all conditions tested the range of extreme motions experienced is 1–1.8 ∙
Hm0 for surge, 0.5–1.5 ∙
Hm0 for heave and 14°–20° for pitch. Assuming an incident
Hm0 = 8.28 m as design condition (
Tr100), the upper bound of the maximum expected motions would be 14.9 m for the surge excursion, 12.4 m for heave and 20° for pitch oscillation heights (oscillation amplitude being the half of it). These values are larger than those actually experienced, reported in
Table 6, as wave reflection in the basin reduced the incident
Hm0. Due to this the highest
Hm0 tested has been 0.15 m, corresponding to 7.45 m at full scale. By extrapolating the results achieved in design conditions to
Tr100, values shown in
Table 7 have been determined.
Table 7.
Design values extrapolated to Tr100 conditions, at model and full scale.
Table 7.
Design values extrapolated to Tr100 conditions, at model and full scale.
| Extreme Response | Extrapolated to Tr100 |
|---|
| Model scale | WD-DanWEC scale |
|---|
| F1/250 (N) | 7.15 | 8.93 × 10⁵ |
| Surge1/250 (m) | 0.243 | 12.1 |
| Heave1/250 (m) | 0.142 | 7.1 |
| Pitch1/250 (°) | 18.9 | 18.9 |
5. Conclusions and Further Work
The structural design of a 1.5 MW pre-commercial demonstrator unit of Wave Dragon to be deployed at the DanWEC test site in Hanstholm, Northern Denmark, is currently being carried out together with the related feasibility analysis [
3]. The unit will have a rated power of 1.5 MW, with a yearly power output of 2 GWh at a location with an average wave power resource of 6 kW/m.
The up-scaling is largely based on the measurement campaign carried out on the prototype during the sea trials and experimental data acquired in previous phases of development [
2]. For the mooring system, however, practical experience is limited as the conceptual setup proposed has never been tested due to limitations imposed by the local conditions. The mooring design process is being therefore carried out numerically, but due to the complexity of the system it is constantly complemented and targeted by experimental results from the tank testing of a 1:50 scale model.
This paper has presented the findings of a series of tank tests which have been carried out with the objective of quantifying the response of the device to extreme conditions typical of the DanWEC location, in terms of motions and tension in the main mooring line. The best strategies to reduce the design loads in the main mooring line have also been assessed.
The study has shown that tension in the main mooring line reduces significantly when the system’s natural period in surge,
Ts, increases. When the surge resonant frequency is shifted away from the frequency band at which the second order wave forces act, the low frequency peak in the tension response is notably reduced (
Figure 9).
The most efficient strategy to do this has proved to be allowing a large horizontal compliance to the system by decreasing the stiffness of the main mooring line. The adoption of a very compliant system, providing surge natural period (Ts) typically in the order of 100 s, shall therefore be assumed as the most desirable design configuration. This has the effect of reducing the extreme tension in the main mooring line up to 65% with respect to stiffer configurations with Ts in the order of 50 s.
Another strategy assessed is the adoption of the so-called survivability mode. This consists in lowering the floating level of the device to its minimum, by opening the valves of the air chambers and venting all the air out of them, and can be realized and maintained passively even in the case of loss of grid connection and at the same time malfunctioning of the emergency generator system. Mooring tension can be also reduced through the appropriate mass and buoyancy distribution on the device, as done with the new scaled model tested here for the first time, so that it can be passively maintained slightly tilted to the front (negative trim), with the ramp lower than the back. Both these strategies have the consequence of increasing the surge added mass of the system, hence its
Ts [Equation (1)]. Their efficiency was already shown in a previous study [
6] and it is confirmed here only limitedly to configurations with rigid moorings, else their effect is overcome by the large compliance of the system. In these conditions their effects (which seem to be correlated) reach a 15%–30% reduction of the extreme mooring tension.
Overall, two scenarios can be therefore pictured:
In the most desirable one, in which it is possible to provide a large horizontal compliance to the system (typically with Ts in the order of 100 s), the adoption of the survivability mode would not have practical effect in reducing the mooring line tension. In these conditions the lowest extreme values of mooring tensions are experienced and shall be therefore assumed as design conditions. In any case the maximum loads from impacting waves on certain structural parts will be diminished in survivability mode.
If it is not possible to provide enough compliance to the system (with Ts in the order of 50 s), then the adoption of the survivability mode helps decreasing the extreme mooring tension as much as the system is stiff.
By adopting the most favorable design conditions (scenario no. 1) for the WD-DanWEC, it has been estimated that in a 100 year return period storm with Hm0 = 8.28 m and Tp = 12.9 s would determine an extreme tension in the main mooring line of about 0.9 MN. In terms of extreme motions, the height of oscillation in heave and pitch would be respectively of 7 m and 19°, while the maximum surge excursion would be 12 m.
It has been confirmed that the extreme response in mooring tension is more sensitive to the low frequency part of the spectral energy, especially to the components close to the surge natural frequency. Steeper waves tend to induce a larger energy transfer at low frequencies, through the non-linear wave structure interaction. Therefore, although less energetic in absolute terms, they tend to determine larger response in mooring tension. In bottom-limited locations typical of the North Sea, such as DanWEC test center where the water depth is around 30 m, steep waves are rather common, especially in storm conditions.
Future work will be focused on the assessment of alternative mooring configurations, using the software DeepC which allows performing time-domain simulations of the composite system (Wave Dragon and moorings) [
9]. The alternative configurations considered will differ in terms of the external components of the mooring system (
i.e., the CALM system), with the goal of providing the desired level of horizontal compliance.
A preliminary economic assessment of the different mooring configurations shall also be carried out, as if more than one configuration will prove suitable to provide the desired compliance the choice will be based on the lowest cost considering CAPEX as well as OPEX.

