1. Introduction
Large amounts of natural gas, predominantly methane, are stored in gas hydrates in sediments below the seafloor and the permafrost [
1]. Current estimates of the global methane hydrate inventory range between 1000 and 10,000 Gt of carbon [
2,
3,
4,
5]. Motivated by these results, gas hydrate research activities worldwide center around the exploitation of this potential new energy resource. The methods that are currently discussed to produce the methane from gas hydrates are generally derived from standard techniques used in conventional oil and gas business,
i.e., reduction of the pressure in the reservoir and thermal stimulation, as well as injection of hydrate inhibitors, such as salt, to induce dissociation of the gas hydrates [
6]. In addition, the substitution of CH
4 by CO
2 as guest molecule in the gas hydrate structure has been proposed as a more elegant production technology with respect to greenhouse gas policies [
7,
8].
All of these methods have been studied in laboratory experiments to validate their feasibility as well as in numerical simulations to gain first ideas about their applicability on reservoir scale. First production tests were carried out in the permafrost reservoir of Mallik in northern Canada in 2002 [
9] as well as in 2008 [
10]. Gas hydrates were successfully destabilized by injection of hot water and by depressurization, respectively, producing limited amounts of CH
4 gas over a few days. Further field trials in 2012 will test the chemical exchange of methane in gas hydrates by injection of CO
2 below the permafrost of the Alaska North Slope [
11] and the depressurization technique in the first offshore test in the Nankai Trough [
12,
13].
Overall, the conclusions drawn from those studies are that thermal stimulation by injecting hot water is slow and inefficient, whereas depressurization seems to be the more promising strategy [
6]. However, due to the endothermic nature of gas hydrate dissociation, in the long run, the reservoir will cool down, re-establishing stable conditions for gas hydrates and consequently, methane production rates are expected to cease after some time [
14,
15].
Thus, being able to achieve stable and economic methane production rates will require a combination of depressurization and methods (re)activating the methane hydrate reservoir.
One elegant way to activate the methane hydrate reservoir is the injection of CO
2. Since CO
2 hydrate is thermodynamically more stable than CH
4-hydrate and both form structure-I, the exchange reaction will proceed exothermically [
16], adding heat to the system. Besides its attractiveness in combining energy production with CO
2 storage as a measure to mitigate further increases in greenhouse gas emissions to the atmosphere, a technological advantage is that it sustains the integrity and geomechanical stability of the sediments, thus reducing the potential risk of slope failures.
Several laboratory-based studies have shown the feasibility of the hydrate conversion reaction on pure or sediment-dispersed gas hydrates and from molecular scale to volumes of a few liters (an overview is given in
Discussion). However, the overall reaction rate turns out to be quite sluggish and the conversion is often incomplete. This results primarily from a shell of CO
2-hydrate that forms around the methane hydrate grain. Any further mass transport of CO
2 into and CH
4 out of the inner core is drastically slowed down or even completely inhibited as analogous experiments with C
2H
6 as attacking guest molecules have shown [
17]. Moreover, excess water, as usually encountered in the pore space of hydrate deposits, generally induces immediate CO
2-hydrate formation blocking permeable pathways for the gas exchange.
Common to all those studies is that the chosen pressure-temperature conditions were either within the stability fields of CO2- and CH4-hydrate or only CO2-hydrate. Hence, any attempt towards economic CH4 production rates based on the CH4-to-CO2-hydrate conversion requires a different approach.
In the Ignik Sikumi Gas Hydrate Field Test (January-April 2012) [
11] on the Alaska North Slope a 2-stage Huff’n’Puff-like procedure was, thus, followed. First a CO
2/N
2 gas mixture (~6000 m
3 over 13 days) was injected into the CH
4-hydrate bearing sandstone. Subsequently, gas was produced by depressurization for 6 weeks with CH
4 contents dominating the produced gas mixture already after 2 days [
18].
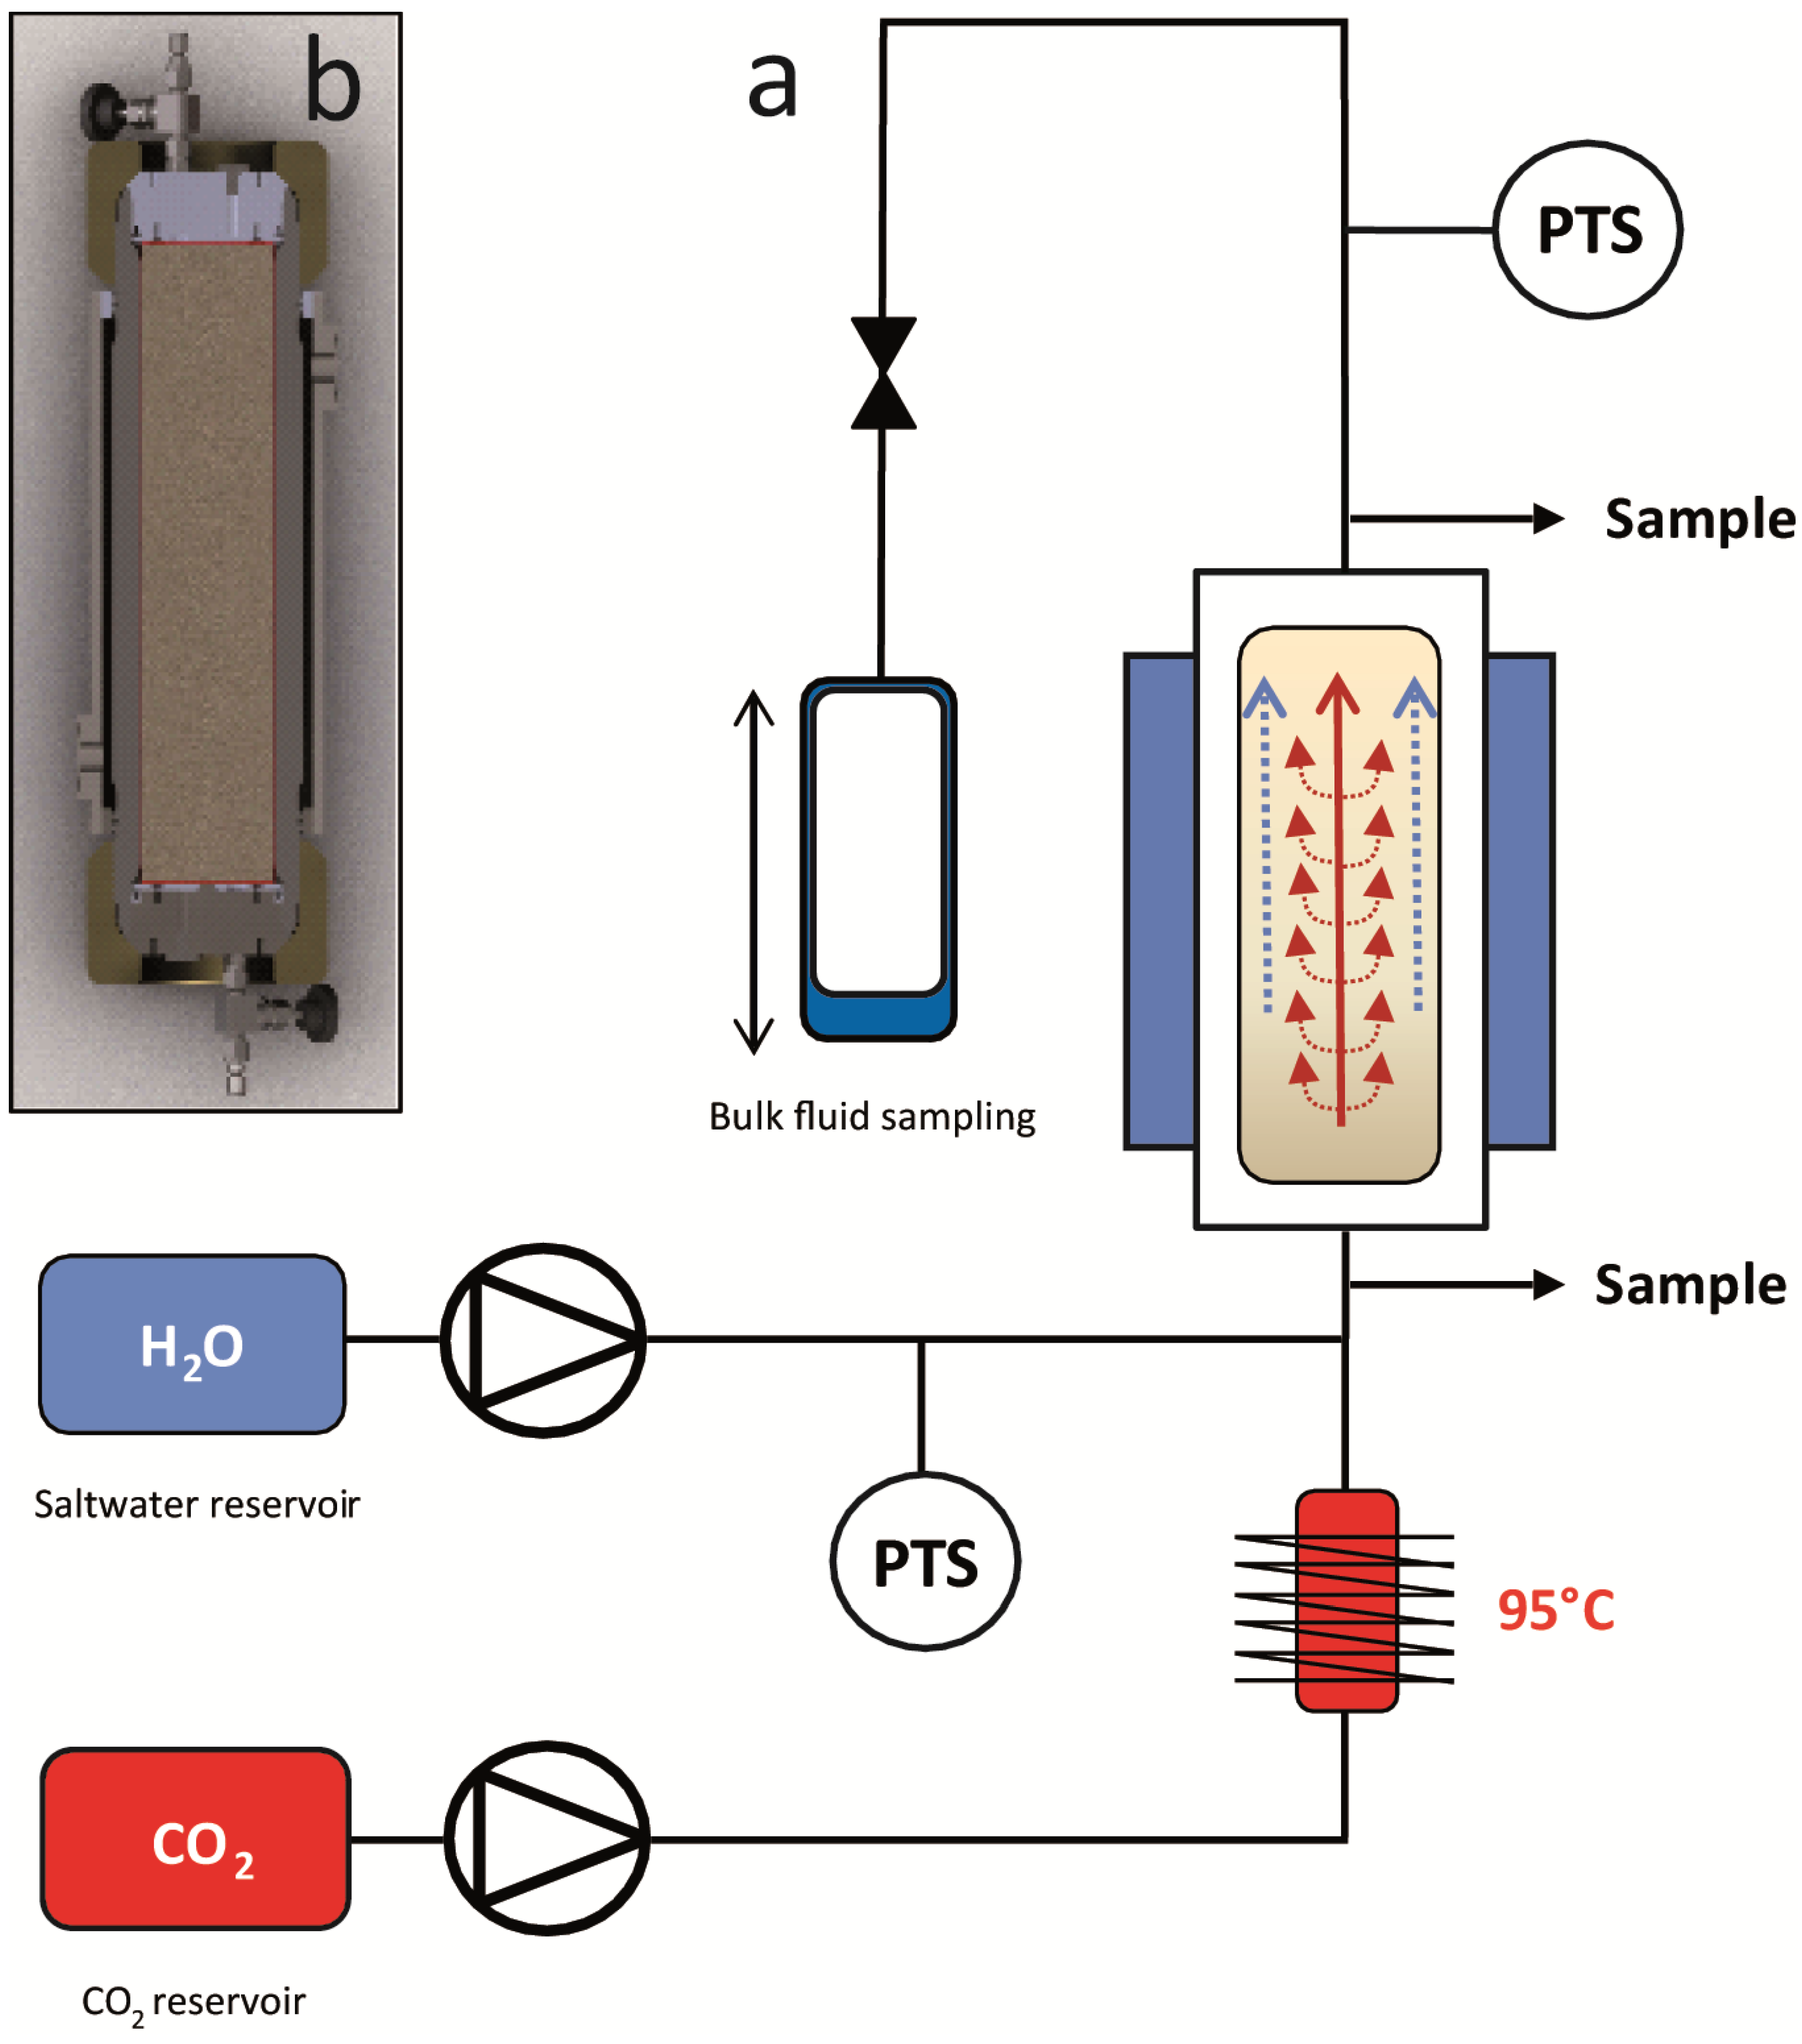
Here, we present a different strategy: in our experiments we have injected hot (95 °C), supercritical CO2 into CH4-hydrate bearing sand at typical marine p-/T-conditions. The hot CO2 was injected in several discrete intervals, actively dissociating the CH4-hydrate. Each injection was followed by a period of thermal and chemical equilibration of the system. The results are analyzed and presented in terms of CH4 production rate and overall CH4 yield, hydrate conversion efficiency, degree of CO2 and H2O retention in the system, as well as efficiency of the energy input for CH4-hydrate dissociation. Partitioning of the components CO2 and CH4 into the different liquid, gaseous and hydrate phases is estimated and the results are compared in light of previous experiments which used cold CO2. Finally, we conclude with perspectives for this hydrate exploitation strategy and outline the steps that are necessary to develop a successive exploitation strategy for marine gas.
3. Results
3.1. Analysis of Mass Balances
3.1.1. CH4 Inventory and CO2 Inflow during Injection and Equilibration Periods
Mass balances were calculated from measured compositions of influent and effluent fluid streams.
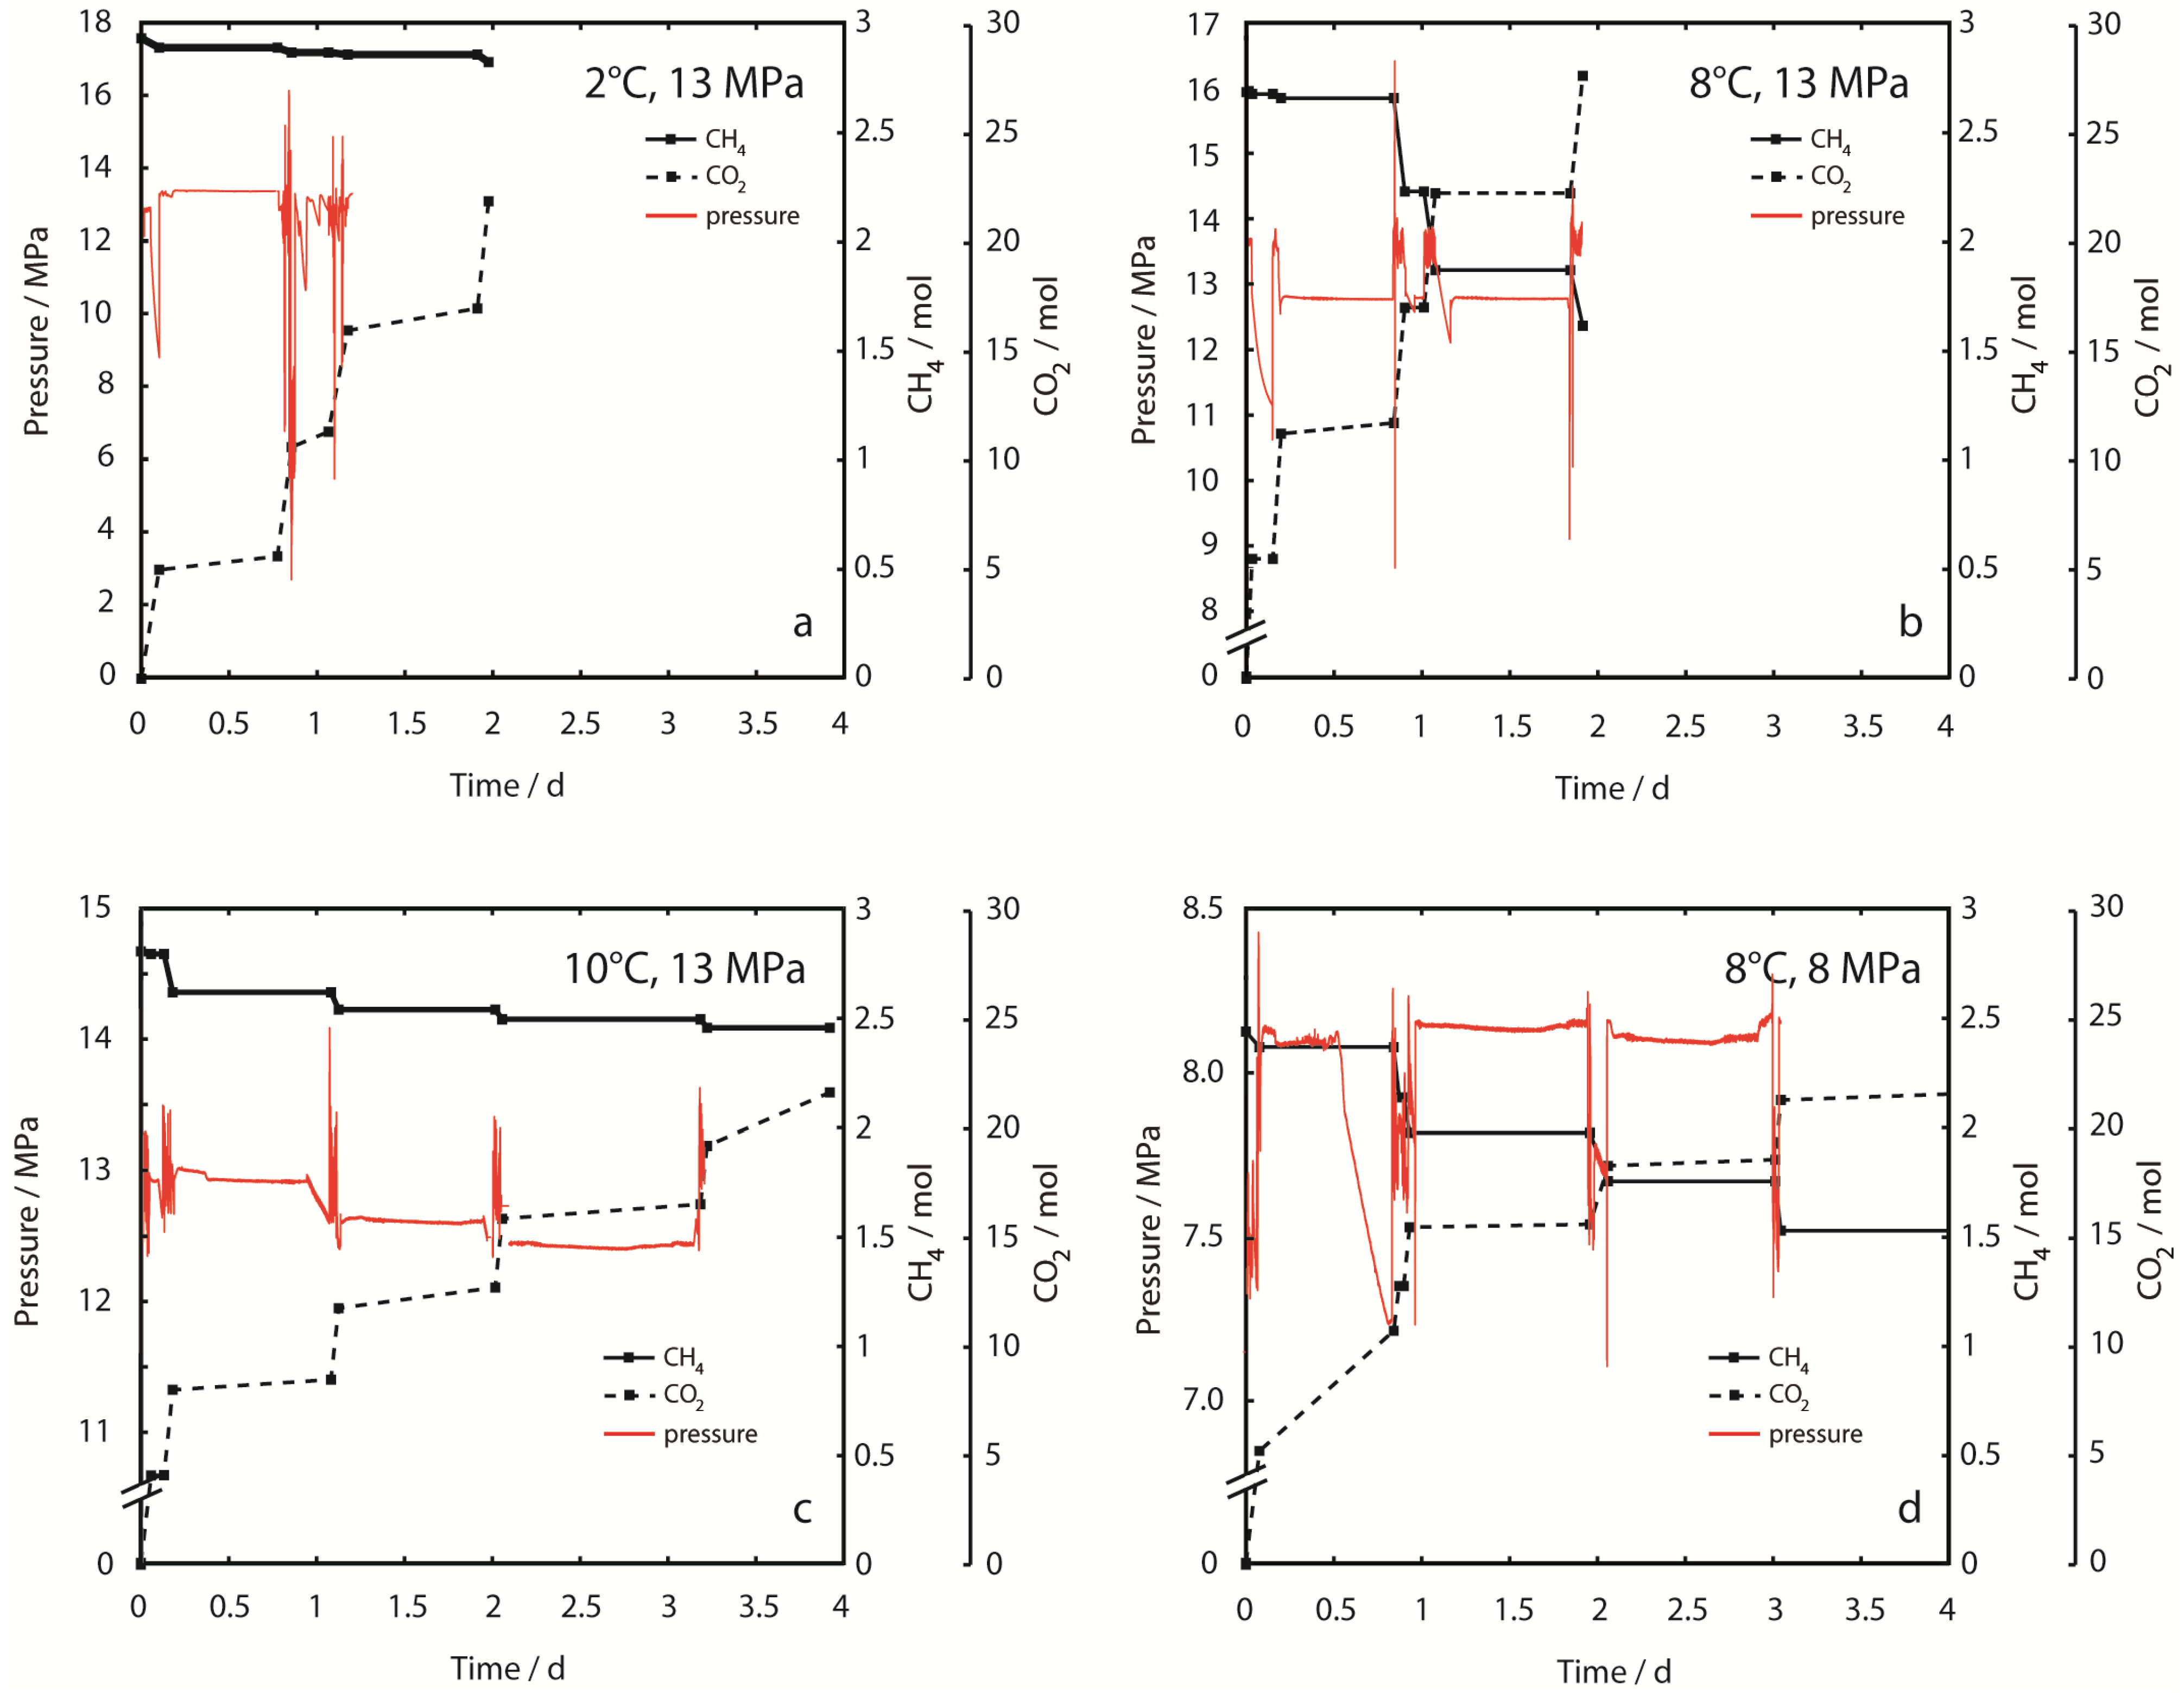
Figure 3 shows the time-dependent CH
4 inventory and the cumulative amount of injected CO
2 during the whole experimental period. The bulk sample composition was altered considerably by production of CH
4 and retention of CO
2 during injection/production intervals, but was only slightly changed during equilibration intervals as a result of pressure-controlled slow injection of CO
2.
CH
4 production was clearly dependent on sediment temperature and hydrostatic pressure. Between 2% and 35% of the initial amount of CH
4 fixed in hydrate was produced after stepwise injection of 22 mol and 21 mol CO
2 (
Figure 3a at 2 °C, 13 MPa and 3d at 8 °C, 8 MPa, respectively). From the graphs of effluent fluid pressure in
Figure 3, it is apparent that pressure is not constant during injection periods. Pressure oscillations are partly due to the backpressure regulation mechanism where pressure is discontinuously released by a valve, or due to accidental freezing of regulators after cooling from adiabatic gas expansion. However, exceptionally large pressure spikes were observed in Experiment 1 at 2 °C, 13 MPa. These pressure spikes occurred after sample permeability decreased drastically, suggesting rapid CO
2-hydrate formation. Permeability could only be restored after sample fracturing with very high differential pressures >15 MPa. Sample blocking became irreversible by experimental means at the end of Experiment 1.
Figure 3.
Inventory of CH4, cumulative amount of injected CO2 and sample effluent pressure (peffl) in each of the experimental runs. (a) 2 °C, 13 MPa; (b) 8 °C, 13 MPa; (c) 10 °C, 13 MPa; (d) 8 °C, 8 MPa. It should be noted, that the axis scaling for peffl is different for every experiment. CO2 was injected stepwise as hot supercritical CO2,sc and at a constant flow rate (steep gradients in dashed lines). Injection of CO2 at constant pressure and low flow rate alternated with equilibration periods. Fluids including CH4 could only exit the system during injection/production periods. CH4 production is shown as a decrease of the CH4 inventory. Effluent fluid pressure (peffl) is constant during equilibration periods. Strong aberrations indicate technical problems, which could be solved without destabilization of the hydrate sample. However, peffl is unstable during injection periods. Massive pressure spikes were observed in Experiment 1 (2 °C, 13 MPa) after sample permeability changed due to CO2-hydrate formation. Sample permeability could be restored temporarily by fracturing at high differential pressures (>15 MPa). CO2-hydrate formation eventually led to complete congestion of the fluid pathways at the end of the experiment. Sample blocking was not observed in other experiments at higher temperatures.
![]()
3.1.2. CH4 Production
Generally, data in this study are presented as amounts of substance or masses of the components CH
4, CO
2 and H
2O which were retained inside the pressure vessel,
i.e., the development of the inventory of the respective components in the bulk sample, as a function of the amount of injected CO
2. This approach allows for easy comparison of CH
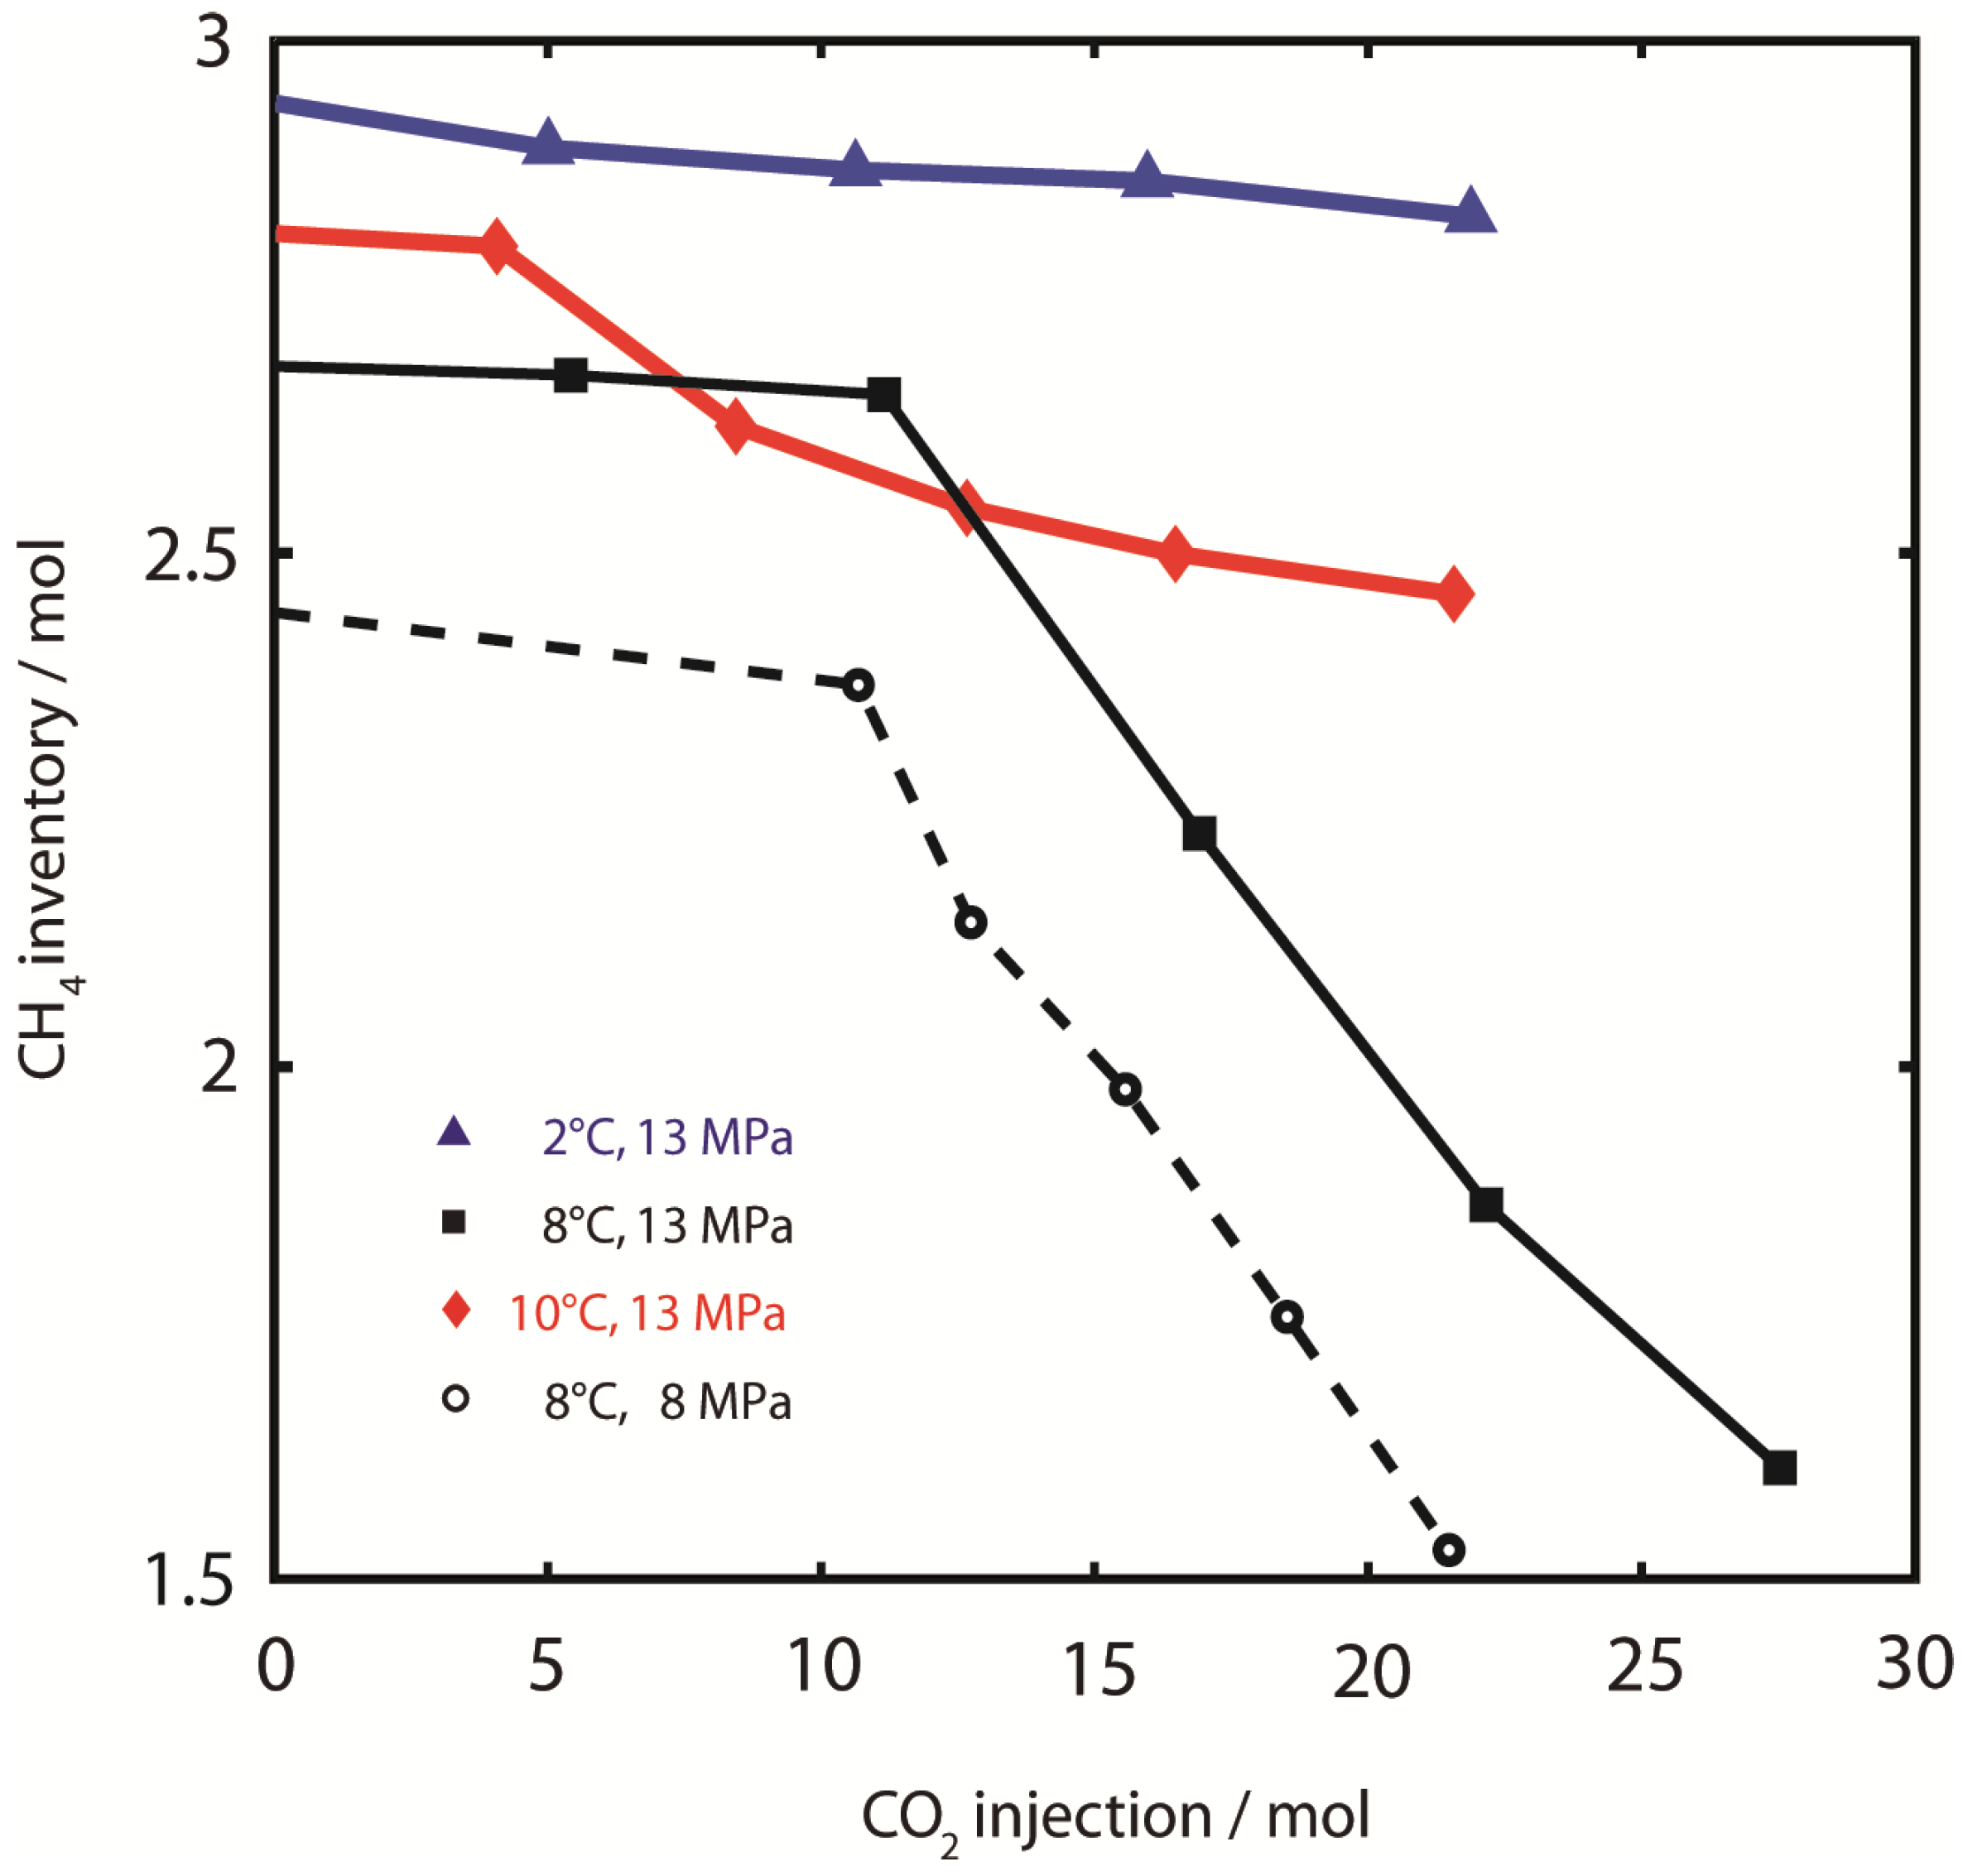
4 production efficiencies as shown in
Figure 4. Changes in inventory amounts are calculated by balancing substance amounts of influent and effluent fluids. Results in
Table 2 indicate that CH
4 concentration in the overall effluent gas was comparatively high during early injection steps. However, only small amounts of bulk effluent gas consisting of both CH
4 and CO
2 were produced. During later injection steps, the produced fluid volume is much larger with high amounts of CO
2 contributing to the effluent gas. Therefore, the absolute amounts of produced CH
4 are increased while the relative amounts of CH
4 are decreased. We found that CH
4 production from CO
2 injection is most efficient at 8 °C, while the gas recovery was apparently independent of pressure. CH
4 recovery at 2 °C and 10 °C was both impaired compared to experiments at 8 °C. The experiment at 8 °C, 13 MPa was terminated after the injection of 27.5 moles of CO
2. At this point, 31% of the available hydrate reservoir was depleted and produced as effluent CH
4. Particularly at 8 °C, CH
4 production showed a linear trend with respect to CO
2 injection, which indicates that CH
4 from the CH
4 inventory can be produced with constant efficiency using CO
2,sc. The experiments were stopped before reaching a maximum production yield after the volume of injected CO
2 was approximately equal to the sample void volume.
Figure 4.
CH4 production. CH4 sample inventory during injection of CO2. Low CH4 production efficiency and yield was observed at 2 °C, 13 MPa () and 10 °C, 13 MPa (). CH4 production efficiency and yield were highest at 8 °C (both runs).
Figure 4.
CH4 production. CH4 sample inventory during injection of CO2. Low CH4 production efficiency and yield was observed at 2 °C, 13 MPa () and 10 °C, 13 MPa (). CH4 production efficiency and yield were highest at 8 °C (both runs).
During the initial saltwater percolation period prior to CO2 injection (data not shown), only minor amounts of CH4 were produced with the effluent water. The continuously injected saltwater is undersaturated with respect to CH4 and therefore stimulates the dissociation of CH4-hydrates until saturation is reached. The occurrence of this effect indicates a satisfactory surface contact between the percolating liquids and the hydrate. However, the production of free CH4,g was not observed during the saltwater percolation period.
Table 2.
Effluent amounts of CH4 and CO2. Amounts of CH4 and CO2 recovered in the effluent fluid for each injection step. The third column for each injection step shows the CH4 content in the effluent gas consisting of only CH4 and CO2. Although the amounts of effluent CH4 increase, the CH4 content is low because of large amounts of effluent CO2
| Experimental Conditions | Effluent gas composition |
|---|
| Inj. Step 1 | Inj. Step 2 | Inj. Step 3 | Inj. Step 4 | Inj. Step 5 |
|---|
| n (mol) | CH4 /% (v/v) | n (mol) | CH4 /% (v/v) | n (mol) | CH4 /% (v/v) | n (mol) | CH4 /% (v/v) | n (mol) | CH4 /% (v/v) |
|---|
| CH4 | CO2 | CH4 | CO2 | CH4 | CO2 | CH4 | CO2 | CH4 | CO2 |
|---|
| 2 °C, 13 MPa | 0.004 | 0.02 | 17.3 | 0.022 | 1.16 | 1.8 | 0.011 | 1.44 | 0.7 | 0.034 | 2.21 | 1.5 | / | / | / |
| 8 °C, 13 MPa | 0.009 | 0.02 | 29.3 | 0.019 | 0.01 | 65.2 | 0.317 | 3.33 | 8.7 | 0.237 | 4.09 | 5.5 | 0.255 | 4.05 | 5.9 |
| 10 °C, 13 MPa | 0.142 | 1.45 | 8.9 | 0.175 | 2.81 | 5.9 | 0.079 | 2.71 | 2.8 | 0.044 | 2.86 | 1.5 | 0.039 | 2.55 | 1.5 |
| 8 °C, 8 MPa | 0.070 | 0.05 | 56.2 | 0.231 | 1.50 | 13.3 | 0.162 | 2.3 | 6.5 | 0.221 | 2.4 | 8.4 | 0.227 | 2.7 | 7.7 |
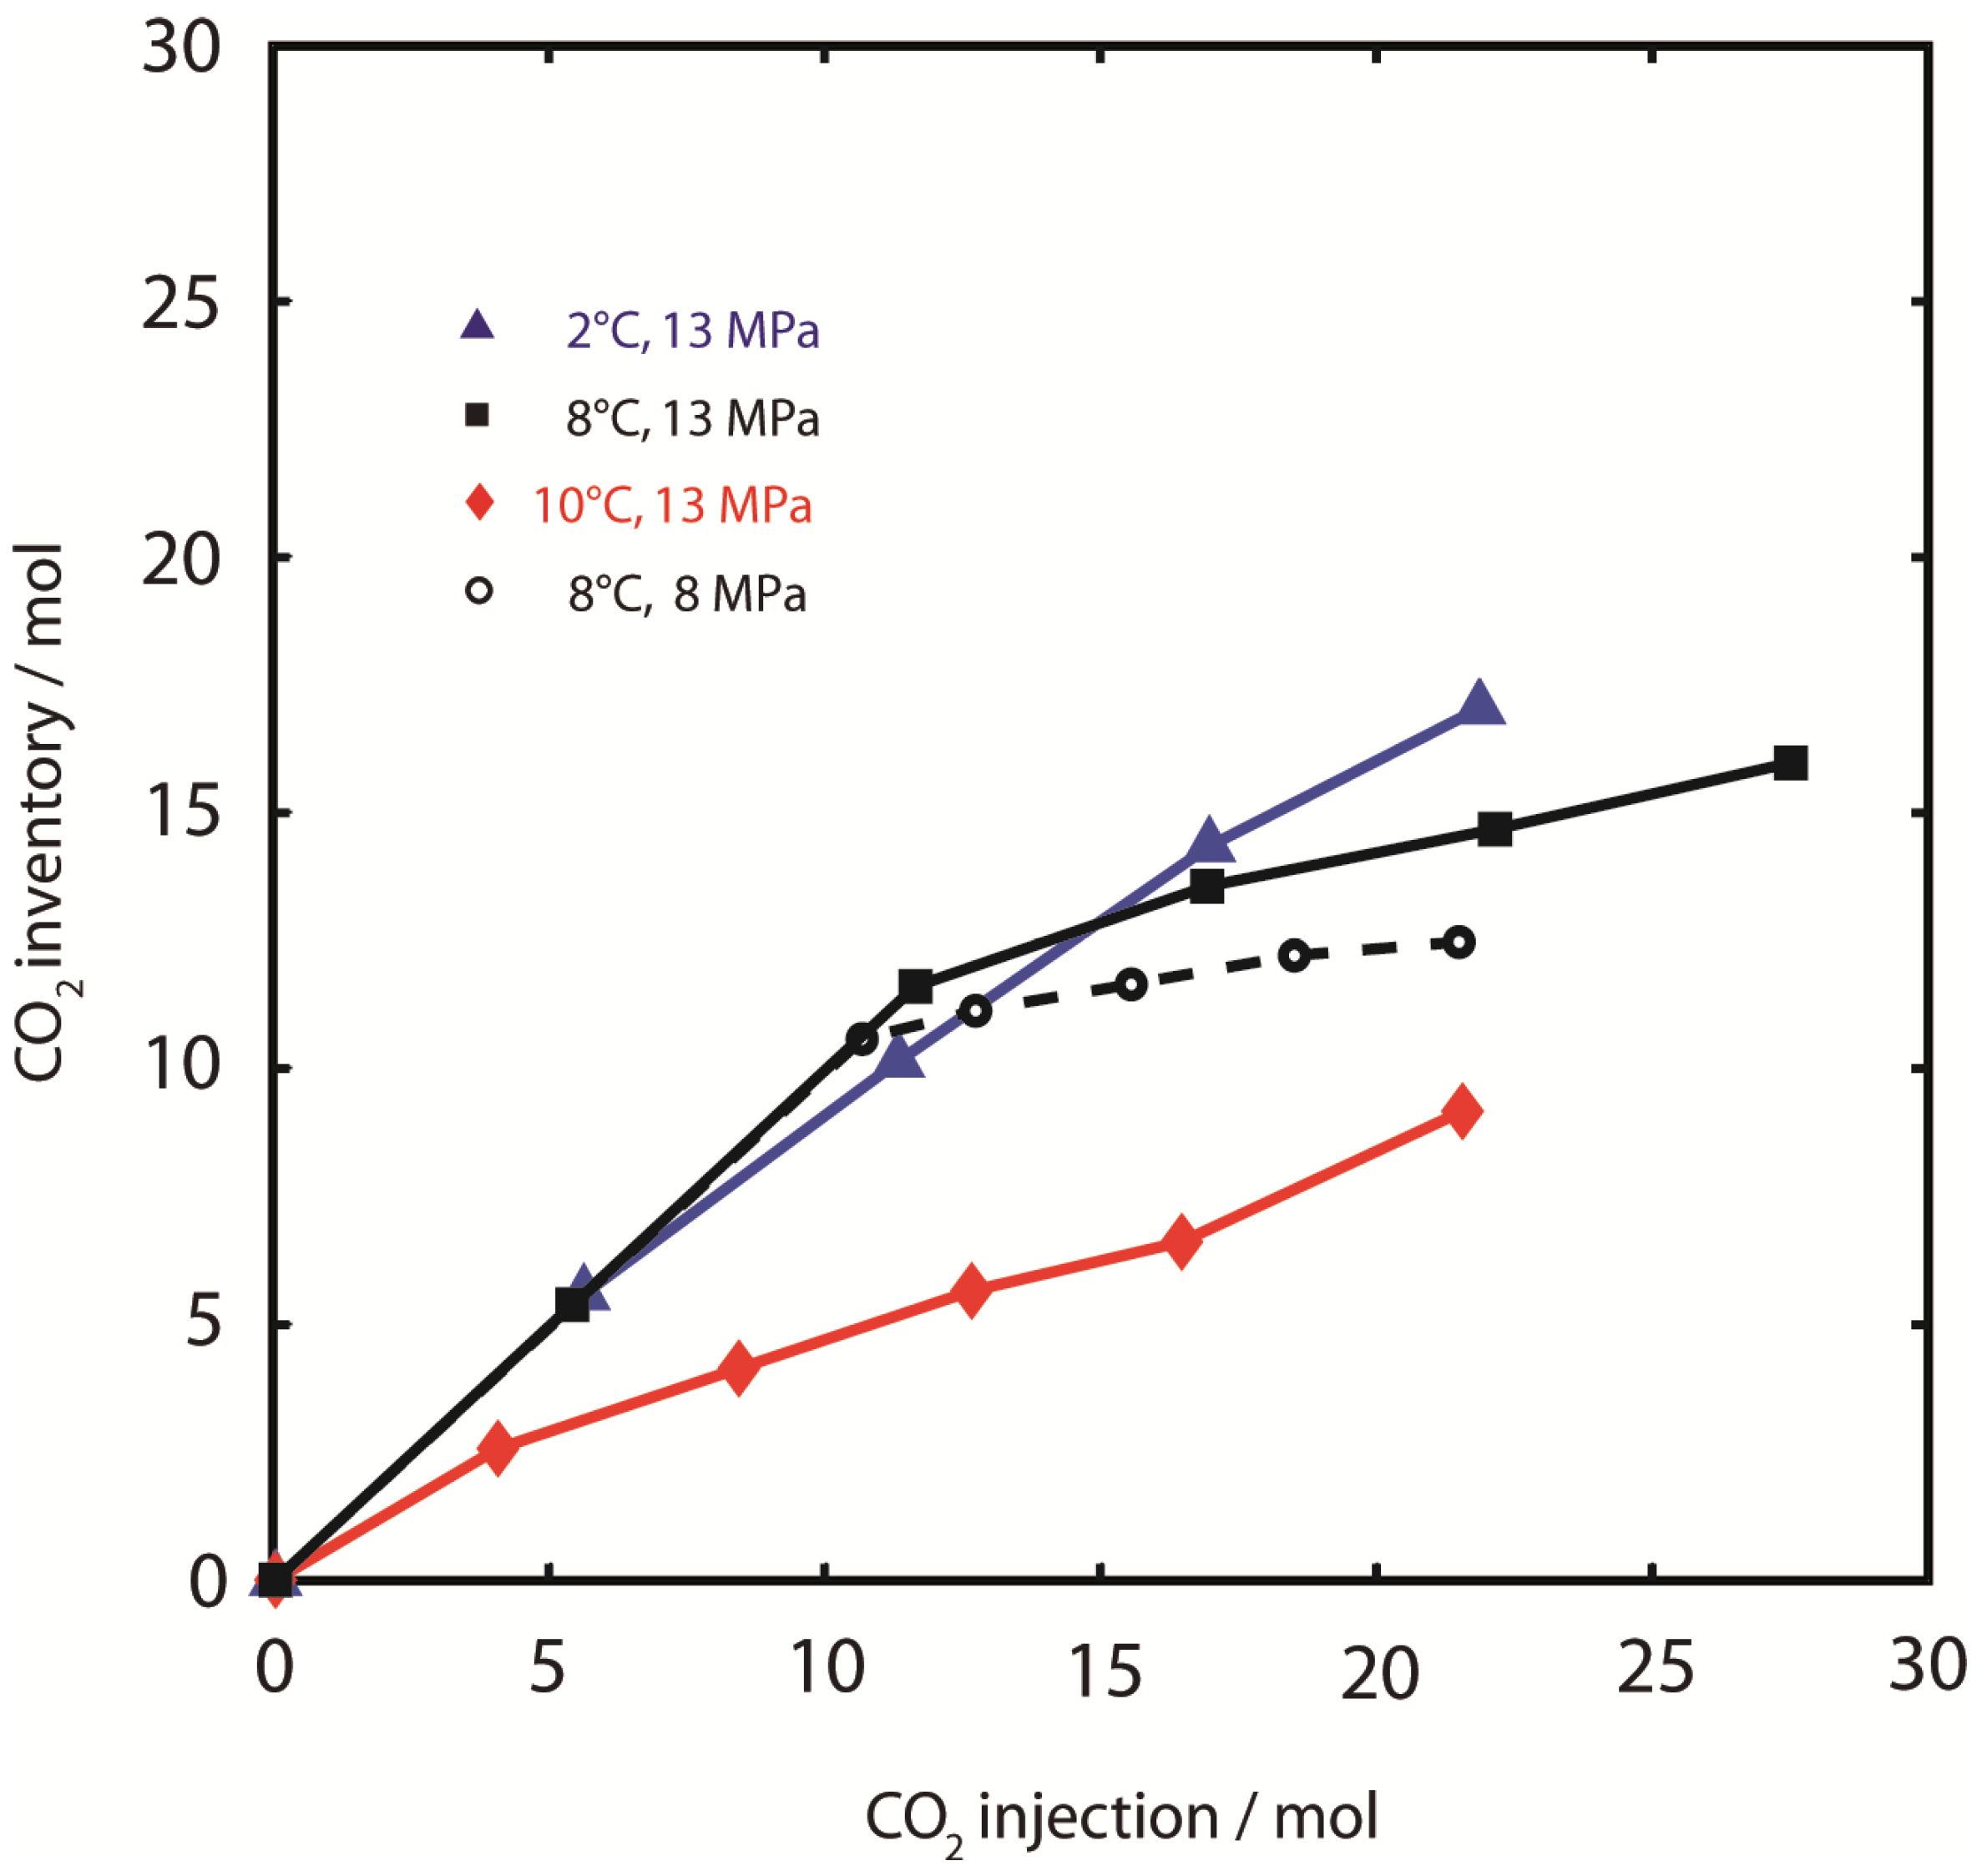
3.1.3. CO2 and H2O Retention
In addition to CH
4 production, the efficient retention of CO
2 and H
2O is important for the overall process. As shown in
Figure 5, CO
2 retention was most efficient at 2 °C, 13 MPa, where the thermodynamic conditions were most favorable for CO
2-hydrate formation. Increasing amounts of CO
2 were retained over the entire experimental period with a linear increase in the CO
2 inventory until the experiment was stopped after loss of hydraulic conductivity. Also in experiments at higher temperatures the maximum CO
2 retention capacity was not reached until the end of the experiments. However, CO
2 retention efficiency was lower than at 2 °C. Similar to CH
4 production, differences in CO
2 retention were minor in experiments at 8 °C at different pressures. While the retention during the first injection steps was comparable to the retention at 2 °C, it was less efficient during later injection steps (
nCO2,inj > 10 mol) where substantial amounts of the injected CO
2 were produced in the effluent gas stream. At 10 °C, 13 MPa,
i.e., slightly above the CO
2-hydrate dissociation temperature, CO
2 breakthrough occurred almost immediately after injection.
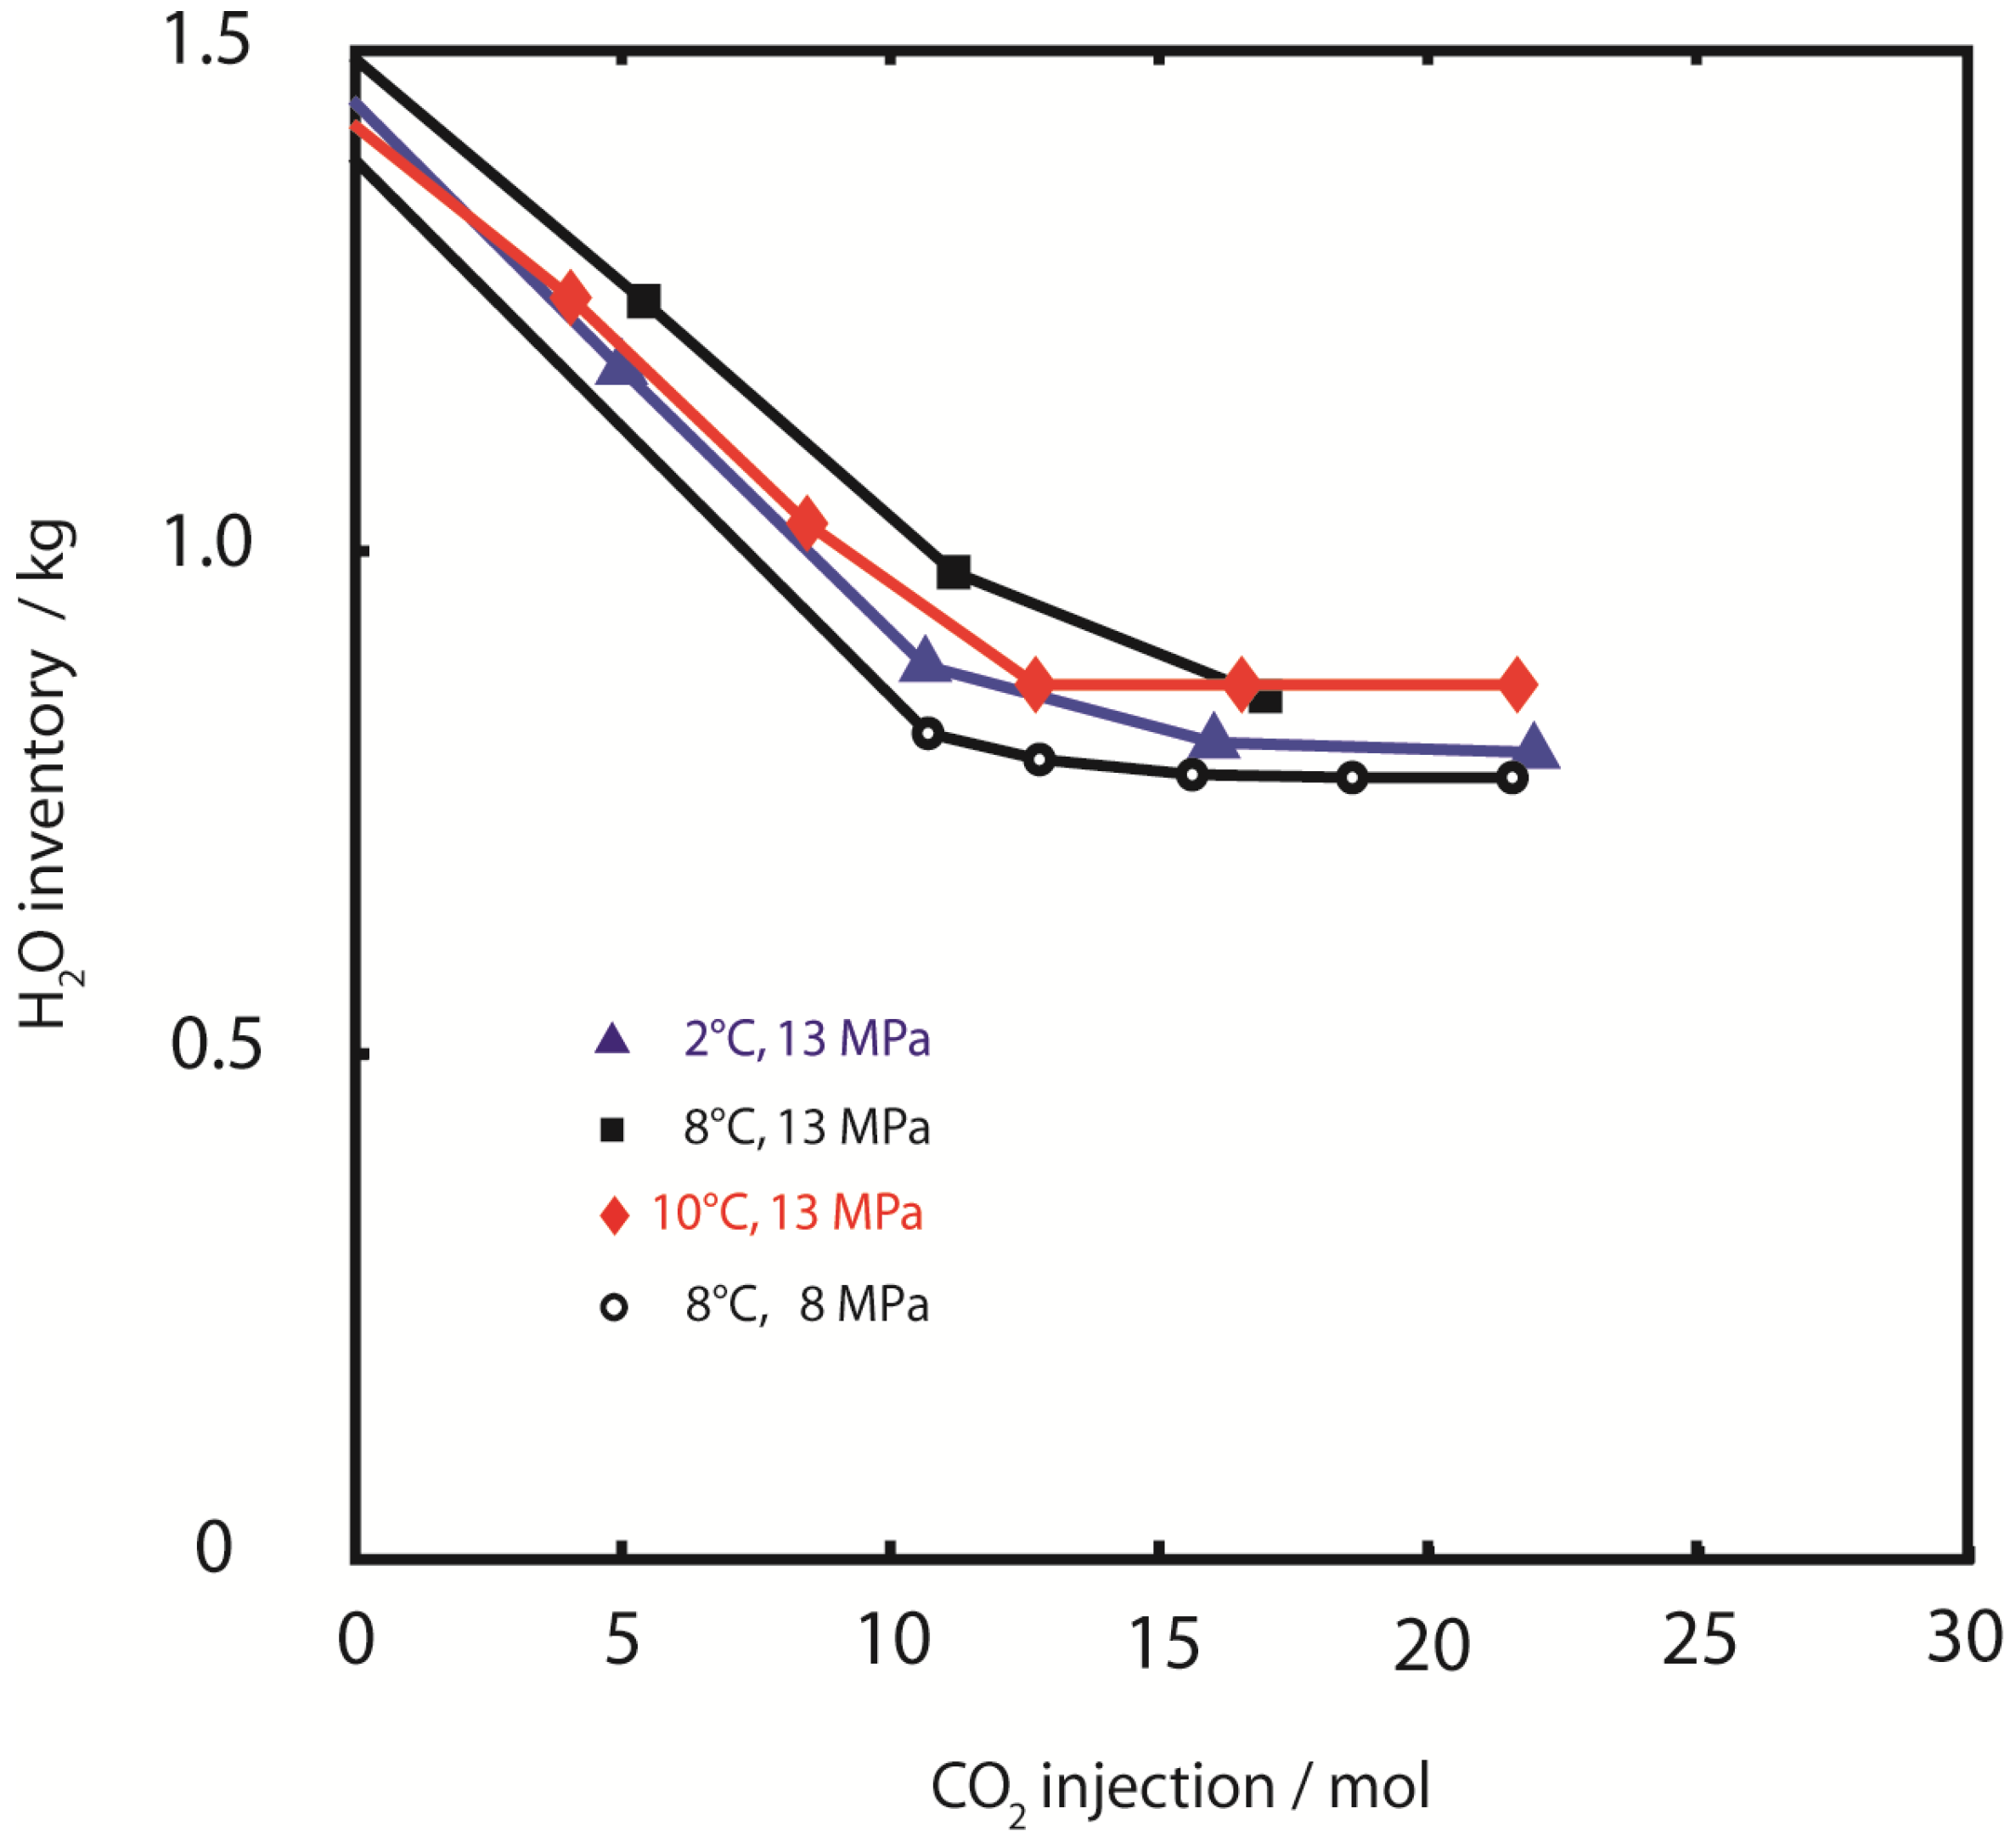
In contrast to CH
4 production and CO
2 retention, the efficiency of water retention was similar in all experiments. Approximately 50% of the initial water was retained in the pressure vessel at all temperatures and pressures (
Figure 6).
Figure 5.
CO2-retention. CO2 sample inventory during injection of CO2. CO2 retention efficiency was highest at 2 °C, 13 MPa (). Rapid CO2 breakthrough was observed at 10 °C, 13 MPa (). CO2 retention efficiency at 8 °C (■, 13 MPa and ○, 8 MPa) was dependent on pressure conditions.
Figure 5.
CO2-retention. CO2 sample inventory during injection of CO2. CO2 retention efficiency was highest at 2 °C, 13 MPa (). Rapid CO2 breakthrough was observed at 10 °C, 13 MPa (). CO2 retention efficiency at 8 °C (■, 13 MPa and ○, 8 MPa) was dependent on pressure conditions.
Figure 6.
Water retention. H2O sample inventory during injection of CO2. Retention of pore water was similar for all experiments with approximately 50% of initial water content (pore water plus hydrate water) being removed.
Figure 6.
Water retention. H2O sample inventory during injection of CO2. Retention of pore water was similar for all experiments with approximately 50% of initial water content (pore water plus hydrate water) being removed.
Typical conductivity values from discontinuous measurements of bulk effluent water samples were 10.3 ± 3.5% below influent saltwater conductivities, indicating partial freshening of the pore water by hydrate water. A small number of samples showed exceptionally low conductivity values compared to influent saltwater medium values (injection step 2 at 10 °C, 13 MPa: 16% of saltwater conductivity, injection step 4 at 8 °C, 8 MPa: 67% of saltwater conductivity). These substantial differences could be due to errors during sampling. However, in accordance to volume balance calculations in the next paragraph they are probably due to distinct events of discharge of low salinity hydrate water released from hydrate dissociation. Conductivity measurements were not used to quantify hydrate dissociation inside the reactor since it was not possible to adequately calculate effects of mixing and transport of H2O in the pressure reactor. Additionally, amounts of discharged H2O were relatively small and could be easily contaminated by leakage of water from the sampling container into the sampling bag. Because of such a leak in the sampling bag, water inventory values for the two last injection steps at 8 °C, 13 MPa could not be calculated.
3.1.4. Investigation of Sampling and Analytical Error
Error in results was investigated from mass balancing after release of fluids from the high-pressure vessel at the end of Experiments 3 and 4. However, mass balance analysis was not carried out in Experiments 1 and 2, since we have attempted to sample undisturbed hydrates at the end of each experiment instead. While fluid release for mass balancing had to be performed slowly, hydrate sampling has to be performed fast and demanded rapid release of remaining pressurized fluids.
However, depressurization and bulk effluent sampling after completion of the experiment by stepwise releasing large amounts of CO2,liq via the manually adjusted backpressure regulator was very problematic. The instant expansion of the CO2, especially after lowering the backpressure, led to pressure spikes in the sampling lines and bag due to flow restrictions in the tubing which had a length of several meters. This caused substantial leakage and extensive loss of effluent gas, which could be visually observed. Pressure spikes were even more distinct and severe due to frequent freezing of the valves from adiabatic gas expansion and subsequent expulsion of CO2 after required additional lowering of the backpressure settings and warming of the frozen valve and tubing. However, this effluent gas loss during final depressurization was of minor importance during the experiment because of much lower flow rates and no adjustment of the backpressure regulator being necessary.
Because of these problems with depressurization, final recovery of CO2 and CH4 showed some deviation with respect to amounts of injected CO2 or initial CH4 amounts. The error in CO2 recovery was −6.5 mol CO2 (30% from total injected CO2) in experiment 3, and −3.4 mol CO2 (16% from total injected CO2, in experiment 4). Mass balance deviations for CH4 were −1.2 mol (40% from initial CH4) in experiment 3 and 0.4 mol (14% from initial CH4) in experiment 4. However, water recovery was excellent in both experiments with a cumulative relative error of < 2%.
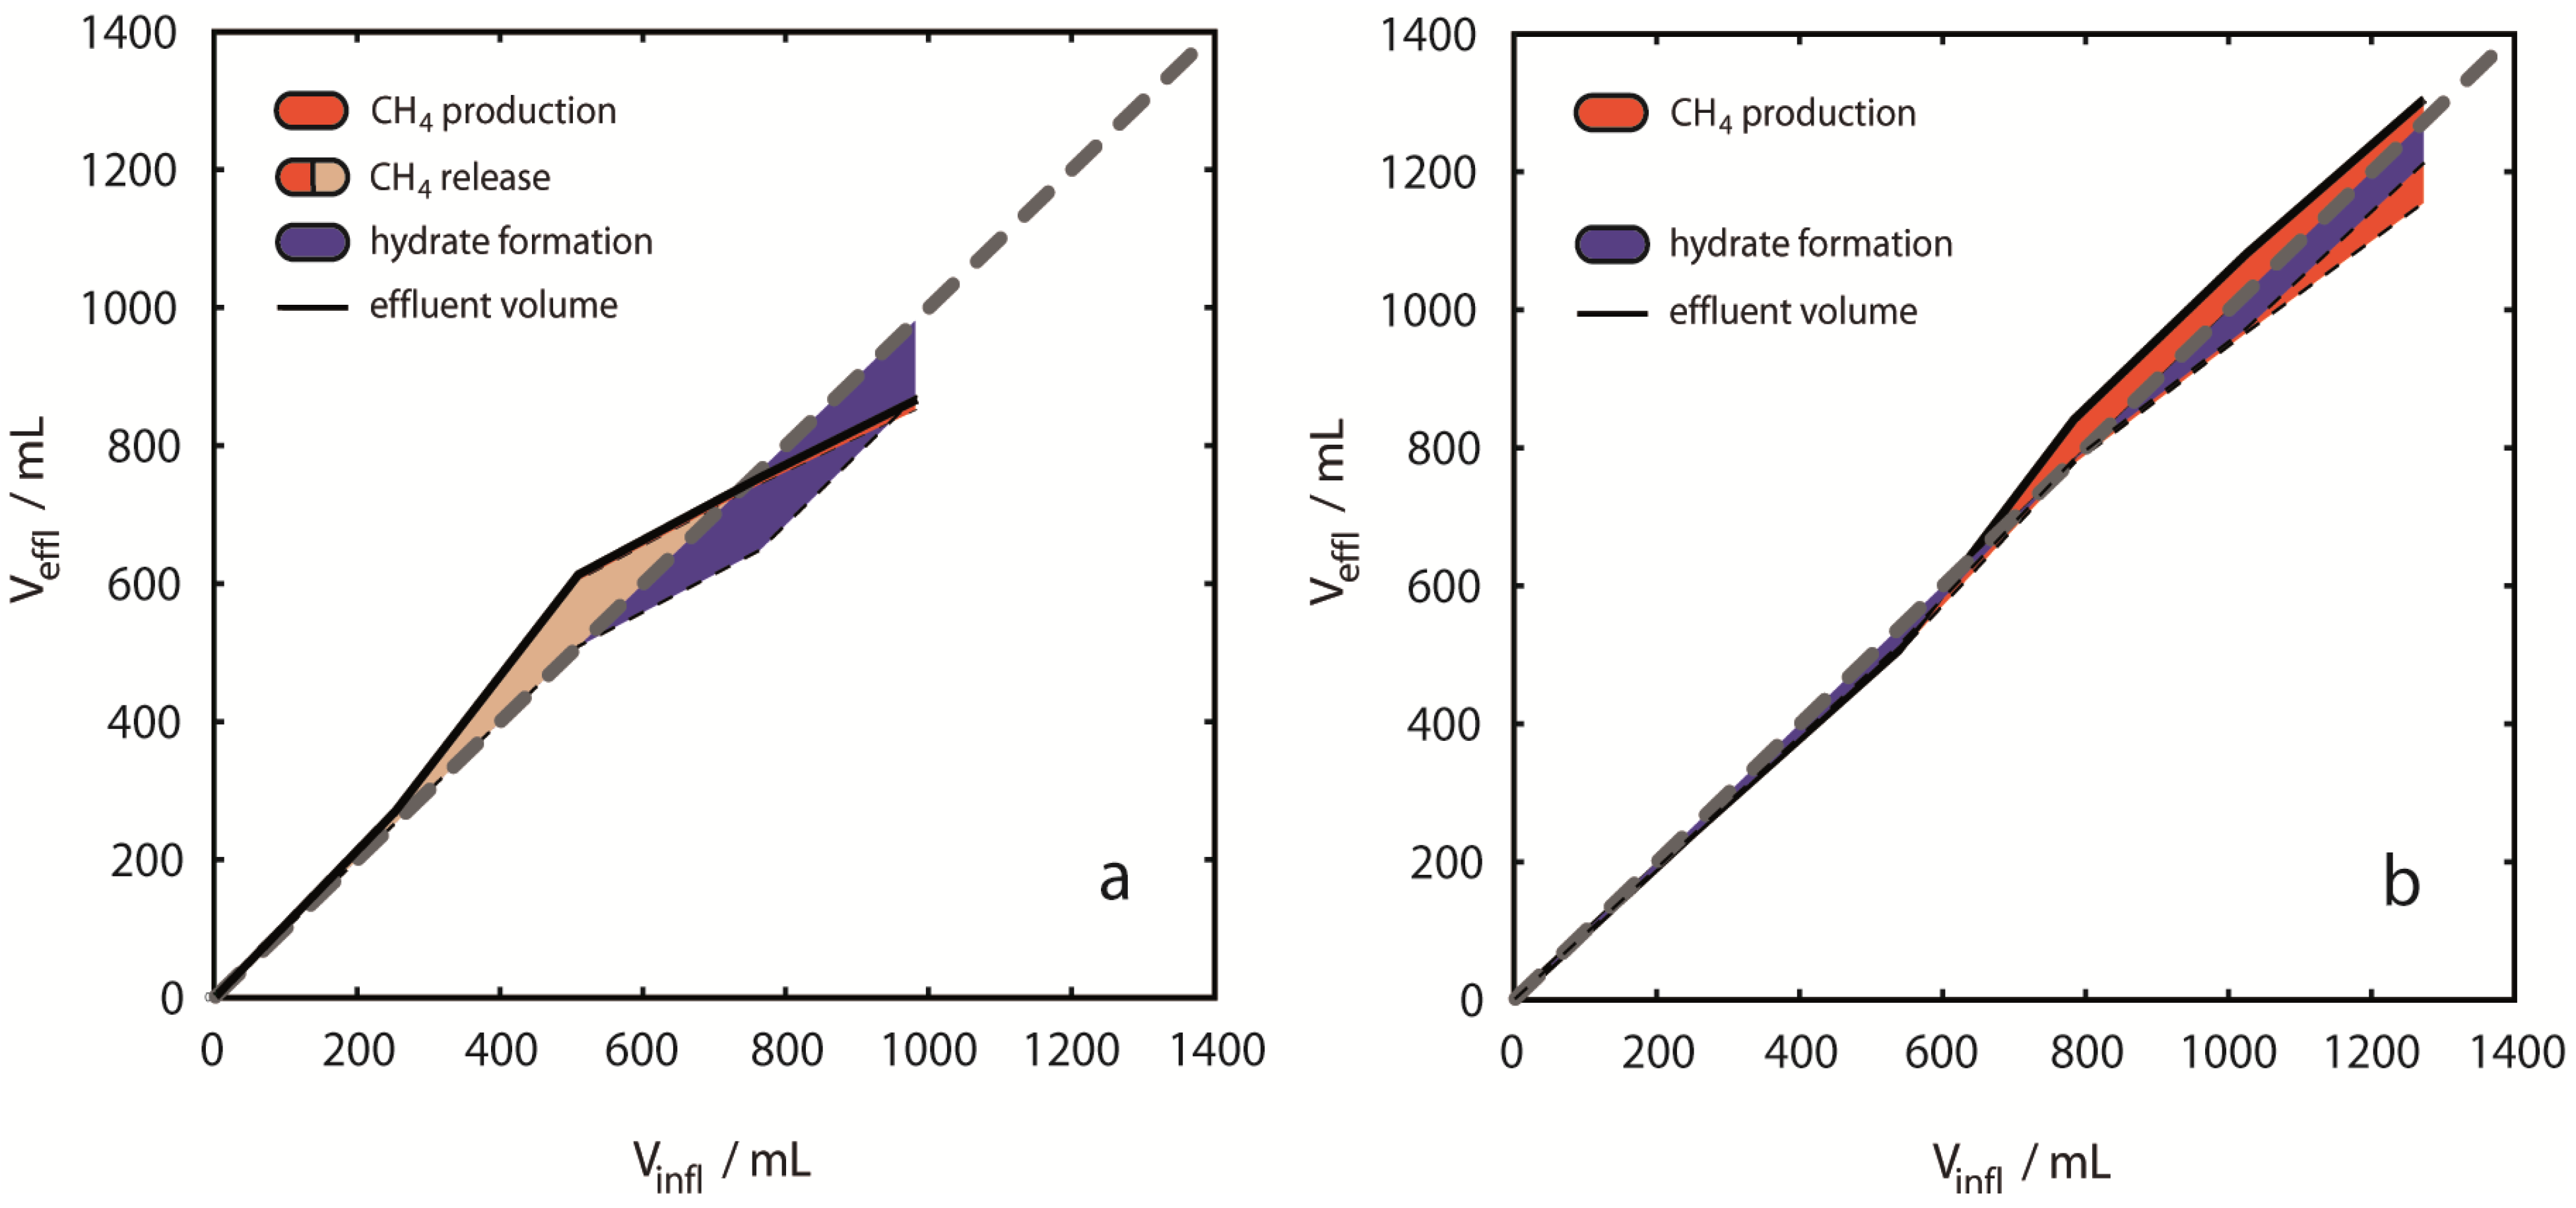
3.2. Analysis of Volume Balances
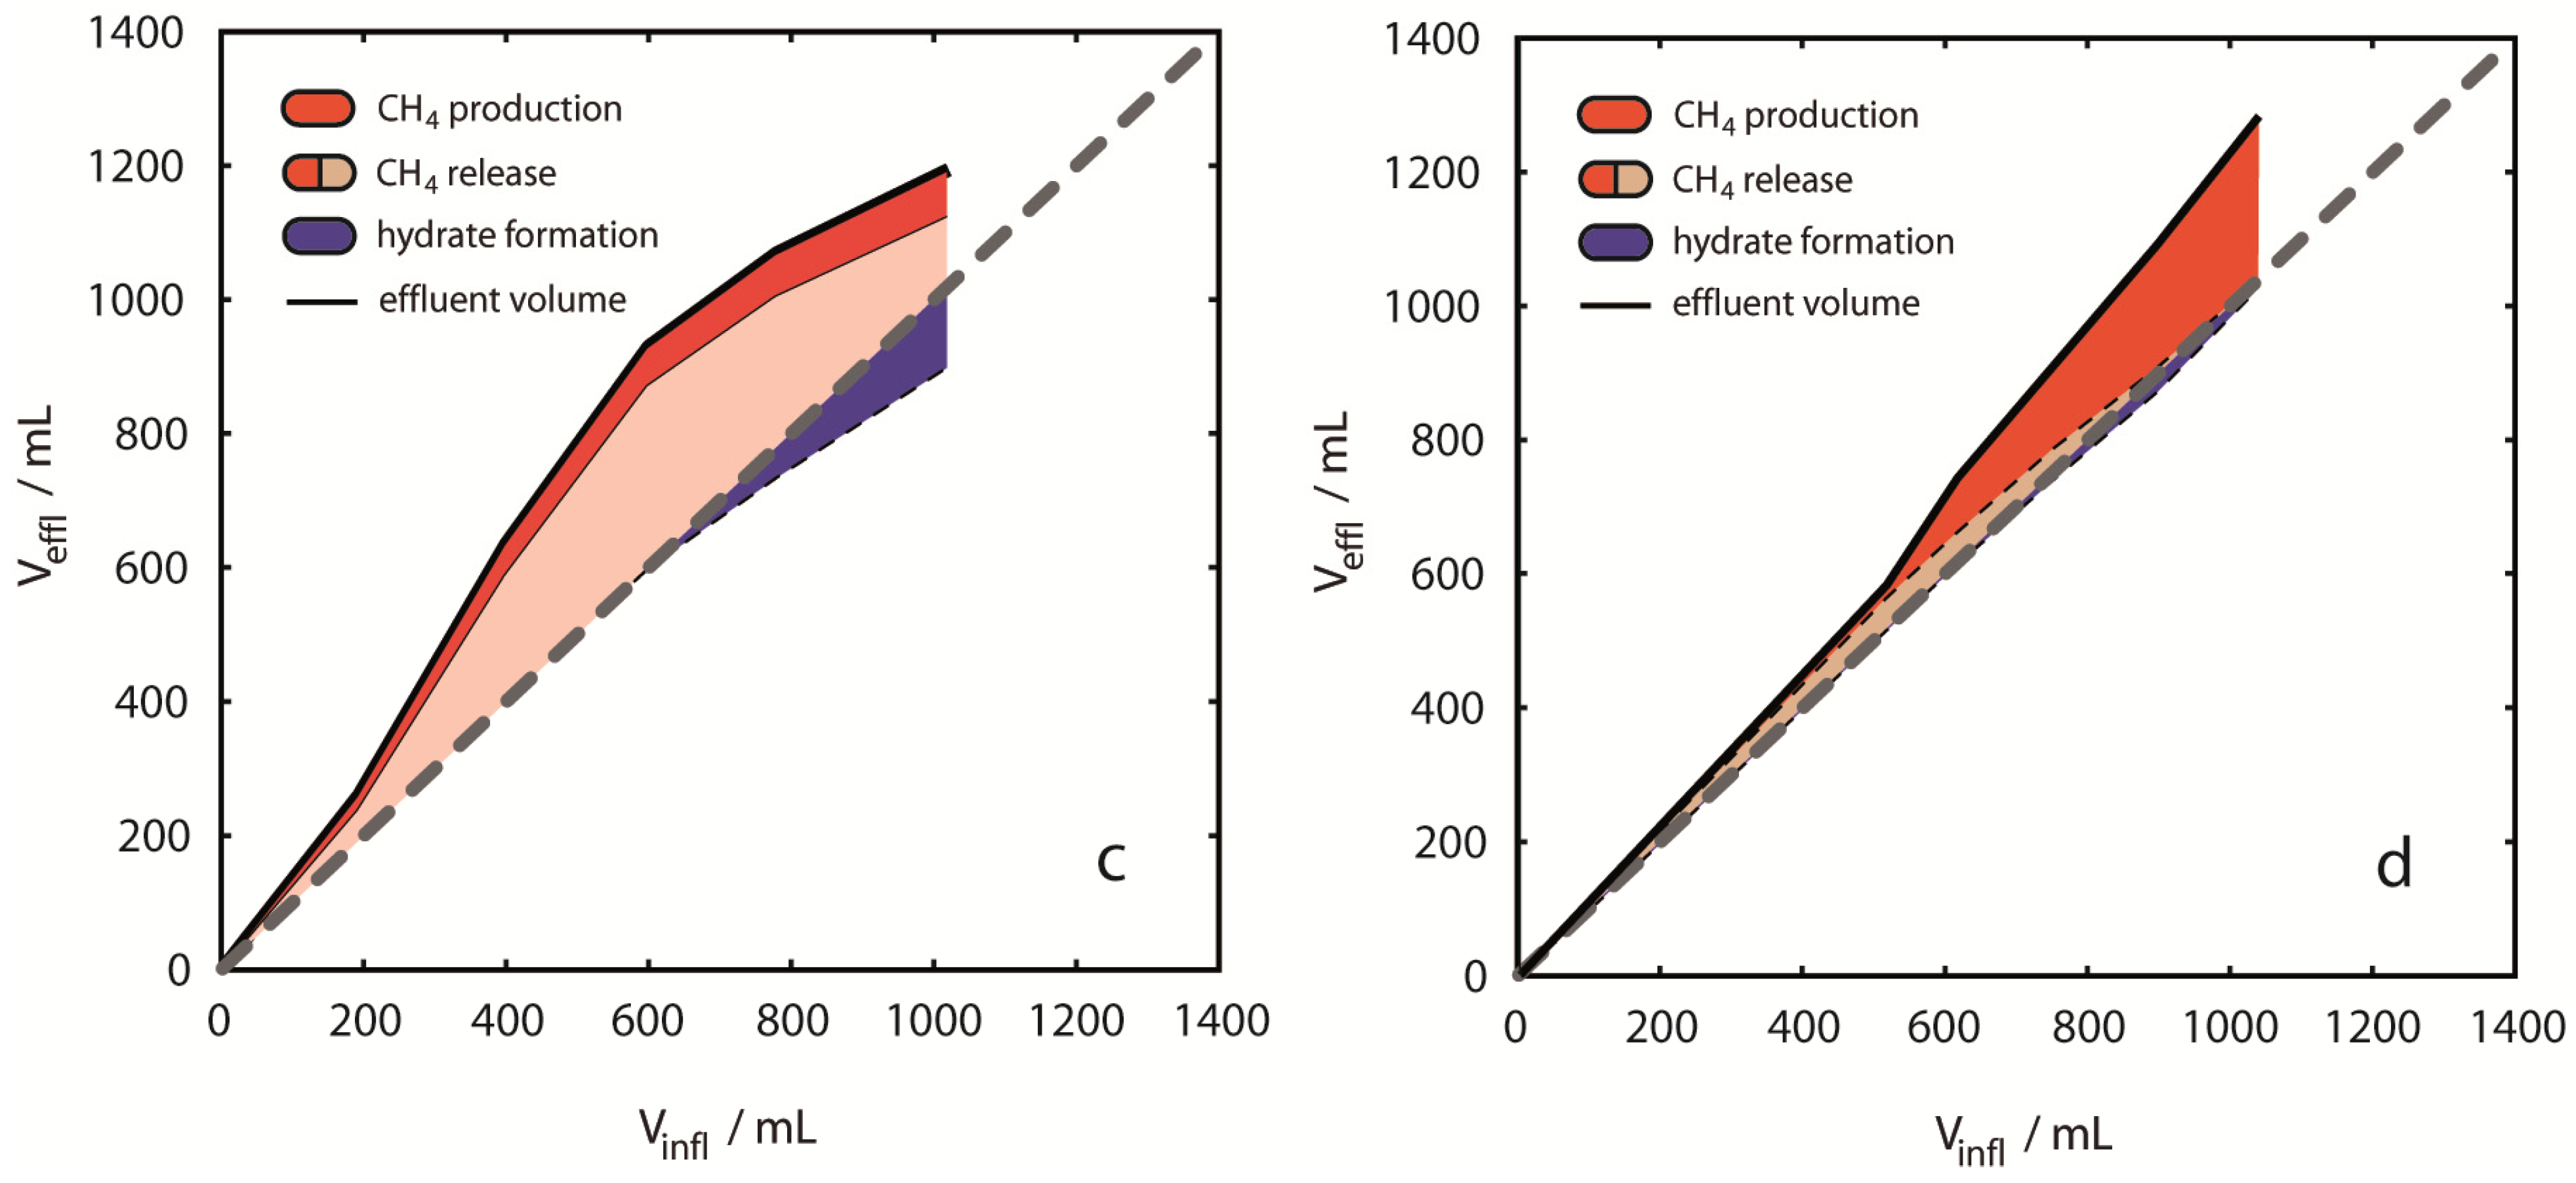
While mass balances allow for the calculation of the quantities of different components inside the sample vessel, they do not provide any information on the distribution of the components among the liquid, gas and hydrate phases. Influent and effluent fluid volumes corrected to experimental pressure and temperature were analyzed as a measure to further constrain the amounts of CH4,g and to evaluate the reservoir size of CH4- and CO2-hydrate. Effluent volumes include the cumulative amounts of CH4, CO2 and H2O in the production fluid; the influent volume is exclusively composed of injected CO2.
CH
4 released in
Figure 7 summarizes the amount of CH
4 produced (red areas) and CH
4,g retained in the pressure vessel (pink areas) after hydrate dissociation. Release of CH
4 from dissociating hydrates causes
Vdiff,rel to positively deviate from the neutral volume balance in
Figure 7. However,
Vdiff,for used for estimating hydrate formation (shown as blue areas in
Figure 7), does not consider CH
4 production in the volume balance, thus both hydrate formation and CH
4,g accumulation are shown as simultaneous events in
Figure 7. The exclusion of CH
4,effl from the volume balance is motivated from considering that CH
4-hydrate dissociation releases CH
4,g and H
2O. Thus, CH
4 production from hydrates does not induce a relevant volume difference inside the pressure vessel. In contrast, CH
4 production from CH
4,g induces a volume difference, and hydrate formation capacity estimated from fluid volume balancing would be lowered accordingly. Since it is currently not possible to distinguish between the possible sources of produced CH
4, we assume that all produced CH
4 originates from hydrate dissociation.
Figure 7.
Fluid volume balancing and evaluation of phase distribution. Deviations from even volume balances [grey dashed lines in (a)–(d)] are shown as colored areas related to the cumulative volume of injected CO2. The figure emphasizes the difference between CH4 production (red areas) and CH4 release (pink areas plus red areas). The volume based hydrate formation potential was derived from negative volume differences (blue areas). Results are presented for single experiments (a) 2 °C, 13 MPa; (b) 8 °C, 13 MPa; (c) 10 °C, 13 MPa; (d) 8 °C, 8 MPa. Volume balances were calculated from inflow amounts of CO2 and effluent amounts of CO2, CH4 and H2O for each injection step. During early injection steps most positive deviations were observed with largest net deviations for 10 °C, 13 MPa (c). Distinct negative deviations were observed in the experiments at 2 °C and 10 °C during later injection steps. Positive deviations are considered to be entirely due to CH4 gas release from CH4-hydrates, whereas negative deviations are considered to be due to hydrate formation of either CO2-, CH4- or mixed CO2-CH4-hydrates.
![]()
![]()
Overall Vdiff,rel revealed different tendencies with respect to p-/T-conditions. Only in Experiment 1 at 2 °C, 13 MPa overall Vdiff,rel was negative (−115 mL, 12% of volume of injected CO2). All other experiments revealed positive volume differences. At 8 °C, 8 MPa Vdiff,rel was +246 mL (24% of volume of injected CO2) and at 10 °C, 13 MPa Vdiff,rel was +182 mL (18% of volume of injected CO2). In contrast, the overall fluid volume balance of +31 mL (3% of volume of injected CO2) was small, but still positive at 8 °C, 13 MPa. Experiments at 2 °C and 10 °C showed a trend to positive volume change values during early injection steps, whereas negative values were observed mainly during the late injection steps. Such a trend was not observed in the experiments at 8 °C. CH4 release was clearly exceeding CH4 production in experiment 3, but also in Experiment 1, volume differences indicated transient CH4 release without CH4 production. The smallest apparent differences between volumes of produced CH4 and released CH4 are observed in experiments at 8 °C.
Volume differences caused by component dissolution were neglected here, however, in all cases of dissolution of a pure component an error is introduced in the volume analysis. Particularly dissolution of CH4 in CO2,liq and dissolution of CO2 in H2O could be significant. The saturation concentration of CO2 in an aqueous solution at 10 °C and 13 MPa is approximately 1.6 mol/kg. Dissolution of 1.6 mol of CO2 of ρ ≈ 942 kg/m3 in 1 kg of saltwater ρ ≈ 1030 kg/m3 produces a brine of ρ ≈ 1046 kg/m3. The volume difference between the resulting brine and the initial two phase liquids amounts to approximately −23 mL that are not accounted for in the volume balance calculations. Only few data are available for estimating the solubility of CH4 in CO2,liq and the possible error from this phase transfer cannot easily be quantified. Further, the solubility of H2O in CO2 and CH4 phases is of minor importance for volume balancing. However, please note that all phase transfers resulting from mutual solubilities of components would induce a negative volume difference and would finally result in an underestimation of CH4 release. CH4 release estimates in this study are therefore minimum values.
3.3. Analysis of Energy Efficiencies
Energy balancing evaluates the efficiency of thermal stimulation of hydrate dissociation. It complements the results from mass and volume balances carried out in the previous paragraphs. We use a simplified energy ratio Equation 8 to estimate energy efficiency of CH4 production E∆H,prod and CH4 release E∆H,rel.
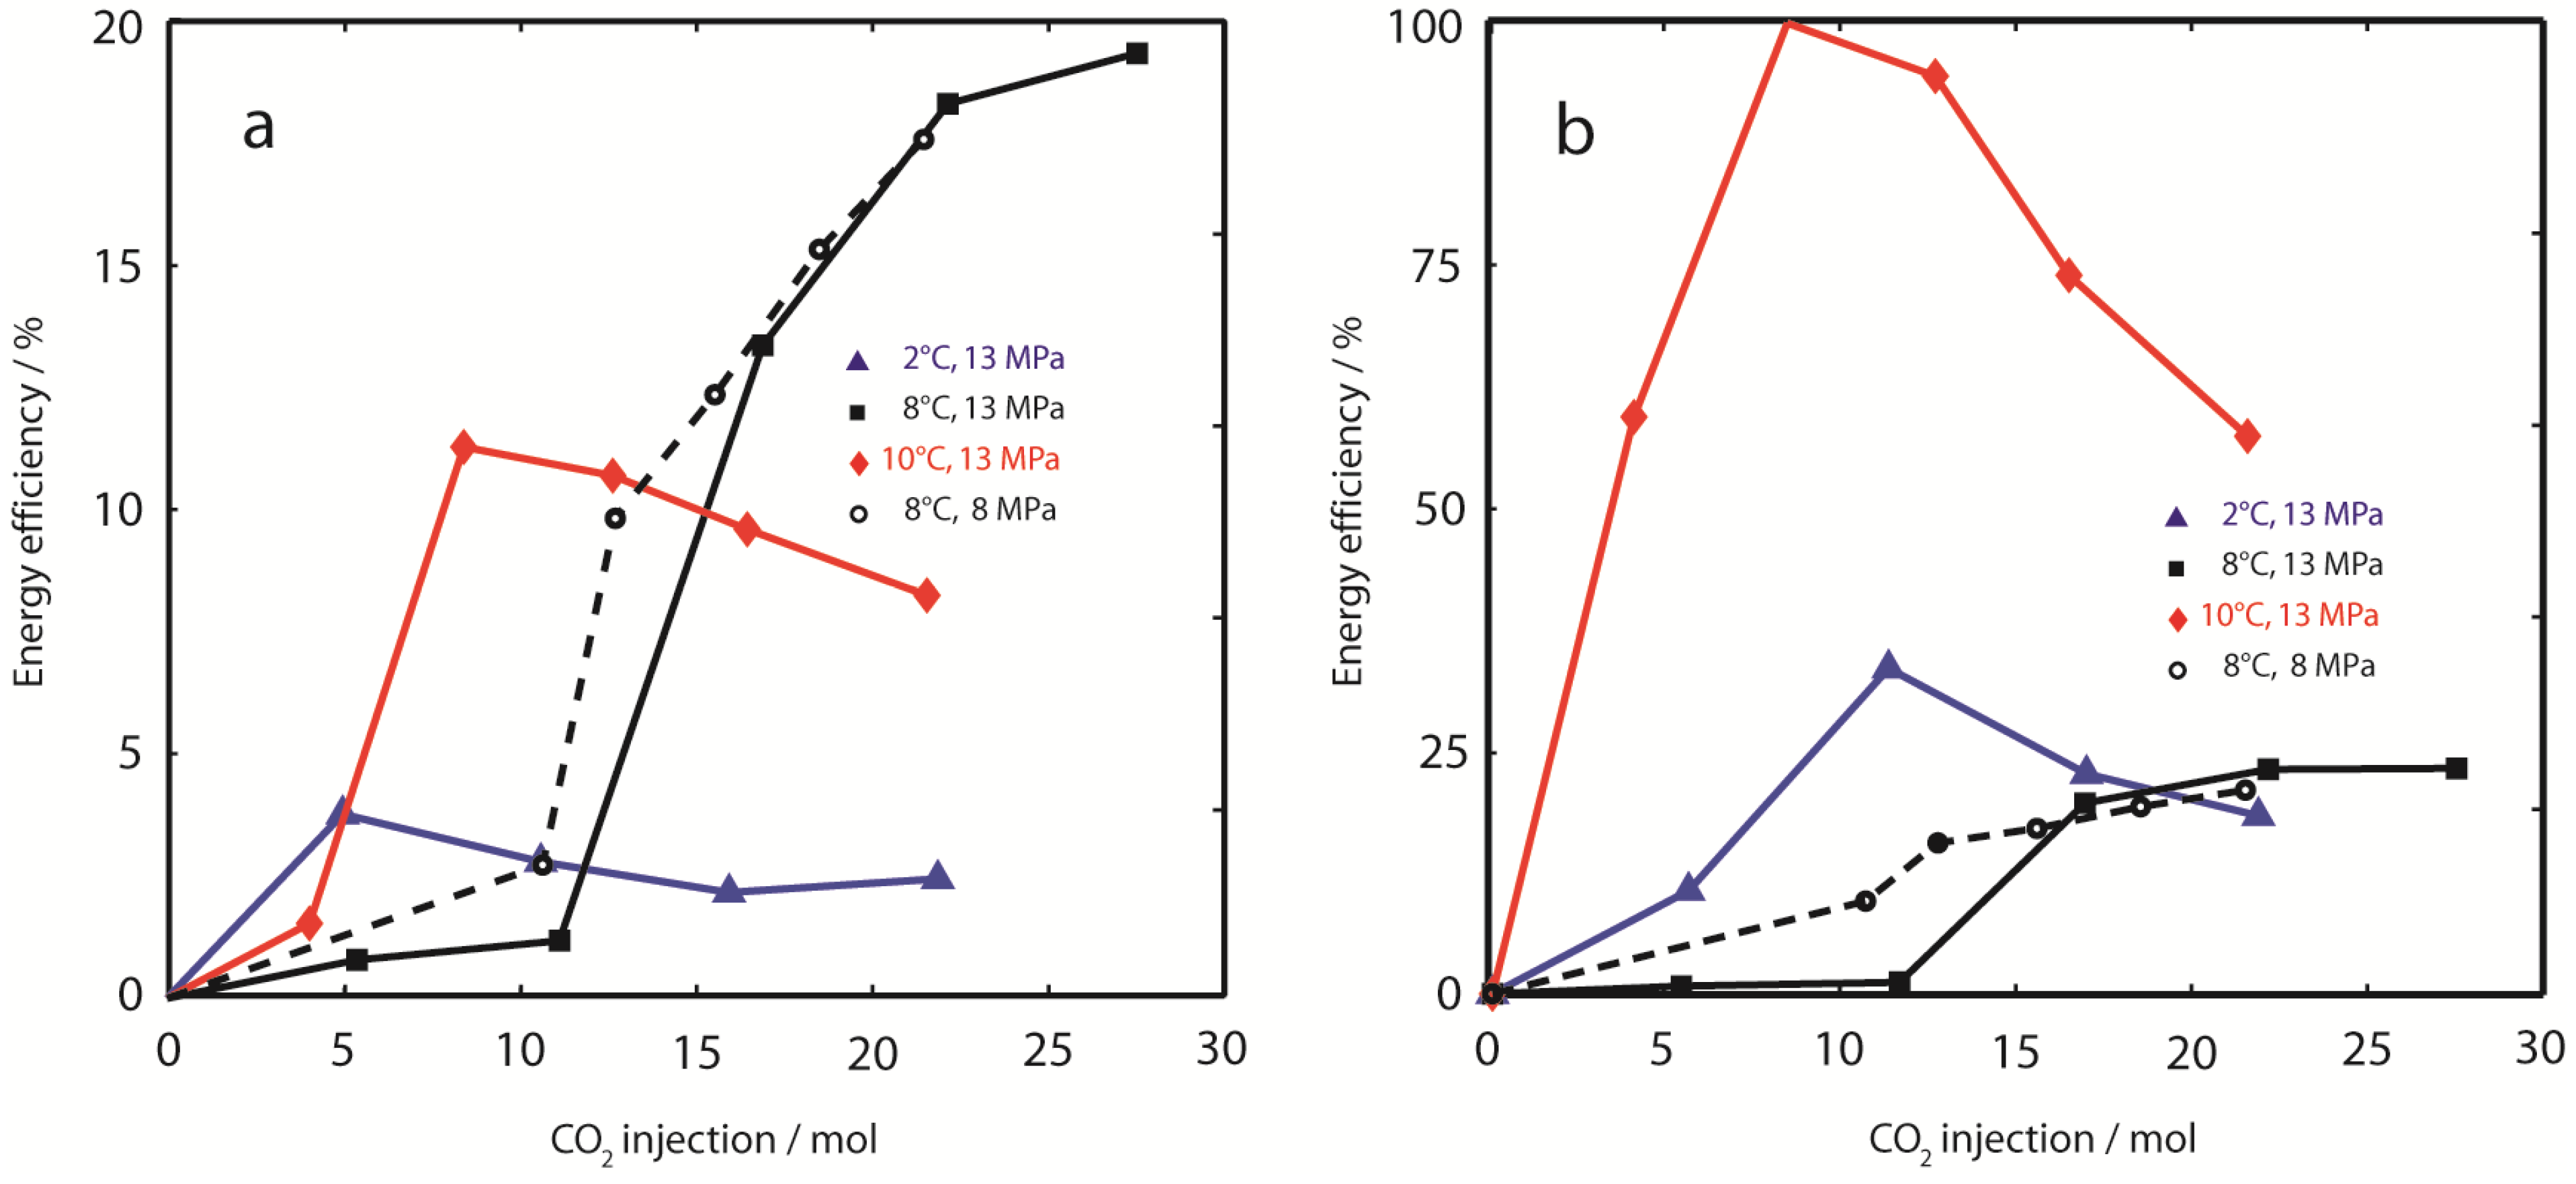
Figure 8.
Energy efficiency. (a) Cumulative energy efficiency of gas production (E∆H,prod) was calculated from free enthalpy changes comparing effluent CH4 gas recovery with theoretical CH4 release from hydrate dissociation due to injection of supercritical CO2. Lowest E∆H,prod was observed at 2 °C, 13 MPa (). E∆H,prod at 10 °C, 13 MPa () peaked at 11.3%, but decreased with ongoing CO2 injection. E∆H,prod was highest at 8 °C, independent of hydrostatic pressure. The energy efficiency calculated from CH4 production is compared to the energy efficiency calculated from CH4 gas release (E∆H,rel); (b, please note the difference in axis scales). Minor differences were observed in experiments at temperatures 8 °C. However, E∆H,rel at 10 °C is close to optimum ( in (b)), whereas energy efficiency of CH4 production is only 11.3% ( in (a)). Also at 2 °C, E∆H,rel is considerably increased compared to E∆H,prod. These results indicate that a significant amount of CH4,g liberated from dissociating CH4-hydrates is trapped and might eventually re-crystallize in secondary CH4- or (CH4-CO2)-hydrates within the sediment.
![]()
The importance to distinguish between CH
4 production and CH
4 release becomes obvious from
Figure 8.
Figure 8a shows the cumulative
E∆H,prod based on CH
4 production yields. While experiments at 8 °C show reasonable energy efficiencies (19% at 13 MPa, and 18% at 8 MPa), energy recovery was apparently poor at 2 °C, 13 MPa (2%) and 10 °C, 13 MPa (8%). In contrast, cumulative
E∆H,rel based on apparent CH
4 release estimated from fluid volume differences was considerably higher, with maximum efficiency values close to 100% for early injection steps at 10 °C. Although the energy efficiency of CH
4 release due to CO
2-injection was close to optimum values for the highest sediment temperature (10 °C), this was not reflected in CH
4 production, which was relatively inefficient compared to experiments at lower temperatures. A similar trend was also observed in Experiment 1 at 2 °C, however,
E∆H,rel was considerably lower compared to the experiment at 10 °C. The increase in cumulative energy efficiency
E∆H,rel between injection steps 1 and 2 at 10 °C can be explained by a very short equilibration time (0.07 d), which was too short for thermal equilibration of the sample.
4. Discussion
4.1. Effect of Reservoir Temperature
Experiments were conducted at three different reactor temperatures (2, 8 and 10 °C) reflecting typical gas hydrate reservoir temperatures found in the natural environment. As anticipated, at 2 °C CO
2-hydrates formed with the excess pore water rapidly reducing the permeability of the sand matrix and thus, blocking available flow pathways. Applying higher differential pressure enabled fracturing of the sample and renewing fluid flow conditions for a few times, as observed by the high pressure spikes in
Figure 3. However, after the fourth injection of CO
2, the experiment had to be aborted as further fracturing of the sample was not possible anymore because the maximum pressure limit of NESSI was reached. This may also illustrate the potential risk of clogging up the surrounding of any CO
2 injection well during CH
4-hydrate production operation under similar unfavorable environmental
p-/T-conditions.
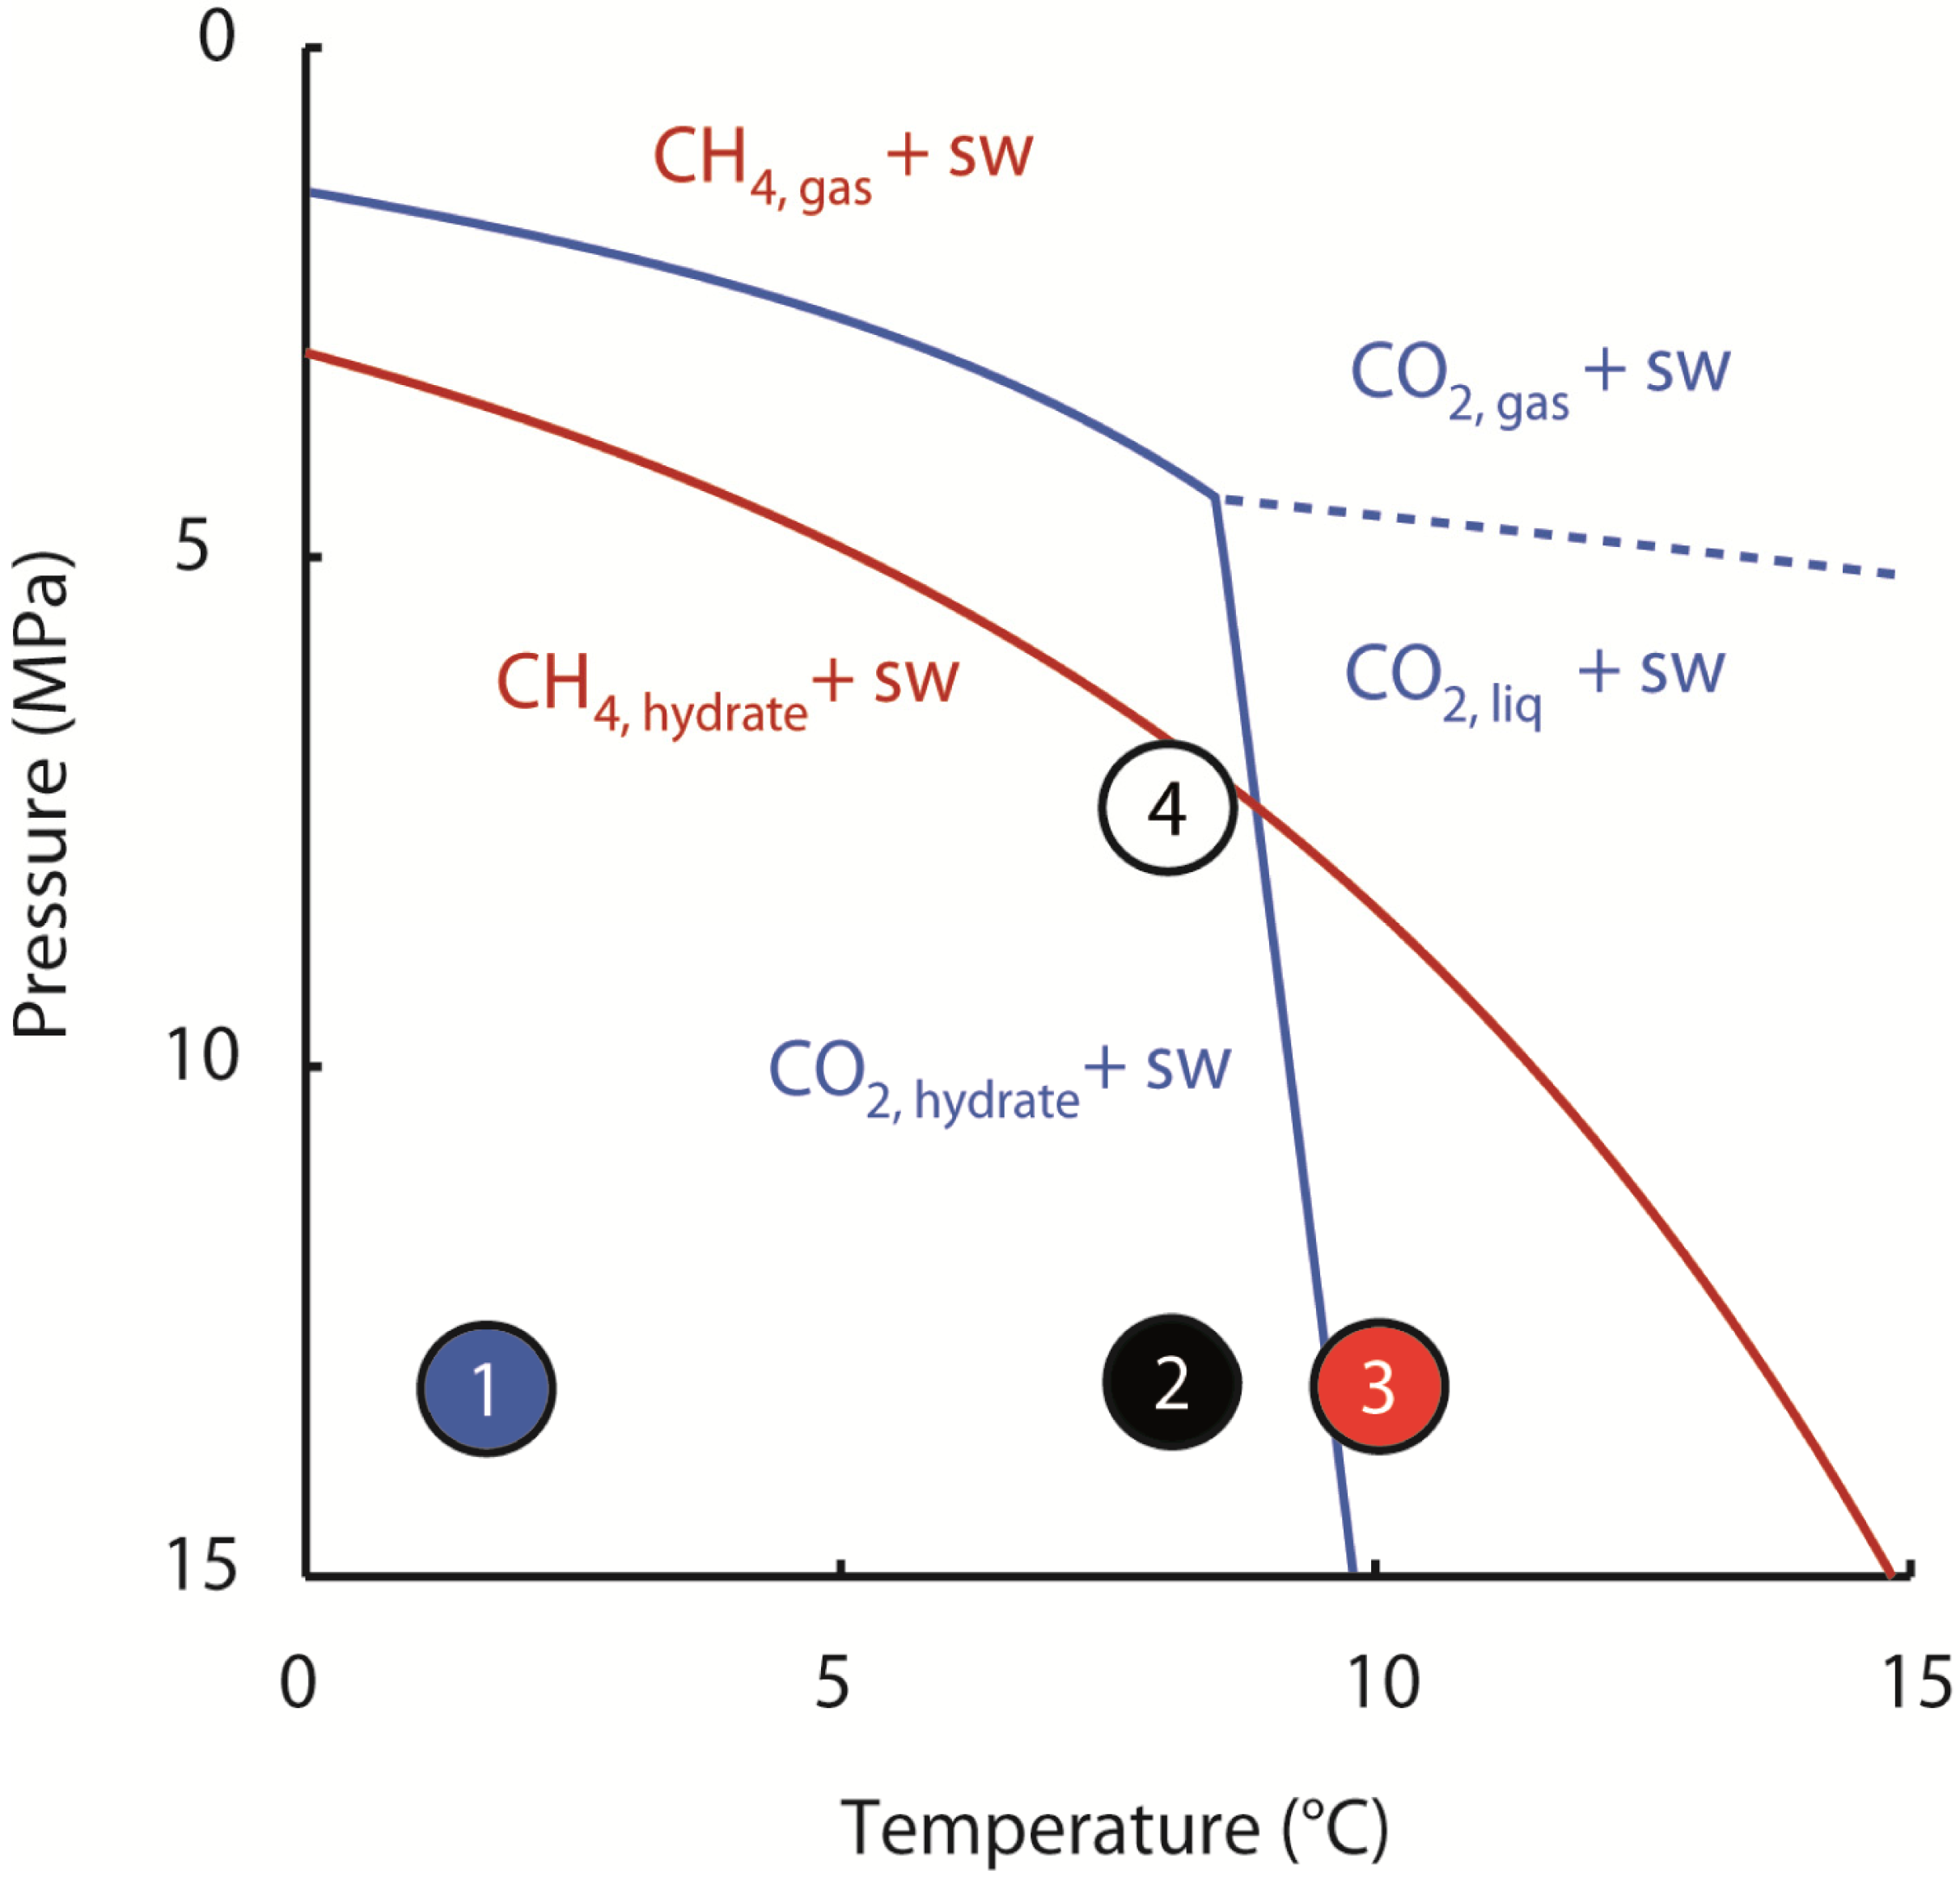
However, the observations made at higher reactor temperatures, particularly that CH
4 recovery at 8 °C was more efficient than at 10 °C, were unexpected. At an operating pressure of 13 MPa CO
2-hydrate may form at 8 °C, whereas liquid CO
2 and saltwater are the stable phases at 10 °C (
Figure 2). Accordingly, the experimental result at 8 °C suggests that formation of CO
2-hydrate in the pore space at comparably moderate rates reduces the permeability locally, thereby diverging the fluid flow to new pathways through the sample. Hence, new regions of the sediment are accessed by the injected CO
2 and new CH
4-hydrates made available for dissociation and CH
4 release. Overall, this leads to a quite evenly distributed migration of the injected CO
2 through the quartz sand and an efficient production of hydrate-bound CH
4.
In contrast, at a reactor temperature of 10 °C the efficiency of the CH4 gas recovery was much lower, because CO2-hydrate could not form. As a consequence, permeability increased locally where the injected CO2 dissociated the CH4-hydrate, opening up a preferential flow pathway for the injected CO2. Hence, the injected CO2 did only affect a small region of the hydrate-bearing sediment and further CH4-hydrate dissociation is controlled by lateral heat propagation away from the conduit and the respective CH4 production is in addition also limited by its mass transport towards the channel.
The unexpected similarity of CH
4 production at 8 °C and 8 MPa or 13 MPa (
Figure 4) indicated that sediment depressurization only had a minor effect on CH
4 production. However, depressurization and enhanced destabilization of initial CH
4-hydrate in the presence of CO
2 likely resulted in a CO
2-CH
4 gas mixture which could readily induce formation of mixed CO
2-CH
4-hydrates of modified stability relative to pure CO
2- or CH
4-hydrates [
26]. Indeed, evidence for re-formation of hydrates with high CH
4 content was found from volume balancing (4.3).
4.2. Supercritical CO2 as Injection Fluid
The injection of CO2,sc for production of CH4 from CH4-hydrates was tested experimentally for the first time. The technical strategy of CH4 production from hydrates by injection of CO2,sc into the host sediment can be considered as a combination of using an injection fluid for chemical activation of the reservoir with additional thermal stimulation. As a result from this combination CH4 production from hydrates is accelerated initially since CH4 release is driven rather by thermal stimulation of hydrate dissociation, than by hydrate conversion. The dominance of heat induced hydrate dissociation over hydrate conversion can be clearly seen from constant CH4 production efficiencies and the absence of apparent mass transfer limitations which would be expected in a diffusion-controlled conversion mechanism. However, the relevance of thermal hydrate dissociation as compared to hydrate conversion after thermal equilibration of the injected CO2 with the reservoir needs to be studied in more detail. The relative contribution of thermal dissociation and mass transport controlled hydrate conversion will strongly influence the development of the injection strategy with regard to lengths of injection and equilibration periods.
As we have further shown in this study, heat injection and transport are crucial not only to CH4-hydrate destabilization but also to flow assurance in the hydrate-sediment porous medium. While different heat injection strategies are potentially feasible, the injection of hot CO2,sc appears to offer some benefits over cold injection of CO2 combined with independent heat injection strategies, because the combined fluid and heat flow prevents uncontrolled CO2-hydrate formation in the best possible way.
Calculations of energy efficiency of CH4 production resulting from injection of hot CO2,sc seemingly indicated substantial heat loss to secondary processes, which has raised questions towards the energetic feasibility of CO2,sc injection. However, this production focused energy balance is somewhat misleading, since CH4 release is apparently exceeding CH4 production drastically. In that case, CH4,g mobilization is the actual problem limiting CH4 production, rather than energy efficiency. This aspect will be discussed in detail in the following paragraph.
While the primary effect of injection fluid temperature i.e., the direct influence on CO2-hydrate formation, CH4-release and production is not clear at the moment, this study provides strong evidence that the secondary effect of injection fluid temperature, which is increasing sediment temperature, is very important. Heat transport and sediment warming as a result of injection of CO2,sc was not evaluated in this study. To stronger emphasize the relevance of this secondary effect of injection fluid temperature and also to better reflect reservoir conditions the experimental setup and procedure needs to be adapted to provide a spatially and temporally resolved temperature profile of the sample.
Although the combination with additional process techniques such as depressurization is promising, the CO2 injection strategy itself is a central engineering tool for process optimization, and further modifications to the injection fluid might be of interest. An unsolved problem is the early breakthrough of CO2 as observed in our experiments which results in a dilute CH4 production fluid. The subsequent processing of the production fluid would be technically and economically demanding. As a further aspect, CH4,g mobilization after hydrate dissociation, could potentially be improved by influencing the physical or chemical properties of the injection fluid.
4.3. CH4 Production and Release
This study clearly reveals the importance to differentiate between CH4 production and CH4 release. Mass balance analyses indicated that using the tested injection scheme both CH4 production and CO2 retention are best at 8 °C. However, the recovered CH4 gas only is a fraction of the CH4 gas being released due to CH4-hydrate dissociation. That this is true to various extents in the different experiments was concluded from fluid volume balancing, i.e., analysis of fluid volume differences. A positive Vdiff,rel as calculated by Equation 6 is assumed to be due to dissociation of CH4-hydrate and release of free gas. In contrast, a negative Vdiff,for must be due to formation of CH4-, CO2- and mixed CH4-CO2-hydrate.
We observed strong differences with respect to fluid volume balances in the different experiments. In the experiment at 2 °C, 13 MPa, indicated by marked negative volume differences during later injection steps, a strong tendency towards hydrate formation was observed. This is clearly in accordance with results from mass flow analysis as well as with experimental observations showing the fatal loss of sample hydraulic conductivity. However, negative volume differences were preceded by positive net volume changes which indicated at substantial release of CH4,g from hydrate dissociation. Since only minor CH4 production was measured in the experiment at 2 °C, CH4,g must have been retained inside the pressure vessel. Hydrate formation in this experiment was hence probably fueled from two reservoirs, CH4,g and CO2,liq. The substantial retention of injected CO2 at 2 °C, CO2,liq suggests that CO2-hydrate is dominantly formed, however, the formation of mixed CO2-CH4-hydrates as well as the re-formation of CH4-hydrates cannot be excluded.
In contrast to the experiment at 2 °C, fluid volume differences in the experiment at 10 °C were clearly dominated by CH4-hydrate dissociation and release of CH4,g, particularly in the early phase of the experiment. The high efficiency of CH4 release with respect to thermal stimulation by CO2,sc was clearly shown from energy efficiency calculations. However, the efficiency of CH4, release was not reflected in CH4 production and up to 2.1 mol CH4,g which was released from hydrates during CO2 injection apparently remained as immobile gas inside the sample pressure vessel. The fact that significant amounts of CH4 remain within the sediment sample raises the question if and to what extent CH4 recovery is limited by gas mobilization rather than by the release of CH4 from hydrate. This is an aspect which needs to be investigated carefully in further studies since it influences process optimization strategies drastically. Similar to experiment 1 at 2 °C, volume differences at 10 °C reveal a transition towards hydrate formation during later injection steps. Since pure CO2-hydrates are thermodynamically not stable under these conditions only the re-formation of CH4-hydrate or the formation of mixed CH4-CO2-hydrates could account for these volume differences. The retention of CH4,g followed by drastic re-formation of CH4-hydrates is thus the reason for poor CH4 production efficiencies at 10 °C.
Interestingly, the strong deviations between CH4 production and CH4 release were not observed in experiments at 8 °C. It is possible, that under these conditions CH4-hydrate dissociation and CH4,g release are well balanced by CO2-hydrate formation and volume differences induced by the simultaneous processes are hidden. The absence of net fluid volume changes could indicate the simultaneous absence of excess CH4 release and CO2-hydrate formation as well as substantial excess CH4 release balanced by CO2-hydrate formation. Indeed, for all experiments, hydrate formation is assumed to be a continuous process and not, as suggested from volume balances, only occurring during later injection periods. Of course, if that is true, ongoing hydrate formation would need to be compensated by additional CH4,g release and would further increase the discrepancy between CH4 production and CH4 release. It shall be emphasized that fluid volume balancing as carried out in this study only helps to distinguish between dominant processes of CH4 release or hydrate formation as ratios, and as such, phase inventory values are not readily accessible.
The reason for discrepancies between CH4 production and apparent CH4 release are not clear yet. Interestingly, we observed similar trends for the experiment at 2 °C, which is putatively dominated by substantial CO2-hydrate formation and the experiment at 10 °C, which excludes the formation of pure CO2-hydrate. It appears possible, that both the fast passage of the CO2 as observed at 10 °C hinders the efficient CH4 production as well as slow passage at 2 °C in low permeability sediments dominated by rapid hydrate formation. At 10 °C, injected and rapidly flowing CO2,sc cools via heat conduction and distant melting of CH4-hydrates, thus producing inaccessible CH4,g inclusions. At 2 °C this effect is possibly modulated and amplified by additional flow restrictions from CO2-hydrate formation which could shield CH4,g inclusions effectively.
4.4. Comparison of Hydrate Conversion Experiments
In our experiments injection times and subsequent equilibration periods were arbitrarily chosen and varied for several technical and practical reasons within and between experiment runs (
Figure 3). The primary goal of our study was to prove the feasibility of our supercritical CO
2 technique under representative
p-/T- conditions, but it was not intended to optimize its performance and efficiency—this must be left for future work. Therefore, calculating rates of hydrate conversion or methane production will give somewhat arbitrary numbers. However, since these are the first hydrate conversion experiments using supercritical CO
2, it seems necessary and appropriate to compare our results to those of previous studies from other groups where CH
4-hydrates were exposed to cold liquid or gaseous CO
2 (see
Table 3).
In our experiments the highest CH
4 yields were achieved at 8 ºC, where 31%–36% of the hydrate-bound CH
4 was produced (
Table 3) before those two experiments were, deliberately, aborted after 44 h and 73 h, respectively. At this point a relatively constant methane production had been established (
Figure 3 and
Figure 4). In contrast, the 10 ºC experiment achieved only a methane yield of 12.5% and shows a considerable decrease in CH
4 production after the second injection cycle. At 2 °C, the methane is quite constantly produced (
Figure 3 and
Figure 4), but with very low overall yield of only 2.4%.
Table 3.
Hydrate conversion experiments.
Table 3.
Hydrate conversion experiments.
| CO2 phase | CH4 yield (%) | Time (h) | Volume (mL) | Sediment | Pressure (MPa) | Temperature (°C) | Hydrate stability | Reactor type | Reference |
|---|
| gas | 100 | 4 | 90 | no | 3.5 | 3 | CO2 | batch | [27] |
| gas | 27 | 280 | 130 | no | 3.25 | 0/(−2/+2) | CH4 + CO2 | batch + flow − through | [28,29,30] |
| gas (N2/CO2) | 85 | 20 | no info | no | 12 | 1 | CH4 + CO2 | batch | [31] |
| gas | 100 | 150 | laser spot | no | 3.0 | 5 | CO2 | batch | [32] |
| gas | 3 | 120 | 420 | no | 3.3 | −2/0/+2 | CH4 + CO2 | batch | [33] |
| liquid | 15 | 700 | 3200 | no | 3.9–4.5 | 1–3 | CH4 + CO2 | batch | [7] |
| liquid | 50 | 5 | no info | no | 6 | −3 | CH4 + CO2 | batch | [34] |
| liquid | 35 | 280 | 130 | no | 5.4, 6.0 | 0 | CH4 + CO2 | batch | [30] |
| liquid | 17 | 100 | 200 | sand | 5 | 8 | CO2 | batch | [35] |
| liquid | 50 | 300 | 100 | sandstone | 8.3 | 4 | CH4 + CO2 | batch | [36,37,38] |
| emulsion with H2O | 25 | 100 | 200 | sand | 5 | 8 | CO2 | batch | [39] |
| supercritical | 40.7/37.5 | 44/76 | 2000 | sand | 13/7.5 | 8 | CH4 + CO2 | flow-through | This study |
| supercritical | 10.7 | 73 | 2000 | sand | 13 | 10 | CH4 | flow-through | This study |
| supercritical | 3.4 | 46 | 2000 | sand | 13 | 2 | CH4 + CO2 | flow-through | This study |
As discussed before, this is due to immediate CO
2-hydrate formation with excess water in the pore space. A blocking of pore space by CO
2-hydrate formation resulting in low CH
4 yields was also encountered by Zunzhao
et al. [
33] and Hirohama
et al. [
7]. For similar reasons, Zhou
et al. [
39] could only achieve ~25% of hydrate conversion when applying a CO
2-H
2O emulsion.
Most of the other studies, summarized in
Table 3, avoided excess water in their experiments. Nevertheless, the achieved methane yield varies over a wide range from similarly low values of 17%–27% [
28,
29,
30,
35] to almost 100% [
27,
31,
32]. The main reason for this scatter is founded in very different experimental conditions, and as a consequence it is difficult to deduce an overall trend. Many of the experiments were conducted at
p-/T- conditions close to the CH
4-water phase boundary and here it seems preferential if the injected CO
2 is gaseous [
27,
31,
32] rather than liquid [
35,
39]. In two of those studies [
27,
32] the temperature was actually raised when introducing the CO
2 gas such that the pure CH
4-hydrates were no longer stable during the conversion reaction. Hence, the CH
4-hydrate was actively destabilized by adding heat to the system,
i.e., in some way a similar strategy as in our experiments.
Experiments that were conducted at
p-/T- conditions well within the stability fields of both gas hydrates [
28,
29,
30,
34,
36,
37,
38] usually achieved only moderate hydrate conversion (
Table 3). Two processes may be most likely to explain these findings: (1) Formation of mixed CH
4-CO
2-hydrates of varying composition and (2) a relatively quick gas exchange at the surface of the CH
4-hydrate grain forming a shell out of CO
2-hydrate and thereby inhibiting the further gas exchange,
i.e., mass transport, into and out of the inner core of the hydrate grain. The latter process has been documented for the CH
4-C
2H
8 gas replacement [
17] and seems very likely to occur in the above batch-type experiments. Since the overall process, particularly in a sediment/sand matrix, is quite complex, some other factors, such as local limitations in heat transfer and hydrate grain size, may also play a role (see Conclusion section for more details).
Thus, the major advantage of injecting supercritical CO2 is the destruction of the original CH4-hydrate excluding mass transfer limitations at hydrate grains. As a consequence, it is possible to establish a continuous production of CH4 gas. Furthermore, immediate formation of the more stable CO2-hydrates or mixed CO2-CH4-hydrates can be avoided at suitable reservoir temperatures potentially because the cooling of the CO2 takes some time, and the liberated CH4 gas warms up and migrates towards the outlet in the equilibration periods of our experiment.
5. Conclusions
In this study we presented the first experimental results on CH
4 production from CH
4-hydrates by injection of hot, supercritical CO
2. Based on the inventories of the components CO
2, CH
4, and H
2O (
Table 4) the overall process performance was analyzed with respect to CH
4 production, CO
2 and H
2O retention as well as energy efficiency (
Table 5). The central finding of this study is that continuous CH
4 production can be achieved, if some initial heat is introduced together with the CO
2. The hot, supercritical CO
2 efficiently activates the CH
4-hydrate reservoir and thereby overcomes mass transport limitations typically observed with cold CO
2. However, the reservoir temperature also plays a crucial role and definitely needs consideration when developing an exploitation strategy. At cold temperatures, rapid cooling of the injected CO
2 can induce formation of CO
2-hydrate with excess water causing congestions in the fluid pathways that may lead to complete process failure. We could further show that both, CH
4 production and CO
2 retention is improved under conditions of slow CO
2-hydrate formation. Constant CH
4 production efficiencies at all temperatures indicate that production is driven by fast thermal destabilization of CH
4-hydrates rather than by slow hydrate conversion. Surprisingly, the combination of mass flow analysis, volume and energy balancing suggests that CH
4 production is limited by gas mobilization rather than by CH
4-hydrate dissociation. Overall, it seems to be necessary to consider secondary processes for the overall CH
4 production process.
Table 4.
Component inventories and phase distribution. Initial and final component and phase inventories are shown. Final amounts of components nfinal were calculated from mass balance analysis. Amounts of gaseous CH4 in the pressure vessel were estimated from volume differences. However, nCH4,g is putatively underestimated in cases of rapid CO2-hydrate formation, and overestimated if CH4-hydrate reformation occurs. Final hydrate inventories nCH4,hyd and nCO2,hyd are calculated from component inventories and show maximum values.
| No. | T, p | CH4 | CO2 | H2O |
|---|
| nInitial | nFinal | nCH4,hyd | nCH4,g | nInitial | nFinal | nCO2,hyd | nCO2,inj | nInitial | nFinal |
|---|
| /mol | /mol | /mol | /mol | /mol | /mol | /mol | /mol | /g | /g |
|---|
| 1 | 2 °C, 13 MPa | 2.9 | 2.8 | 2.1–2.8 | <0.7 | 0 | 17.0 | <7.7 | 21.9 | 1452 | 804 |
| 2 | 8 °C, 13 MPa | 2.7 | 1.6 | 1.4–1.6 | < 0.2 | 0 | 16.0 | <8.3 | 27.5 | 1495 | 860 |
| 3 | 10 °C, 13 MPa | 2.8 | 2.5 | 0.4–2.5 | < 2.1 | 0 | 9.1 | <8.4 | 21.6 | 1429 | 871 |
| 4 | 8 °C, 8 MPa | 2.4 | 1.5 | 1.4–1.5 | < 0.1 | 0 | 12.5 | <7.5 | 21.5 | 1395 | 779 |
Table 5.
Summary of results: Mass and energy based process efficiencies and yields.
Table 5.
Summary of results: Mass and energy based process efficiencies and yields.
| No. | T, p | CH4 | CO2 | H2O | Energy |
|---|
| YCH4 | ECH4 | SCO2 | ECO2 | SH2O | E∆H,prod | E∆H,rel |
|---|
| /mol | /mol-% | | /mol | /mol-% | | /g | /w-% | /J-% | /J-% |
|---|
| 1 | 2 °C, 13 MPa | 0.1 | 2.4 | 0.003 | 17.1 | 77.9 | 0.78 | 804 | 55 | 2.4 | 18.3 |
| 2 | 8 °C, 13 MPa | 0.8 | 31.2 | 0.030 | 16.0 | 58.0 | 0.58 | 860 | 58 | 19.4 | 23.2 |
| 3 | 10 °C, 13 MPa | 0.4 | 12.5 | 0.016 | 9.1 | 42.5 | 0.43 | 871 | 61 | 8.2 | 57.4 |
| 4 | 8 °C, 8 MPa | 0.8 | 35.5 | 0.039 | 12.5 | 58.0 | 0.58 | 779 | 56 | 17.6 | 21.0 |
The combination of CH
4 extraction from gas hydrates and storage of CO
2 results in a complex multi-component, multiphase transport-reaction scheme, as illustrated in
Figure 9. Highly dynamic processes on different time scales are putatively important for CH
4-hydrate dissociation, hydrate conversion and pure or mixed hydrate reformation, all of them altering sediment parameters, such as bulk thermal and geomechanical behavior. Due to the spatial heterogeneity and concurrency of multiple processes, it is very likely that optimization efforts will be most successful when considering processes down to the pore scale. This underlines the technical relevance of former studies of CH
4-CO
2-hydrate conversion (
Table 3), hydrate dissociation and formation ([
40] and references therein), which were strongly focused on gaining mechanistic insights on grain size and molecular scale.
Figure 9.
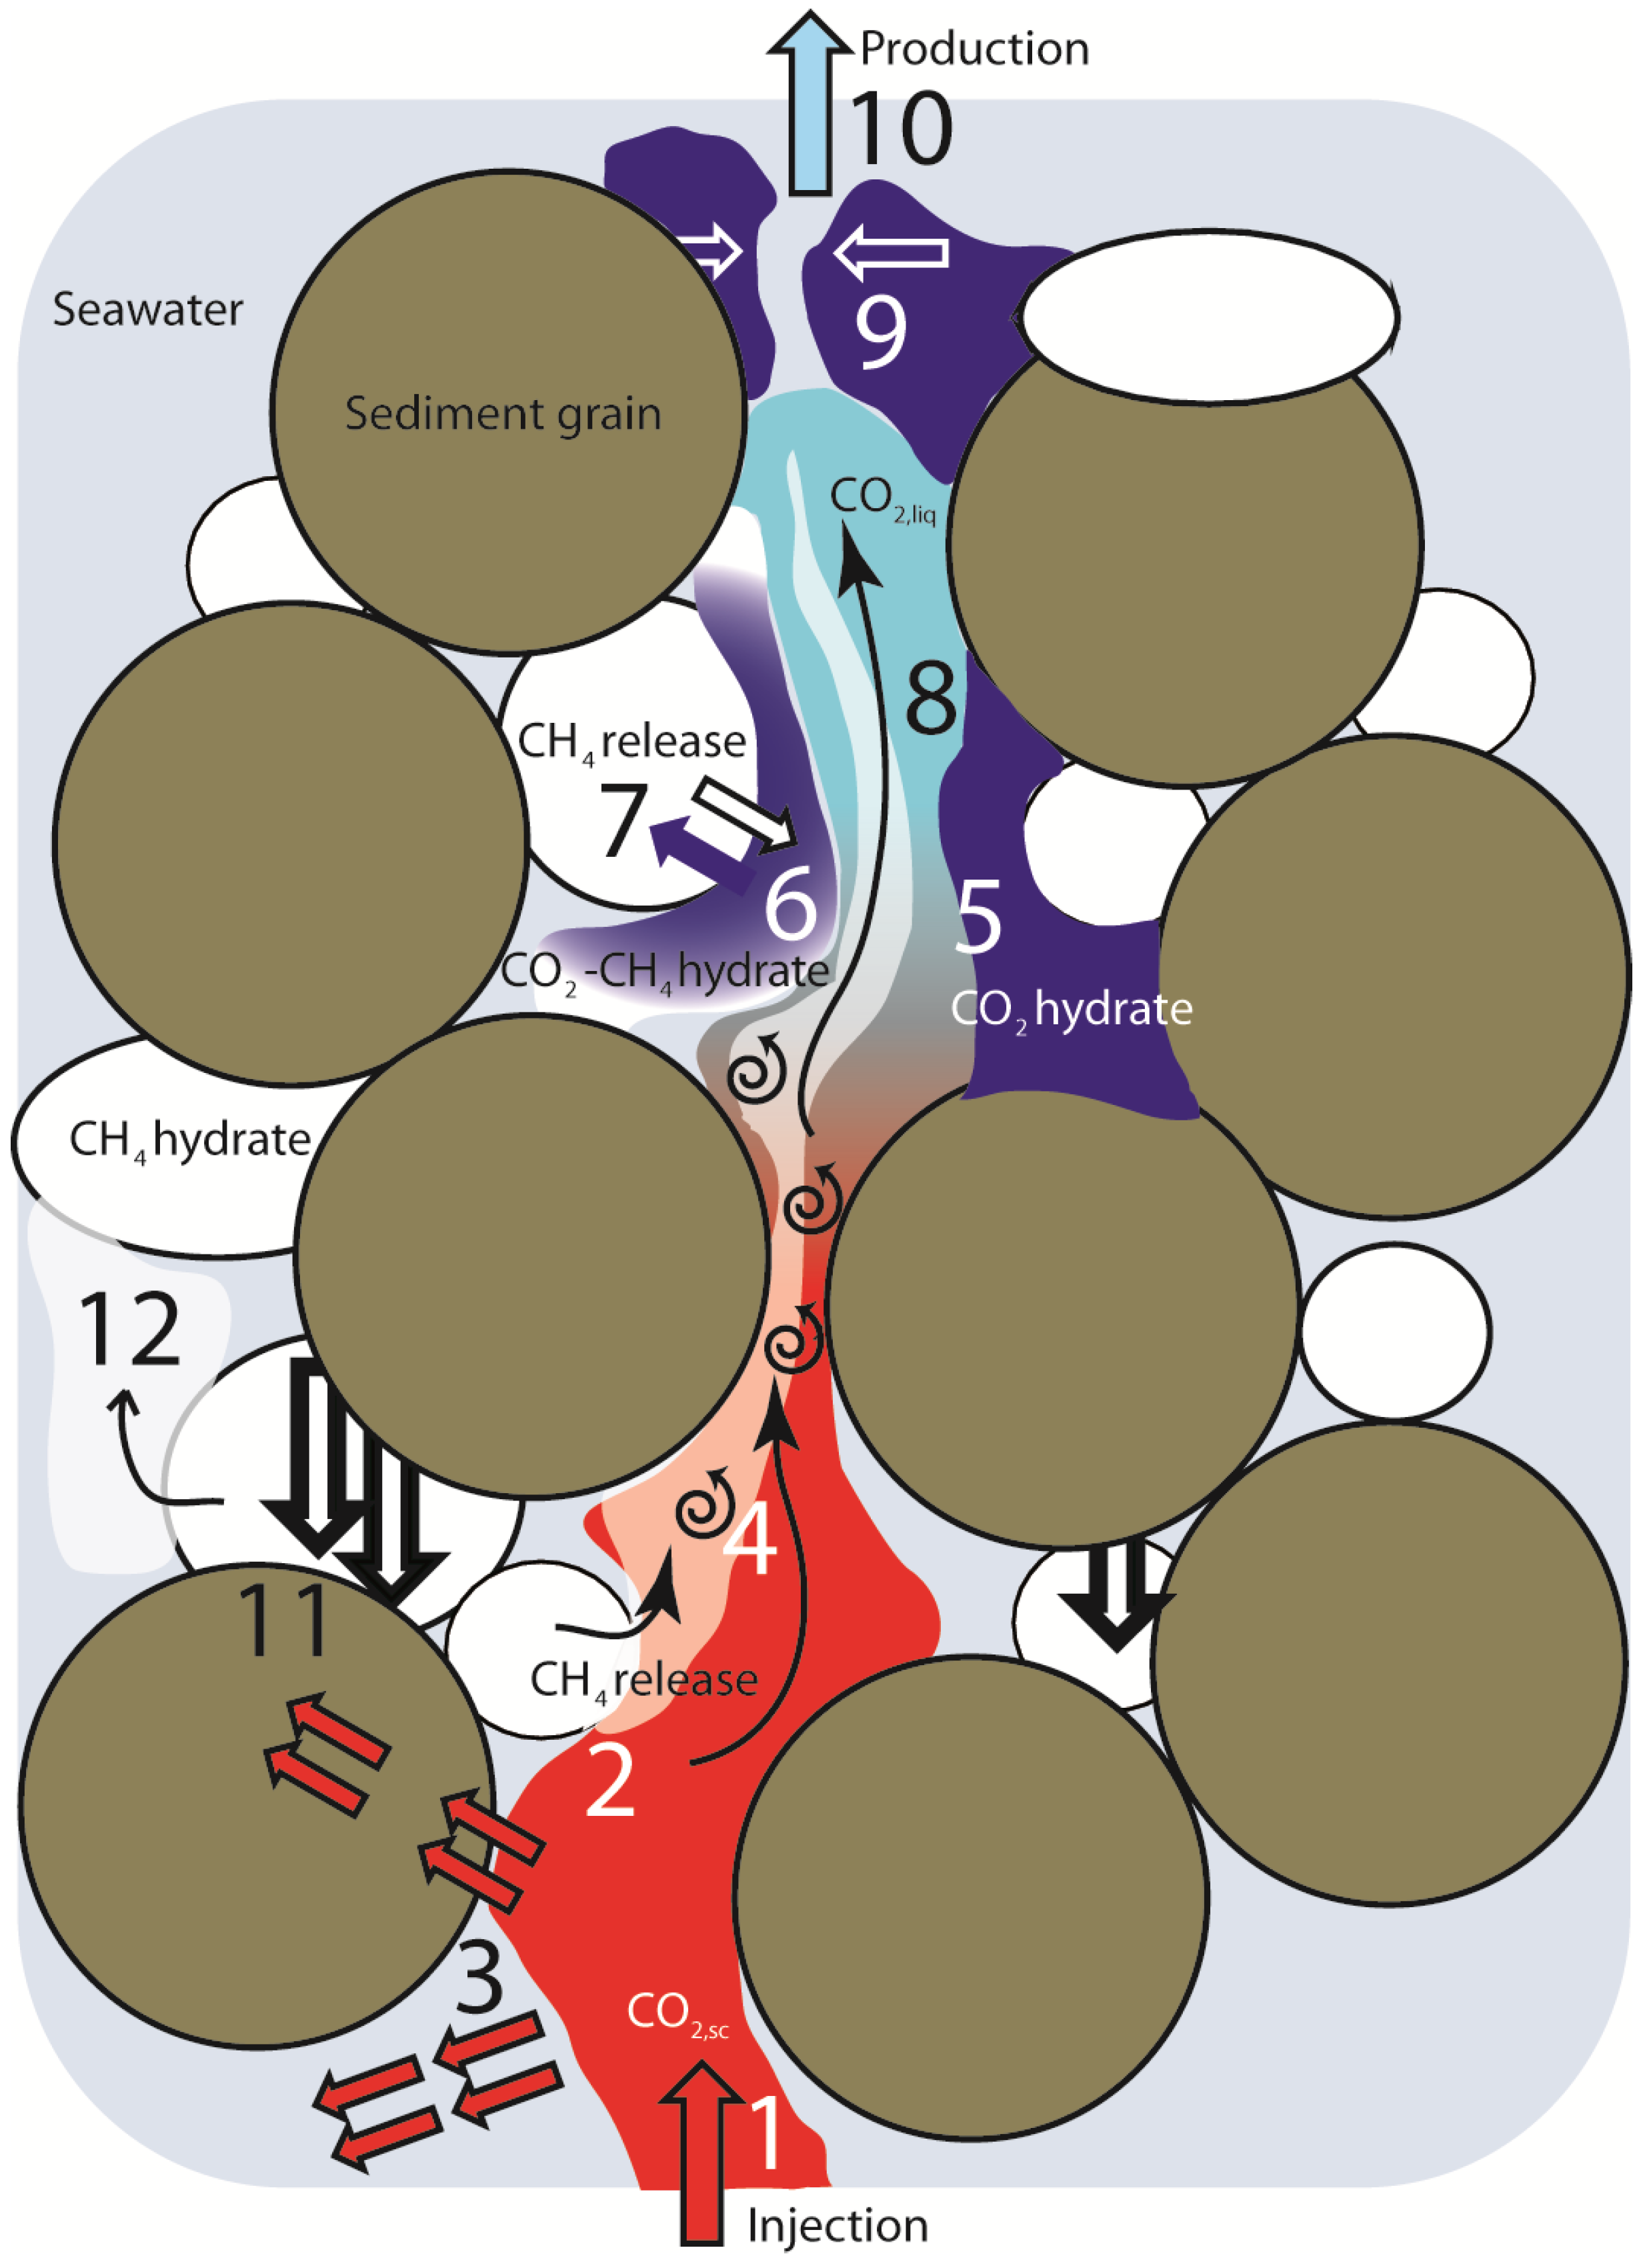
Process dynamics scheme. Relevant transport and reaction processes during injection of hot CO2,sc into CH4-hydrate bearing sediment. (1) Injection of hot, mobile CO2,sc; (2) Fast dissociation of CH4-hydrate due to thermal stimulation from hot CO2,sc injection; (3) Conductive heat transport via sediment particles or non-mobile pore water followed by thermal stimulation and dissociation of distant CH4-hydrate particles; (4) Mixing of CO2 and CH4; (5) CO2-hydrate formation with pore water; (6) Formation of mixed CO2-CH4-hydrates from CO2-CH4 gas mixtures; (7) CH4-CO2-hydrate exchange limited by diffusive transport of CH4 and CO2; (8) CO2,sc cools and rapidly transforms to CO2,liq. CO2-CH4 mixtures remain supercritical at high CH4 content; (9) CO2-hydrate formation with excess pore water might result in pore space clogging followed by substantial change of porosity and permeability. Complete loss of hydraulic conductivity is possible; (10) Production of fluid containing CH4, water and CO2 in various states and different and changing proportions; (11) Dissociation of load-bearing hydrate particles can cause settling of sediment and change of sediment integrity and geomechanical stability; (12) CH4 gas might be released into hydraulically isolated pores as non-producible gas.
Figure 9.
Process dynamics scheme. Relevant transport and reaction processes during injection of hot CO2,sc into CH4-hydrate bearing sediment. (1) Injection of hot, mobile CO2,sc; (2) Fast dissociation of CH4-hydrate due to thermal stimulation from hot CO2,sc injection; (3) Conductive heat transport via sediment particles or non-mobile pore water followed by thermal stimulation and dissociation of distant CH4-hydrate particles; (4) Mixing of CO2 and CH4; (5) CO2-hydrate formation with pore water; (6) Formation of mixed CO2-CH4-hydrates from CO2-CH4 gas mixtures; (7) CH4-CO2-hydrate exchange limited by diffusive transport of CH4 and CO2; (8) CO2,sc cools and rapidly transforms to CO2,liq. CO2-CH4 mixtures remain supercritical at high CH4 content; (9) CO2-hydrate formation with excess pore water might result in pore space clogging followed by substantial change of porosity and permeability. Complete loss of hydraulic conductivity is possible; (10) Production of fluid containing CH4, water and CO2 in various states and different and changing proportions; (11) Dissociation of load-bearing hydrate particles can cause settling of sediment and change of sediment integrity and geomechanical stability; (12) CH4 gas might be released into hydraulically isolated pores as non-producible gas.
![]()
6. Outlook
Our results suggest that both efficiency and rate of CH4 production can be optimized in numerous ways.
The additional combination with depressurization is likely to improve the production process, since CH4-hydrates could initially be destabilized to facilitate injection of the supercritical CO2. In turn, the heat of the CO2 can then compensate the cooling of the reservoir induced by the endothermic hydrate dissociation from depressurization. As a consequence, substantial production rates of CH4 gas could be maintained over extended periods of time.
Different modifications of the injection fluid with respect to its composition and injection temperature as well as of the injection strategy itself might avoid early CO2 breakthrough and also improve gas mobilization, which was identified as a possible obstacle in the production process (i.e., in the 10 °C experiment).
According to our results, reservoir conditions including temperature, pressure and permeability have a major influence on the production process and the choice of appropriate reservoir sites and technical means to influence the reservoir properties will be of paramount importance. So far, our experiments lack from the impossibility to directly monitor the processes and phase distribution inside the pressure vessel. Instead, this information has to be obtained indirectly from the analysis of effluent fluids. Hence, future studies would benefit significantly from the application of online monitoring including imaging techniques such as MRI or CT.
Because of the complexity of the numerous physical and chemical processes contributing to the overall CH4 production we emphasize the importance of understanding the behavior of the system from the reservoir scale down to the pore scale. Only such knowledge can lead to progress in production simulations and laboratory experiments, which are prerequisites for the development of optimized production techniques.


