3.1. Variations in Calibration Constants from Stored Anemometers (not Used in the Field)
In
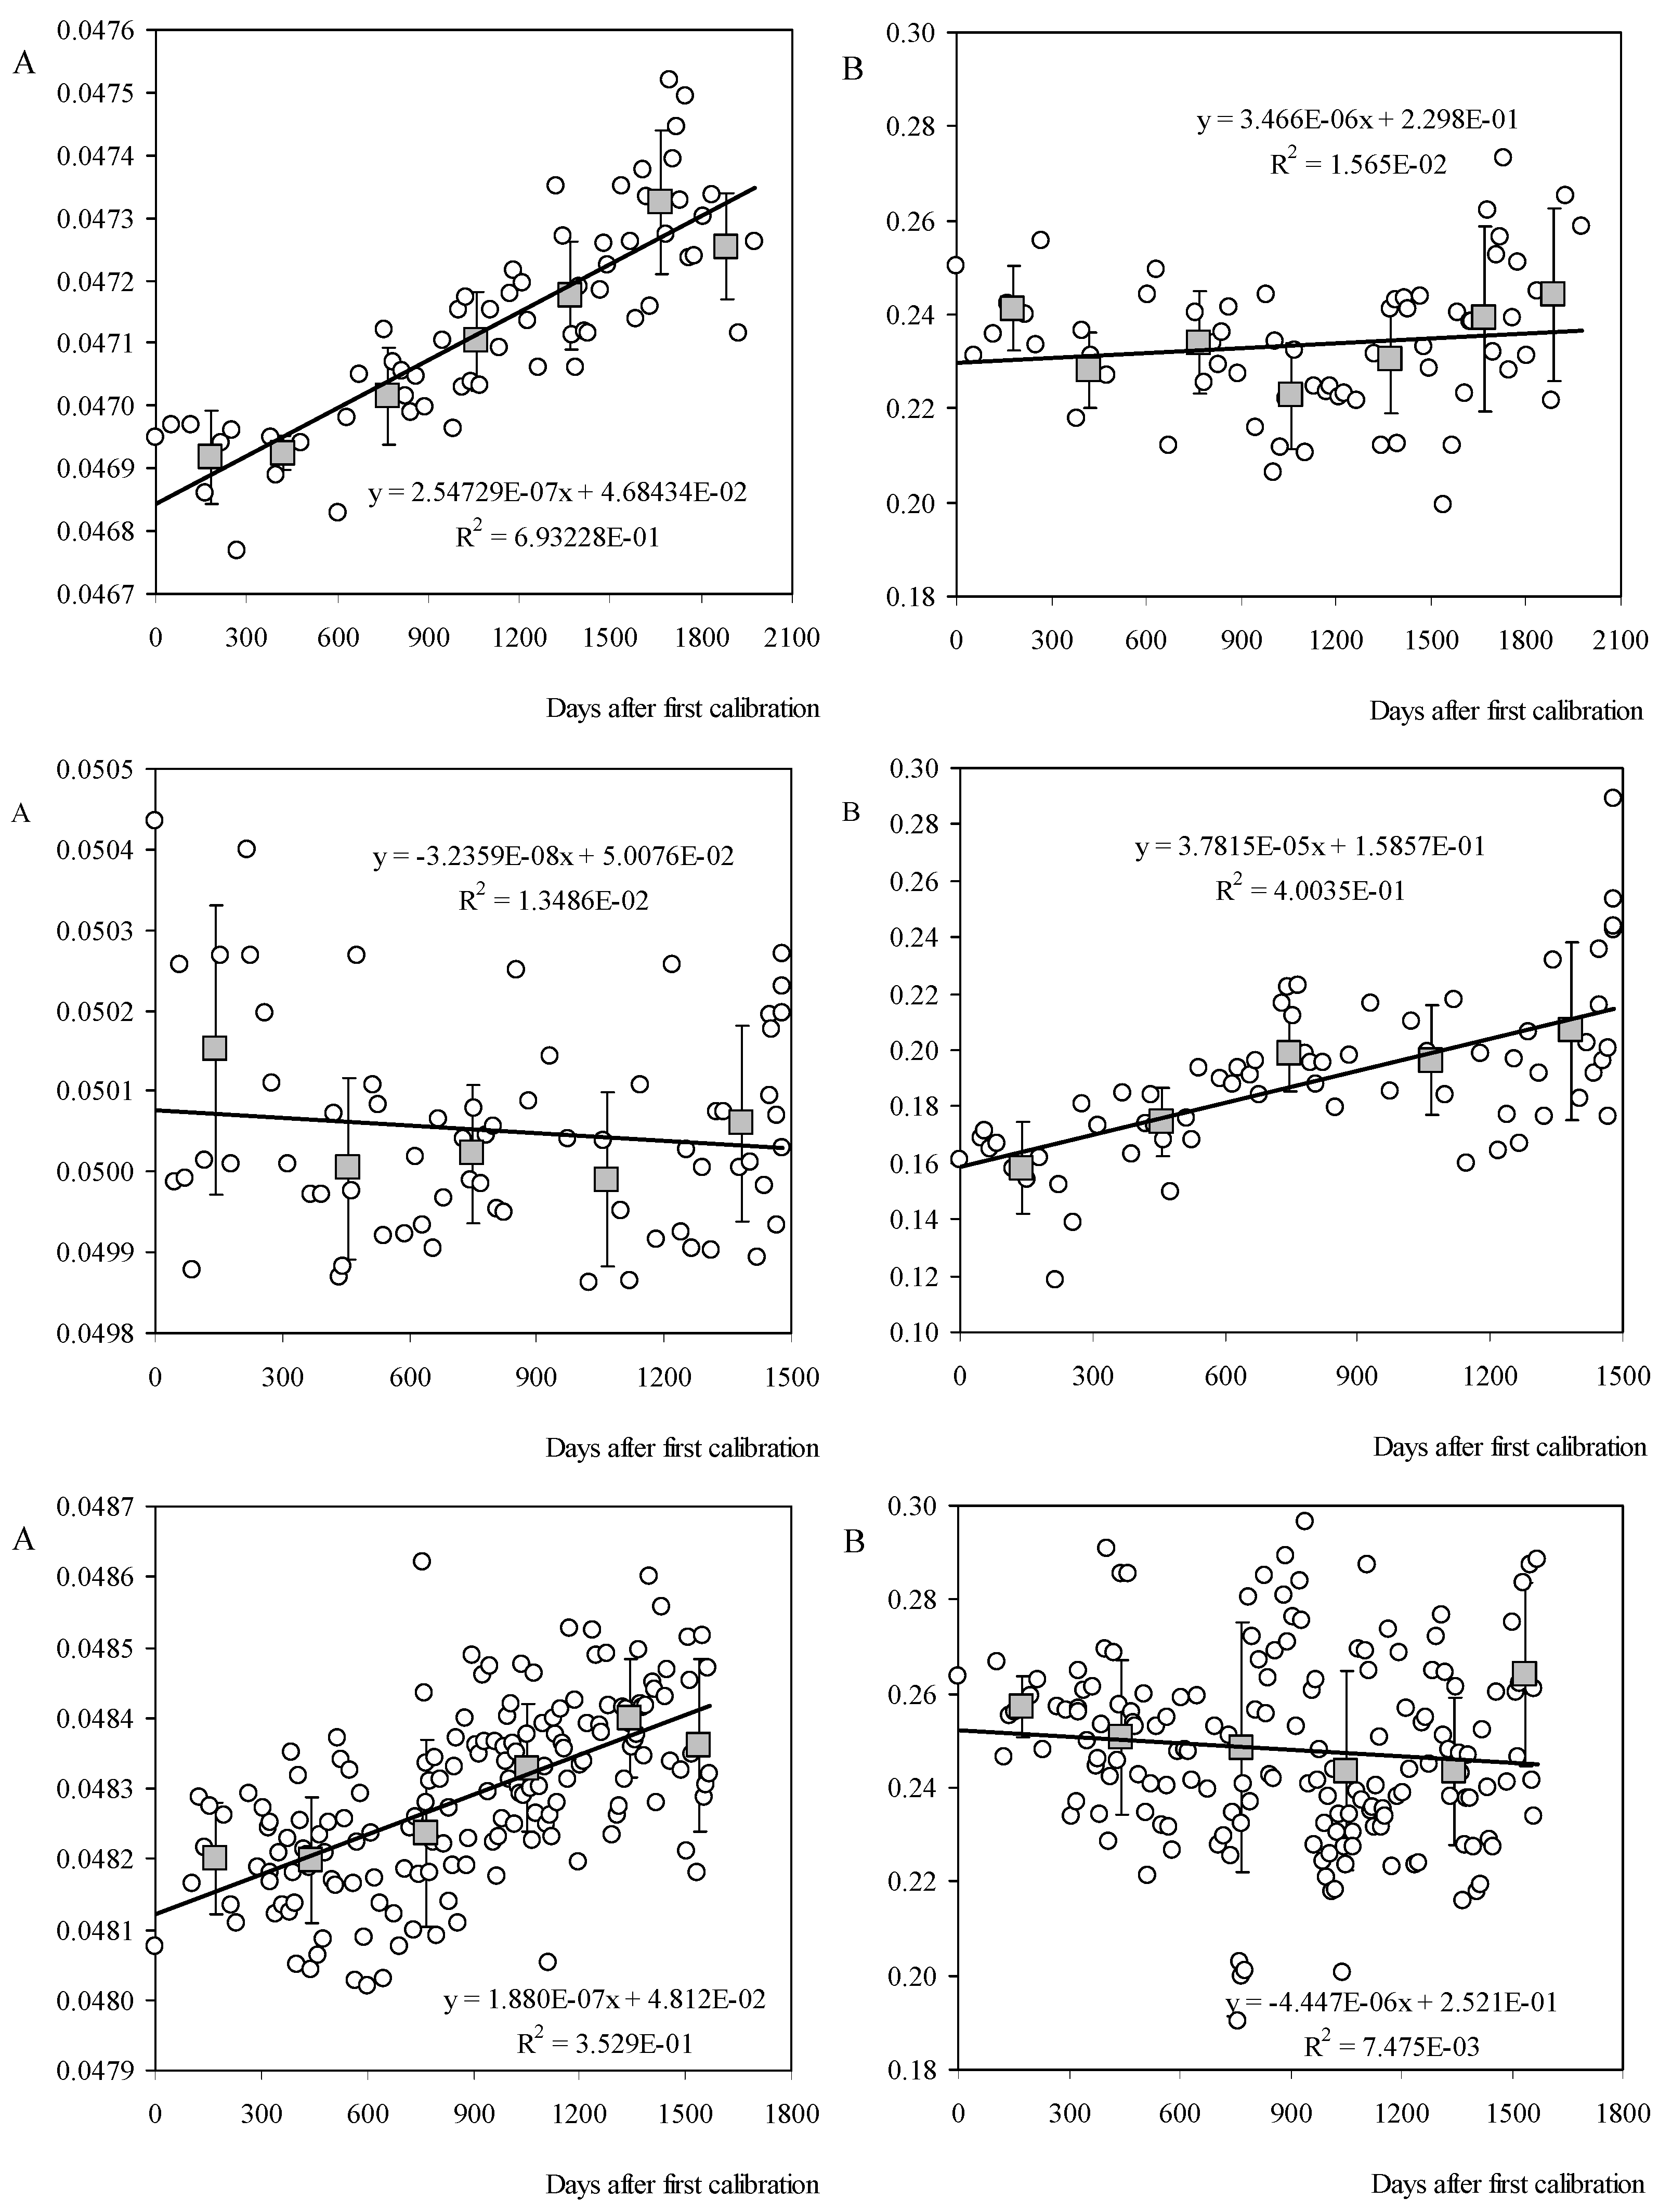
Figure 1 the values of the calibration coefficients corresponding to the IDR/UPM Institute anemometers (Climatronics 100075, Vector Instruments A100 L2, and Thies Clima 4.3350 –from now on these anemometers will be referred to as Cl-100075, A100 L2, and Th-4.3350 in the text), are shown as a function of the number of days after their first calibration. A linear fitting to the data has been included in all graphs. The average values for every 300 days, together with the standard deviation bars, have also been included in the graphs (see
Table 1). As said, these three anemometers were used just for IDR/UPM Institute internal procedures and apart from their periodic calibrations, they were not used at all. Despite the scattering of the data shown in
Figure 1, some trends can be observed by analyzing the 300-day average results. In some cases the variation of the coefficients seem to clearly fit a linear behavior (Cl-100075 and Th-4.3350 A coefficients, and A100 L2 B coefficient), whereas in others (Cl-100075 and Th-4.3350 B coefficients, and A100 L2 A coefficient) the correlation with the linear fit is worse (see in
Figure 1 that the coefficients of determination, R
2, are in these cases significantly lower, from 7.47 × 10
−3 to 1.56 × 10
−2, than the ones previously mentioned, from 3.53 × 10
−1 to 6.93 × 10
−1).
In
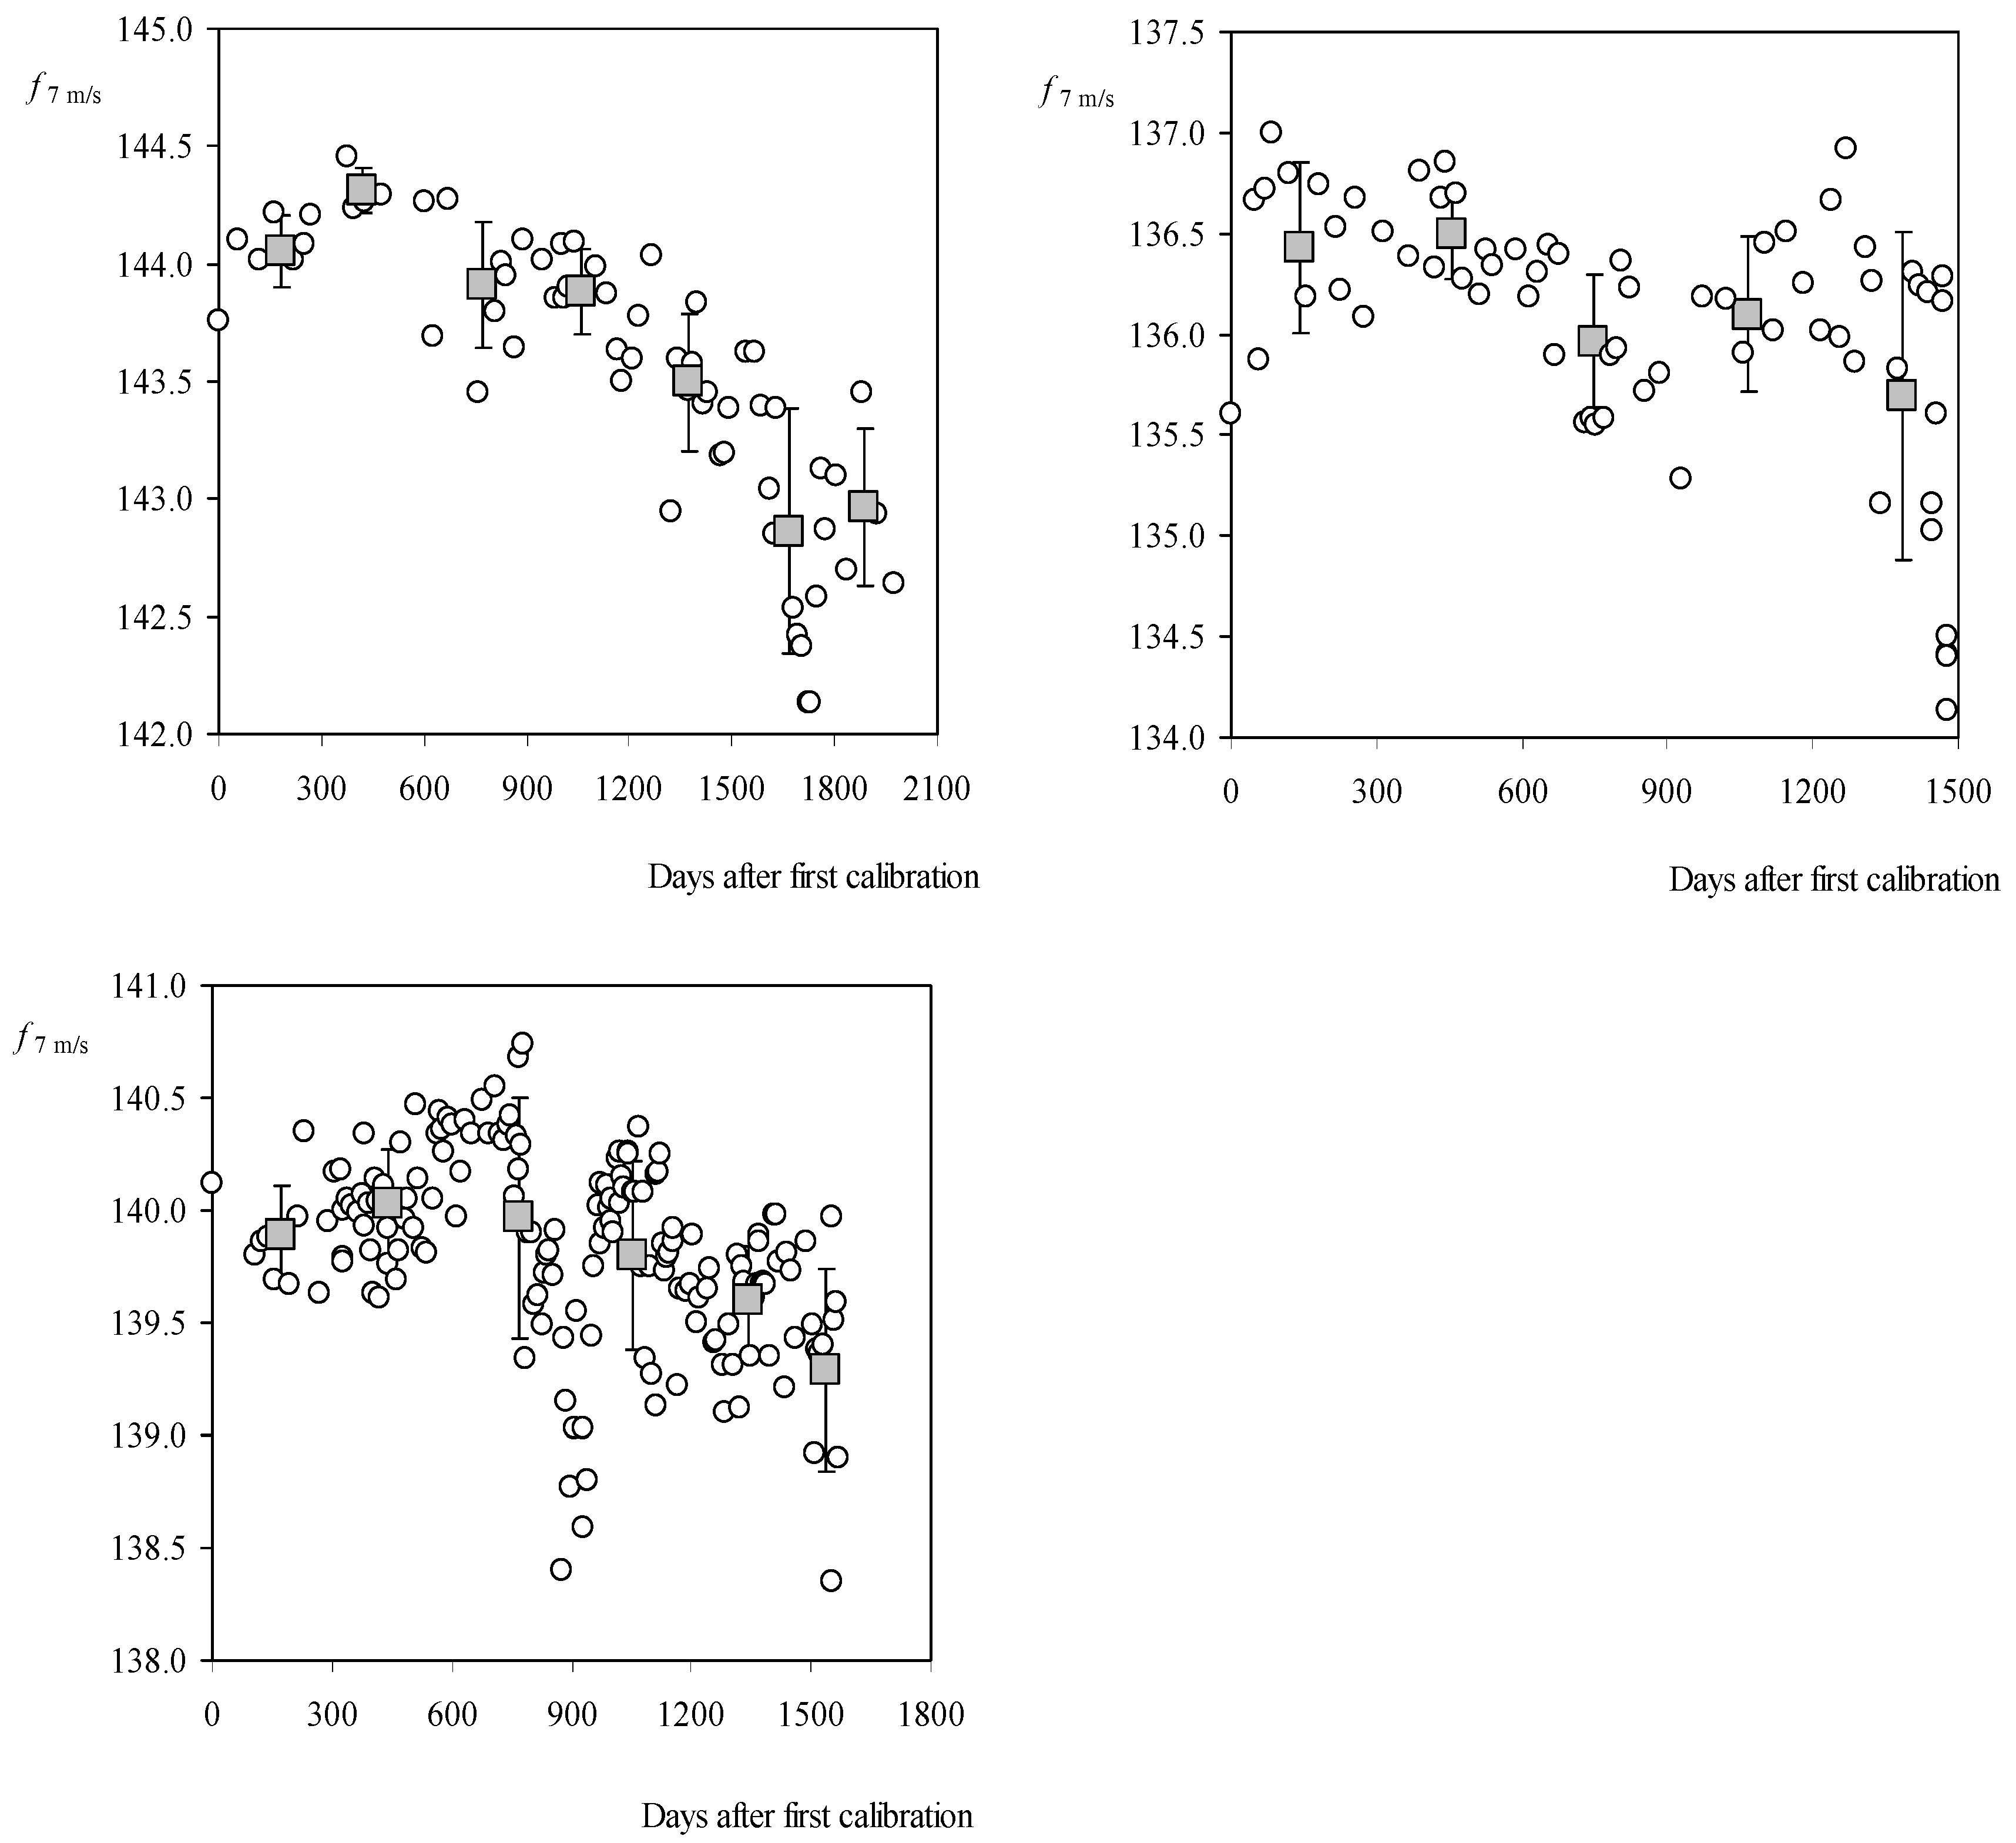
Figure 2 the output frequency at 7 m·s
−1 wind speed of the studied anemometers is plotted as a function of the number of days after their first calibration. There seems to be a transitional period after the starting of life, where the anemometers were more and more efficient in terms of translating the wind speed into rotation (although the practical differences are negligible, around 0.1–0.2 Hz). After this transitional period, the anemometers tend to be less efficient, their output frequency at constant wind speed being decreased with the use. The transitional period observed is around 450 days after the first calibration, for the studied anemometers. The number of calibrations performed on each anemometer within this period was respectively 9 (Cl-100075), 18 (A100 L2) and 30 (Th-4.3350).
If a linear behavior over time after the first calibration, Δ
t, is considered, both calibration coefficients, A and B, can be expressed as:
where (A
0, dA/d
t) and (B
0, dB/d
t) are respectively the linear fit of both coefficients, and the terms
σA and
σB are a measure of the scattering of the data (as known, the interval ±
σ indicates a 68.2% confidence error limits in a Gaussian process).
Bearing in mind what was mentioned in the Introduction with regard to the anemometers’ performance degradation (that is, coefficients A and B—one of them or both—tend to increase if degradation is produced), and the data from
Figure 1, the behavior of the three considered anemometers has been estimated as follows:
Figure 1.
Calibration coefficients’ variation with regard to IDR/UPM Institute anemometers: Climatronics 100075 (top), Vector Instruments A100 L2 (middle), and Thies Clima 4.3350 (bottom) cup anemometers. These coefficients were measured in different calibrations from January 2001 to June 2006 (Climatronics 100075), from September 2003 to September 2007 (A100 L2), and from November 2006 to August 2010 (Thies Clima 4.3350). The 300-day average value has been included, together with the standard deviation bars. The linear fitting to the data has been also included.
Table 1.
Mean and standard deviation values of calibration coefficients A and B every 300 days, corresponding to the IDR/UPM Institute Climatronics 100075, Vector Instruments A100 L2 and Thies Clima 4.3350 anemometers.
Table 1.
Mean and standard deviation values of calibration coefficients A and B every 300 days, corresponding to the IDR/UPM Institute Climatronics 100075, Vector Instruments A100 L2 and Thies Clima 4.3350 anemometers.
| Climatronics 100075 |
| Period considered | Number of calibrations | A mean | σA | B mean | σB |
| First 300 days | 7 | 4.6917 × 10⁻² | 7.5214 × 10⁻⁵ | 2.4124 × 10⁻¹ | 8.9279 × 10⁻³ |
| Between 300 and 600 days | 4 | 4.6925 × 10⁻² | 2.6458 × 10⁻⁵ | 2.2824 × 10⁻¹ | 7.9439 × 10⁻³ |
| Between 600 and 900 days | 10 | 4.7015 × 10⁻² | 7.7683 × 10⁻⁵ | 2.3398 × 10⁻¹ | 1.0886 × 10⁻² |
| Between 900 and 1200 days | 11 | 4.7103 × 10⁻² | 7.8608 × 10⁻⁵ | 2.2276 × 10⁻¹ | 1.1274 × 10⁻² |
| Between 1200 and 1500 days | 13 | 4.7175 × 10⁻² | 8.5312 × 10⁻⁵ | 2.3057 × 10⁻¹ | 1.1498 × 10⁻² |
| Between 1500 and 1800 days | 14 | 4.7325 × 10⁻² | 1.1543 × 10⁻⁴ | 2.3905 × 10⁻¹ | 1.9730 × 10⁻² |
| Between 1800 and 2100 days | 5 | 4.7254 × 10⁻² | 8.4135 × 10⁻⁵ | 2.4437 × 10⁻¹ | 1.8364 × 10⁻² |
| Vector Instruments A100 L2 |
| Period considered | Number of calibrations | A mean | σA | B mean | σB |
| First 300 days | 12 | 5.0151 × 10⁻² | 1.7868 × 10⁻⁴ | 1.5813 × 10⁻¹ | 1.6276 × 10⁻² |
| Between 300 and 600 days | 12 | 5.0005 × 10⁻² | 1.1291 × 10⁻⁴ | 1.7469 × 10⁻¹ | 1.2122 × 10⁻² |
| Between 600 and 900 days | 15 | 5.0022 × 10⁻² | 8.4847 × 10⁻⁵ | 1.9887 × 10⁻¹ | 1.3416 × 10⁻² |
| Between 900 and 1200 days | 8 | 4.9991 × 10⁻² | 1.0809 × 10⁻⁴ | 1.9644 × 10⁻¹ | 1.9603 × 10⁻² |
| Between 1200 and 1500 days | 21 | 5.0060 × 10⁻² | 1.2157 × 10⁻⁴ | 2.0680 × 10⁻¹ | 3.1423 × 10⁻² |
| Thies Clima 4.3350 |
| Period considered | Number of calibrations | A mean | σA | B mean | σB |
| First 300 days | 10 | 4.8200 × 10⁻² | 7.8535 × 10⁻⁵ | 2.5722 × 10⁻¹ | 6.4219 × 10⁻³ |
| Between 300 and 600 days | 36 | 4.8198 × 10⁻² | 8.8757 × 10⁻⁵ | 2.5058 × 10⁻¹ | 1.6461 × 10⁻² |
| Between 600 and 900 days | 33 | 4.8237 × 10⁻² | 1.3275 × 10⁻⁴ | 2.4841 × 10⁻¹ | 2.6559 × 10⁻² |
| Between 900 and 1200 days | 45 | 4.8329 × 10⁻² | 9.0911 × 10⁻⁵ | 2.4362 × 10⁻¹ | 2.1235 × 10⁻² |
| Between 1200 and 1500 days | 33 | 4.8398 × 10⁻² | 8.4043 × 10⁻⁵ | 2.4344 × 10⁻¹ | 1.5727 × 10⁻² |
| Between 1500 and 1800 days | 10 | 4.8361 × 10⁻² | 1.2206 × 10⁻⁴ | 2.6393 × 10⁻¹ | 1.9459 × 10⁻² |
Cl-100075. This anemometer seems to degrade decreasing the rotation speed, but no clear effect can be observed on the offset speed, so only degradation due to the loss of rotation speed was considered (A
0 = 4.684 × 10
−2, and dA/d
t = 2.547 × 10
−7: both the linear fit from
Figure 1; B
0 = 0.2505: value from the initial calibration in 2001, and dB/d
t = 0;
σA = 7.7548 × 10
−5, and
σB = 1.26607 × 10
−2: average values of the scattering from
Table 1).
A100 L2. Only degradation due to the increase of the offset speed was considered for this anemometer (A
0 = 5.044 × 10
−2: value from the initial calibration in 2003, and dA/d
t = 0; B
0 = 1.5857 × 10
−1, and dB/d
t = 3.7815 × 10
−5: both the linear fit from
Figure 1;
σA = 1.21218 × 10
−4, and
σB = 1.85679 × 10
−2: average values of the scattering from
Table 1).
Th-4.3350. As in the case of the Cl-100075 anemometer, only degradation due to the loss of rotation speed was considered (A
0 = 4.8120 × 10
−2, and dA/d
t = 1.880 × 10
−7: both the linear fit from
Figure 1; B
0 = 0.26358: value from the initial calibration in 2006, and dB/d
t = 0;
σA = 9.9509 × 10
−5, and
σB = 1.7644 × 10
−2: average values of the scattering from
Table 1).
Figure 2.
Variation of the output frequency at 7 m·s−1 wind speed, f 7m/s, as a function of the number of days after the first calibration, for the IDR/UPM Institute’s anemometers, Cl-100075 (top left side), A100 L2 (top right side), and Th-4.3350 (bottom). The 300-day average value has been included, together with the standard deviation bars.
Taking into account the Equations (1) to (3), the variation in the measured wind speed as a function of the time (days) after the first calibration can be estimated as:
where the second term is the 68.2% confidence error limits (obviously, this confidence level can be extended by increasing the respective confidence levels of A and B, that is,
σA and
σB).
Once the variation of the measured wind speed regarding an individual anemometer has been defined as a function of the time from its first calibration, it is possible to establish some criteria in order to decide when it should be necessary to recalibrate it. The first criterion could be based solely on the deviation of the measured speed. In this case, the recalibration should be programmed when, at a certain wind speed,
V, the difference between that velocity and the measured wind speed, Δ
V, has reached a certain level. Let us suppose that the limit is established at
X% of the reference wind speed,
V. Then, the recalibration of the anemometer should be scheduled at:
where Δ
t is the number of days after the initial calibration. At that time, the measured wind speed has
X% deviation with respect to the wind speed, with 84.1% confidence (supposing a Gaussian process). Obviously, if it is decided to increase the confidence level to 97.7% the values of
σA and
σB would have to be increased by a factor of 2. On the other hand, if a 50% confidence level is considered the term related to
σA and
σB must be ignored in Equation (5).
In
Table 2,
Table 3 and
Table 4, the proposed recalibration schedules of the Cl-100075, A100 L2, and Th-4.3350 IDR/UPM anemometers, for reference wind speeds
V = 4, 10, 16 and 22 m·s
−1, have been respectively included as a function of the accepted difference between the measured and the reference wind speeds, and the confidence level. See also in the
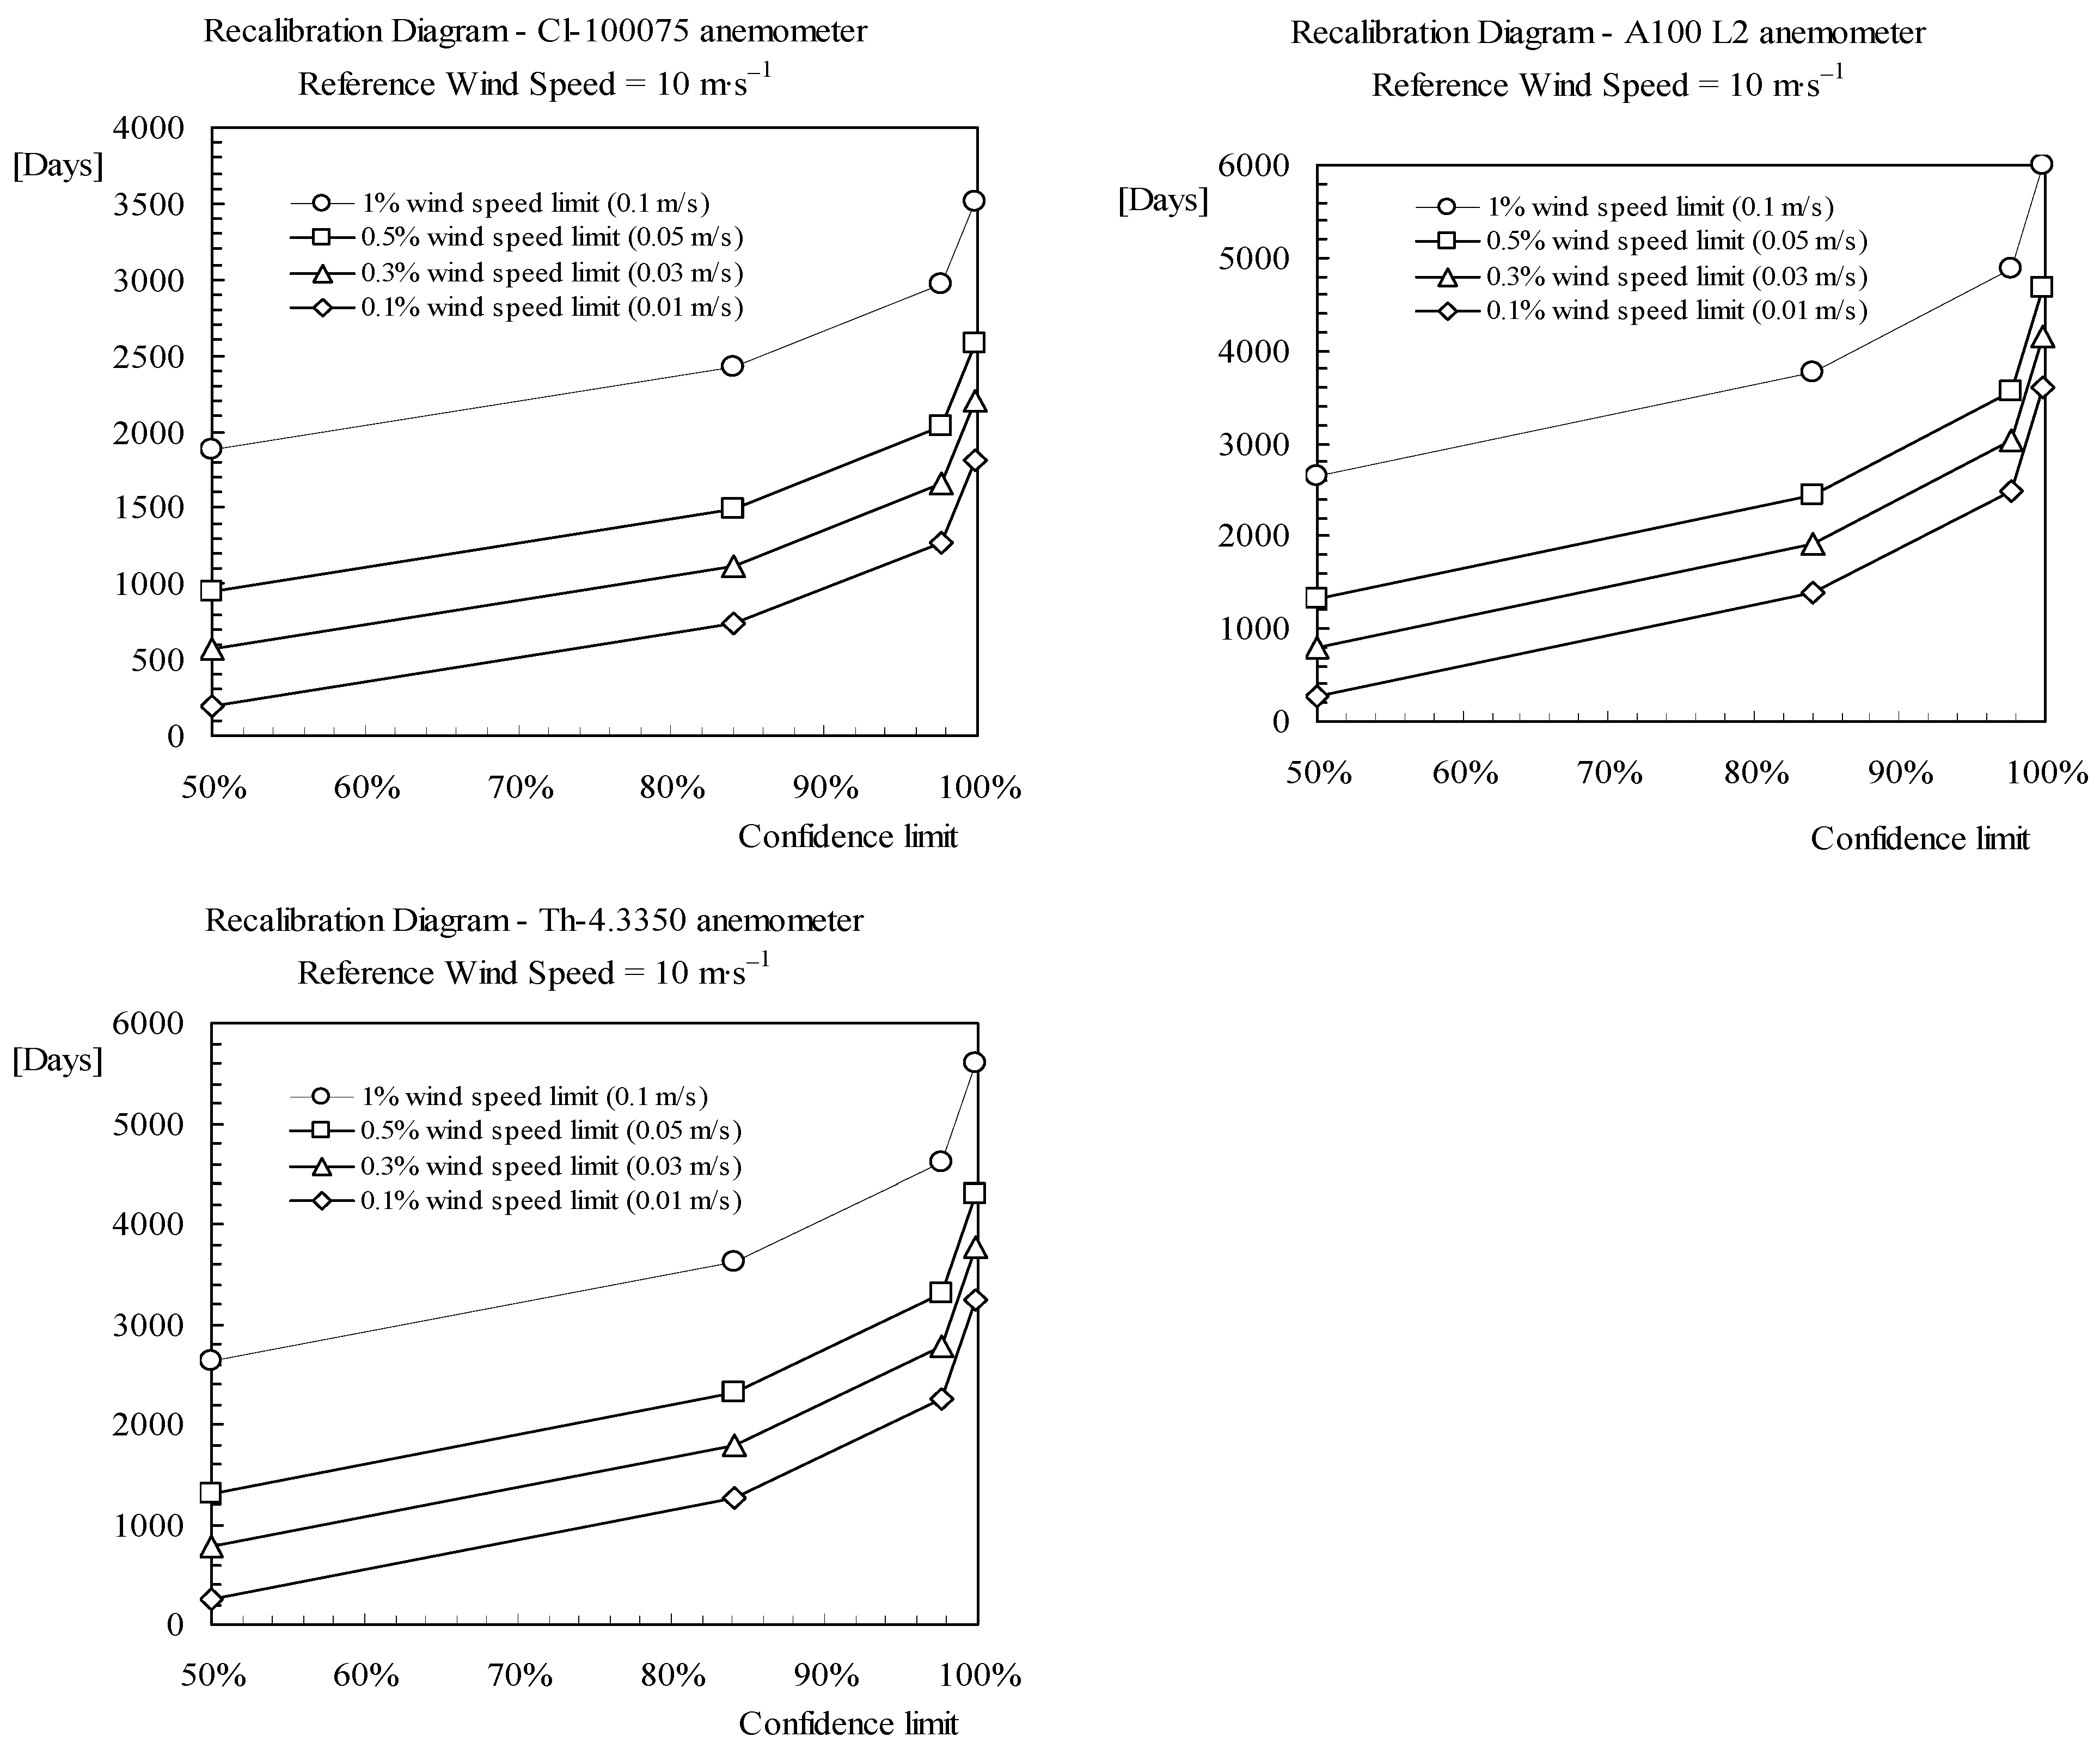
Figure 3, the recalibration diagrams corresponding to the reference wind speed
V = 10 m·s
−1 as a function of the confidence level, for 1, 0.5, 0.3 and 0.1% error with respect to the reference wind speed.
Table 2.
Recalibration schedule (days after the initial calibration) of the IDR/UPM Institute Cl-100075 anemometer for reference wind speeds 4, 10, 16 and 22 m·s−1 as a function of the accepted deviation from the reference wind speeds, and the confidence level.
Table 2.
Recalibration schedule (days after the initial calibration) of the IDR/UPM Institute Cl-100075 anemometer for reference wind speeds 4, 10, 16 and 22 m·s−1 as a function of the accepted deviation from the reference wind speeds, and the confidence level.
| 1% deviation from reference wind speed | | 0.5% deviation from reference wind speed |
|---|
| Confidence level | Reference wind speed | | Confidence level | Reference wind speed |
| 4 | 10 | 16 | 22 | | 4 | 10 | 16 | 22 |
| 50.0% | 1962 | 1886 | 1868 | 1860 | | 50.0% | 981 | 943 | 934 | 930 |
| 84.1% | 2887 | 2430 | 2321 | 2272 | | 84.1% | 1906 | 1486 | 1386 | 1342 |
| 97.7% | 3813 | 2973 | 2773 | 2683 | | 97.7% | 2832 | 2030 | 1839 | 1753 |
| 99.9% | 4738 | 3516 | 3225 | 3095 | | 99.9% | 3757 | 2573 | 2291 | 2165 |
| 0.3% deviation from reference wind speed | | 0.1% deviation from reference wind speed |
| Confidence level | Reference wind speed | | Confidence level | Reference wind speed |
| 4 | 10 | 16 | 22 | | 4 | 10 | 16 | 22 |
| 50.0% | 589 | 566 | 560 | 558 | | 50.0% | 196 | 189 | 187 | 186 |
| 84.1% | 1514 | 1109 | 1013 | 970 | | 84.1% | 1122 | 732 | 639 | 598 |
| 97.7% | 2439 | 1652 | 1465 | 1381 | | 97.7% | 2047 | 1275 | 1091 | 1009 |
| 99.9% | 3365 | 2196 | 1917 | 1793 | | 99.9% | 2972 | 1818 | 1544 | 1421 |
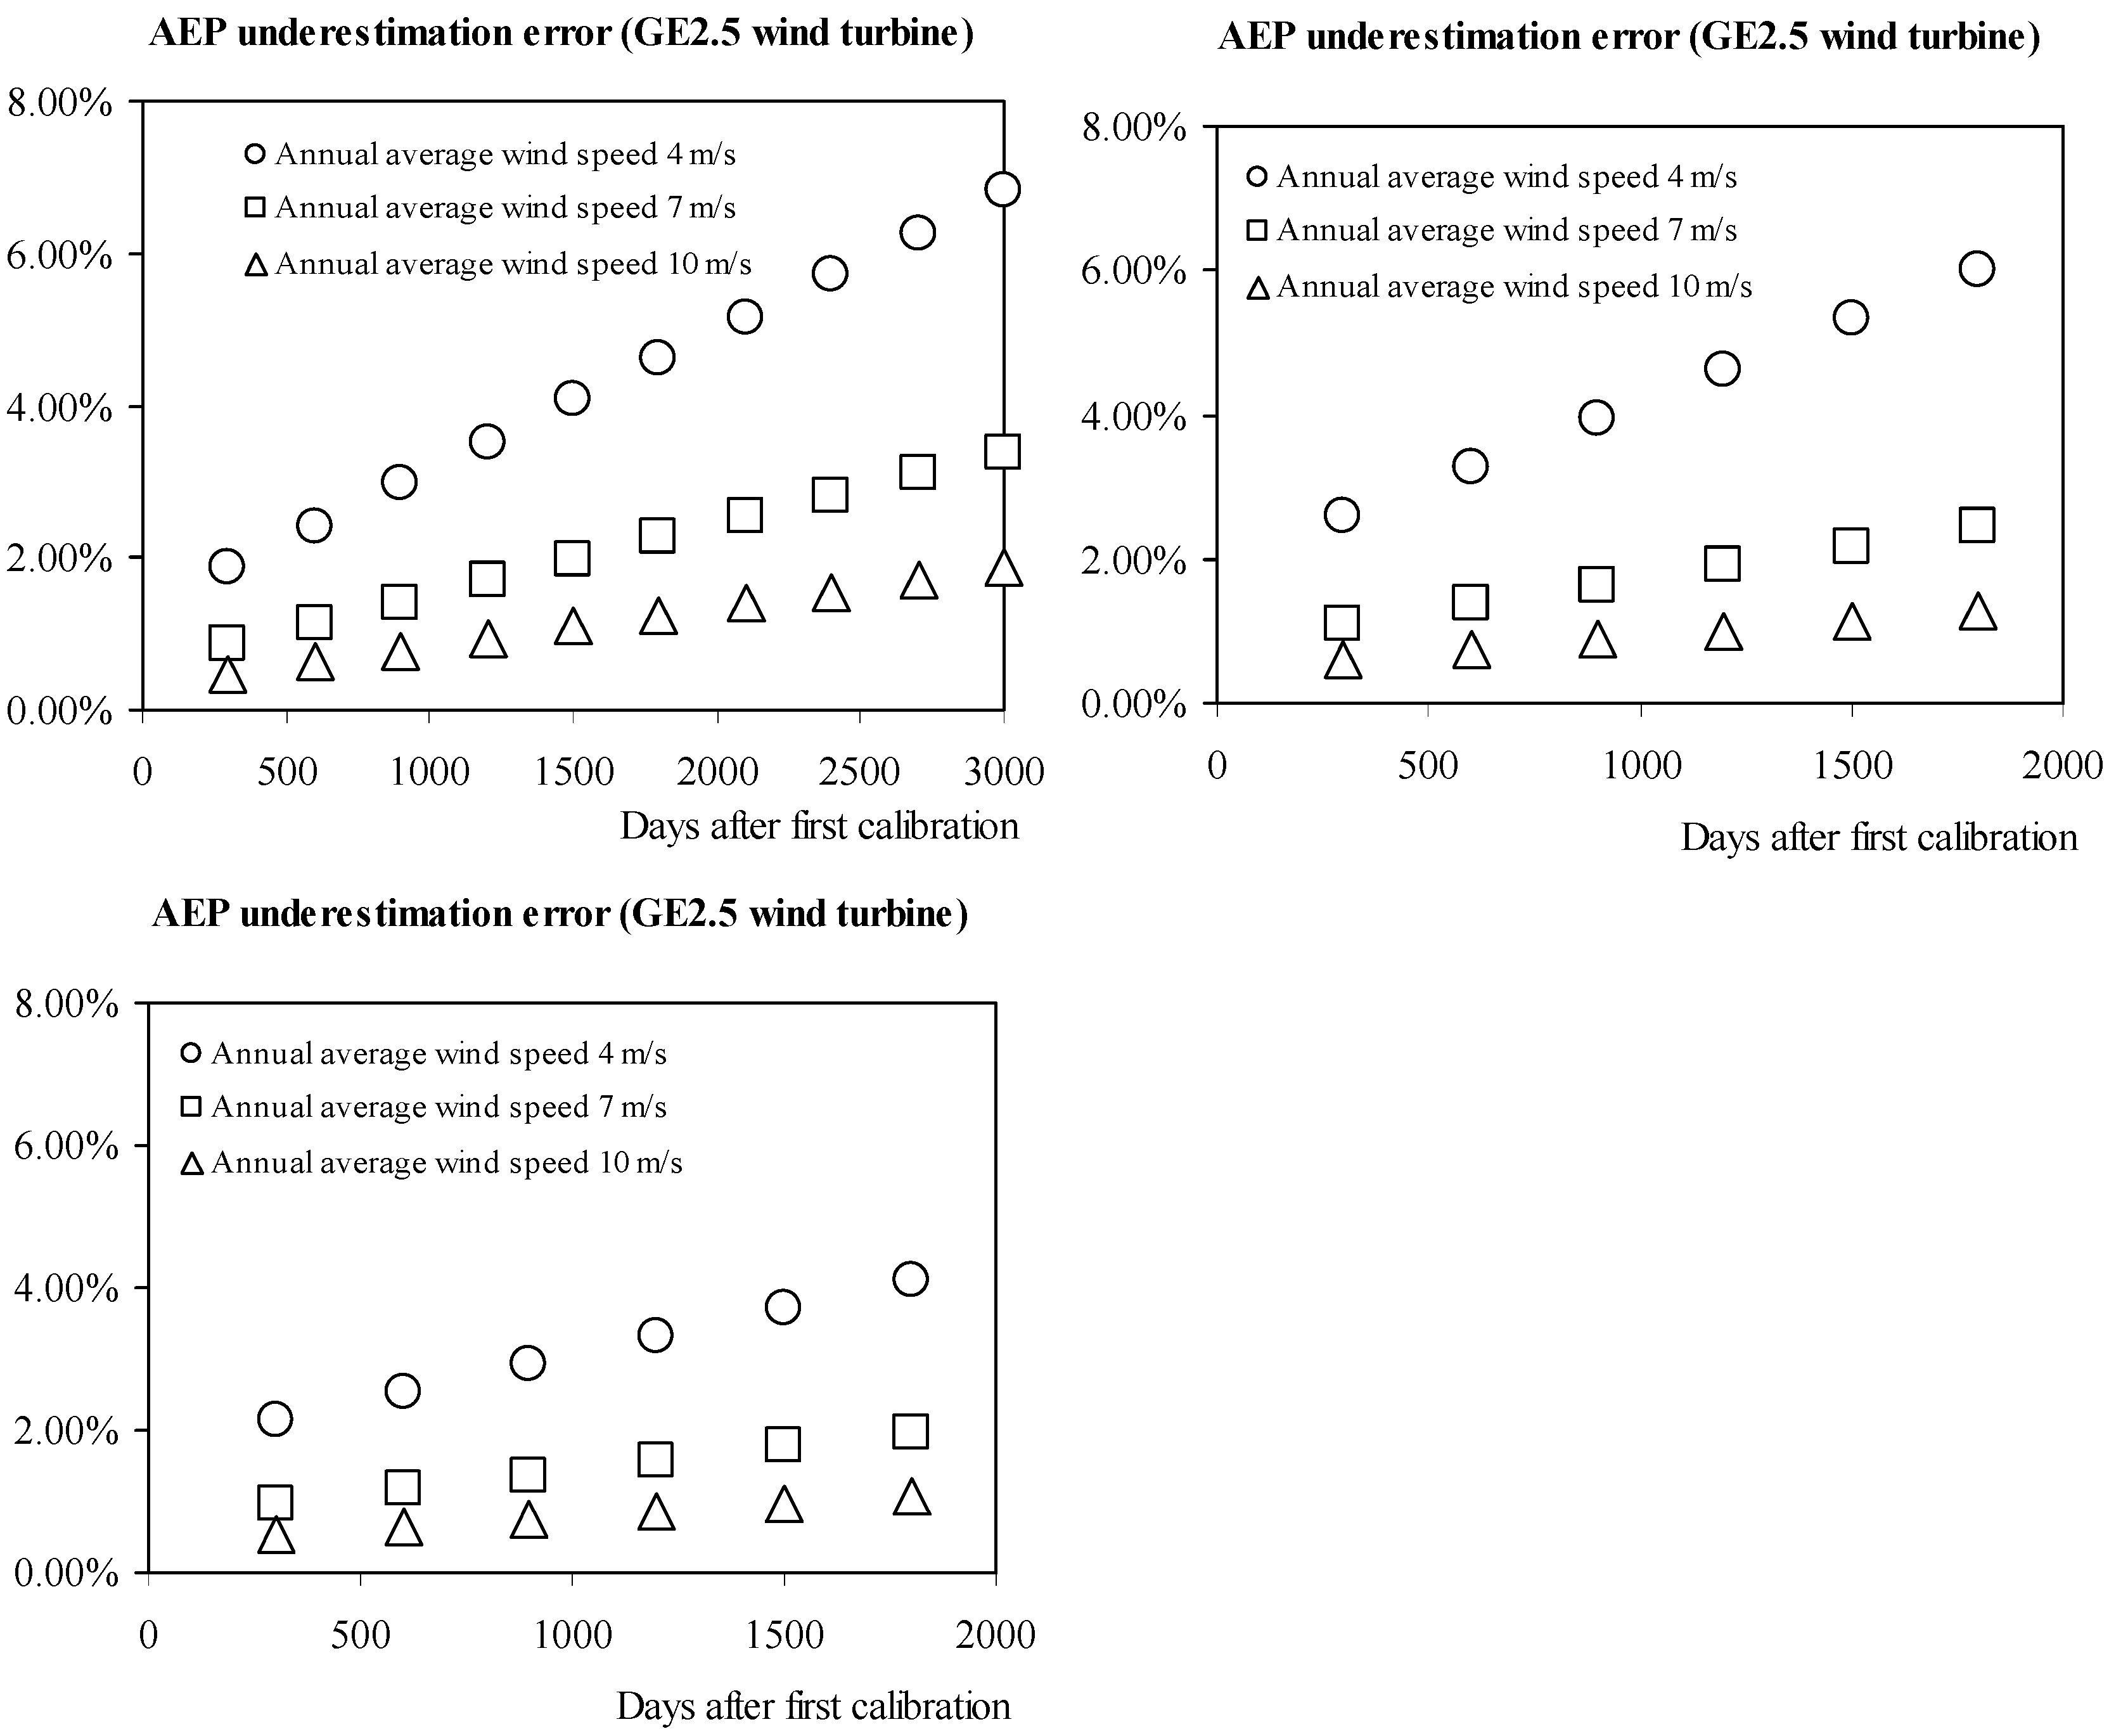
The second criterion suggested to recalibrate the anemometers can be based on the variations of the Annual Energy Production (AEP) estimations due to the error in the wind speed measurements caused by the anemometer’s loss of performance. In
Figure 4 the variations of the AEP due to the Cl-100075, A100 L2 and Th-4.3350 anemometers’ degradation (with 84.1% confidence level) are shown for 4, 7 and 10 m·s
−1 hub height annual average wind speed (see also
Table 5). These AEP calculations have been made by following the procedure recommended by the International Electrotechnical Commission (IEC) [
10], using the General Electric GE2.5 wind turbines power curve as a reference (see [
4]). The recalibration of the anemometer should then be ordered when the underestimation of the AEP reaches a certain critical level.
Table 3.
Recalibration schedule (days after the initial calibration) of the IDR/UPM Institute A100 L2 anemometer for reference wind speeds 4, 10, 16 and 22 m·s−1 as a function of the accepted deviation from the reference wind speeds, and the confidence level.
Table 3.
Recalibration schedule (days after the initial calibration) of the IDR/UPM Institute A100 L2 anemometer for reference wind speeds 4, 10, 16 and 22 m·s−1 as a function of the accepted deviation from the reference wind speeds, and the confidence level.
| 1% deviation from reference wind speed | | 0.5% deviation from reference wind speed |
|---|
| Confidence level | Reference wind speed | | Confidence level | Reference wind speed |
| 4 | 10 | 16 | 22 | | 4 | 10 | 16 | 22 |
| 50.0% | 1058 | 2644 | 4231 | 5818 | | 50.0% | 529 | 1322 | 2116 | 2909 |
| 84.1% | 1793 | 3761 | 5729 | 7697 | | 84.1% | 1264 | 2439 | 3613 | 4788 |
| 97.7% | 2528 | 4877 | 7227 | 9576 | | 97.7% | 1999 | 3555 | 5111 | 6667 |
| 99.9% | 3263 | 5994 | 8724 | 11455 | | 99.9% | 2734 | 4672 | 6609 | 8546 |
| 0.3% deviation from reference wind speed | | 0.1% deviation from reference wind speed |
| Confidence level | Reference wind speed | | Confidence level | Reference wind speed |
| 4 | 10 | 16 | 22 | | 4 | 10 | 16 | 22 |
| 50.0% | 106 | 264 | 423 | 582 | | 50.0% | 106 | 264 | 423 | 582 |
| 84.1% | 841 | 1381 | 1921 | 2461 | | 84.1% | 841 | 1381 | 1921 | 2461 |
| 97.7% | 1576 | 2497 | 3419 | 4340 | | 97.7% | 1576 | 2497 | 3419 | 4340 |
| 99.9% | 2311 | 3614 | 4916 | 6219 | | 99.9% | 2311 | 3614 | 4916 | 6219 |
Table 4.
Recalibration schedule (days after the initial calibration) of the IDR/UPM Institute Th-4.3350 anemometer for reference wind speeds 4, 10, 16 and 22 m·s−1 as a function of the accepted deviation from the reference wind speeds, and the confidence level.
Table 4.
Recalibration schedule (days after the initial calibration) of the IDR/UPM Institute Th-4.3350 anemometer for reference wind speeds 4, 10, 16 and 22 m·s−1 as a function of the accepted deviation from the reference wind speeds, and the confidence level.
| 1% deviation from reference wind speed | | 0.5% deviation from reference wind speed |
|---|
| Confidence level | Reference wind speed | | Confidence level | Reference wind speed |
| 4 | 10 | 16 | 22 | | 4 | 10 | 16 | 22 |
| 50.0% | 2740 | 2629 | 2602 | 2591 | | 50.0% | 1370 | 1314 | 1301 | 1295 |
| 84.1% | 4478 | 3622 | 3419 | 3328 | | 84.1% | 3108 | 2308 | 2118 | 2032 |
| 97.7% | 6216 | 4615 | 4235 | 4065 | | 97.7% | 4846 | 3301 | 2934 | 2769 |
| 99.9% | 7954 | 5608 | 5051 | 4802 | | 99.9% | 6584 | 4294 | 3750 | 3506 |
| 0.3% deviation from reference wind speed | | 0.1% deviation from reference wind speed |
| Confidence level | Reference wind speed | | Confidence level | Reference wind speed |
| 4 | 10 | 16 | 22 | | 4 | 10 | 16 | 22 |
| 50.0% | 822 | 789 | 781 | 777 | | 50.0% | 274 | 263 | 260 | 259 |
| 84.1% | 2560 | 1782 | 1597 | 1514 | | 84.1% | 2012 | 1256 | 1077 | 996 |
| 97.7% | 4298 | 2775 | 2413 | 2251 | | 97.7% | 3750 | 2249 | 1893 | 1733 |
| 99.9% | 6036 | 3768 | 3230 | 2988 | | 99.9% | 5488 | 3242 | 2709 | 2470 |
There seems to be some discrepancy with regard to the recalibration based on the deviation of the measured speed at 10 m·s
−1 reference wind speed (
Figure 3), and the recalibration based on the underestimation of the AEP (
Figure 4).
Figure 3.
Recalibration diagram proposed for the IDR/UPM Institute’s Cl-100075 (top left side), A100 L2 (top right side), and Th-4.3350 (bottom) cup anemometers.
Figure 3.
Recalibration diagram proposed for the IDR/UPM Institute’s Cl-100075 (top left side), A100 L2 (top right side), and Th-4.3350 (bottom) cup anemometers.
Based on the loss of performance at 10 m·s
−1 wind speed, the Cl-100075 anemometer should be recalibrated before the A100 L2 anemometer, however, for 4 m·s
−1 hub height annual average wind speed the underestimation of the AEP is higher in the case of the A100 L2 anemometer than in the case of the Cl-100075 anemometer, no matter the time elapsed since the first calibration. This can be explained as both anemometers degrade differently, according to the data in
Figure 1. The Cl-100075 anemometer loses performance by decreasing the rotation speed for a given wind speed, whereas the A100 L2 anemometer does it by increasing the offset speed. This represents a different degradation of the anemometers’ performances at different reference wind speeds. In
Figure 5 the underestimation of the measured wind speed, Δ
V, is plotted as a function of the reference wind speed for the three anemometers considered 300, 900 and 1800 days after the first calibration. As can be observed in the aforementioned figure, for low wind speeds the loss of performance of the A100 L2 anemometer is greater than the one from the Cl-100075 anemometer, whereas the situation is different for higher wind speeds.
Figure 4.
Variation of the Annual Energy Production (AEP) underestimation caused by the error in the wind speed measurement due to the loss of performance of the IDR/UPM Institute’s Cl-100075 (top left side), A100 L2 (top right side), and Th-4.3350 (bottom) cup anemometers. AEP related to General Electric GE2.5. Underestimation calculated with 84.1% confidence level.
Figure 5.
Underestimation of the measured wind speed, ΔV, as a function of the reference wind speed for the three anemometers considered (left: Cl-100075; middle: A100 L2; right: Th-4.3350) 300, 900 and 1,800 days after the first calibration of the anemometer. Confidence level: 84.1%.
Figure 5.
Underestimation of the measured wind speed, ΔV, as a function of the reference wind speed for the three anemometers considered (left: Cl-100075; middle: A100 L2; right: Th-4.3350) 300, 900 and 1,800 days after the first calibration of the anemometer. Confidence level: 84.1%.
3.2. Variations in Calibration Constants from Anemometers Used in Field
As mentioned previously, the behavior of five different anemometers (Risø P2546, Thies Clima 4.3303 and 4.3350, Climatronics 100075, and Vector Instruments A100 LK), has been studied using the data from individual anemometers calibrated at least two times at the IDR/UPM Institute. The number of anemometers analyzed with regard to the number of calibrations performed is as follows, Risø P2546: 29 anemometers calibrated 2-times, 18 anemometers calibrated 3-times, 11 anemometers calibrated 4-times, four anemometers calibrated 5-times, and one anemometer calibrated 6-times; Climatronics 100075: five anemometers calibrated 2-times, and three anemometers calibrated 3-times; Vector Instruments A100 LK: 90 anemometers calibrated 2-times, 45 anemometers calibrated 3-times, and seven anemometers calibrated 4-times; Thies Clima 4.3303: 33 anemometers calibrated 2-times, 11 anemometers calibrated 3-times, three anemometers calibrated 4-times, and one anemometer calibrated 5-times; Clima 4.3350: 227 anemometers calibrated 2-times, 54 anemometers calibrated 3-times, and four anemometers calibrated 4-times.
Table 5.
Underestimation of the Annual Energy Production (AEP) caused by the deviation in the wind speed measurement due to the loss of performance of the IDR/UPM Climatronics100075, Vector Instruments A100 L2 and Thies Clima 4.3350 anemometers. AEP related to General Electric GE2.5. Underestimation calculated with 84.1% confidence level.
| | Climatronics100075 | |
| Days after first calibration | Hub height annual average wind speed | |
| 4 m·s−1 | 7 m·s−1 | 10 m·s−1 | |
| 300 | 1.87% | 0.86% | 0.47% | |
| 600 | 2.42% | 1.14% | 0.62% | |
| 900 | 2.97% | 1.42% | 0.78% | |
| 1200 | 3.52% | 1.70% | 0.93% | |
| 1500 | 4.07% | 1.98% | 1.09% | |
| 1800 | 4.62% | 2.26% | 1.24% | |
| 2100 | 5.17% | 2.54% | 1.40% | |
| 2400 | 5.72% | 2.82% | 1.55% | |
| 2700 | 6.27% | 3.10% | 1.71% | |
| 3000 | 6.82% | 3.38% | 1.87% | |
| | Vector Instruments A100 L2 | | Thies Clima 4.3350 |
| Days after first calibration | Hub height annual average wind speed | | Hub height annual average wind speed |
| 4 m·s−1 | 7 m·s−1 | 10 m·s−1 | | 4 m·s−1 | 7 m·s−1 | 10 m·s−1 |
| 300 | 2.61% | 1.12% | 0.60% | | 2.14% | 0.97% | 0.52% |
| 600 | 3.29% | 1.38% | 0.73% | | 2.54% | 1.17% | 0.63% |
| 900 | 3.96% | 1.65% | 0.87% | | 2.93% | 1.37% | 0.75% |
| 1200 | 4.64% | 1.92% | 1.01% | | 3.33% | 1.57% | 0.86% |
| 1500 | 5.32% | 2.18% | 1.15% | | 3.72% | 1.77% | 0.97% |
| 1800 | 5.99% | 2.45% | 1.29% | | 4.12% | 1.97% | 1.08% |
All anemometers studied were used in the field under different climatic conditions during different time periods. The elapsed time between calibrations is not exactly equal to the periods of service due to transportation, installation and disassembly times, but it seems reasonable to assume that this time is minimal when compared to the period of service. The percentage variation of the calibration constants A and B of the studied anemometers is shown in
Figure 6 and
Figure 7 as a function of the time elapsed from the first calibration.
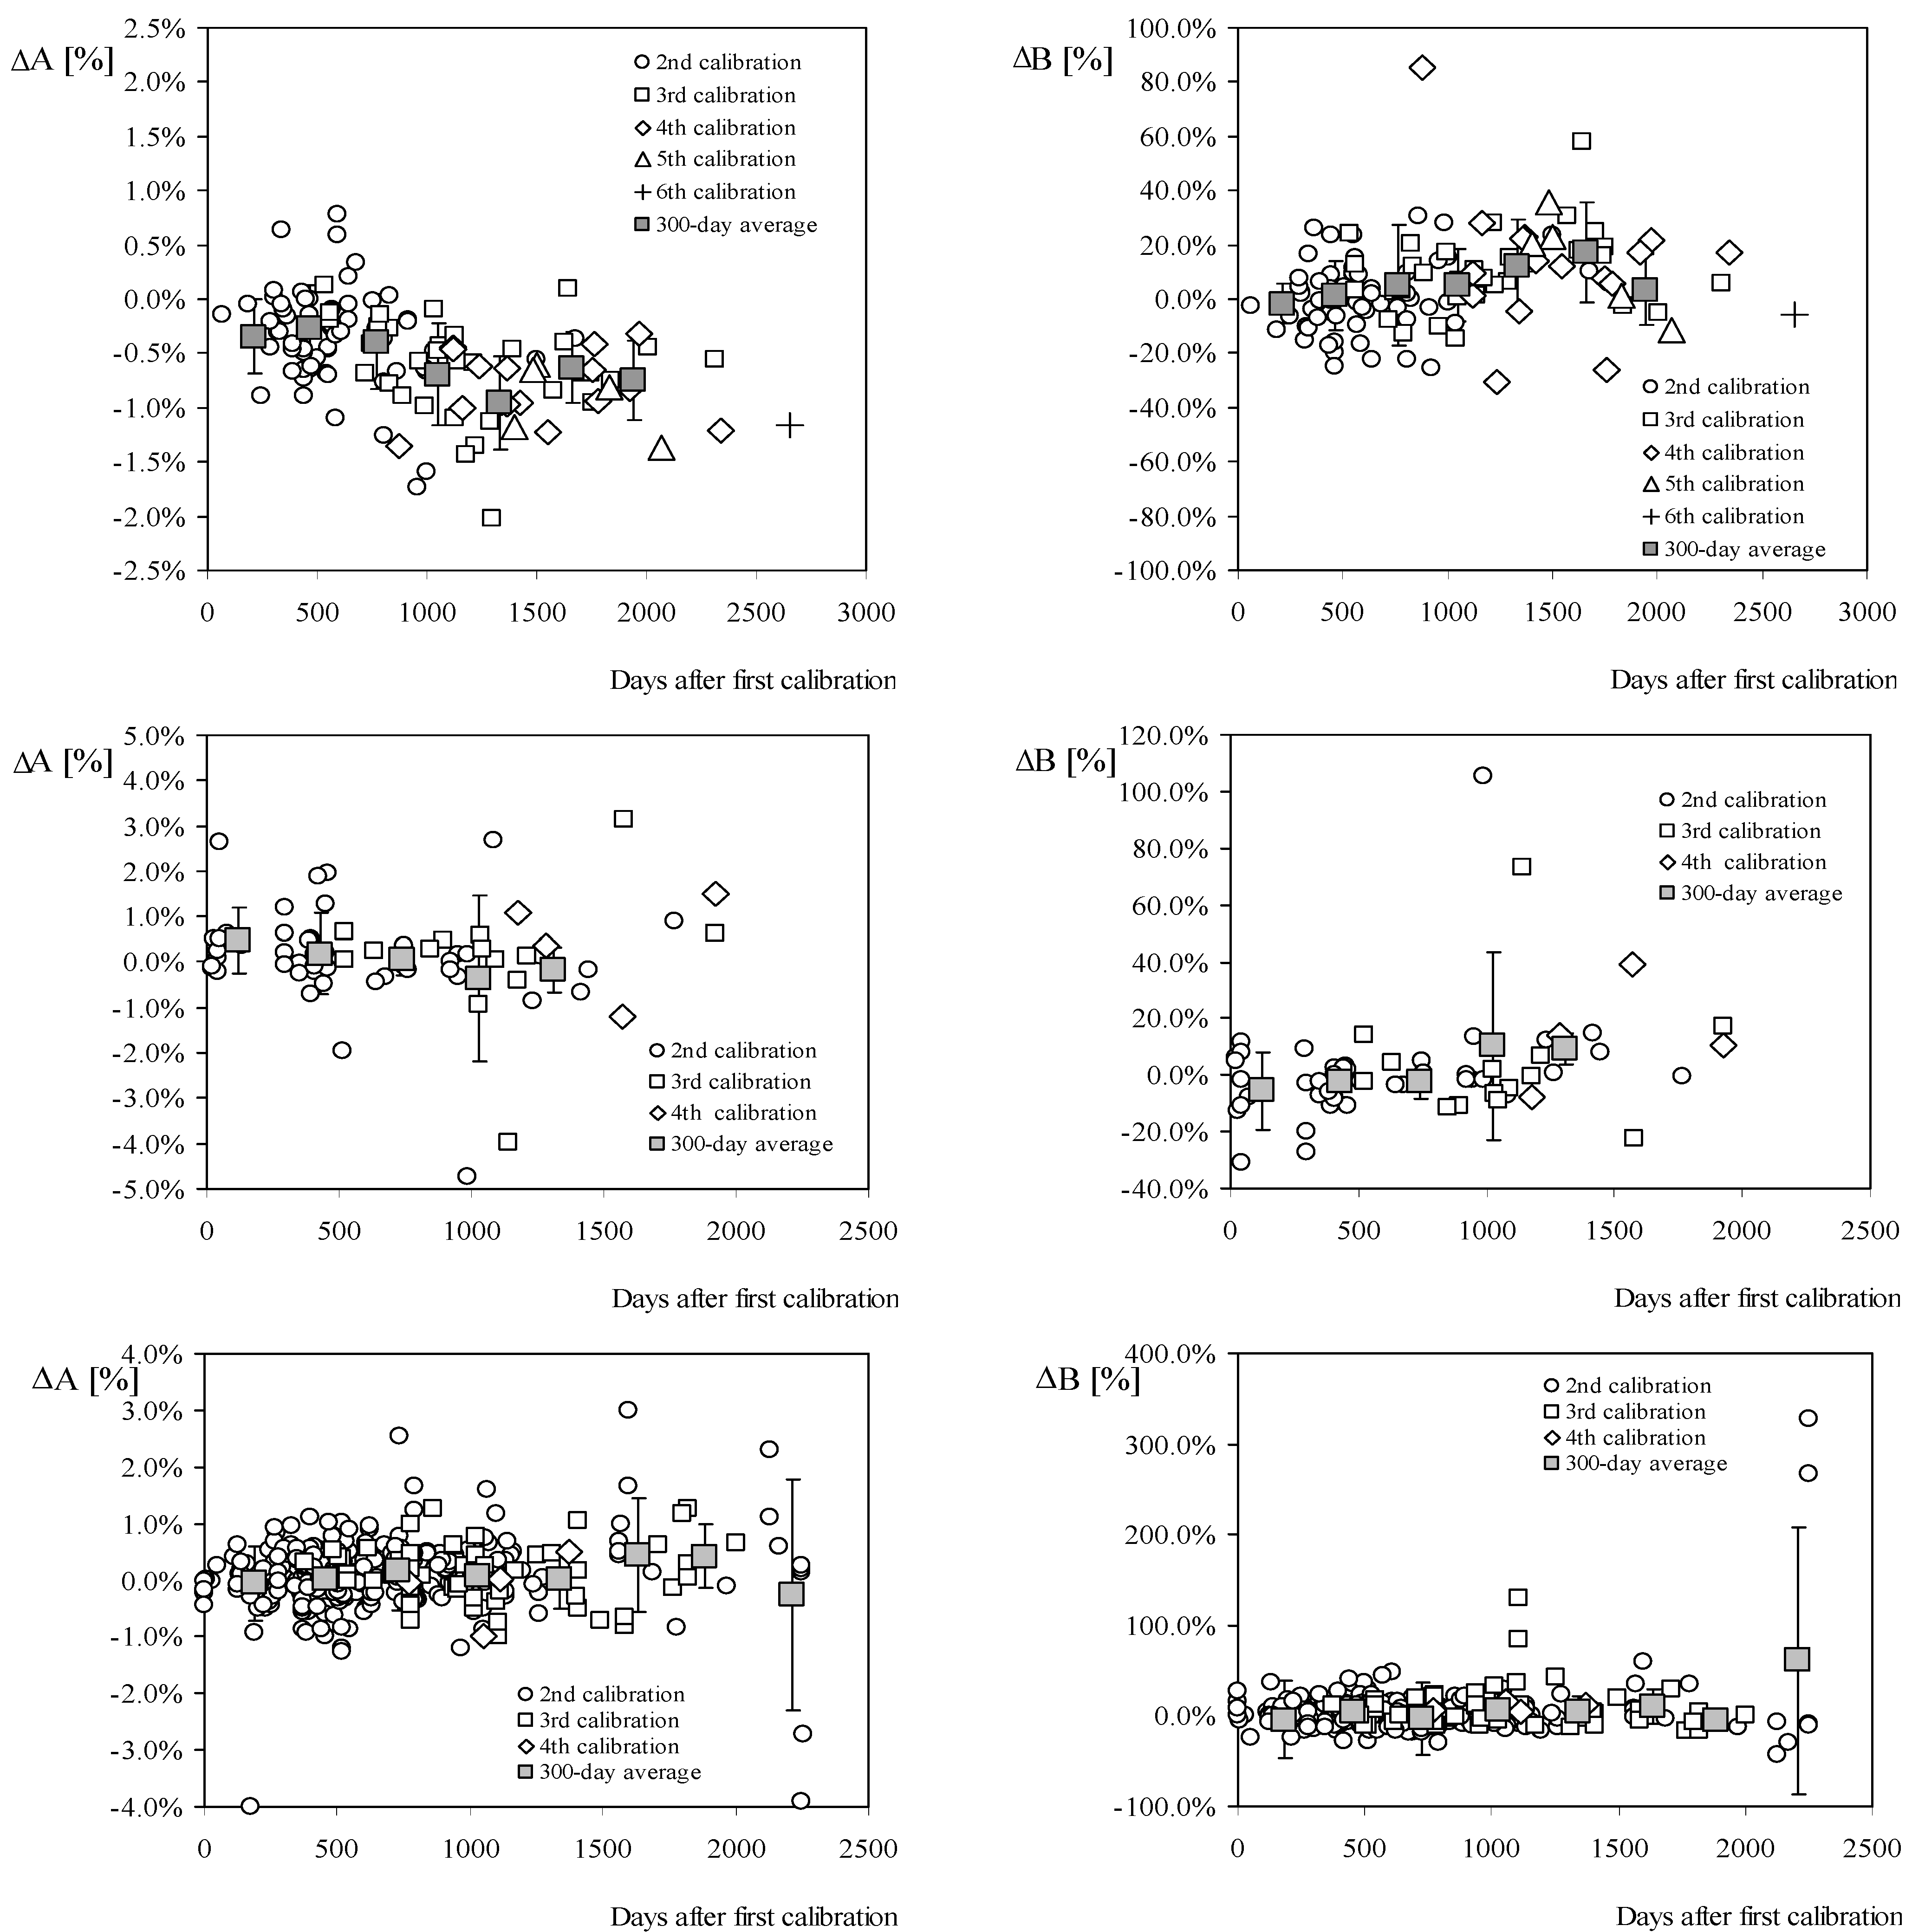
Figure 6.
Percentage variation of calibration constants A and B from the initial values with regard to Risø P2546 (top), Thies Clima 4.3303 (middle), and Thies Clima 4.3350 (bottom) anemometers calibrated several times at the IDR/UPM Institute. The 300-day average value has been included, together with the standard deviation bars.
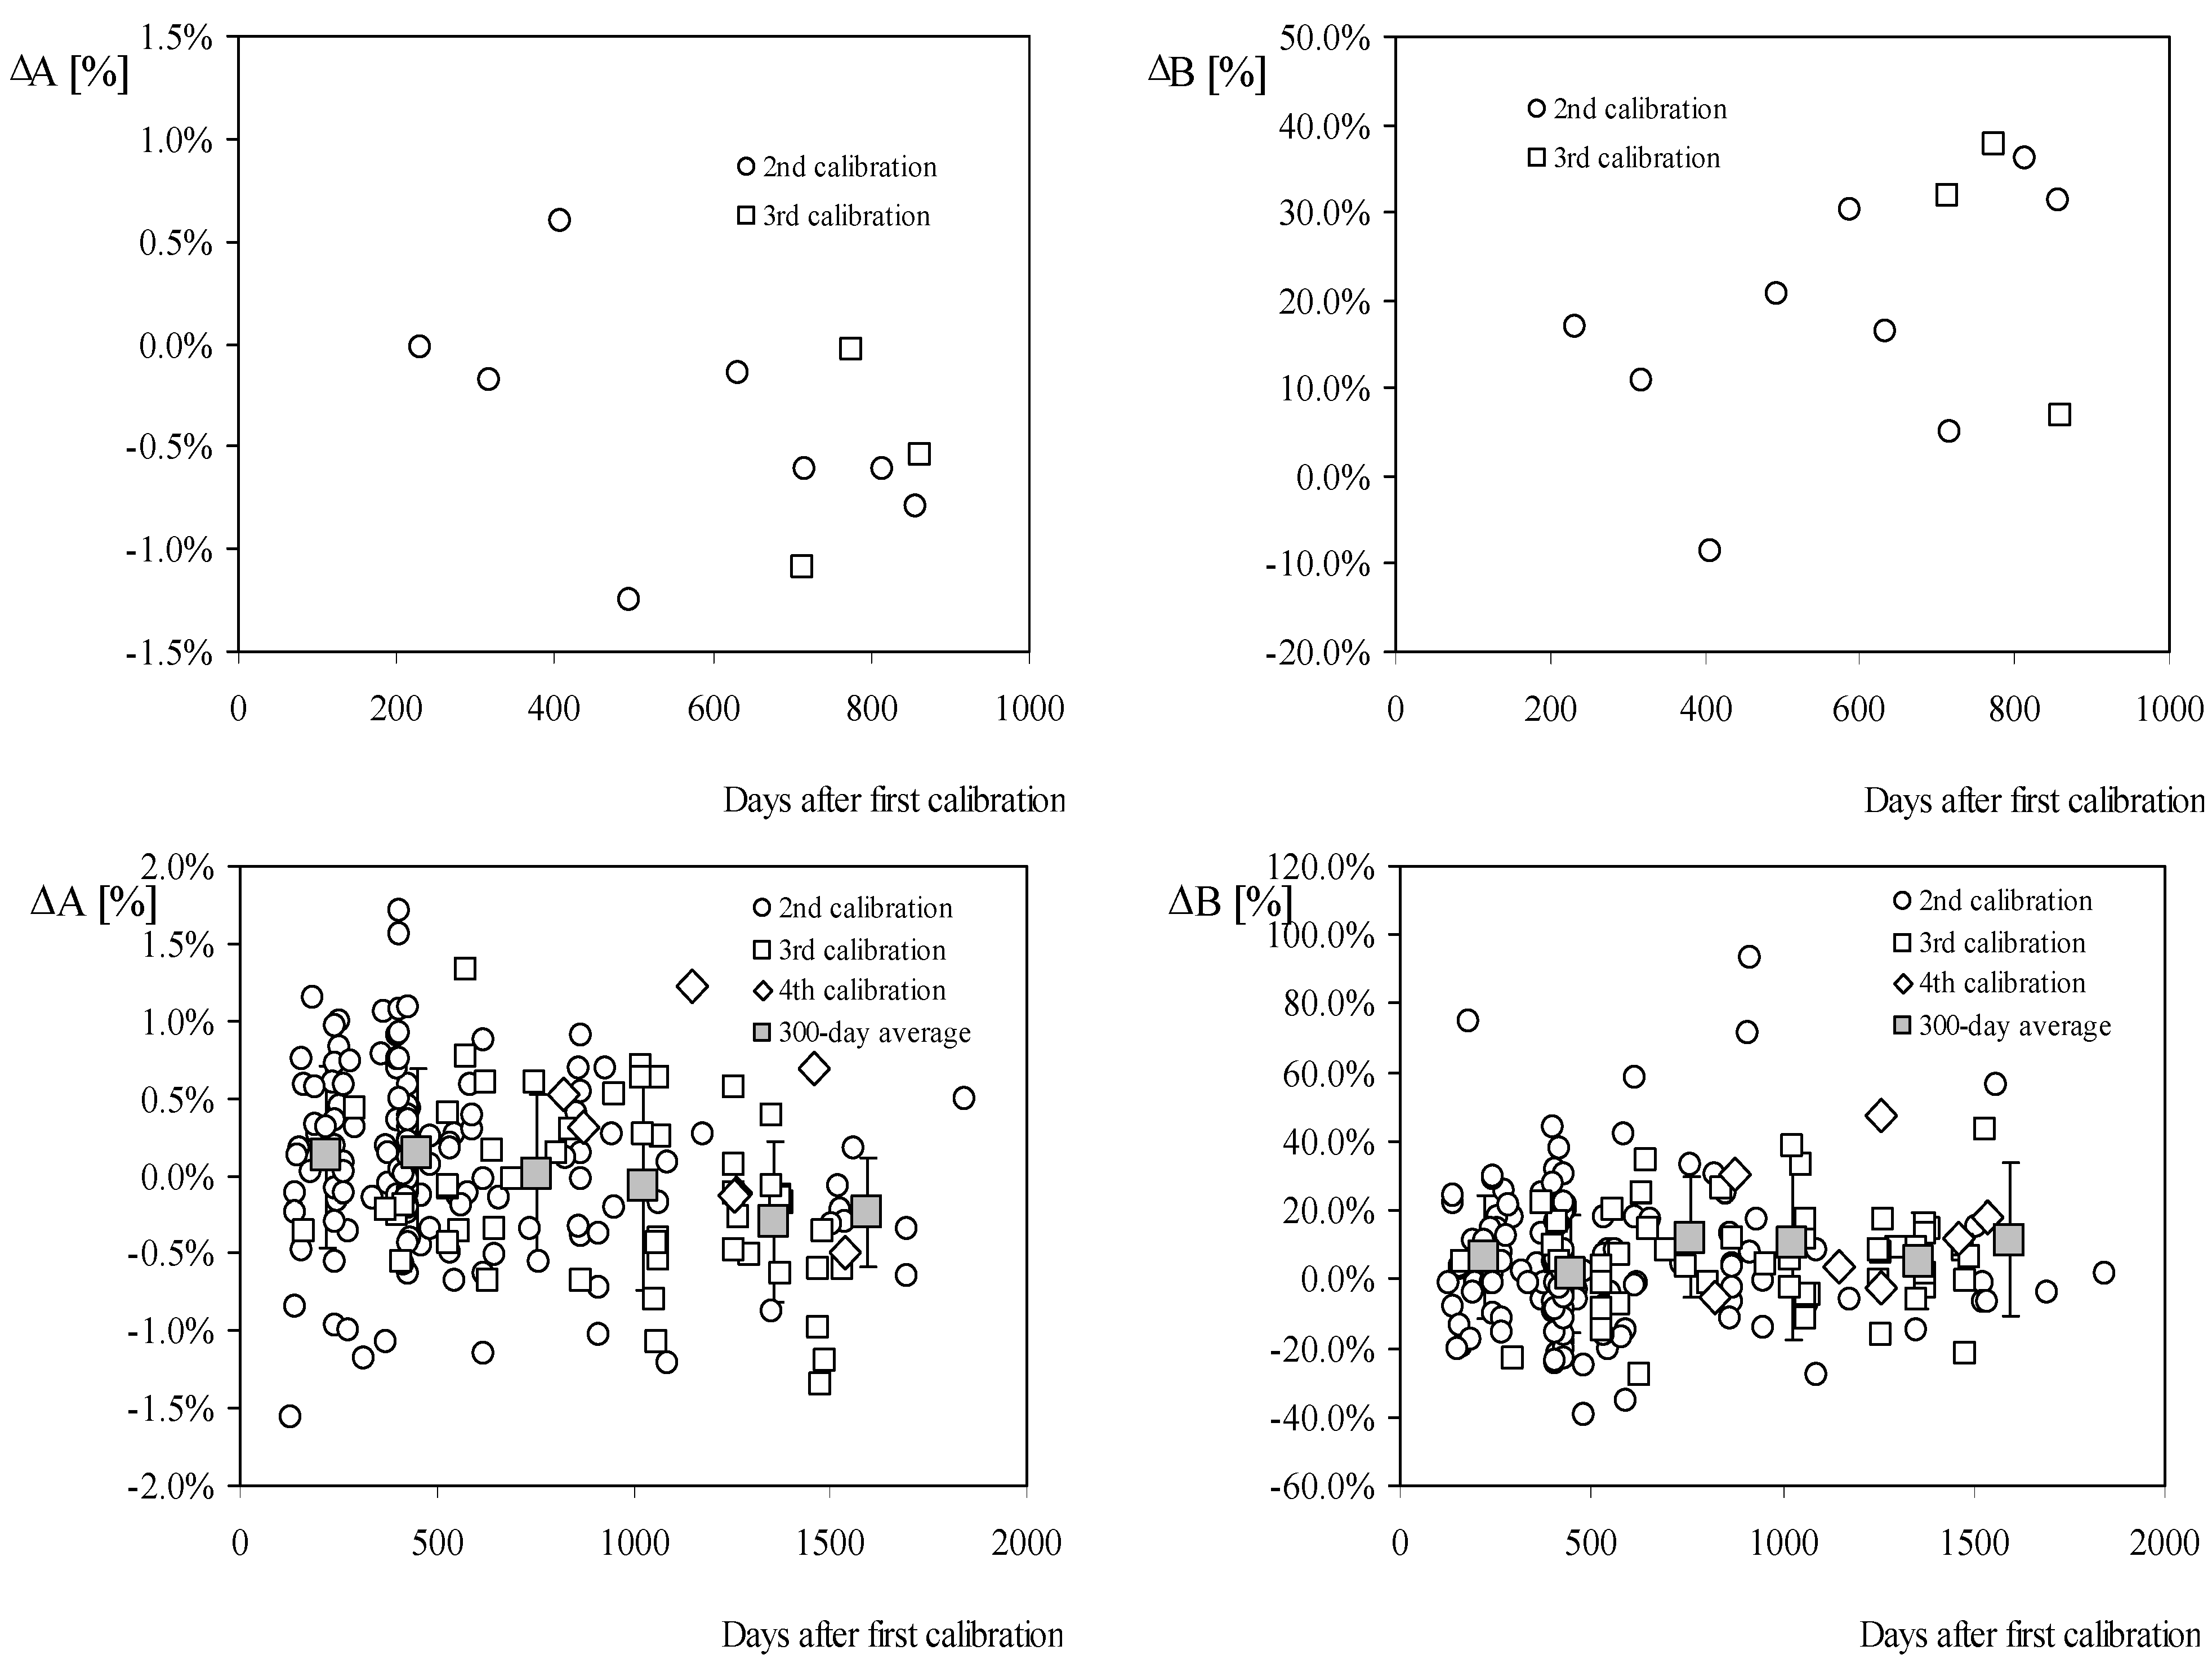
Figure 7.
Percentage variation of calibration constants A and B from the initial values with regard to Climatronics 100075 (top), and Vector Instruments A100 LK (bottom) cup anemometers calibrated several times at the IDR/UPM Institute. The 300-day average value, together with the standard deviation bars, have been included for the second model (the data corresponding to the Climatronics 100075 model is clearly not sufficient for an equivalent statistic).
In these figures, the 300-day average variation and the standard deviation bars have also been included as a way to filter the great scattering from the data (see also in
Table 6 the mentioned average and standard deviation values of each anemometer model, with the exception of the Climatronics 100075, as not enough data is available with regard to this model—only 11 calibrations were carried out in the studied period, see
Figure 7). Taking into account this 300-day average evolution, there seems to be a similar behavior between all anemometers, the value of constant A decreasing over time since the first calibration, and the value of constant B increasing. The only exception to this rule is the Thies Clima 4.3350 anemometer, whose 300-day average variation seems to increase slightly with regard to both coefficients (see
Figure 6).
Table 6.
Percentage variation of coefficients A and B from the initial calibration each 300 days, corresponding to Risø P2546, Thies Clima 4.3303, Thies Clima 4.3350, and Vector Instruments A100 LK anemometers respectively calibrated at the IDR/UPM from June 2003 to January 2011, from September 2003 to September 2010, from November 2003 to January 2011, and March 2005 to January 2011. Average and standard deviation values (see also
Figure 6 and
Figure 7).
Table 6.
Percentage variation of coefficients A and B from the initial calibration each 300 days, corresponding to Risø P2546, Thies Clima 4.3303, Thies Clima 4.3350, and Vector Instruments A100 LK anemometers respectively calibrated at the IDR/UPM from June 2003 to January 2011, from September 2003 to September 2010, from November 2003 to January 2011, and March 2005 to January 2011. Average and standard deviation values (see also Figure 6 and Figure 7).
| Risø P2546 |
| Period considered after the first calibration | Number of calibrations in the considered period | ΔA mean
[%] | σΔA
[%] | ΔB mean
[%] | σΔB
[%] |
| First 300 days | 5 | 0.34% | 0.34% | 1.62% | 7.61% |
| Between 300 and 600 days | 39 | 0.27% | 0.40% | 1.21% | 12.79% |
| Between 600 and 900 days | 21 | 0.40% | 0.44% | 5.06% | 22.26% |
| Between 900 and 1200 days | 20 | 0.70% | 0.47% | 4.83% | 13.42% |
| Between 1200 and 1500 days | 12 | 0.96% | 0.43% | 12.31% | 17.27% |
| Between 1500 and 1800 days | 13 | 0.63% | 0.33% | 17.05% | 18.50% |
| Between 1800 and 2100 days | 6 | 0.75% | 0.37% | 3.35% | 13.03% |
| Between 2100 and 2700 days | 3 | 0.98% | 0.36% | 5.62% | 11.42% |
| Thies Clima 4.3303 |
| Period considered after the first calibration | Number of calibrations in the considered period | ΔA mean
[%] | σΔA
[%] | ΔB mean
[%] | σΔB
[%] |
| First 300 days | 14 | 0.46% | 0.73% | 5.58% | 13.57% |
| Between 300 and 600 days | 19 | 0.19% | 0.88% | 2.00% | 5.92% |
| Between 600 and 900 days | 8 | 0.04% | 0.34% | 2.43% | 6.10% |
| Between 900 and 1200 days | 15 | 0.36% | 1.82% | 10.21% | 33.20% |
| Between 1200 and 1500 days | 6 | 0.17% | 0.48% | 9.51% | 5.45% |
| Between 1500 and 2100 days | 6 | 1.02% | 1.41% | 7.86% | 20.17% |
| Thies Clima 4.3350 |
| Period considered after the first calibration | Number of calibrations in the considered period | ΔA mean
[%] | σΔA
[%] | ΔB mean
[%] | σΔB
[%] |
| First 300 days | 52 | 0.06% | 0.66% | 4.26% | 42.73% |
| Between 300 and 600 days | 112 | 0.03% | 0.48% | 3.91% | 13.08% |
| Between 600 and 900 days | 84 | 0.16% | 0.71% | 3.10% | 39.46% |
| Between 900 and 1200 days | 58 | 0.07% | 0.52% | 6.76% | 22.86% |
| Between 1200 and 1500 days | 12 | 0.03% | 0.53% | 5.20% | 16.38% |
| Between 1500 and 1800 days | 16 | 0.43% | 1.01% | 10.22% | 19.39% |
| Between 1800 and 2100 days | 5 | 0.42% | 0.55% | 5.62% | 9.04% |
| Between 2100 and 2400 days | 8 | 0.25% | 2.04% | 60.81% | 147.46% |
| Vector Instruments A100 LK |
| Period considered after the first calibration | Number of calibrations in the considered period | ΔA mean
[%] | σΔA
[%] | ΔB mean
[%] | σΔB
[%] |
| First 300 days | 41 | 0.13% | 0.59% | 6.47% | 17.59% |
| Between 300 and 600 days | 77 | 0.15% | 0.55% | 1.55% | 17.22% |
| Between 600 and 900 days | 29 | 0.01% | 0.52% | 12.15% | 17.38% |
| Between 900 and 1200 days | 22 | 0.06% | 0.67% | 10.36% | 27.80% |
| Between 1200 and 1500 days | 22 | 0.30% | 0.51% | 5.34% | 14.16% |
| Between 1500 and 2100 days | 10 | 0.31% | 0.26% | 12.37% | 23.29% |
Table 7.
68.2% confidence limits (ΔAlower, ΔAupper, ΔBlower, and ΔBupper) for the variation of the constants A and B in the intervals 0–300, 300–600 and 600–1000 days from the initial calibration, with regard the anemometers studied (Risø P2546, Thies Clima 4.3303 and 4.3350, and Vector Instruments A100 LK).
| Risø P2546 |
| Interval [days after first calibration] | ΔAlower [%] | ΔAupper [%] | ΔBlower [%] | ΔBupper [%] |
| 0–300 | −0.45% | 0.03% | −17.40% | 32.36% |
| 300–600 | −0.67% | 0.14% | −12.84% | 18.30% |
| 600–1000 | −0.73% | 0.19% | −16.93% | 22.17% |
| Thies Clima 4.3303 |
| Interval [days after first calibration] | ΔAlower [%] | ΔAupper [%] | ΔBlower [%] | ΔBupper [%] |
| 0–300 | −1.18% | 1.51% | −25.01% | 24.77% |
| 300–600 | −0.68% | 1.07% | −7.55% | 1.89% |
| 600–1000 | −1.29% | 0.85% | −17.05% | 32.12% |
| Thies Clima 4.3350 |
| Interval [days after first calibration] | ΔAlower [%] | ΔAupper [%] | ΔBlower [%] | ΔBupper [%] |
| 0–300 | −0.74% | 0.60% | −44.85% | 36.07% |
| 300–600 | −0.45% | 0.52% | −12.18% | 20.61% |
| 600–1000 | −0.25% | 0.69% | −11.94% | 13.13% |
| Vector Instruments A100 LK |
| Interval [days after first calibration] | ΔAlower [%] | ΔAupper [%] | ΔBlower [%] | ΔBupper [%] |
| 0–300 | −0.75% | 0.65% | −10.95% | 29.08% |
| 300–600 | −0.40% | 0.74% | −15.53% | 18.97% |
| 600–1000 | −0.64% | 0.39% | −14.30% | 36.10% |
In
Table 7 the 68.2% confidence limits (assuming a Gaussian process), for the variation of constants A and B in the intervals 0–300, 300–600 and 600–1000 days from the initial calibration are included. With these variations of the constants A and B it is possible to estimate the same confidence limits for the measured wind speed deviation,
Vlower and
Vupper, at any wind speed,
V:
where ΔA
lower, ΔA
upper, ΔB
lower, and ΔB
upper are respectively the variation limits of calibration coefficients from
Table 7, A
0 and B
0 are the calibration constants corresponding to each anemometer (from reference [
4]: A
0 = 0.627 and B
0 = 0.179 for the Risø P2546; A
0 = 0.047 and B
0 = 0.499 for the Thies Clima 4.330; A
0 = 0.0483 and B
0 = 0.248 for the Thies Clima 4.3350; A
0 = 0.0505 and B
0 = 0.195 for the Vector Instruments A100 LK), and
f is the frequency output, which can be obviously expressed as a function of the reference wind,
V, speed as:
In
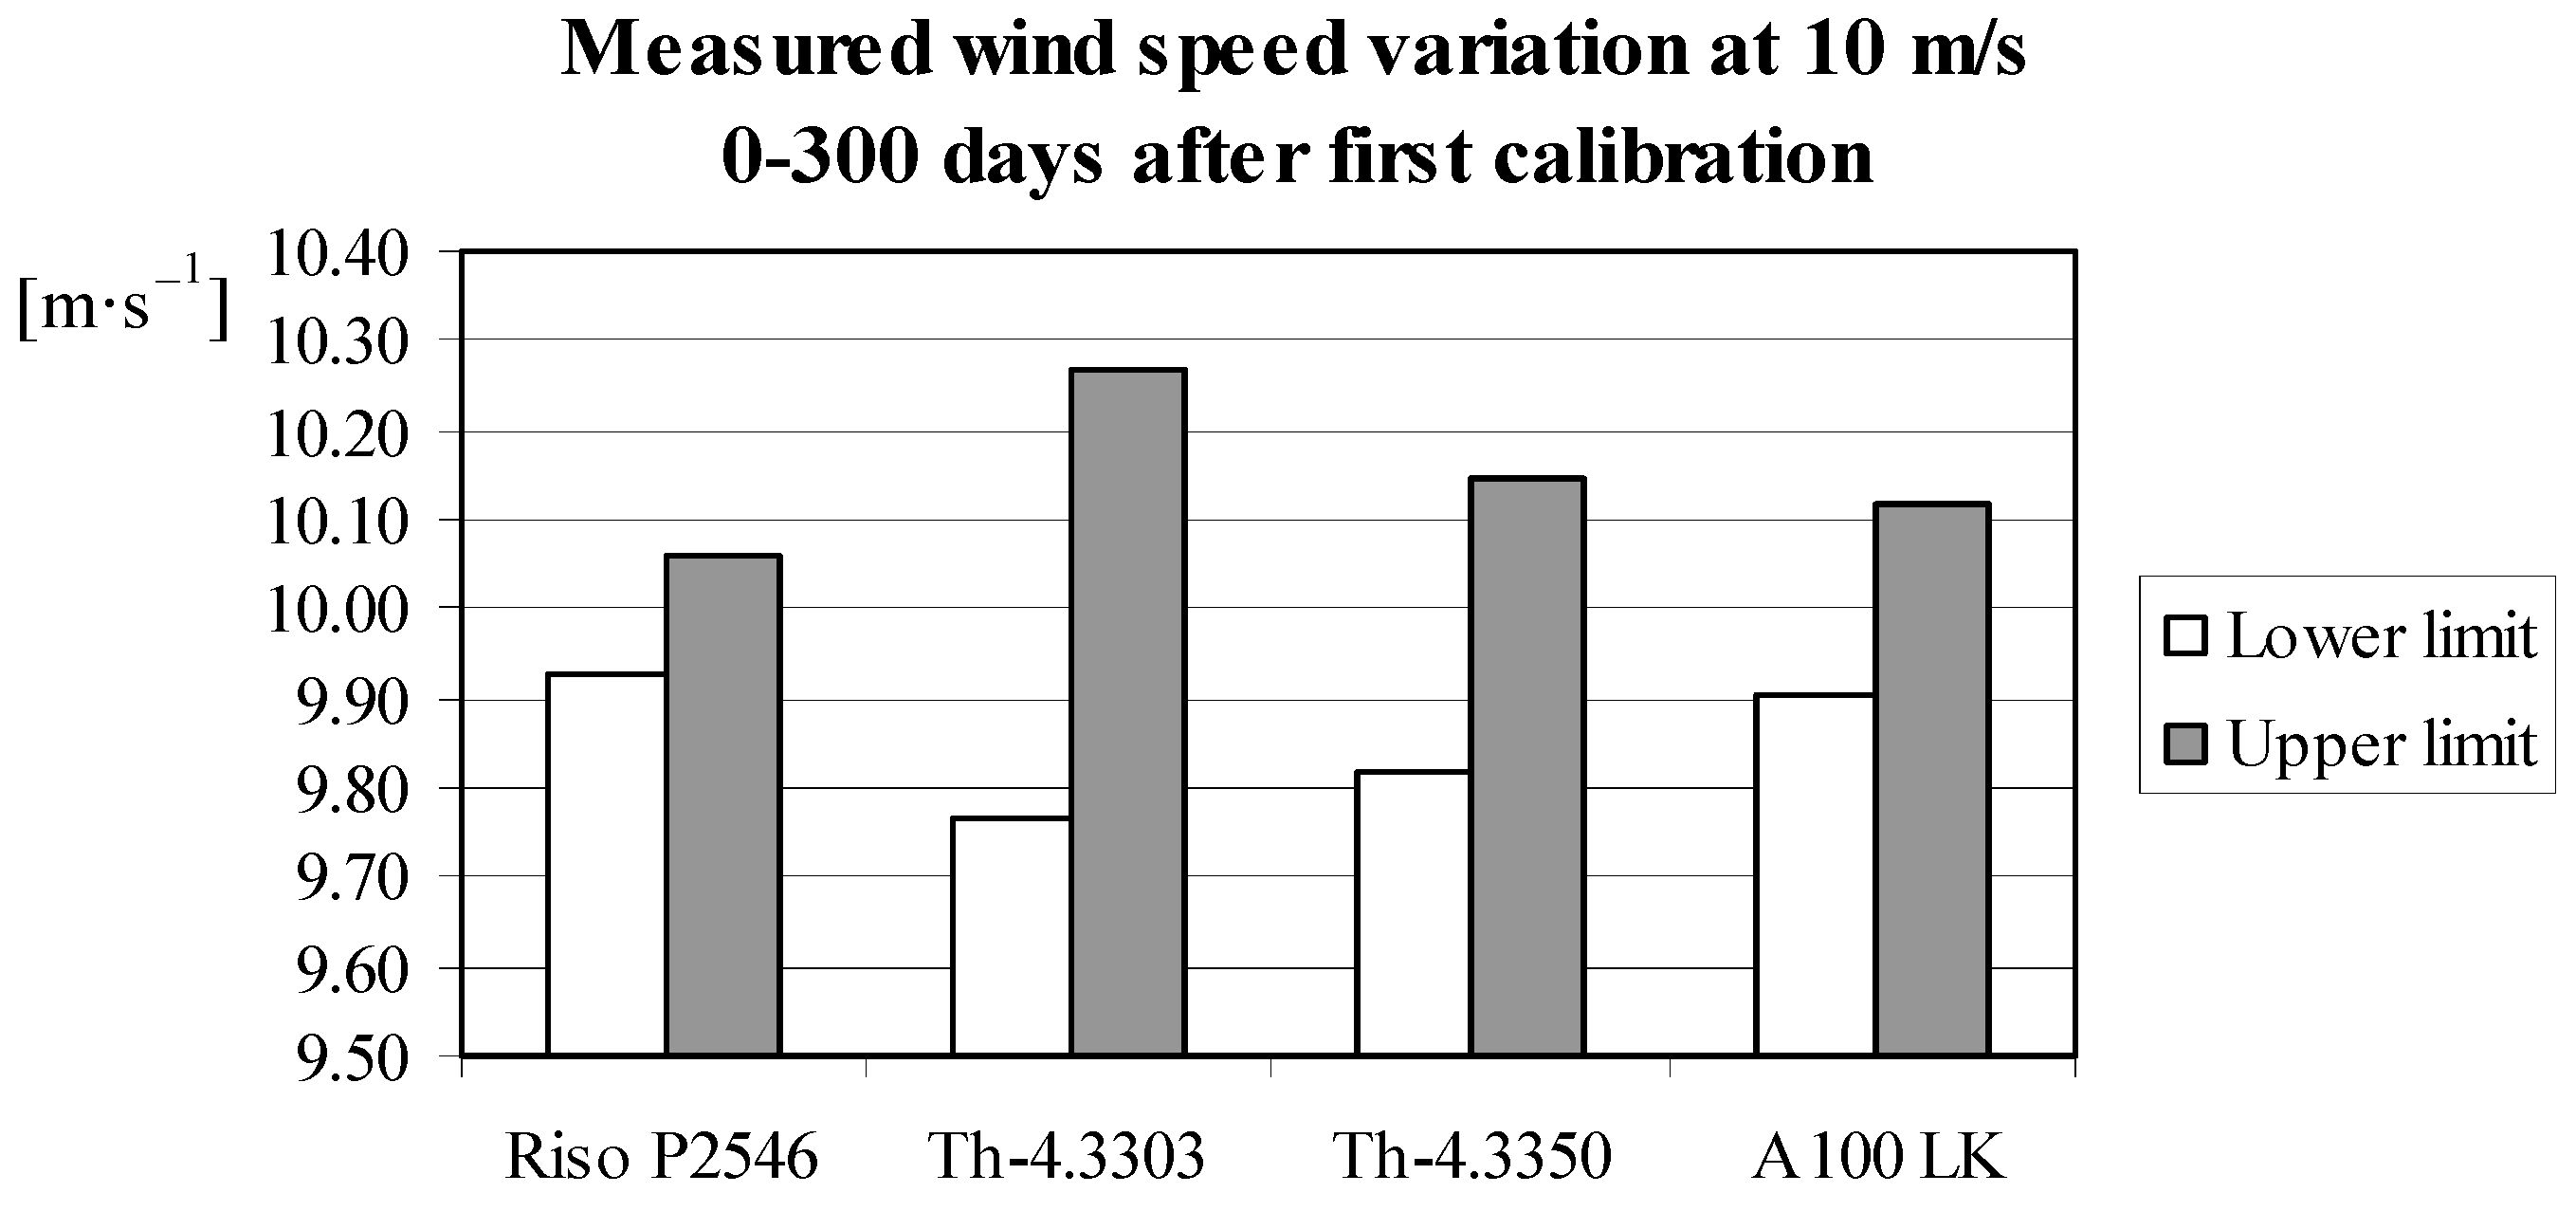
Figure 8 the 68.2% confidence limits for the variation of the measured wind speed at 10 m·s
−1 reference wind speed, and for the selected anemometers are shown. The results included in
Table 7 show that the loss of performance is greater for the Thies Clima 4.3303, Thies Clima 4.3350, and Vector Instruments A100 LK in the first period considered (0–300 days after the initial calibration) than in the second (300–600 days after the initial calibration). This suggests the existence of a transitional period after installation where the anemometer is adjusting before reach a stable working point. In the case of Thies Clima 4.3303 and Vector Instruments A100 LK, the deviation from the initial calibration in the third period studied (600–1000 days after the initial calibration) returns to the level of the first period. This indicates that the aforementioned adjusting period is over. In the case of the Thies Clima 4.3350 anemometer it seems that the adjustment period is extended to the third period studied. With regard to the Risø P2546, it also seems that there is a transitional period. However, this effect is less clear in this case as only calibration coefficient B seems to increase in the third period its deviation from the first calibration.
Figure 8.
68.2% confidence limits for the variation in the interval between 0 and 300 days after the first calibration, of the measured wind speed at 10 m·s−1 with regard to the anemometers studied.
Figure 8.
68.2% confidence limits for the variation in the interval between 0 and 300 days after the first calibration, of the measured wind speed at 10 m·s−1 with regard to the anemometers studied.
However, these tendencies that could be applied to a large number of anemometers may not describe the behavior of a single individual anemometer. In
Figure 9 the behavior of the anemometers that were calibrated more times at the IDR/UP Institute during the studied period of time is shown. No clear pattern for the loss of performance of an anemometer can be extrapolated from these graphs, that is, with the available information it is not possible to estimate, with the procedure described previously for the stored anemometers, the variations of the measured wind speed over time since the first calibration. It should also be said that together with the different conditions in which each anemometer was in service, these anemometers were subjected to different maintenance processes before their calibrations. The maintenance performed on each anemometer referred to in
Figure 9 has been included in
Table 8, according to the available information. No clear effect of the maintenance on the calibration constants variation with the time elapsed from the initial calibration can be observed. Some anemometers that were not subjected to any maintenance before their calibration showed a change in the A constant variation pattern that, as far as the authors know, could only be attributed to a change in the service conditions (see in
Figure 9 variations of A constants with regard to R-1—3rd calibration, and R-2—5th calibration; or in
Figure 10 with regard to Th50-1—3rd calibration, and Th50-4—3rd calibration).
Table 8.
Maintenance works performed on the more times calibrated anemometers at the IDR/UPM Institute in the studied period of time.
Table 8.
Maintenance works performed on the more times calibrated anemometers at the IDR/UPM Institute in the studied period of time.
| Risø P2546 |
| Anemometer | Maintenance before calibration |
| 2nd | 3rd | 4th | 5th | 6th |
| R-1 | No | No | No | Yes 0 | No |
| R-2 | No | No | No | No | - |
| R-3 | Yes 0 | No | No | No | - |
| R-4 | No | No | No | No | - |
| R-5 | Yes 0 | No | No | No | - |
| Thies Clima 4.3303 |
| Anemometer | Maintenance before calibration |
| 2nd | 3rd | 4th | 5th | 6th |
| Th03-1 | Yes 1 | Yes 1 | (*) | Yes 1 | - |
| Th03-2 | Yes 1 | (*) | Yes 1 | - | - |
| Th03-3 | Yes 1, 2 | Yes 1 | Yes 1,2 | - | - |
| Th03-4 | Yes 1 | No | Yes 1 | - | - |
| Thies Clima 4.3350 |
| Anemometer | Maintenance before calibration |
| 2nd | 3rd | 4th | 5th | 6th |
| Th50-1 | No | No | No | - | - |
| Th50-2 | No | Yes 1 | (*) | - | - |
| Th50-3 | (*) | (*) | (*) | - | - |
| Th50-4 | No | No | No | - | - |
| Anemometer | Maintenance before calibration |
| 2nd | 3rd | 4th | 5th | 6th |
| LK-1 | No | Yes 1 | Yes 1 | - | - |
| LK-2 | No | Yes 1 | No | - | - |
| LK-3 | No | Yes 1 | No | - | - |
| LK-4 | No | Yes 0 | No | - | - |
| LK-5 | No | No | No | - | - |
| LK-6 | No | No | No | - | - |
| LK-7 | No | Yes 1 | Yes | - | - |
Figure 9.
Percentage variation of calibration constants A and B from the initial values with regard to (from top to bottom): five specific Risø P2546 anemometers (R-1 to R-5) calibrated more than four times; four specific Thies Clima 4.3303 anemometers (Th03-1 to Th03-4) calibrated more than three times; four specific Thies Clima 4.3350 anemometers (Th50-1 to Th50-4) calibrated more than three times; and seven specific Vector Instruments A100 LK anemometers (LK-1 to LK-7) calibrated more than three times. All anemometers calibrated at the IDR/UPM Institute.
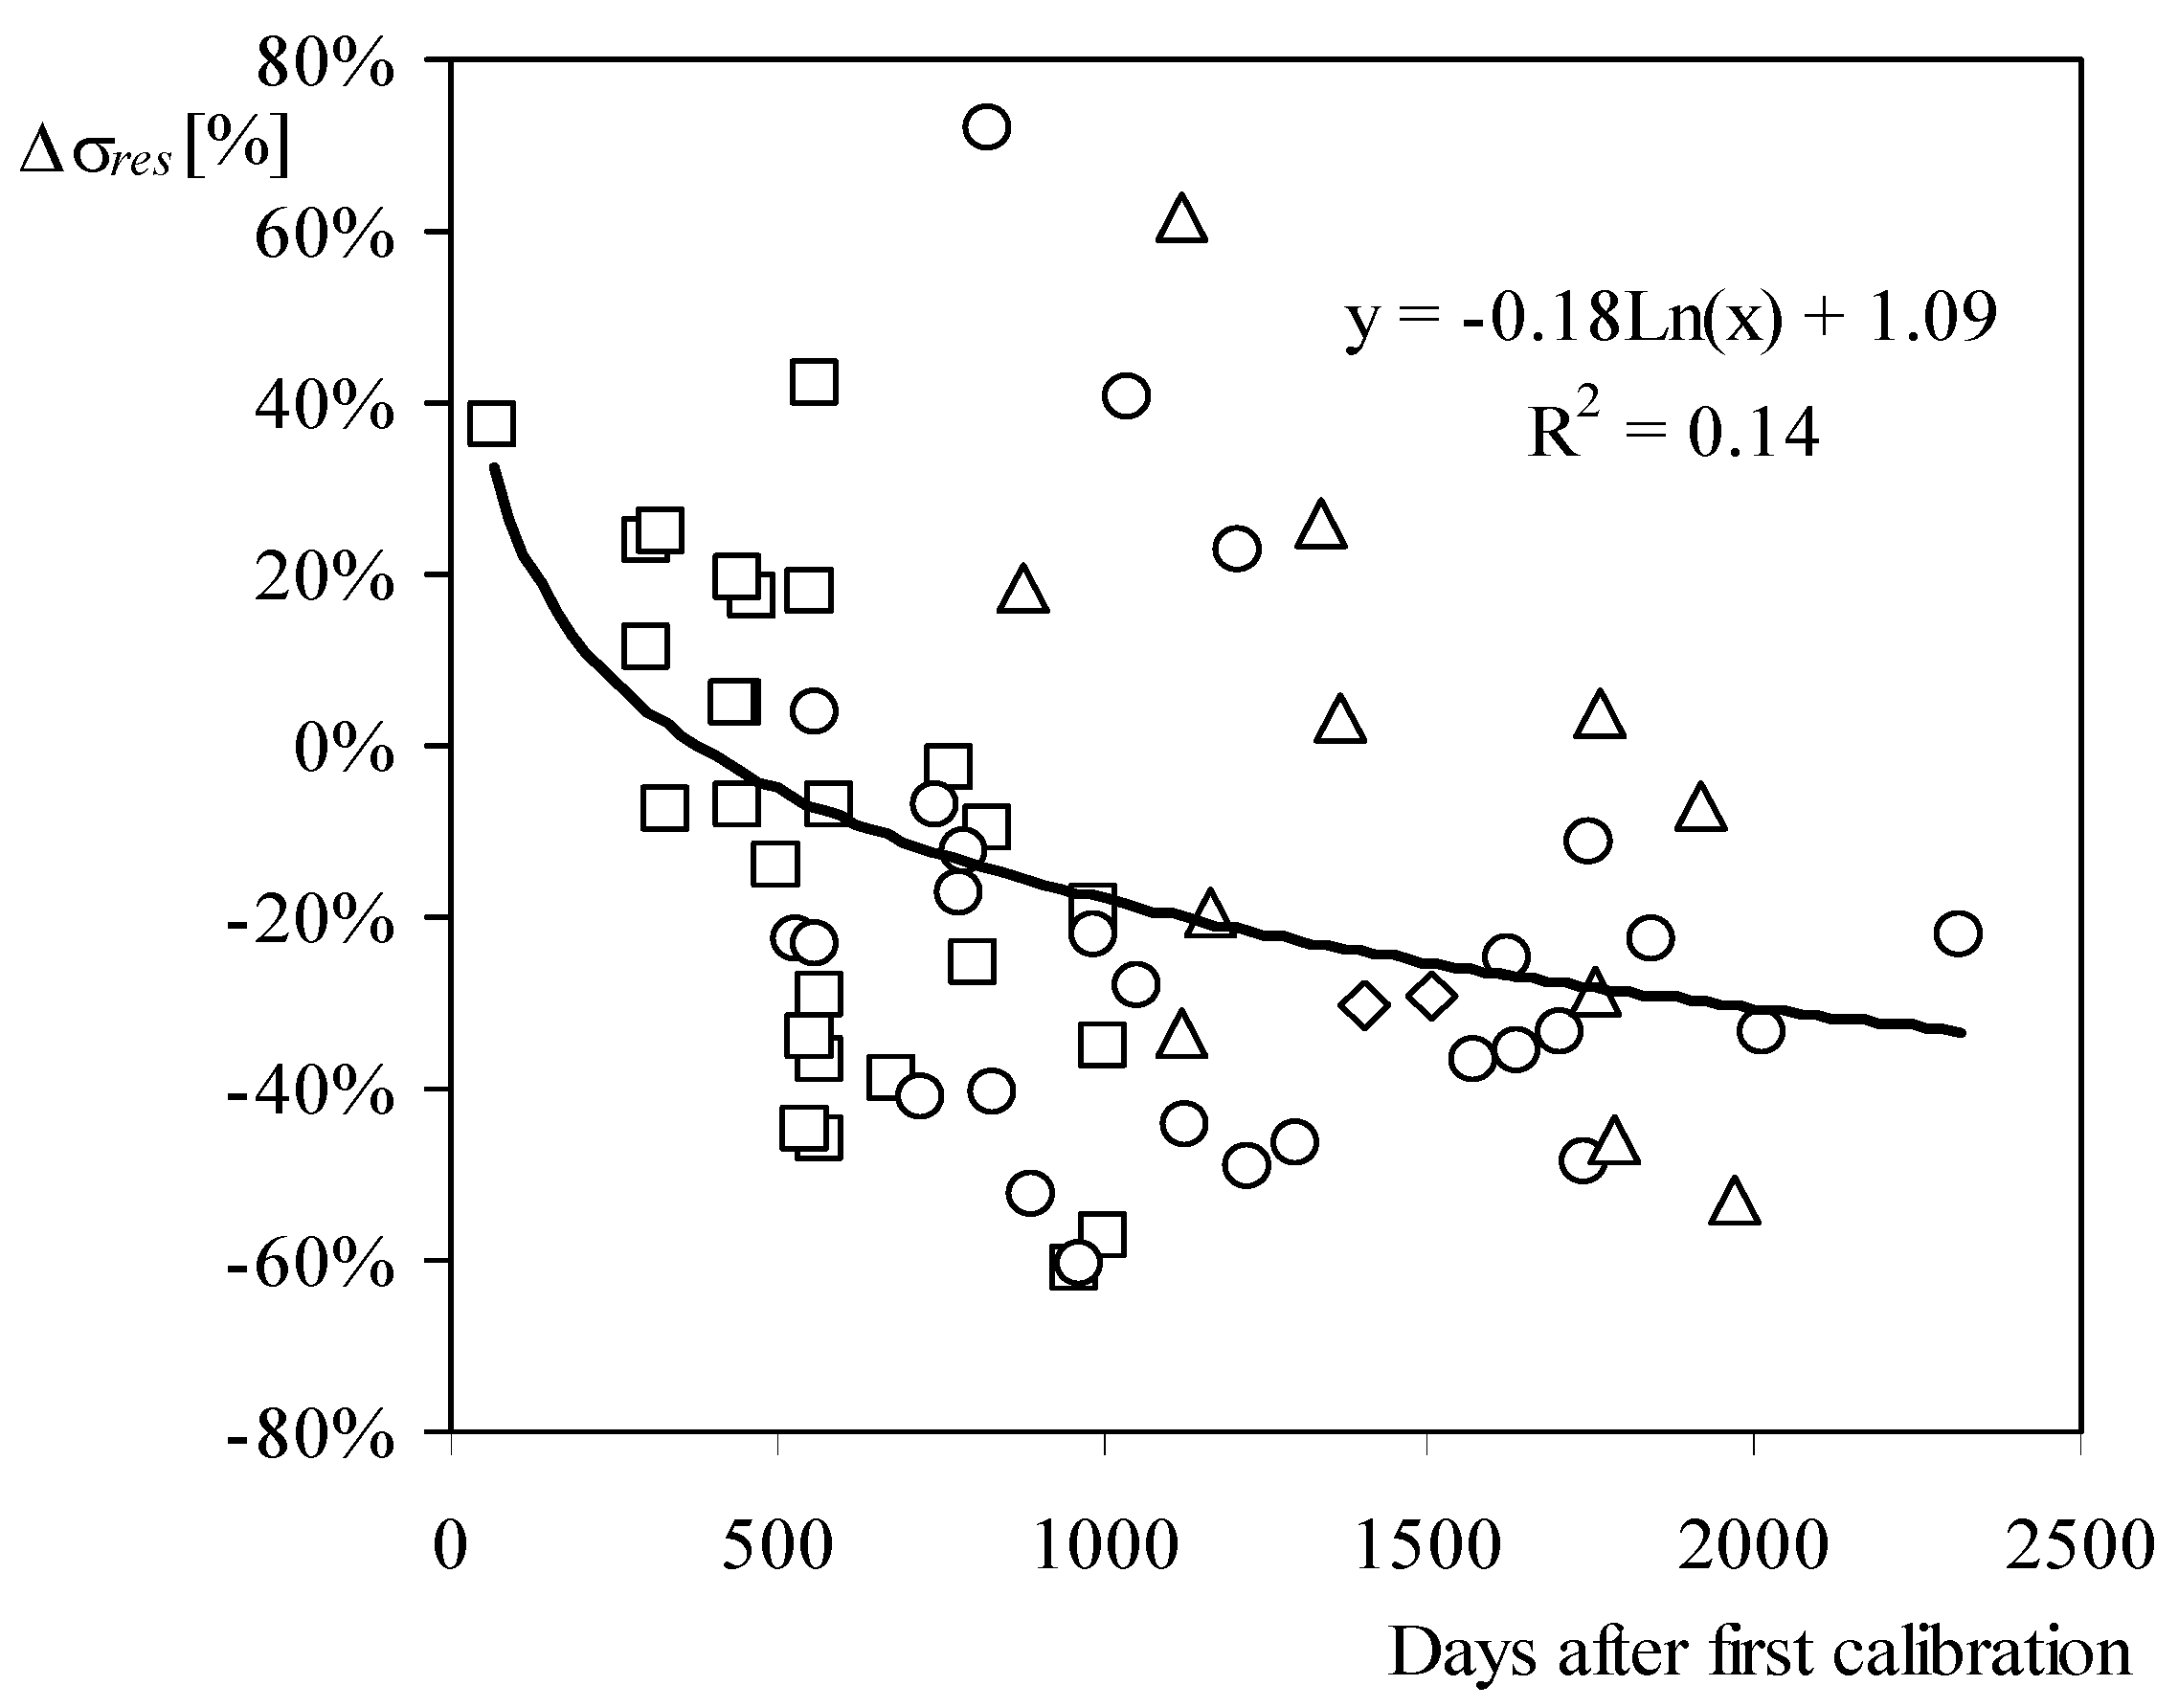
Going one step further, the residuals concerning the calibrations performed on the single individual anemometers whose maintenance was traced were analyzed. The residuals of a calibration are calculated as the difference between the reference wind speed and the transfer function at all the calibration points. No conclusion that could lead to foreseeing the maintenance requirements for an anemometer can be derived from this particular analysis. In
Figure 10, the percentage deviation of the residuals’ standard deviation,
σres, from the initial calibration has been plotted for the traced Risø P2546 anemometers as a function of the time elapsed since the initial calibration. In order to have consistent data, only calibrations performed on anemometers never subjected to any maintenance are included in this graph. Although in the figure it seems that the residuals tend to stabilize some time after the initial calibration, no clear conclusion with regard to the loss of performance can be extrapolated from the data.
Figure 10.
Variation of the standard deviation of the residuals, σres, as a function of the time elapsed from the initial calibration, with regard to calibrations performed to 27 Risø P2546 anemometers that were not subjected to maintenance. These anemometers were calibrated several times at the IDR/UPM Institute (16 anemometers calibrated 3-times, nine anemometers calibrated 4-times, and two anemometers calibrated 5-times). The symbols indicate second calibration (squares), third calibration (circles), fourth calibration (triangles), and fifth calibration (rhombi). A natural logarithm line has been fitted to the data.


