Probabilistic Method to Assess the Impact of Charging of Electric Vehicles on Distribution Grids


 ,
,  and
and
Abstract
:1. Introduction
2. State of the Art
3. General Model Used for the Study
3.1. Time Horizon
3.2. Statistical Variables
- Regular electric demand
- Demand due to EV recharge
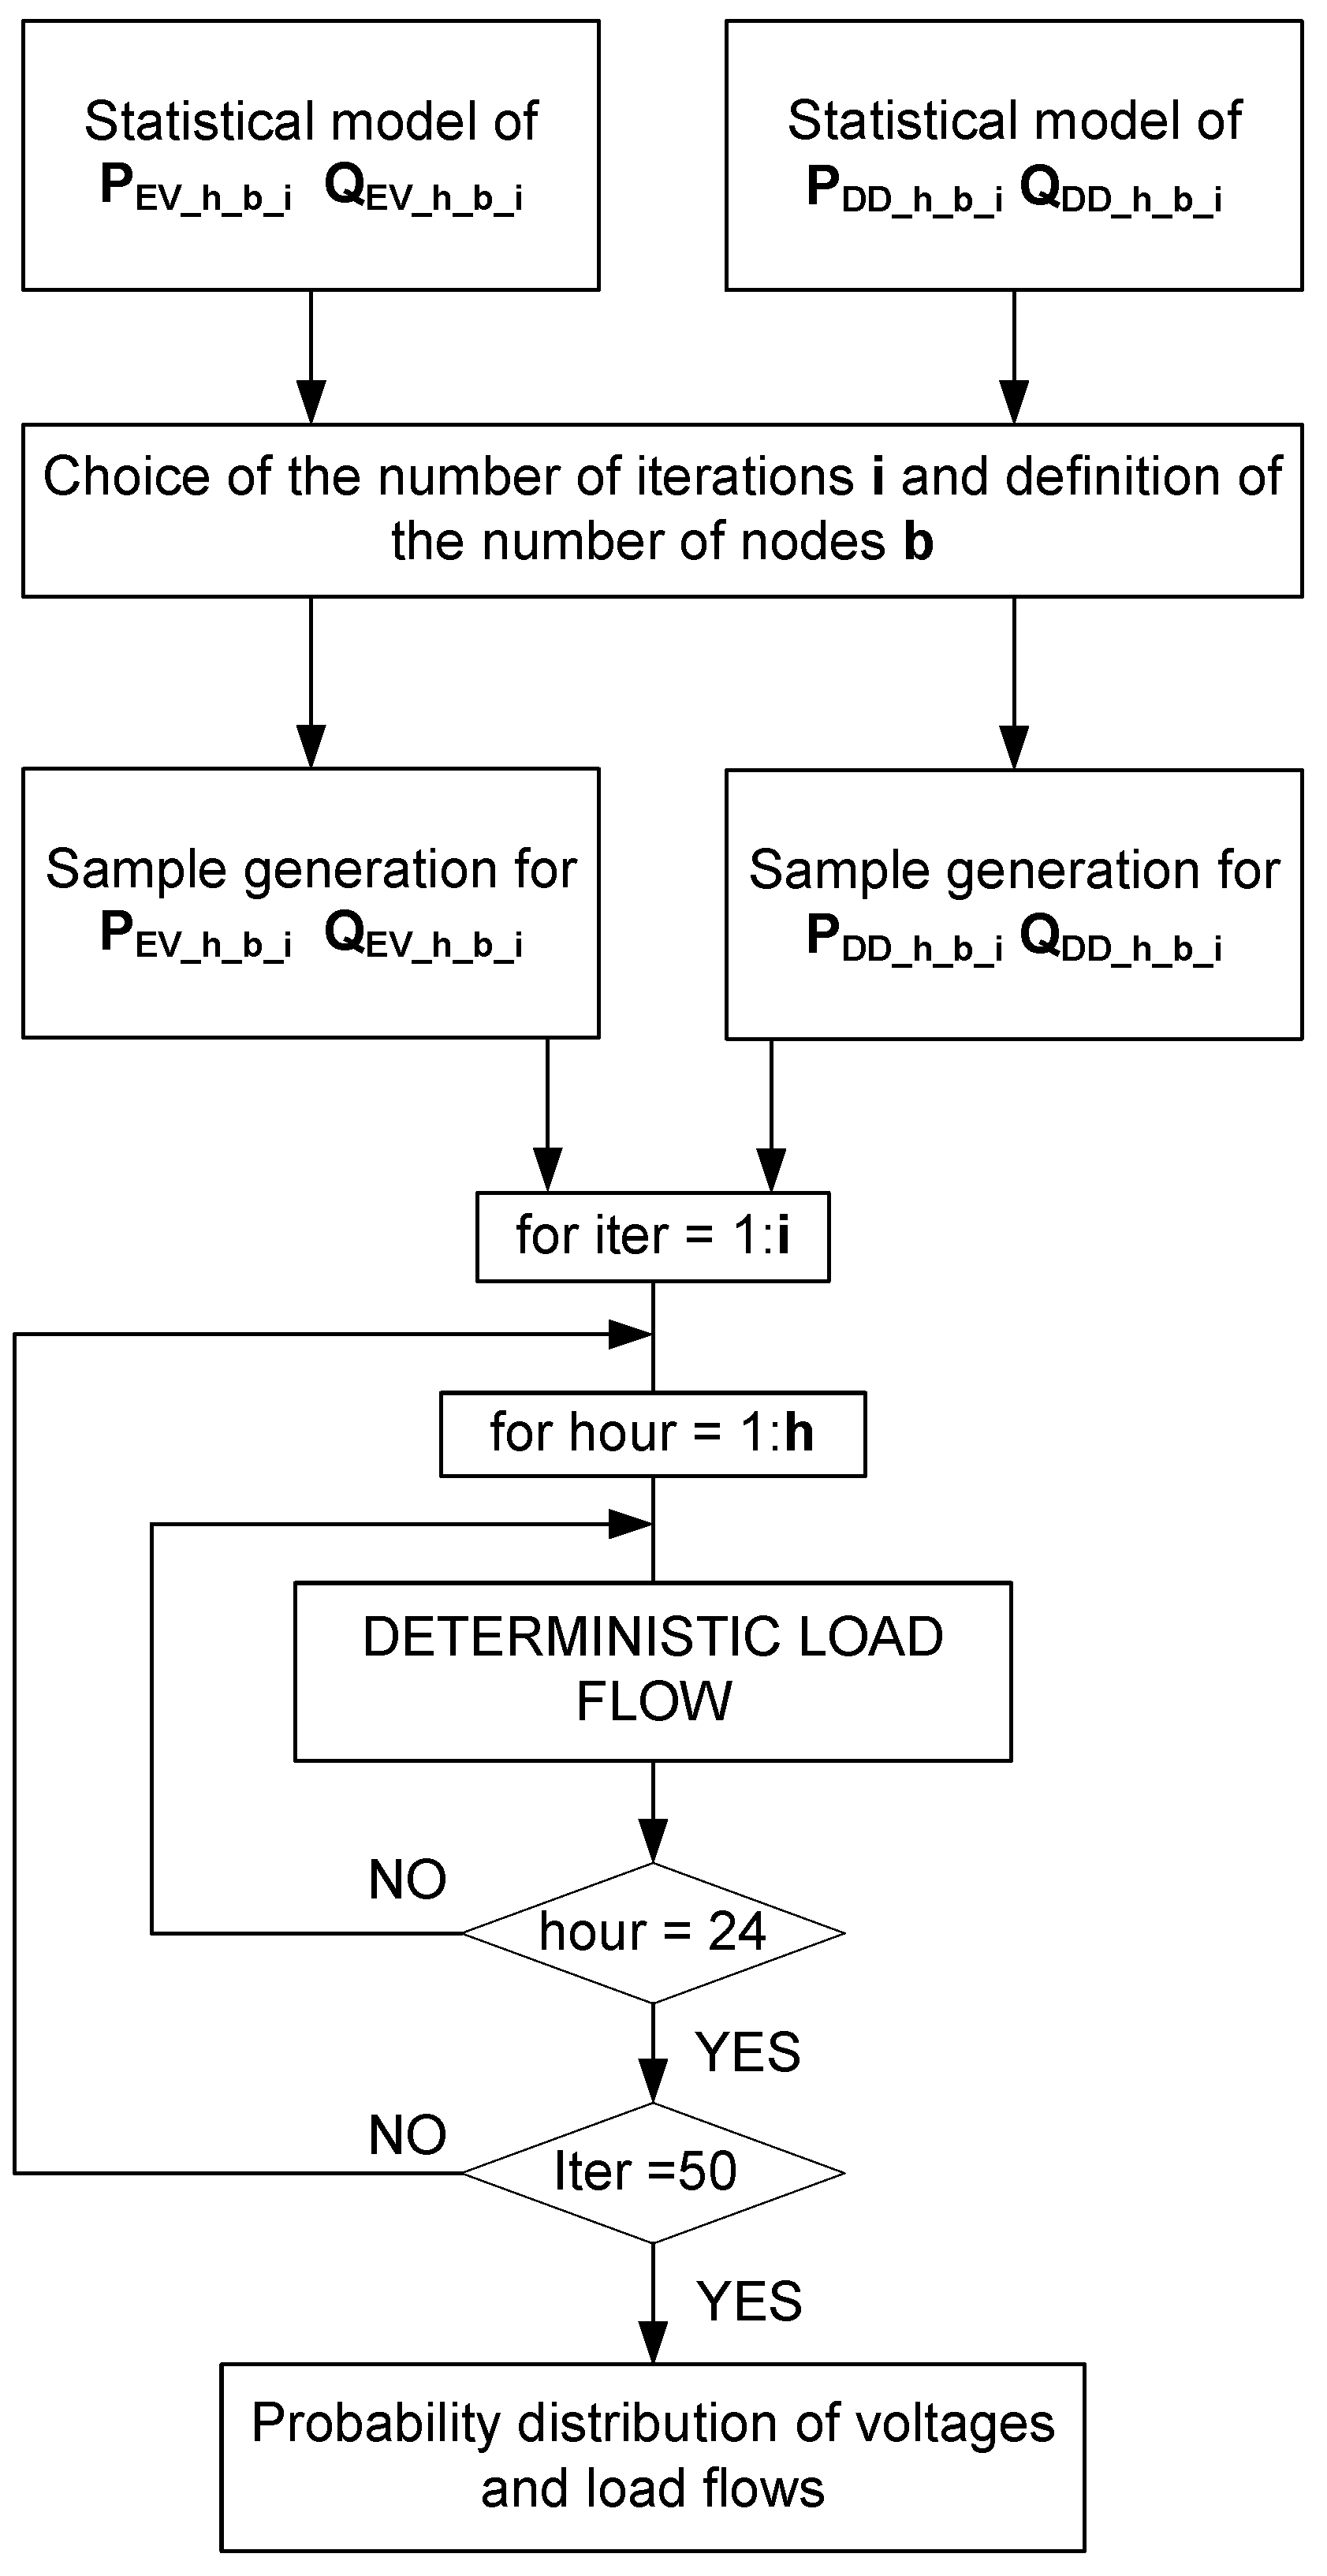
3.3. Description of the Algorithm for the Probabilistic Load Flow Implementing the Statistical Model for the Household and EV Consumption
- Sample generation of the statistical variables
- Execution of probabilistic load flows

4. Generating the Probabilistic Model for the Grid’s Electrical Demand
- The creation of a statistical model able to generate random values according to previously defined conditions.
- The generation of samples for the performed load flows and for each iteration.
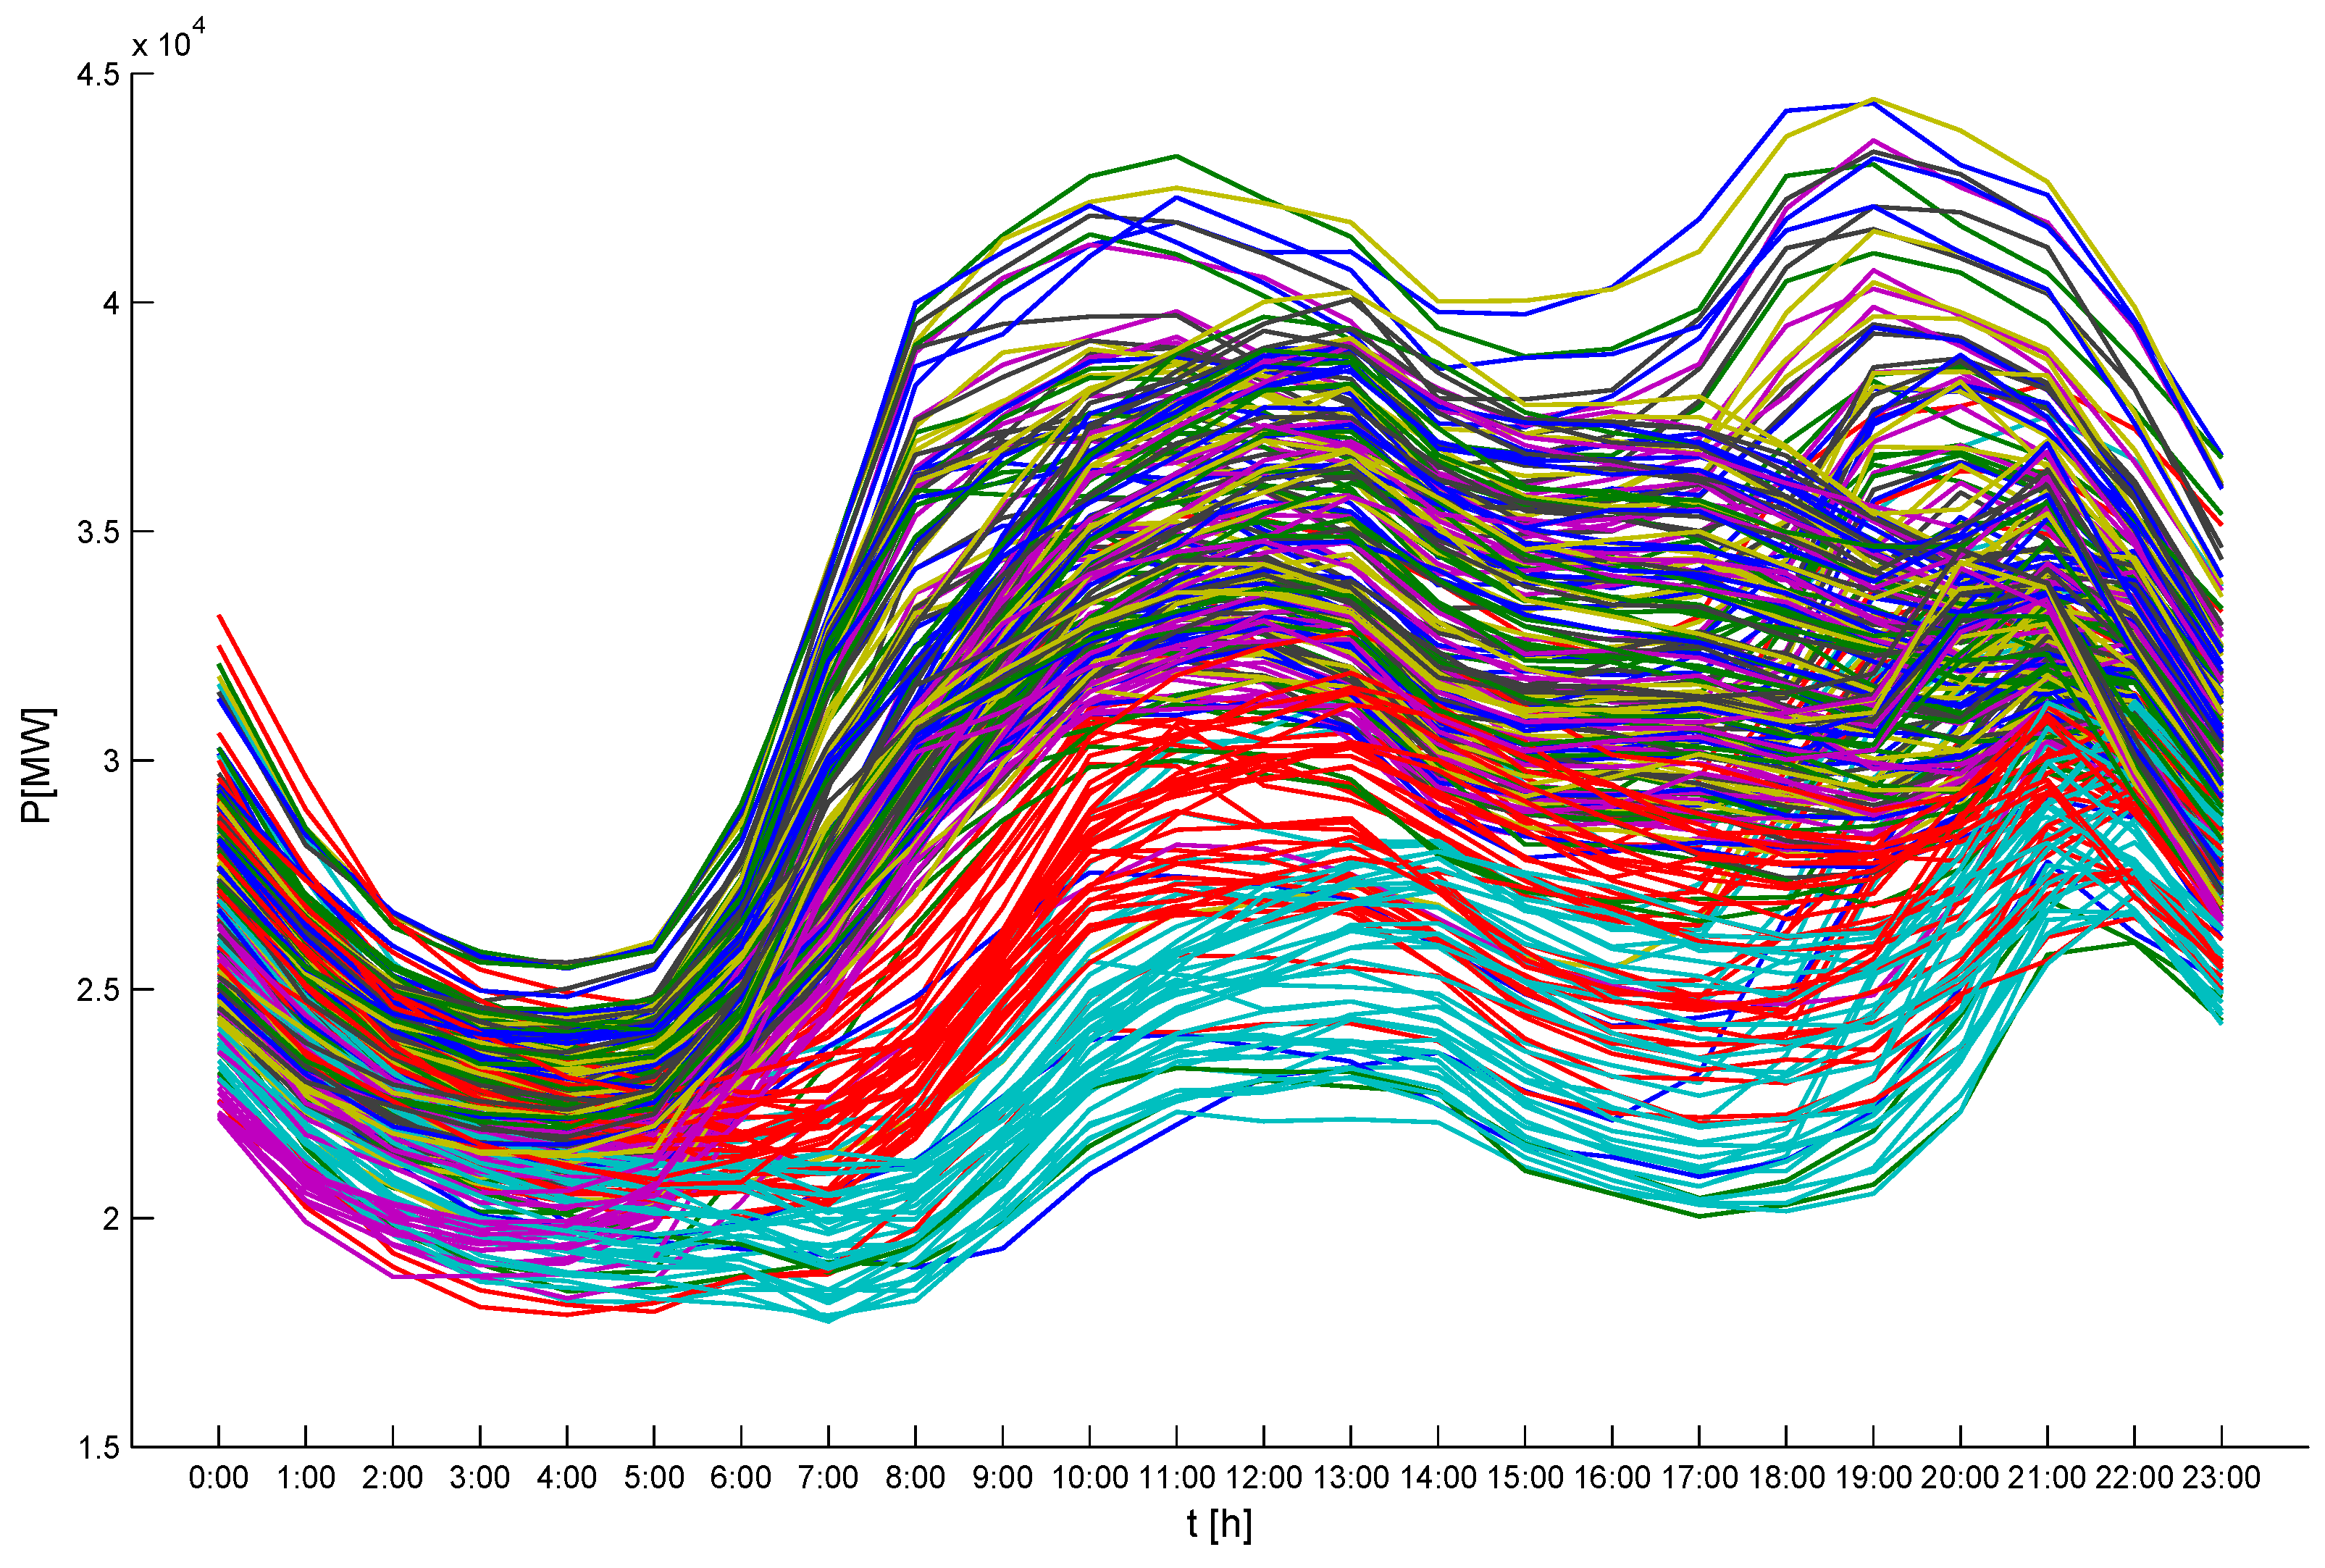
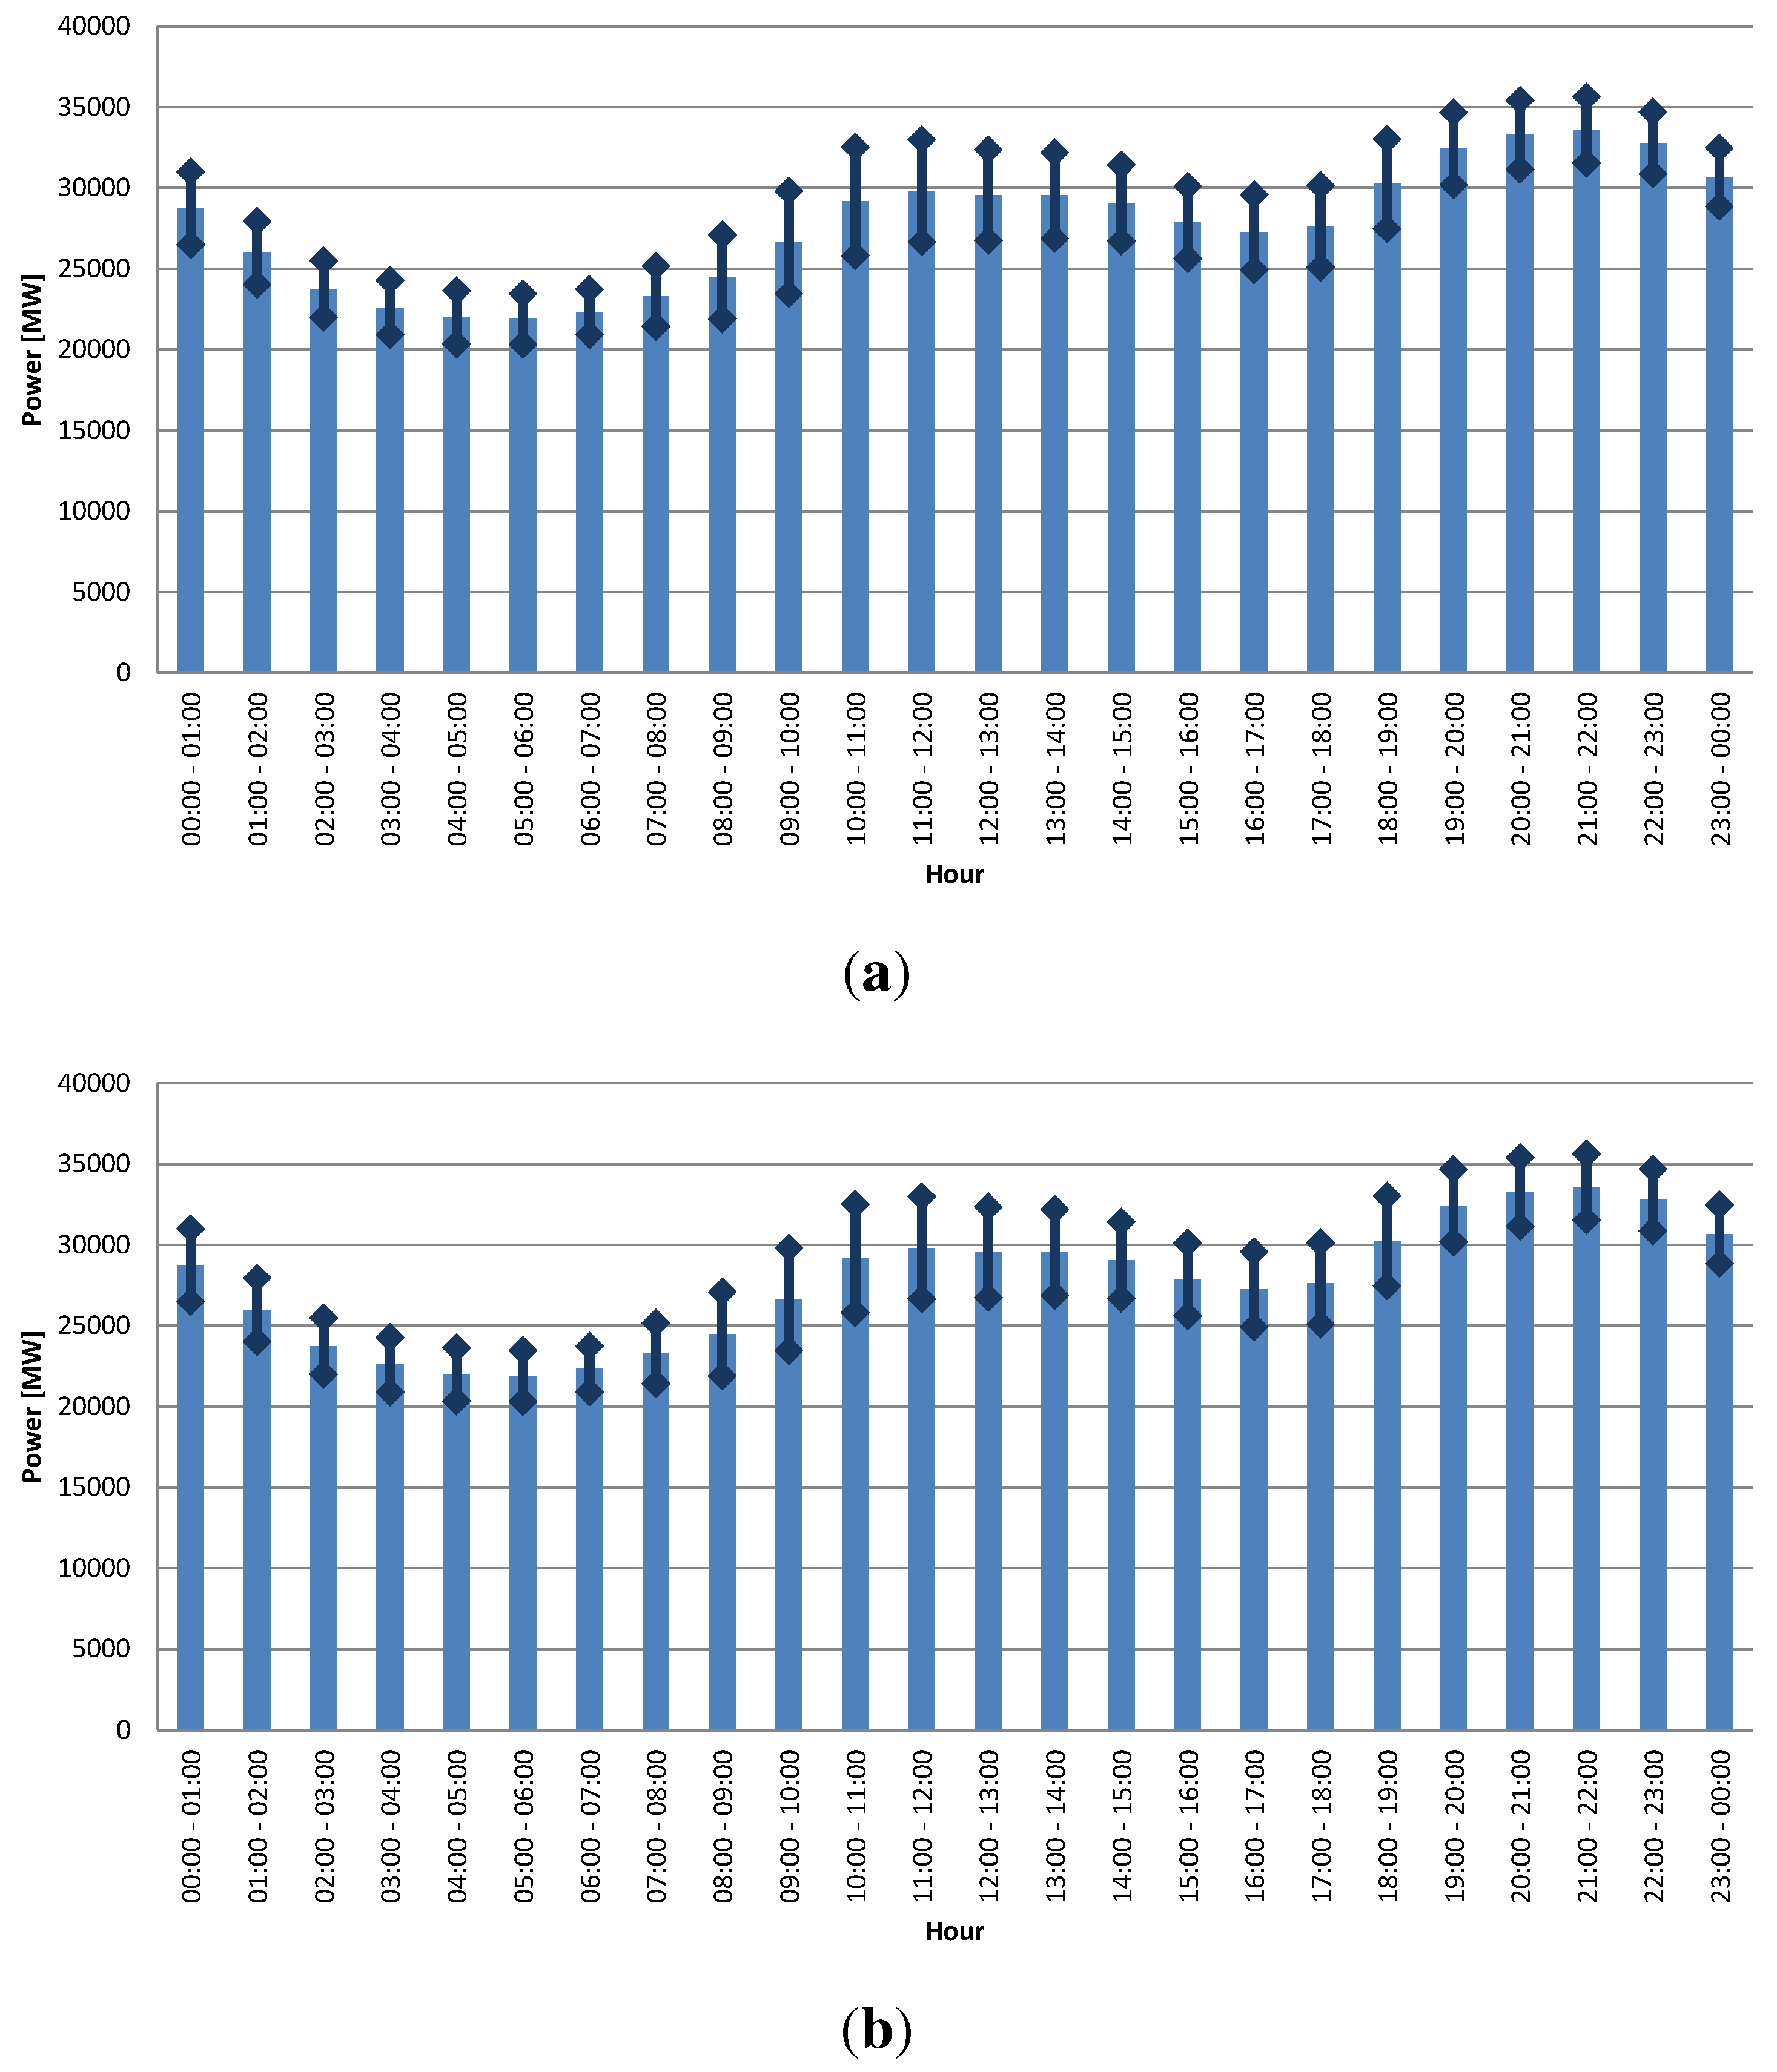
4.1. Data Processing
- Winter (January, February)
- Spring (April, May)
- Summer (July, August)
4.2. Adapting National Demand to a Standard Distribution Grid
5. Generation of the Probabilistic Model for EV Demand
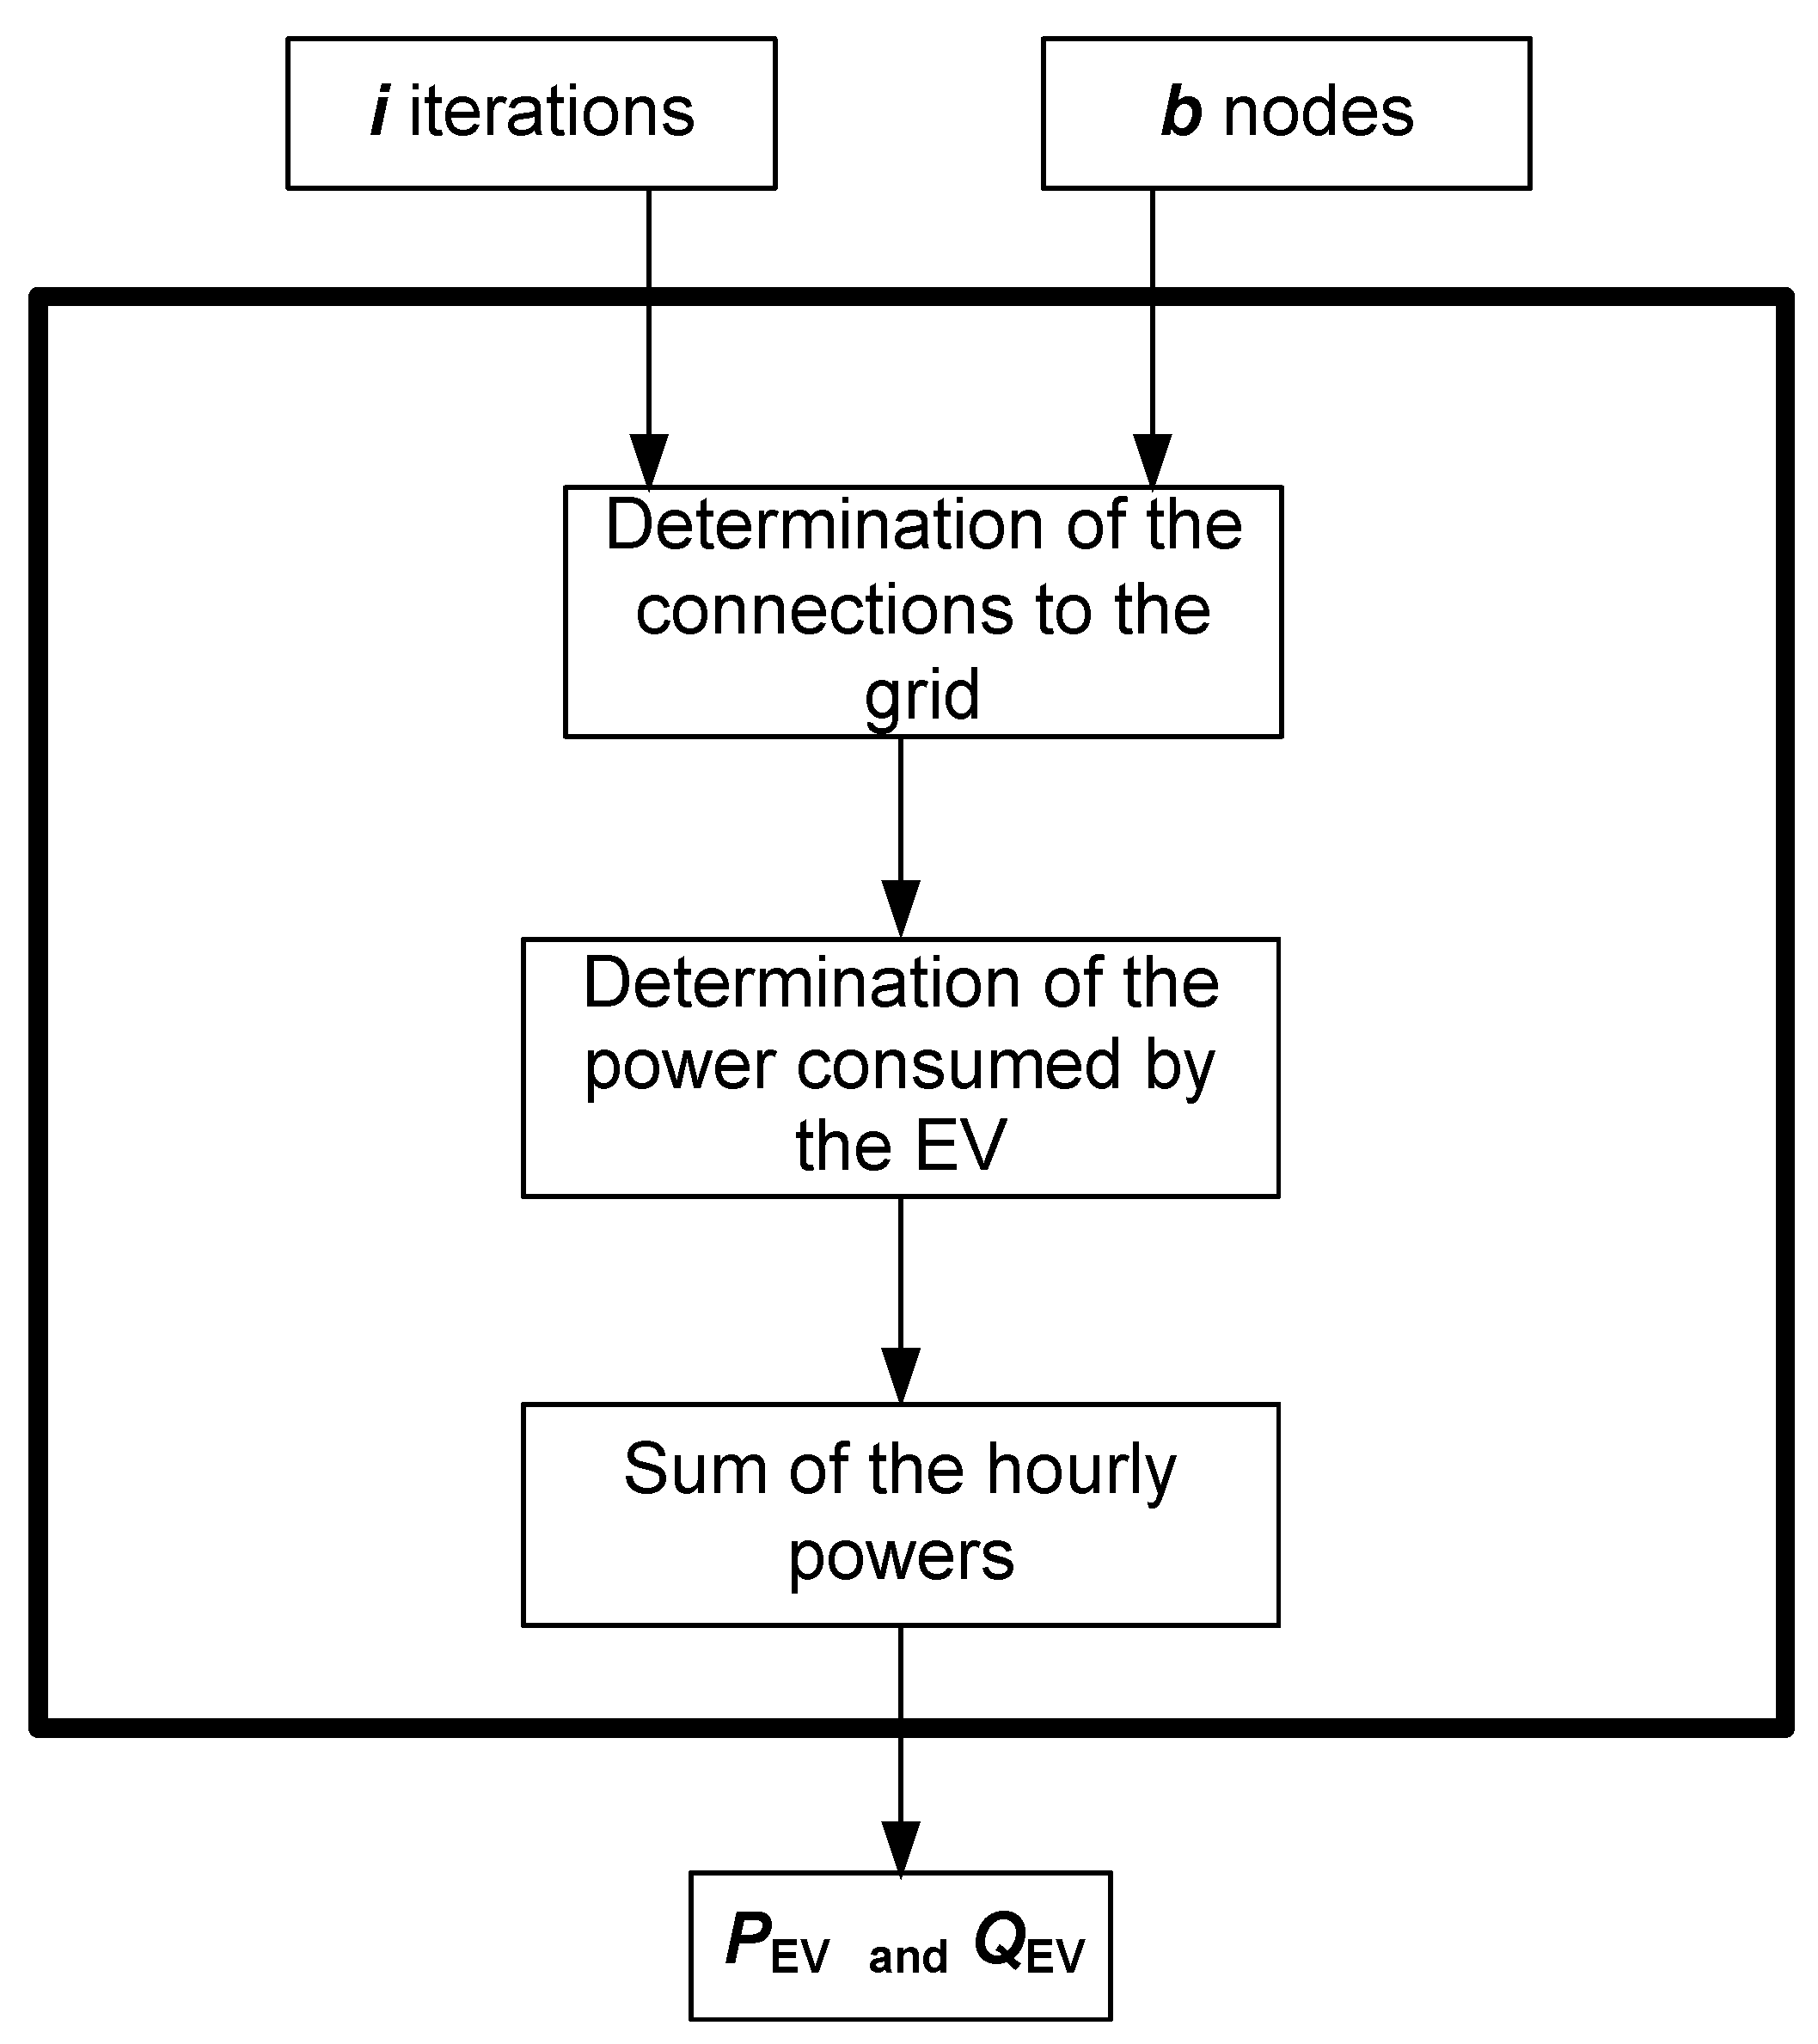
- Distribution of the EV along the grid nodes
- Connection time of the EV
- Load curve of the battery of the EV
- Energy consumed by the EV before its connection
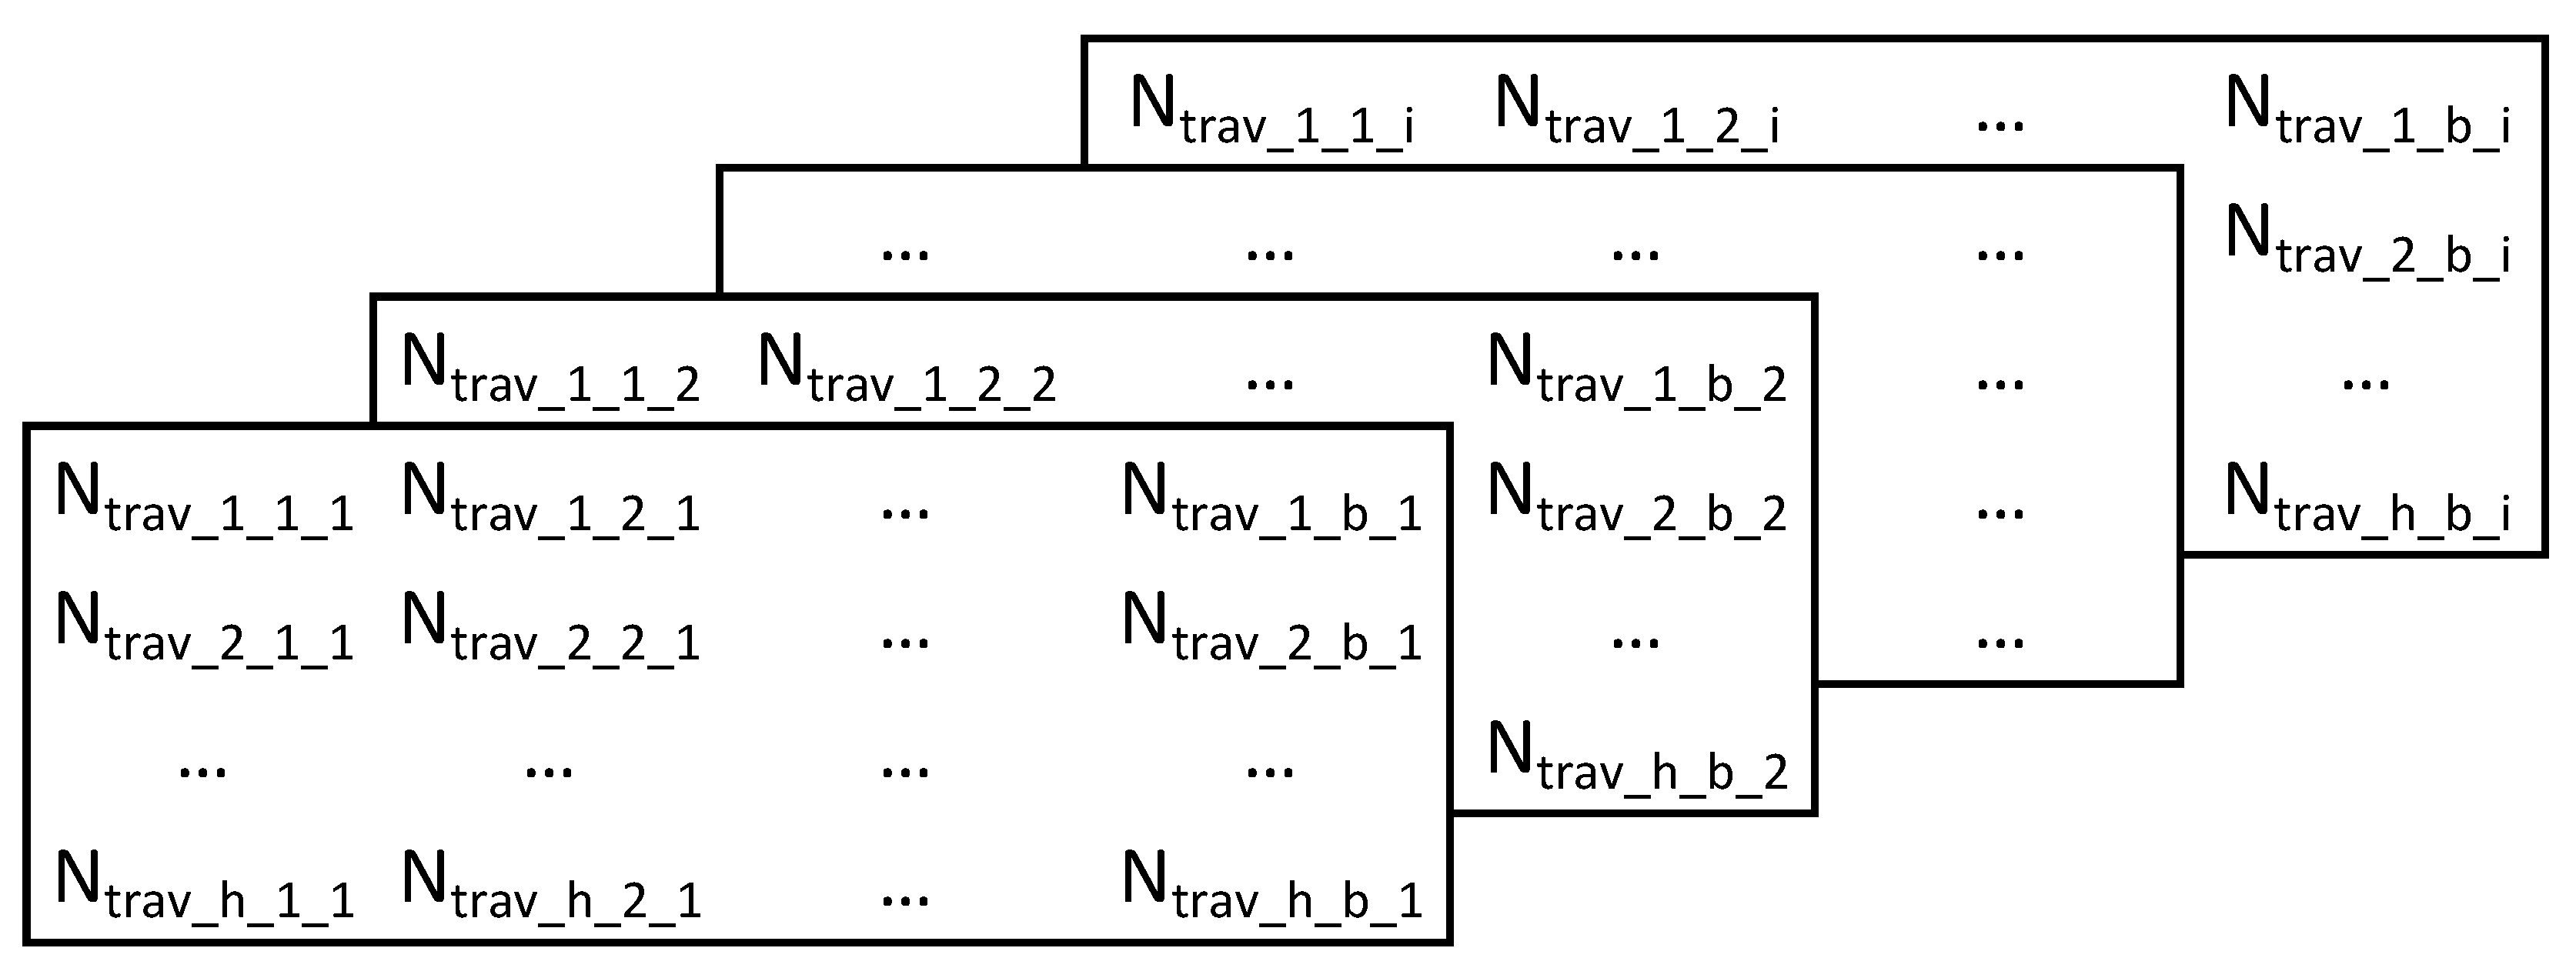
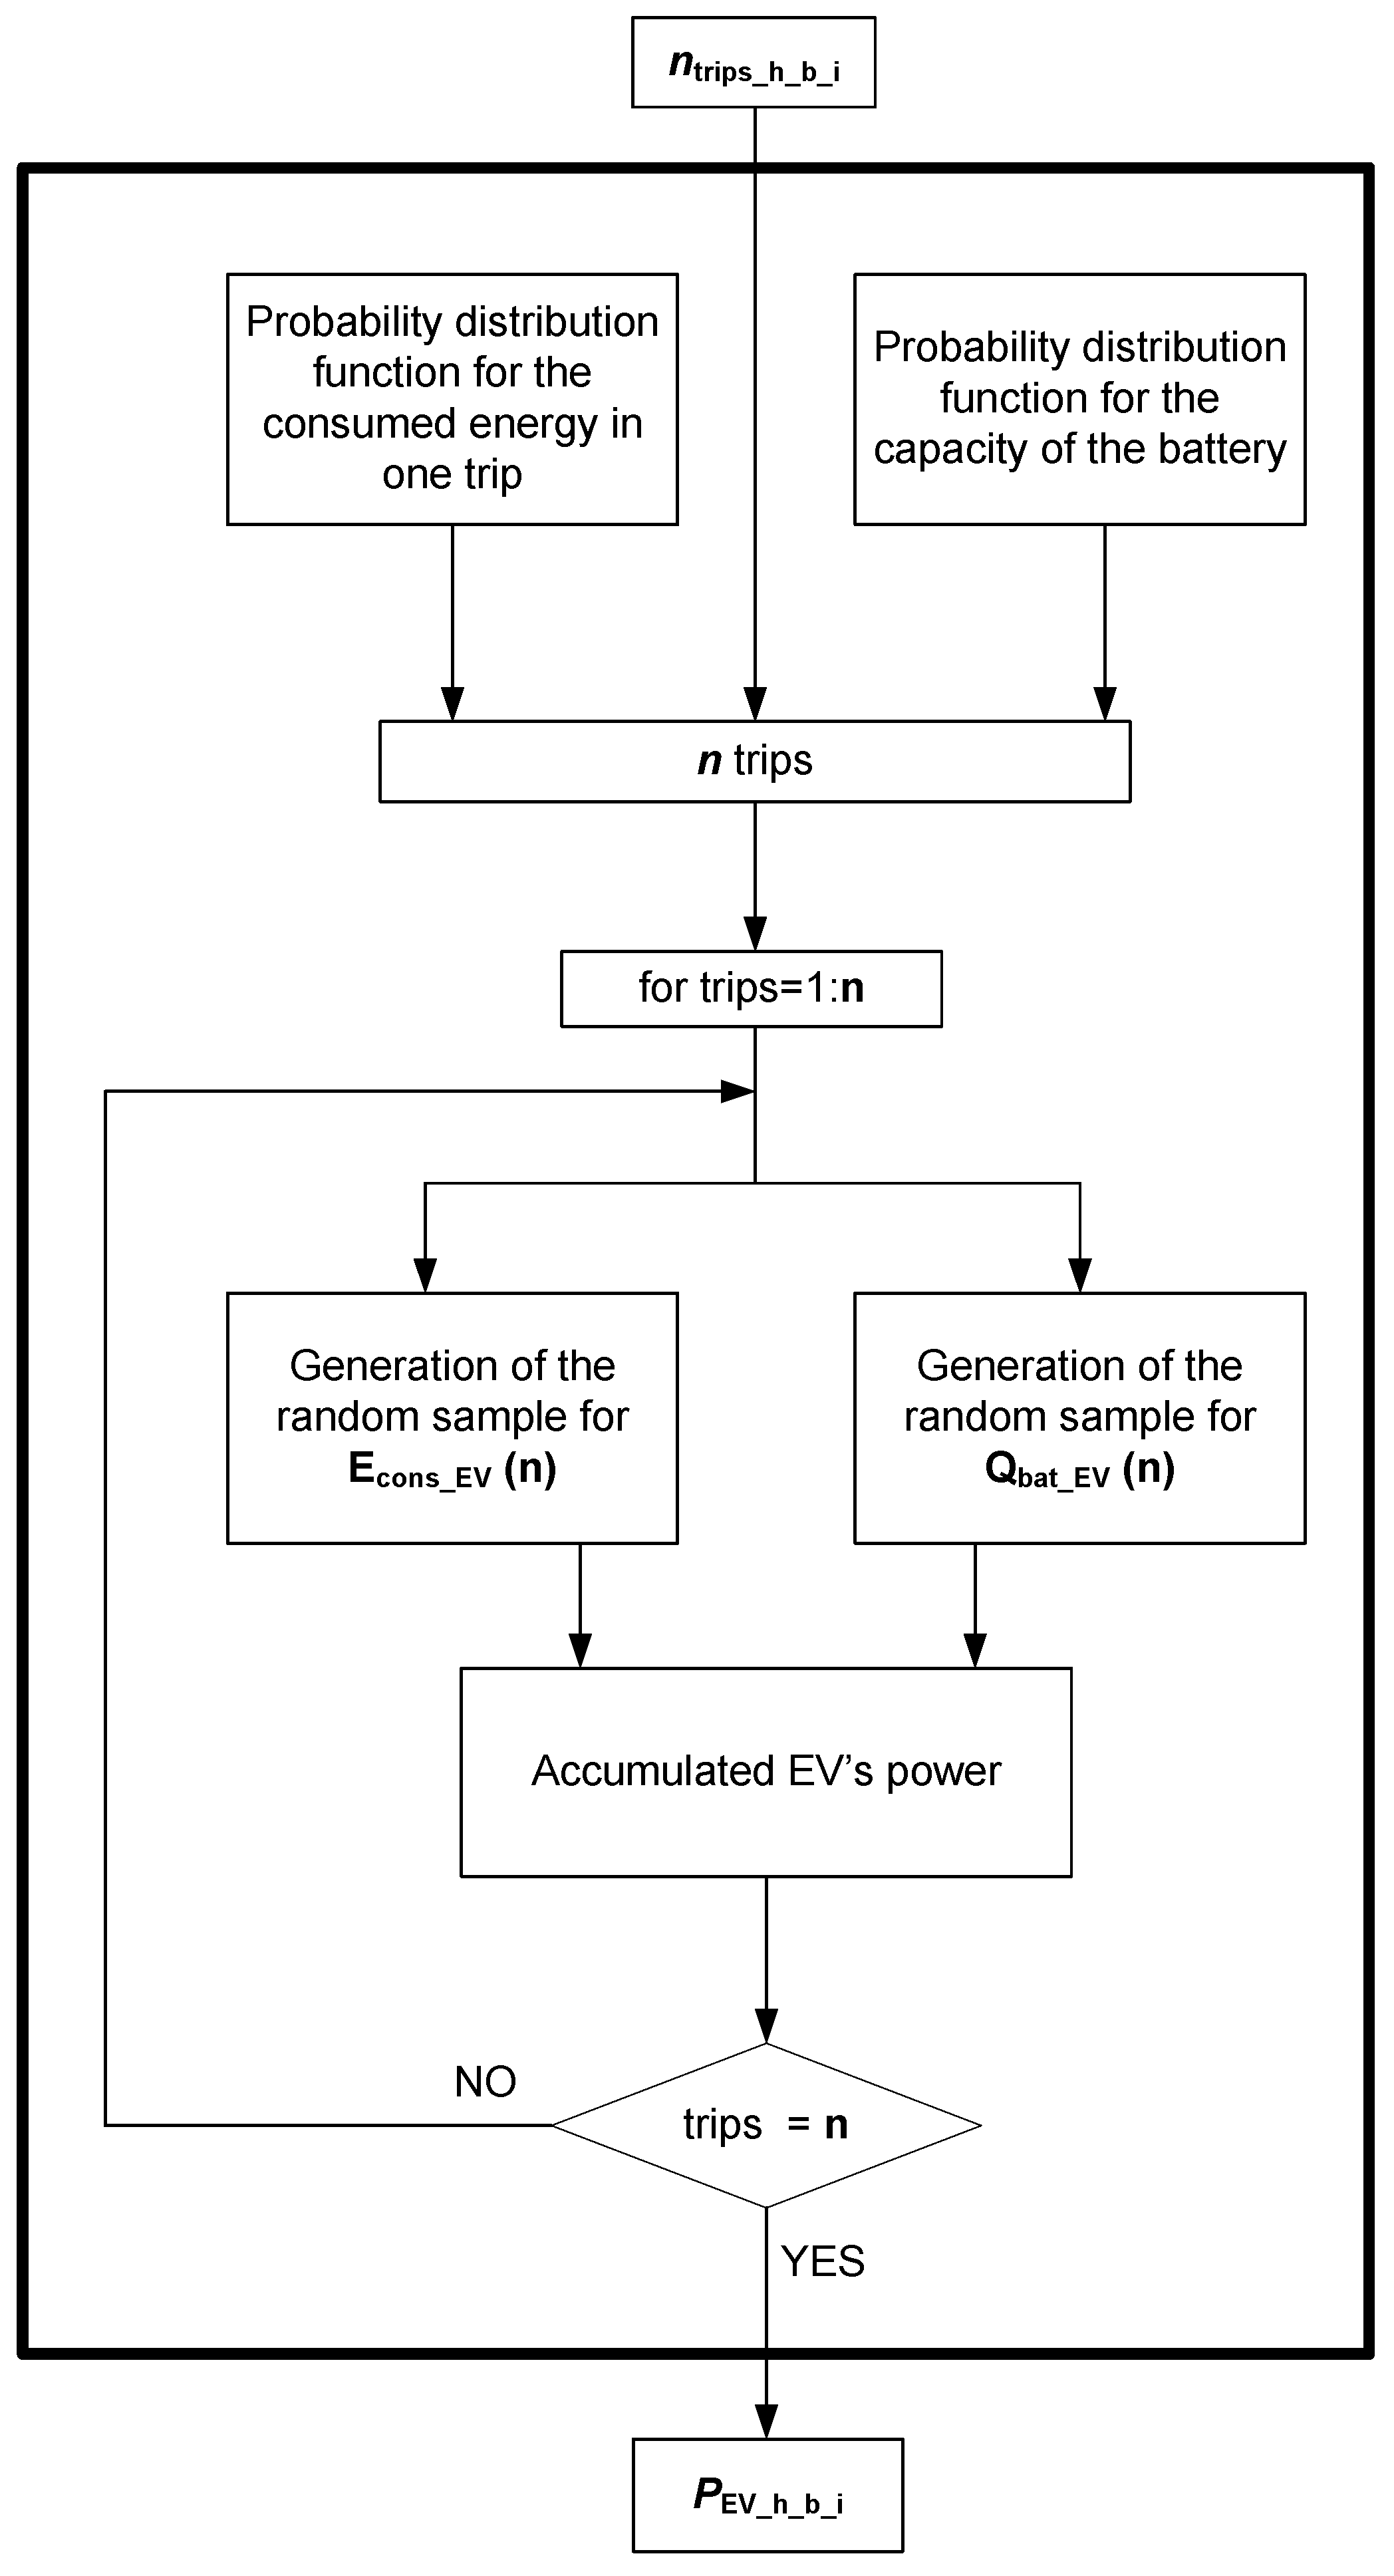
- Generation of the EVs’ number of connections for each hour, node and iteration
- Transformation of the number of connections to its corresponding consumed power aggregated per node

5.1. Distribution of the EVs along the Grid
- Number of EVs in the scenario to study
- Distribution of the connection along the nodes of the grid
- Connection time of the EV
5.1.1. Number of EV in the Studied Scenario
- Number of houses ()
- Number of vehicles per house()
- Mean number of trips made for each vehicle in one day ()
- Ratio of how many of these trips are made through the private vehicle ()
5.1.2. Distribution of the EVs along the Nodes of the Grid
- Each node has the same probability.
- The number of trips in the studied area remains constant. It is assumed that the number of trips going outside the studied area is the same as the number of trips going inside the studied area.
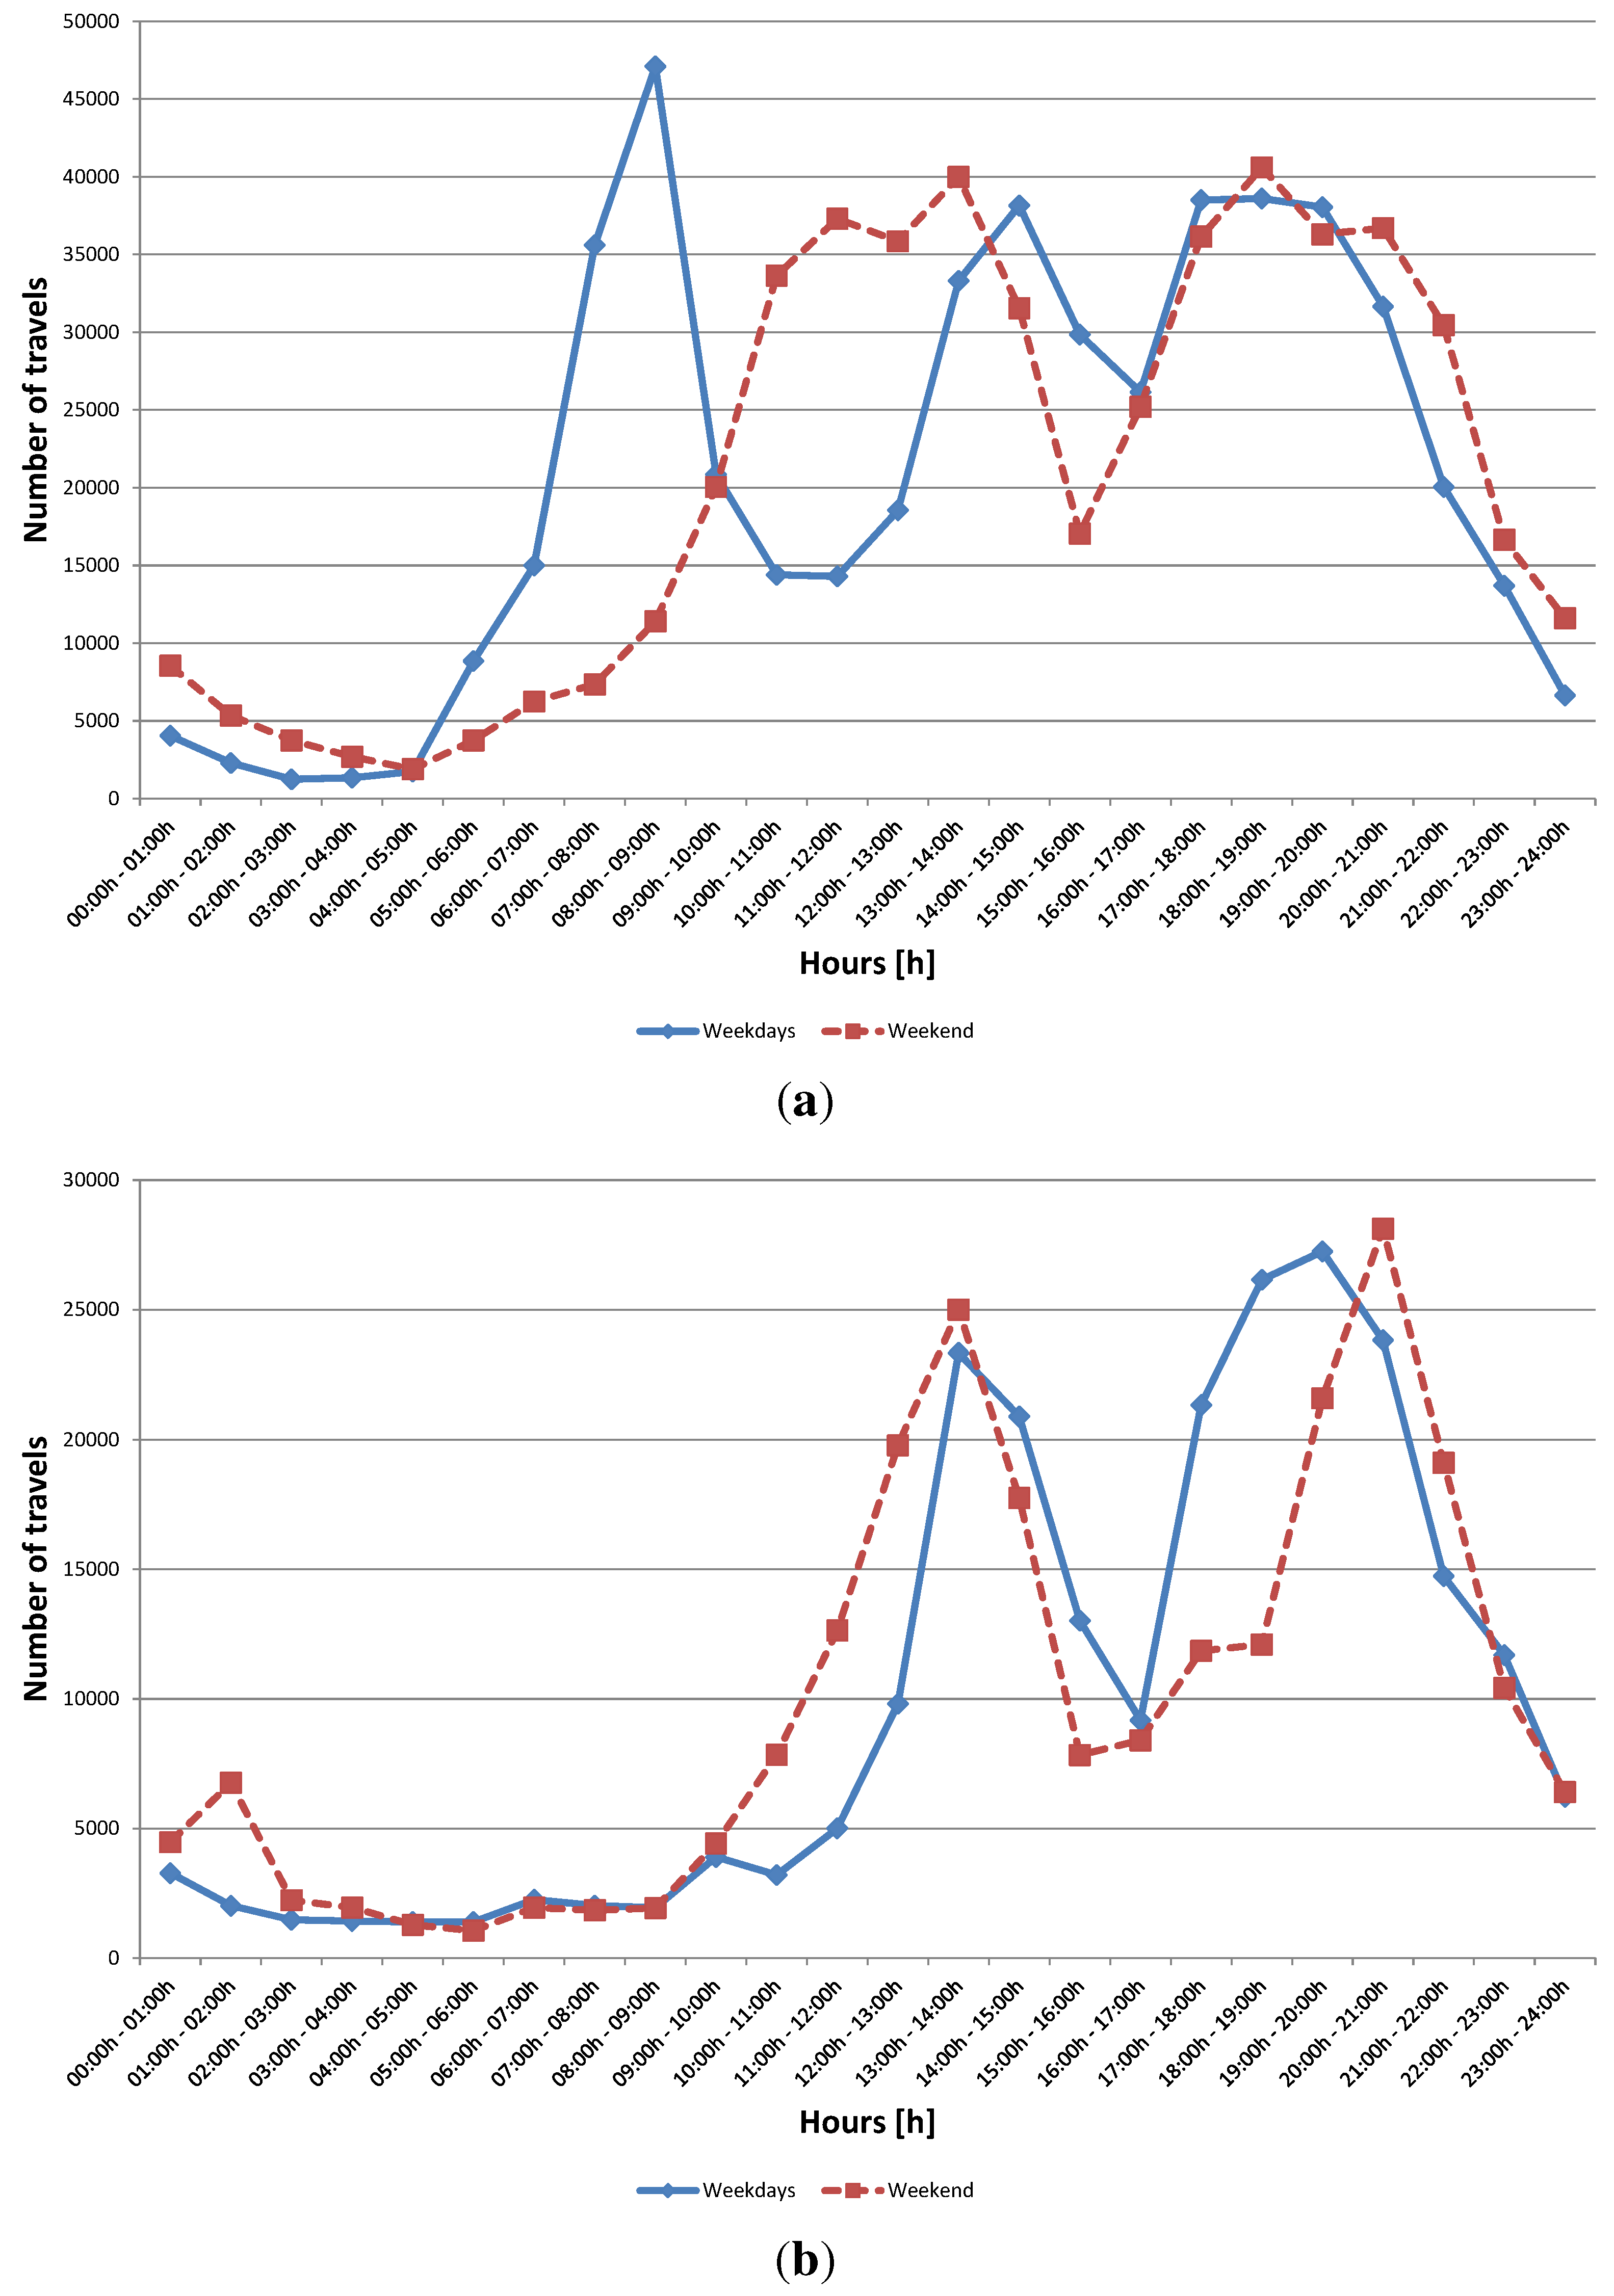
5.1.3. Connection Time of the EVs
- The EV recharges its batteries after every trip.
- The EV recharges its batteries at the end of the day when all trips are completed.
- An EV must have its battery partially or completely discharged in order to start a recharge.
- An EV can only recharge its battery if there are available outlets.
- It is assumed that EV drivers show a cautious attitude towards the possibility of ending up with a depleted battery and will therefore arrive at their destination before the battery is depleted.
5.2. Consumed Power Associated with EV Consumption
5.2.1. Consumed Power by EV Recharge,

| Electric Vehicle (EV) | Capacity [kWh] | Consumption [kWh/km] | Technology |
|---|---|---|---|
| BYD F3DM | 16.5 | 0.160 | Li-Ion |
| BYD e6 (75kW) | 59.4 | 0.160 | Li-Ion |
| BYD e6 (200kW) | 59.4 | 0.175 | Li-Ion |
| CHANA BENNI | 9.0 | - | AGM |
| Micro-Vett Fiat 500 | 22.0 | - | Li-Ion |
| Mitsubishi i MiEV | 16.5 | 0.100 | Li-Ion |
| Smart electric drive Coupe | 14.5 | 0.122 | Li-Ion |
| Subaru Estella | 9.0 | - | Li-Ion |
| Tata Indica Vista EV | 26.5 | 0.133 | Li-Ion |
| SEAT Leon Twin Drive Ecomotive | 12.0 | 0.240 | Li-Ion |
| Zytel Gorila | 10.8 | 0.150 | Lead-Acid |
| Opel Ampera | 16.5 | 0.133 | Li-Ion |
| REVA NXR | 13.5 | 0.090 | Li-Ion |
| Micro-Vett Fiorino M1-Fi(LC-EG)-Li | 13.5 | - | Li-Ion |
| Micro-Vett Fiorino M1-Fi(HC-Eg)-Li(S) | 21.0 | 0.240 | Li-Ion |
| Micro-Vett Fiorino M1-Qu(HC-Eg)-Li(S) | 21.0 | 0.240 | Li-Ion |
| Micro-Vett Fiorino M1-Qu(HC-Eg)-Li(L) | 32.0 | 0.240 | Li-Ion |
| Smart electric drive Cabrio | 14.5 | 0.122 | Li-Ion |
| Think City 2010 | 83.0 | 0.144 | NiNa |
| Peugeot ION | 16.5 | 0.125 | Li-Ion |
| Tesla Roadster | 51.5 | 0.231 | Li-Ion |
| TOYOTA Prius Plug-In Hybrid | 5.0 | 0.062 | Li-Ion |
| Citroen C-Zero | 16.5 | - | Li-Ion |
| Mini-E | 35.0 | 0.130 | Li-Ion |
| Volkswagen Golf | 26.5 | - | Li-Ion |
| Nissan Leaf | 24.0 | - | Li-Ion |
| Chevrolet Volt | 16.5 | - | Li-Ion |
| Brusa Spyder | 16.0 | - | Li-Ion |
| Phoenix SUT | 35.0 | - | Li-Ion |
| Lumeneo Smera | 10.0 | - | Li-Ion |

6. Study Grid
| Voltage | Topology | Benefits | Drawbacks |
|---|---|---|---|
| High | Meshed | Introduces the possibility of assessing the impact of large generation units. Lower error in the demand’s modeling. | Due to the high short-circuit grid’s power and its topology, a reduced impact on the grid is expected. |
| Medium | Radial | Brings the opportunity of introducing distributed generation units and assessing its impact. Lower error in the demand’s modeling. | Due to the high short-circuit grid power, a reduced impact on the grid is expected. |
| Low | Radial | Due to its low short-circuit power, a high impact on the grid is expected. | It is not feasible to include any generation unit. Higher error in demand modeling. |
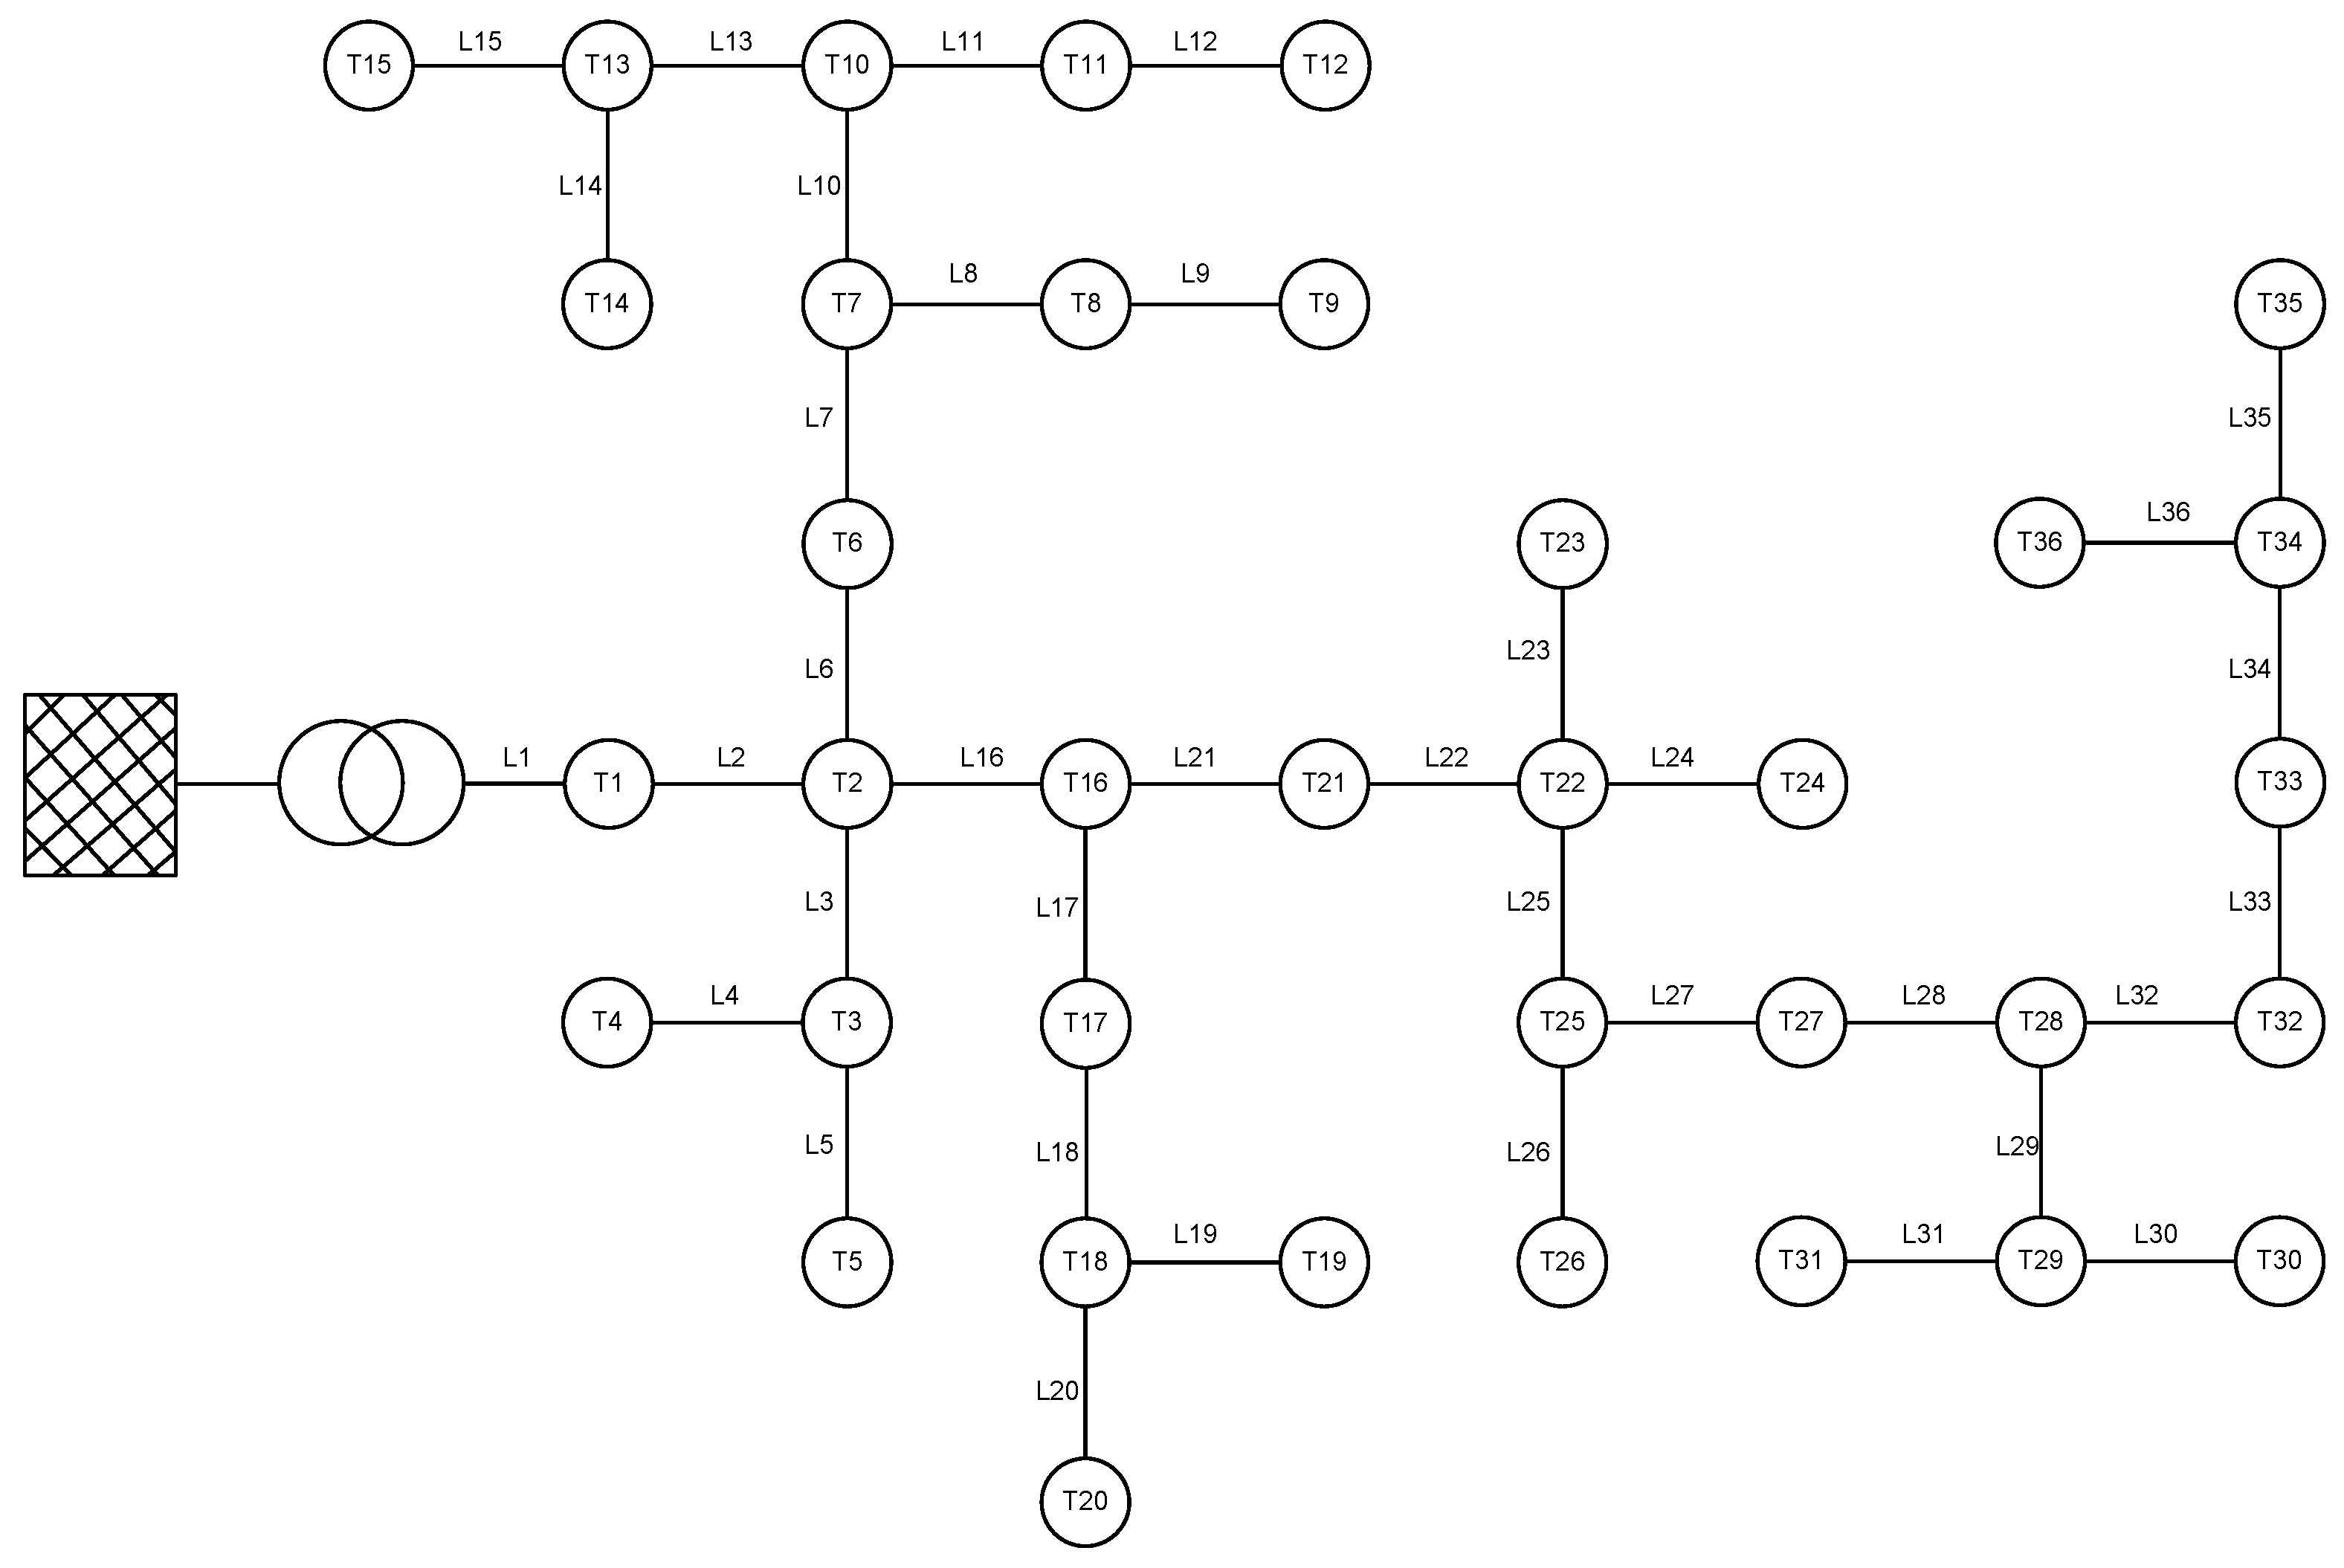
6.1. Proposed Grid
6.2. Proposed Scenario

| A [mm] | R [Ohm/km] | [Ohm/km] | [A] |
|---|---|---|---|
| 240 | 0.125 | 0.116 | 415 |
| 400 | 0.0778 | 0.105 | 530 |
| Feature | Assigned Value |
|---|---|
| Power | 160-250-400-630 kVA |
| Connection type: 250-400-630 kVA | Dyn11 |
| Voltage of the HV coupling | 25 kV |
| No-load voltage of the LV coupling | 420 V |
| Transformer’s tap positions | −5 −2.5 0 +2.5 +5 +10 |
| Capacity of resisting short-circuit events in the LV side | 22.2 |
| Transformer station | Number of transformers | Pnom [kVA] | Line | L [km] | S [mm] | |
|---|---|---|---|---|---|---|
| T0 | 1 | 25000 | - | - | - | |
| T1 | 1 | 160 | L1 | 0.3 | 400 | |
| T2 | 3 | L2 | 0.2 | 400 | ||
| T3 | 1 | 400 | L3 | 0.4 | 240 | |
| T4 | 2 | L4 | 0.4 | 240 | ||
| T5 | 1 | 160 | L5 | 0.3 | 240 | |
| T6 | 1 | 400 | L6 | 0.2 | 240 | |
| T7 | 1 | 250 | L7 | 0.3 | 240 | |
| T8 | 2 | L8 | 0.2 | 240 | ||
| T9 | 1 | 400 | L9 | 0.3 | 240 | |
| T10 | 1 | 160 | L10 | 0.2 | 240 | |
| T11 | 2 | 250 | L11 | 0.3 | 240 | |
| T12 | 1 | 250 | L12 | 0.3 | 240 | |
| T13 | 2 | L13 | 0.3 | 240 | ||
| T14 | 1 | 160 | L14 | 0.3 | 240 | |
| T15 | 2 | L15 | 0.2 | 240 | ||
| T16 | 2 | L16 | 0.4 | 240 | ||
| T17 | 2 | L17 | 0.4 | 240 | ||
| T18 | 1 | 250 | L18 | 0.2 | 240 | |
| T19 | 1 | 160 | L19 | 0.5 | 240 | |
| T20 | 2 | L20 | 0.1 | 240 | ||
| T21 | 1 | 250 | L21 | 0.4 | 240 | |
| T22 | 2 | L22 | 0.2 | 240 | ||
| T23 | 2 | L23 | 0.3 | 240 | ||
| T24 | 1 | 630 | L24 | 0.2 | 240 | |
| T25 | 2 | L25 | 0.5 | 240 | ||
| T26 | 2 | L26 | 0.2 | 240 | ||
| T27 | 1 | 160 | L27 | 0.3 | 240 | |
| T28 | 1 | 400 | L28 | 0.2 | 240 | |
| T29 | 1 | 160 | L29 | 0.2 | 240 | |
| T30 | 2 | L30 | 0.3 | 240 | ||
| T31 | 1 | 250 | L31 | 0.2 | 240 | |
| T32 | 2 | L32 | 0.7 | 240 | ||
| T33 | 1 | 400 | L33 | 0.3 | 240 | |
| T34 | 2 | L34 | 0.5 | 240 | ||
| T35 | 2 | L35 | 0.3 | 240 | ||
| T36 | 1 | 400 | L36 | 0.4 | 240 |
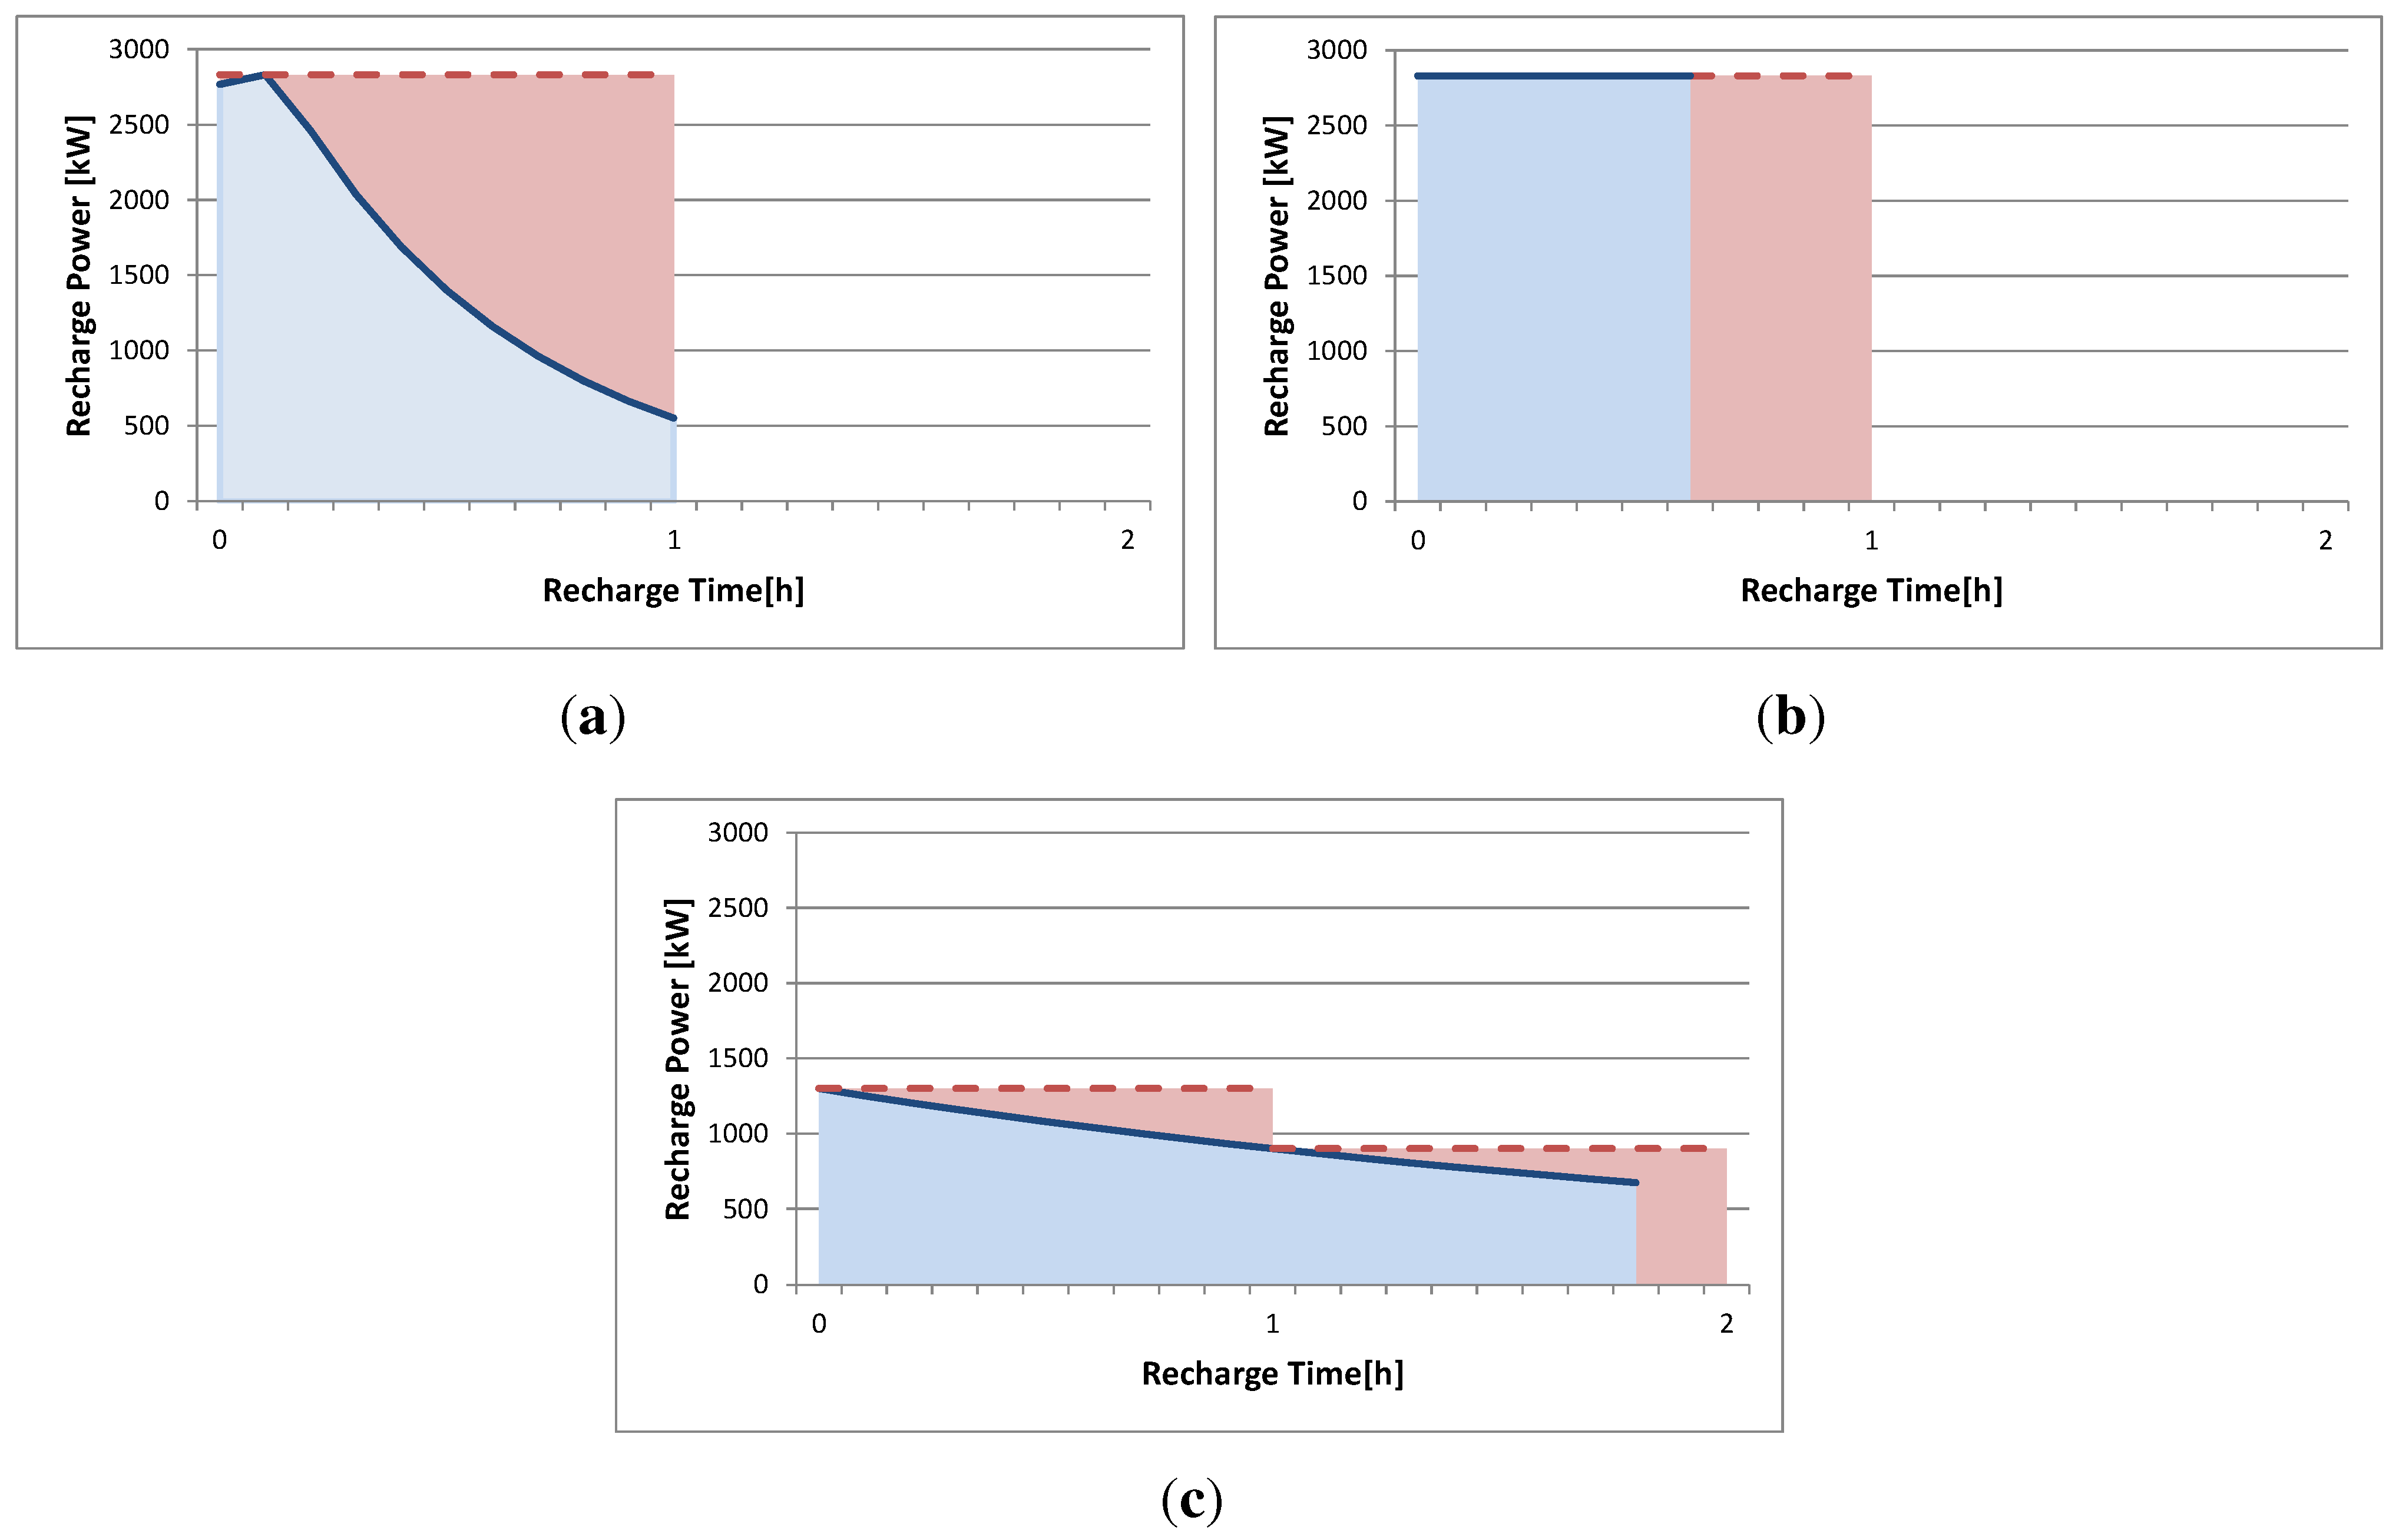
7. Results without the Electrical Demand: Recharge Curve of the EV
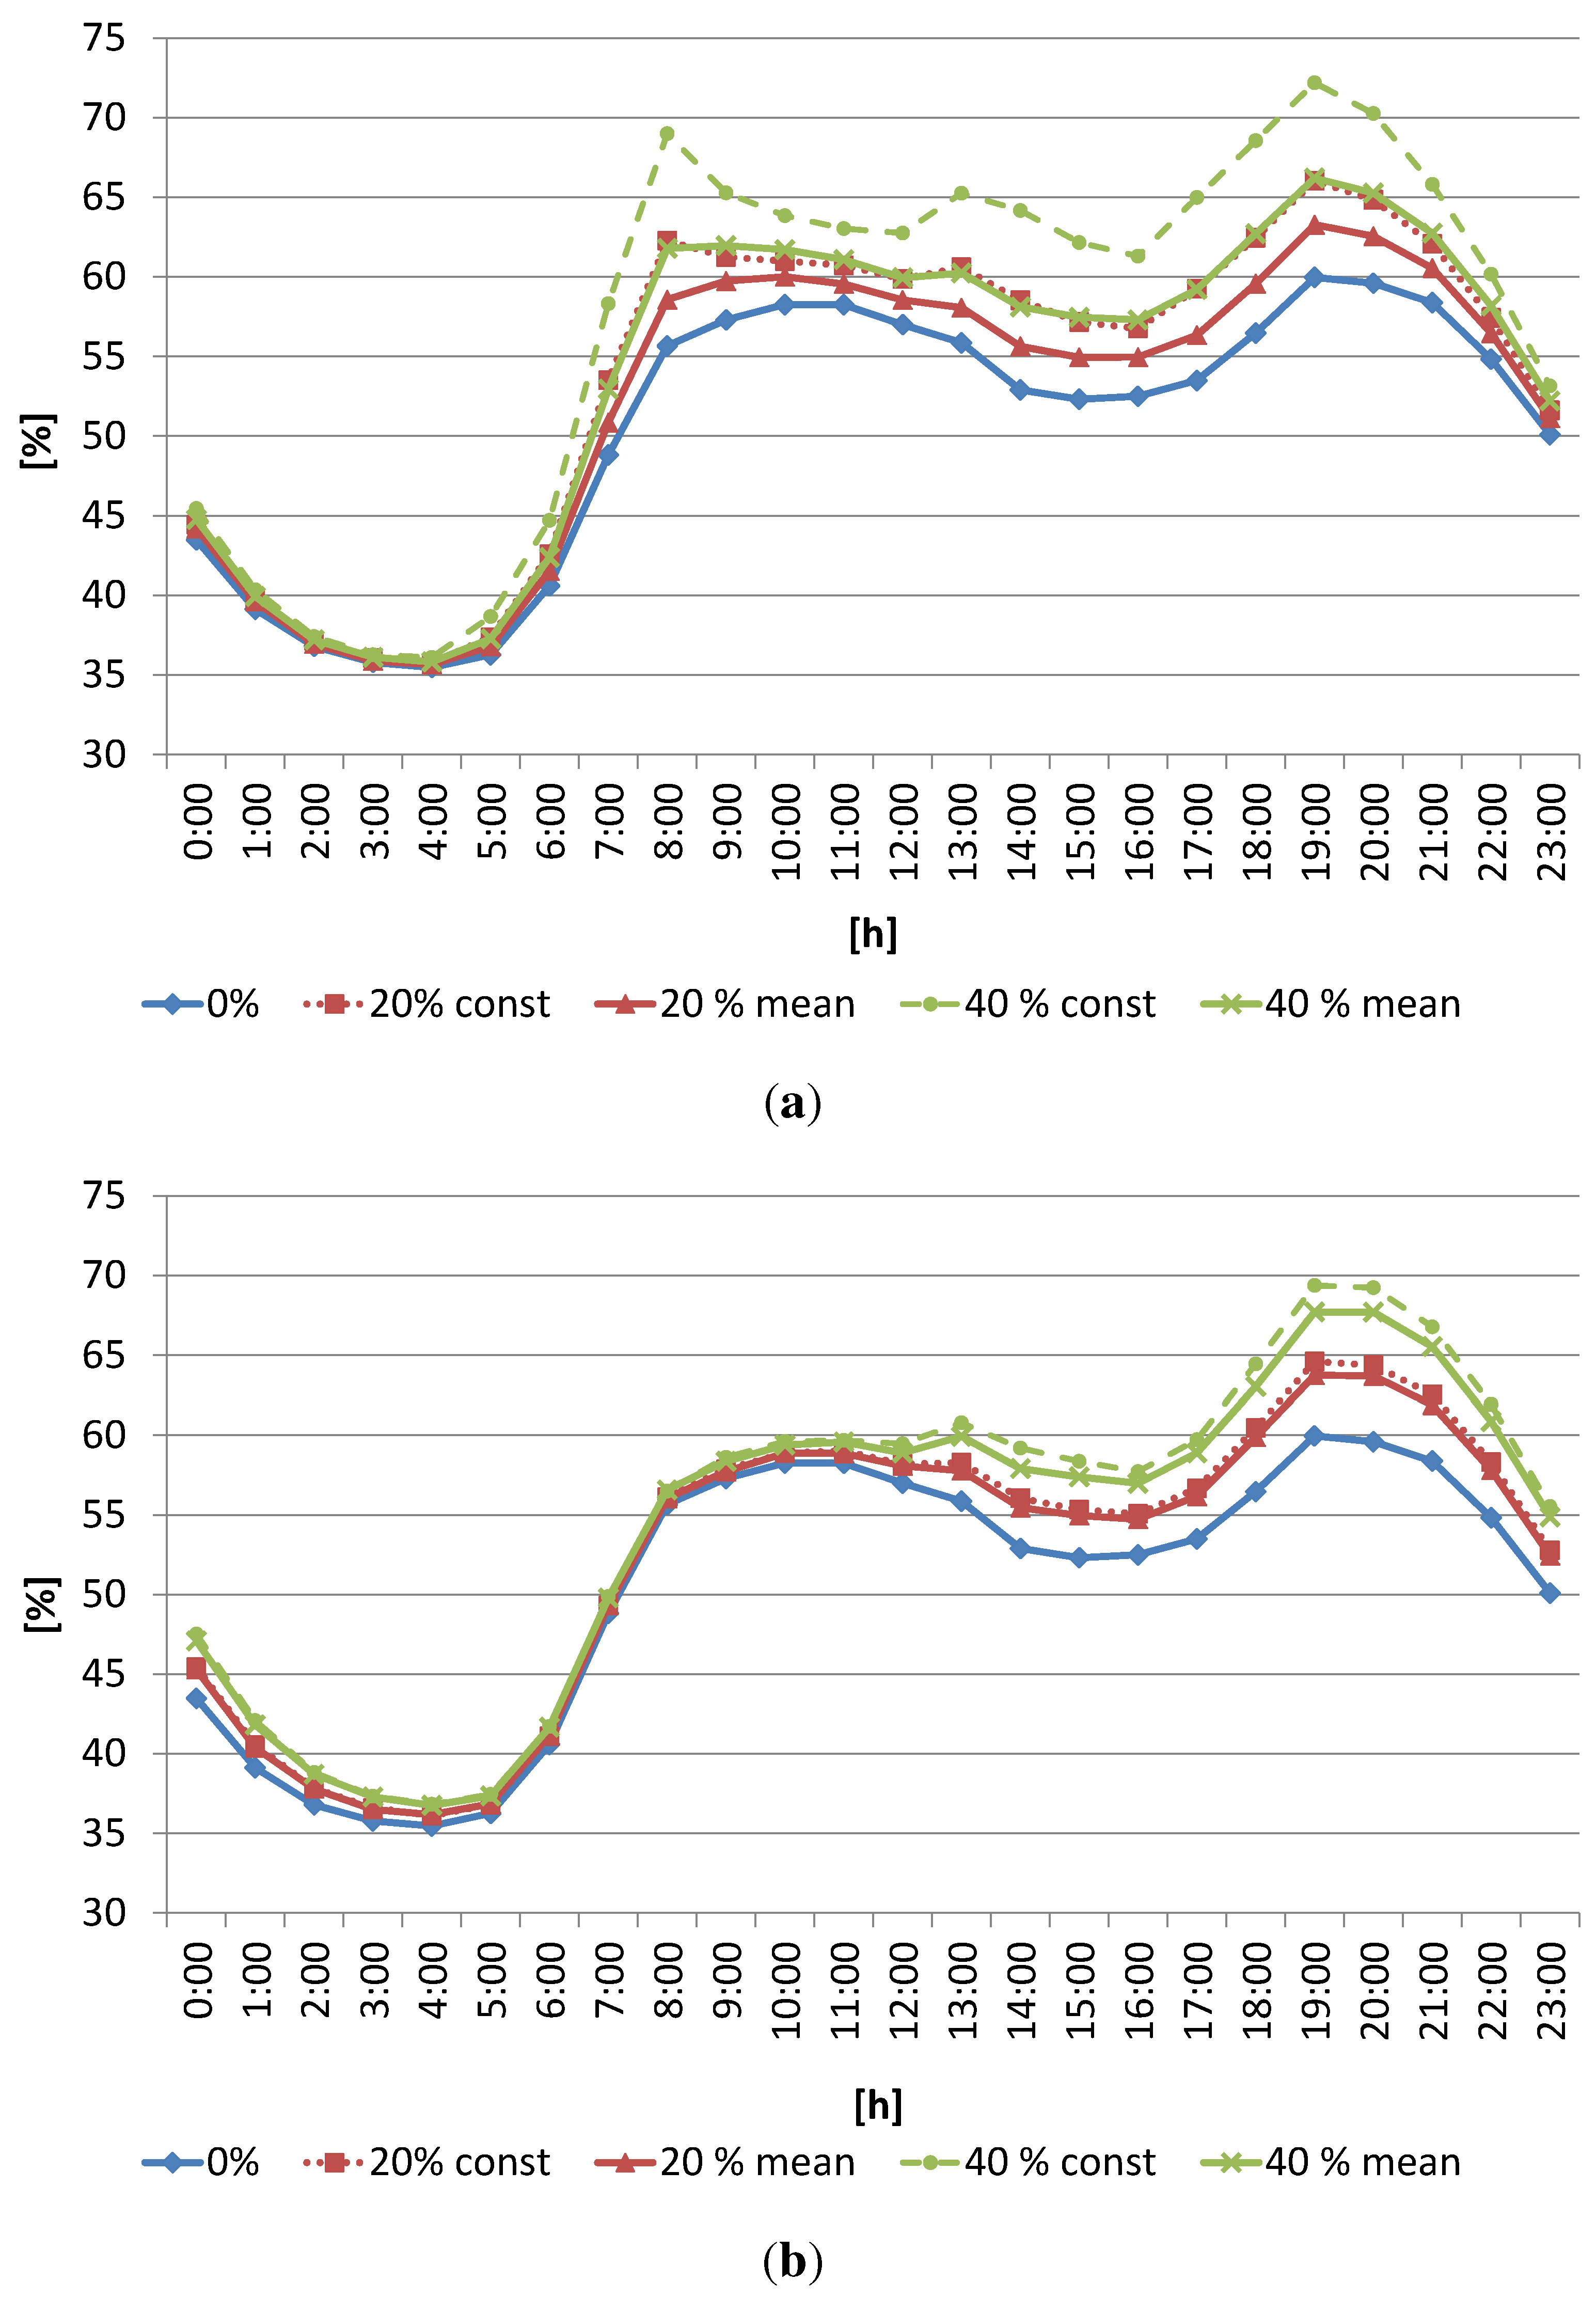
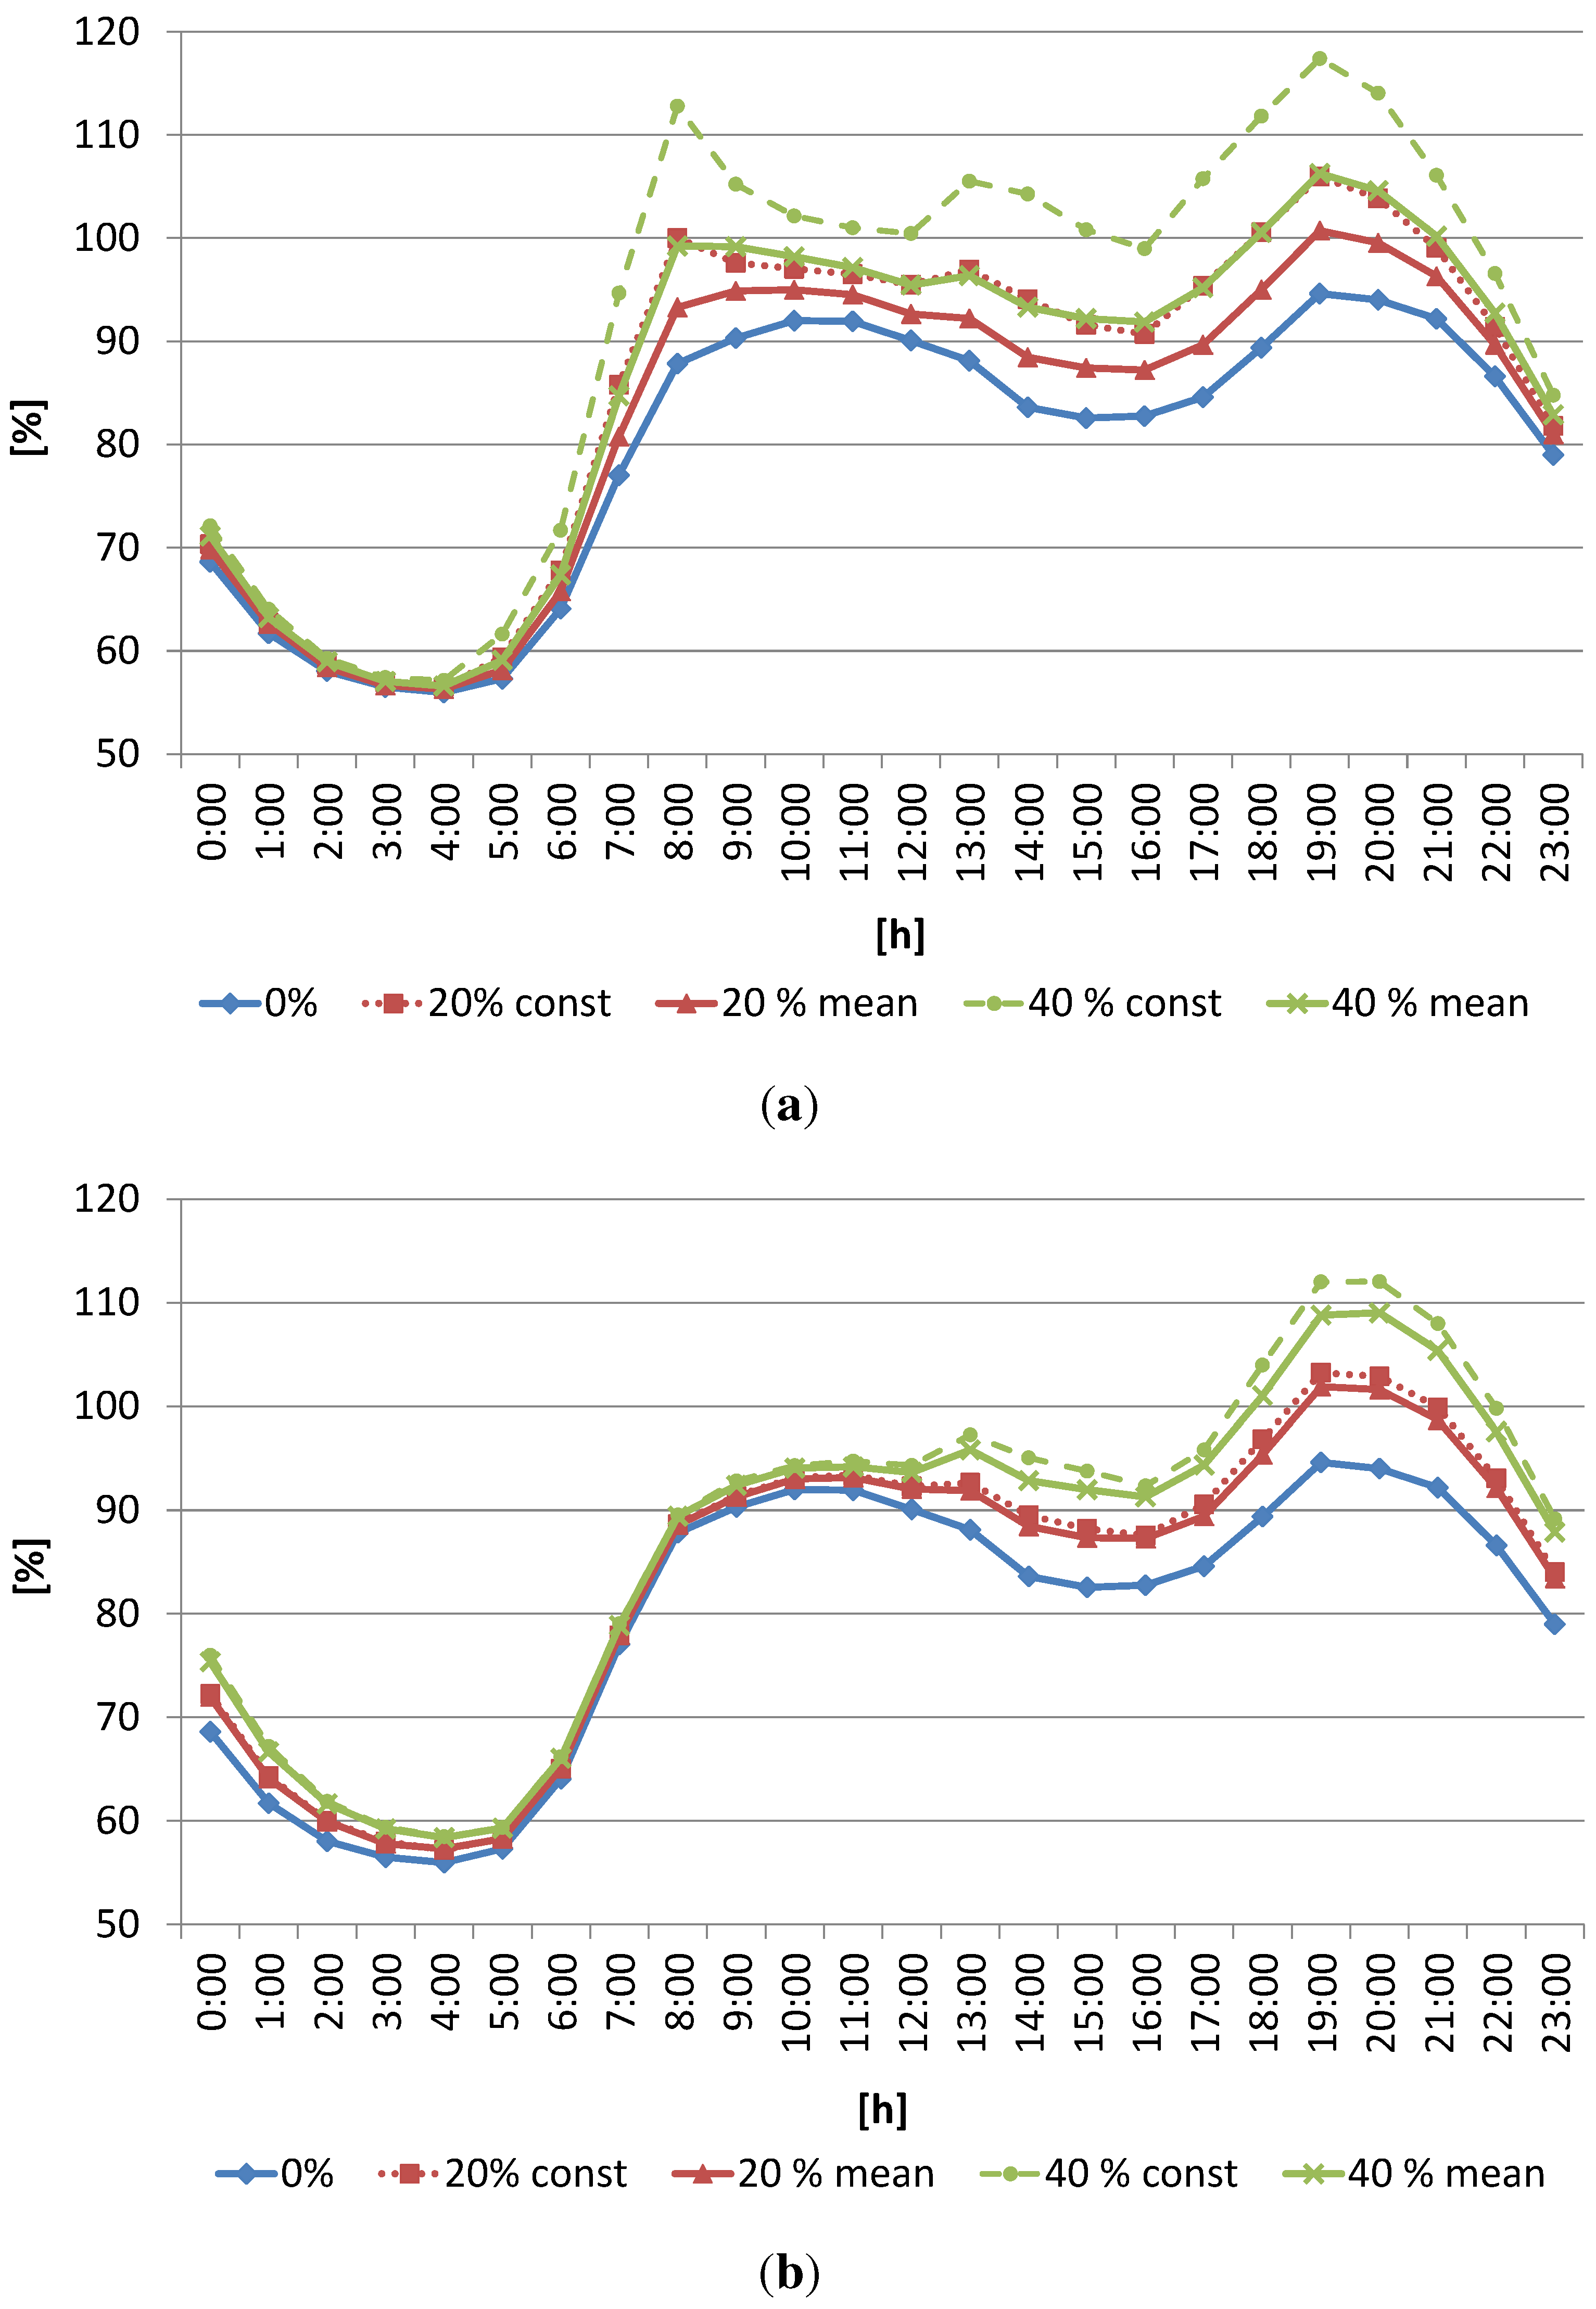
- Constant Power: The recharge is performed at constant power (Figure 10(b)).
- Variable Power: The recharge is performed based on the battery’s recharge model (Figure 10(a)).
- Variable model with average values for the power to recharge: The recharge is performed based on the battery’s recharge model but the chosen value for the power is the mean for the established periods (Figure 10(c)).

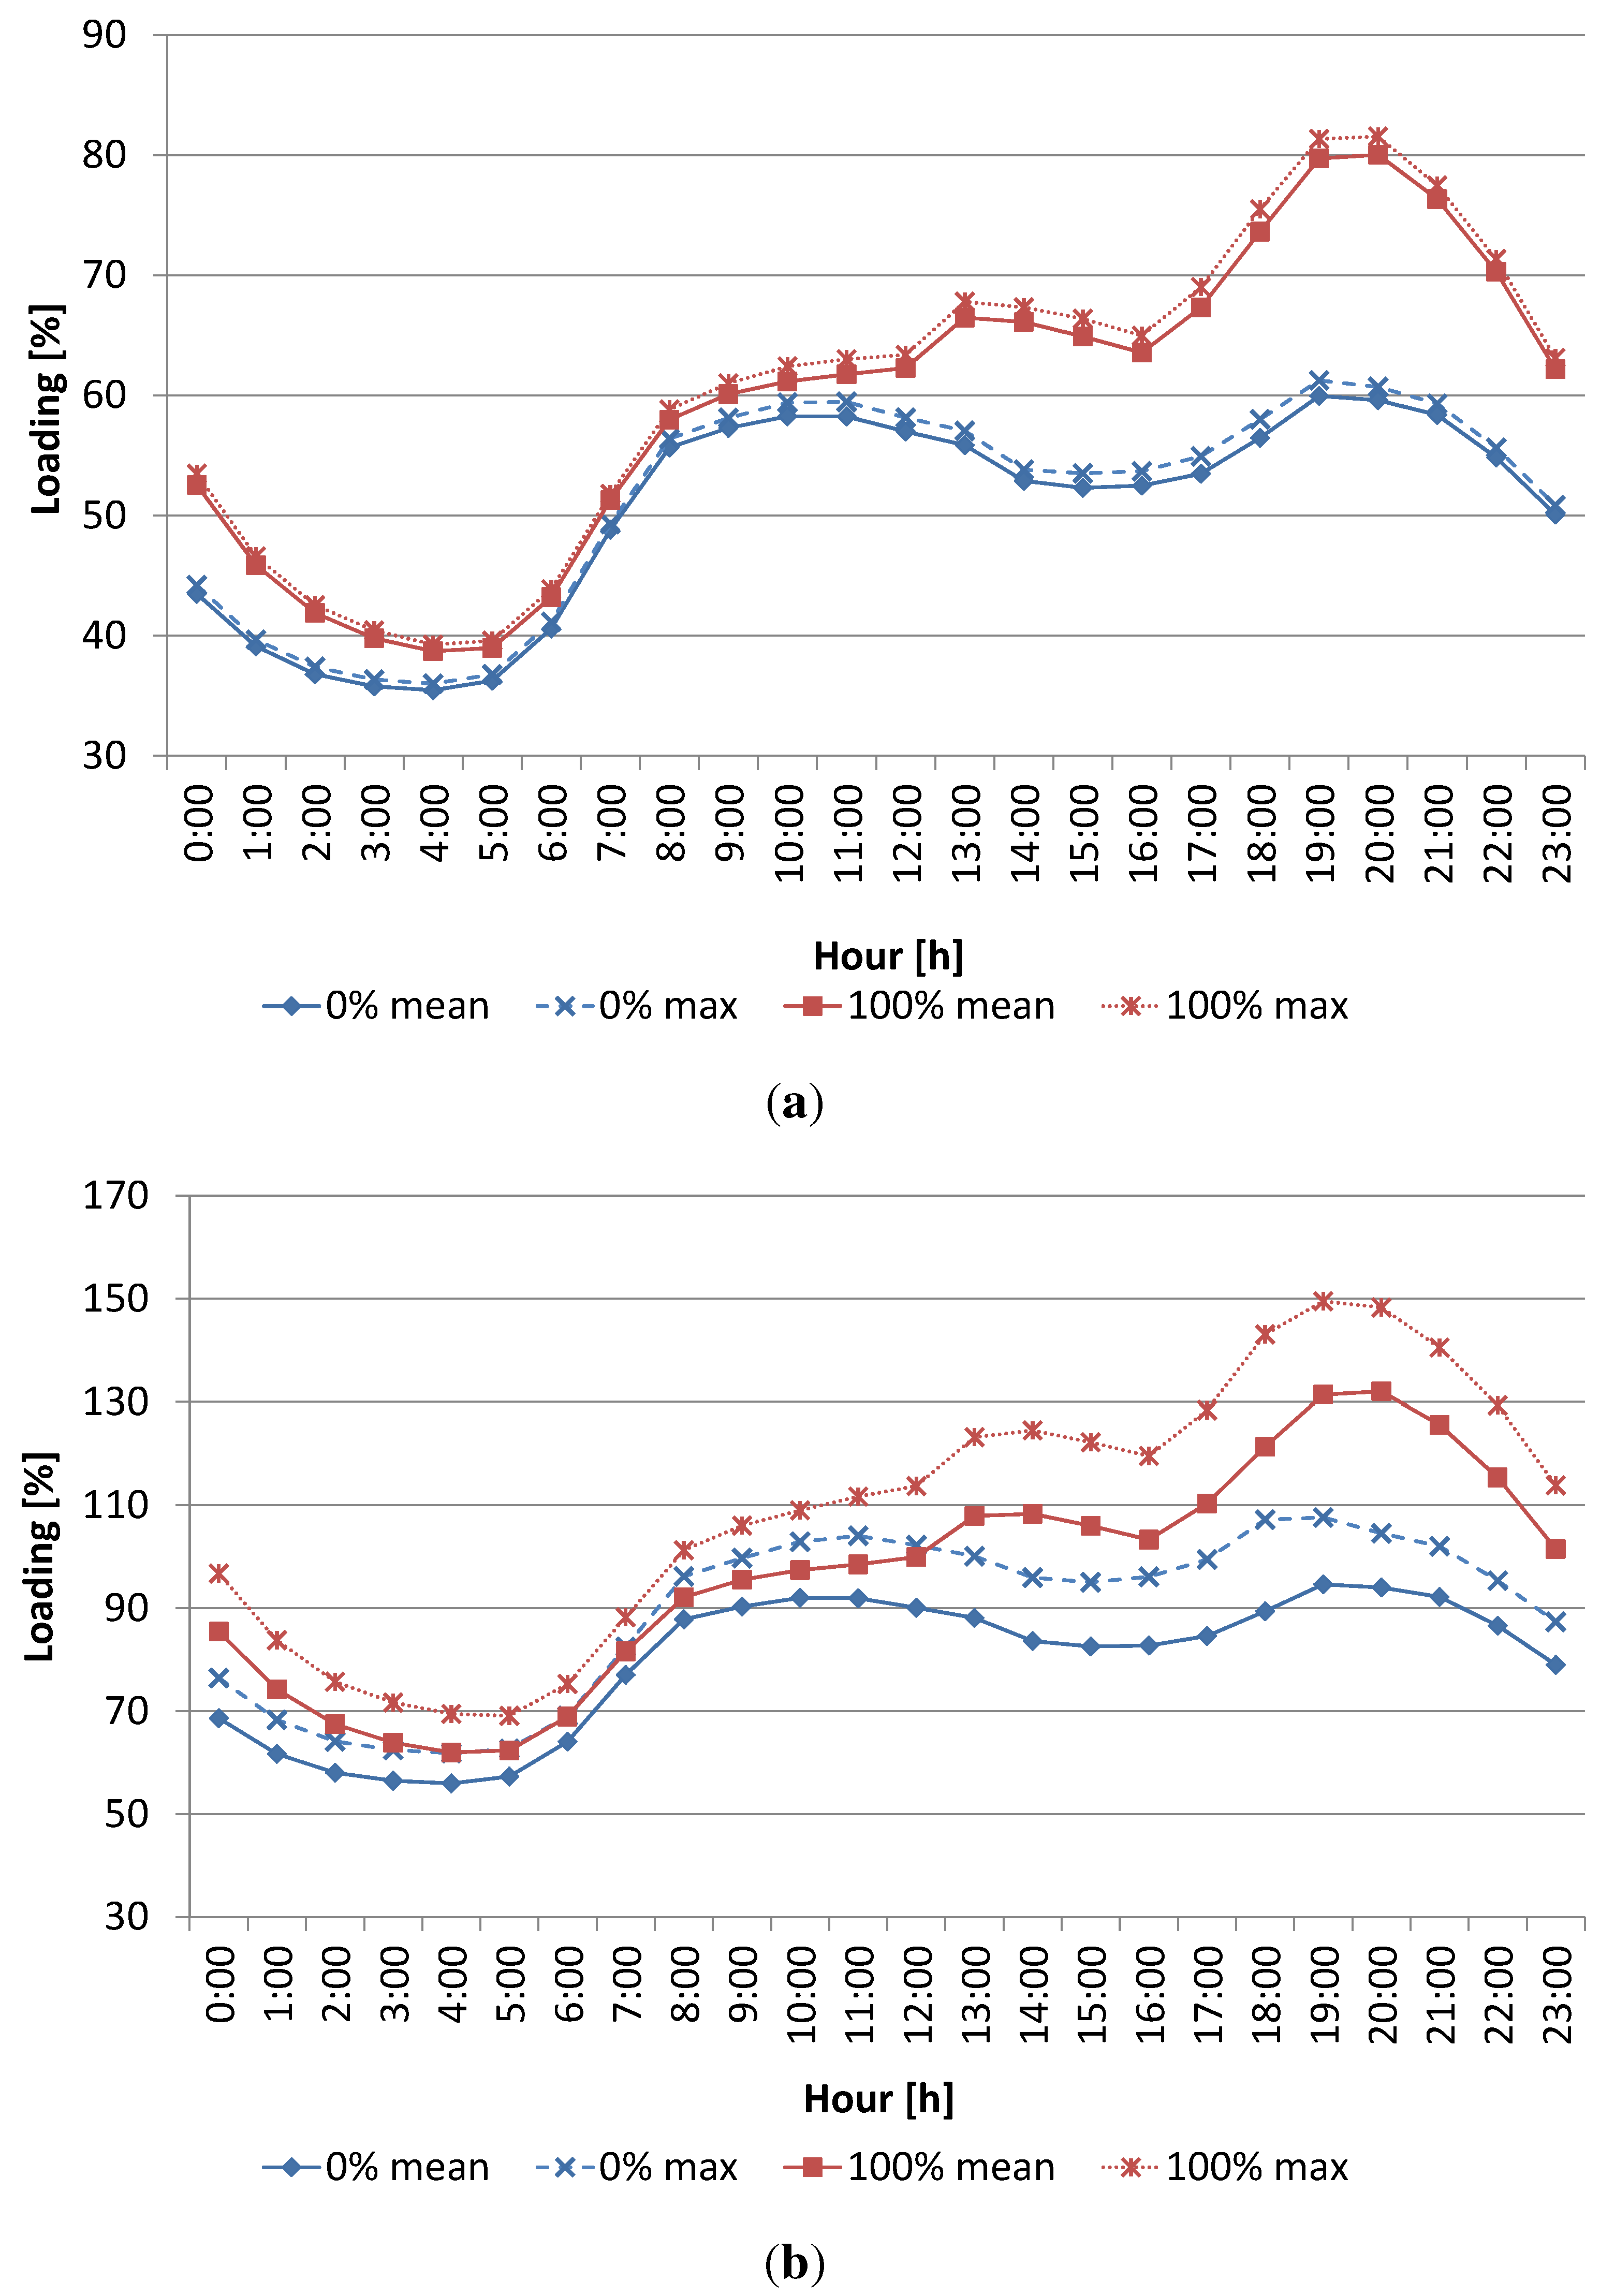
8. Results with Electrical Demand:Impact into the Distribution Grid
8.1. Comparison of the Constant Power Battery’s Recharge Model and Variable Model with Mean Values for the Power to Recharge
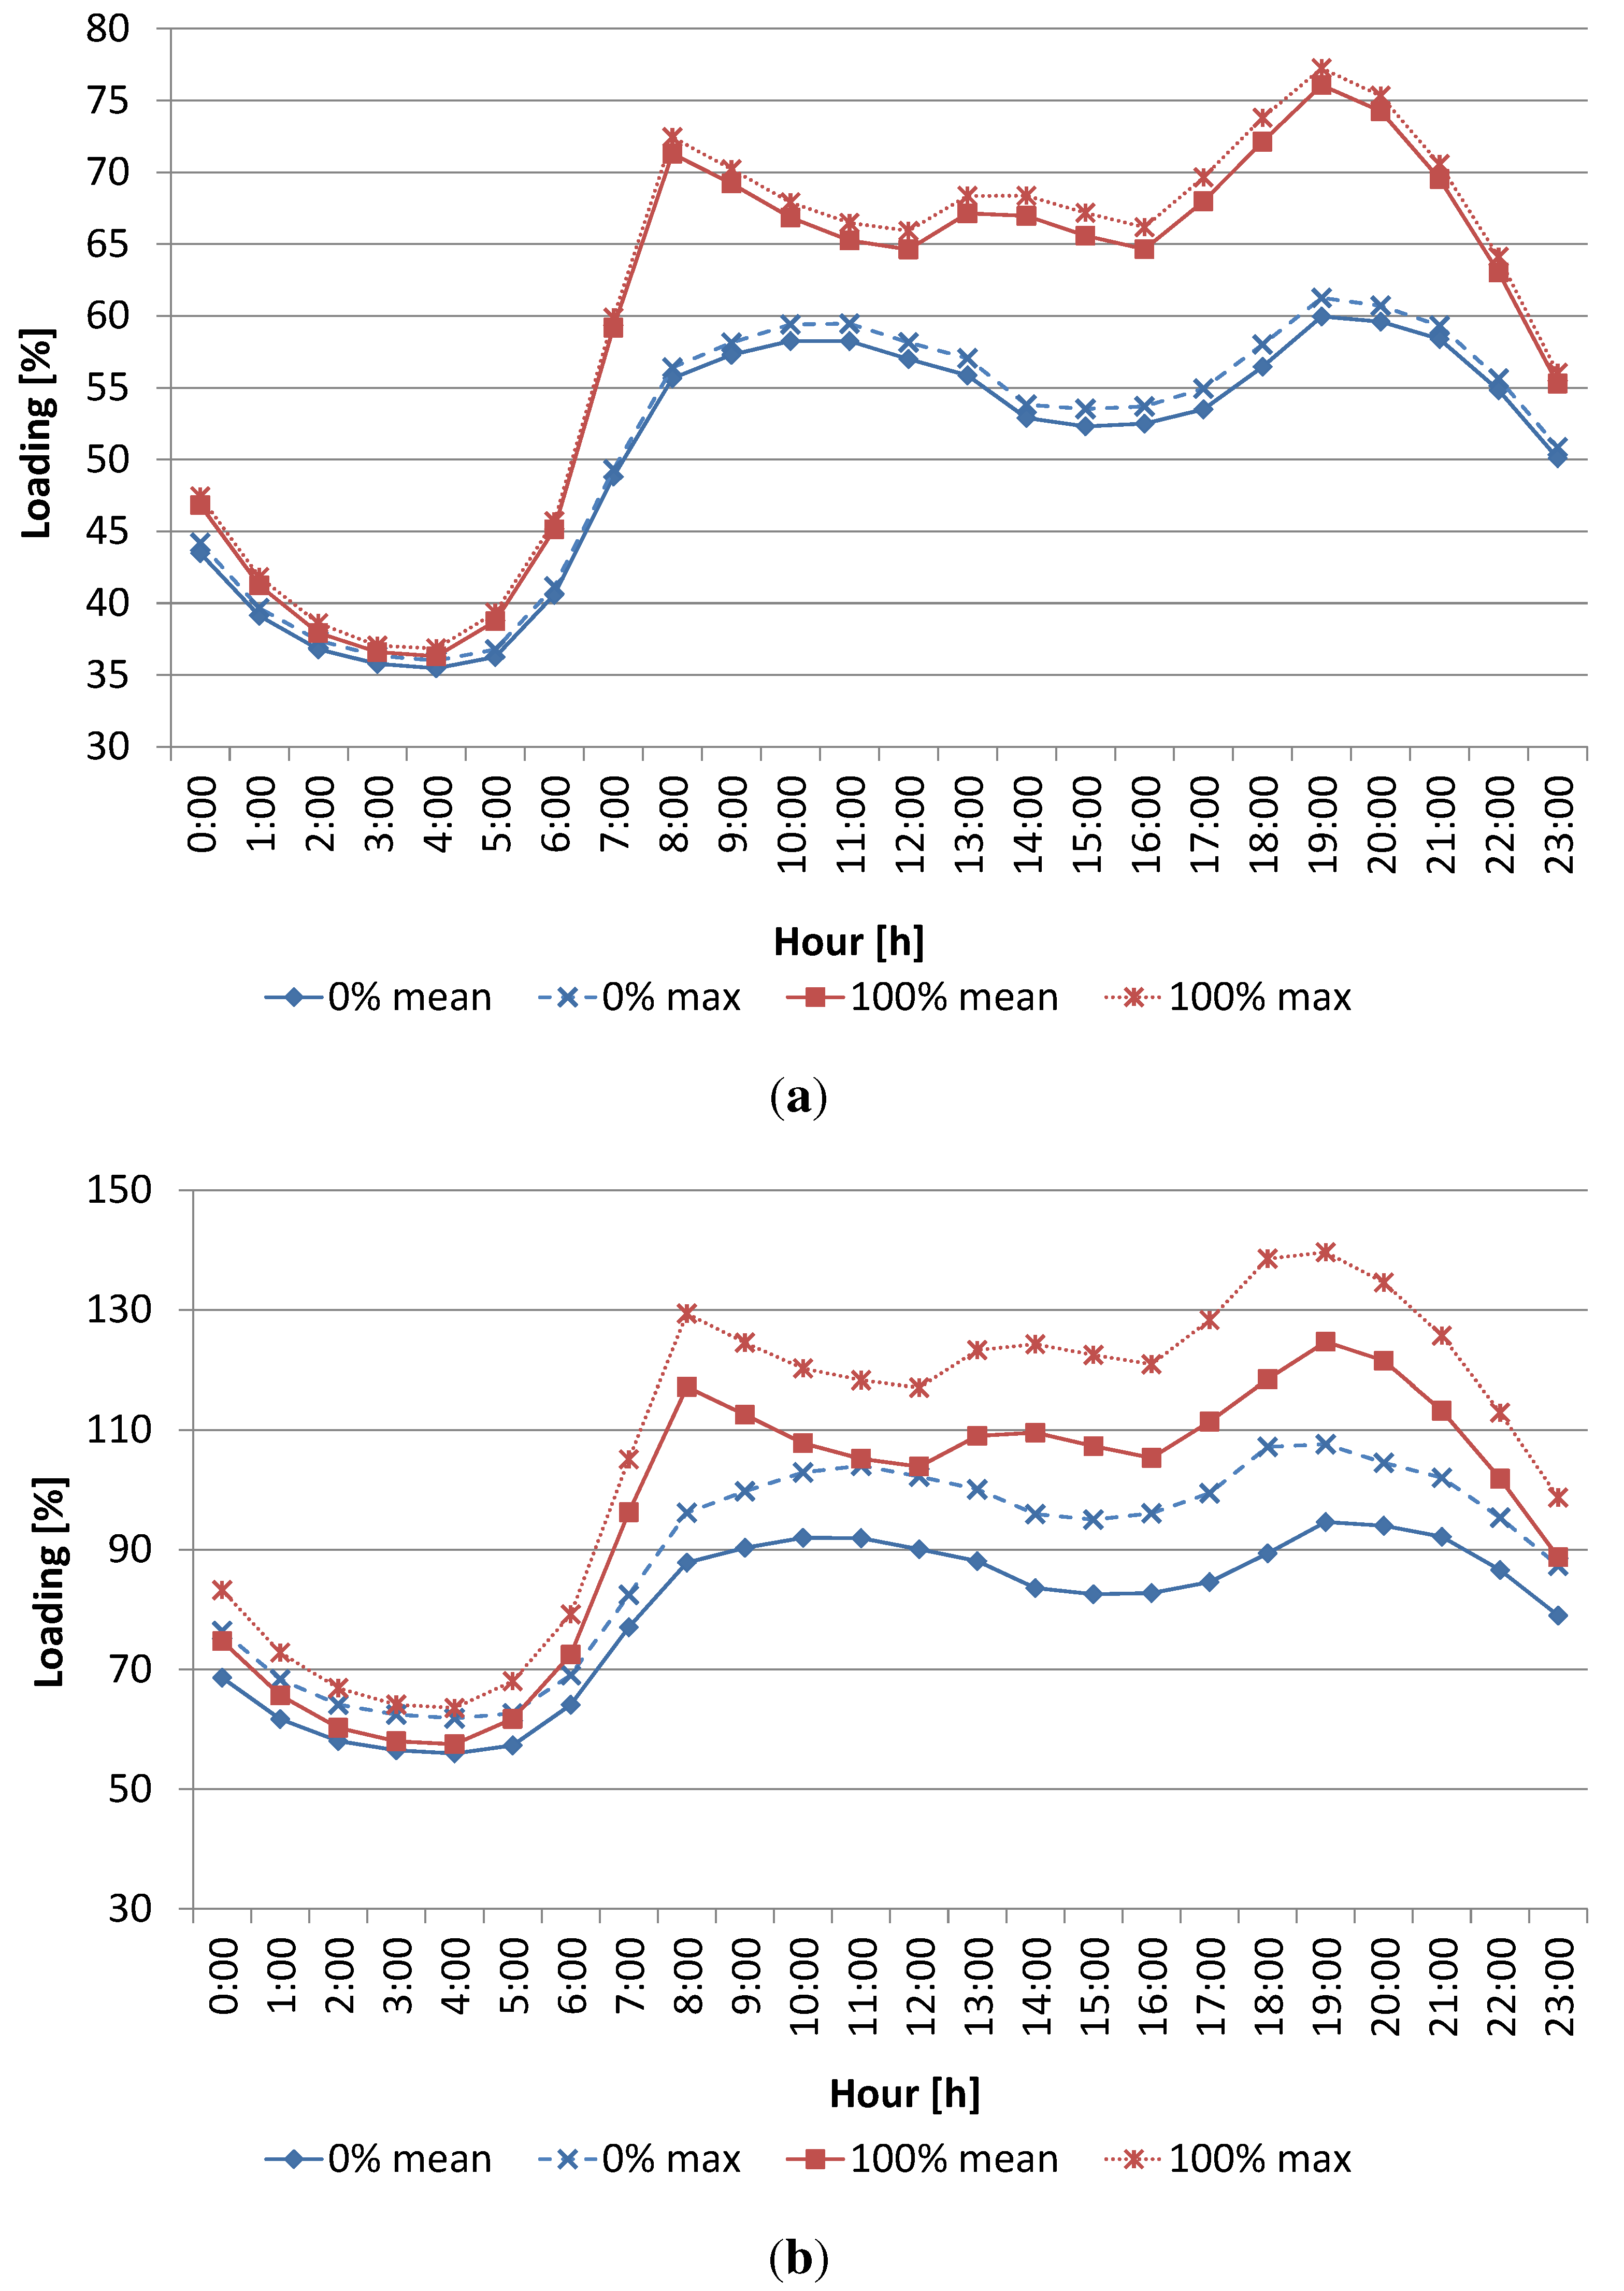
8.2. Extreme Scenario: EV Penetration of 100%

9. Conclusions
- Obtainment of the probabilistic model for electrical demand. It consists of creating a statistical model able to generate random values according to the available data of the Spanish hourly load profile (rescaled to the study grid). The seasonal patterns of the consumption were obtained in order to generate a normal distribution for each hour of each pattern. Using these normal distributions, the random values for the hourly power due to the electrical demand can be generated. The pattern chosen for the simulation is the winter pattern because the highest consumptions are experienced, which results in the most critical case.
- Battery model creation. The load curves of the different types of batteries have been implemented in order to include their behaviour in the simulations and maintain accuracy.
- Obtainment of the probabilistic model for the electrical demand due to the EV consumption. In order to get the EV consumption, several steps had to be taken:
- Study of the mobility patterns of Barcelona and adaptation to the studied area in order to get the number of EVs that would be recharging in the area. The distribution of the number of EVs along the nodes has been done considering that each node has the same probability of recharging vehicles.
- Determination of the consumed power of the EVs for each recharge. The consumed energy per travel is based on the specific consumption of the battery and the distance travelled. In this study the travelled distance follows a log normal distribution with a shape value of 1.929 and a scale factor of 1.508.
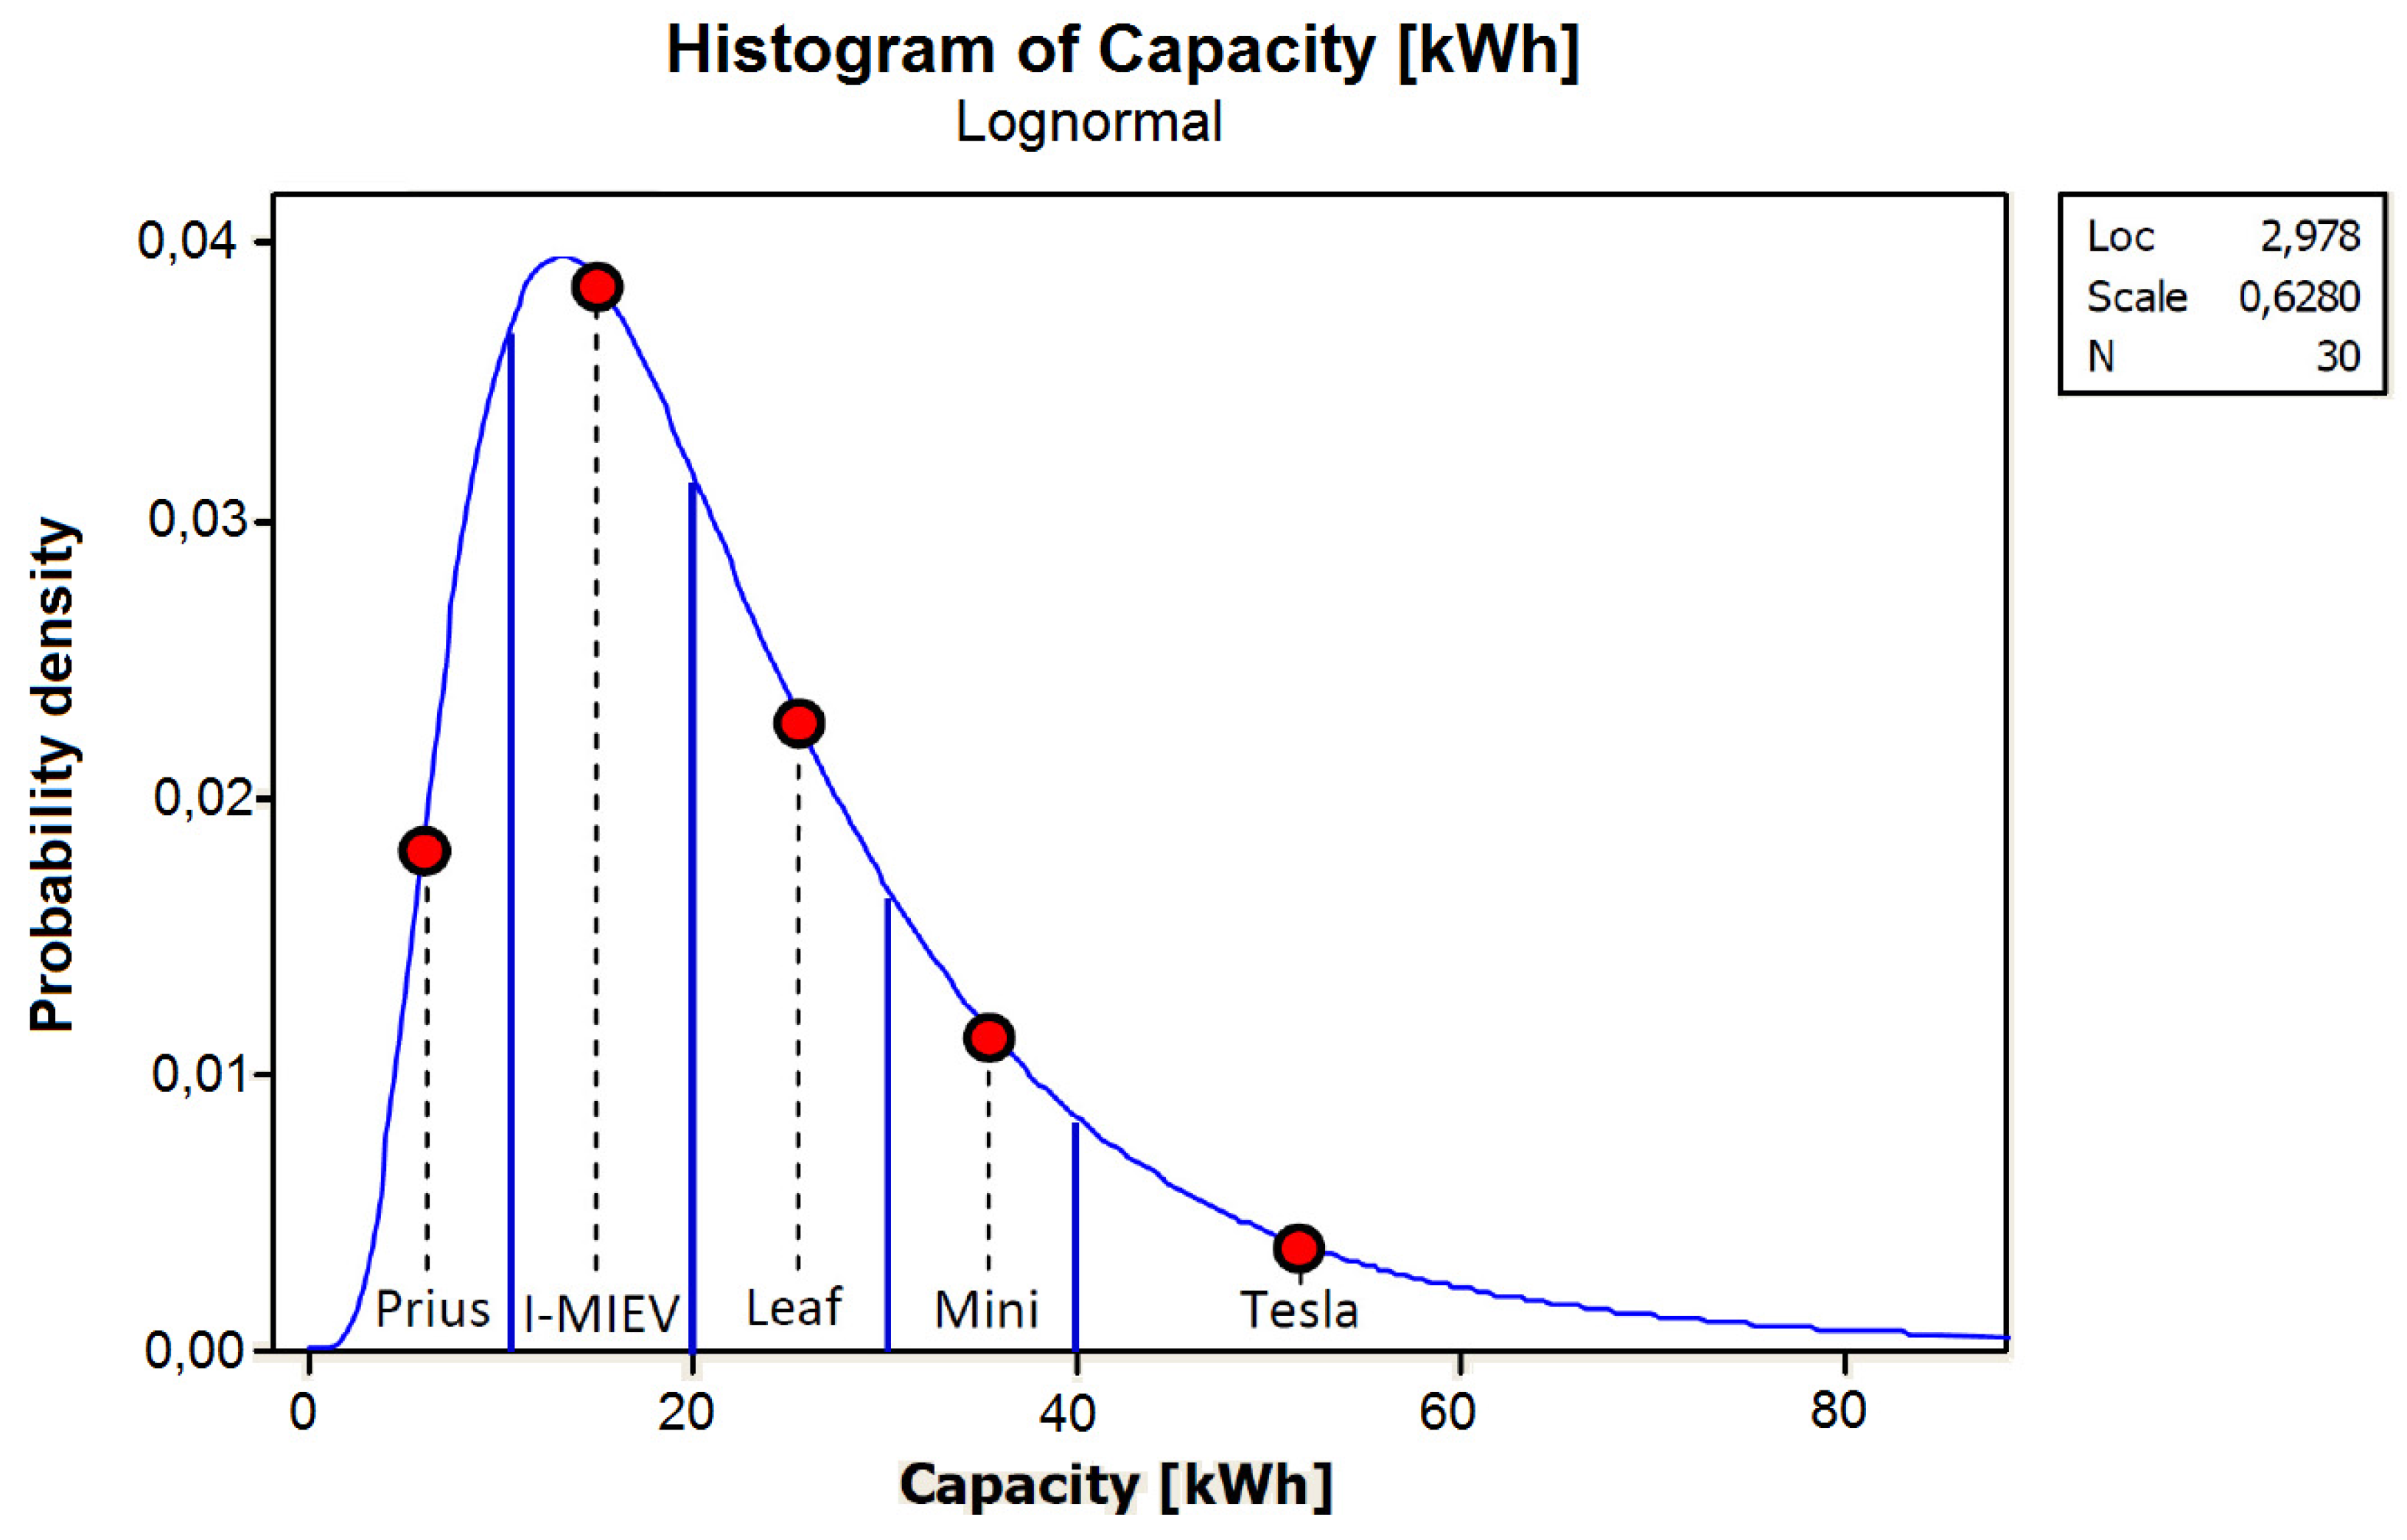
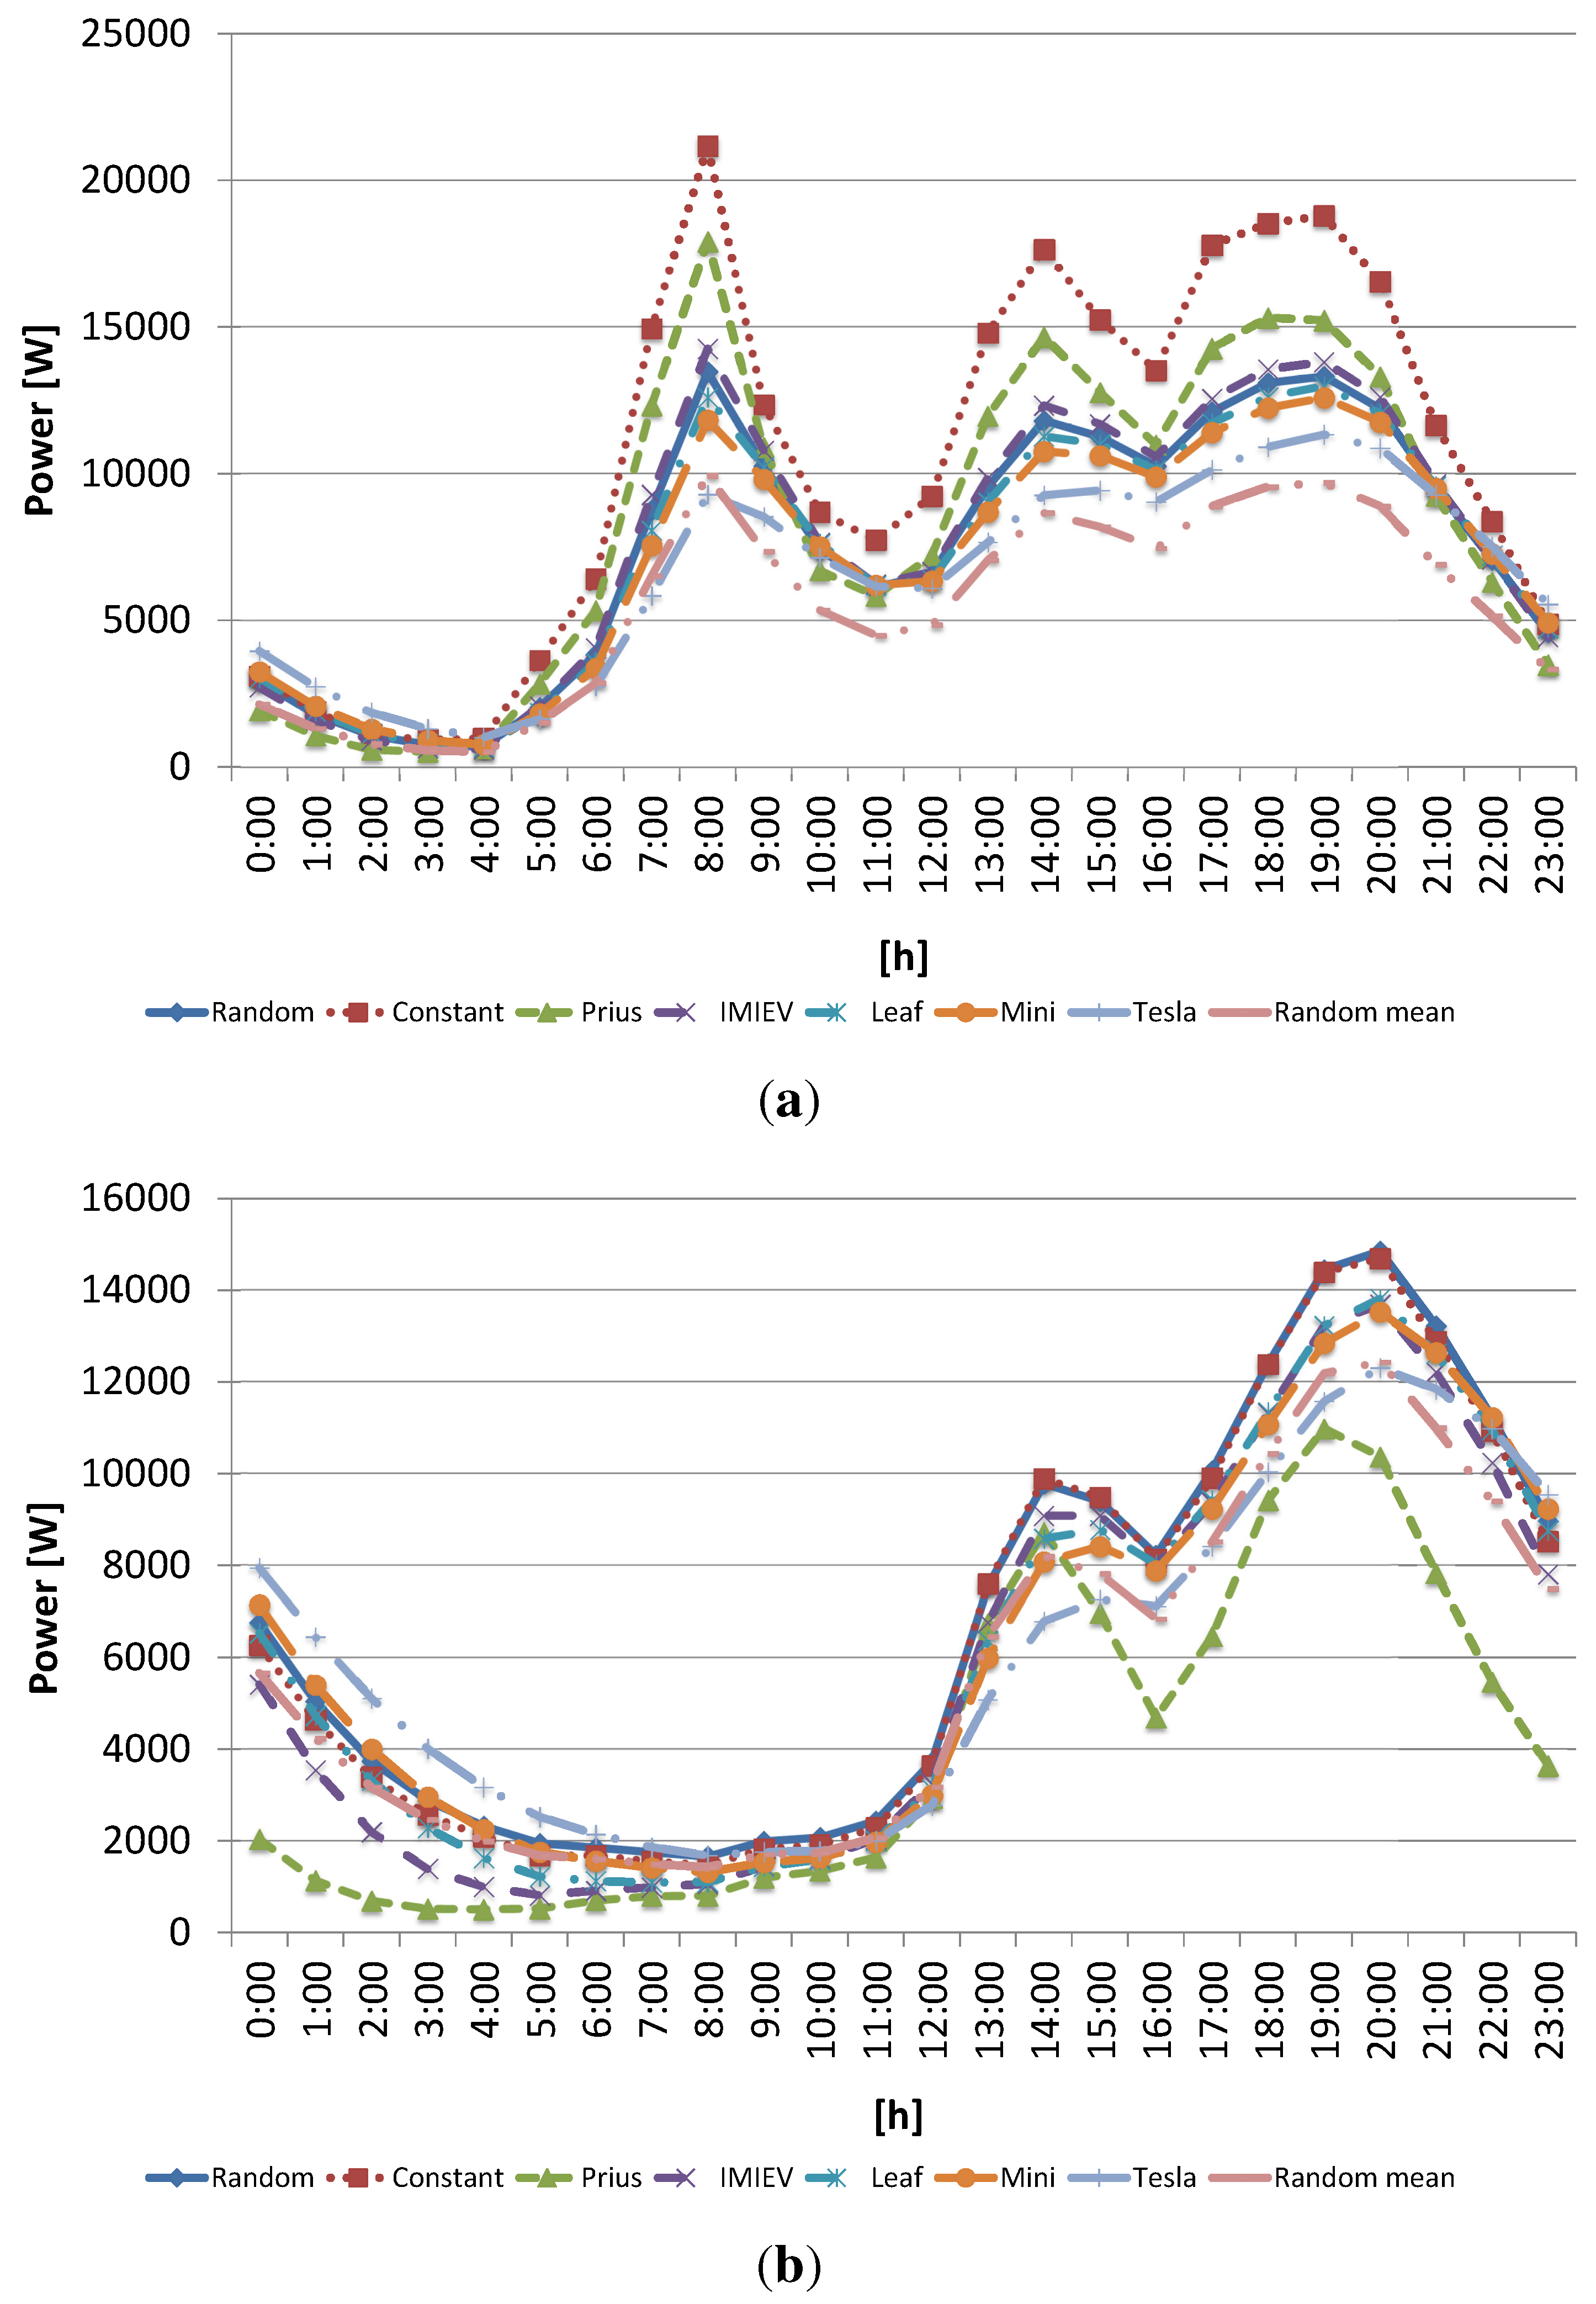
- Obtainment of the type of battery of each EV. The type of battery determines the specific consumption of the previous step. In the study, a log normal function was created from the capacities to be generated for random batteries, and depending on the value, a known load curve from an existent model was assigned (Figure 8).
- One of the main interests of this study is to obtain the impact of EVs recharging in a real distribution grid situation. Thus, an IEEE test system has been adapted to an underground cable system used, like in Barcelona. The main advantage of this new test system is that it also contains mobility-related data that can be used in future studies.
- Simulation using the Monte Carlo method of the possible scenarios using the power system simulator DIgSILENT. Once all the consumptions per node, hour and iteration have been determined (EV’s consumption and conventional demand), deterministic load flows with these values can be performed in order to get the confidence interval for the result variables.
- The constant battery model does not take into account that during the last stage of the recharge, consumption decreases in an exponential way (constant voltage stage). This inaccuracy gets accentuated when the recharge is performed during this stage (recharge after each trip).
- The simulation using time periods with one hour resolution results in an imprecision when the recharge lasts less than one hour. This situation results in the recharge of more energy during the simulation than required.
Acknowledgements
References
- New York Independent System Operator. Alternate Route: Electrifying the Transportation Sector; Technical Report; New York Independent System Operator: New York, NY, USA, 2009. [Google Scholar]
- Denholm, P.; Short, W. An Evaluation of Utility System Impacts and Benefits of Optimally Dispatched Plug-in Hybrid Electric Vehicles; Technical Report; National Renewable Energy Laboratory: Colorado, USA, 2006. [Google Scholar]
- Gong, Q.; Midlam-Mohler, S.; Marano, V.; Rizzoni, G. Study of PEV charging on residential distribution transformer life. IEEE Trans. Smart Grid 2012, 3, 404–412. [Google Scholar] [CrossRef]
- Dickerman, L.; Harrison, J. A new car, a new grid. IEEE Power Energy Mag. 2010, 8, 55–61. [Google Scholar] [CrossRef]
- Gonzalez, C.; Villafafila, R.; Ramirez, R.; Sudria, A.; Sumper, A.; Chindris, M. Assess the Impact of Photovoltaic Generation Systems on Low-Voltage Network: Software Analysis Tool Development. In Proceedings of the 9th International Conference Electrical Power Quality and Utilisation (EPQU 2007), Barcelona, Spain, 9–11 October 2007; pp. 1–6.
- Hadley, S. Impact of Plug-in Hybrid Vehicles on the Electric Grid; Technical Report; Oak Ridge National Laboratory: Oak Ridge, TN, USA, 2006. [Google Scholar]
- Shao, S.; Pipattanasomporn, M.; Rahman, S. Challenges of PHEV Penetration to the Residential Distribution Network. In Proceedings of the IEEE Power Energy Society General Meeting (PES ’09.), Calgary, Canada, 26–30 July 2009; pp. 1–8.
- Clement-Nyns, K.; Haesen, E.; Driesen, J. The impact of charging plug-in hybrid electric vehicles on a residential distribution grid. IEEE Trans. Power Syst. 2010, 25, 371–380. [Google Scholar] [CrossRef]
- Clement, K.; Haesen, E.; Driesen, J. Coordinated Charging of Multiple Plug-in Hybrid Electric Vehicles in Residential Distribution Grids. In Proceedings of the IEEE/PES Power Systems Conference and Exposition (PSCE ’09), Seattle, WA, USA, 15–18 March 2009; pp. 1–7.
- Acha, S.; Green, T.C.; Shah, N. Effects of optimised plug-in hybrid vehicle charging strategies on electric distribution network losses. In Proceedings of the IEEE Transmission and Distribution Conference and Exposition (2010 PES), New Orleans, LA, USA, 19–22 April 2010; pp. 1–6.
- Karnama, A. Analysis of Integration of Plug-in Hybrid Electric Vehicles in the Distribution Grid. MA Thesis, Royal Institute of Technology (KTH), Stockholm, Sweden, 2009. [Google Scholar]
- Taylor, J.; Maitra, A.; Alexander, M.; Brooks, D.; Duvall, M. Evaluation of the Impact of Plug-in Electric Vehicle Loading on Distribution System Operations. In Proceedings of the IEEE Power Energy Society General Meeting (PES ’09.), Calgary, Canada, 26–30 July 2009; pp. 1–6.
- Judd, S.; Overbye, T. An Evaluation of PHEV Contributions to Power System Disturbances and Economics. In Proceedings of the 40th North American Power Symposium (NAPS ’08.), Calgary, Canada, 28–30 September 2008; pp. 1–8.
- Vlaamse regulator van de elektriciteits. De verbruiksprofielen van huishoudelijke en niethuishoudelijke elektriciteitsverbruikers voor het jaar 2007. Available online: http://www.vreg.be (accessed on 15 October 2010).
- Stockholm Office of Research and Statistics. Statistical Year-book of Stockholm; Stockholm Office of Research and Statistics: Stockholm, Sweden, 2009. [Google Scholar]
- Axsen, J.; Kurani, K.S. Anticipating plug-in hybrid vehicle energy impacts in California: Constructing consumer-informed recharge profiles. Trans. Res. Part D 2010, 15, 212–219. [Google Scholar]
- Martinez-Vicente, D. El impacto del vehiculo electrico en la red de distribucion. MA Thesis, Universitat Politècnica de Catalunya (UPC), Barcelona, Spain, 2011. [Google Scholar]
- Seppala, A. Load Research and Load Estimation in Electricity Distribution. Ph.D. Thesis, Helsinki University of Technology, Helsinki, Finland, 1996. [Google Scholar]
- Neimane, V. On Development Planning of Electricity Distribution Networks. Ph.D. Thesis, Royal Institute of Technology, Stockholm, Sweden, 2001. [Google Scholar]
- Ministry of Science and Technology. Reglamento Electrotecnico de Baja Tension (Low Voltage Electrical Standard); Spanish Government: Madrid, Spain, 2002.
- EMQ 2006 de la Regiò Metropolitana de Barcelona; Generalitat de Catalunya —Departament de Política Territorial i Obres Públiques: Barcelona, Spain, 2006.
- Vlachogiannis, J. Probabilistic constrained load flow considering integration of wind power generation and electric vehicles. IEEE Trans. Power Syst. 2009, 24, 1808–1817. [Google Scholar] [CrossRef]
- Ronald, E.W.; Raymond, H.M.; Sharon, L.M. Probability and Statistics for Engineers and Scientists, 9th ed.; Prentice Hall: New Jersey, NJ, USA, 2011. [Google Scholar]
- Kersting, W.H. Radial distribution test feeders. IEEE Trans. Power Syst. 1991, 6, 975–985. [Google Scholar] [CrossRef]
- DIgSILENT PowerFactory. Available online: http://www.digsilent.de (accessed on 15 May 2012).
© 2012 by the authors; licensee MDPI, Basel, Switzerland. This article is an open access article distributed under the terms and conditions of the Creative Commons Attribution license (http://creativecommons.org/licenses/by/3.0/).
Share and Cite
Valsera-Naranjo, E.; Sumper, A.; Villafafila-Robles, R.; Martínez-Vicente, D. Probabilistic Method to Assess the Impact of Charging of Electric Vehicles on Distribution Grids. Energies 2012, 5, 1503-1531. https://doi.org/10.3390/en5051503
Valsera-Naranjo E, Sumper A, Villafafila-Robles R, Martínez-Vicente D. Probabilistic Method to Assess the Impact of Charging of Electric Vehicles on Distribution Grids. Energies. 2012; 5(5):1503-1531. https://doi.org/10.3390/en5051503
Chicago/Turabian StyleValsera-Naranjo, Eduardo, Andreas Sumper, Roberto Villafafila-Robles, and David Martínez-Vicente. 2012. "Probabilistic Method to Assess the Impact of Charging of Electric Vehicles on Distribution Grids" Energies 5, no. 5: 1503-1531. https://doi.org/10.3390/en5051503
APA StyleValsera-Naranjo, E., Sumper, A., Villafafila-Robles, R., & Martínez-Vicente, D. (2012). Probabilistic Method to Assess the Impact of Charging of Electric Vehicles on Distribution Grids. Energies, 5(5), 1503-1531. https://doi.org/10.3390/en5051503