Abstract
Based on currently available data from site measurements in the Shenhu Area of the South China Sea, methane hydrate dissociation behavior by depressurization is studied in a one-dimensional experimental apparatus. According to time variation of temperature, resistance and gas production, the hydrate dissociation process is divided into three stages: free gas release, rapid dissociation and gradual dissociation. The experimental results show that as the hydrate saturation increases the proportion of hydrate decomposed decreases in the rapid dissociation stage. The hydrate dissociation rate and the dissociation heat increase as the dissociation pressure decreases. Furthermore, the decrease of the dissociation pressure works against the secondary formation of the hydrate.
1. Introduction
Natural gas hydrates (NGH) are non-stoichiometric crystalline inclusion compounds, formed from the reaction between natural gas and water under a certain temperature and pressure [1]. Natural gas hydrate reservoirs have been found in permafrost and marine sediment distributed all over the Earth. However, how to exploit gas hydrates with safe, effective and economical methods is still being pursued [2,3,4]. The suggested methods being explored for hydrate production mainly include depressurization [5,6,7,8,9,10], thermal stimulation [11,12,13,14,15] and inhibitor injection [16,17,18,19]. Recently, other methods such as CO2 replacement [20,21,22], gas lift [23], and huff and puff method [24] have been the focus of researchers. Among the various methods, depressurization is considered the most promising technique for producing gas from methane hydrate reservoirs [5,13,16].
Experimental and numerical investigations on NGH dissociation by depressurization have been reported [5,6,7,8,9,10]. Yousif et al. [7,25] performed hydrate dissociation experiments induced by depressurization at ice point in Berea Sandstone cores, and then proposed a moving boundary model of the dissociating front. The one-dimensional model assumed that the entire system was under isothermal conditions, and it was proved to fit to the hydrate dissociation measurements. Hiroyuki et al. [26] expressed the dissociation model as a function of heat transfer and mass transfer, and the heat transfer from the surroundings was regarded as the dominant factor. The model, which was evaluated using several depressurization experiments under various production pressure conditions, was demonstrated to be able to predict the characteristics quantitatively during the gas production process from cores. Chuang et al. [27] used a one-dimensional linear model suggested by Makogon to present a parametric study of natural gas production in a confined reservoir by a depressurization well. The results of the study showed that the gas production rate was a sensitive function of well pressure, reservoir temperature and zone permeability. Sun et al. [28] developed a non-isothermal one-dimension simulator to simulate two cases of gas production from sediments by depressurization, and found that laboratory-scale experiments were generally dissociation-controlled, but the field-scale processes were typically flow-controlled. Kono et al. [29] studied the dissociation kinetics of the hydrate decomposition within various custom-design porous sediments by the depressurizing method, and concluded that the dissociation rate was related to sediment properties. However, till now there are no reports on hydrate formation and dissociation with free gas by depressurization.
Based on currently available data from site measurements in the Shenhu Area of the South China Sea [30,31], in this work the hydrate formation and dissociation with free gas by depressurization using a one-dimensional experimental apparatus is studied to discuss the effect of initial saturation and dissociation pressure on gas production.
2. Experimental Section
2.1. Experimental Apparatus
The schematic of the experimental apparatus in this work is shown in Figure 1. The hydrate vessel, as the most important unit, is immersed in a constant temperature water bath with the control range from −15 to 30 °C and an accuracy of ±0.1 °C. The vessel is made of 316 stainless steel, with a pressure rating up to 25 MPa. The inside of the vessel is cylindrical, with a diameter of 38 mm and a length of 250 mm. Four resistance thermometers (Pt100, −20–200 °C, ±0.02) and four pairs of electrodes are placed at 5, 75, 145 and 215 mm from the inlet, and placed on the inner surface of the vessel, are used for measuring the temperatures and resistances of four parts of the vessel. Two pressure transducers, (TRAFAG 8251, 0–25 MPa, ±0.1%), are equipped to measure the inlet and outlet pressures. The boost pump and compressor help to pump methane gas with a purity of 99.9% from a gas cylinder into the gas container through a gas filter. The gas container can supply gas for the vessel with the help of a proportional integral derivative (PID) controller. The metering pump helps to inject liquids with the flow range of 0–9.99 mL/min. A backpressure regulator (the pressure range of 0–30 MPa, ±0.02 MPa) connected to the outlet of the vessel is used to control the pressure of the outlet. The gas and water produced from methane hydrate are separated by the water/gas separator, and then they are measured at atmospheric pressure by using a gas meter and a balance, respectively. The gas meter is D07-11CM, 0–10 L/min, ±2%, from Seven Star Co. The balance is a Sartorius BS2202S, 0–4200 g, ±0.01 g. Time variations of temperature, pressure, gas and water volumes produced are recorded by the data acquisition system.
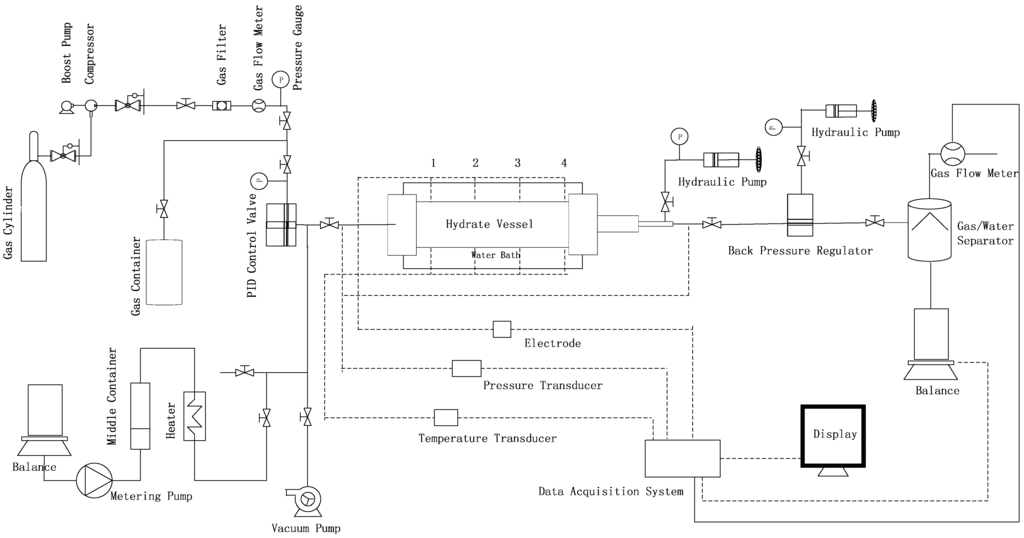
Figure 1.
Schematic of the experimental apparatus.
2.2. Preparation of the Methane Hydrate Samples
The results from the Shenhu Area show that the pressures of hydrate layer are in the ranges of 12.7–14.6 MPa, temperatures are in the range of 8.6–16.2 °C, sediment porosities are in the range of 33%–48%, and hydrate saturations are in the range of 1.0–47.3% with an average value of around 22%. In this work, the experimental information, such as pressure, temperature, saturation, porous media, are totally in accordance with the Shenhu Area. Dry sands with the size range of 300–450 μm are tightly packed in the vessel, with a porosity of approximately 48%. The vessel is emptied twice to remove the residual air and other impurities. Then, deionized water is injected into the vessel by the metering pump. After the temperature of the water bath is set to a predetermined temperature required for the gas hydrate synthesis, which is 9.0 °C in the current research, methane gas is injected slowly into the vessel until the pressure in the vessel reaches approximately 20 MPa, which is sufficiently higher than the equilibrium hydrate dissociation pressure in the sediment at the working temperature of 9.0 °C. After that, the vessel is closed as an isochoric system to form the hydrate samples. The formation process lasts for 7–15 days until the pressure and hydrate saturation in the vessel corresponds to the geological data of gas hydrate deposits in the South China Sea. During the formation process, the temperature, pressure and resistance in the vessel are recorded at 5 min intervals.
2.3. Depressurization Dissociation
The hydrate dissociation by depressurization is carried out in the following procedure: first, the pressure setting for the backpressure regulator is slightly higher than that in the vessel. Then the outlet valve is opened, and the backpressure regulator is turned down to make the outlet pressure decrease gradually to a predetermined pressure (dissociation pressure). At that pressure, the dissociation of the hydrate lasts until there is little gas released. During the entire dissociation process, the temperature, pressure and resistance in the vessel, the gas and water production are recorded at 10 s intervals. After the dissociation process, the system pressure is gradually vented to atmospheric pressure.
3. Results and Discussion
As shown in Table 1, six experimental runs are chosen to investigate the effect of hydrate saturation and production pressure on hydrate dissociation. Runs 1–3 are conducted at different saturations, and Runs 4–6 are conducted at different dissociation pressures. Using the fugacity model of Li et al. [32], the equilibrium hydrate dissociation pressure in the sediment at the working temperature of 9 °C is calculated, and the calculated value is 6.5 MPa. Thus the dissociation pressure of the former three runs is set at 6.0 MPa which is slightly lower than the equilibrium pressure. The hydrate saturation is calculated according to the mass balance. The volume of the water and gas before hydrate formation is equal to the total volume of water, gas, and hydrate after hydrate formation, as expressed in Equation (1):

Table 1.
Summary of experimental conditions and results.
| Run 1 | Run 2 | Run 3 | Run 4 | Run 5 | Run 6 | |
|---|---|---|---|---|---|---|
| Initial pressure (MPa) | 12.8 | 13.5 | 15.2 | 13.7 | 13.7 | 13.8 |
| Inner temperature (°C) | 9.1 | 9.1 | 9.0 | 9.0 | 8.9 | 9.0 |
| Equilibrium pressure (MPa) | 6.3 | 6.3 | 6.3 | 6.3 | 6.3 | 6.3 |
| Hydrate saturation (%) | 35.5 | 23.3 | 15.6 | 25.3 | 27.0 | 25.7 |
| Water saturation (%) | 12.3 | 21.8 | 28.2 | 31.5 | 29.2 | 30.5 |
| Production pressure (MPa) | 6.0 | 6.0 | 6.0 | 5.0 | 5.5 | 6.0 |
The volume of gas is calculated by the pressure and temperature in the vessel using the P-R Equation. Before using P-R Equation, it assumes that there is 5.75 mol of water in 1 mol of methane hydrate, and the density of methane is 0.94 g/cm3 and water in the vessel is incompressible.
The hydrate samples with different saturations for production model are obtained by injecting same volumes of methane, while stopping the hydrate formation process at different pressure.
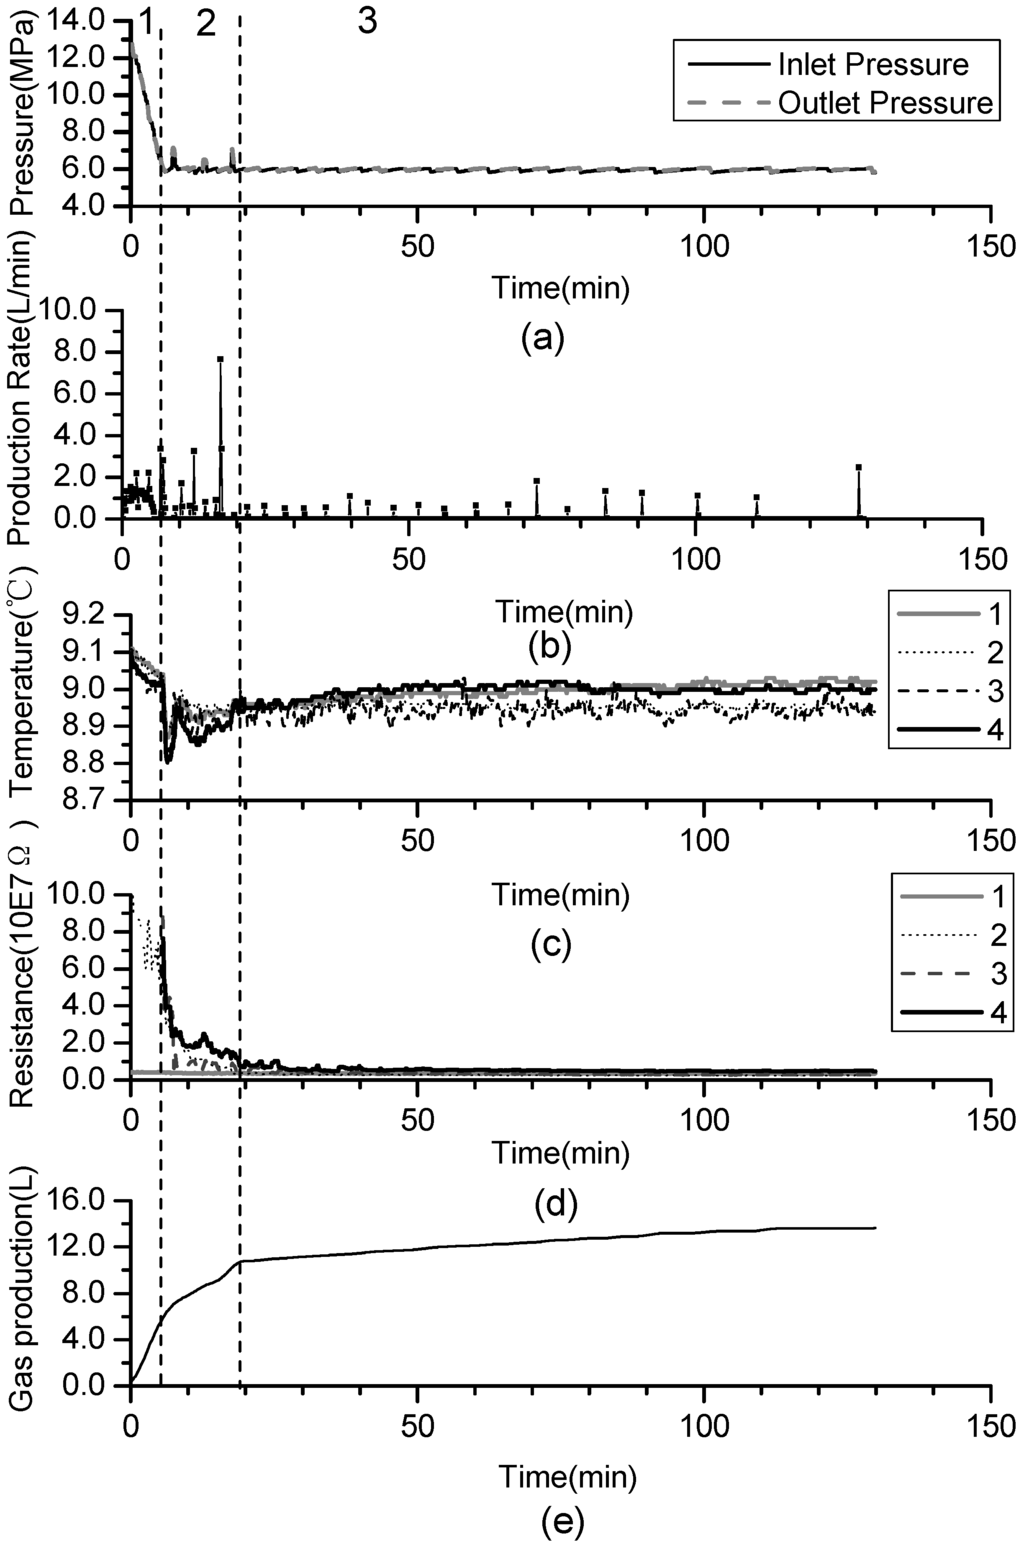
Figure 2.
Time variation of dissociation characteristic for Run 1: (a) pressure profiles; (b) production rate; (c) temperature profiles; (d) resistance profiles; (e) cumulative gas production.
A similar tendency of dissociation characteristics is achieved in all experiments. To investigate the production behavior, Run 1 is the reference case in this study. Figure 2 shows time variation of five parameters such as: (a) pressure profiles, (b) production rate, (c) temperature profiles, (d) resistance profiles, (e) cumulative gas production in run 1. Due to the fact hydrate dissociation is an endothermic reaction, the temperature variation can be used to characterize the process. The resistance can be used to characterize the change of the gas hydrate reservoir [33]. Because the resistivity of gas hydrate is greater than that of water, with the dissociation of the hydrate the resistance decreases. The temperatures and resistances at four points change almost simultaneously because of the high permeability and length limit of the porous media in the experiments induce that the hydrate dissociates identically at each point in this vessel, and it further indicates that the effect of gas flow during production process can be ignored.
As shown in Figure 2, the process of the hydrate dissociation induced by depressurization in this work can be divided into three main phases:
- (1)
- Phase 1: free gas release process. With depressurization, the free gas is released at first, then temperatures and resistances decline slightly, while the gas production increases sharply. About 40% of the cumulative gas is produced in this section.
- (2)
- Phase 2: rapid hydrate dissociation process. When the pressure drops rapidly to 6 MPa, the gas production rate increases suddenly, while temperatures and resistances simultaneously decrease sharply. The drop of the temperature accompanies with that gas production rate increases suddenly and the curve of the cumulative gas production rises sharply. Then, temperatures increase gradually because of the heat transferred from the water bath. Meanwhile, the resistances drop continuously, and this indicates that the hydrate keeps dissociating. About 40% of cumulative gas is produced in this phase.
- (3)
- Phase 3: slow hydrate dissociation process. Gas production is unconspicuous in this phase. Temperatures and resistances display few changes, and the curve of the cumulative gas production tends to flatten. About 20% of cumulative gas is produced in this section, and the phase lasts for a long time.
According to the work on kinetics of methane hydrate dissociation by Kim and Bishnoi [34], the driving force for hydrate dissociation is the pressure difference between equilibrium pressure and dissociation pressure. The equilibrium pressure decreases as temperature drops, which leads to a decrease in the driving force. As shown in the curve of the cumulative gas production, gas production increases rapidly during Phase 2. The hydrate dissociation consumes the heat in the core rapidly, causing the temperature to decrease sharply. Subsequently, the decrease of the dissociation driving force induces the decrease of the gas production rate. Then the temperatures recover to the surrounding temperature because the heat transferred from the surroundings exceeds that consumed for decomposition, and it leads to a gas production rate rise again with the increase of driving force. Thus, the curve of cumulative gas production increases rapidly, then slows down, and then rapidly increases again in Phase 2. In Phase 3, the hydrate production rate decreases due to the hydrate becomes less and less.
Figure 3, Figure 4 and Figure 5 show changes of temperature, pressure, and the cumulative gas production with time for Runs 1–3. Because the temperatures at four points change almost the same, the temperature of the fourth point is used for describing the system temperature in the last discussion. The amount of cumulative gas is almost the same in the three runs. Thus, the higher saturation means there is less free gas in these experiments. The quantities of gas produced during different sections are shown in Table 2. Gases produced in Phases 2 and 3 are totally from the hydrate dissociation. During Phase 2, 67% of the hydrates dissociate in Run 1, 75% in Run 2, and 83% in Run 3. The minimum temperature-drops which are caused by endothermic dissociation are all 8.8 °C in these three runs. Additionally, the run with the higher saturation takes more time for the temperature recovery. Therefore, the figures also shows that as the saturation increases, the proportion of hydrate dissociating during Phase 2 will decrease. Thus, it leaves more hydrates dissociate in the third phase with slower rate, and additionally the well temperature recovers slowly.
Table 2.
Gas production of different sections for Runs 1–3.
| Run 1 | Run 2 | Run 3 | |
|---|---|---|---|
| Gas production in Phase 1 (%) | 40 | 60 | 70 |
| Gas production in Phase 2 (%) | 40 | 30 | 25 |
| Gas production in Phase 3 (%) | 20 | 10 | 5 |
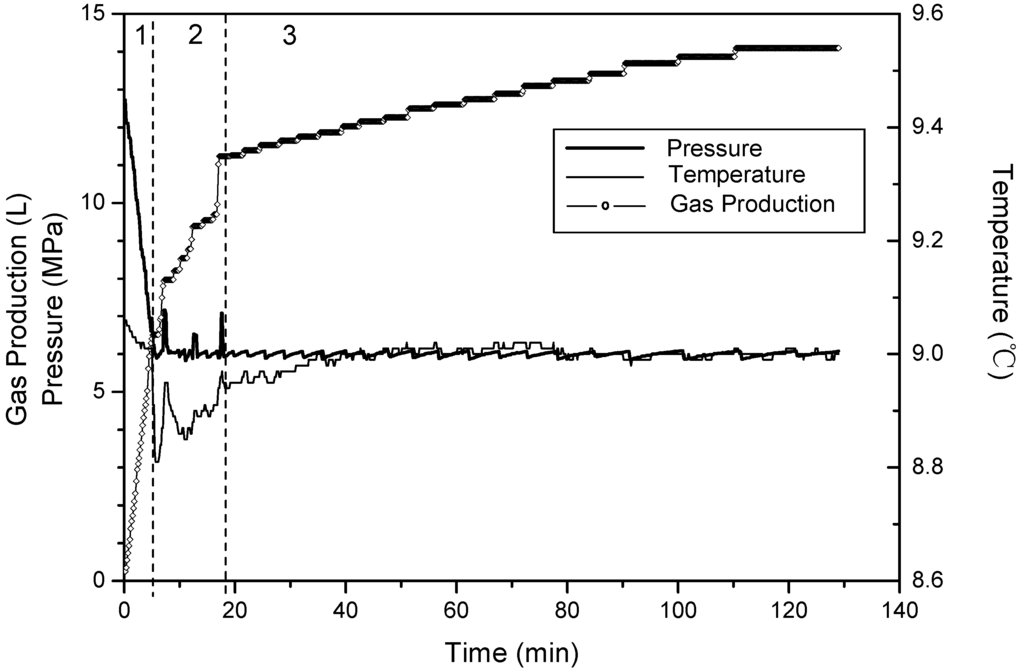
Figure 3.
Time variation of pressure and temperature and gas production for Run 1.
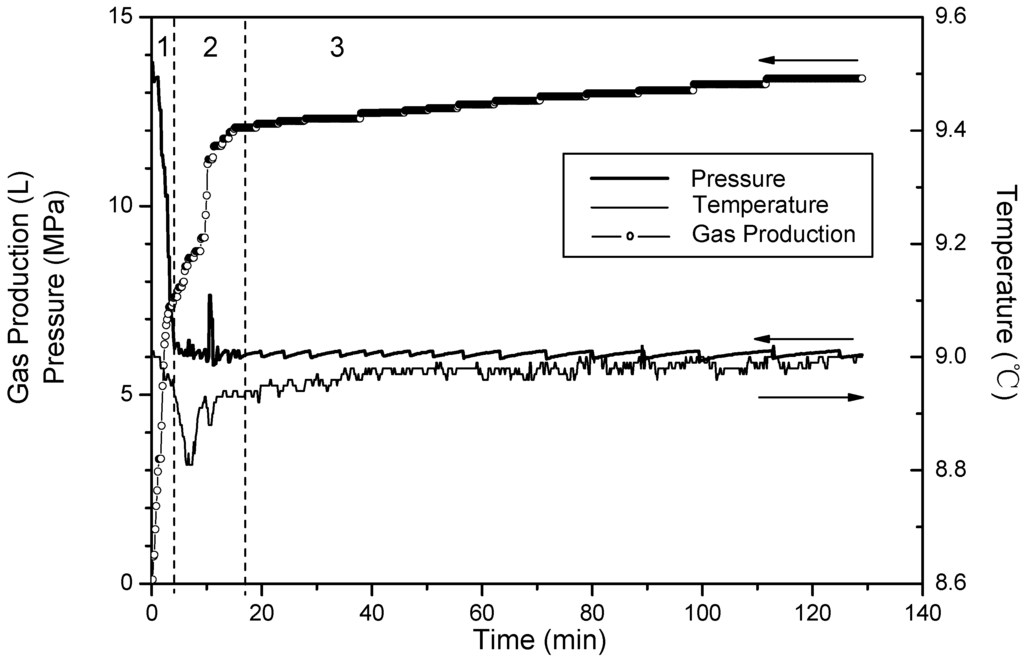
Figure 4.
Time variation of pressure and temperature and gas production for Run 2.
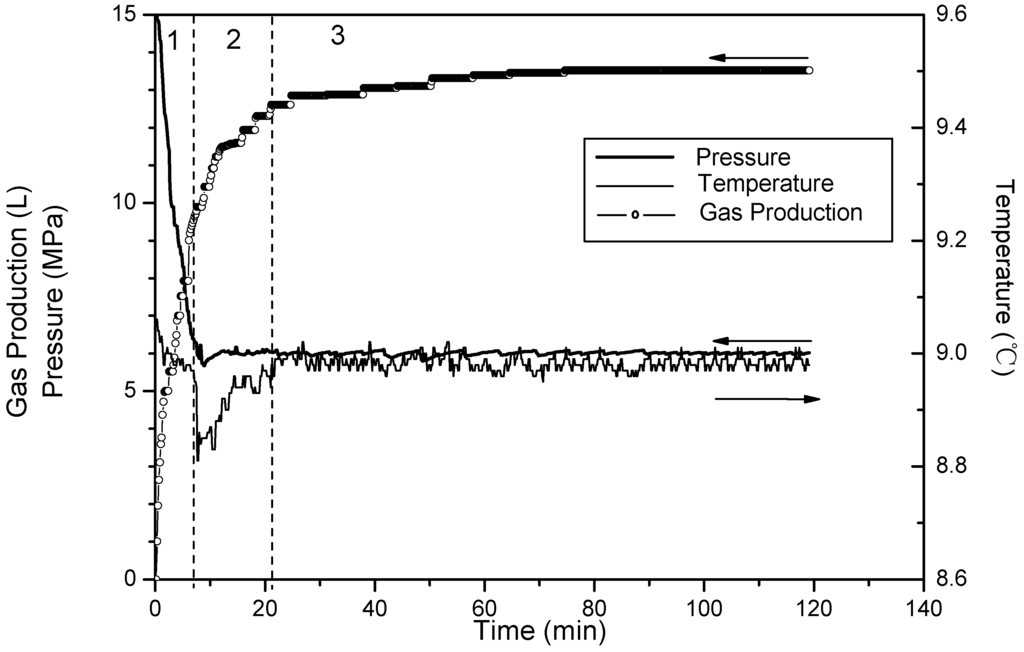
Figure 5.
Time variation of pressure and temperature and gas production for Run 3.
From the above discussion, the hydrate will take a long time to dissociate if it is produced at high saturation and high pressure. In a field-scale reservoir, it might be difficult to fully exploit hydrate only by depressurization. The dissociation rate decreases as the temperature drops caused by hydrate dissociation, while it increases as the temperature rises caused by reduction of heat consumption for dissociation. Therefore, in a field-scale reservoir, it can be suggested that if the hydrate production process by depressurization is into its Phase 3, the production behavior should stop. It is also suggested that the production should restart after the temperature rises back by heat transfer from the surroundings.
Corresponding to Runs 4–6, Figure 6, Figure 7 and Figure 8 show changes of temperature, pressure, and the cumulative gas production with time. The hydrate saturation and the amount of free gas are close in these three runs. The minimum temperature is 8.4 °C in Run 4, 8.5 °C in Run 5, and 8.8 °C in Run 6, and the temperature rises back slowly in sequence. This indicates that the temperature-drop increases as the dissociation pressure decreases. With the pressure drop, the temperature drops correspondingly. Because a pressure drop leads to the hydrate dissociation, the heat in the core is consumed, thus the temperatures in the vessel drop. Furthermore, a large temperature drop enhances dissociation zone heat absorption from surroundings, therefore the temperature recovers quickly in the experiments with low dissociation pressure.
In Phase 2, more than 95% of the hydrate dissociates either in Run 4 or Run 5, while only 70% in Run 6. Compared to the differences of dissociation characteristic between Run 5 and Run 6, the difference between Run 4 and Run 5 is obvious. The enhancement of the driving force resulting from decreasing pressure can increase the dissociation rate to further shorten the reaction time. However, the trend is more prominent when the dissociation pressure decreases from 6 MPa to 5.5 MPa. Under the condition of 6 MPa, due to the fact the heat for hydrate dissociation in the core is less, and the low temperature difference between the dissociation zone and surroundings is negative for the heat transfer, thus, the dissociation rate slows dramatically.
Figure 6.
Time variation of pressure and temperature and gas production for Run 4.
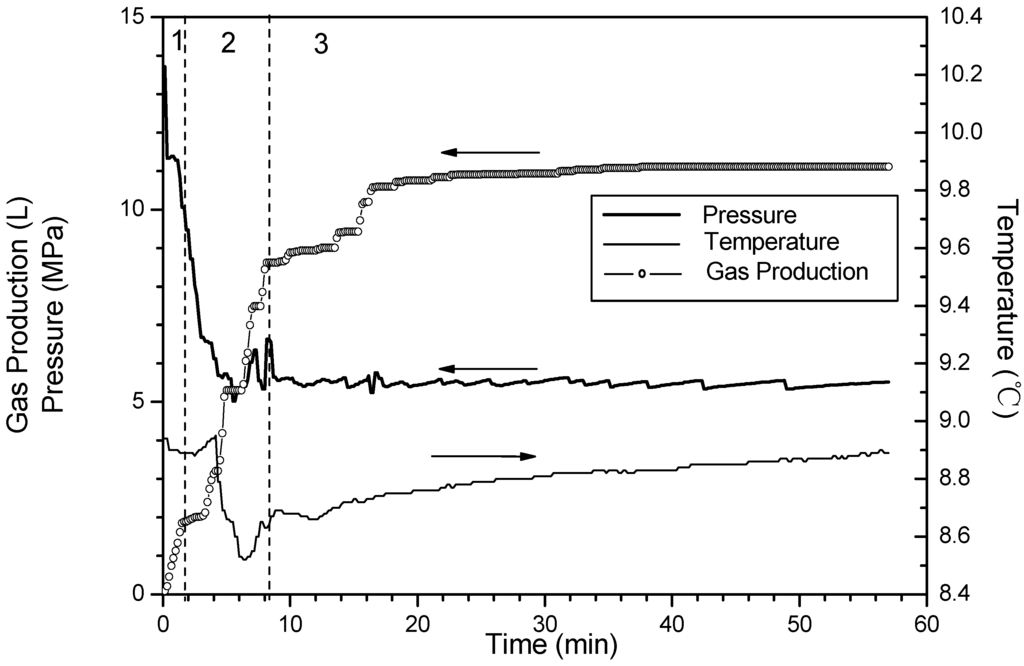
Figure 7.
Time variation of pressure and temperature and gas production for Run 5.
Additionally, when the dissociation pressures are decreased to 5.5 MPa and 5.0 MPa, respectively, the temperature rises slightly before it drops sharply. A similar phenomenon has been reported by Kneafsey et al. [35] and the slight rise of the temperature is caused by forming the secondary hydrate before dissociation in depressurization experiments. Because the pressure in the reactor is still higher than the equilibrium hydrate dissociation pressure during this period, the secondary hydrate formation is a result of the water flow. It is attributed to the fact that, in the formation process before the beginning of the hydrate dissociation, as the forming hydrate gradually increases, the formerly forming hydrate adsorbs and encases some water, and thus, this hinders the contact of methane gas with the enclosed water for further hydrate formation. This phenomenon is called the “Loricae Effect” [36]. However, in the depressurizing process for the hydrate dissociation, the water encased in the hydrate is driven out to be free water flowing toward the outlet under the effect of the driving force. This flowing free water contacts methane gas in the sediment to form the hydrate again, causing the rise of the system temperature as a result of the effect of the heat released from the hydrate formation [37]. However, the phenomenon is not clear at the condition of 6.0 MPa. It is indicated that the decrease of dissociation pressure may aggravate the secondary hydrate formation.
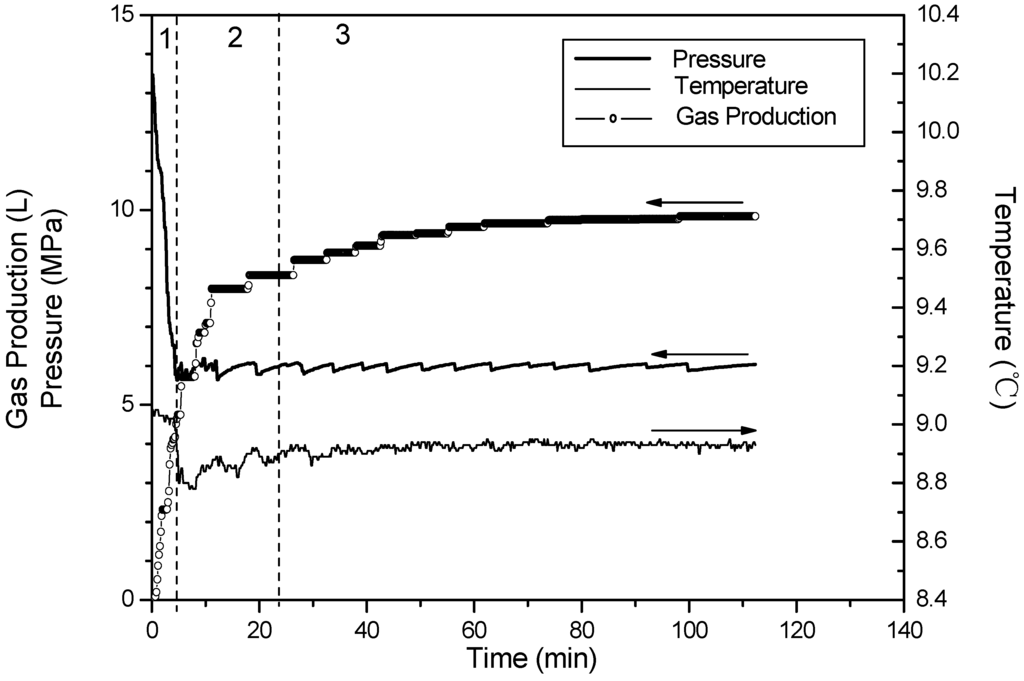
Figure 8.
Time variation of pressure and temperature and gas production for Run 6.
4. Conclusions
Methane hydrate dissociation caused by depressurization has been studied based on geological data of the Shenhu Area in this work. Time variations of pressure, temperature, resistance and cumulative gas production during the depressurization process are gathered to indicate the dissociation characteristics, and the effects of different hydrate saturation and dissociation pressure on methane hydrate dissociation have been discussed. The following conclusions have been reached:
- (1)
- The experimental process of hydrate dissociation induced by depressurization can be divided into three phases. The first one is the free gas release phase. In this phase, the gas production increases sharply, temperature and resistance decrease slightly as depressurization occurs. The second one is the rapid hydrate rapid dissociation phase. In this phase temperature and resistance decrease sharply at the beginning, then temperature recovers gradually because of the heat transfer, while resistance goes down gradually, and the production rate is large. The third one is the slow hydrate dissociation phase. In this phase, temperature and resistance experience few changes, but the gas production increases slowly.
- (2)
- The initial hydrate saturation can affect the amount of hydrate dissociation in the different phases. It shows that as the saturation increases, the proportion of hydrate dissociating during the rapid dissociation phase will decrease, thus, it allows more hydrates to dissociate in the third stage with slower rate and the temperature recovers slowly as well.
- (3)
- The dissociation rate increases by lowering the dissociation pressure, and this tendency is more apparent when the dissociation pressure approaches the equilibrium. At a lower dissociation pressure, more heat in the core can be applied for dissociation. Moreover, the dissociation pressure can also affect the temperature-drop during the hydrate dissociation process. Furthermore, the decrease of dissociation pressure may negatively affect the secondary hydrate formation.
Acknowledgments
This work was supported by National Natural Science Foundation of China (51076155)) and Science & Technology Program of Guangdong Province (2009B050600006), which are gratefully acknowledged.
References
- Sloan, E.D. Clathrate Hydrates of Nature Gas; Marcel Dekker: New York, NY, USA, 1998. [Google Scholar]
- Milkov, A.V. Global estimates of hydrate-bound gas in marine sediments: How much is really out there? Earth Sci. Rev. 2004, 66, 183–197. [Google Scholar] [CrossRef]
- Collett, T.S. Gas hydrates as a future energy resource. Geotimes 2004, 49, 24–27. [Google Scholar]
- Klauda, J.B.; Sandler, S.I. Predictions of gas hydrate phase equilibria and amounts in natural sediment porous media. Mar. Petrol. Geol. 2003, 20, 459–470. [Google Scholar] [CrossRef]
- Moridis, G.J.; Reagan, M.T. Strategies for Gas Production From Oceanic Class 3 Hydrate Accumulations. In Proceedings of the Offshore Technology Conference, Houston, TX, USA, 30 April–3 May 2007.
- Kurihara, M.; Funatsu, K.; Ouchi, H.; Masuda, Y.; Narita, H. Investigation on applicability of methane hydrate production methods to reservoirs with diverse characteristics. In Proceedings of the 5th International Conference on Gas Hydrates, Trondheim, Norway, 13–16 June 2005; pp. 714–725.
- Yousif, M.H.; Abass, H.H.; Selim, M.S.; Sloan, E.D. Experimental and theoretical investigation of methane-gas-hydrate dissociation in porous media. SPE Reserv. Eng. 1991, 6, 69–76. [Google Scholar] [CrossRef]
- Moridis, G.J.; Collett, T.S.; Boswell, R.; Kurihara, M.; Reagan, M.T.; Koh, C.; Sloan, E.D. Toward production from gas hydrates: Current status, assessment of resources, and simulation-based evaluation of technology and potential. SPE Reserv. Eval. Eng. 2009, 12, 745–771. [Google Scholar] [CrossRef]
- Su, K.H.; Sun, C.Y.; Yang, X.; Chen, G.J.; Fan, S.S. Experimental investigation of methane hydrate decomposition by depressurizing in porous media with 3-Dimension device. J. Nat. Gas Chem. 2010, 19, 210–216. [Google Scholar] [CrossRef]
- Yang, X.; Sun, C.Y.; Su, K.H.; Yuan, Q.; Li, Q.P.; Chen, G.J. A three-dimensional study on the formation and dissociation of methane hydrate in porous sediment by depressurization. Energy Convers. Manag. 2012, 56, 1–7. [Google Scholar] [CrossRef]
- Li, G.; Tang, L.; Huang, C.; Feng, Z.; Fan, S. Thermodynamic evaluation of hot brine stimulation for natural gas hydrate dissociation. J. Chem. Ind. Eng. (China) 2006, 57, 2033–2038. [Google Scholar]
- Li, G.; Li, X.S.; Tang, L.G.; Li, Q.P. Control Mechanisms for Methane Hydrate Production by Thermal Stimulation. In Proceedings of the 6th International Conference on Gas Hydrates (ICGH 2008), Vancouver, Canada, 6–10 July 2008.
- Kawamura, T.; Ohtake, M.; Sakamoto, Y.; Yamamoto, Y.; Haneda, H.; Komai, T.; Higuchi, S. Experimental Study on Steam Injection Method Using Methane Hydrate Core Samples. In Proceedings of the Seventh (2007) ISOPE Ocean Mining Symposium, Lisbon, Portugal, 1–6 July 2007; International Society Offshore& Polar Engineers: Lisbon, Portugal, 2007; pp. 83–86. [Google Scholar]
- Pang, W.X.; Xu, W.Y.; Sun, C.Y.; Zhang, C.L.; Chen, G.J. Methane hydrate dissociation experiment in middle-sized quiescent reactor using thermal method. Fuel 2009, 88, 497–503. [Google Scholar] [CrossRef]
- Yang, X.; Sun, C.Y.; Yuan, Q.; Ma, P.C.; Chen, G.J. Experimental study on gas production from methane hydrate-bearing sand by hot-water cyclic injection. Energy Fuel 2010, 24, 5912–5920. [Google Scholar] [CrossRef]
- Kawamura, T.; Yamamoto, Y.; Ohtake, M.; Sakamoto, Y.; Komai, T.; Haneda, H. Experimental Study on Dissociation of Hydrate Core Sample Accelerated by Thermodynamic Inhibitors for Gas Recovery from Natural Gas Hydrate. In Proceedings of the 5th International Conference on Gas Hydrate, Trondheim, Norway, 12–16 June 2005; pp. 3023–3028.
- Li, G.; Li, X.S.; Tang, L.G.; Zhang, Y. Experimental investigation of production behavior of methane hydrate under ethylene glycol injection in unconsolidated sediment. Energy Fuel 2007, 21, 3388–3393. [Google Scholar] [CrossRef]
- Najibi, H.; Chapoy, A.; Haghighi, H.; Tohidi, B. Experimental determination and prediction of methane hydrate stability in alcohols and electrolyte solutions. Fluid Phase Equilibria 2009, 275, 127–131. [Google Scholar] [CrossRef]
- Li, G.; Li, X.S.; Tang, L.; Zhang, Y.; Feng, Z.; Fan, S. experimental investigation of production behavior of methane hydrate under ethylene glycol injection. J. Chem. Ind. Eng. (China) 2007, 58, 2067–2074. [Google Scholar]
- Ota, M.; Morohashi, K.; Abe, Y.; Watanabe, M.; Smith, R.L.; Inomata, H. Replacement of CH4 in the hydrate by use of liquid CO2. Energy Convers. Manag. 2005, 46, 1680–1691. [Google Scholar] [CrossRef]
- Zhou, X.T.; Fan, S.S.; Liang, D.Q.; Du, J.W. Determination of appropriate condition on replacing methane from hydrate with carbon dioxide. Energy Convers. Manag. 2008, 49, 2124–2129. [Google Scholar] [CrossRef]
- Ota, M.; Abe, Y.; Watanabe, M.; Smith, R.L.; Inomata, H. Methane recovery from methane hydrate using pressurized CO2. Fluid Phase Equilibria 2005, 228, 553–559. [Google Scholar] [CrossRef]
- Hamaguchi, R.; Nishimura, Y.; Matsukuma, Y.; Minemoto, M. A Fluid Dynamic Study on Recovery System of Methane Hydrate. In Proceedings of the 5th International Conference on Gas Hydrate, Trondheim, Norway; 2005; p. 1005. [Google Scholar]
- Li, X.S.; Wang, Y.; Li, G.; Zhang, Y.; Chen, Z.Y. experimental investigation into methane hydrate decomposition during three-dimensional thermal huff and puff. Energy Fuel 2011, 25, 1650–1658. [Google Scholar] [CrossRef]
- Yousif, M.H.; Li, P.M.; Selim, M.S.; Sloan, E.D. Depressurization of natural gas hydrates in Berea sandstone cores. J. Inclus. Phenom. Mol. Recog. Chem. 1990, 8, 71–88. [Google Scholar] [CrossRef]
- Oyama, H.; Konno, Y.; Masuda, Y.; Narita, H. Dependence of depressurization-induced dissociation of methane hydrate bearing laboratory cores on heat transfer. Energy Fuel 2009, 23, 4995–5002. [Google Scholar] [CrossRef]
- Ji, C.; Ahmadi, G.; Smith, D.H. Natural gas production from hydrate decomposition by depressurization. Chem. Eng. Sci. 2001, 56, 5801–5814. [Google Scholar] [CrossRef]
- Sun, X.; Nanchary, N.; Mohanty, K.K. 1-D modeling of hydrate depressurization in porous media. Transp. Porous Media 2005, 58, 315–338. [Google Scholar] [CrossRef]
- Kono, H.O.; Narasimhan, S.; Song, F.; Smith, D.H. Synthesis of methane gas hydrate in porous sediments and its dissociation by depressurizing. Powder Technol. 2002, 122, 239–246. [Google Scholar] [CrossRef]
- Lu, J.A.; Yang, S.X.; Wu, N.Y.; Zhang, G.X.; Zhang, M.; Liang, J.Q. Well logging evaluation of gas hydrates in Shenhu area, south China sea. Geoscience 2008, 22, 447–451. [Google Scholar]
- Wu, N.Y.; Zhang, H.G.; Yang, S.X.; Liang, J.Q.; Wang, H.B. Preliminary discussion on natural gas hydrate (NGH) reservoir system of Shenhu area, north slope of south China sea. Nat. Gas Ind. 2007, 27, 1–6. [Google Scholar]
- Li, X.S.; Zhang, Y.; Li, G.; Chen, Z.Y.; Yan, K.F.; Li, Q.P. Gas hydrate equilibrium dissociation conditions in porous media using two thermodynamic approaches. J. Chem. Thermodyn. 2008, 40, 1464–1474. [Google Scholar] [CrossRef]
- Zhou, X.T.; Fan, S.S.; Liang, D.Q.; Wang, D.L.; Huang, N.S. Use of electrical resistance to detect the formation and decomposition of methane hydrate. J. Nat. Gas Chem. 2007, 16, 399–403. [Google Scholar] [CrossRef]
- Kim, H.C.; Bishnoi, P.R.; heidemann, R.A.; Rivzi, S.S.H. kinetics of methane hydrate decomposition. Chem. Eng. Sci. 1987, 42, 1645–1653. [Google Scholar] [CrossRef]
- Kneafsey, T.J.; Tomutsa, L.; Moridis, G.J.; Seol, Y.; Freifeld, B.M.; Taylor, C.E.; Gupta, A. Methane hydrate formation and dissociation in a partially saturated core-scale sand sample. J. Pet. Sci. Eng. 2007, 56, 108–126. [Google Scholar] [CrossRef]
- Stern, L.A.; Kirby, S.H.; Durham, W.B. Peculiarities of methane clathrate hydrate formation and rheology, and the associated superheating of water ice. Science 1996, 273, 1843–1848. [Google Scholar] [CrossRef]
- Li, X.S.; Zhang, Y.; Li, G.; Chen, Z.Y.; Wu, H.J. Experimental investigation into the production behavior of methane hydrate in porous sediment by depressurization with a novel three dimensional cubic hydrate simulator. Energy Fuel 2011, 25, 4497–4505. [Google Scholar] [CrossRef]
© 2012 by the authors; licensee MDPI, Basel, Switzerland. This article is an open access article distributed under the terms and conditions of the Creative Commons Attribution license (http://creativecommons.org/licenses/by/3.0/).