1. Introduction
When the World is seeking an environmentally benign fuel source, supercritical techniques can be a good support for other available technologies. Due to human activities of mass production, mass consumption, and mass waste since the early twentieth century, environmental issues such as global warming and acid rain have become increasingly serious problems in the World. Environmentally friendly biomass resources such as lignocelluloses could be utilized effectively as an alternative to fossil resources [
1]. Biomass, as an energy source, has two striking characteristics. Firstly, biomass is the only renewable organic resource and is also one of the most abundant resources. Secondly, biomass fixes carbon dioxide in the atmosphere by photosynthesis [
2]. Due to the limitations of homogeneous and heterogeneous catalytic reactions for biodiesel production from biomass, a sustainable and environmentally friendly technology using supercritical alcohol (SCA) has been receiving considerable attention. The liquid products in alcohol can be used directly as liquid fuel because alcohol itself is a good fuel [
3]. Supercritical fluids are regarded as promising solvents for industrial use in the coming decades and their special physical properties have caught worldwide attention for a long period of time [
1,
4]. Several reviews have highlighted developments in theory, application, and instrumentation [
5,
6]. Supercritical fluids are also extremely compressible media, being both dense and compressible at the same time; their heat diffusion coefficient is generally very small compared to standard gases, while their mass diffusion coefficients are generally much larger than those of most liquids [
7]. The advantages of supercritical fluid (SCF) technology in biodiesel production compared to conventional catalytic reactions are enormous and vital in solving issues involving energy security in the future. The use of supercritical fluid technology as a sustainable route for biodiesel production has vast potential compared to the catalytic processes [
8].
SCA technology is a noncatalytic process which makes separation and purification of biodiesel relatively easy and simple. Supercritical fluids (SCF) have the properties of both liquid and gaseous elements. Having a density close to liquids, the supercritical fluid has the ability to dissolve many components, whereas the high diffusivity and low viscosity of the supercritical fluid also enable it to behave like a gas. Such mobility properties of the supercritical fluid tend to maximize the yields of the products. Along with this major advantage of SCF, others have been mentioned in the referred papers [
9,
10]. Supercritical ethanol (SCE,
Tc = 513.9 K,
Pc = 61.4 bars) and supercritical methanol (SCM,
Tc = 512.6 K,
Pc = 80.9 bars) have lower critical temperatures and pressures than water (
Tc = 647.1 K,
Pc = 220.6 bars), which shows that SCA can offer milder conditions for the reactions [
11,
12,
13]. In addition, alcohols are expected to readily dissolve relatively high molecular weight products from cellulose, hemicelluloses, and lignin due to their high dielectric constants when compared with those of water. Further, methanol and ethanol are ubiquitous solvents. The alcohols may be alternatives to water as supercritical solvents considering their less corrosive and aggressive chemical nature, lower critical temperatures and pressures, and reasonably high dielectric constants [
1,
11,
12].
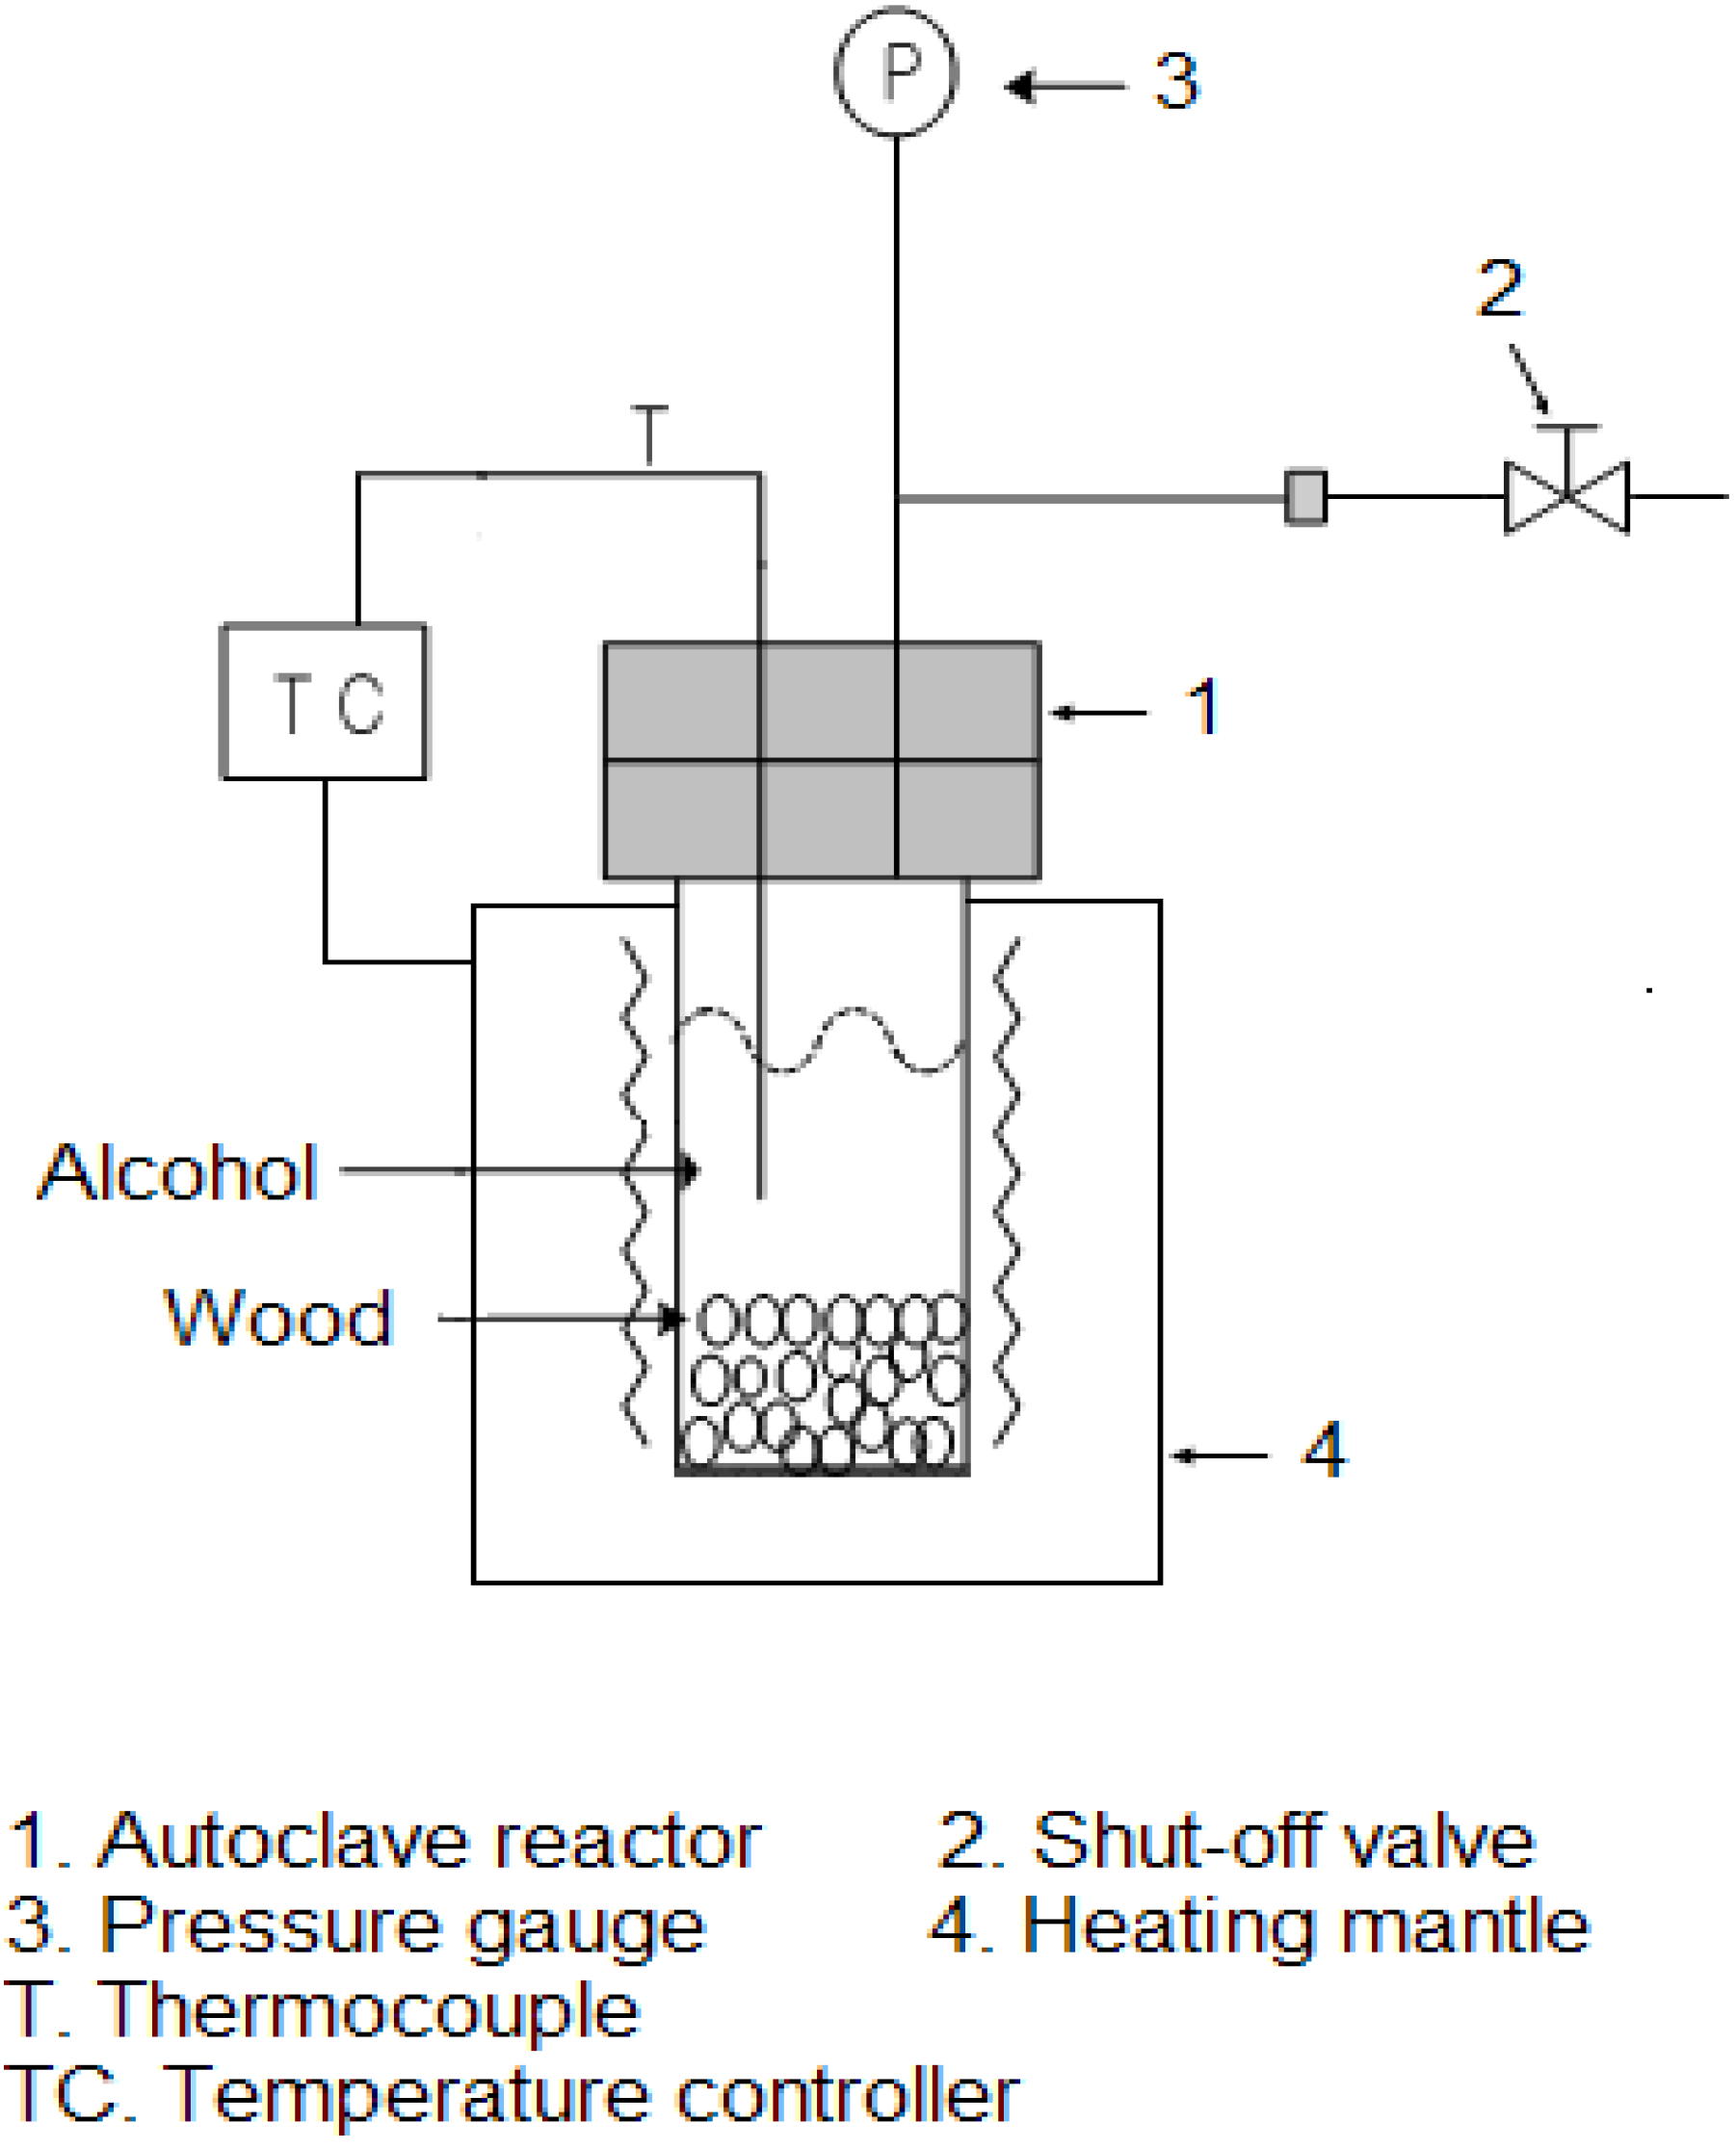
Wood and other forms of biomass can be used in various ways to provide energy through combustion, gasification, pyrolysis,
etc. [
14]. SCA have not been studied extensively so far; however, SCA, like SCE and SCM, shows some promising results for better conditions. High conversions (80%–100%) were obtained when the reaction was conducted in SCA [
15]. The kinetics of wood degradation using SCA were studied in this work, but factors including hard reaction conditions, complicated compositions of degradation products, and difficulty of continuous operation tend to limit the kinetic study on the wood degradation in SCF. For SCA, although they are important cosolvents and excellent substitutes for supercritical water [
16], questions regarding their intermolecular forces, microscopic structure, dynamic property, and hydrogen bonding still remain unanswered. In this work, the kinetics of wood decomposition has been analyzed to make a comparative study of the activation energy using various kinetic analysis methods. This paper also includes the analysis of the liquid products obtained from this work. The analysis of the characteristics of the liquid products on increasing reaction temperature and time has been performed through Gas Chromatography Mass Spectrometry (GC-MS).
4. Results and Discussion
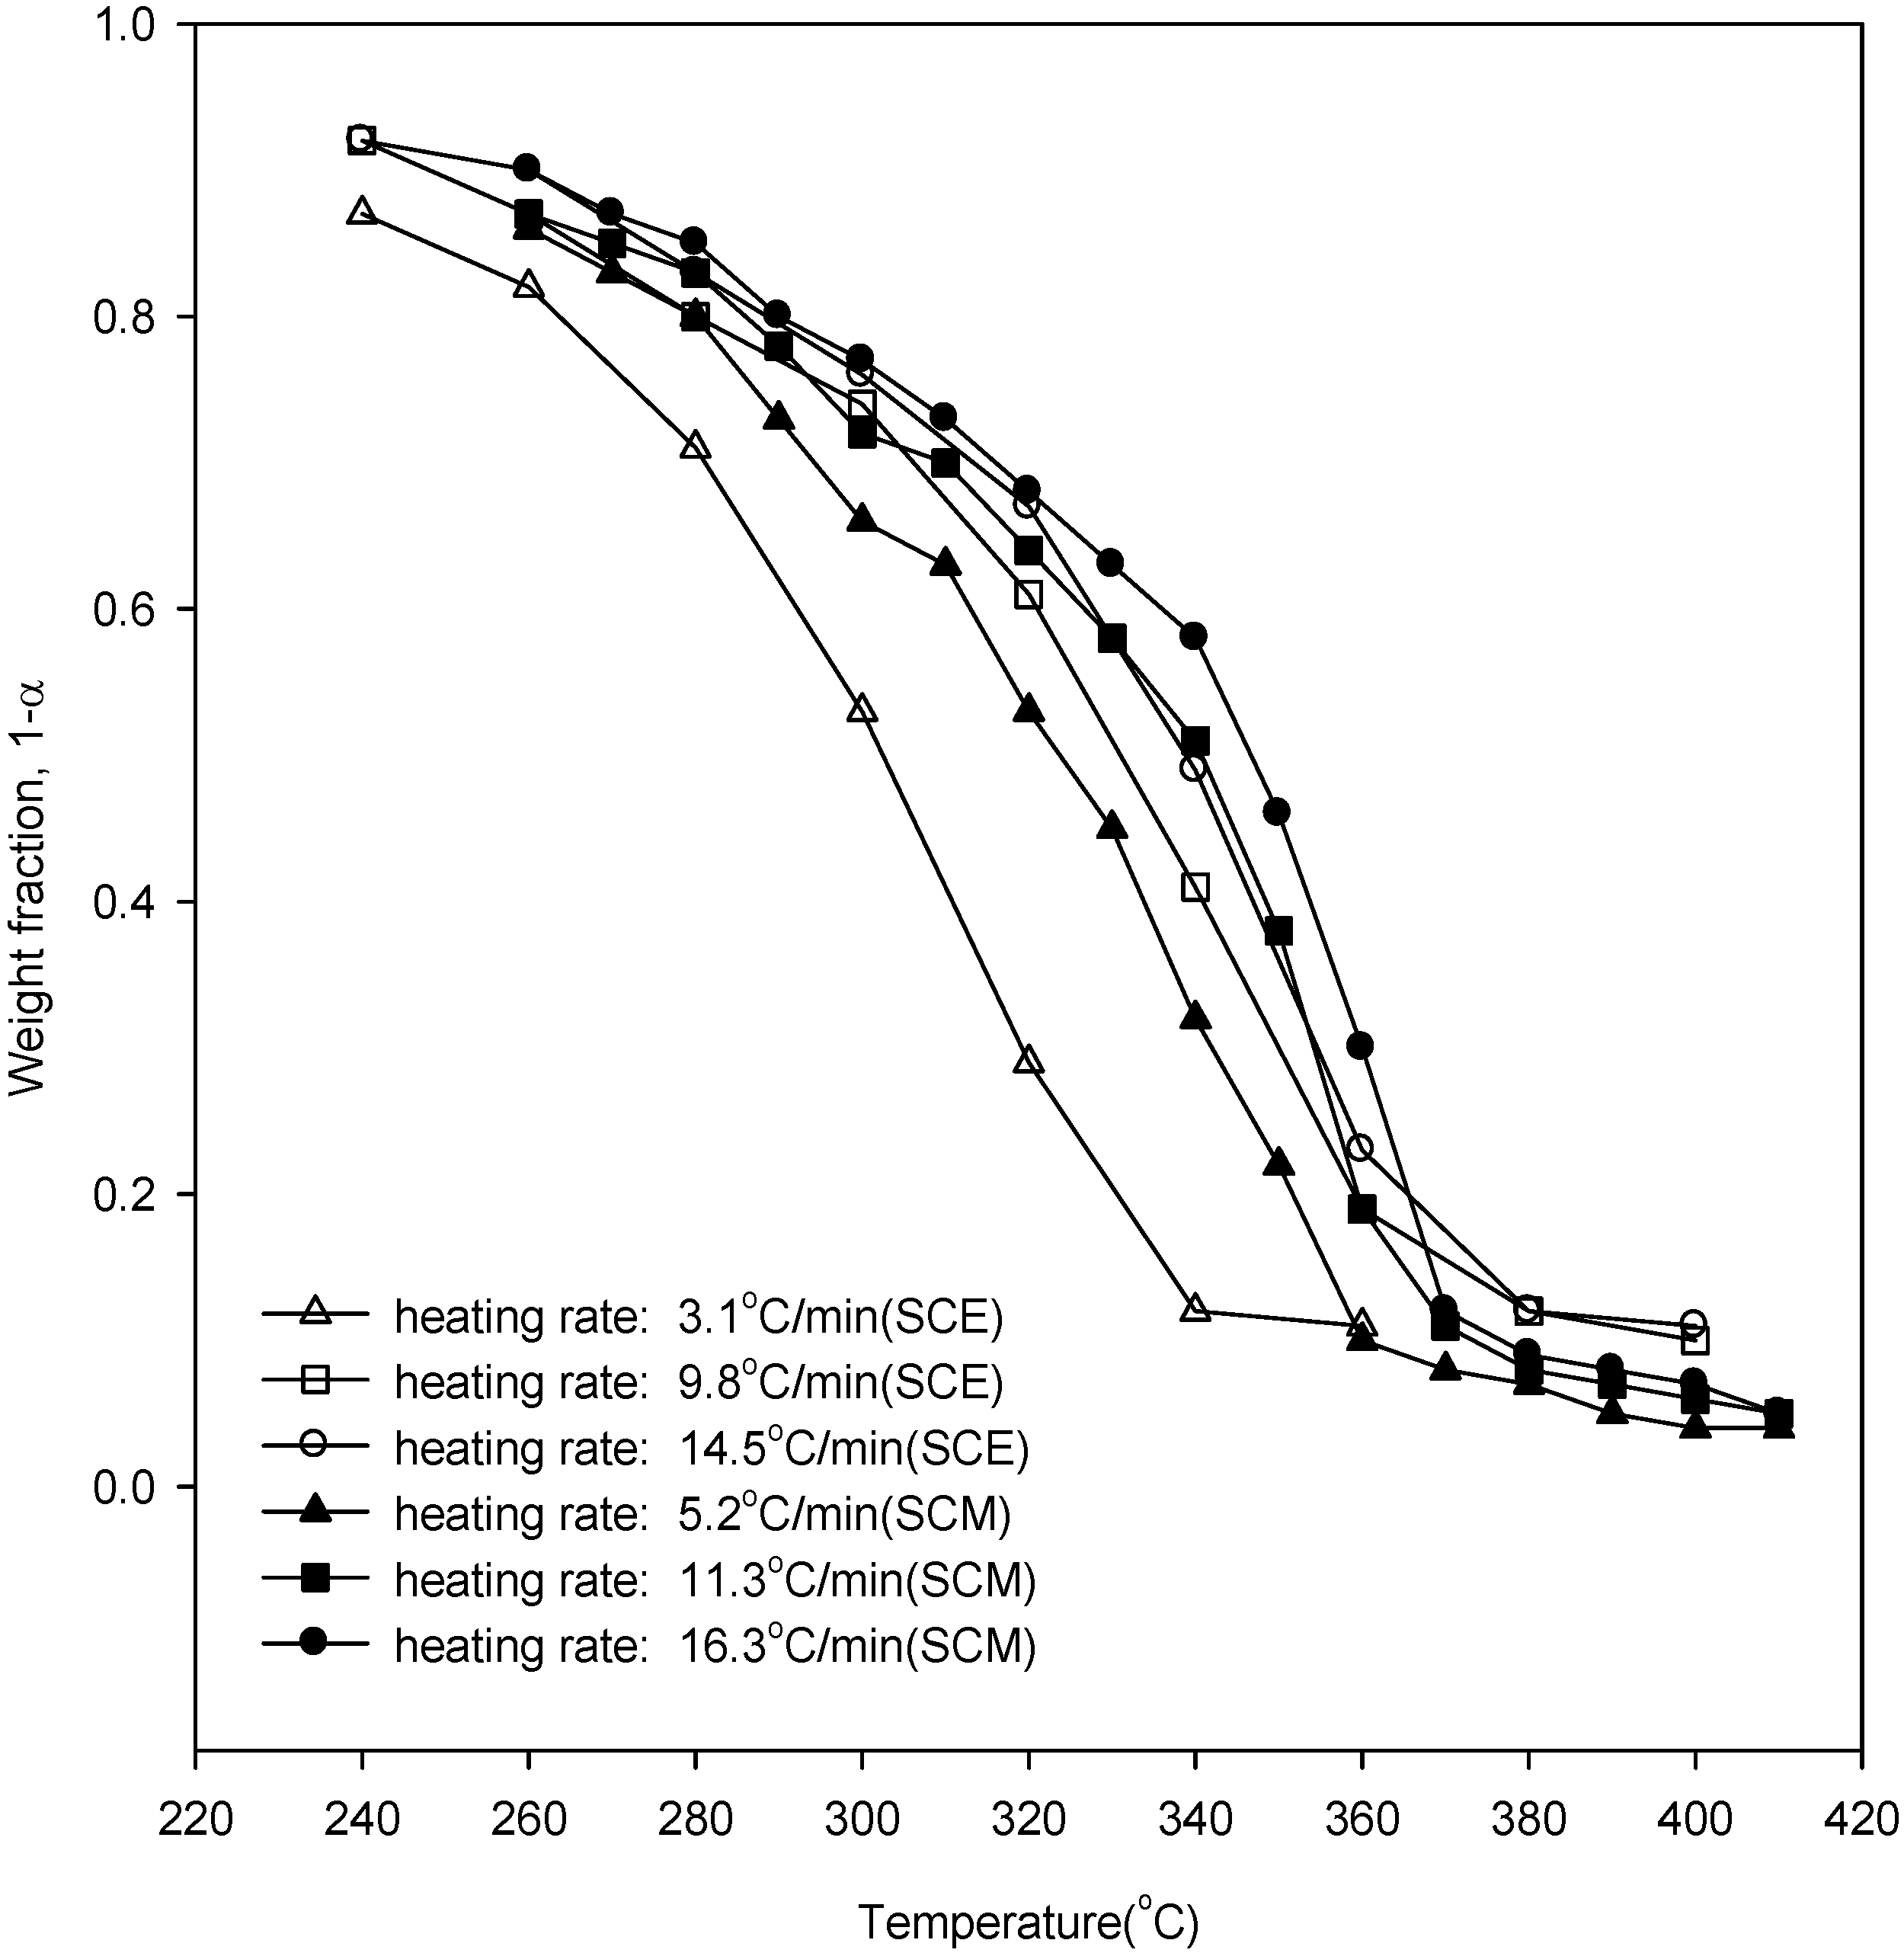
Figure 2 shows the weight loss curves of wood in SCE and SCM. It can be seen that with increased heating rate the weight loss curves of wood degradation were displaced to higher temperatures due to the heat transfer lag. Further, there is a higher conversion in SCE yields at a lower temperature than in SCM yields. In our previous work [
13], it was shown that the degree of hydrogen bonding of ethanol was slightly weaker in comparison to that in methanol in the supercritical region [
11].
Figure 2.
Weight loss data of wood degradation in SCE and SCM.
Figure 2.
Weight loss data of wood degradation in SCE and SCM.
Using
Figure 2, the points of inflection, along with their respective weight fractions, were obtained and are listed in
Table 3. From
Table 3 and Equation (6), the overall reaction orders for SCE were obtained as 1.26, 1.26, and 0.96 for heating rates of 3.1, 9.8, and 14.5 °C/min, while from our previous work [
20], the overall reaction orders for SCM were 0.59, 0.62, and 0.64 for heating rates of 5.2, 11.3, and 16.3 °C/min, respectively.
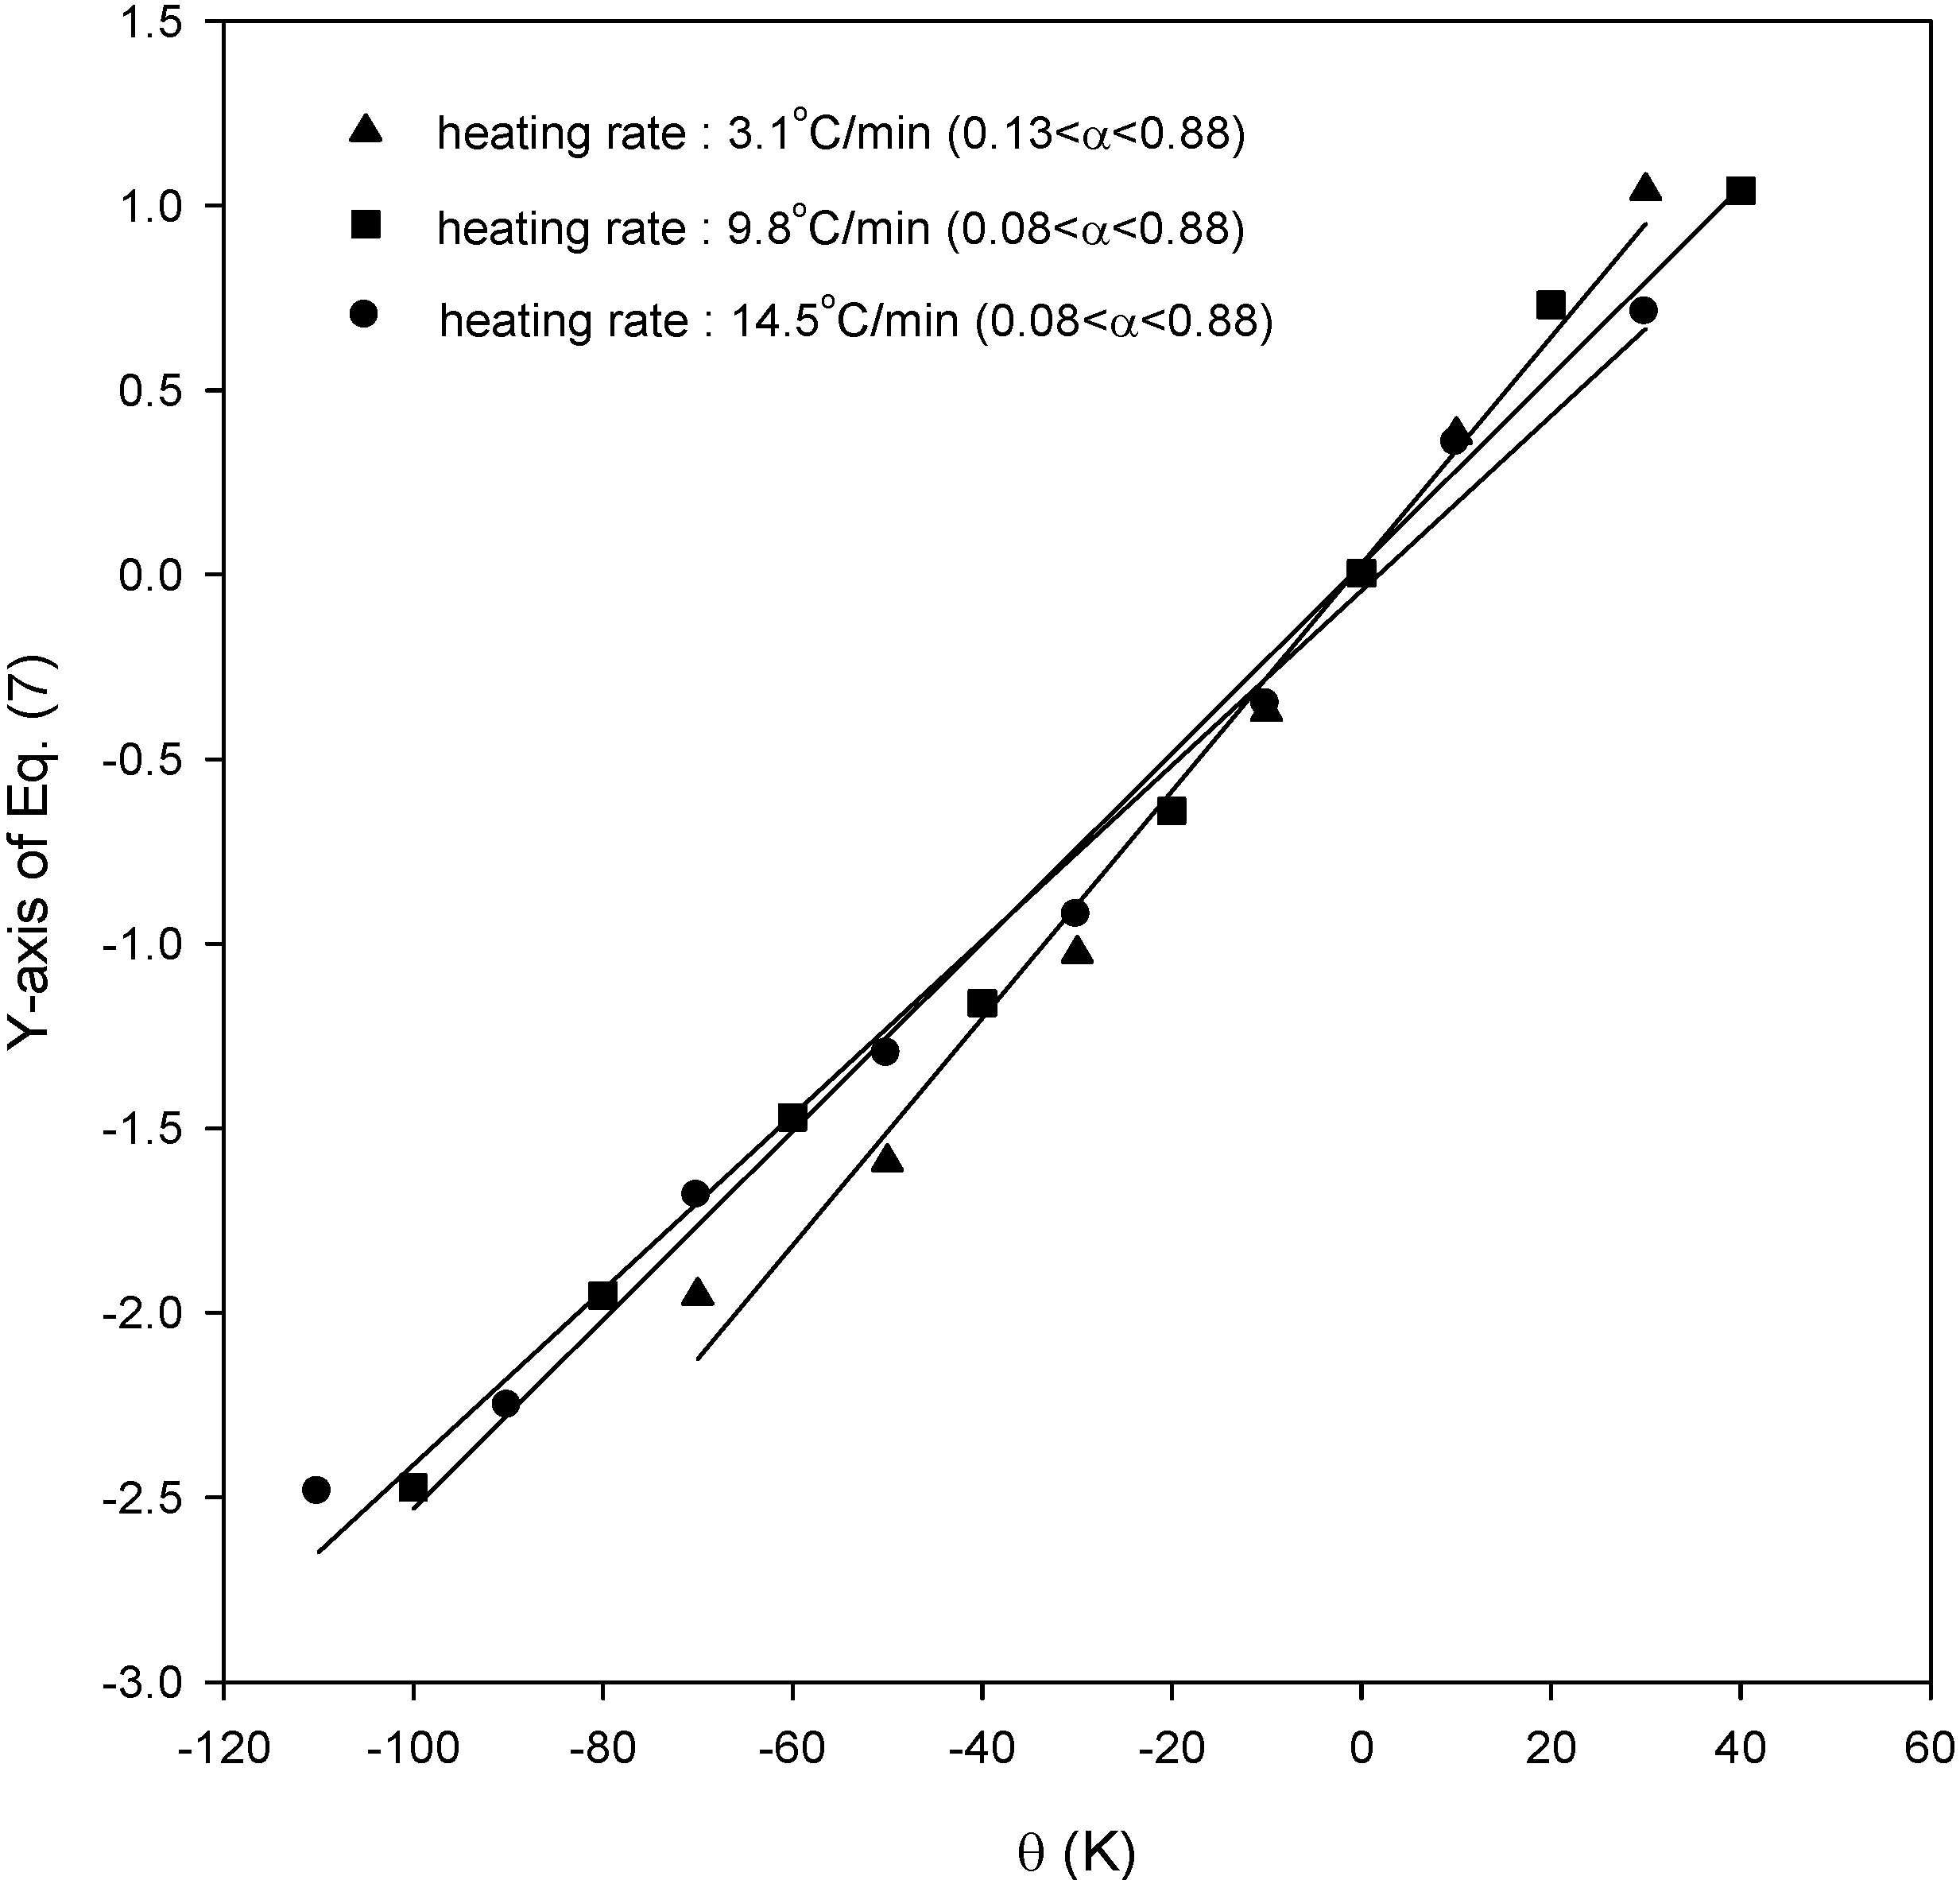
Figure 3 shows the results for SCE from Equation (7). From the slope in this figure, the activation energies for SCE were obtained as 86.0, 79.1, and 78.0 kJ/mol for heating rates of 3.1, 9.8, and 14.5 °C/min, respectively, while the activation energies for SCM were 73.7, 73.5, and 74.5 kJ/mol for heating rates of 5.2, 11.3, and 16.3 °C/min from our previous work [
20].
Table 3.
Weight fraction and temperature at which the inflection occurs in weight loss curve.
Table 3.
Weight fraction and temperature at which the inflection occurs in weight loss curve.
| | Heating rates, β (°C/min) | Temperature, Ts (°C) | Weight fraction, (1 − αs) |
|---|
| SCE | 3.1 | 310 | 0.41 |
| 9.8 | 340 | 0.41 |
| 14.5 | 350 | 0.36 |
| SCM | 5.2 | 345 | 0.26 |
| 11.3 | 355 | 0.28 |
| 16.3 | 360 | 0.20 |
Figure 3.
Plots of Equation (7) for the application of kinetic analysis for SCE.
Figure 3.
Plots of Equation (7) for the application of kinetic analysis for SCE.
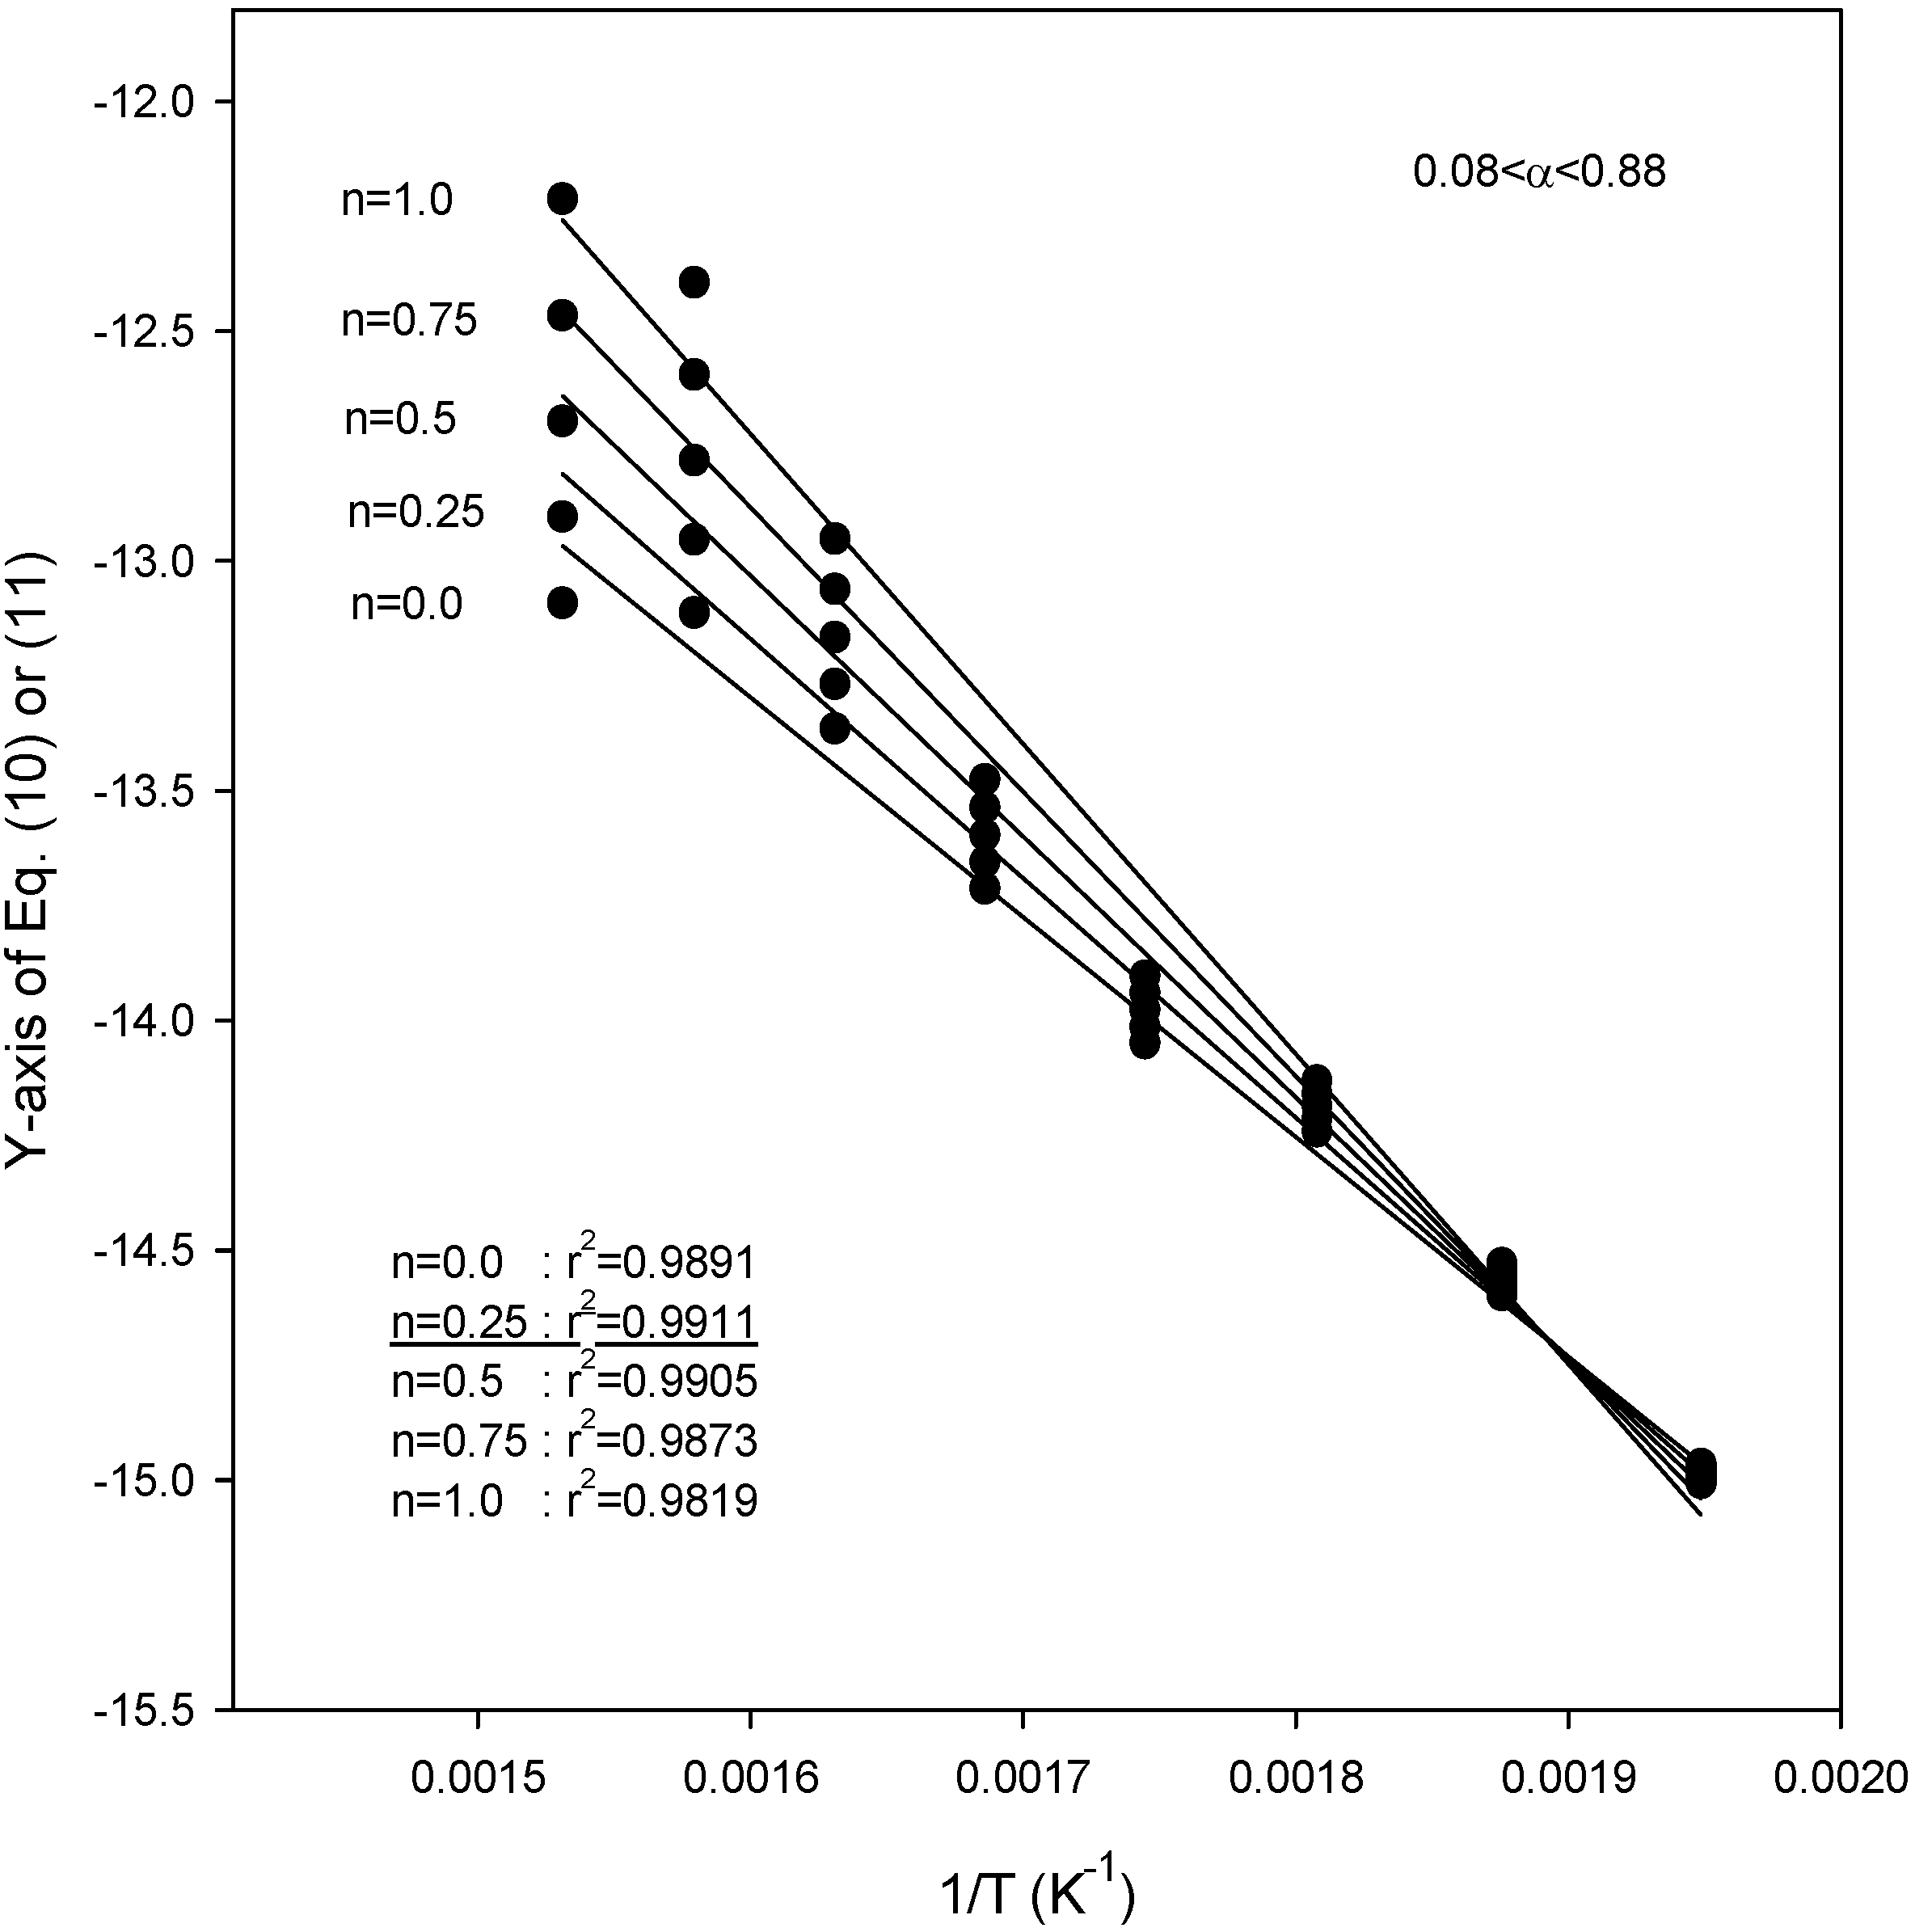
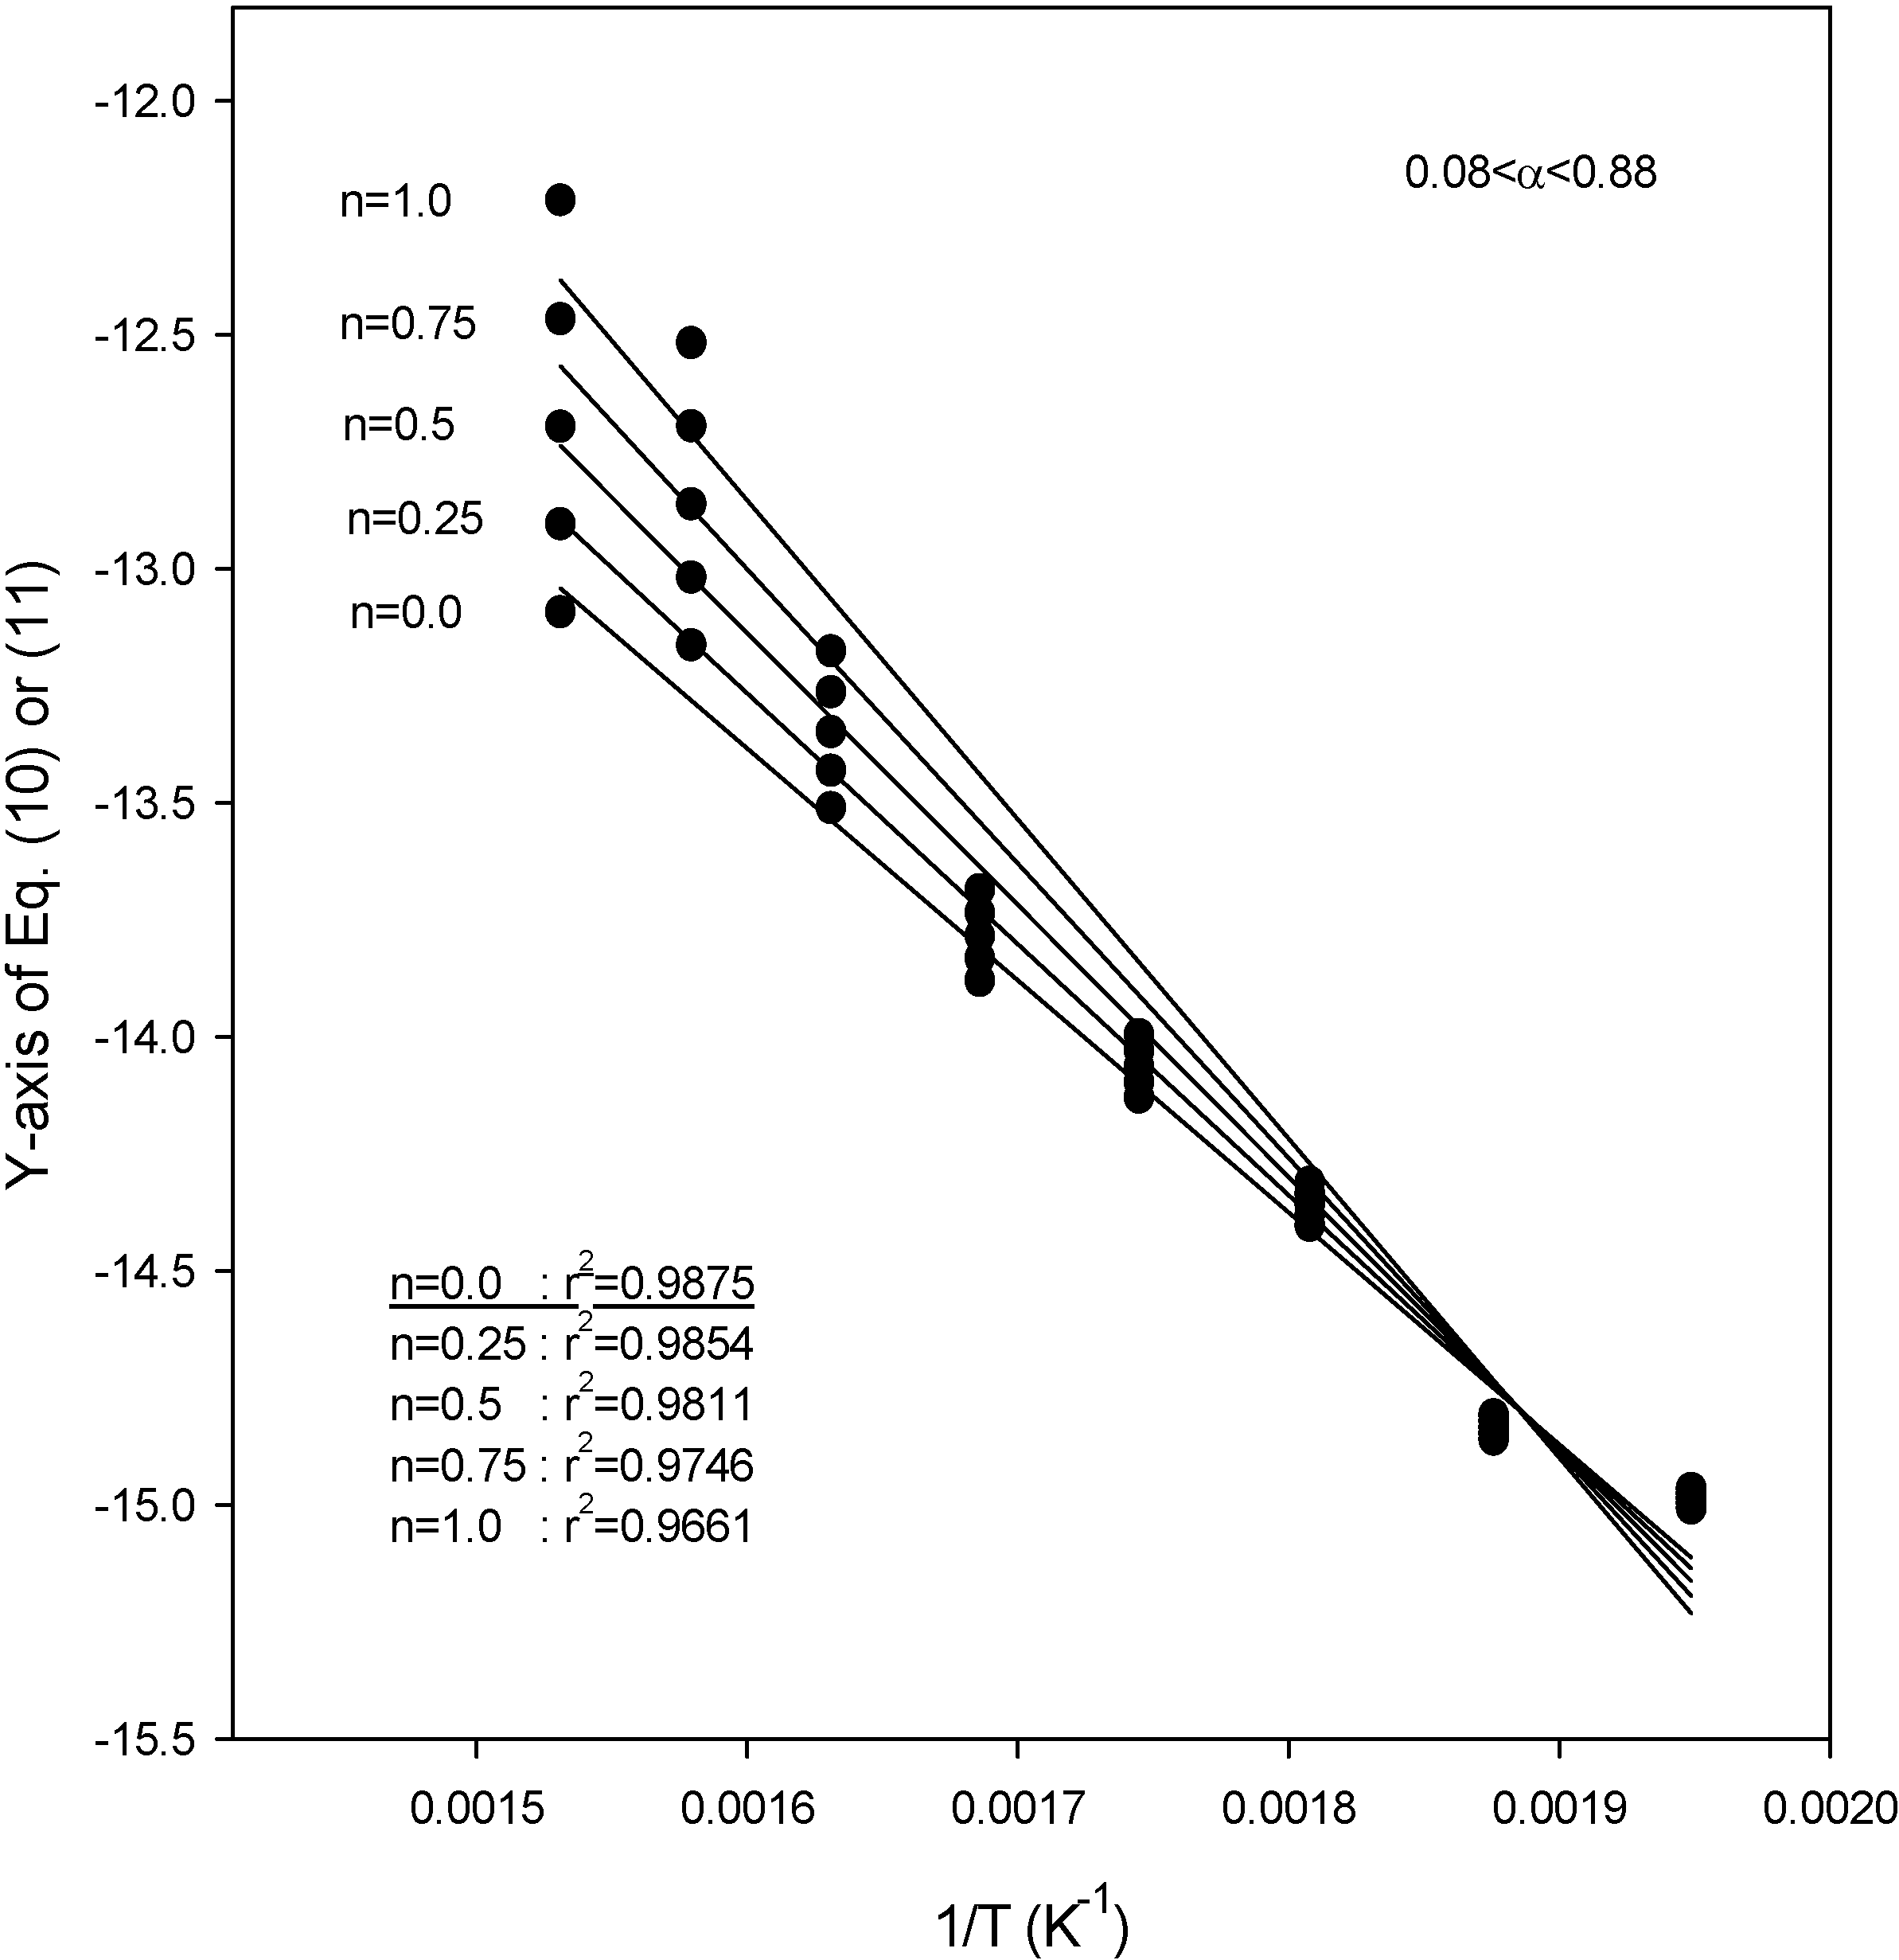
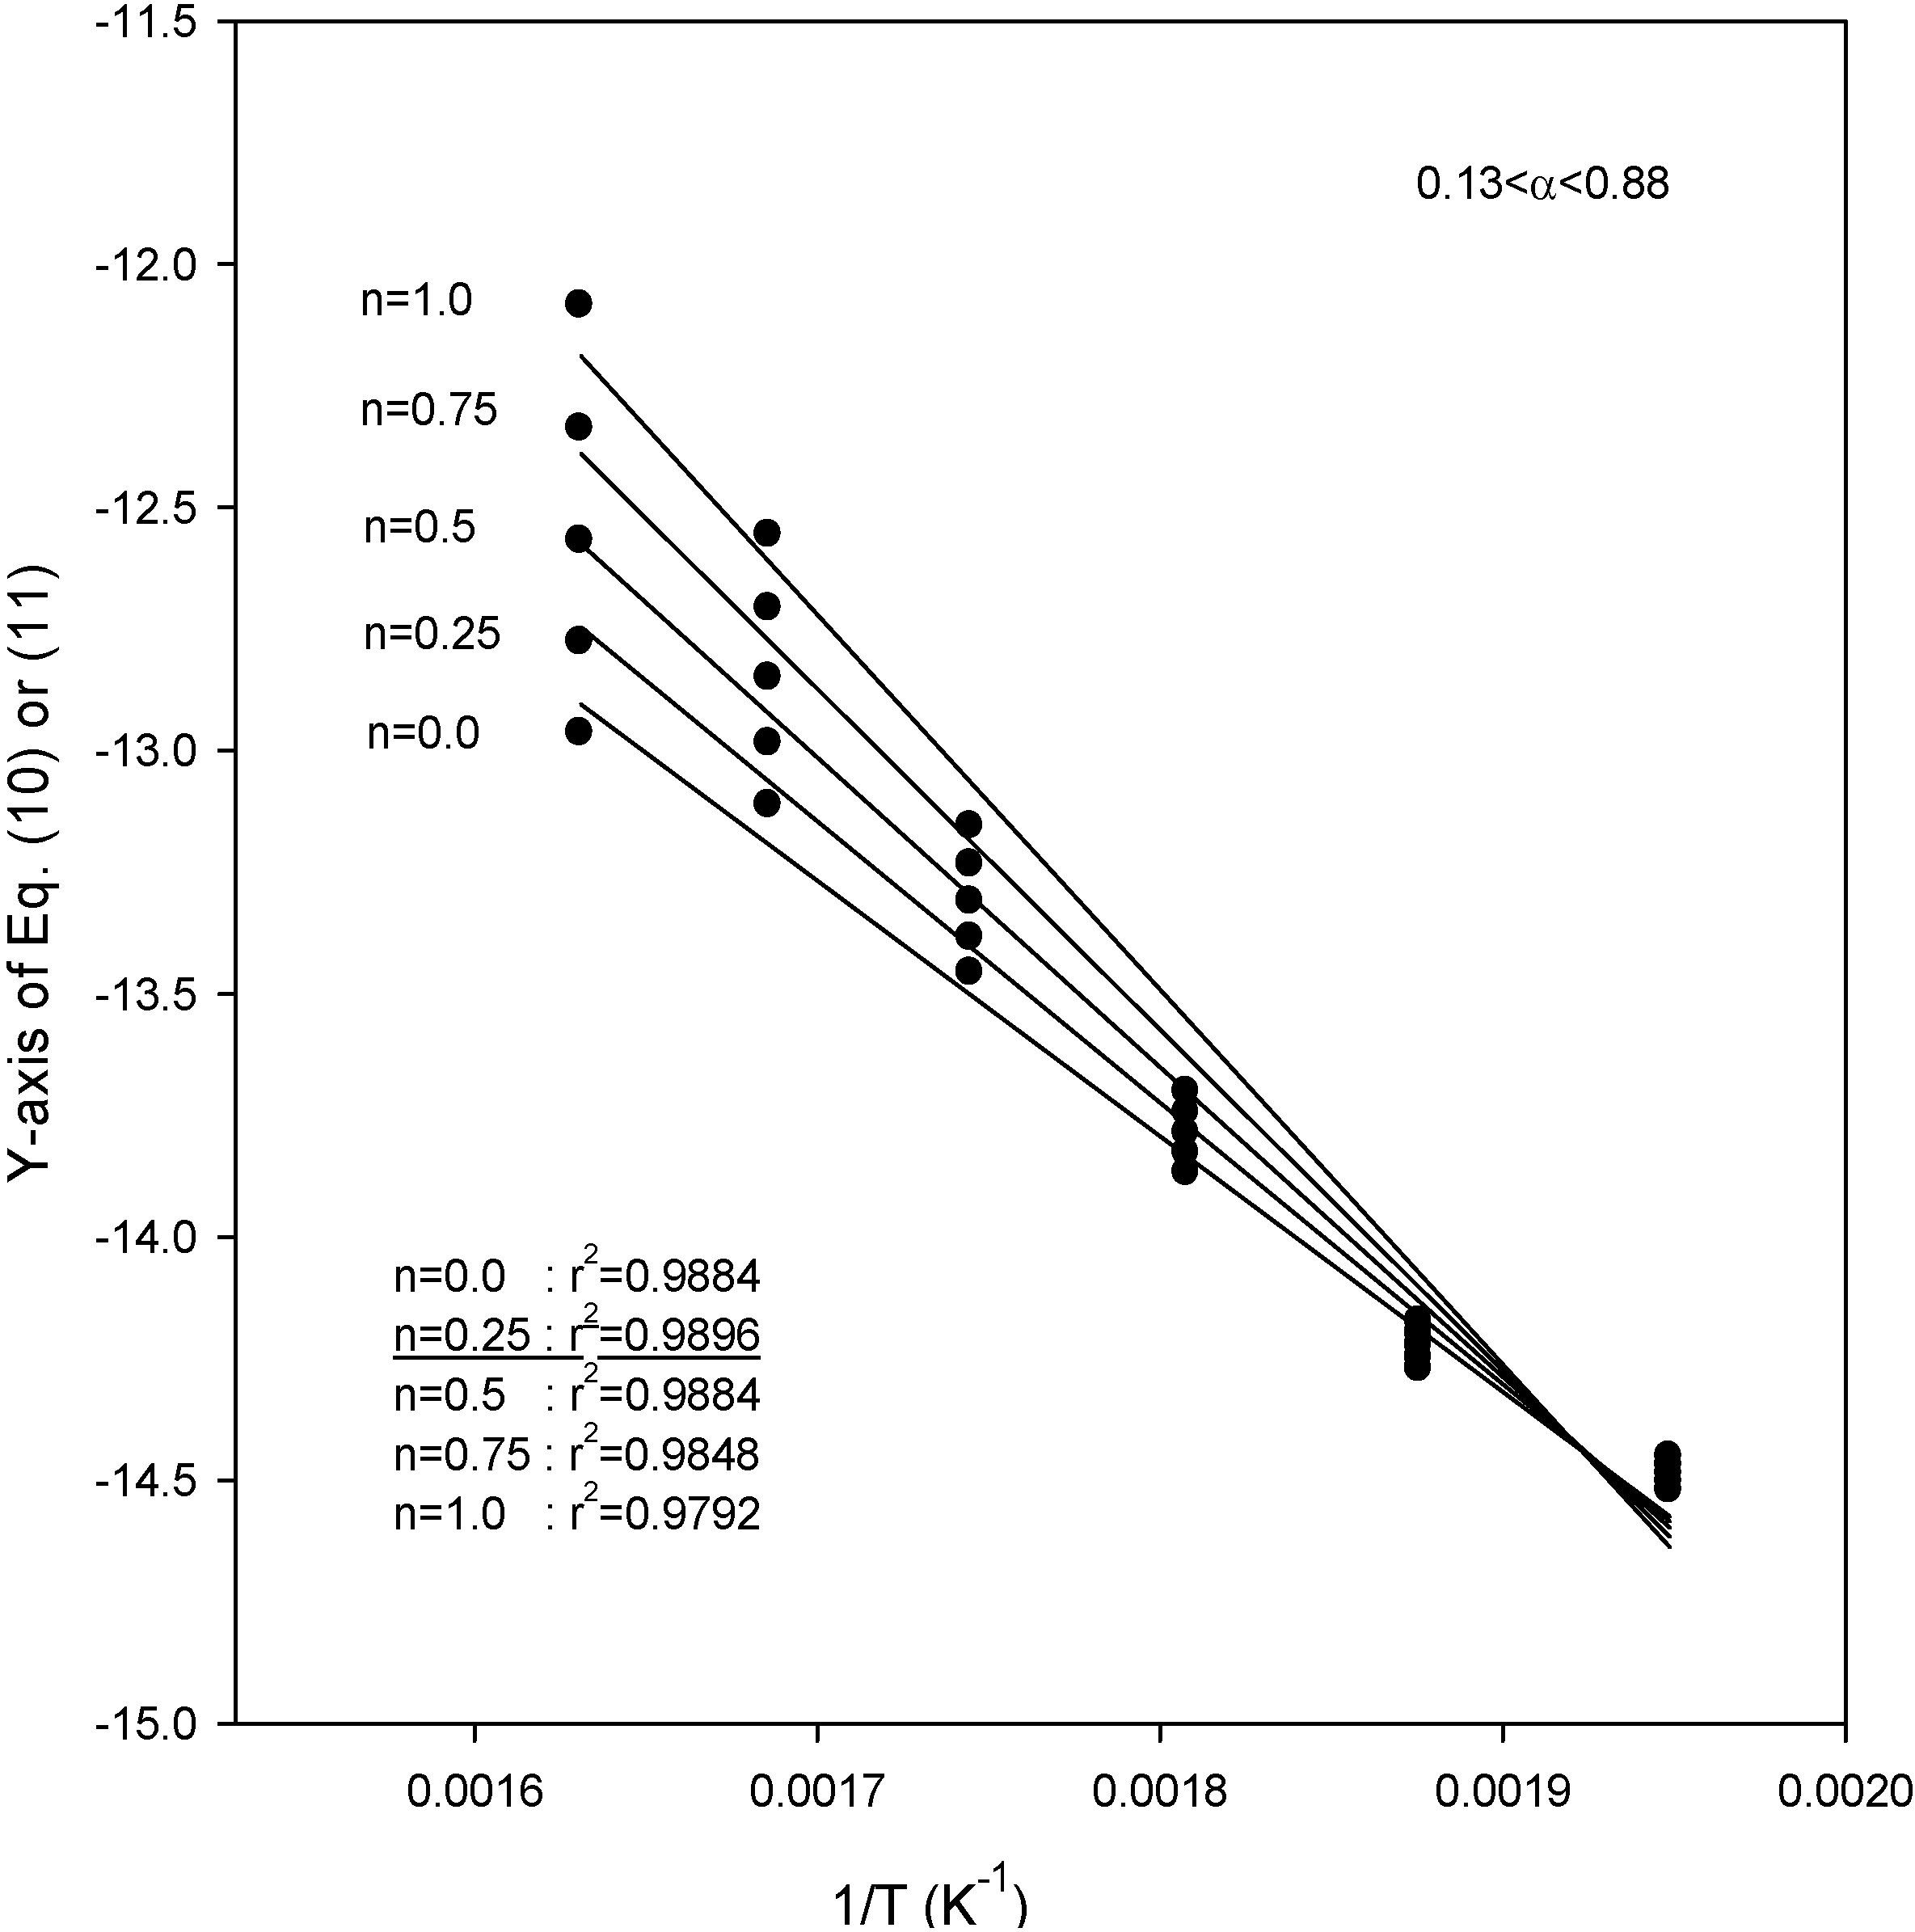
Figure 4,
Figure 5 and
Figure 6 also show the plot of Equations (10) and (11) for the application of the second kinetic analysis method used in this work at heating rates of 3.1, 9.8, and 14.5 °C/min for SCE, respectively. This method has been applied to our data and the best fit values for each heating rate were determined by employing reaction order values (
n) of 0, 0.25, 0.5, 0.75, and 1.0. The best overall fit values were obtained using a value of
n = 0.25, with the exception of a heating rate of 14.5 °C/min, for which the best fit of the data was obtained using a value of
n = 0.0. From the slope of the lines in
Figure 4,
Figure 5 and
Figure 6, the activation energies were obtained as 48.1, 43.3 and 40.1 kJ/mol for heating rates of 3.1, 9.8, and 14.5 °C/min, respectively. The best overall fit values in SCM were
n = 0.25 for all heating rates, while the activation energies were 48.8, 45.2, and 47.6 kJ/mol for heating rates of 5.2, 11.3, and 16.3 °C/min, respectively [
20]. All the parameters were obtained under unstirred condition. Although stirring was not implemented in this study because of experimental setup limitations, we considered the significance of stirring in this study. The rate of thermal reaction would surely be affected by any stirring. Since the stirring keeps the biomass particles mixed with the SCA, thus increasing the weight loss and then increasing the rate of reaction, considering it in supercritical reactions will increase the conversion.
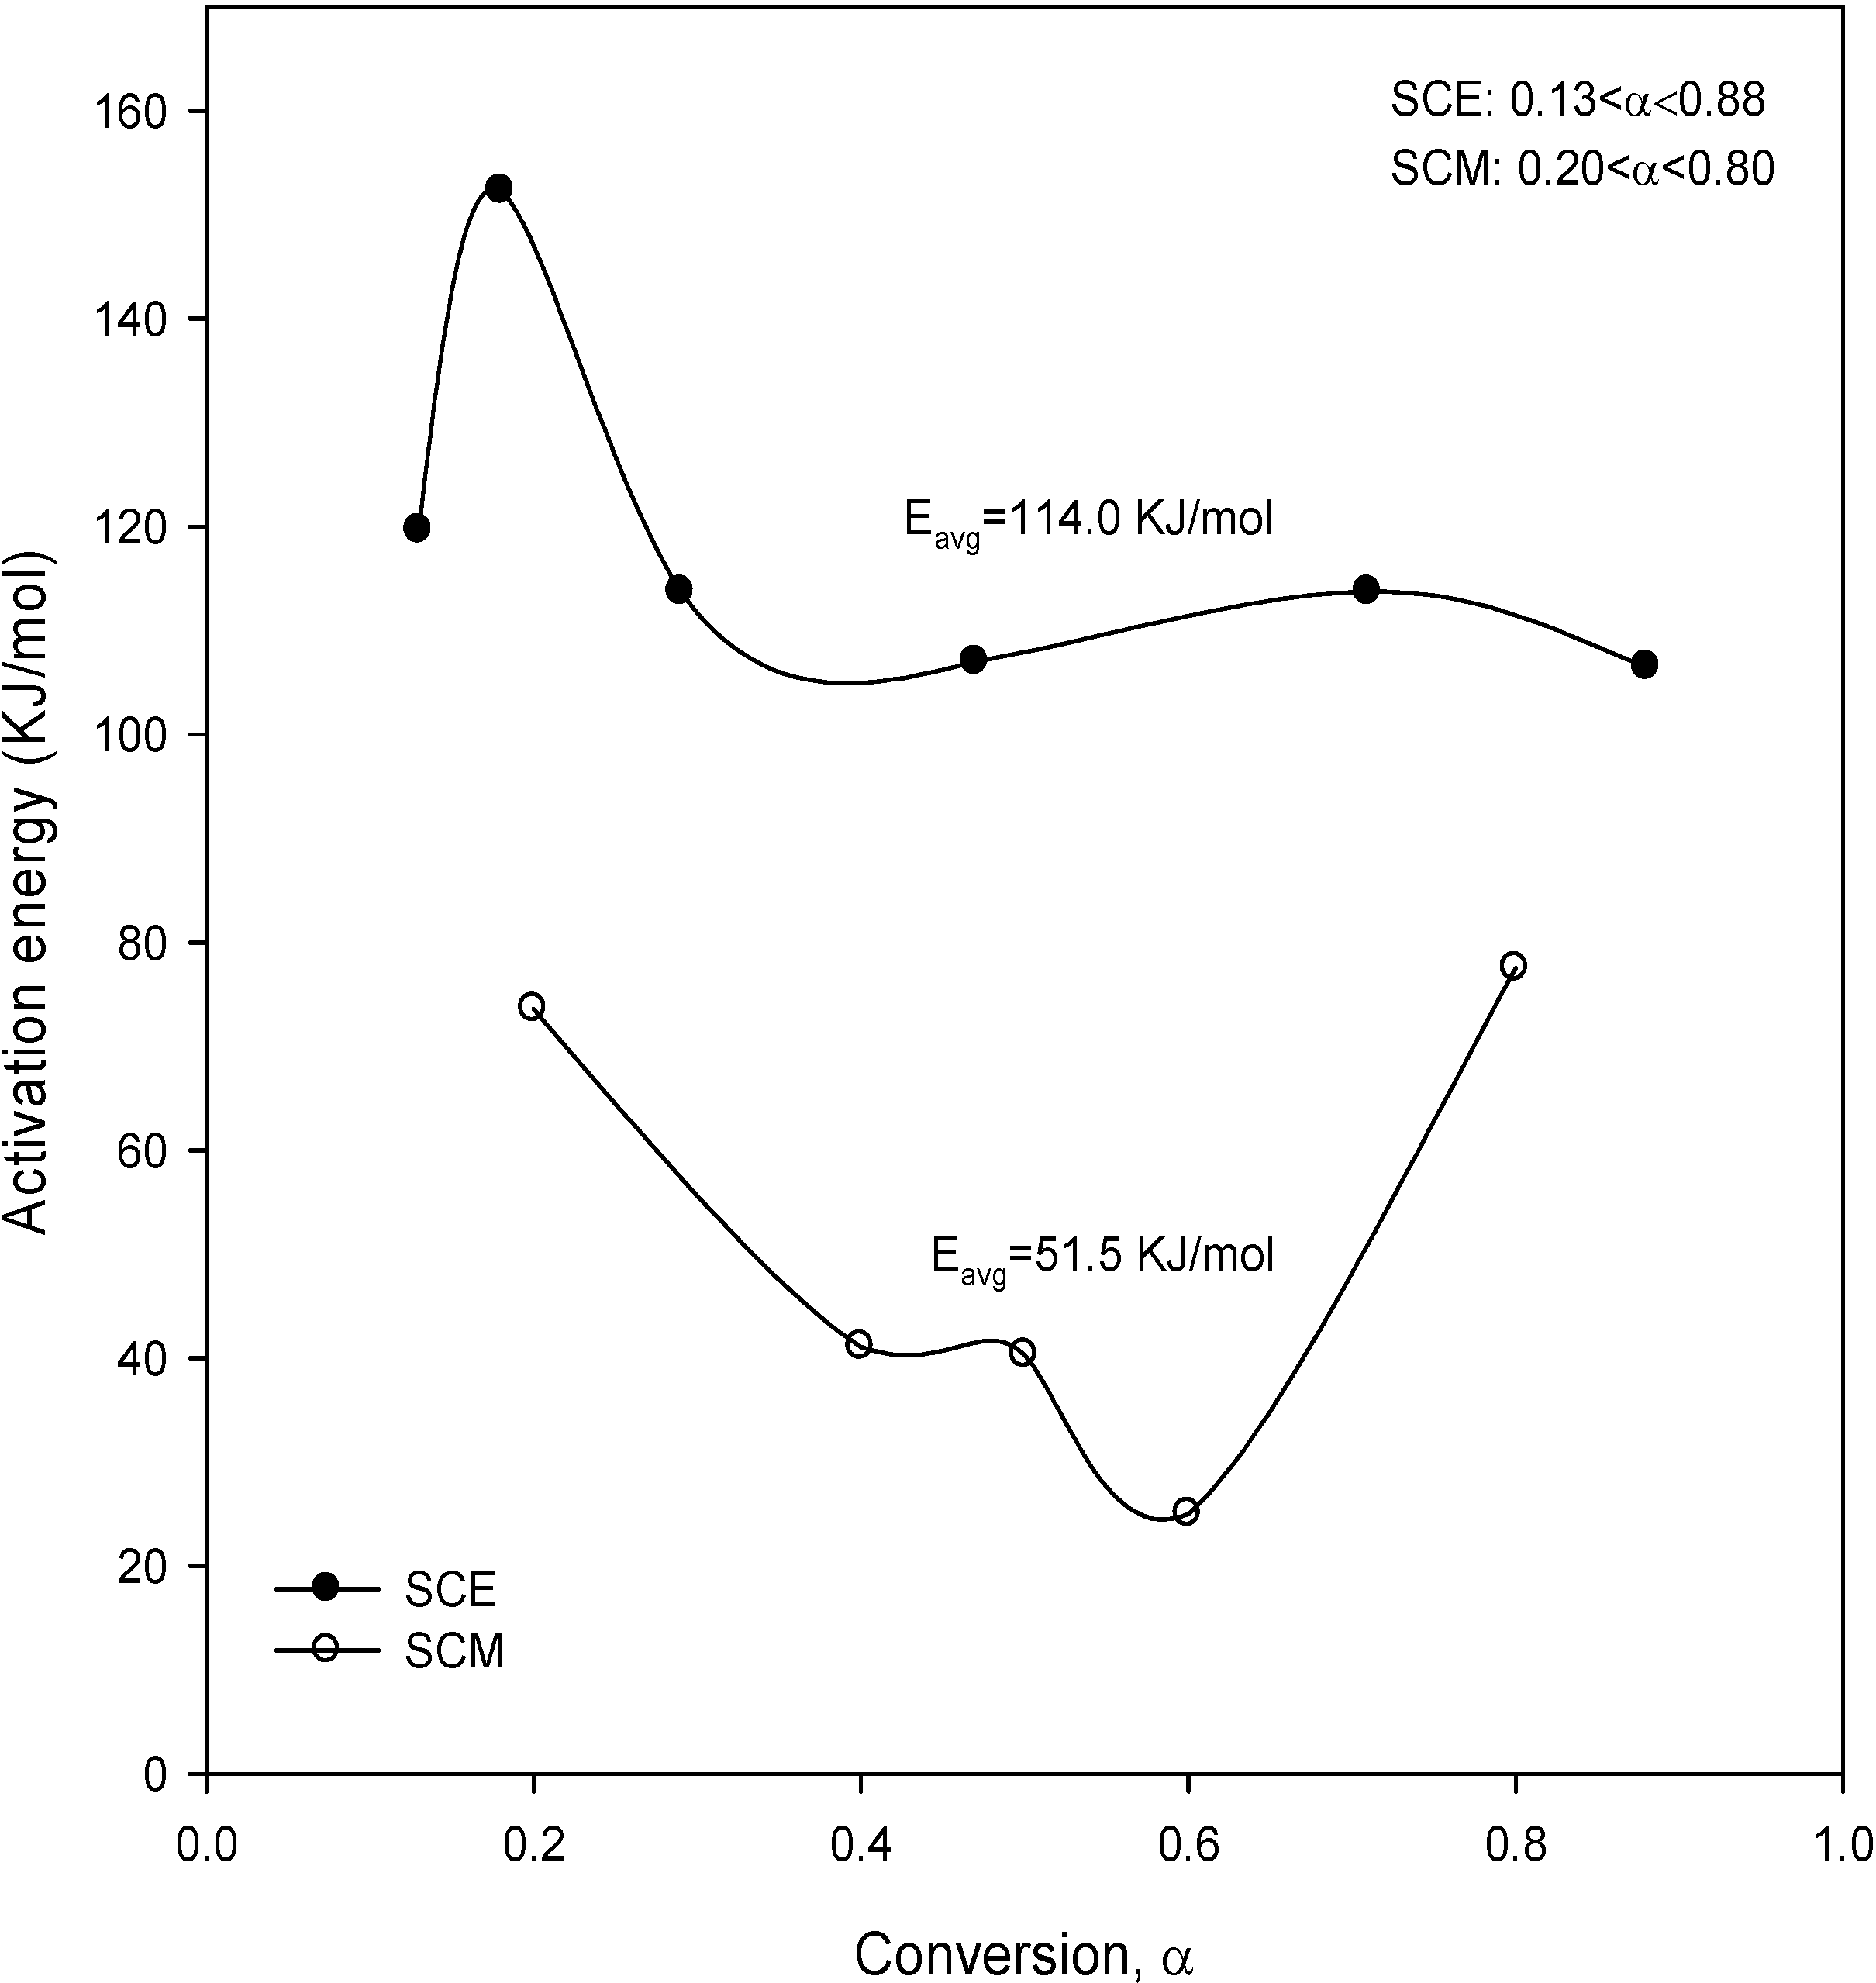
Figure 7 shows the result obtained for the activation energies from Equation (12). The average activation energies by this method were 114 kJ/mol and 51.5 kJ/mol for SCE and SCM, respectively, and this method yielded the highest activation energy for SCE. For comparative purposes, the results from the analytical methods used in this work are summarized in
Table 4. In Methods 1 and 2, it was seen that the activation energies of SCE were similar to those of SCM, while it was obtained from Method 3 that the activation energy of SCM was lower than that of SCE.
Figure 4.
Plots of Equations (10) or (11) for the application of the kinetic analysis method at a heating rate of 3.1 °C/min for SCE.
Figure 4.
Plots of Equations (10) or (11) for the application of the kinetic analysis method at a heating rate of 3.1 °C/min for SCE.
Figure 5.
Plots of Equations (10) or (11) for the application of the kinetic analysis method at a heating rate of 9.8 °C/min for SCE.
Figure 5.
Plots of Equations (10) or (11) for the application of the kinetic analysis method at a heating rate of 9.8 °C/min for SCE.
Figure 6.
Plots of Equations (10) or (11) for the application of the kinetic analysis method at a heating rate of 14.5 °C/min for SCE.
Figure 6.
Plots of Equations (10) or (11) for the application of the kinetic analysis method at a heating rate of 14.5 °C/min for SCE.
Figure 7.
Activation energy upon conversion obtained from Equation (12) for SCE and SCM.
Figure 7.
Activation energy upon conversion obtained from Equation (12) for SCE and SCM.
It was also found from
Table 4 that there were tremendous variations in the calculated kinetic parameters, depending on the mathematical approach. This observation clearly indicated the problems in the selection and utilization of the different analytical methods to describe the wood degradation under supercritical conditions.
Table 4.
Summary of the kinetic parameters obtained from this work.
Table 4.
Summary of the kinetic parameters obtained from this work.
| | | Heating rates, β (°C/min) | Activation energy, E (kJ/mol) | Reaction order, n |
|---|
| Method 1 | SCE | 3.1 | 86.0 | 1.26 |
| 9.8 | 79.1 | 1.26 |
| 14.5 | 78.0 | 0.96 |
| SCM [16] | 5.2 | 73.7 | 0.59 |
| 11.3 | 73.5 | 0.62 |
| 16.3 | 74.5 | 0.64 |
| Method 2 | SCE | 3.1 | 48.1 | 0.25 |
| 9.8 | 43.3 | 0.25 |
| 14.5 | 40.1 | 0.0 |
| SCM [16] | 5.2 | 48.8 | 0.25 |
| 11.3 | 45.2 | 0.25 |
| 16.3 | 47.6 | 0.25 |
| Method 3 | SCE | - | 114.0 a | - |
| SCM | - | 51.5 a | - |
The qualitative analysis of wood degradation in SCA is absolutely necessary to study its effects. The liquid products were obtained from the experiments conducted at 300, 315, and 330 °C.
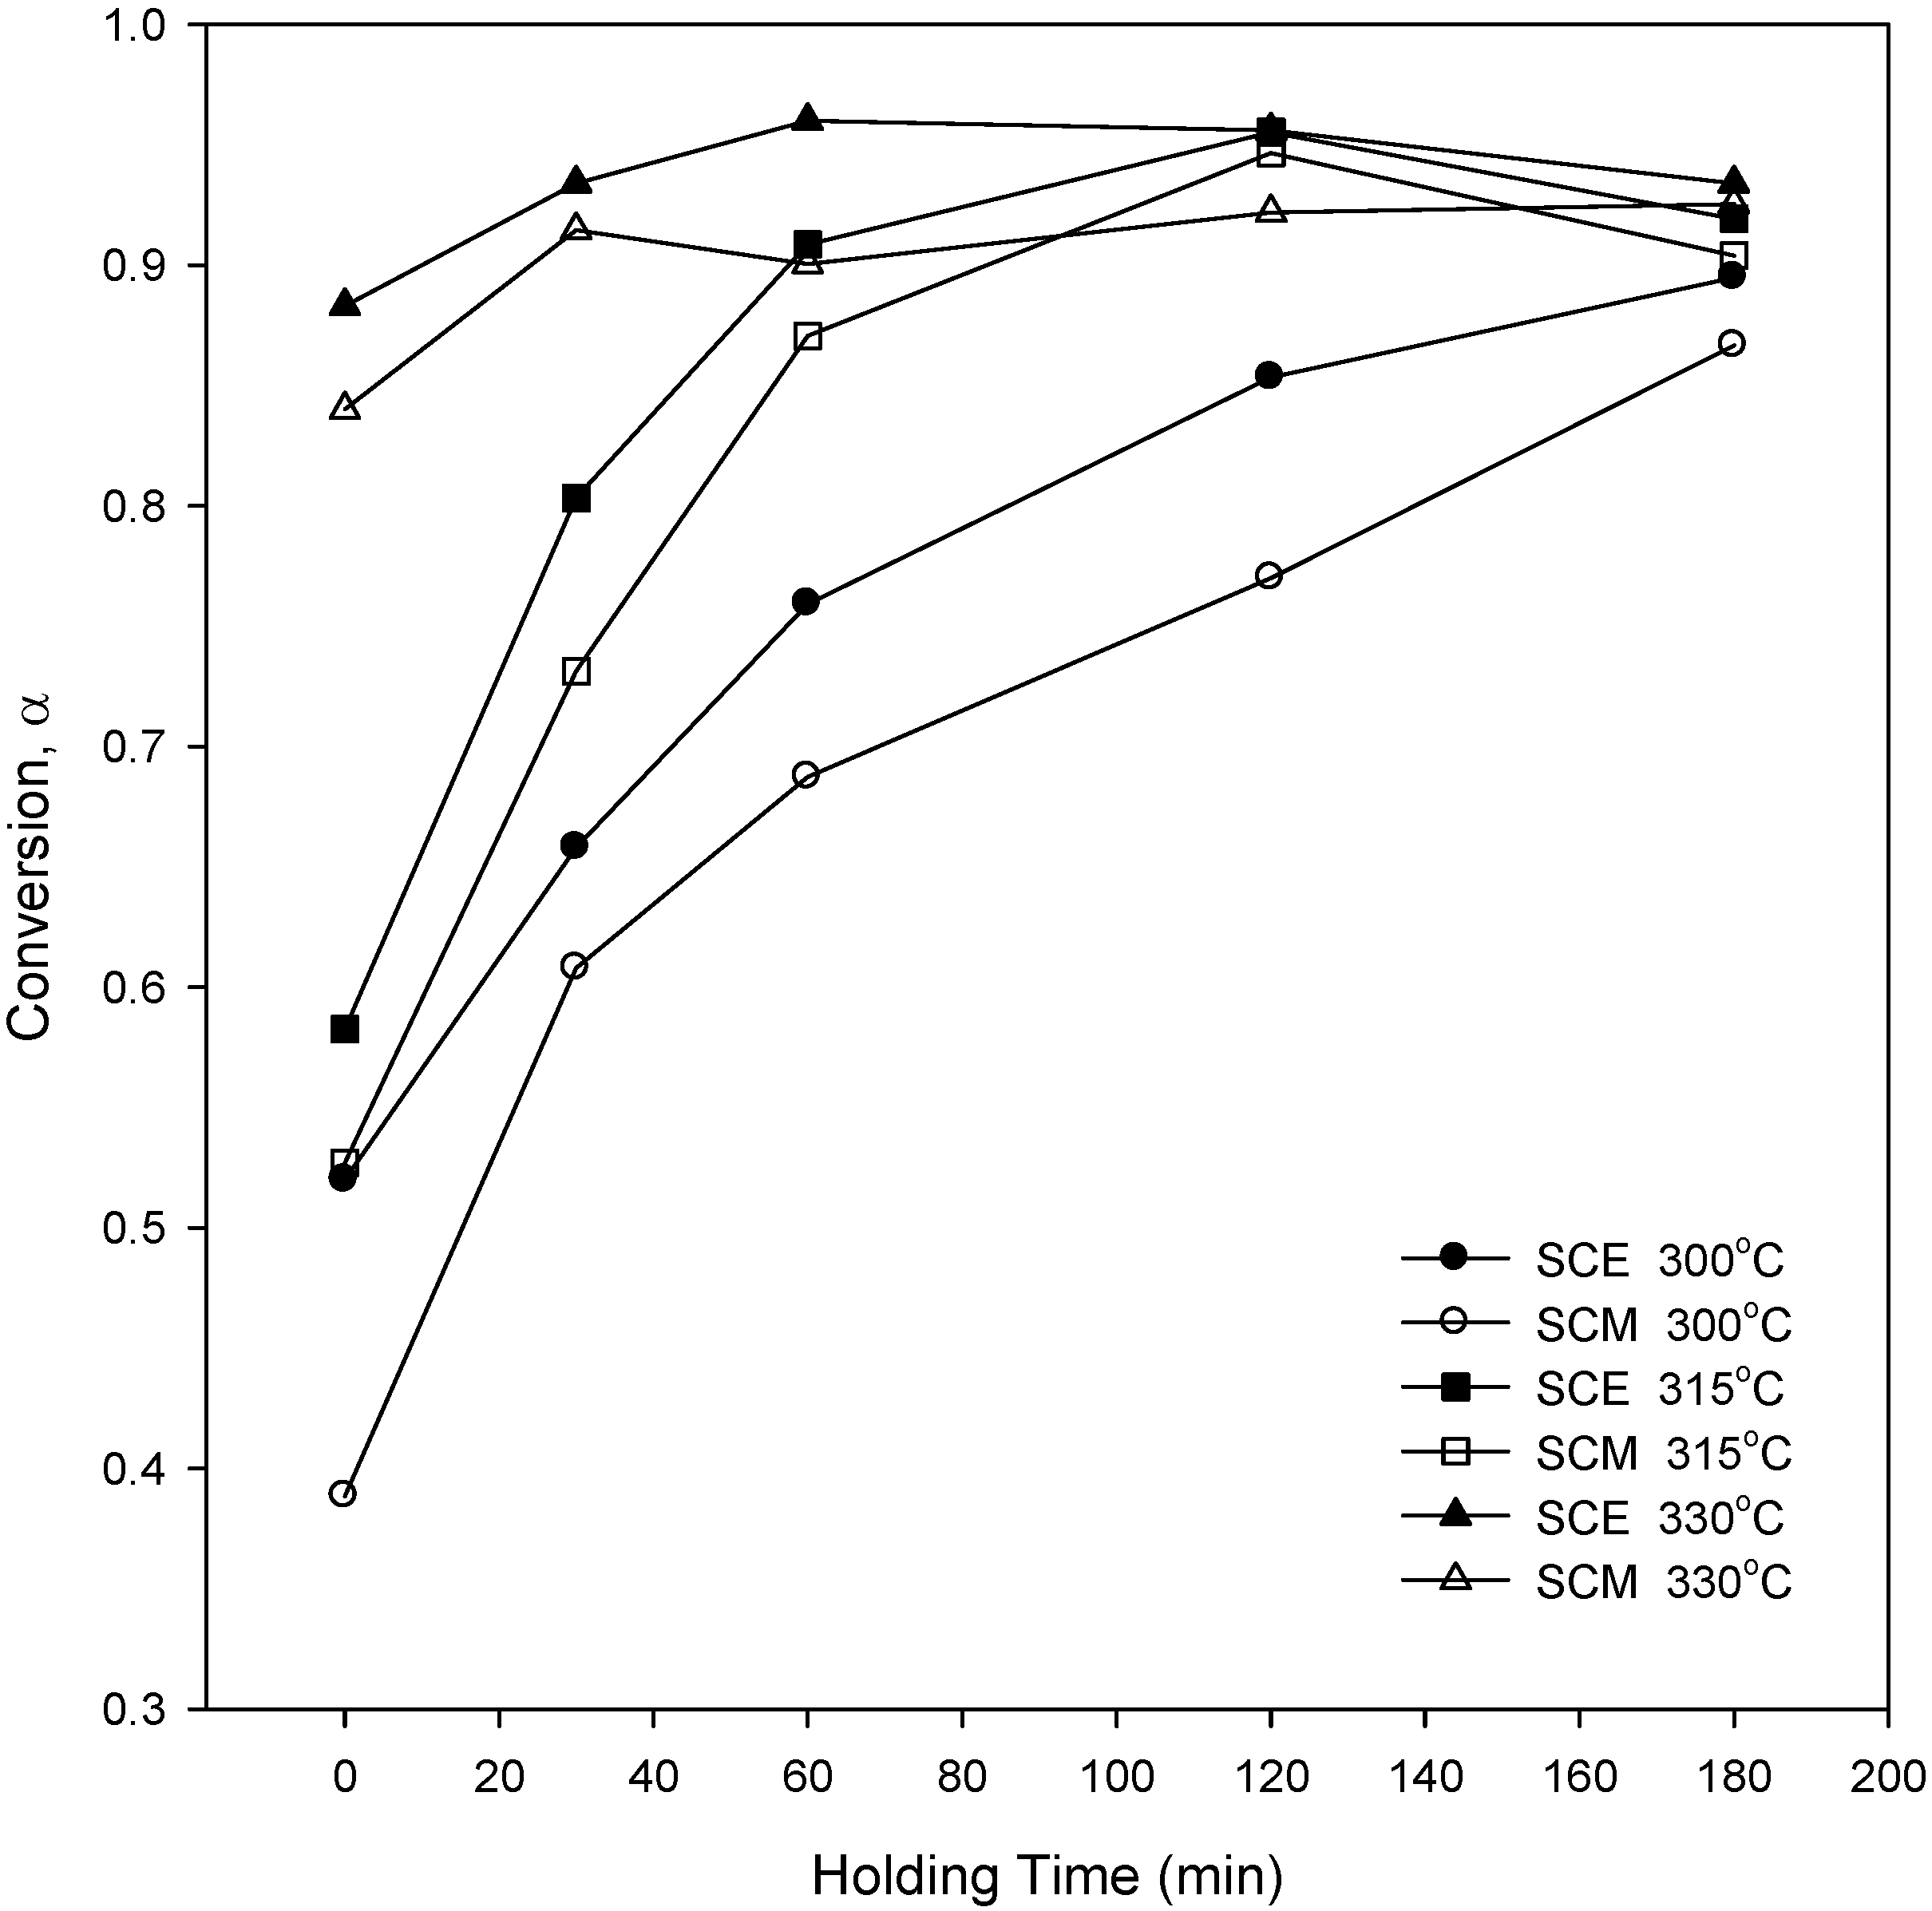
Figure 8 shows the conversion to liquid products of wood at various reaction temperatures for SCA. The conversion increased with the increase of reaction temperature and holding time, and the conversions in SCE were higher than those of SCM. This result is similar to the experimental results of weight loss for the kinetic analysis of
Figure 2, which shows the possibility that ethanol can act as a better solvent under supercritical conditions. It was also found that the conversion increased with the increase of reaction holding time for reaction temperatures of 315 and 330 °C, and then decreased again. At the initial stage, biomass was decomposed and depolymerized into small compounds, and these compounds may then rearrange through condensation, cyclization, and polymerization reactions to form new compounds. Thus, the conversion is less for longer holding times [
21].
Table 5 shows the grouping of the compounds obtained from the product analysis for SCE and SCM. This table shows the compounds, in terms of carbon number, for a reaction holding time of 0, 30, 60, 120, and 180 min and for reaction temperatures of 300, 315, and 330 °C. This data shows that the compounds with carbon numbers ranging from 2 to 15 are the major products. The products do not show much difference in terms of holding time and reaction temperature.
Figure 8.
Percentage conversion at various reaction temperatures using SCM and SCE.
Figure 8.
Percentage conversion at various reaction temperatures using SCM and SCE.
Table 5.
The weight percentage of compounds according to the carbon number of liquid products obtained at different holding times.
Table 5.
The weight percentage of compounds according to the carbon number of liquid products obtained at different holding times.
| | Temperature (°C) | Carbon number | Holding time (min) |
|---|
| 0 | 30 | 60 | 120 | 180 |
|---|
| SCE | 315 | –C5 | 60.5735 | 55.1467 | 48.8496 | 40.2349 | 42.3631 |
| C6–C10 | 21.3746 | 30.6275 | 42.3841 | 43.2205 | 38.7331 |
| C11–C15 | 8.9993 | 9.7628 | 6.4340 | 16.5445 | 18.9037 |
| C15+ | 9.0523 | 4.4629 | 2.3321 | 0 | 0 |
| 315 | –C5 | 49.8866 | 48.9922 | 49.7882 | 53.3591 | 52.1675 |
| C6–C10 | 22.6942 | 38.9051 | 38.1877 | 36.9808 | 40.2991 |
| C11–C15 | 22.5731 | 12.1026 | 7.9642 | 9.6600 | 3.1626 |
| C15+ | 4.8460 | 0 | 4.0597 | 0 | 5.6382 |
| 330 | –C5 | 62.308 | 45.1746 | 47.3825 | 56.9097 | 53.5084 |
| C6–C10 | 26.395 | 42.3808 | 35.3924 | 27.54808 | 35.2916 |
| C11–C15 | 11.297 | 12.4444 | 10.4425 | 11.1417 | 10.1567 |
| C15+ | 0 | 0 | 6.78253 | 4.4003 | 1.0432 |
| SCM | 300 | –C5 | 59.3559 | 35.7655 | 29.4561 | 44.4425 | 45.7245 |
| C6–C10 | 24.2777 | 41.4319 | 54.2352 | 41.2186 | 41.8139 |
| C11–C15 | 16.3662 | 22.8025 | 16.3086 | 12.6105 | 9.2282 |
| C15+ | 0 | 0 | 0 | 1.72831 | 3.2331 |
| 315 | –C5 | 41.6373 | 57.4272 | 58.3233 | 40.0128 | 32.9110 |
| C6–C10 | 38.8932 | 28.4824 | 36.3414 | 50.7345 | 38.8445 |
| C11–C15 | 17.7693 | 10.3694 | 4.5028 | 4.5284 | 28.2444 |
| C15+ | 1.70001 | 3.7207 | 0.8322 | 4.7240 | 0 |
| 330 | –C5 | 54.0369 | 41.5547 | 31.5717 | 40.8246 | 30.9853 |
| C6–C10 | 32.1226 | 41.5144 | 55.8919 | 46.6675 | 59.9668 |
| C11–C15 | 5.0866 | 16.9307 | 10.8452 | 4.7987 | 3.3761 |
| C15+ | 8.7538 | 0 | 1.6910 | 7.70905 | 5.6716 |
Table 6 shows the product in terms of their aliphatic and aromatic composition for SCE and SCM at 300, 315, and 330 °C. From
Table 6 it can be seen that the aliphatic component increases with an increase in reaction temperature and holding time, while the aromatic component decreases with an increase in temperature and holding time for SCE. This clearly shows the conversion of aromatic components to aliphatic components with an increase of temperature and holding time. Similar results concerning a decrease in the aromatic components are shown in other works [
21]. However, the change in reaction temperature and holding time for SCM doesn’t show significant changes. From this, it can be seen that the degradation of wood in SCM occurs very randomly, while it is not very random for SCE. From our previous work [
13] and as this result, SCE shows significant possibilities as a solvent for supercritical reactions, although further exploration is indispensable.
Table 6.
The weight percentages of aromatic and aliphatic components in the liquid products obtained from this work.
Table 6.
The weight percentages of aromatic and aliphatic components in the liquid products obtained from this work.
| Temperature (°C) | Holding time (min) | SCE | SCM |
|---|
| Aliphatic | Aromatic | Aliphatic | Aromatic |
|---|
| 300 | 0 | 37.21739 | 62.78261 | 50.19121 | 49.80879 |
| 30 | 58.82611 | 41.17389 | 54.17968 | 45.82032 |
| 60 | 39.52417 | 60.47583 | 62.57999 | 37.42001 |
| 120 | 52.41277 | 47.58723 | 40.96126 | 59.03874 |
| 180 | 63.28477 | 36.71523 | 61.40423 | 38.59577 |
| 315 | 0 | 44.53008 | 55.46992 | 45.87700 | 54.12300 |
| 30 | 57.82844 | 42.17156 | 45.99045 | 54.00955 |
| 60 | 58.09071 | 41.90929 | 45.58905 | 54.41095 |
| 120 | 61.00901 | 38.99099 | 60.89976 | 39.10024 |
| 180 | 71.61326 | 28.38674 | 50.72985 | 49.27015 |
| 330 | 0 | 67.01420 | 32.98580 | 70.58513 | 29.41487 |
| 30 | 58.57076 | 41.42924 | 62.86133 | 37.13867 |
| 60 | 68.27741 | 31.72259 | 48.98633 | 51.01367 |
| 120 | 58.71955 | 41.28045 | 61.42090 | 38.57910 |
| 180 | 77.04858 | 22.95142 | 77.27807 | 22.72193 |
5. Conclusions
In this work, the kinetics of wood degradation have been analyzed using a nonisothermal weight loss technique with heating rates of 3.1, 9.8, and 14.5 °C/min for SCE and 5.2, 11.3, and 16.3 °C/min for SCM. Three different kinetic analysis methods were implemented to obtain the kinetic parameters such as apparent activation energy and overall reaction order for wood degradation in supercritical alcohols. From this work, the activation energies of wood degradation in SCE were obtained as 78.0–86.0, 40.1–48.1, and 114 kJ/mol according to the kinetic analysis method used in this work. In addition, the activation energies for SCM were obtained as 73.5–77.8, 45.2–48.8, and 52 kJ/mol, according to the same kinetic analysis methods followed previously. It was also found that there were variations in the calculated kinetic parameters, depending on the mathematical approach.
At the supercritical region, it was found that conversion is higher in SCE at lower temperatures than in SCM. The product analysis shows that the majority of products fall in the carbon number range of 2 to 15. The products do not show many differences in terms of reaction temperature and holding time. SCE shows a specific pattern with change of reaction temperature and holding time, while SCE doesn’t show any specific pattern with these changes. Overall, SCE shows significant potential as a solvent for supercritical reactions, although further exploration is necessary.


