Article

Research on Resource Utilization of Bi-Level Non-Cooperative Game Systems Based on Unit Resource Return

1
Hubei Key Laboratory for High-Efficiency Utilization of Solar Energy and Operation Control of Energy Storage System, Hubei University of Technology, Wuhan 430068, China
2
School of Electrical and Electronic Engineering, Hubei University of Technology, Wuhan 430068, China
*
Author to whom correspondence should be addressed.
Energies 2025, 18(9), 2396; https://doi.org/10.3390/en18092396
Submission received: 23 February 2025 / Revised: 26 April 2025 / Accepted: 6 May 2025 / Published: 7 May 2025

Abstract

:
In a competitive market, due to differences in the nature of various power generation entities, there is a decline in resource utilization and difficulties in ensuring a return on investment for generating units within the system. A bi-level non-cooperative game model based on the Unit Resource Return (URR) is proposed to safeguard the interests and demands of each power generation unit while improving the overall resource utilization rate of the system. Firstly, we construct a comprehensive energy-trading framework for the overall system and analyze the relationship between the Independent System Operator (ISO) and the generation units. Secondly, we propose the Unit Resource Return (URR), inspired by the concept of input-output efficiency in economics. URR evaluates the return on unit resource input by taking the maximum generation potential of each unit as the benchmark. Finally, a bi-level non-cooperative game model is established. In the lower-level non-cooperative game, the generating units safeguard their own interests, while in the upper-level, the ISO adjusts the output allocation and engages in a master–slave game between generating units to ensure the overall operational efficiency of the system. URR is adopted as the ISO’s price-clearing equilibrium criterion, enabling the optimization of both resource profitability and allocation. Ultimately, both the upper and lower-level decision variables reach a Nash equilibrium. The experimental results show that the bi-level non-cooperative game model based on the Unit Resource Return improves the overall resource utilization of the system and enhances the long-term operational motivation of the generating units.

1. Introduction

With the large-scale integration of renewable energy into the grid, it has become a trend for renewable energy to participate in the electricity market competition [1,2]. Meanwhile, traditional energy sources, due to their high reliability, continue to play a crucial role in providing basic output for the power system. In the context of market competition, traditional and renewable energy sources exhibit different market competitiveness due to variations in cost structures and generation characteristics. System managers may show a preference for the output allocation of different generation units, which can lead to an uneven distribution of energy. As a result, the full potential of power generation units may not be realized, and investment returns may be hard to guarantee. Further research is needed to explore how to improve the resource utilization of the system, maintain the profitability of generation units, and ensure the long-term stability and development of the system.
Energy generation units belonging to different stakeholders are difficult to optimize using traditional single-entity scheduling methods [3]. Existing research often uses game theory models to address the scheduling issues of power generation units from different stakeholders. In [4], non-cooperative games are formed among electricity retailers, while Stackelberg games are established between retailers and users, with the game objectives being to maximize retailer profits and enhance user satisfaction. In [5], a combination of leader–follower and cooperative games is used to maximize the benefits of the distribution network operator and the integrated energy microgrid, which helps achieve coordinated operation and improve microgrid efficiency. In [6], a non-cooperative game is nested within a leader–follower game to effectively enhance the profits and strategic flexibility of multiple energy suppliers. In [7], the leader–follower game is used to coordinate the operation of shared energy storage and the integrated energy microgrid cluster, embedding cooperative games between microgrids to maximize the benefits of both shared energy storage and the microgrid cluster. All the game participants in the above studies focus on their own interests and consider the competitive and interactive behaviors between different stakeholders. However, fewer studies approach the scheduling of the system’s stakeholders from an objective perspective.
The Independent System Operator (ISO), as a common non-profit organization, ensures fairness and effectiveness in the electricity market and balances the interests of various stakeholders and fostering a competitive environment [8]. In [9], after multiple smart grids submit their bids, the ISO determines the clearing price with the objective of minimizing the smart grid’s costs. The smart grids then make optimal scheduling decisions based on the prices and operational constraints provided by the ISO. In [10], the ISO functions as an information hub and is primarily responsible for market clearing after receiving the planning and decision-making proposals from other market participants. It also provides feedback on locational marginal prices, generator active output, and other information, but does not directly participate in the power system planning issues. In [11], the ISO, in coordination with power generation companies and demand response markets, conducts a leader–follower game aiming to minimize purchasing costs and demand response incentive costs, while releasing incentive signals to alleviate supply–demand tension. In [12], each retailer maximizes its profits through its pricing strategy, while consumers make choices between retailers based on welfare maximization models considering price and service factors. The ISO balances supply and demand through market clearing to set electricity prices. In the above studies, the ISO is treated as the system leader, which ensures the objectivity and fairness of the game. However, market clearing is often carried out by maximizing consumer utility and minimizing the production costs of power generation companies. In this operational model, higher-cost generation units are assigned less generation output by the ISO, which may lead to poor returns on investment for the game followers. This results in a large number of idle units, reduced resource utilization, and ultimately undermines the long-term enthusiasm of power generation units.
To improve the overall resource utilization of the system under market competition, it is essential to evaluate the resource allocation of different market participants and ensure the return on investment for the investors. In [13], a new bidding model is proposed that considers the constraints of energy storage and market electricity demand, to promote the optimal allocation of energy storage resources and enhance their market profitability. In [14], a capacity optimization configuration method is proposed, aimed at maximizing the investment return rate of pumped storage, guiding the rational allocation of different types of capacities for pumped storage, thereby enhancing the security and economic efficiency of grid operation. Reference [15] aims to maximize the daily comprehensive net revenue of a hybrid energy storage system, taking into account demand-side response, while balancing system reliability and economic efficiency, and improving the utilization rate of renewable energy. In [16], the Return on Investment (ROI) is used as the objective function to measure the economic feasibility of base station systems. ROI is the ratio of the returns obtained from an investment over a given period to the amount of investment, which serves as an indicator to measure the profitability of investment projects or assets. These studies focus on different scheduling objectives and consider the overall economic benefits of the system. However, most of the objectives are oriented toward enhancing the overall economy of the system, with relatively less emphasis on resource utilization.
In summary, (1) Regarding the competitive–cooperative relationships among multiple stakeholders, most of the scheduling models for power generation units in existing literature focus either on maximizing individual interests or fully following the leader’s allocation, with limited studies considering both the competition between multiple generation units and the optimization of overall system resource allocation in the scheduling process. (2) Existing literature on ISO often uses generation unit costs as the scheduling objective, which can lead to uneven output distribution, resulting in lower investment returns and resource utilization efficiency. On the other hand, existing literature on investment returns mainly focuses on system economics and less on studying the contribution of generation units from the perspective of resource input. Therefore, this paper proposes a bi-level non-cooperative game model based on Unit Resource Return (URR). First, the URR is proposed to evaluate the profits and resource inputs of generating units, improving the overall resource utilization of the system and the profitability of generating units. Secondly, a bi-level game model for energy information interaction between the ISO and generating units is established. The upper level is a master–slave game optimization model regarding price clearing between the ISO and generating units, while the lower level is a non-cooperative game model in which generating units participate in market competition. It ensures the autonomy of each generating unit and the overall stability of the system’s profits.

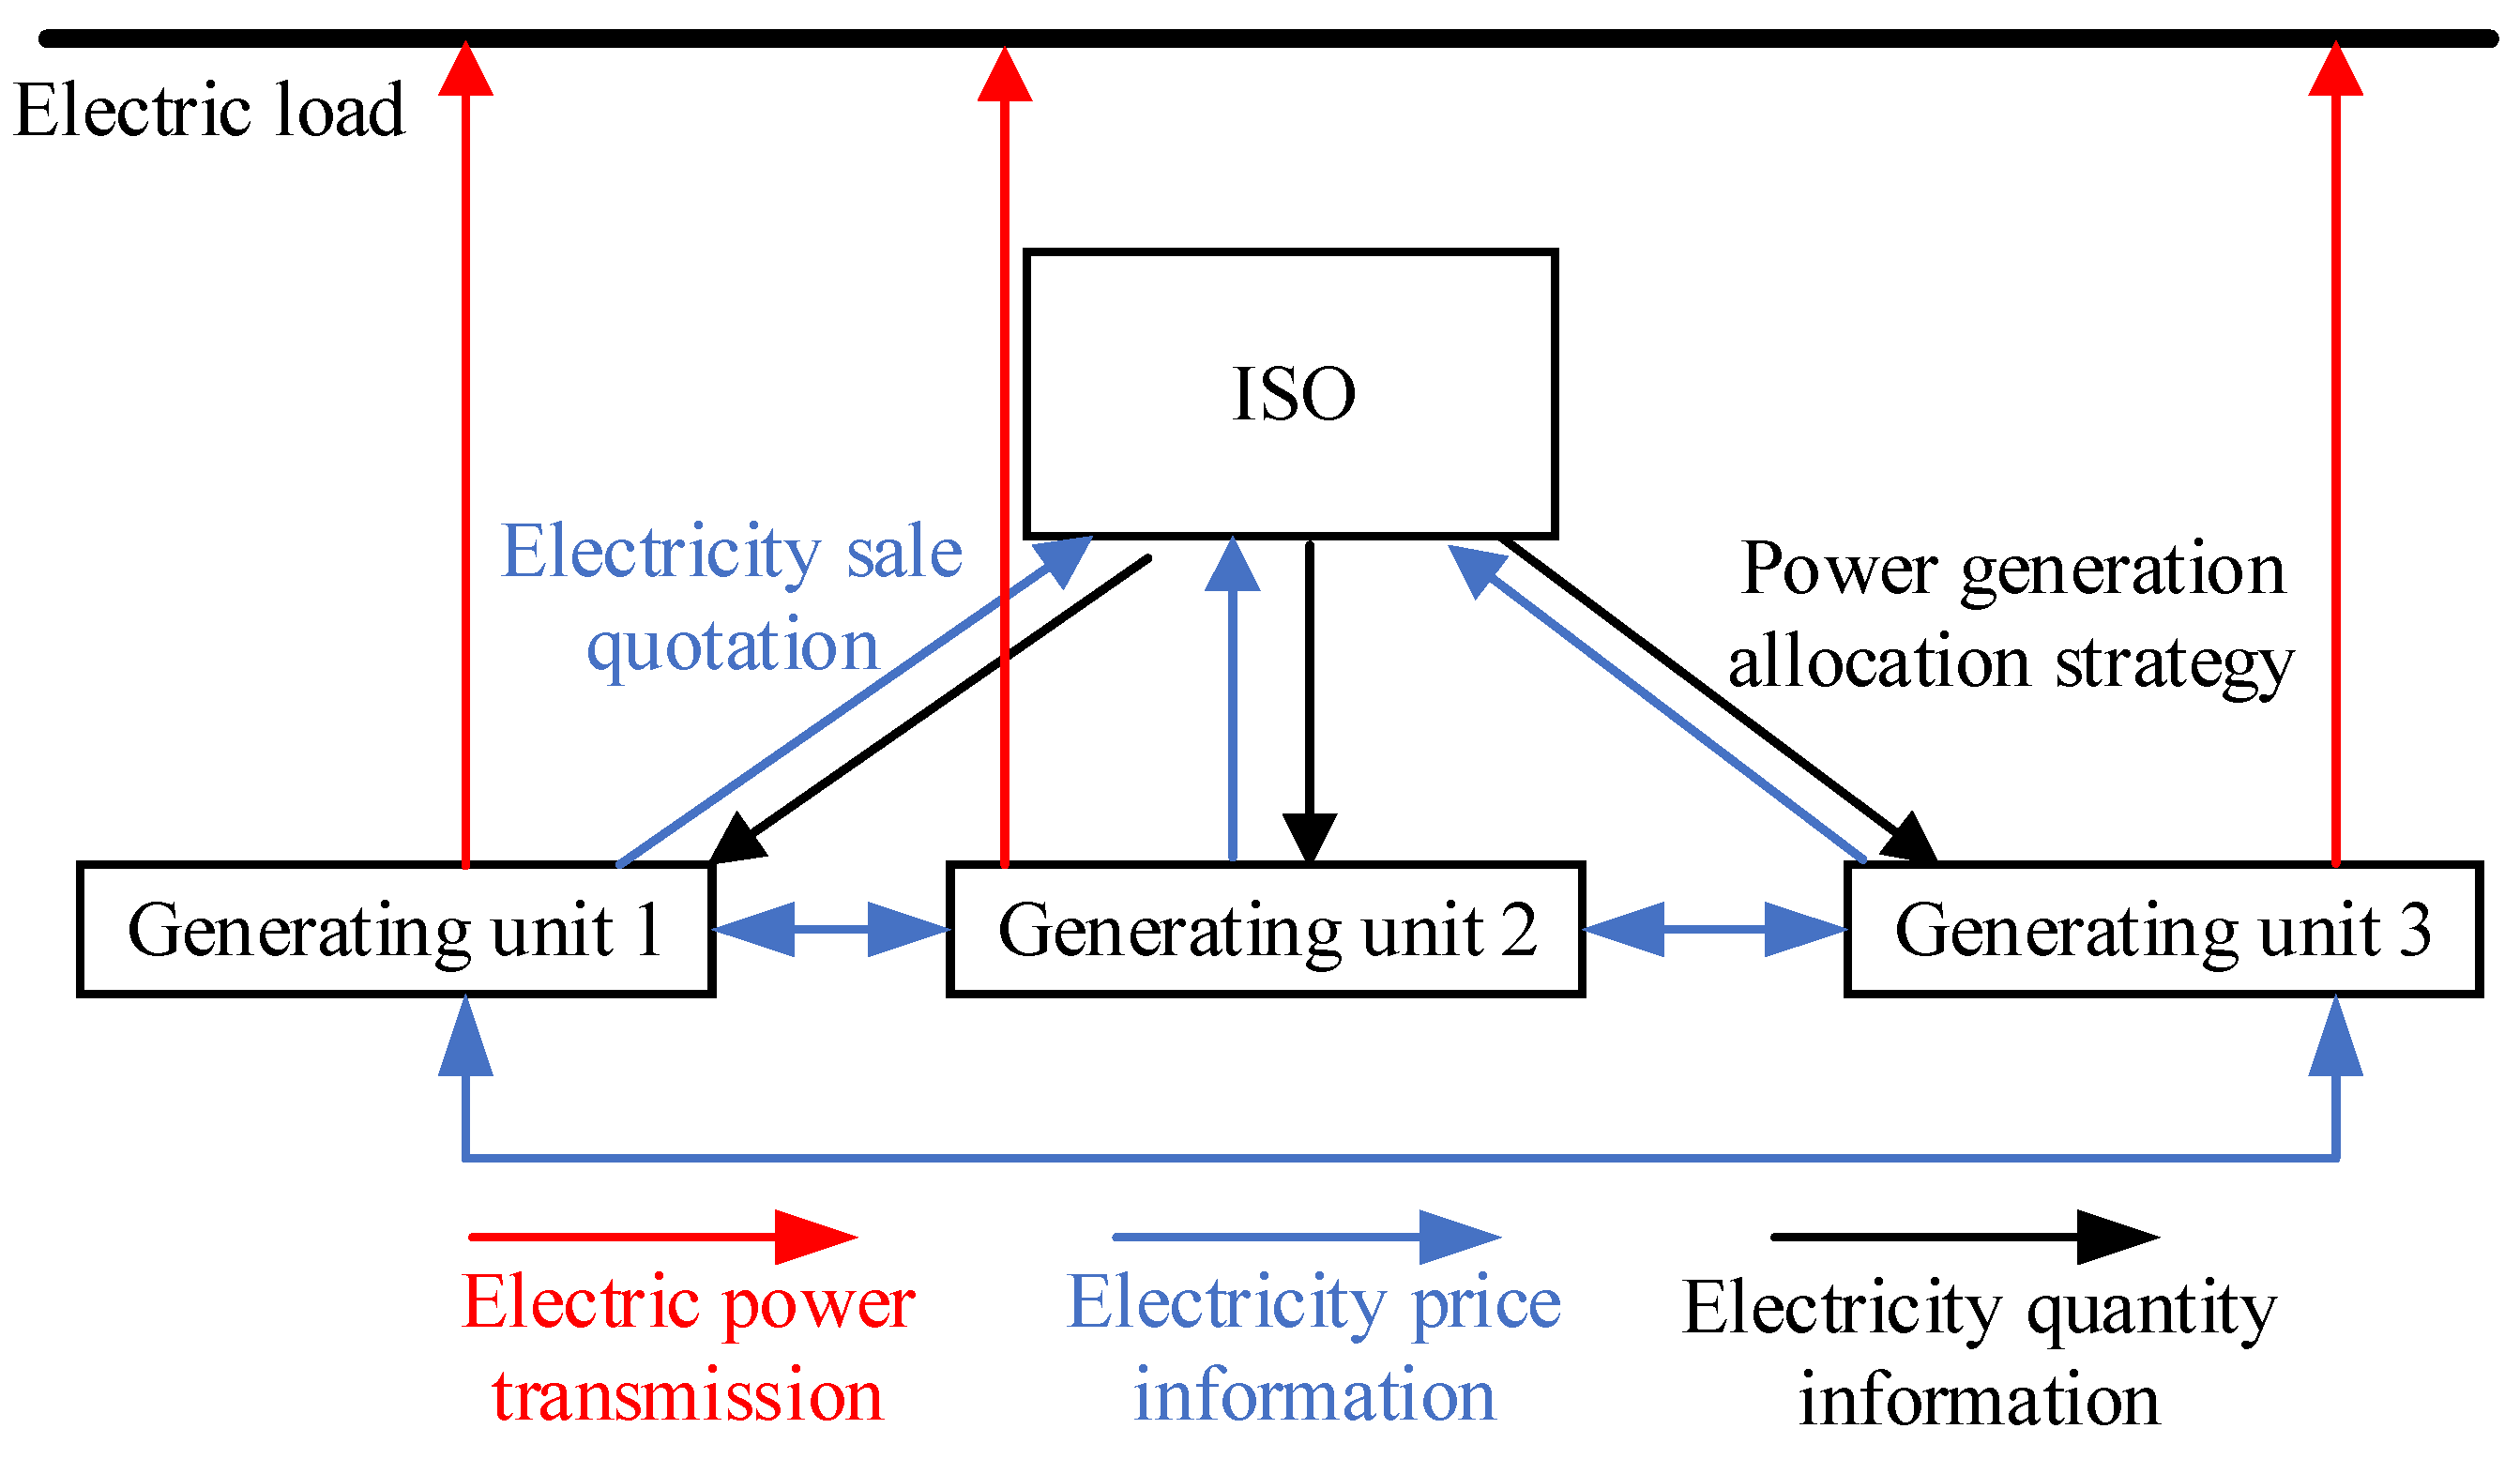
2. System Energy-Trading Framework

The energy-trading framework of the system is shown in Figure 1. Under this framework, a market model based on power generation unit bidding is used. The ISO clears the market with the objective of minimizing the system’s generation costs and maximizing the overall resource utilization of the system. Power generation units bid by maximizing their own profits within the specified electricity price ceiling, based on the bidding information from the previous round that is provided by the ISO and other generation units. The results are submitted to the ISO, which adjusts the power allocation strategy and then returns it to the generation units. The process of iterative bidding continues until a final price and generation schedule are determined.

3. Analysis of System Resource Utilization Rate

3.1. Unit Resource Return

The common standard for evaluating the economic feasibility of an investment is ROI [16]. ROI, which considers both revenue and costs, can more accurately assess the profitability of a project. The formula for ROI is defined as [17]
ROI = M C C
where M represents the investment return, which includes net profit, capital appreciation, or other forms of returns. C represents the investment cost, which refers to the capital or funds invested in the project or asset.
Since ROI mainly focuses on economic benefits, when referencing day-ahead scheduling, considering the significant differences in equipment, environment, and stability among generation units, we use the power generation output of the units as resource input and define the unit resource return.
URR i = M i I i D i
where Mi denotes the revenue of generation unit i. Ii represents the generation cost of unit i. Di indicates the resource consumption of unit i. i represents the generating unit identifier, including represents the wind power unit WT, the thermal power unit TPP, and the photovoltaic unit PV. There are a total of n generating units in the system, indexed by j.
  • URR of Wind and Photovoltaic Generation Units
The resource consumption of wind and solar is defined as the maximum power generation capacity of the wind and solar power units. The URR for these renewable energy sources is expressed as
URR i = t = 1 N x i t P i , max t
where xi(t) represents the profit of the wind and photovoltaic generating unit at time t, Pi,max(t) is the power output upper limit at time t for the generation units i at time t, N = 24 is the total time period.
2.
URR of Thermal Power Generation Units
The resource consumption of thermal power is defined as the generation power of the thermal power unit in the current period. The URR for this type of conventional energy is expressed as
URR TPP = t = 1 N x TPP t P TPP , sell t
where xTPP(t) represents the profit of the thermal power generation unit at time t, PTPP,sell(t) is the power generation task assigned by the ISO to the TPP at time t.
URR standardizes the profit of a generation unit for a given time period based on its maximum generation potential for that period, maximizing the unit output profit of all generation units. Since it takes into account the resource consumption of generation units, URR focuses more on the unit output profit and the generation efficiency of the units. When URR is high, it can encourage generation units to operate under high-return conditions. It ensures the long-term operational motivation of the generation units, helping to improve the economic efficiency and resource utilization of the system, while reducing resource waste.

3.2. System Resource Utilization Function

The overall system resource utilization function is:
f 1 = j = 1 n URR j
where URRi represents the Unit Resource Return for each generating unit over a time period.
This objective function focuses on URR, which helps improve the efficiency of generating units and optimize resource allocation. It can prevent resources from being overly concentrated in a few efficient units and maintain the stability of system profits.

4. Bi-Level Non-Cooperative Game Model

4.1. Bi-Level Non-Cooperative Game Optimization Framework

To balance the profits of different generating units and optimize the system resource allocation, we construct a bi-level non-cooperative game optimization model between the ISO and generating units.
The game model is divided into two stages: Stage 1 constitutes the upper-level leader–follower game between the ISO and the generation units. As a non-profit coordination and dispatch authority within the system, the ISO seeks to minimize total generation costs while simultaneously maximizing system-wide resource utilization efficiency. Based on the bidding information provided by the generation units, the ISO adjusts the power allocation strategy and transmits this strategy to Stage 2. Stage 2 is the lower-level non-cooperative game model within the generating unit system, where each generating unit aims to maximize its own profits. Based on the generation allocation strategy input from Stage 1, each generating unit calculates its optimal electricity selling price and sends the pricing strategy back to Stage 1. The bi-level game framework is shown in Figure 2.

4.2. Modeling of Lower-Level Generating Units

The generating units, as game followers, optimize the bids for internal combustion generators, wind turbine generators, and photovoltaic generating units based on the generation allocation strategy set by the ISO, and return the bids to the ISO.

4.2.1. Objective Function

The optimization goal of the generating unit is to maximize its own profit, which includes revenue from electricity sales and generation costs. The objective function can be expressed as:
max x i = t = 1 N c i , sell t P i , sell t I i t
where Pi,sell(t) represents the generation amount given by the ISO at time t, ci,sell(t) is the bid price of generating unit i at time t and Ii(t) is the gas cost and penalty cost of generating unit i at time t.
  • Wind and Photovoltaic Generation Units
The cost of wind power (photovoltaic), which is the curtailment cost of wind (solar), can be expressed as:
I i t = k i P i , max t P i , sell t
where ki is the curtailment ratio coefficient for wind (solar) power.
2.
Thermal Power Generation Unit
The cost of thermal power, which is the gas purchase cost, can be given by:
I TPP t = c buy G TPP , g t
where cbuy is the gas purchase price and GTPP,g(t) is the amount of natural gas purchased by the thermal power unit at time t.

4.2.2. Constraints

  • Electricity Selling Price Constraints
The electricity selling price reported by the generating unit should be within a certain limited range [18]. The electricity selling price constraints for each generating unit at different time periods are expressed as follows
c i , min c i c i , max
where ci,min and ci,max represent the lower and upper bounds of the electricity selling price for generating unit i, respectively.
2.
Overall System Electricity Selling Revenue Constraints
Since the revenue from the power generation units’ sales is borne by the load side, the ISO will ensure that the overall system electricity selling revenue does not exceed the users’ capacity to bear. The constraint is given by
j = 1 n t = 1 N c j , sell t P j , sell t X
where X represents the total electricity selling revenue of the generating unit for one day.

4.3. ISO Objective Modeling

As a participant in the electricity market planning process, the ISO adjusts the generation allocation of the generating units based on the bid strategies provided by each generating unit.

4.3.1. Objective Function

The objective function of the ISO is defined as simultaneously considering minimizing the generation costs and maximizing the resource utilization efficiency of the system, expressed as:
max F ISO = w f 1 f 1 N ( 1 w ) f 2 f 2 N
f 2 = j = 1 n t = 1 N I j t
where f2 is the total generation cost of the system, w is the weight coefficient, reflecting the focus of ISO on system resource utilization and generation cost, f1 and f2 represent the formulas for resource utilization and system generation cost, respectively, and f1N and f2N represent the benchmark values for resource utilization and system generation cost, respectively. Both f1N and f2N are constant values, calculated using the output and price given by Equations (5) and (12).
Under the objective function of max FISO, the proposed URR is introduced as a resource utilization evaluation function, enabling the ISO to better assess the efficiency of translating renewable energy potential into actual dispatch outcomes and to reduce wind and solar curtailment. At the same time, by using Equation (11) as the objective function, the model seeks to fully mobilize the maximum possible output of wind and solar resources, enhancing the system’s actual generation capacity given resource availability. This allows for the effective exploitation of renewable energy potential, improves the system’s generation adequacy under various operating conditions, enhances overall system reliability, and reduces dependence on the capacity market.

4.3.2. Constraints

Considering the safe operation and the overall supply–demand balance of the system, the electricity output of wind and solar generation units cannot exceed their maximum generation capacity. Thermal power units must satisfy operational constraints, output power limits, and ramp rate constraints [19,20]. The total generation capacity of all power generation units in the system must meet the contractual demand set by the ISO. This paper does not consider selling electricity to loads outside the contract.
0 P WT , sell t P WT , max t
0 P PV , sell t P PV , max t
P TPP , sell t = η G TPP , g t
P TPP , min P TPP , sell t P TPP , max
G TPP , down G TPP , g t + 1 G TPP , g t G TPP , up
j = 1 n P j , sell t = P load t
where PWT,max(t) and PPV,max(t) are the power output upper limits at time t for the wind and solar generation units, respectively, GTPP,g is the gas purchase amount of the thermal power unit at time t, PTPP,min and PTPP,max are the lower and upper limits of the output electrical power of the thermal power unit, respectively, GTPP,down and GTPP,up are the lower and upper limits of the ramp-up rate of the thermal power unit’s output electrical power, respectively, and Pload(t) is the load-side demand at time t as provided by the ISO.

5. Algorithm Solution Analysis

5.1. Upper-Level Leader–Follower Game in the Bi-Level Non-Cooperative Game Model

The model treats the ISO as the leader and the power generation units as followers, with the leader–follower interaction reaching a Nash equilibrium through their respective strategies [21,22,23]. Therefore, the leader–follower game model can be expressed as:
G = K ; P ; F ISO
  • Participants: ISO, and n generating units
    K = ISO , WT , TPP , PV ,
  • Strategy: The strategy of the ISO is N-dimensional and represents the generation allocation for each generating unit adjusted based on their bidding prices. It is expressed in vector form as P = P WT , P TPP , P PV .
  • Objective: The ISO, as the upper-level guiding module, does not consider its interests. However, as the overall system coordinator, it must ensure that the contributions of power generation units receive reasonable returns and improve the system’s resource utilization efficiency. Its objective function is calculated by Formula (11).

5.2. Lower-Level Non-Cooperative Game in the Bi-Level Non-Cooperative Game Model

There are direct conflicts of interest between generating units, especially between thermal power generation and renewable energy from wind and solar. They need to compete for the total electricity sales revenue share allocated by the ISO to ensure their own interests. Each generating unit, based on the generation strategy issued by the leader (ISO) and the previous electricity sales strategy of other units, formulates an appropriate bid to maximize its own profit, forming a non-cooperative competitive relationship until the game reaches Nash equilibrium [24,25]. The model can be expressed as:
G K = K ; ρ ; x
  • Participants: n different types of generating units
    K = WT , TPP , PV ,
  • Strategy: The strategy of each generating unit is an N-dimensional bidding strategy, which can be represented in vector form as ρ = c WT , c TPP , c PV .
  • Profit: The objective function of each generating unit can be calculated using Formula (6).

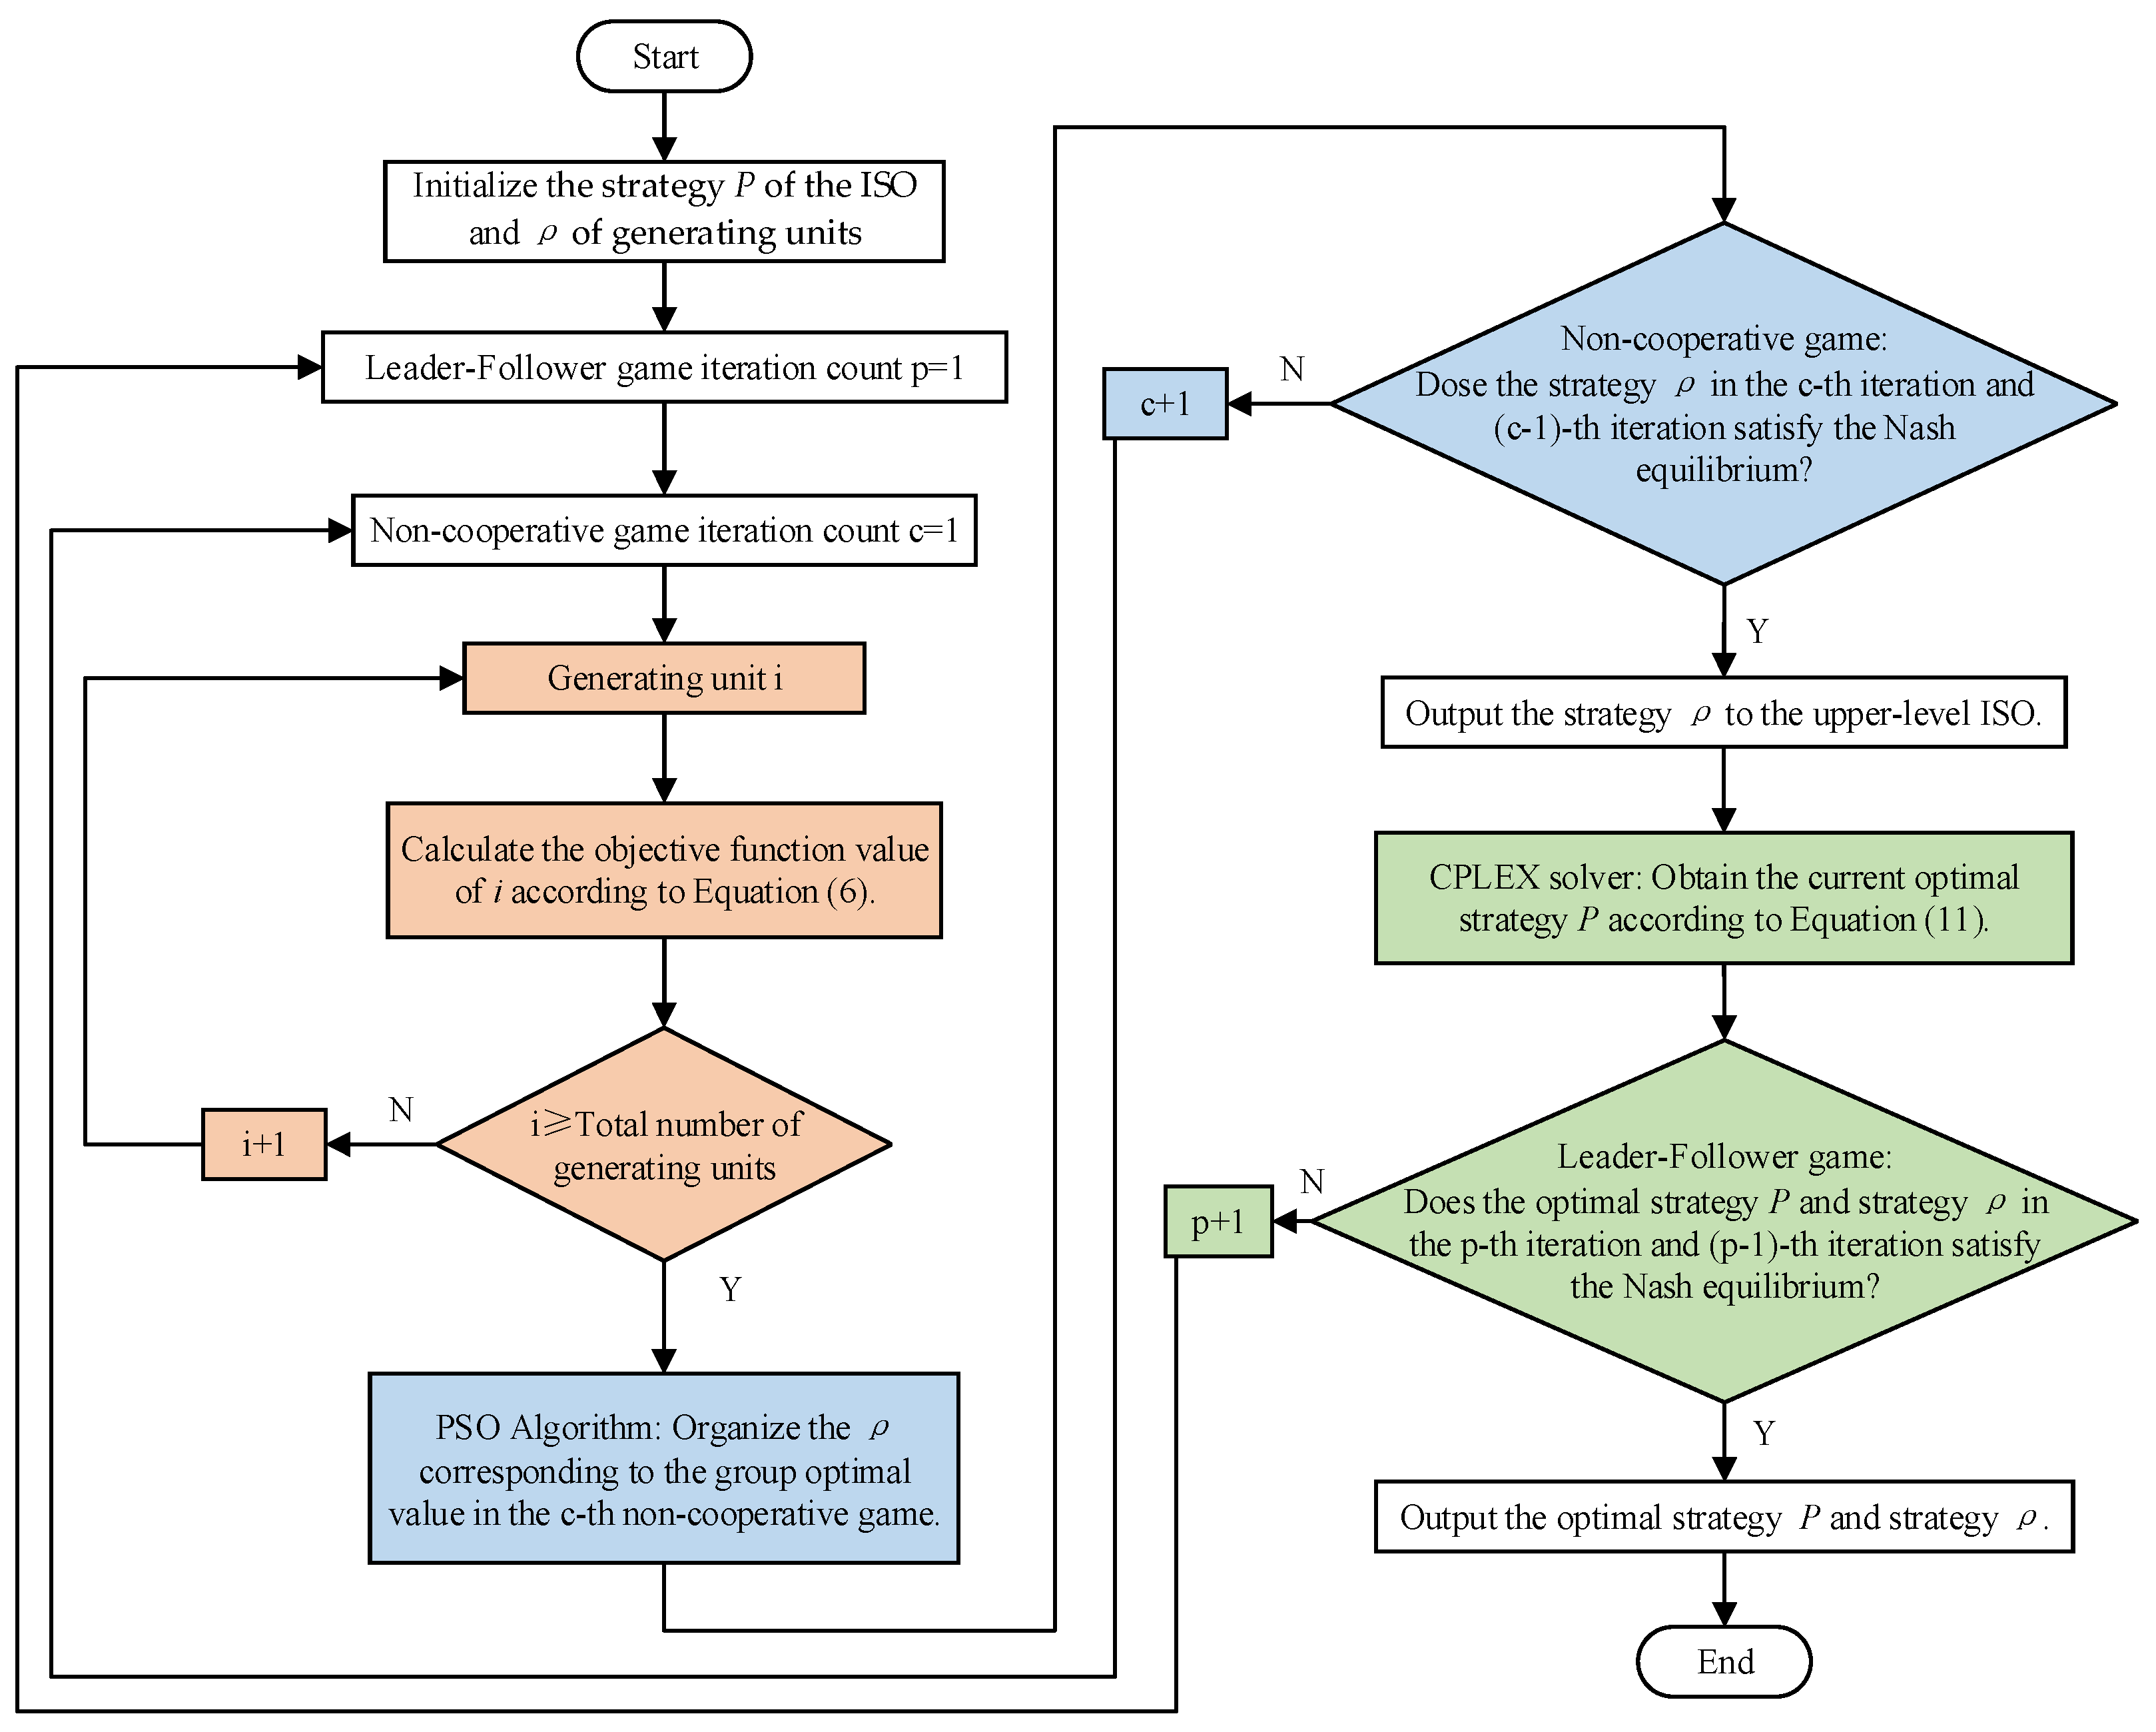
5.3. Algorithm Flowchart

For the bi-level non-cooperative game model proposed in this paper, an iterative loop-solving method is used, embedding the PSO optimization algorithm and the CPLEX solver, until the Nash equilibrium between the ISO and the generating units and the Nash equilibrium among different generating units are satisfied. The solving process of the model is shown in Figure 3.

6. Case Analysis

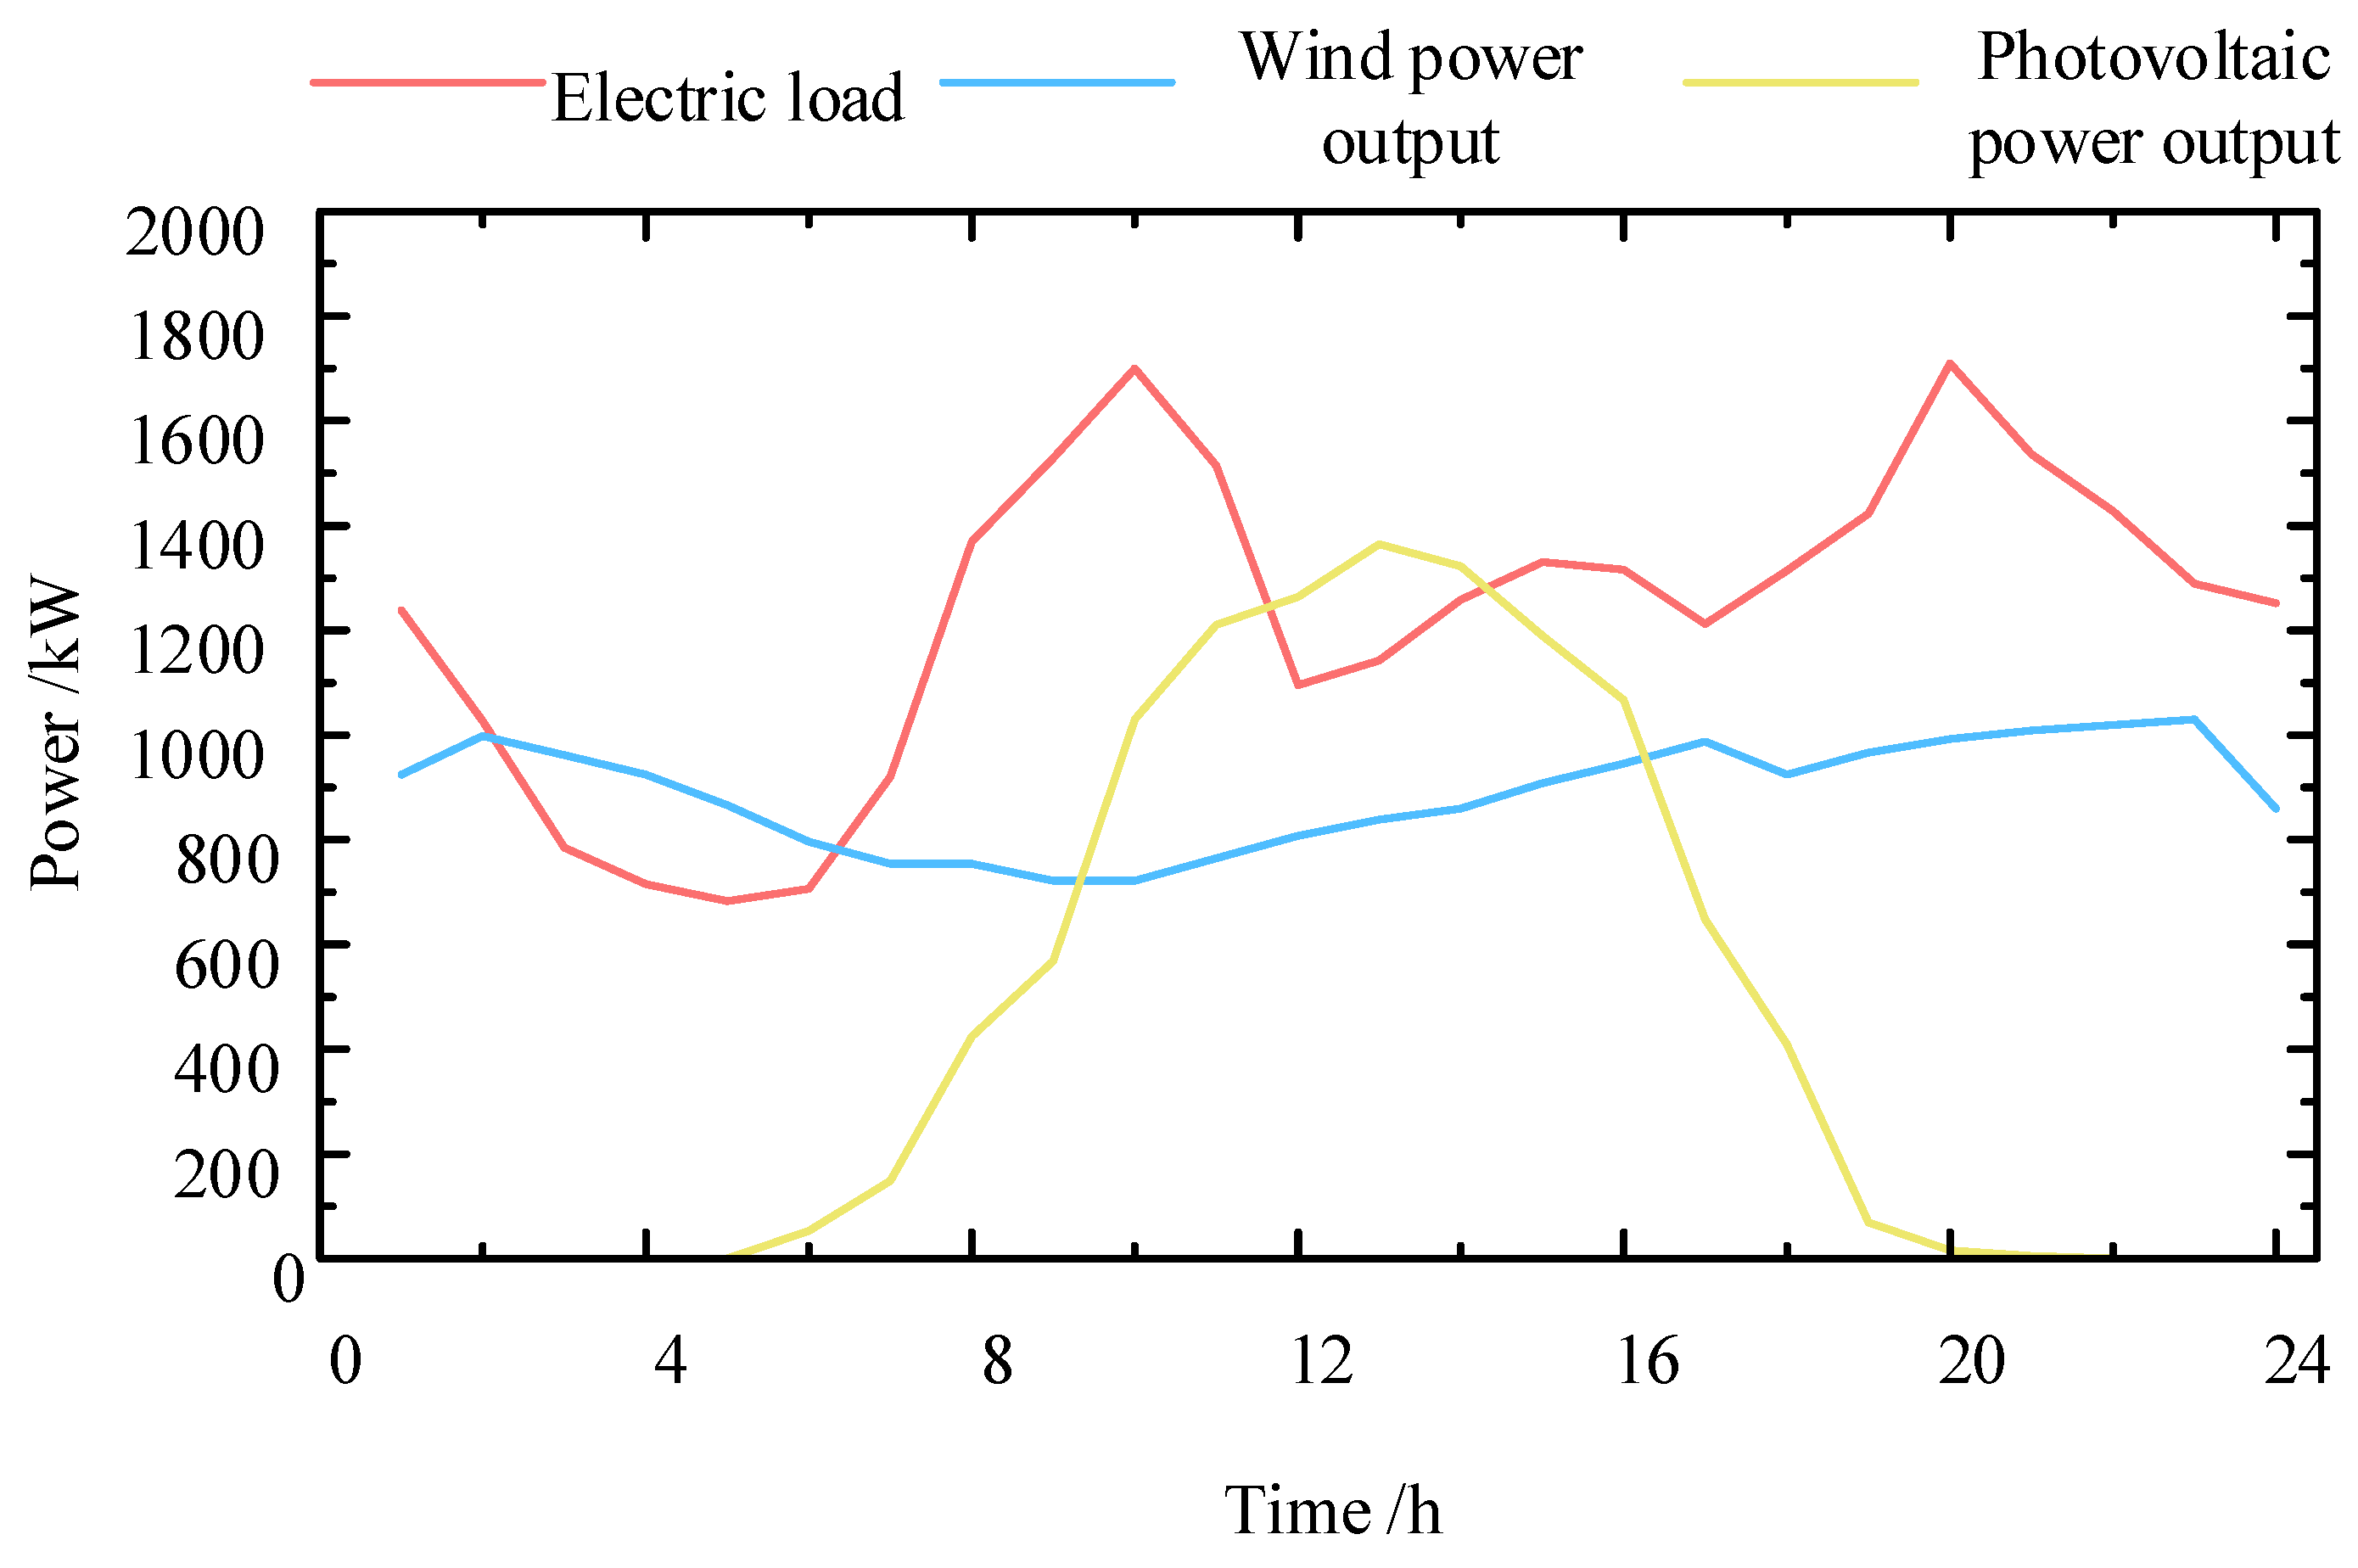
6.1. Basic Case Data

To verify the effectiveness of the proposed bi-level non-cooperative game model considering resource utilization for generation units and ISO, a simulation analysis is conducted with the following case study. The optimization scheduling is performed over a 24-h period (N = 24 h). The electric load in the load contract signed by ISO and the forecasted output of wind and solar are shown in Figure 4, with the natural gas price set at 0.35 RMB/(kW·h) [26]. The TPP equipment has a capacity of 600 kW with an energy conversion efficiency of 92% and a ramping constraint of 20%. The unit penalty cost for wind curtailment is kWT = 0.14 RMB/(kW·h), and for solar curtailment, the penalty cost is kPV = 0.13 RMB/(kW·h).
The example simulation is solved using the CPLEX 12.9 solver called through Yalmip on the Matlab R2019b, with the PSO optimization algorithm combined with the Nash equilibrium to solve the model. The PSO algorithm uses a maximum–minimum inertia weight of 0.9 and 0.4, with learning factors of 0.5 and 0.5 [27].

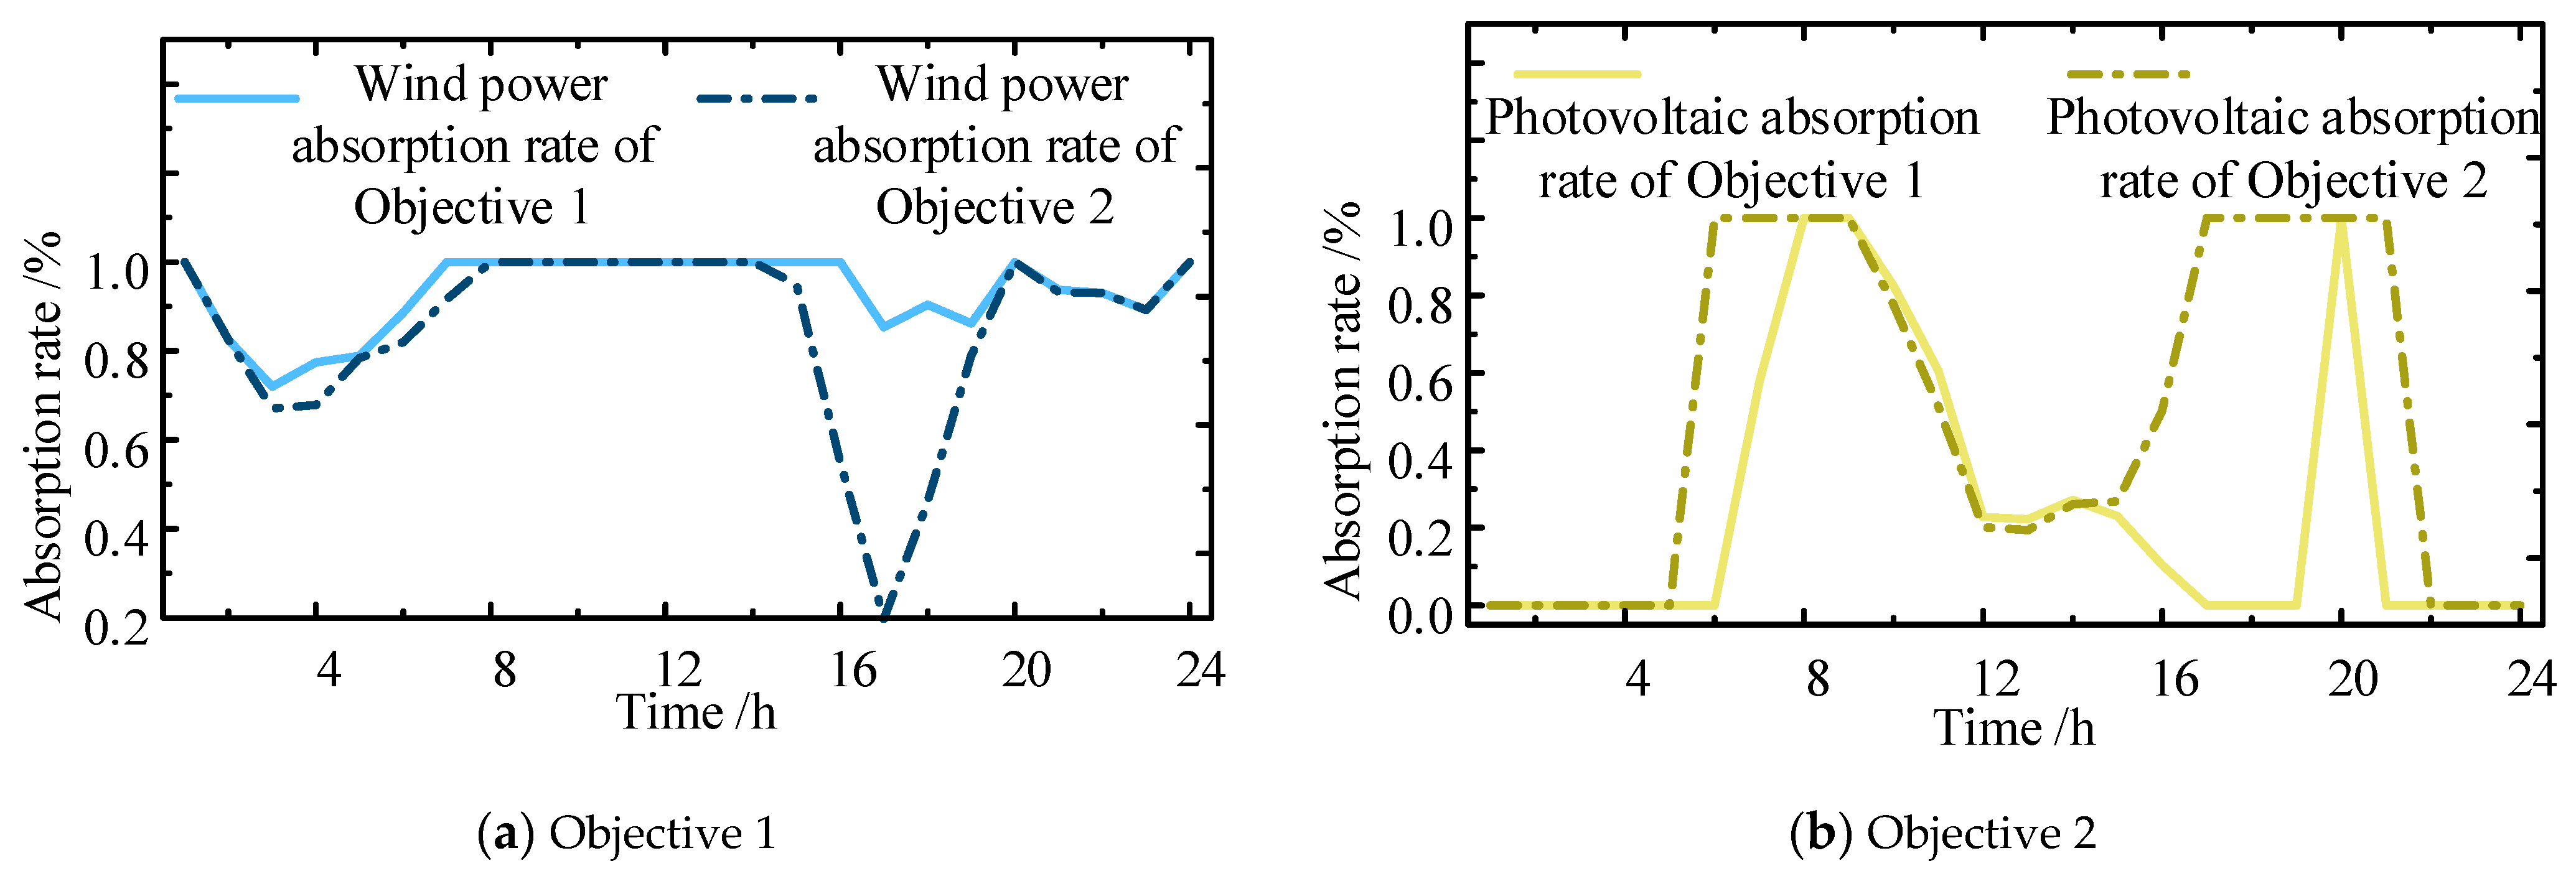
6.2. Analysis of the Impact of Different Objectives on the System

The output and selling prices of power generation units largely depend on the profit-seeking behavior of the units and the objectives pursued by the ISO. We have set two different objectives as optimization schemes for ISO scheduling. Objective 1 is to minimize the power generation cost, and Objective 2 is to maximize the URR. By solving for different objectives, we derive the profit, cost, absorption rate, URR, and price results of different power generation units in the system, as shown in Table 1 and Table 2. In Table 1, the standardized standard deviation of URR is calculated by dividing each power generation unit’s URR by the total URR and then calculating the standard deviation from the resulting values. The outputs and absorption rates of different generation units are shown in Figure 5 and Figure 6.
Since Objective 1 focuses on the generation costs of power units and emphasizes reducing wind and solar curtailment as well as gas purchases, the power allocation is more inclined towards wind and solar generation. As shown in Table 1, compared to Objective 2, Objective 1 achieves a wind power profit higher by 2678, a photovoltaic profit higher by 70, a total electricity sales revenue higher by 91, an increase in renewable energy absorption rate by 1.2%, and a reduction in total generation cost by 218. Figure 6a shows that the wind absorption rate in Objective 1 is more evenly distributed and approaches 1. However, from Table 1 and Figure 6b, it can be seen that the solar absorption rate decreases in Objective 1. Analyzing Figure 5a, it can be concluded that since the unit curtailment cost for solar is lower than that for wind, wind is prioritized when wind power alone can meet the load demand at hour 6. During hours 17–19, the absorption rate is not high due to the ramping constraints of the thermal power plant. Under Objective 1, the overall trend in ISO’s power distribution is to increase renewable energy generation and reduce thermal power output.
Since Objective 2 focuses on the generation potential of each power unit, aiming to maximize the unit output profit of all power units and reasonably evaluate the contributions of different units to the system. As shown in Table 1 and Table 2, compared to Objective 1, Objective 2 achieves a thermal power profit higher by 2439, a thermal power URR higher by 12.63, a photovoltaic URR higher by 10.22, a total URR higher by 20.85, nearly doubling the average electricity sales price of thermal power, reducing the profit standard deviation by 45%, and decreasing the standardized URR standard deviation by 38%. This is because the higher selling price of thermal power significantly improves its unit resource utilization rate. As shown in Figure 6, wind power makes certain concessions to photovoltaic power at 6:00, 17:00–19:00, and 21:00, enabling photovoltaic power to operate at full capacity during these periods, thereby significantly improving the unit resource utilization rate of photovoltaic power. Meanwhile, from Table 1 and Table 2, it is evident that the profit standard deviation and the normalized URR standard deviation under Objective 2 are smaller than those under Objective 1. This indicates that when URR is the objective, the profits of each generation unit are more balanced, which ensure that each unit’s contributions are rewarded accordingly.
In Table 2, it can be observed that the pricing of thermal power under Objective 2 is significantly higher than that under Objective 1, but the total revenue under Objective 1 is higher. Figure 5 shows that under Objective 1, wind power output is the highest, and since wind power has lower generation costs and higher curtailment costs, wind power has a competitive advantage in the lower-level non-cooperative game, leading to wind power being priced slightly higher in Objective 1 to gain more revenue. However, this also results in the inability to raise thermal power pricing, leading to lower profit margins, and consequently, the total resource utilization rate in Objective 1 is almost halved compared to that in Objective 2.
By comparing the system’s minimum cost approach with the maximum URR approach, it is clear that the cost-focused approach can increase the absorption rate of renewable energy but may also reduce the competitiveness of traditional energy sources like thermal power. On the other hand, the URR-focused approach maximizes the unit output profit of all generation units, encouraging each unit to improve efficiency as much as possible. As the leader, the ISO adjusts power output allocation based on the bids of different generation units, ensuring fairer competition among units and guaranteeing that all generation units can achieve relatively equitable profits. This approach, at a small cost sacrifice, significantly enhances the unit resource return, improves the balance of revenue among generation units, and avoids situations where some units are either overworked or idle.

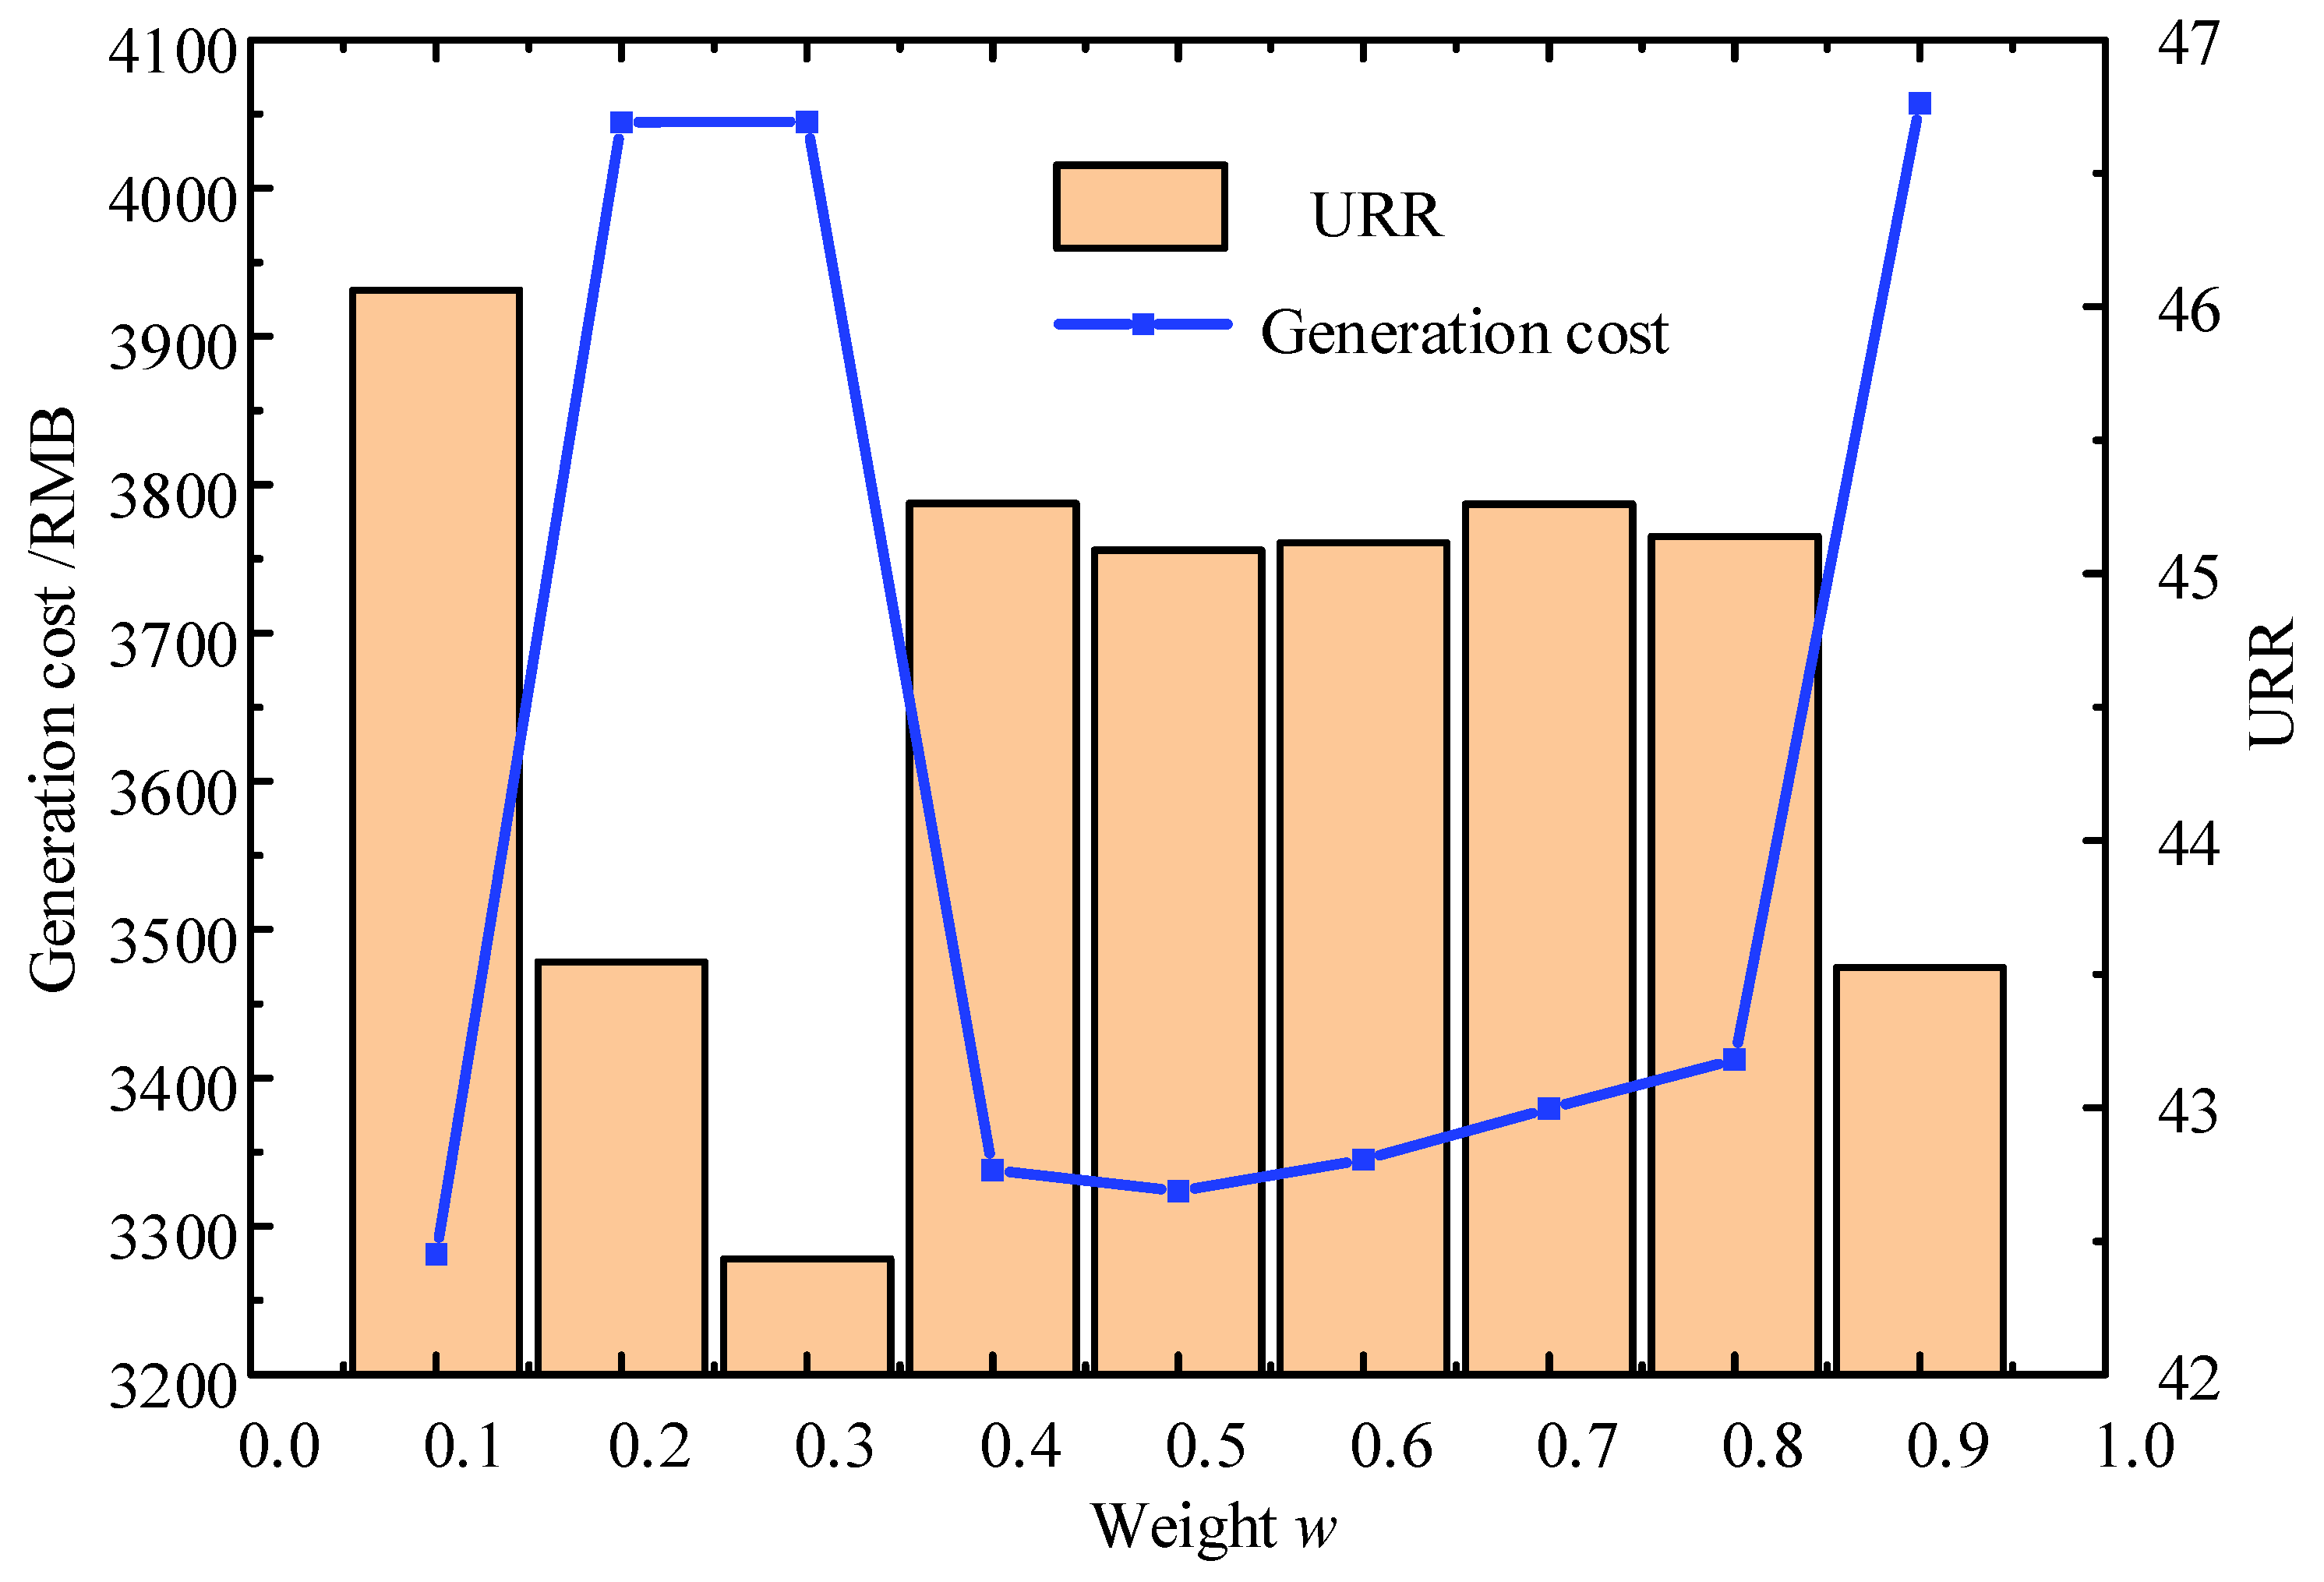
6.3. The Impact of Weight Proportions on Scheduling Results

The ISO objective in this study is a weighted combination of the system’s total URR and generation costs. Different weightings reflect the varying degree of importance the ISO places on the system’s total URR and generation costs. Objective 1 and Objective 2 represent the two extreme cases of the objective function with weights w = 0 and w = 1, respectively. The results of the total system URR, power generation cost, and the average final selling price under different weights are shown in Figure 7 and Figure 8. A reasonable adjustment of the attention weight can achieve a balance between system benefits and unit resource utilization.
By comparing the URR and costs in Table 1, it can be seen that as long as the ISO considers resource utilization, the system’s total URR remains above 40. This is due to the slight adjustments in wind and solar power generation during the early morning and evening periods, allowing photovoltaic power to operate at full capacity even when its maximum generation is inherently low during these times, thereby significantly increasing the system’s total URR. By comparing Table 1 and Figure 8, it can be observed that as long as the ISO considers resource utilization, the average bid of thermal power can be maintained around 1.2. This is also an advantage of maximizing URR, ensuring a higher return for each unit of generation contribution.
From the comparison of the model results under different weightings, it is evident that by selecting an appropriate level of ISO attention, a balanced outcome between system benefits and URR can be achieved. As long as URR is given some attention to the objective, the contribution returns from thermal power can be safeguarded. Applying this indicator to the evaluation of traditional energy sources, such as thermal power, can maintain their long-term operational incentives.

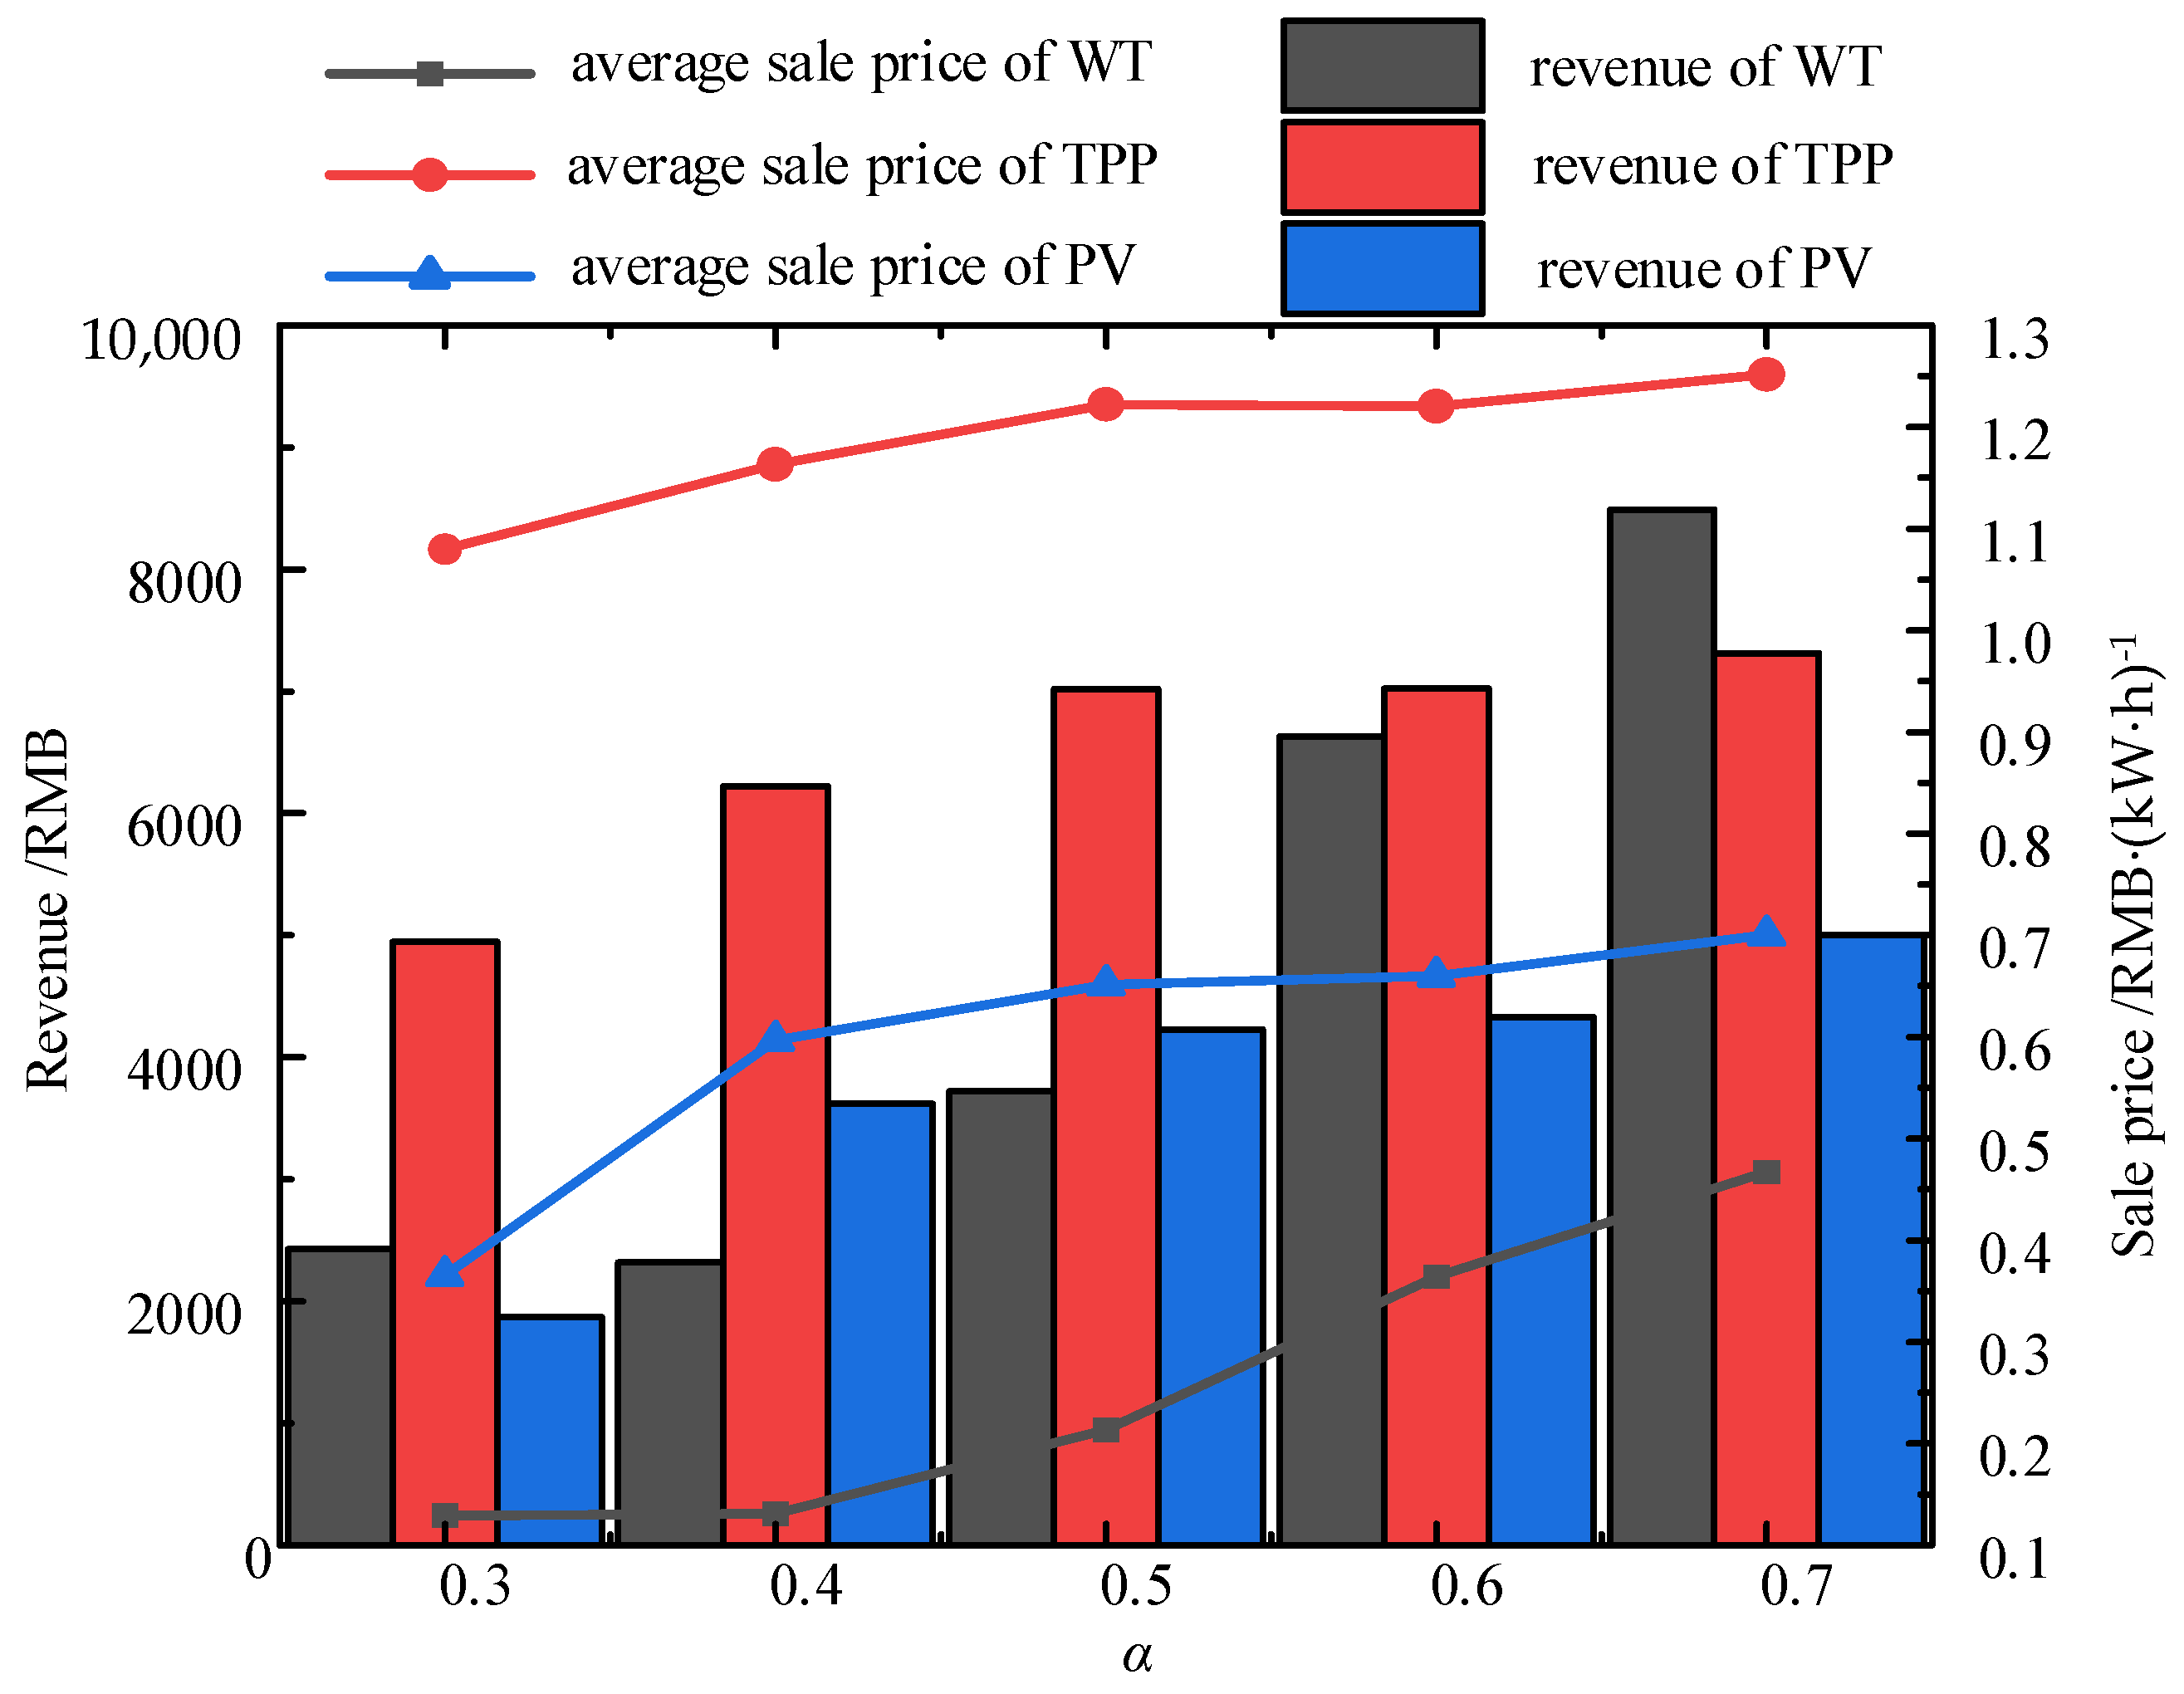
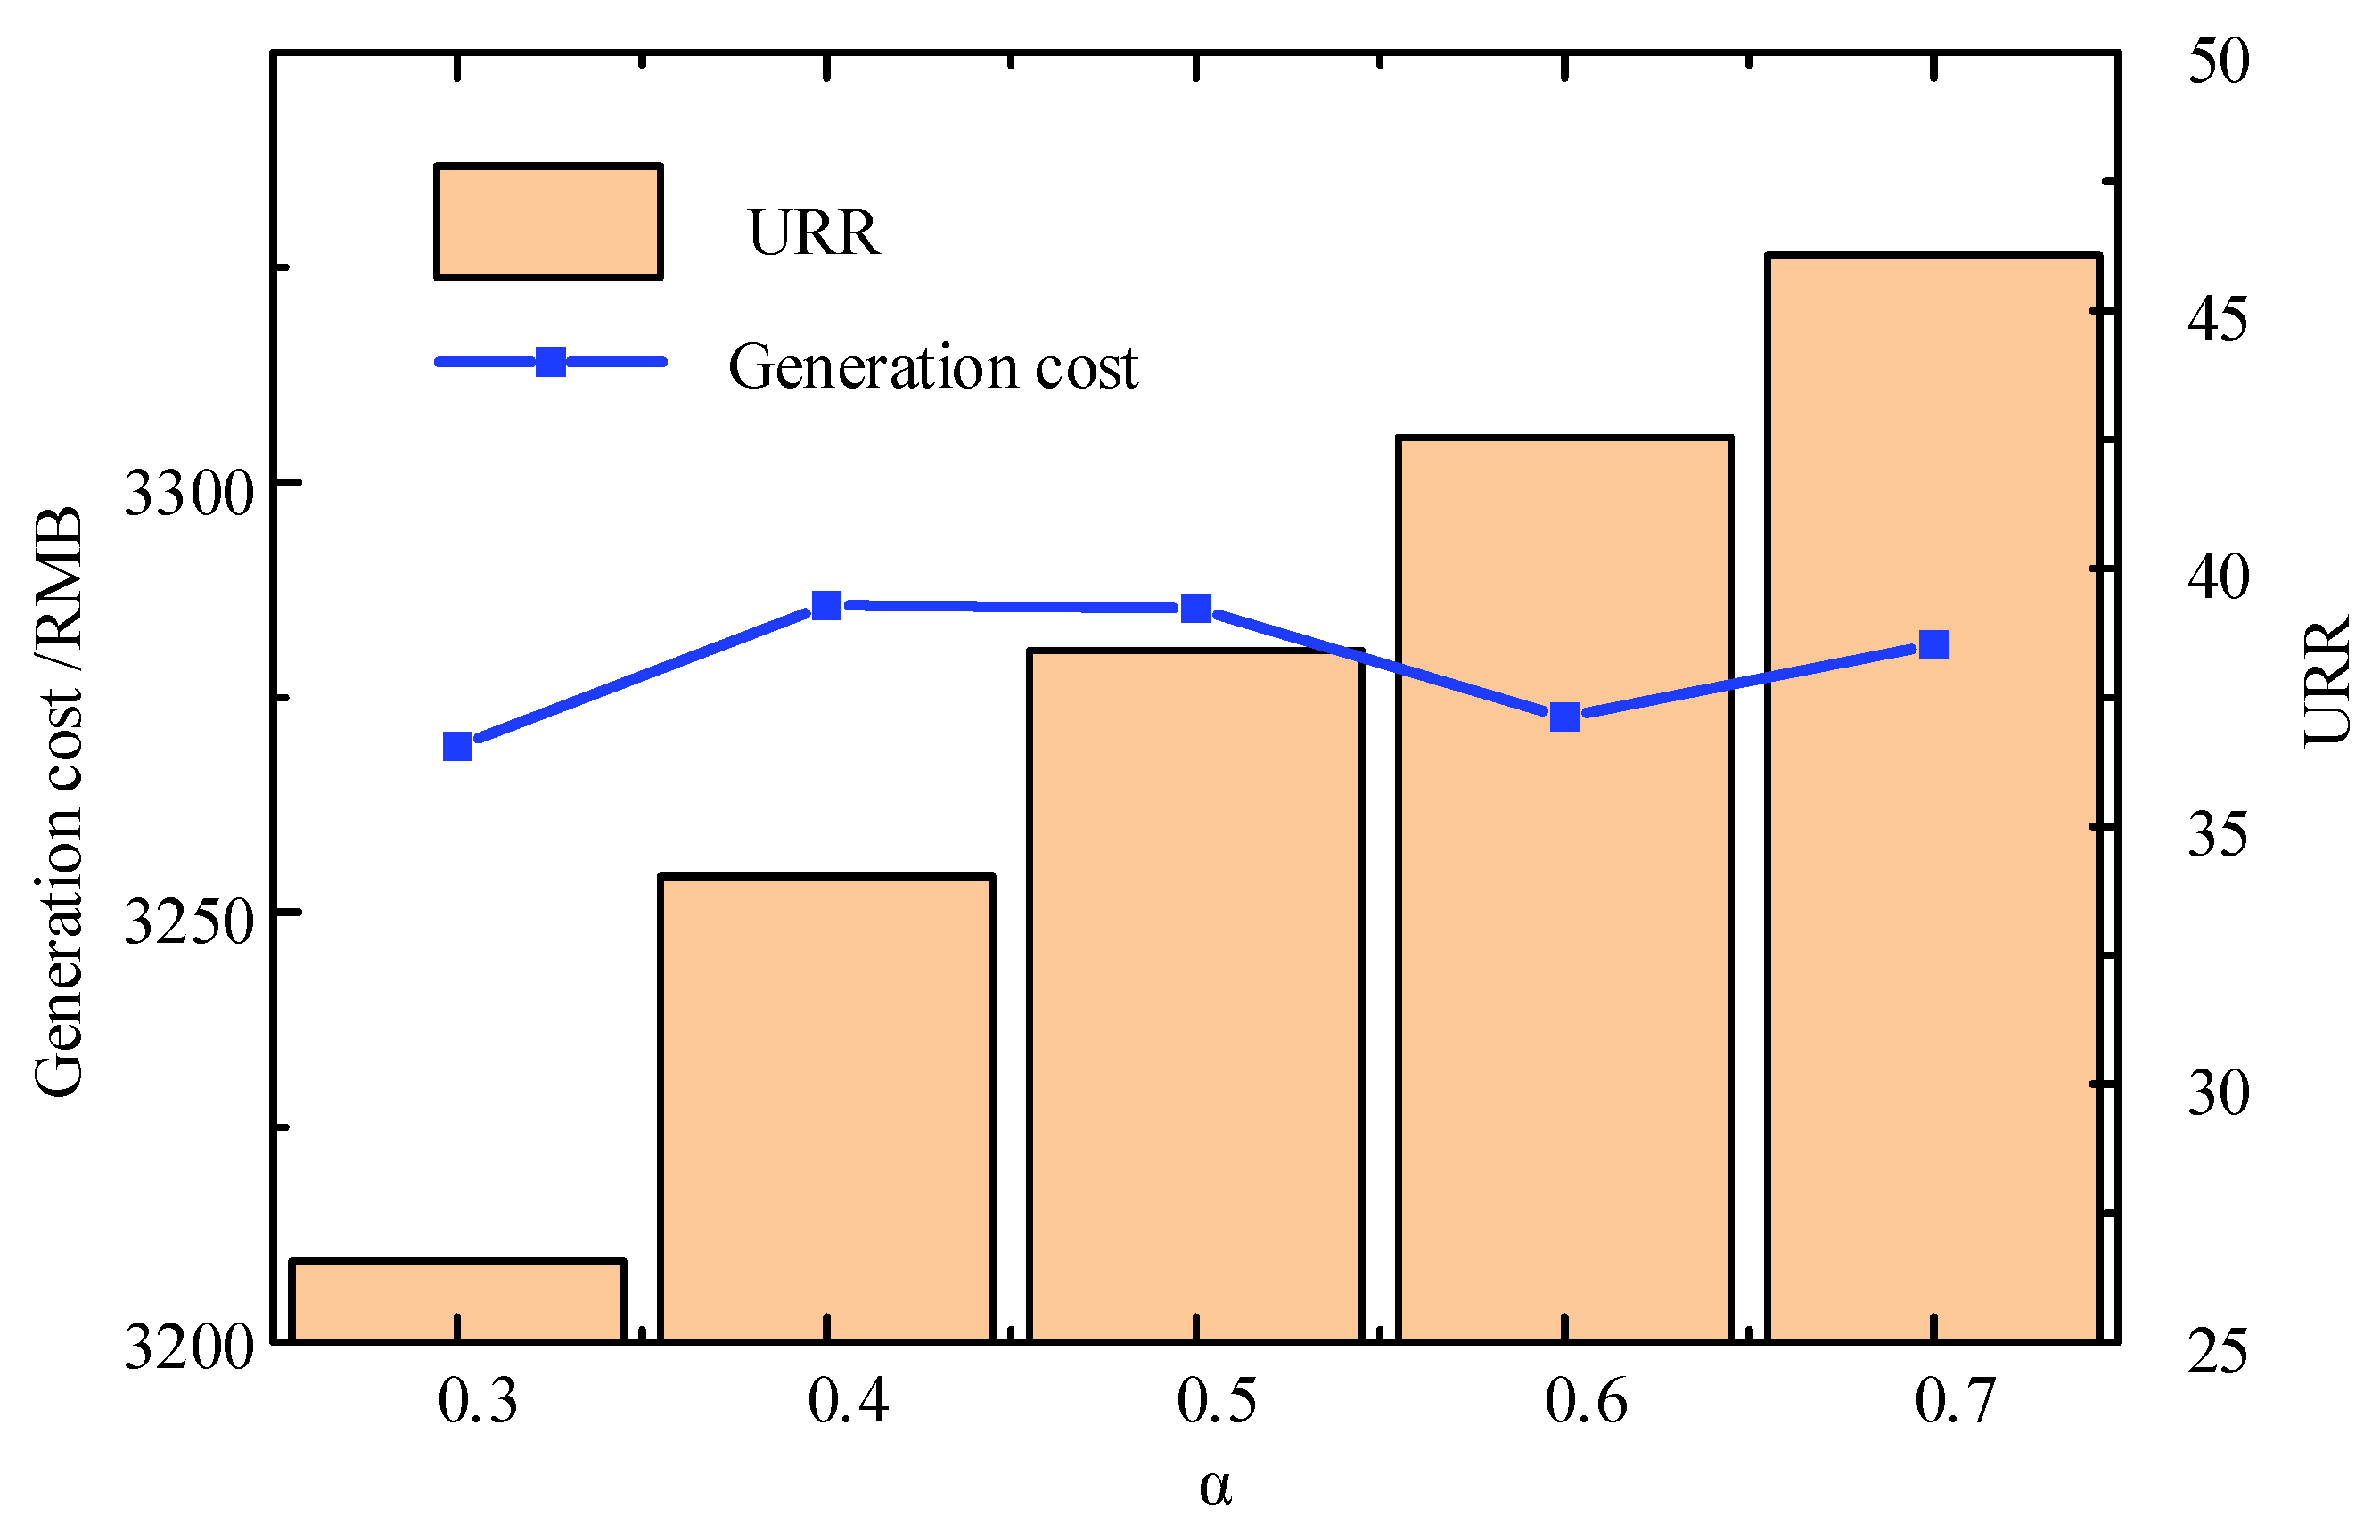
6.4. The Impact of the Total Revenue Constraint for Power Generation Units Issued by ISO on the Results

This experiment is set under the condition of w = 0.1 and the impact of the total revenue constraint issued by the leader ISO to power generation units on the system results is analyzed. The total electricity sale revenue constraint is set to X = α × Pload, issued by the ISO to the generating units, where α = 0.3~0.7. The results of the power generation unit’s revenue, average final selling price, URR, and power generation cost under different values of X are shown in Figure 9, Figure 10 and Figure 11.
As shown in Figure 9, the total revenue constraint directly affects the power generation unit’s pricing. The price of wind and solar power declines faster than that of thermal power. This is because when URR is included in the objective, maintaining a higher price for thermal power is the best way to sustain its output return rate. However, for wind and solar, URR will become negative when the price is low or the absorption rate is low.
Since w = 0.1, the generation cost has the greatest influence on the objective, so the output of thermal power remains nearly unchanged, while the output of wind and solar adjusts according to price changes. When X decreases, the electricity sale prices of wind and photovoltaic power decrease, and the influence of cost in the objective increases. This leads the ISO’s power allocation to lean solely towards either wind power or photovoltaic power, causing the URR of the party with fewer generation tasks to become negative. As can be seen from Figure 10, the number of negative values in photovoltaic URR at α = 0.3 is significantly higher than at α = 0.7, making it difficult to improve the total URR. As seen in Figure 11, the generation cost reaches its lowest value at 0.6, while URR continues to decrease, suggesting that a total revenue constraint of 0.7 or 0.6 can yield a more optimal result.
By comparing the results of output and pricing under different total revenue constraints, it can be seen that the total revenue constraint directly impacts the price. At lower prices, ISO carefully adjusts the output of thermal power to ensure the objective is met, mainly making slight adjustments to the output distribution of wind and solar, maximizing the total URR of the power generation units while minimizing cost, thereby achieving the optimal scheduling goal.

7. Conclusions

This study focuses on the complex optimal dispatch of heterogeneous generation units and proposes a bi-level non-cooperative game model based on the Unit Resource Return (URR). The model accounts for differences among generation units in terms of equipment characteristics, environmental conditions, and operational stability. By treating the generation output as a measure of resource input, we define the URR as the return per unit of resource input and incorporate it into the bi-level non-cooperative game framework. A leader–follower game is established between the upper and lower levels: the upper level aims to maximize the system-wide URR and minimize total generation cost, thereby guiding the system toward improved overall efficiency. The lower level consists of a non-cooperative game among the generation units, where each unit seeks to maximize its own electricity sales profit, ensuring the autonomy of market participants. The main conclusions are as follows:
  • The establishment of the bi-level non-cooperative game model enables a balance between the autonomy of individual generation units and the overall efficiency of the power system. In this framework, different generation units adopt distinct bidding strategies, fostering fairer competition among them. This ensures that each unit of output receives a reasonable return, encouraging the system to dispatch various types of generation units more equitably and avoiding situations where certain units are either excessively utilized or left idle.
  • Incorporating URR into the ISO’s dispatch objective can effectively guide system-level scheduling while ensuring a fair return on the contributions of generation units. The model simultaneously considers both generation cost and resource utilization efficiency. URR encourages all units to improve their operational efficiency, achieving a significant increase in unit resource returns at a relatively low cost. This approach maintains a competitive balance among different types of generation units, enhances the equity of profit distribution, and promotes sustained participation and operational enthusiasm across the system.
  • In the current model, generation units do not submit bids based on their true production costs. Instead, they optimize their bidding strategies by anticipating competitor behavior and system conditions in order to maximize their own profit—reflecting strategic bidding behavior. Future research may incorporate constraints on truthful bidding, regulatory mechanisms, or multi-agent evolutionary game approaches to enhance the model’s applicability in real-world electricity markets.

Author Contributions

Conceptualization, Y.Q. and B.F.; methodology, P.L.; software, P.L.; validation, Y.Q., P.L., and B.F.; formal analysis, Y.Q. and B.F.; investigation, B.F.; resources, Y.Q. and B.F.; data curation, P.L.; writing—original draft preparation, P.L.; writing—review and editing, Y.Q., P.L., and B.F.; visualization, P.L.; supervision, Y.Q. and B.F.; project administration, B.F.; funding acquisition, B.F. All authors have read and agreed to the published version of the manuscript.

Funding

This research was funded by Key Research and Development Program of the Hubei Province of China, grant number 2023BAB209.

Data Availability Statement

The original contributions presented in the study are included in the article, further inquiries can be directed to the corresponding author.

Conflicts of Interest

The authors declare no conflicts of interest.

References

  1. Wang, X.; Zhang, K.; Zhang, S.; Wang, F. Game Analysis of Multi-Energy Markets Considering Wind Power Bidding. Acta Energ. Solaris Sin. 2021, 42, 279–285. [Google Scholar]
  2. Mei, S.; Wang, Y.; Liu, F. A Game Theory Based Planning Model and Analysis for Hybrid Power System with Wind Generators-Photovoltaic Panels-Storage Batteries. Autom. Electr. Power Syst. 2011, 35, 13–19. [Google Scholar]
  3. Dong, L.; Tu, S.Q.; Li, Y.; Pu, T. A Stackelberg Game Model for Dynamic Pricing and Energy Management of Multiple Virtual Power Plants Using Metamodel-Based Optimization Method. Power Syst. Technol. 2020, 44, 973–981. [Google Scholar]
  4. Li, F.; Yu, K.; Chen, X.; Hua, H.C. Price Decision Optimization for Electricity Retailers Based on Dual Game under Carbon Constraints. Electr. Power 2024, 57, 126–136. [Google Scholar]
  5. Chen, L.; Zhu, Z.; Wang, K.; Guo, B.; Shuai, W.L. Optimal Operation of Distribution Networks and Multiple Integrated Energy Microgrids Based on Mixed Game Theory. Power Syst. Technol. 2023, 47, 2229–2243. [Google Scholar]
  6. Mi, Y.; Zhao, H.; Fu, Q.; Ma, S.Y.; Cai, P.C.; Yuan, M.H. Two-level Game Optimal Operation of Regional Integrated Energy System Considering Wind and Solar Uncertainty and Carbon Trading. Power Syst. Technol. 2023, 47, 2174–2188. [Google Scholar]
  7. Yang, D.; Wang, Y.; Yang, S.; Jiang, C.; Liu, X. Multi-microgrid and Shared Energy Storage Two-layer Energy Trading Strategy Based on Hybrid Game. High Volt. Eng. 2024, 50, 1392–1402. [Google Scholar]
  8. Feng, C.; Wang, X. Review of Unit Maintenance Scheduling in Market Environment. Power Syst. Prot. Control. 2011, 39, 138–147. [Google Scholar]
  9. Haghighat, H.; Karimianfard, H.; Zeng, B. Integrating Energy Management of Autonomous Smart Grids in Electricity Market Operation. IEEE Trans. Smart Grid 2020, 11, 4044–4055. [Google Scholar] [CrossRef]
  10. Yang, N.; Ding, L.; Liu, Z.; Yan, J.; Xing, C.; Zhu, B.X.; Huang, Y.H.; Zhang, X.T.; Ren, Y.L. Power System Planning Method Considering Uncertainty Value and Entire Market Element Game under Market Background. Power Syst. Prot. Control 2022, 50, 11–23. [Google Scholar]
  11. Chen, Z.; Lin, K.; Wang, B. Design of Demand Response Incentive Mechanism Considering Lowest Efficiency Loss Based on Stackelberg Equilibrium Analysis in Unilateral Liberalization Market. Power Syst. Technol. 2022, 46, 1790–1800. [Google Scholar]
  12. Hong, Q.; Meng, F.; Liu, J.; Bo, R. A Bilevel Game-Theoretic Decision-Making Framework for Strategic Retailers in Both Local and Wholesale Electricity Markets. Appl. Energy 2023, 330, 120311. [Google Scholar] [CrossRef]
  13. Luan, T.; Yang, Z.; Li, J.; Deng, Y.X.; Feng, S.H. Design of Electricity Market Mechanism Adapting to Cost Characteristics of Electrochemical Energy Storage. Autom. Electr. Power Syst. 2024, 48, 101–110. [Google Scholar]
  14. Zhong, H.; Wu, F.; Zhang, L.; Dong, X.W.; Xia, X.; Shu, D. Optimal Capacity Allocation of Pumping and Storage Power Station Based on Multi-time Scale Decision-making in Power Market. High Volt. Eng. 2023, 49, 4109–4119. [Google Scholar]
  15. Zhang, L.; Shi, Z.; Zhou, W.; Ma, J.; Chen, K.; Yang, D.W.; Wan, J. Capacity Optimization Configuration of Battery, Thermal and Hydrogen Hybrid Energy Storage System Considering Battery Life. Power Syst. Technol. 2025, 49, 998–1006. [Google Scholar]
  16. Yu, Y.; Yan, W.; Zhong, Y.; Ge, X.H. Joint Optimization of Return on Investment and Carbon Efficiency for Green Cellular Networks with Hybrid Energy Supply. J. Chongqing Univ. Posts Telecommun. Nat. Sci. Ed. 2024, 36, 106–117. [Google Scholar]
  17. Sadat, S.A.; Mittal, K.; Pearce, J.M. Using Investments in Solar Photovoltaics as Inflation Hedges. Energies 2025, 18, 890. [Google Scholar] [CrossRef]
  18. Dehghanpour, K.; Nehrir, H. An Agent-Based Hierarchical Bargaining Framework for Power Management of Multiple Cooperative Microgrids. IEEE Trans. Smart Grid 2019, 10, 514–522. [Google Scholar] [CrossRef]
  19. Zhu, R.; Ren, Y.; Meng, Q.; He, J.W.; Pan, Y.; He, B. Electricity-Heat-Gas Cooperative Optimal Operation Strategy of Integrated Energy System Based on Cooperative Game. Acta Energ. Solaris Sin. 2022, 43, 20. [Google Scholar]
  20. Chen, J.; Hu, Z.; Chen, Y.; Chen, J.B.; Chen, W.N.; Gao, M.X.; Lin, M.R.; Du, Y.X. Thermoelectric Optimization of Integrated Energy System Considering Ladder-Type Carbon Trading Mechanism and Electric Hydrogen Production. Electr. Power Autom. Equip. 2021, 41, 48–55. [Google Scholar]
  21. Mao, K. Non Cooperative Games of Three Oligarch Firms on Output. J. Sci. Teach. Coll. Univ. 2024, 44, 16–20. [Google Scholar]
  22. Wu, L.; Jing, Z.; Wu, Q.; Deng, S. Equilibrium Strategies for Integrated Energy Systems Based on Stackelberg Game Model. Autom. Electr. Power Syst. 2018, 42, 142–150, 207. [Google Scholar]
  23. Li, P.; Wu, D.; Li, Y.; Liu, H.T.; Wang, N.; Zhou, X.C. Optimal Dispatch of Multimicrogrids Integrated Energy System Based on Integrated Demand Response and Stackelberg Game. Proc. CSEE 2021, 41, 1307–1321. [Google Scholar]
  24. Shuai, Z.; Wei, P.; Tengfei, M. Noncooperative Game Model of Prosumer P2P Electricity Trading Considering Markov Decision. Autom. Electr. Power Syst. 2023, 47, 18–27. [Google Scholar]
  25. Wang, X.; Yan, L.; Liu, B.; Zhao, F.J.; Gao, B.F. Cooperative Operational Strategies of Photovoltaic, Energy Storage, Load and Power Grid Based on Cooperative and Non-Cooperative Game. Acta Energ. Solaris Sin. 2023, 44, 128–138. [Google Scholar]
  26. Cao, P.; Deng, C.; Zhang, X.; Zhang, Y.; Dong, Y. Real-Time Coordinated Optimal Scheduling Strategy for Thermal Power Units with Adaptive Time Division and Variable Objective. Power Syst. Technol. 2024, 1–12. [Google Scholar]
  27. Li, G.; Li, Q.; Liu, Y.; Liu, H.; Song, W.; Ding, R. A Cooperative Stackelberg Game Based Energy Management Considering Price Discrimination and Risk Assessment. Int. J. Electr. Power Energy Syst. 2022, 135, 107461. [Google Scholar] [CrossRef]
Figure 1. Framework of interaction among ISO and generating units.
Energies 18 02396 g001
Figure 2. Basic framework of the bi-level non-cooperative game.
Energies 18 02396 g002
Figure 3. Optimization process of the bi-level non-cooperative game based on Nash equilibrium.
Energies 18 02396 g003
Figure 4. Forecast diagram of electrical load of the system, wind and solar turbine output.
Energies 18 02396 g004
Figure 5. Comparison of power generation under different objectives.
Energies 18 02396 g005
Figure 6. Comparison of wind and photovoltaic absorption rates under different objectives.
Energies 18 02396 g006
Figure 7. Comparison of generation costs and URR results under different weights (w).
Energies 18 02396 g007
Figure 8. Average quotation results of generating units with respect to different w.
Energies 18 02396 g008
Figure 9. Revenue and average electricity sale price of generating units under different X(α) constraint conditions.
Energies 18 02396 g009
Figure 10. Comparison of photovoltaic URR results under different X (α = 0.3 and α = 0.7) values.
Energies 18 02396 g010
Figure 11. Comparison of generation costs and URR results under different X(α).
Energies 18 02396 g011
Table 1. Comparison of results under different objectives.
Objective12
Profit of WT11,388.679768710.521313
Profit of TPP2749.3940165188.411317
Profit of PV3697.2111943627.456385
Total profit17,835.2849717,526.38901
Total electricity sale revenue21,094.8750321,003.7032
Total generation cost3259.5900593477.314186
Profit standard deviation3868.5958442126.013175
Wind power absorption rate0.9278669650.840815262
Photovoltaic absorption rate0.3720000250.507971136
Total renewable energy absorption rate0.7411691760.729023648
URR of WT12.608365810.61315561
URR of TPP7.56987843220.19290866
URR of PV4.26269043614.4884504
Total URR24.4409346745.29451467
URR standard deviation3.4314581393.934610277
Standardized URR standard deviation0.1403979920.086867258
Table 2. Average electricity selling prices for each generating unit under different objectives.
Price Corresponding to the Objective12
Average sale price of WT0.5816212830.501662503
Average sale price of TPP0.6165891381.221805977
Average sale price of PV0.4595794230.652547483
Disclaimer/Publisher’s Note: The statements, opinions and data contained in all publications are solely those of the individual author(s) and contributor(s) and not of MDPI and/or the editor(s). MDPI and/or the editor(s) disclaim responsibility for any injury to people or property resulting from any ideas, methods, instructions or products referred to in the content.

