Article

Robust Assessment Method for Hosting Capacity of Distribution Network in Mountainous Areas for Distributed Photovoltaics

1
Electric Power Research Institute of Guizhou Power Grid Co., Ltd., Guiyang 550002, China
2
College of Electrical and Information Engineering, Hunan University, Changsha 410082, China
*
Author to whom correspondence should be addressed.
Energies 2025, 18(9), 2394; https://doi.org/10.3390/en18092394
Submission received: 1 April 2025 / Revised: 25 April 2025 / Accepted: 1 May 2025 / Published: 7 May 2025
(This article belongs to the Section A2: Solar Energy and Photovoltaic Systems)

Abstract

:
The penetration rate of distributed photovoltaic (PV) in mountainous distribution networks is increasing year by year, and the assessment of distributed PV hosting capacity (PVHC) in distribution networks in mountainous areas is also becoming more and more important. To this end, this paper proposes a robust assessment method for distributed PVHC of flexible distribution networks in mountainous areas. The method utilizes soft open point (SOP) and energy storage to realize the flexible interconnection of distribution networks in mountainous areas, connecting the low-voltage nodes at the end of distribution networks in mountainous areas and improving the overall power quality of distribution networks. Secondly, the output curves of distributed PV output and load demand are analyzed and the distributed PV uncertainty model is drawn, so as to construct a two-layer robust assessment model of distributed PVHC for mountainous flexible distribution networks. Finally, the dual-layer robust assessment model, which cannot be solved directly, is transformed into a solvable mixed-integer linear programming model using the pairwise method, and the effectiveness of this paper’s method is verified by the simulation results of the IEEE 33-node distribution network system.

1. Introduction

With the introduction of the “dual-carbon” goal and the continuous improvement of living standards, the demand for electricity supply in daily life, industrial production, and commercial development is increasing, and the requirements for power supply quality are becoming more and more stringent, which can no longer be met by traditional power generation technologies. In order to solve this problem, most countries have begun to increase the penetration rate of distributed power supply represented by distributed PV [1], which utilizes solar energy to realize the efficient production of electric energy [2]. However, the high penetration of distributed PV brings many problems to distribution networks, such as overvoltage, power quality degradation, and line thermal stability violation. Therefore, it is necessary to accurately assess the hosting capacity of distribution grids for distributed PVs so that distribution grids can be more friendly to accept a high percentage of distributed PVs [3,4,5,6,7,8,9].
Distributed PV carrying capacity assessment often depends on the constraints and objective functions considered, and most studies today tend to use the maximum capacity of distributed PVs that can be accessed by the distribution network as the objective function. M. S et al. [10] proposed a probabilistic-based method for maximum hosting capacity assessment of distributed PVs; X. Chen et al. [11] proposed a robust assessment method for maximum capacity of distributed PVs. Second, the distributed PV carrying capacity is categorized as static and dynamic based on the availability of some distributed PV capacity regulation. P. Astero and L. Söder [12] proposed an adaptive controller for static synchronous compensator to regulate steady-state and dynamic voltages as a way to study the static hosting capacity (SHC) and dynamic hosting capacity (DHC) of distributed PVs in the distribution network; Mahmoodi M et al. [13] proposed a robust assessment method for the dynamic hosting capacity of distributed PVs; and Naciri S et al. [14] proposed an integrated method for dynamically estimating the hosting capacity of a distributed PV system, which takes into account the time-dependent fluctuations of generation and load, as well as over-voltage constraints, in its mathematical model. In addition to this, some scholars have further investigated the effect of energy storage on the enhancement of the distributed PV carrying capacity of distribution grids on the basis of the assessment of distributed PV carrying capacity. S. Zhang et al. [15] proposed an assessment method that takes into account the flexibility of battery energy storage systems (BESS) to delineate the feasible region for distributed PV integration capacity, and Z. Zheng et al. [16] proposed a method for assessing the consumption capacity of distributed PV and distributed energy storage in distribution networks. The research on distributed PVHC assessment of distribution grids in the above literature is only limited to distribution grids in urban or industrial areas where power users are relatively concentrated, and there is a relative lack of research on distribution grids in mountainous areas where power users are dispersed and the transmission radius is large.
Therefore, a large number of scholars have begun to conduct relevant research on the operational characteristics of distribution networks in mountainous areas and the assessment of distributed PVHC in distribution networks in mountainous areas. Juqin X et al. [17] proposed evaluation of optimal access location and the maximum capacity of distributed power supply using firefly optimization algorithm; Xumeng Tan [18] analyzed the power supply reliability of distribution networks in mountainous areas and proposed technical measures and management measures to improve the power supply reliability of distribution networks; Xinghang Weng et al. [19] proposed a feeder automation planning method for 10 kV distribution networks in mountainous areas, taking into account the access of distributed power sources, and studied the impact of distributed power sources on distribution networks in mountainous areas; Zhang Y et al. [20] studied the impact of distributed PVs on feeder automation based on the construction mode of feeder automation and the impact of distributed PVs on feeder automation, to study the impact of distributed PV access on mountainous distribution systems. Although the above literature has achieved some results in the study of distributed PVHC assessment of distribution network in mountainous areas, there are still some problems:
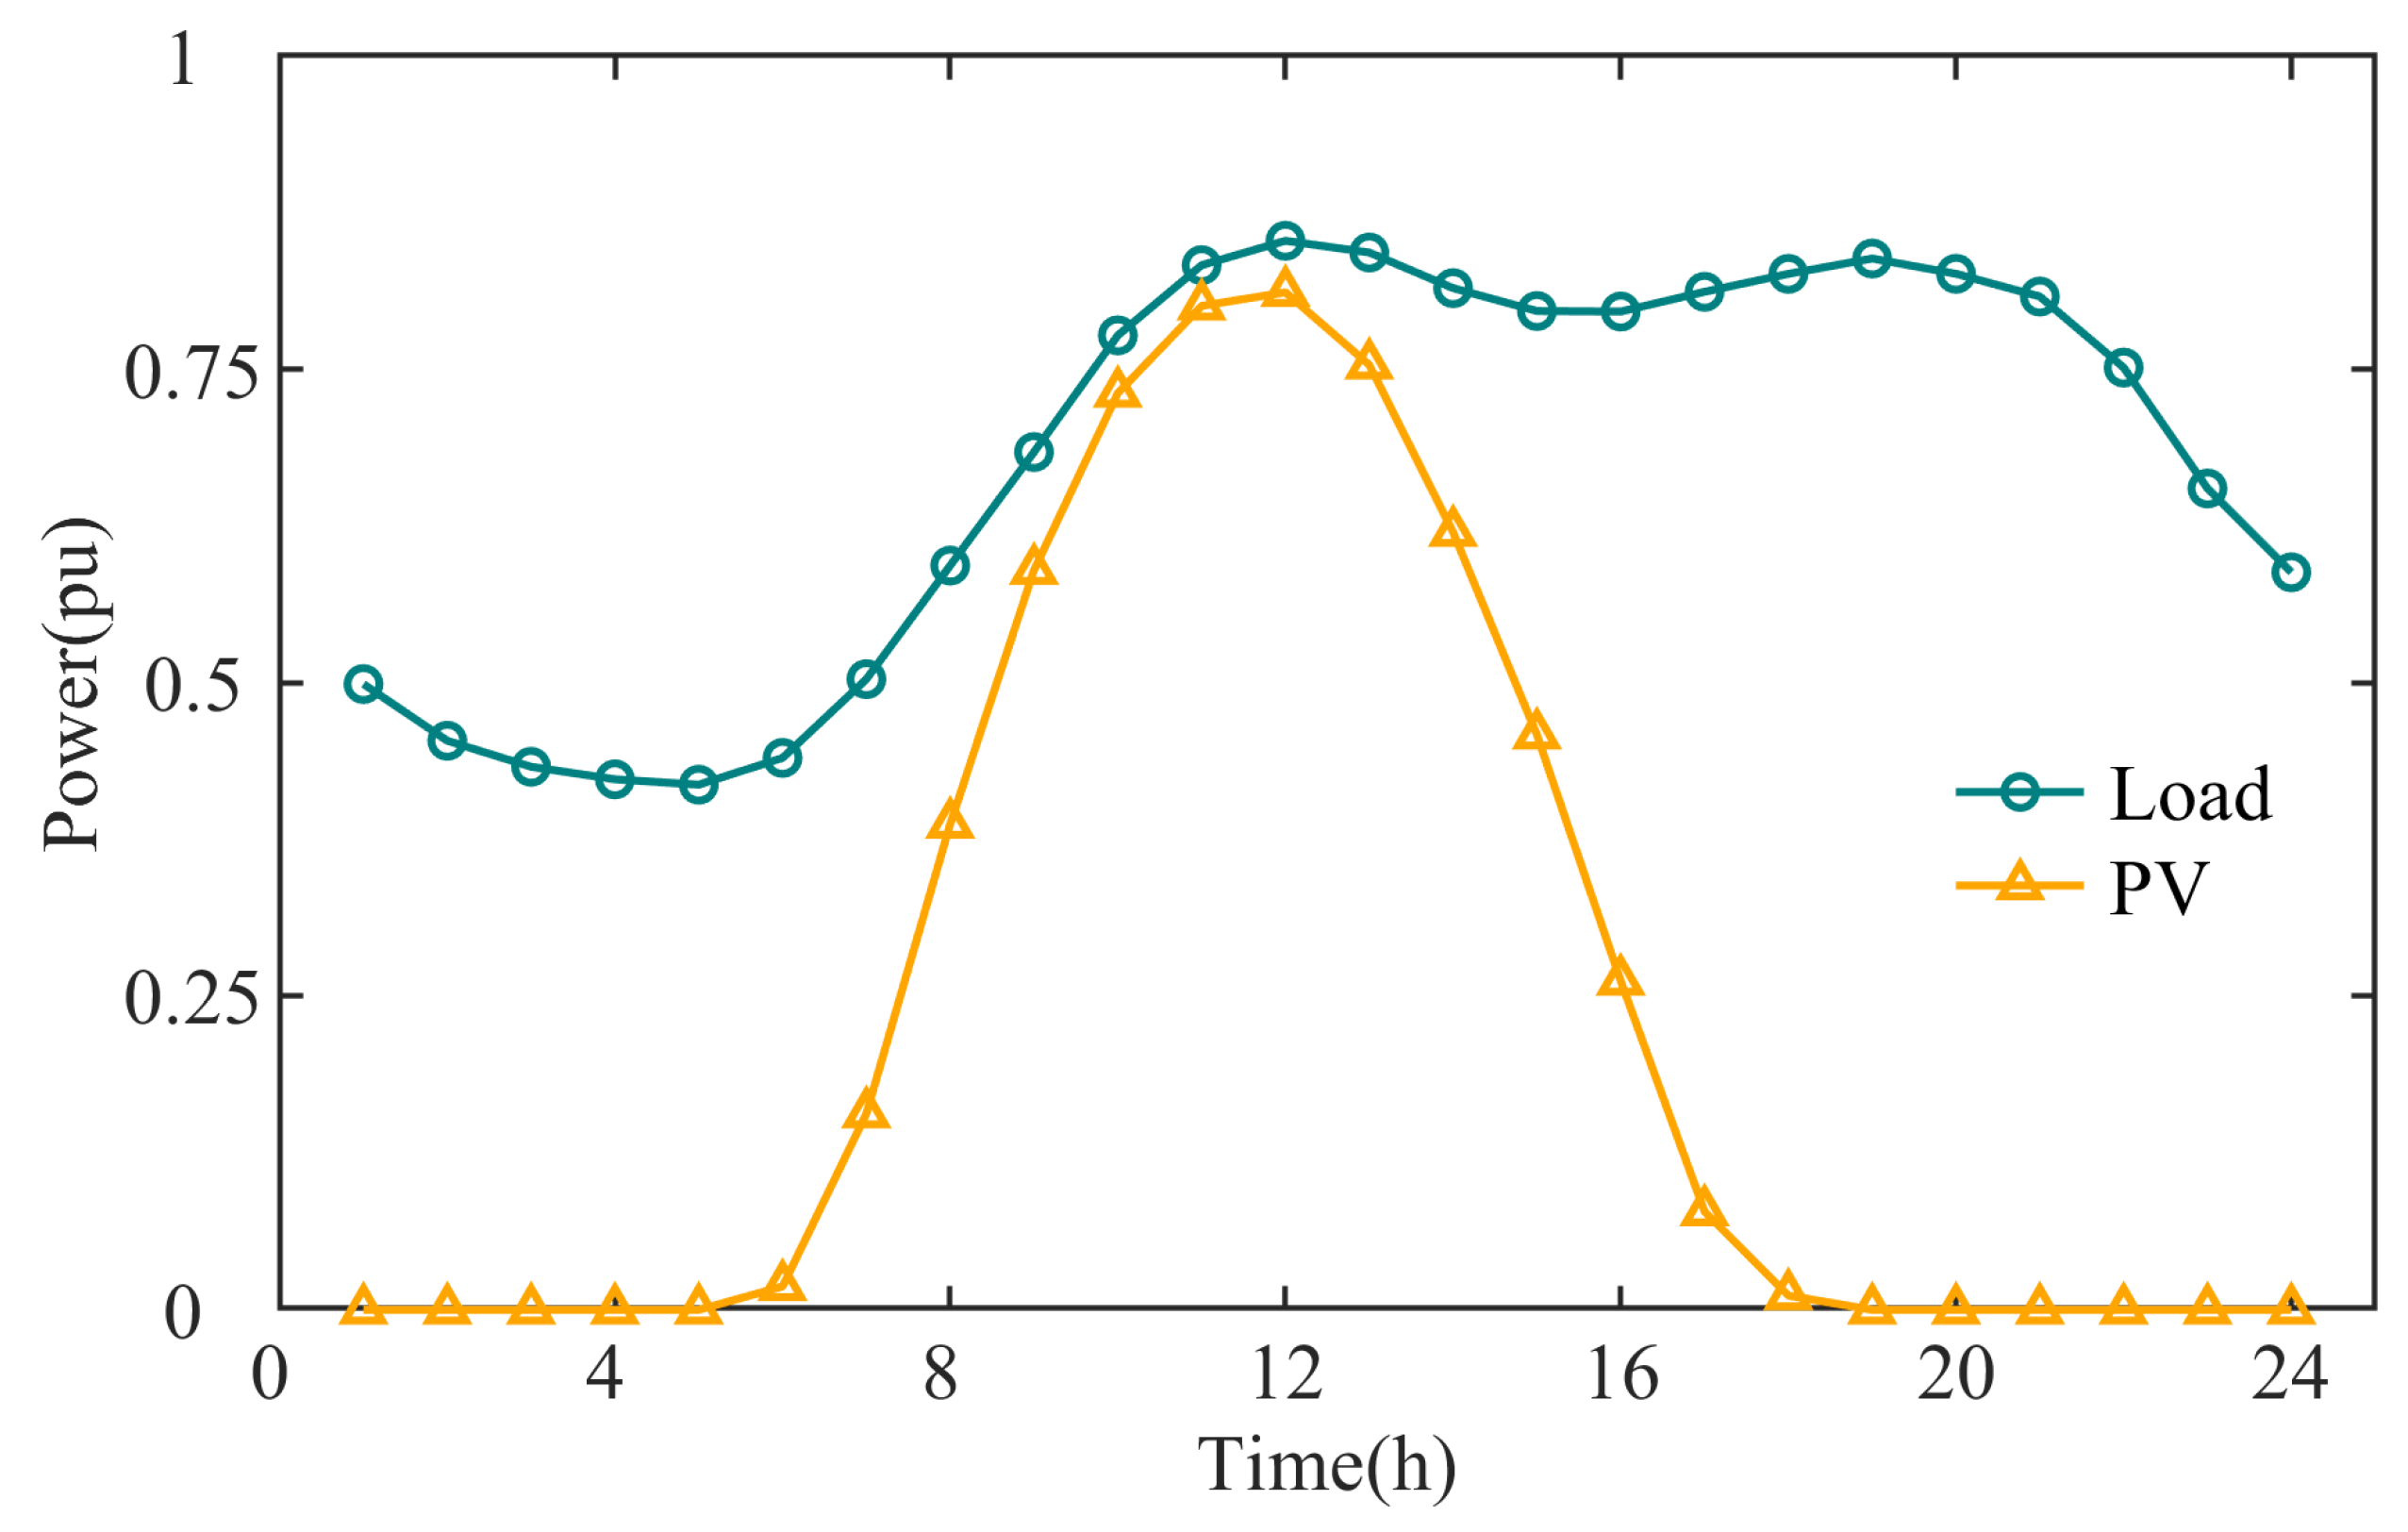
  • The above literature [14,15,16,17,18,19,20] did not further analyze the impact of distributed PV output uncertainty on mountain distribution networks. Influenced by weather and geography, the output curve of distributed PV is characterized by disorder and high volatility. Evaluating the hosting capacity of the distribution network without considering the uncertainty may lead to an overestimation of the results, resulting in low power quality and safety hazards in practical applications;
  • The above literature [10,11,12,13,14,15,16,17,18,19,20] does not apply SOPs to further improve the distributed PVHC of the distribution network. The SOPs have the ability to flexibly adjust the spatial tidal current and can be used to replace the traditional contact switches in the distribution network. Through the flexible contact of SOPs, supply zones that originally have no power interaction start to interconnect. Between the interconnected supply zones, the stochastic currents caused by source–load uncertainty are effectively adjusted by the SOP, and the distributed PVs and loads are able to balance and complement each other. Obviously, SOP has a positive effect on the distribution network to accommodate more distributed PVs.
For the above problems, this paper proposes a robust assessment method of distributing PVHC for flexible distribution networks in mountainous areas. The method introduces intelligent soft open points with energy storage (soft open points with energy storage, E-SOP) to realize the flexible interconnection of the distribution network based on the traditional mountainous distribution network. Secondly, the output curves of distributed PV output and load demand are analyzed, and a two-layer robust assessment model of distributed PVHC for mountainous flexible distribution grids considering distributed PV uncertainty is constructed. Finally, the dual-layer robust assessment model, which cannot be solved directly, is transformed into a solvable mixed-integer linear programming model using the pairwise method, and then the effectiveness of this paper’s method is verified by the simulation results of the IEEE 33-node distribution network system. The flowchart of the model solution is shown in Figure 1. The method not only analyzes the uncertainty of distributed PV output, but also improves the robustness of the assessment results by including the effects of uncertain variables in the assessment of distributed PC carrying capacity. Meanwhile, the method introduces E-SOP and further improves the distributed PV carrying capacity of the distribution network through its current regulation capability.

2. Characteristics of a Mountainous Distribution Network

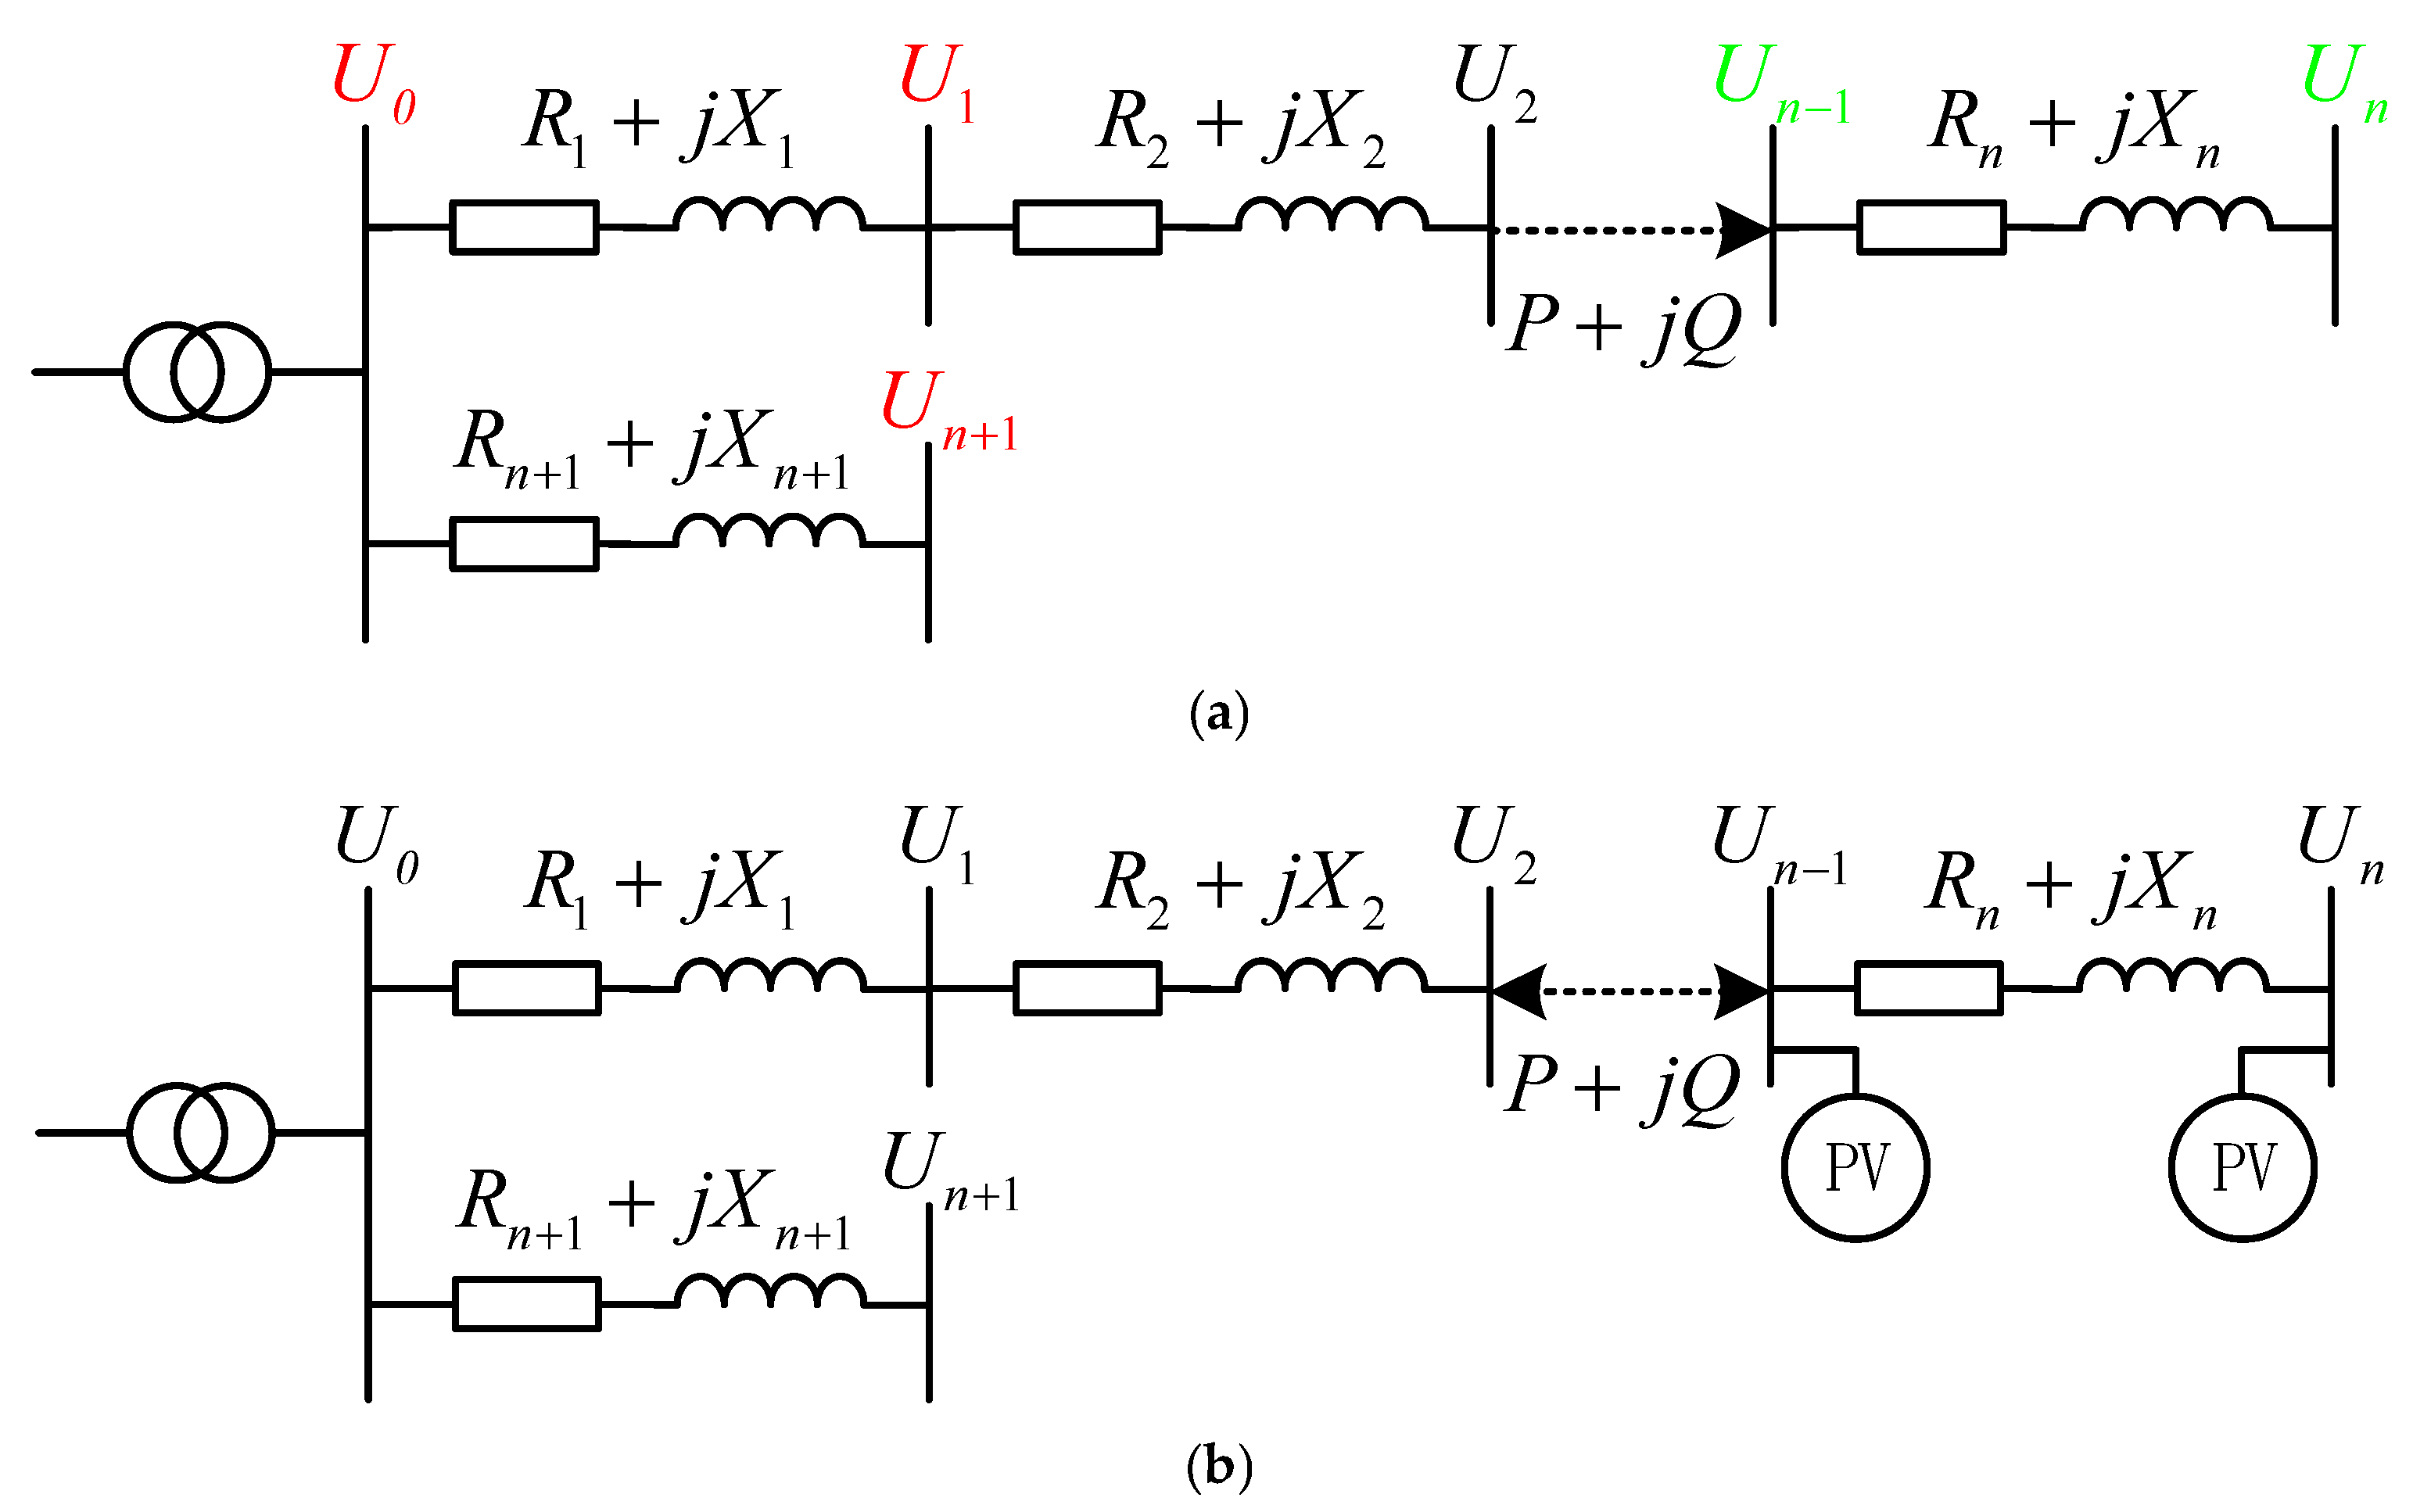
2.1. Traditional Mountain Distribution Networks

Due to the backward economic conditions and dispersed power users, most of the traditional mountainous distribution grids adopt a radial network structure that relies on long feeder transmission, which makes the power supply capacity of distribution grids weak and fails to ensure the voltage at the end of the distribution grid frame [21,22,23,24]. The access of distributed PV ensures the power supply in remote mountainous areas, breaks the previous unidirectional flow from the head-end to the end, and avoids the problem of low voltage at the end of the distribution network frame. Figure 1 shows the equivalent model of traditional mountainous distribution network and mountainous distribution network with access to distributed PV, in which the node voltage is green, indicating that the node may have under-voltage, and the node voltage is red, indicating that the node may have over-voltage. Observing Figure 2a, it can be seen that due to the long transmission lines of the traditional mountainous distribution network, the voltage of the node at the end of the distribution network may be under-voltage due to the influence of the line impedance, and in order to eliminate this risk, it is necessary to increase the voltage of the first node, but this in turn brings about the risk of the first node’s voltage overrunning the limit. Therefore, in this paper, distributed PVs are connected to the end node of the distribution network to increase the voltage of the end node through local consumption, as shown in Figure 2b. Observing Figure 2b, it can be seen that the access of distributed PV not only eliminates the risk of voltage overrun at the end node, but also makes the current distribution change from unidirectional to bidirectional.

2.2. Flexible and Interconnected Mountain Distribution Grids

The access of distributed PV improves the power quality and power supply reliability of distribution network in mountainous areas, and also changes the direction of the current from unidirectional to bidirectional, so it is difficult to apply the traditional distribution network contact switch to the mountainous distribution network containing distributed PV. Therefore, this paper adopts the E-SOP, as shown in Figure 3, and constructs a flexible interconnected mountainous distribution network. As can be seen from Figure 3, the two ports of the E-SOP are connected to different nodes of the distribution network, and a battery storage system is installed on the DC bus. The E-SOP can be regarded as consisting of two parts: the SOP and the battery storage system [25,26]. The main circuit topology of the SOP is shown in the dashed box of Figure 2, which consists of two voltage source-type converters based on IGBTs and generating voltage waveforms using the pulse width modulation (PWM) technique, as well as two sets of inductors. Based on the structure of the E-SOP, the E-SOP model with one port is established as follows:
0 P i , t ch μ i , t P i ch , max
0 P i , t dis ( 1 μ i , t ) P i dis , max
E i , t + Δ t = E i , t + η i ch P i , t ch P i , t dis η i dis Δ t
E i min E i , t E i max
E i , 0 = E i , 24
m M P i , t , m E-SOP = P i , t dis P i , t ch
0 P i , t , m E-SOP P i E-SOP , max
0 Q i , t , m E-SOP Q i E-SOP , max
P i , t , m E-SOP 2 + Q i , t , m E-SOP 2 S i , m E-SOP 2
In the above equation, t is the operating moment of the scheduling cycle T; i is a node of the distribution network; μ i , t is the charging and discharging state of the energy storage; P i , t ch and P i , t dis are the charging and discharging power of the energy storage; P i ch , max and P i dis , max are the limit values of the charging and discharging power of the energy storage; Ei,t is the amount of the energy storage; η i ch and η i dis are the charging and discharging efficiency; E i max and E i min are the upper and lower limit of the stored energy of the energy storage; P i , t , m E-SOP and Q i , t , m E-SOP are the active and reactive power flowing to the E-SOPs at ports m ; P i E-SOP , max and Q i E-SOP , max are the limit values of the active power and reactive power flowing at the E-SOP ports; S i , m E-SOP is the converter capacity at port m .

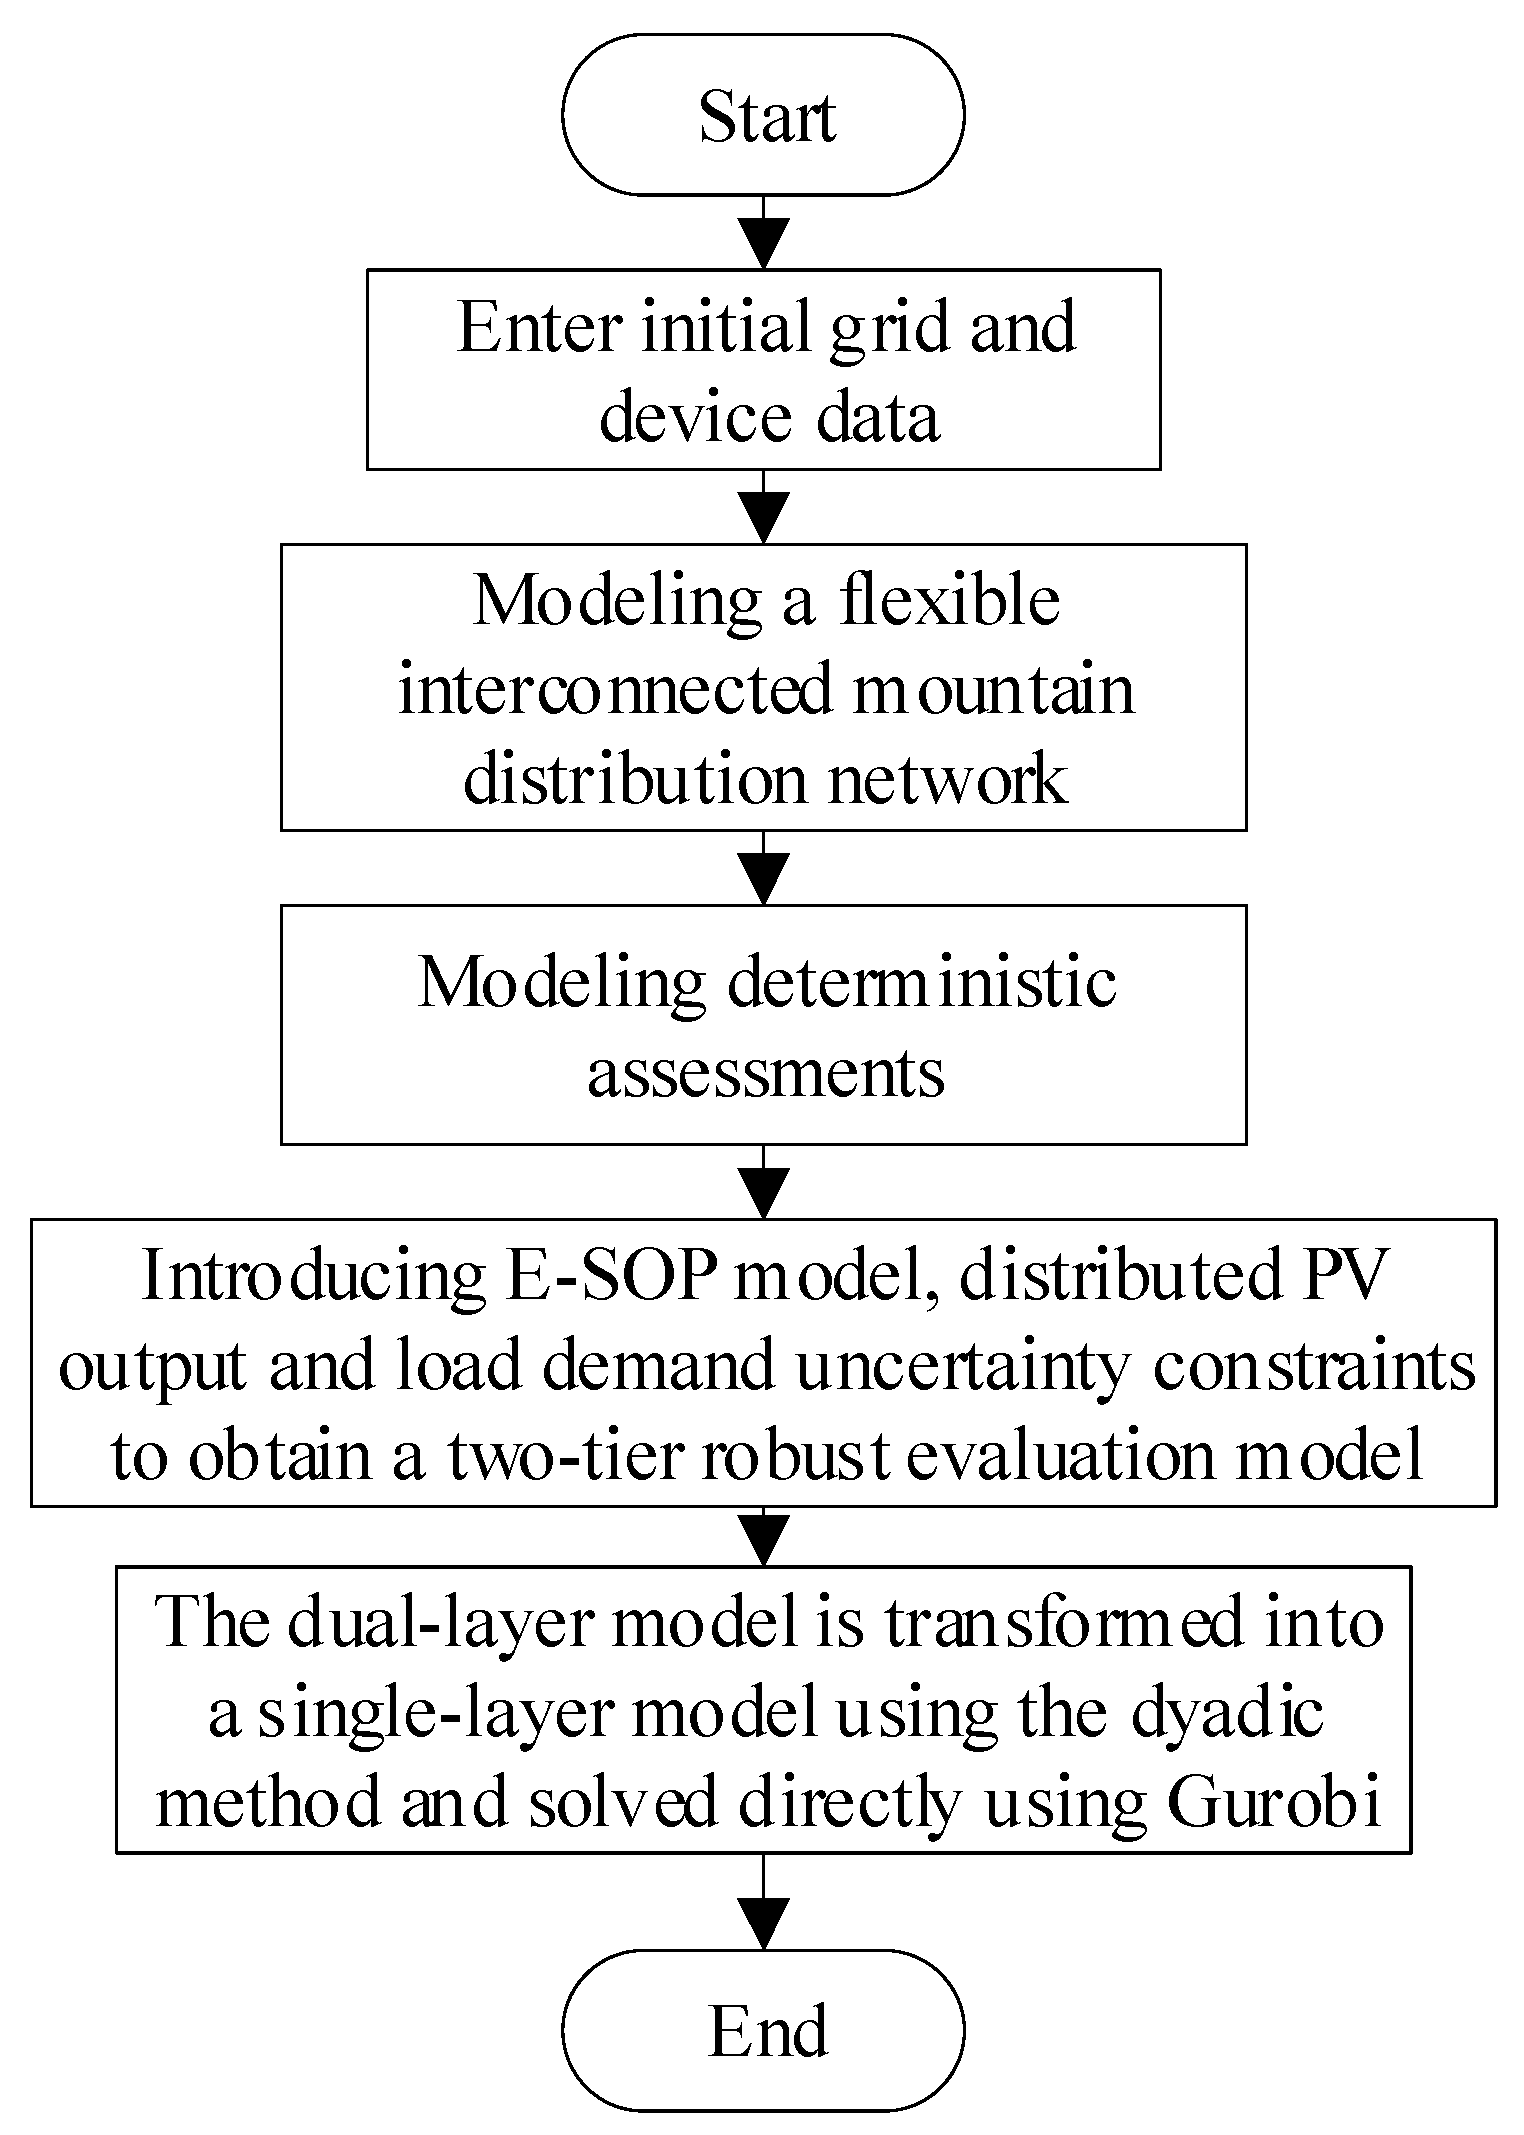
3. Formulation of the Problem

In order to further investigate the impact of uncertainty variables and E-SOP on the assessment of distributed PVHC of distribution networks in mountainous areas, this paper introduces the constraints of the E-SOP model, distributed PV output and load demand uncertainty on the basis of the traditional deterministic assessment model, and constructs a two-layer robust assessment model for distribution networks in mountainous areas.

3.1. Deterministic Assessment Model

3.1.1. Objective Function

The distributed PV maximum hosting capacity deterministic assessment model takes into account various operational constraints in the distribution network and calculates the maximum capacity of distributed PV that can be accommodated in the distribution network. The objective function of the deterministic model is shown in Equation (10).
max C H = max ( i = Ω PV S i PV )
In the above equation, C H is the maximum capacity of distributed PVs that can be accommodated by the distribution network; ΩPV is the set of nodes by which distributed PVs can be accessed; and S i PV is the rated power of distributed PVs that can be installed.

3.1.2. Restrictive Condition

The constraints include linear tidal equations and nodal voltage constraints. They are specified as follows:
P i , t inj = P i , t PV + P i , t dis P i , t ch P i , t L P i , t TCLs
Q i , t inj = Q i , t SVG Q i , t L
l : ( l , i ) Z e l e t o P l , t f l : ( l , i ) Z e l e f r P l , t f + P i , t inj = 0
l : ( l , i ) Z e l e t o Q l , t f l : ( l , i ) Z e l e f r Q l , t f + Q i , t inj = 0
i : ( l , i ) Z e l e f r V i , t i : ( l , i ) Z e l e t o V i , t = P l , t f r l + Q l , t f x l / V N
V i , min V i , t V i , max , i Ω e l e
In the above equation, Ω e l e is the set of nodes; l is the branch; Zele is the set of the branch; Z e l e f r is the mapping of the branch to the first node; Z e l e t o is the mapping of the branch to the end; P i , t inj and Q i , t inj are the node active and reactive power; P i , t PV is the PV output; P i , t TCLs is the temperature-controlled load aggregation power; Q i , t SVG is the reactive power; P i , t L and Q i , t L are the active and reactive power of the load; P l , t f and Q l , t f are the active and reactive tidal current of the line; Vi,t is the node voltage magnitude; VN is the rated voltage; rl and xl are the line resistance and reactance; and V i , max and V i , min are the upper and lower limit of the voltage magnitude.

3.2. Robust Evaluation Model

3.2.1. Distributed PV Uncertainty Carving

Distributed PV power output has a strong stochastic nature due to the influence of environmental conditions such as light intensity, temperature, and air humidity. Equation (17) is used to describe the uncertainty of random fluctuation of distributed PV power. Considering that the robust evaluation model is the worst-case scenario under the uncertainty environment, and the worst-case scenario is usually located at the boundary of the distributed PV power fluctuation interval, u i , t + and u i , t are introduced to denote the upper and lower boundaries of the distributed PV power fluctuation interval.
P ˜ i , t PV = P i , t PV 0 + Δ P i , t PV , max u i , t + Δ P i , t PV , min u i , t
In the above equation, P ˜ i , t PV is the output uncertainty variable of the distributed PV at node i at time t; P i , t PV 0 is the output expectation of the distributed PV at node i at time t; and Δ P i , t PV , max and Δ P i , t PV , min denote the maximum deviation and minimum deviation of the output prediction of the distributed PV at node i at time t.
u i , t + and u i , t are binary variables whose constraints are shown in Equation (18). Equation (18) ensures that they do not take one at the same time and that the number of occurrences of both during the entire scheduling period T cannot exceed the time robust budget.
u i , t + + u i , t 1 , 0 u i , t + , u i , t 1 t T u i , t + + u i , t Γ t i m e
In addition, assuming that there are NPV distributed PVs in the distribution network, the number of distributed PVs with power deviation (i.e., actual power deviation from the predicted power) at a particular moment may also be random, with a maximum number of NPV and a minimum number of 0. In order to characterize this uncertainty, the spatially robust budget Γ s p a c e is introduced to impose constraints on u i , t + and u i , t as shown in Equation (19).
i Ω PV u i , t + + u i , t Γ s p a c e
In summary, the polyhedral ensemble describing the stochasticity of distributed PV power fluctuations is constructed as follows:
U PV II = P ˜ i , t PV P ˜ i , t PV = P i , t PV 0 + Δ P i , t PV , max u i , t + Δ P i , t PV , min u i , t u i , t + + u i , t 1 , 0 u i , t + , u i , t 1 t T u i , t + + u i , t Γ t i m e i Ω PV u i , t + + u i , t Γ s p a c e

3.2.2. Two-Layer Robust Evaluation Model

Based on the above portrayal of distributed PV uncertainty variables, a two-layer robust assessment model in compact form, as shown in Equations (21)–(25), is established. The outer layer of the two-layer robust assessment model is the uncertainty variable u minimizing the distributed PV capacity accepted by the distribution grid, and the inner layer is the distribution grid maximizing the distributed PV capacity through flexible resources. The constraints Equation (22) for the two-layer robust model, specifically referring to the constraints Equations (1)–(9) and (11)–(16) of the deterministic model.
min u U   max x X C T x = min u U   max x X ( i = Ω PV S i PV )
X = x A x + B u d , D x + E u = h
U = U PV II
u = P ˜ i , t PV
x = P i , t , m E-SOP , Q i , t , m E-SOP , P l , t f , Q l , t f , V i , t , P i , t PV P i , t dis , P i , t ch P i , t L , P i , t TCLs , Q i , t SVG , Q i , t L
In the above equation, the vector u denotes the vector consisting of uncertainty variables; the vector x denotes the vector consisting of distribution network operation state variables. C corresponds to the objective function Equation (1) coefficient matrix; A, B and d are the constant coefficient matrices or vectors of the corresponding inequality constraints; and D, E and h are the constant coefficient matrices or vectors of the corresponding equation constraints.

3.3. Solution Method

Since Equations (21)–(25) of the two-layer robust assessment model of distributed PVHC cannot be solved directly, this paper reconstructs the two-layer model into a single-layer model for solving the problem by the pairwise method [27,28]. Based on Equations (21)–(25), the inner layer problem can be written as Equation (26).
      max x X C T x   s . t . A x d B u   π D x = h E u   λ
In the above equation, π and λ are pairwise multipliers. The inner layer max problem of the two-layer robust assessment model of distributed PVHC is reconstructed as a min problem by pairwise transformation. At this point, the inner layer problem is merged with the outer layer problem to obtain the single layer min problem; see Equation (27).
min u , π , λ d B u T π + h E u T λ s . t . A T π + D T λ = C π 0 u U
At this point, the bilinear terms B u T π and E u T λ in Equation (23) can be converted to linear complementarity conditions using the large M method, B u T π , as exemplified here in Equation (28). The bilinear robust evaluation model is reconstructed as a mixed-integer linear programming problem that can be solved directly by the commercial solver Gurobi.
0 d B u M Z M ( 1 Z ) π 0
In the above equation, M is a sufficiently large number; and Z is a binary variable, such that only one of the two equations in the above equation always works.

4. Calculus Analysis

4.1. Parameterization

In this section, an IEEE 33-node mountain flexible distribution network is used to validate the effectiveness of the proposed robust assessment method for distributed PVHC. The topology of the IEEE 33-node mountain flexible distribution network is shown in Figure 4. The base voltage is 12.66 kV and the peak loads are 4.49 MW and 1.92 Mvar. the node voltage safety range is 0.9 p.u.–1.1 p.u. The transformer capacity is 10 MVA. The transformer capacity is 10 MVA. The AC/DC converter ports of the E-SOP are connected to nodes 17, 21, 24, and 32 with rated capacity of 0.5 MVA. 0.5 MW/2 MWh energy storage batteries, which are connected to the DC bus of the E-SOP. The time robust budget and space robust budget are set to 1 p.u. The temporal curves of load and distributed PV are shown in Figure 5. The nodes for evaluating the distributed PVHC of the distribution network are set to be nodes 3, 14, 16, and 30, respectively, and the maximum accessible capacity of each node is 4 MW.

4.2. Robust Model Evaluation Results and Analysis

In order to verify the effectiveness and superiority of the method proposed in this paper, this section uses two other assessment methods to compare with the method proposed in this paper and the actual hosting capacity results. Among them, the actual hosting capacity results are calculated from 100 days of data randomly selected from distributed PV and load datasets as test samples, as shown in Figure 6.
Method I: the deterministic assessment model introduced in Section 2.1 that considers only constraints such as linear tidal equations, nodal voltage constraints, etc.
Method II: the two-layer robust assessment model of distributed PVHC for mountainous flexible distribution networks considering distributed PV uncertainty proposed in this paper.
Method III: traditional method. The day of the year with the largest distributed PV output is used to calculate the hosting capacity, and the uncertainty of the distributed PV output is not taken into account.
As can be seen in Figure 6, whether or not the E-SOP is considered, the results from the deterministic assessment model and the traditional method are higher than the actual results, and the larger results may reduce the power quality of the distribution network in practice and lead to safety hazards. This is because traditional methods and deterministic assessments do not take into account the impact of uncertain variables on the hosting capacity of the distribution network, but the two-layer robust model developed in this paper takes into account the uncertain variables minimizing the capacity of the distribution network to accommodate distributed PVs, and the results obtained are more robust and accurate. In addition, compared to the traditional mountain distribution grid without considering E-SOP, the evaluation results of the three methods for the mountainous flexible distribution grid considering E-SOP are all improved because E-SOP has not only the spatial flexibility of SOP, but also the temporal flexibility of ESS, which enables the random tidal current caused by the uncertainty of distributed PVs to be regulated efficiently by E-SOP, and the distributed PVs and the loads to be balanced and complemented, thus further improving the mountainous flexibility. The distributed PVHC of the distribution network is further improved, and the evaluation results are shown in Table 1.

4.3. Impact of E-SOP on Mountainous Distribution Grids

From the analysis in the previous section, it can be seen that the mountainous flexible distribution grid utilizes the temporal and spatial flexibility of E-SOP to enhance the distributed PVHC of the mountainous flexible distribution grid. To further explore the impact of E-SOP on the mountainous distribution network, in this section, the average, maximum, and minimum values of the voltages at each node of the mountainous distribution network in a day with/without considering E-SOP, respectively, are plotted as curves for comparison, as shown in Figure 7. Observing Figure 7a, it can be seen that the effect of E-SOP on the voltage at the first node of the distribution network is negligible. Whereas, for the end nodes (nodes 12–17) of the distribution network, the introduction of E-SOP significantly enhances the voltage magnitude. This is because the SOP has the ability of spatially flexible adjustment of tidal currents, which can regulate the tidal currents at the first and the end nodes. Meanwhile, the ESS is able to act as a flexible resource in the mountainous distribution network to transfer power for the end nodes across time, thus increasing the voltage at the end nodes. Further observation of Figure 7b,c shows that the curves of the maximum and minimum values of the voltage at each node of the mountainous distribution network are very similar regardless of whether E-SOP is considered or not, which suggests that E-SOP can alleviate the problem of lower voltage at the end nodes while ensuring that the voltage at each node of the mountainous flexible distribution network does not overrun the limit.

4.4. Impact of Robust Budgets on Hosting Capacity

In order to analyze the uncertainty of distributed PV power random fluctuation, Section 3.2 constructs a distributed PV uncertainty carving model and proposes the definition of a robust budget. Therefore, in order to analyze the impact of the robust budget on the hosting capacity of the distribution network, this paper compares the hosting capacity of the distribution network under different robust budgets, as shown in Figure 8. Observing Figure 8, it can be seen that with the increase in the spatial robust budget, the results of the distribution network hosting capacity assessment decrease, while the change in the temporal robust budget does not cause the change in the hosting capacity assessment results. This is because the robust model proposed in this paper considers the worst-case distribution grid hosting capacity assessment, i.e., the moment of the day when the distributed PV output is the largest. Therefore, no matter how the time robust budget changes, the method proposed in this paper will only yield the results of the distribution grid hosting capacity assessment at the time of the day when the distributed PV outlets are at their maximum. In addition, when the time-robust budget or space-robust budget is 0, the distribution grid hosting capacity result is the largest and both are 10.211 MW. This is because when the time or space-robust budget is 0, the moments or the number of fluctuations of distributed PV output is 0, meaning that there is no fluctuation of distributed PV output in the assessment process.

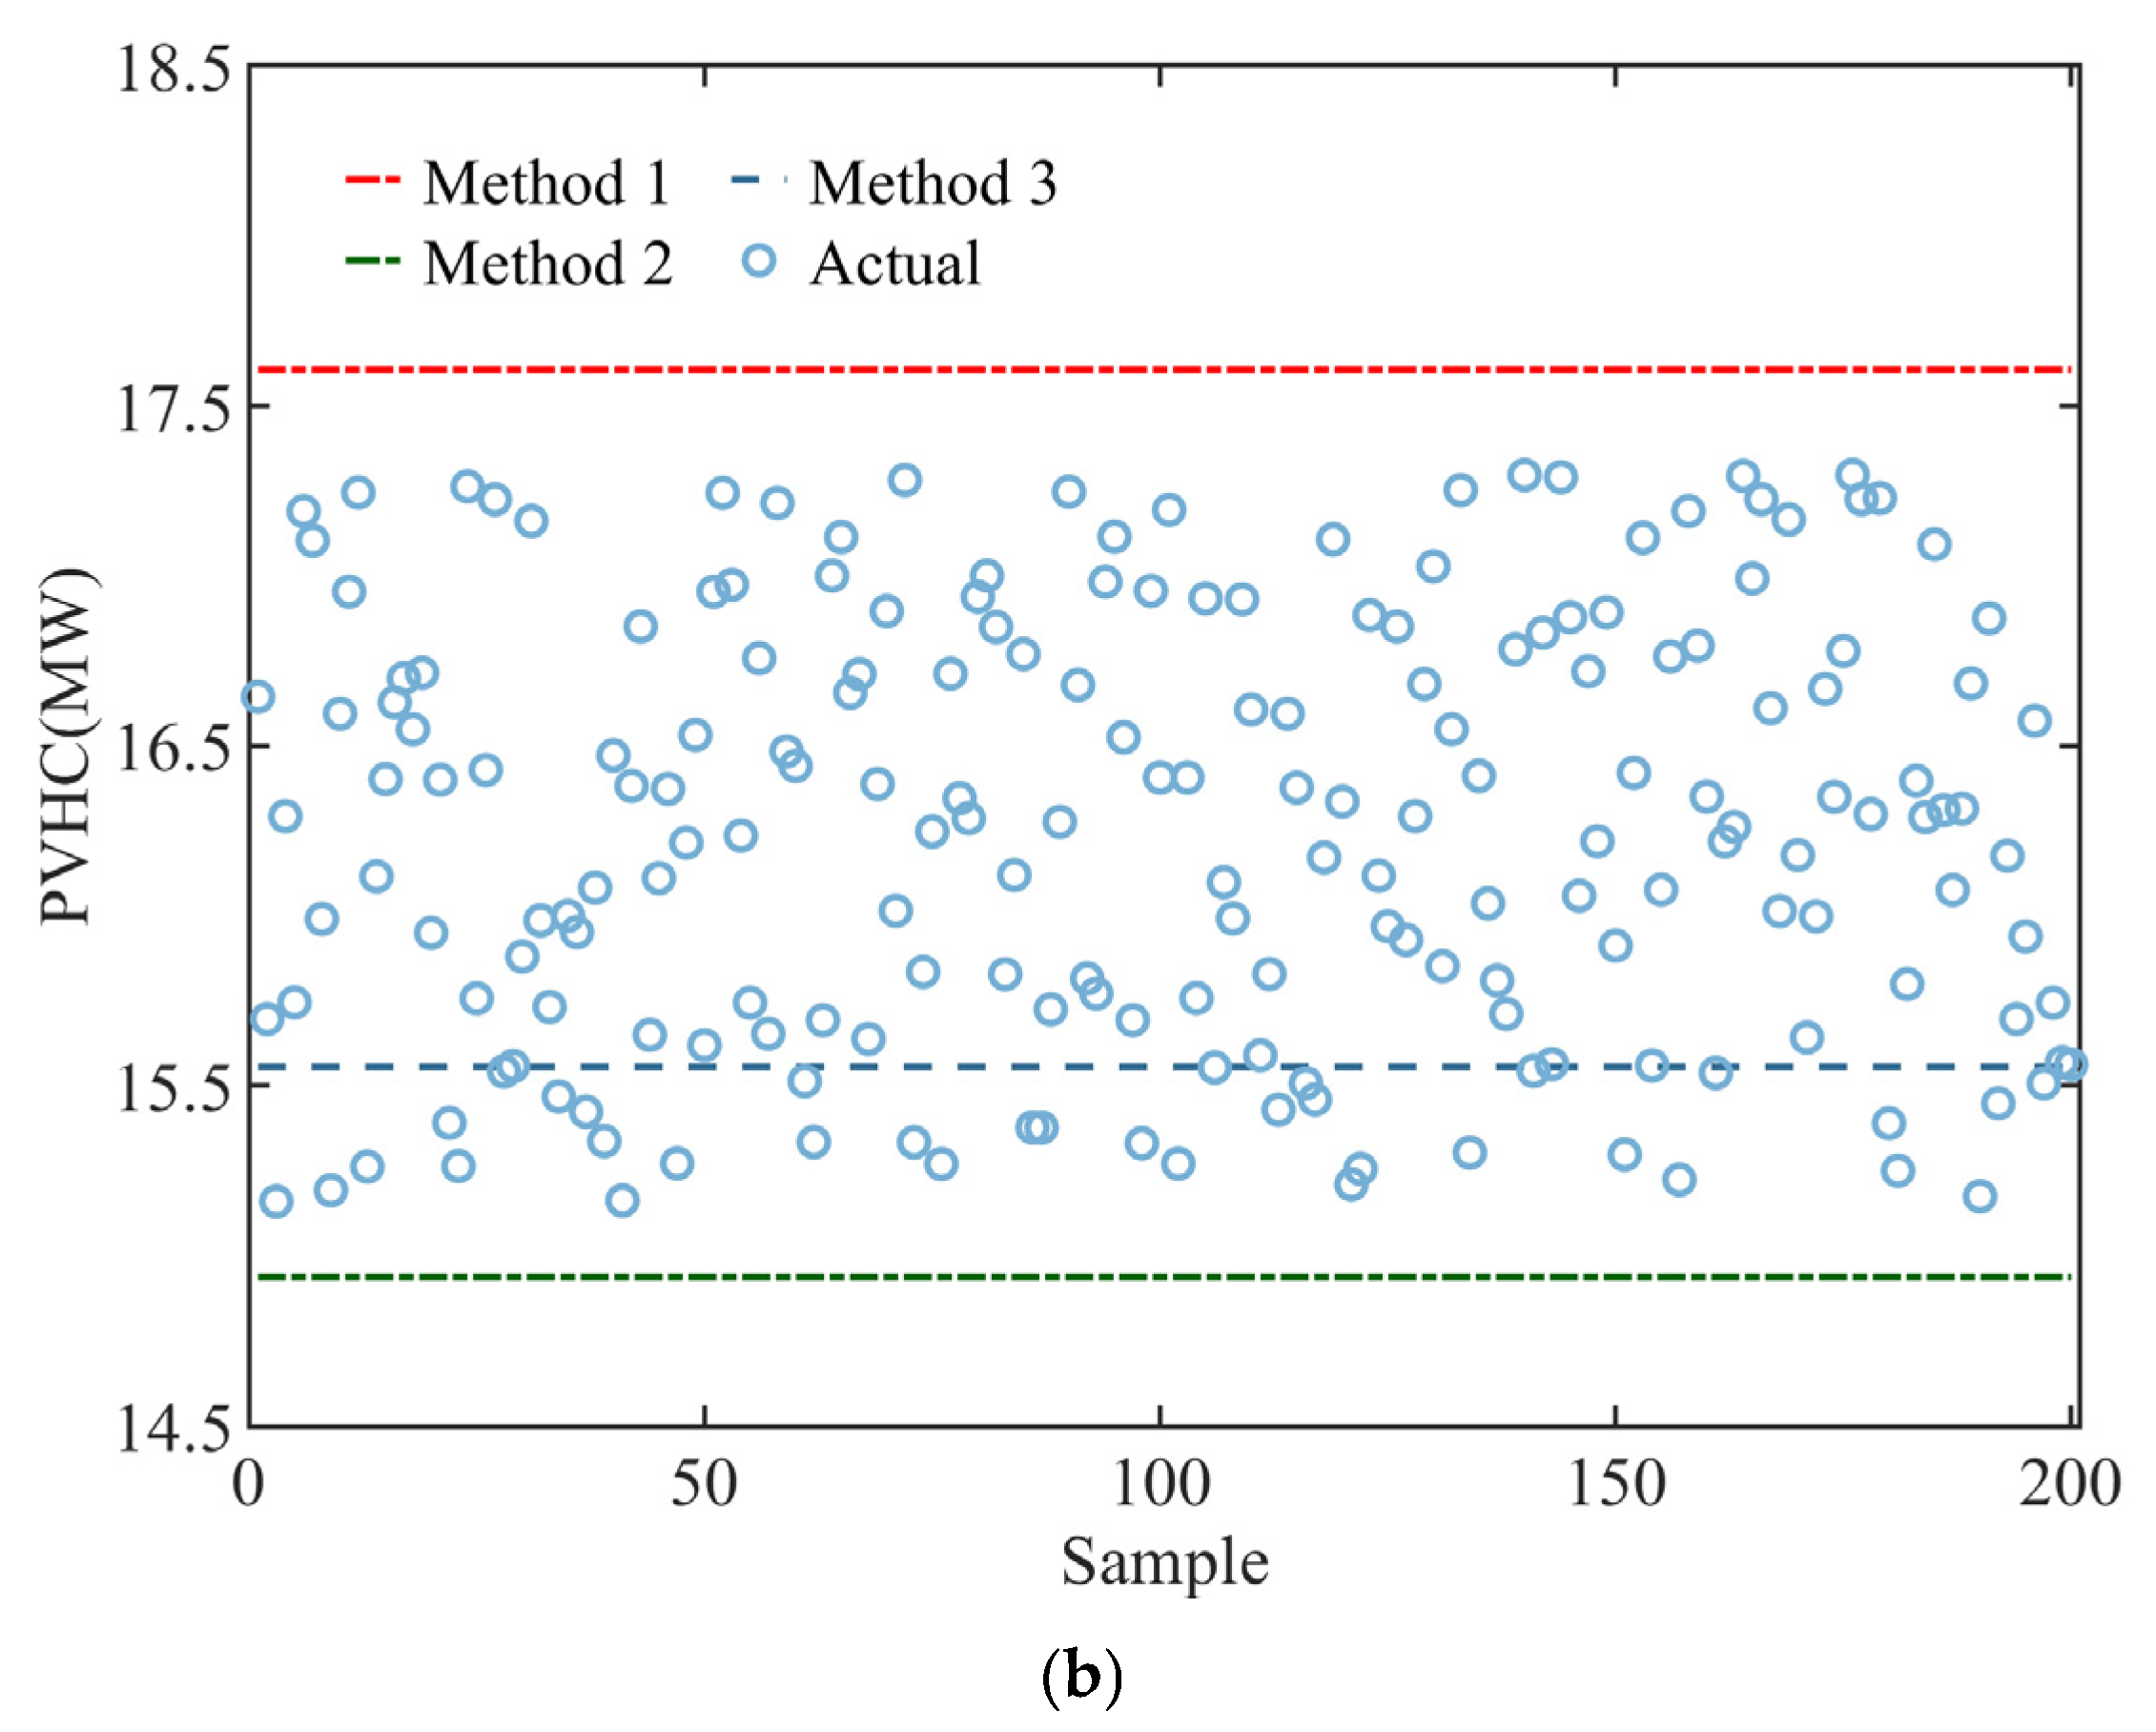
4.5. Applicability of Different Distribution Networks

In order to explore the applicability and superiority of the methods proposed in this paper, this section further analyzes the evaluation results of the three methods under different sizes of distribution networks. First, this section constructs a 69-node distribution network and a 135-node distribution network, respectively. The AC/DC converter ports of the E-SOP in the 69-node distribution grid are connected to nodes 27, 35, 46, and 65, and the nodes for distributed PVHC assessment are nodes 21, 46, 52, and 64, with a maximum accessible capacity of 4 MW at each node; the AC/DC converter ports of the E-SOP in the 135-node are connected to nodes 21, 31, 75, and 134, and the distributed PVHC assessment results are further analyzed in this section. Node 134 and the distributed PVHC assessment nodes are nodes 44, 49, 59 and 73, respectively, with a maximum accessible capacity of 6 MW per node, and the topologies of the two distribution grids are shown in Figure 9.
Second, based on the topology of the distribution network constructed in Figure 9, the three methods proposed in Section 4.2 are used in this section to evaluate the hosting capacity of distribution networks of different scales, as shown in Figure 10. Observing Figure 10, it can be seen that the methods proposed in this paper are not only applicable to the small-scale 33-node distribution network, but also to the large-scale 69- and 135-node distribution networks. Meanwhile, compared with the deterministic evaluation model and traditional methods, the evaluation results obtained by the proposed method in this paper are more robust and can be adapted to most of the situations. In addition, the computational speed is also an important factor in determining whether a method is good or bad, so the computational times of the three methods are compared in this section, as shown in Table 2. Observing Table 2, it can be seen that with the expansion of the distribution network scale, the calculation time of the three methods has increased to a certain extent, and because the method of this paper takes into account the uncertainty of the distributed PV output, the calculation time of the proposed method of this paper has increased relative to the deterministic assessment model and the traditional method. However, compared with the improvement of accuracy and robustness of the hosting capacity assessment results brought by this paper’s method, the slight increase in computation time is acceptable.

5. Conclusions

Aiming at the characteristics of mountainous distribution network with scattered power users and large transmission radius, this paper analyzes the difference between a traditional mountainous distribution network and mountainous flexible distribution network, and establishes a robust assessment model of a mountainous distribution network’s hosting capacity for distributed PV based on the consideration of distributed PV output uncertainty. The following conclusions can be obtained through the analysis of the IEEE 33-node mountain flexible distribution grid example:
(1)
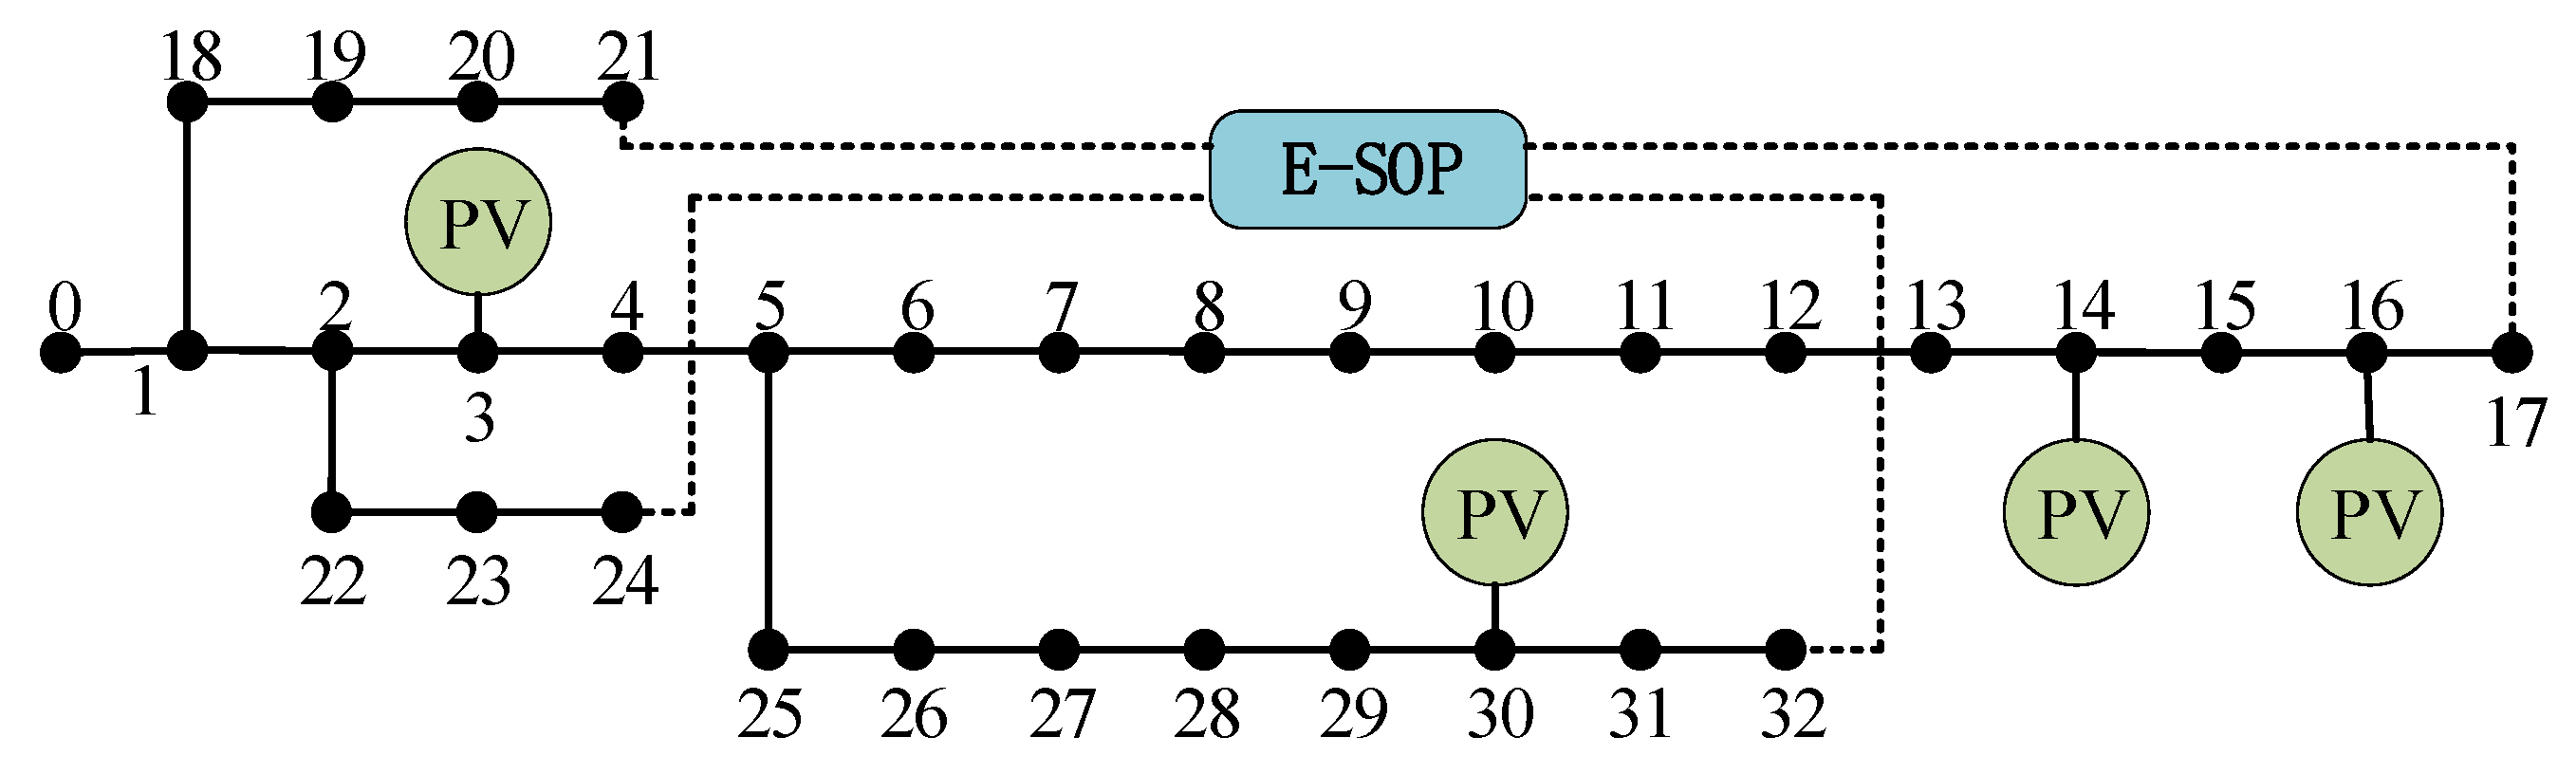
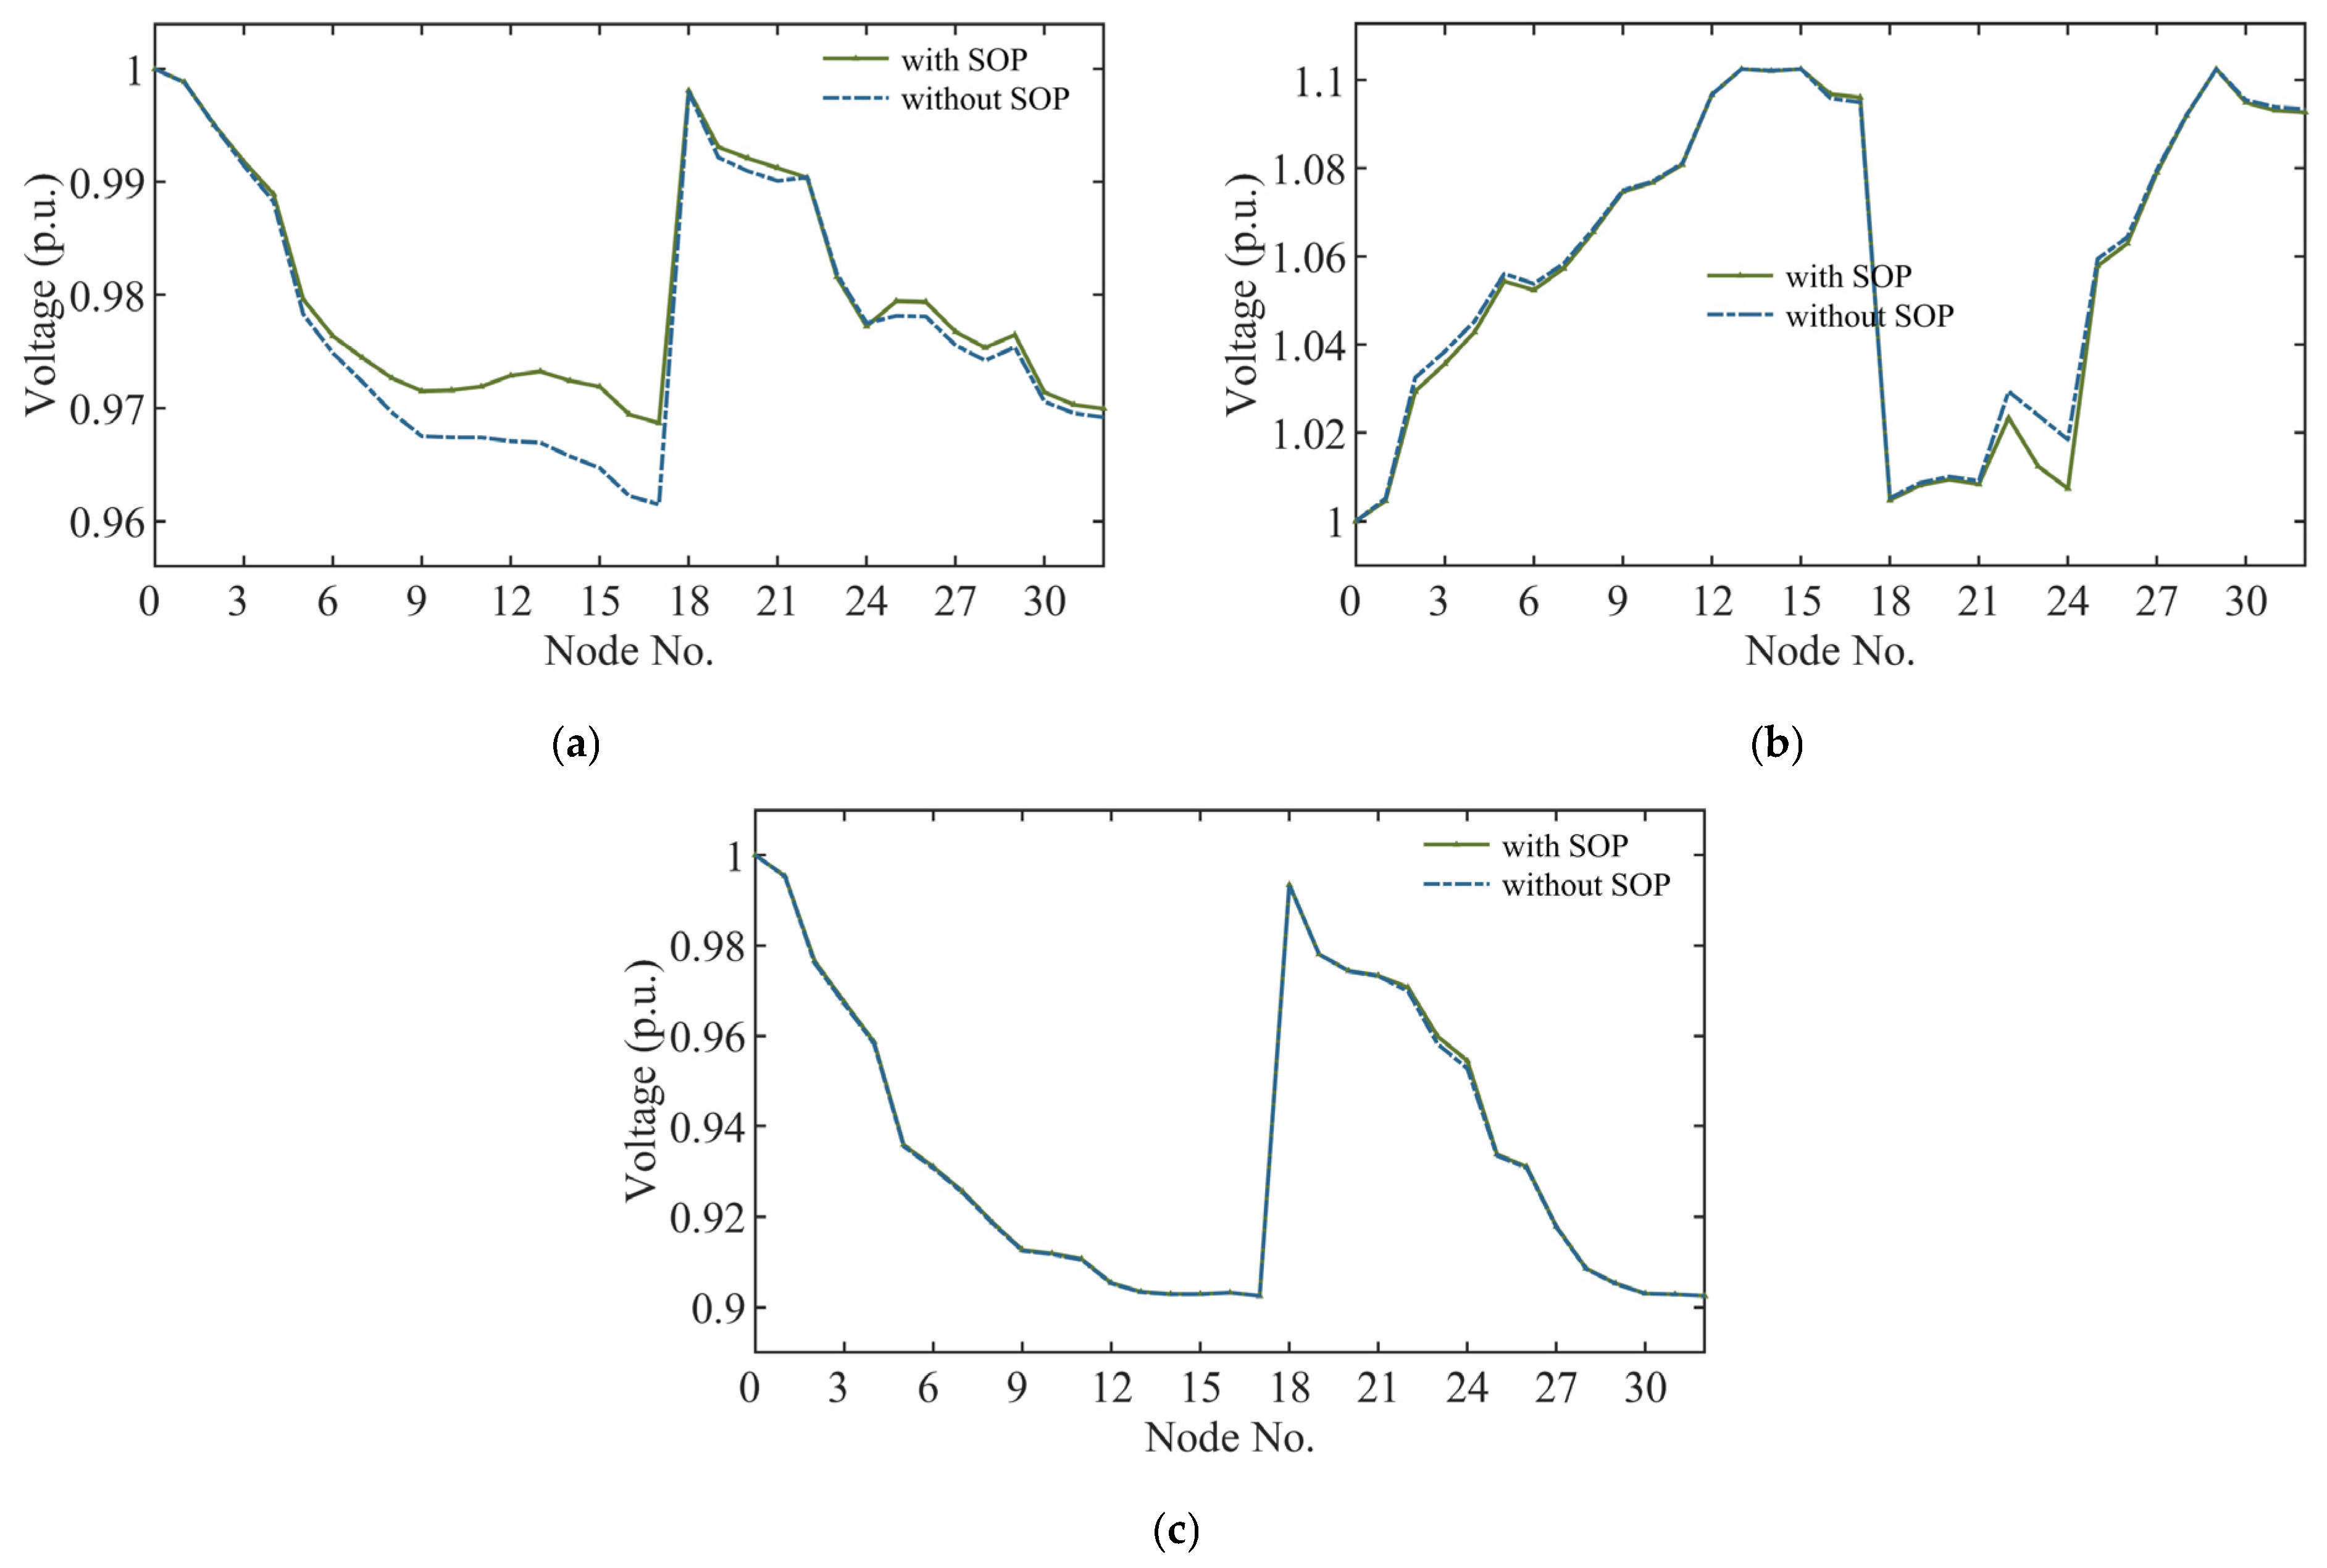
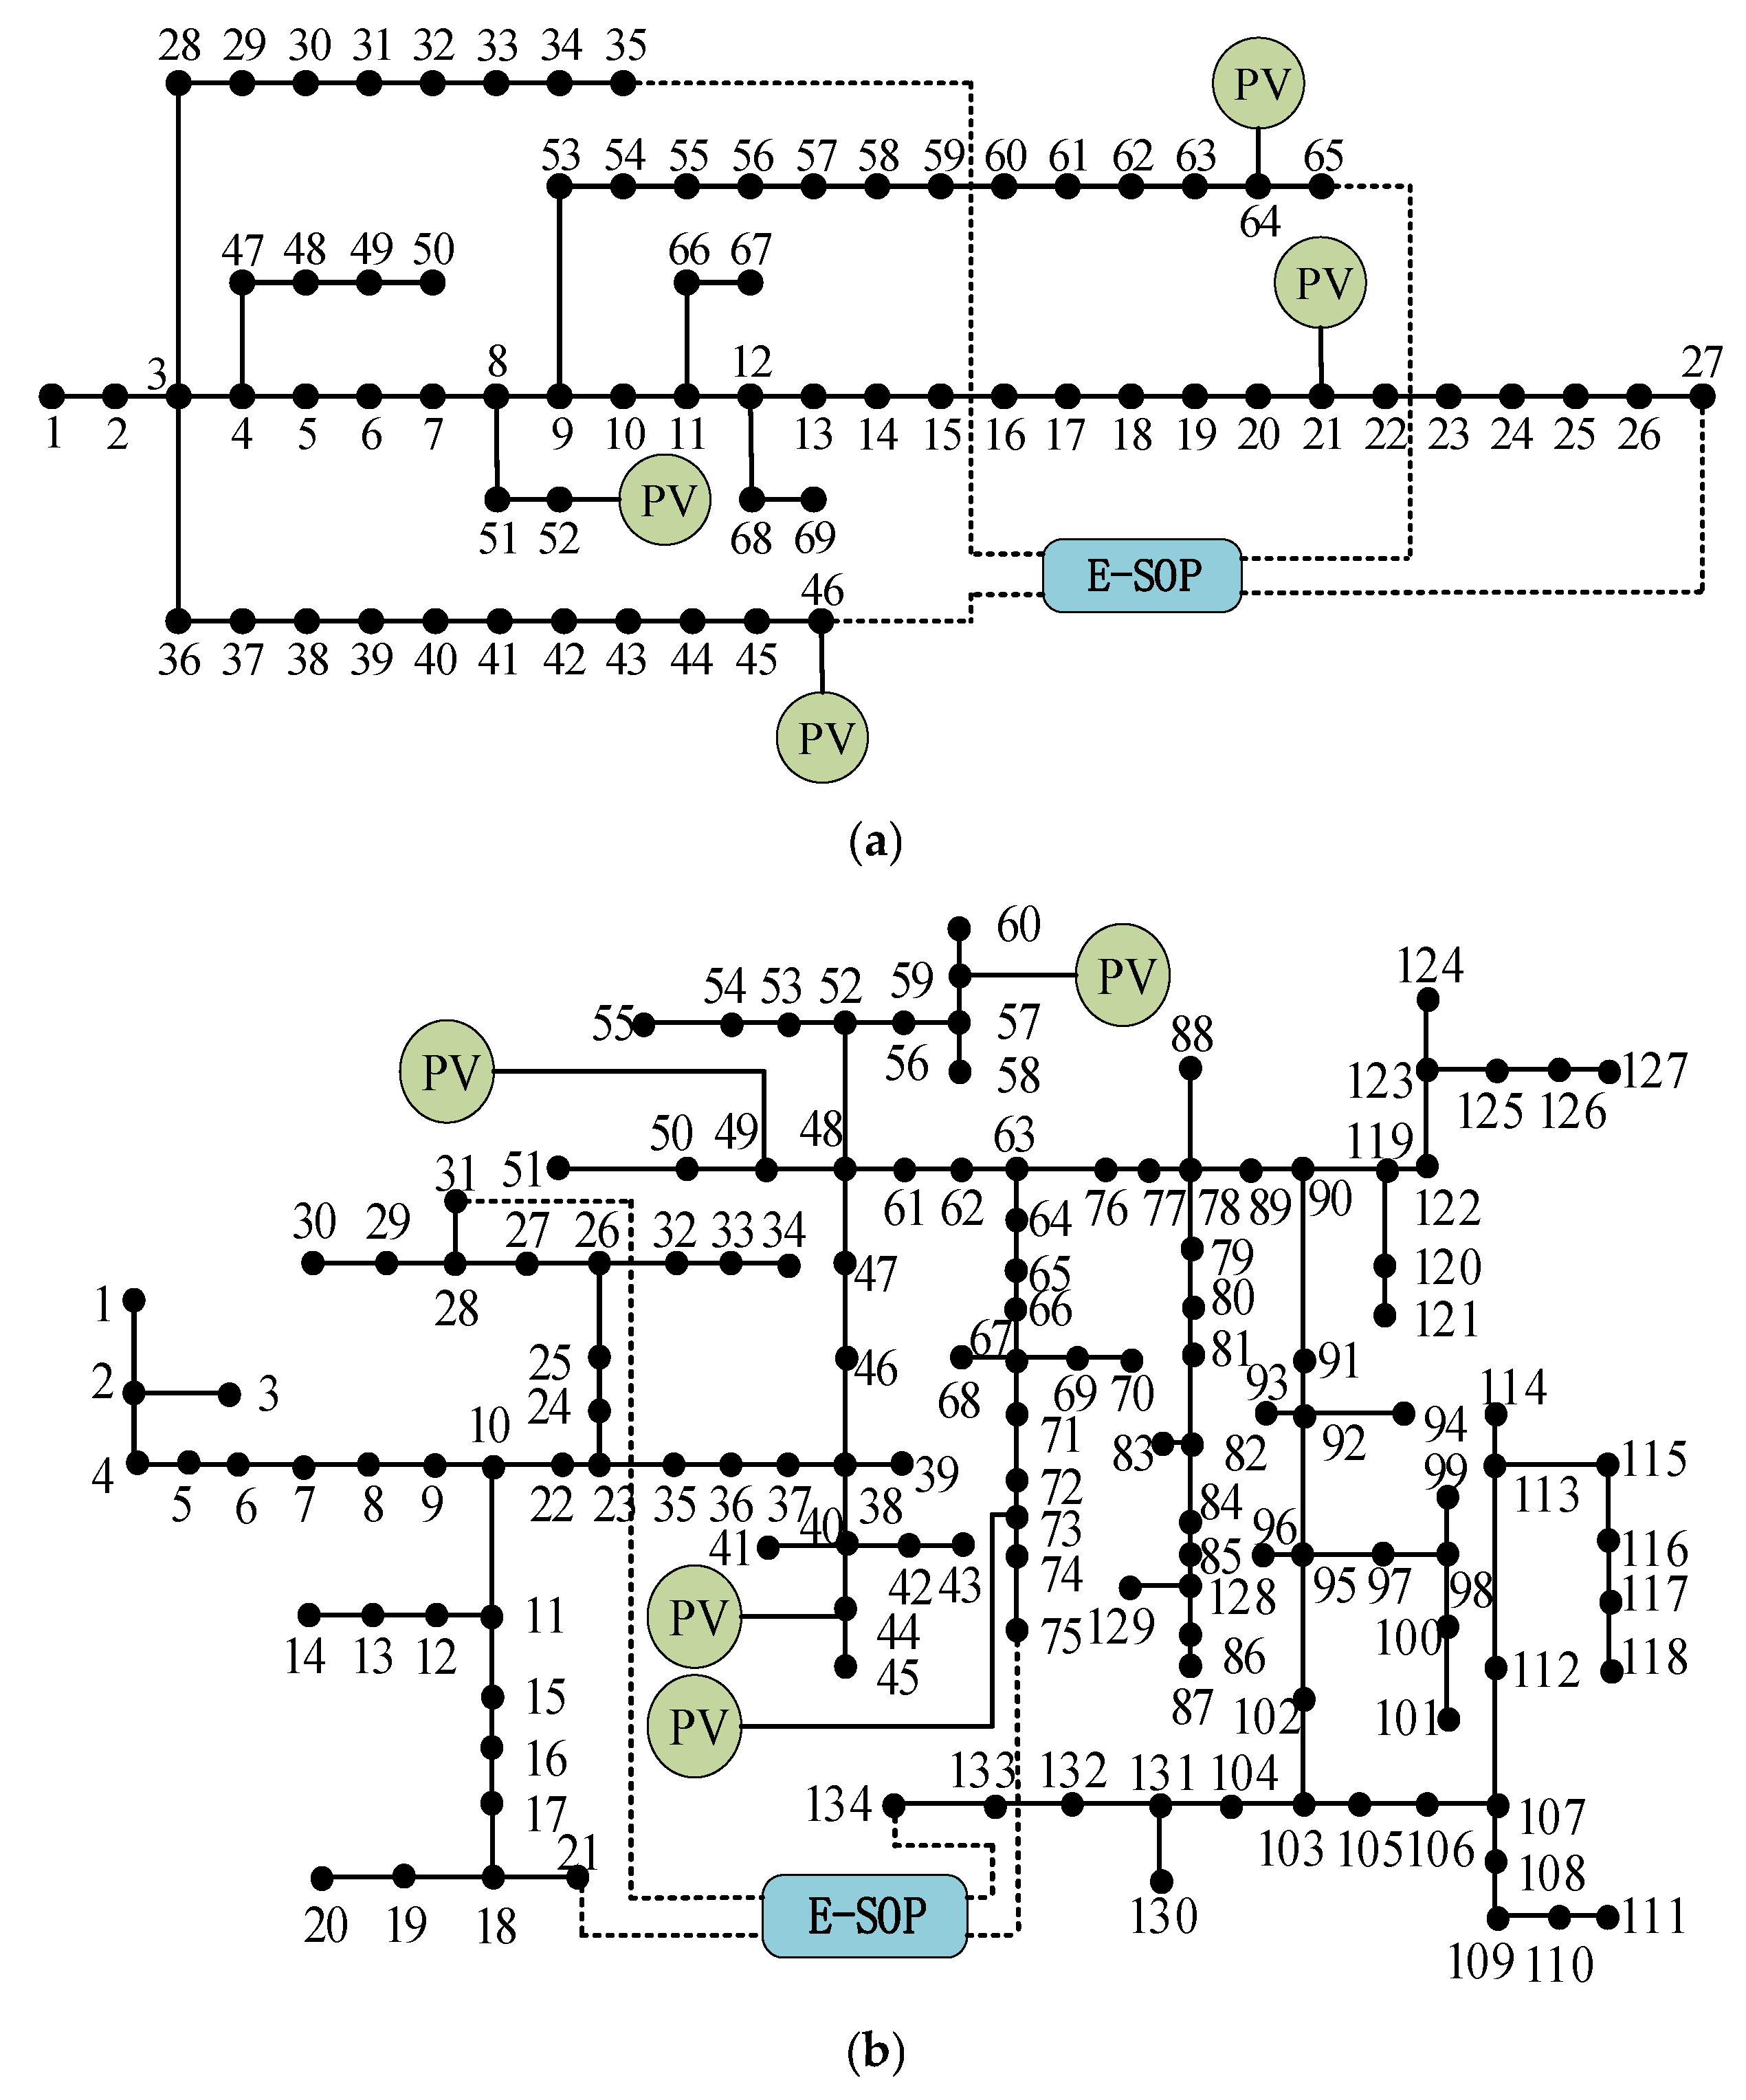
E-SOP’s temporal and spatial trend flexibility makes it possible to alleviate the problem of low voltage at the end of the mountainous distribution network and change the unidirectional trend into bidirectional trend, thus improving the hosting capacity of distributed PV in the distribution network. The case study of the 33-node mountainous flexible distribution network of IEEE shows that the introduction of E-SOP further alleviates the problem of low voltage at the end-nodes of the mountainous distribution network caused by the long power supply radius. This means that there are fewer problems. Meanwhile, the evaluation results are improved when E-SOP is taken into account compared with when it is not taken into account, whether it is a deterministic evaluation model, a traditional method, or the method proposed in this paper.
(2)
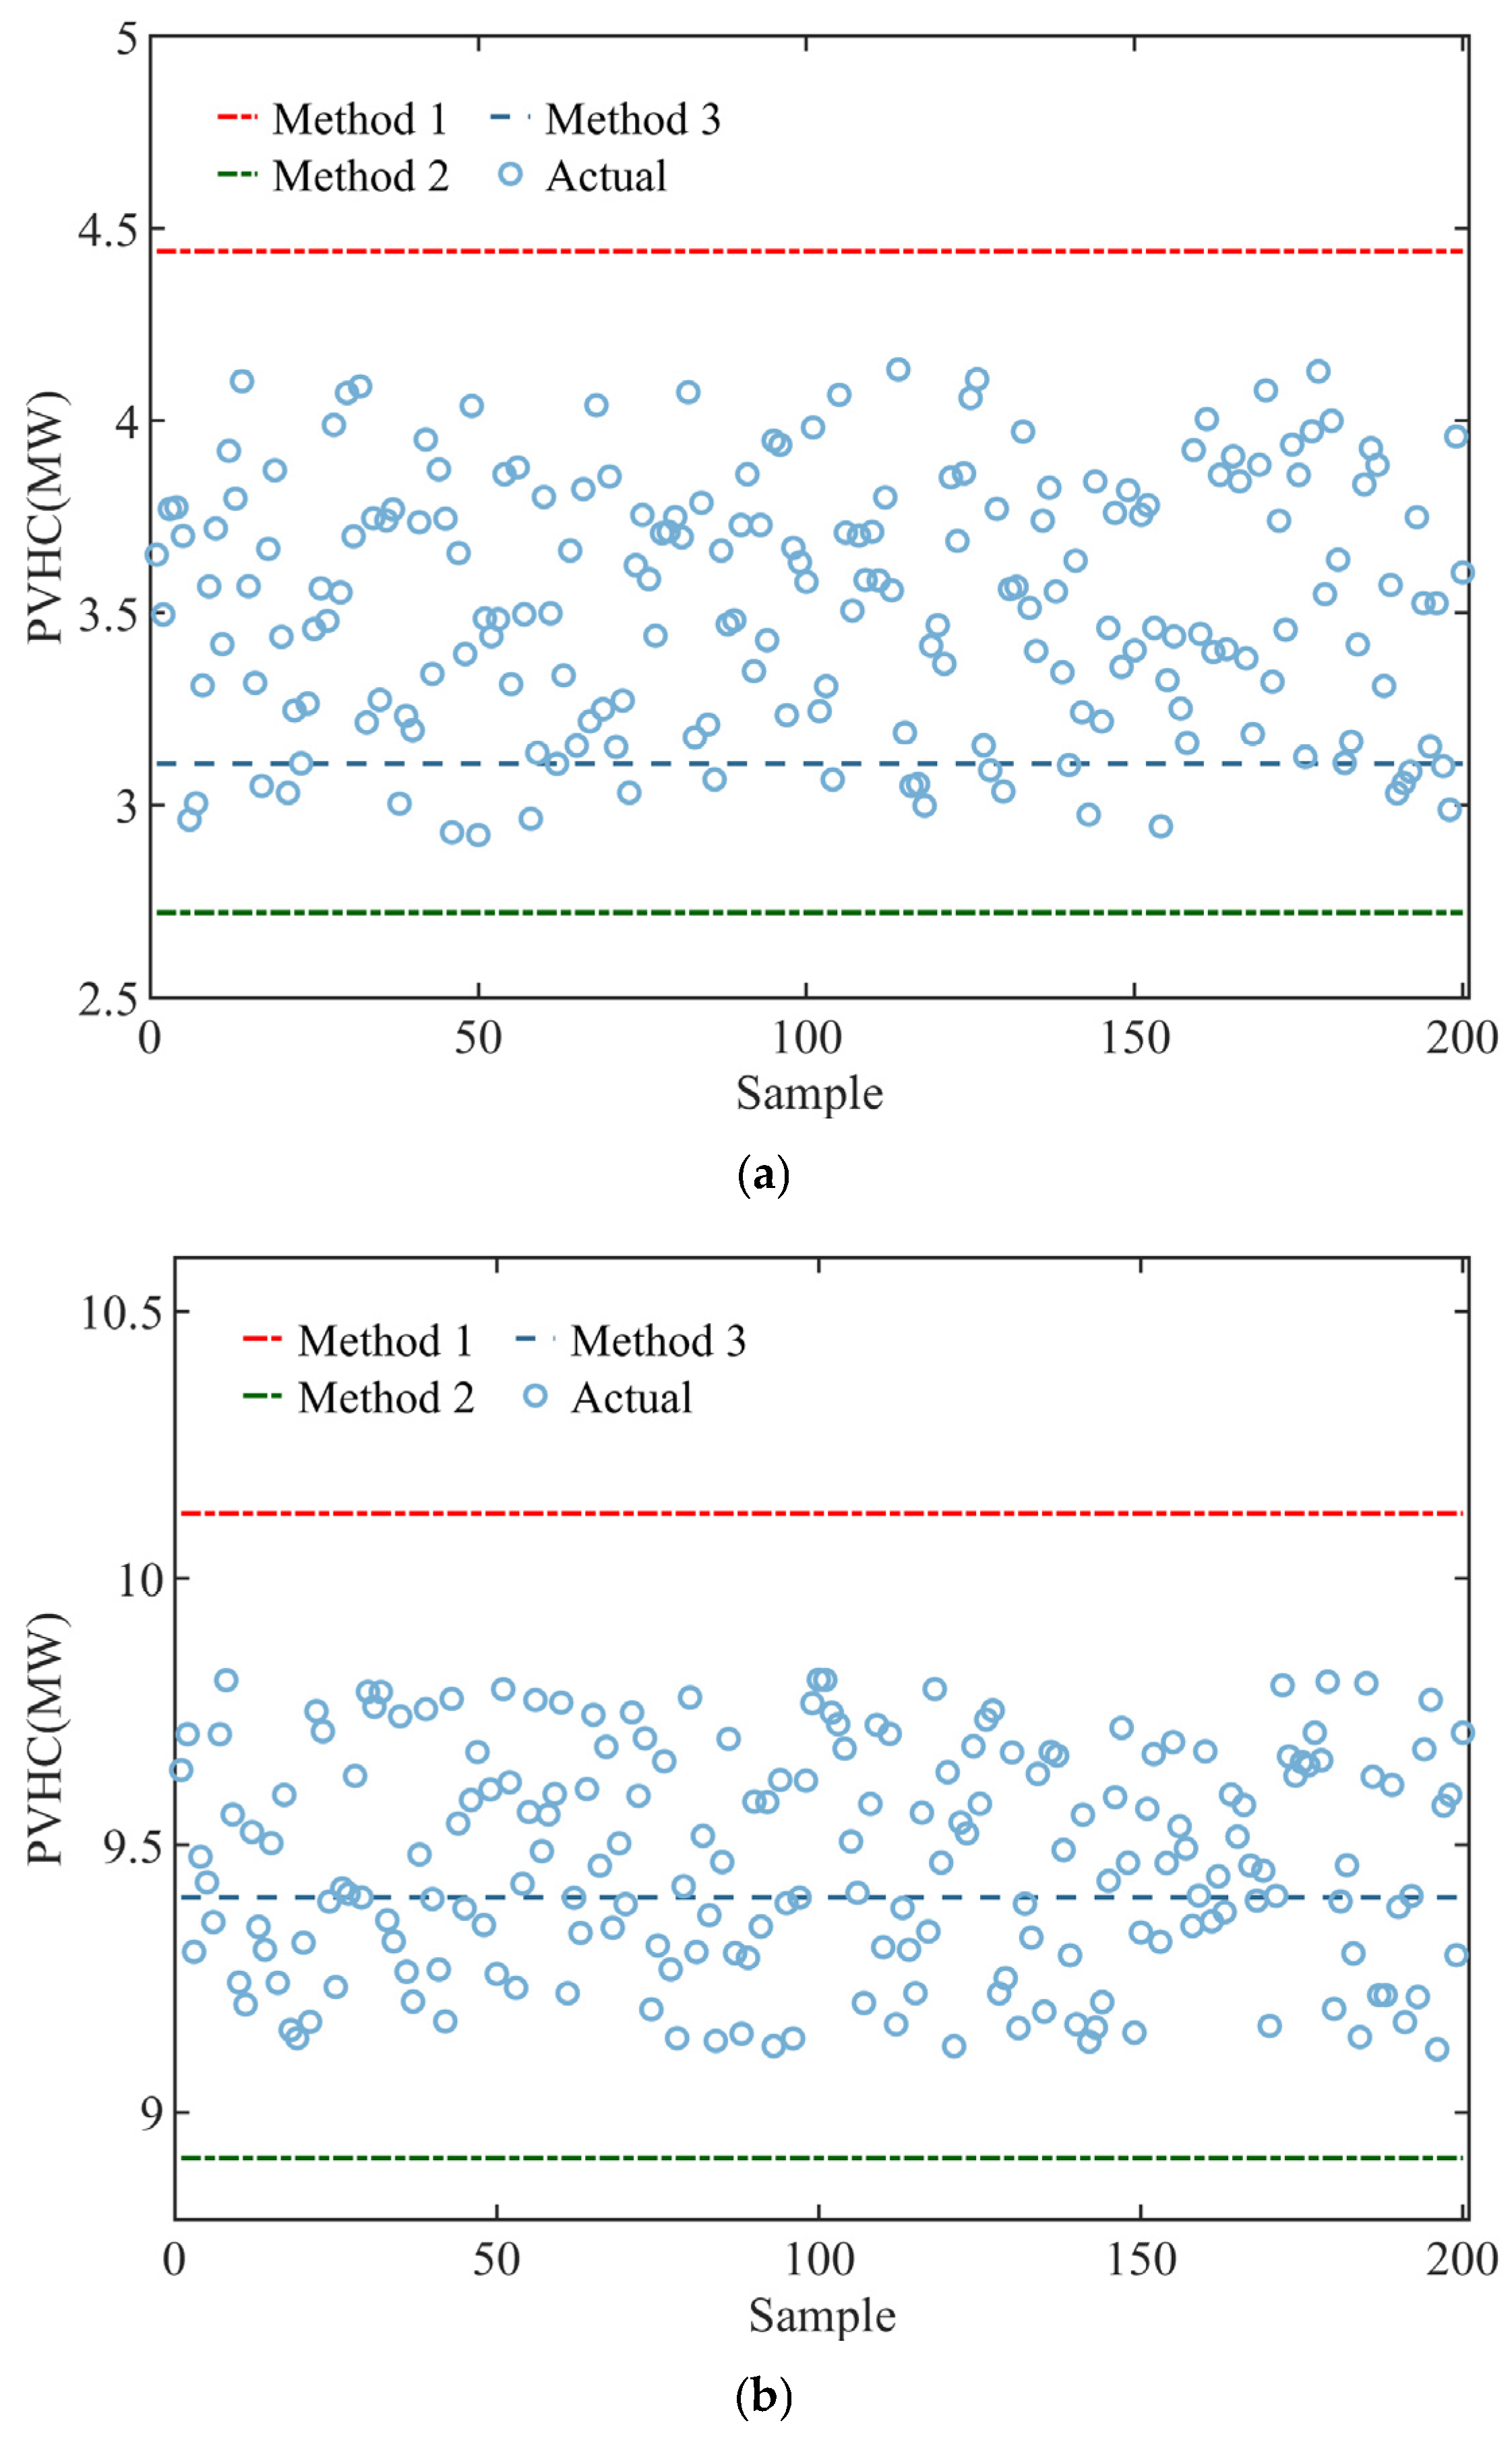
The method proposed in this paper analyzes the distributed PV output uncertainty model on the basis of the deterministic assessment model, and obtains a two-layer robust assessment model. An example analysis of the IEEE 33-node mountainous flexible distribution network shows that the two-layer robust model developed by the method proposed in this paper takes into account the uncertainty variables to minimize the distribution network acceptance of the distributed PV capacity, and the results obtained have good robustness and accuracy.

Author Contributions

Conceptualization, Y.Z.; methodology, K.Z.; software, H.D.; validation, R.W.; formal analysis, Y.Y.; investigation, L.H.; resources, Q.G.; data curation, K.L.; project administration, Q.G.; methodology, Q.G. All authors have read and agreed to the published version of the manuscript.

Funding

This work is supported by the design of mountainous distribution network interconnection architecture to support high proportion of distributed photovoltaic consumption and equipment research and development project (GZKJXM20222409).

Data Availability Statement

The original contributions presented in the study are included in the article; further inquiries can be directed to the corresponding author.

Conflicts of Interest

Author Youzhuo Zheng, Kun Zhou, Yekui Yang and Long Hua were employed by the company Electric Power Research Institute of Guizhou Power Grid Co., Ltd. The remaining authors declare that the research was conducted in the absence of any commercial or financial relationships that could be construed as a potential conflict of interest.

References

  1. Breyer, C.; Khalili, S.; Bogdanov, D.; Ram, M.; Oyewo, A.S.; Aghahosseini, A.; Gulagi, A.; Solomon, A.A.; Keiner, D.; Lopez, G.; et al. On the History and Future of 100% Renewable Energy Systems Research. IEEE Access 2022, 10, 78176–78218. [Google Scholar] [CrossRef]
  2. PraveenKumar, S.; Kumar, A. Thermodynamic, environmental and economic analysis of solar photovoltaic panels using aluminium reflectors and latent heat storage units: An experimental investigation using passive cooling approach. J. Energy Storage 2025, 12, 115487. [Google Scholar] [CrossRef]
  3. Mmary, E.R.; Marungsri, B. Optimal Hybrid Renewable Generator for Techno-Economic Benefits in Smart Distribution Network. In Proceedings of the 2018 International Electrical Engineering Congress (iEECON), Krabi, Thailand, 7–9 March 2018. [Google Scholar]
  4. Xiao, J.; Zu, G.; Zhou, H.; Zhang, X. Total Quadrant Security Region for Active Distribution Network with High Penetration of Distributed Generation. J. Mod. Power Syst. Clean Energy 2021, 9, 128–137. [Google Scholar] [CrossRef]
  5. Zhang, S.; Ge, S.; Liu, H.; Li, J.; Wang, C. Model and observation of the feasible region for PV integration capacity considering Wasserstein-distance-based distributionally robust chance constraints. Appl. Energy 2023, 347, 121312. [Google Scholar] [CrossRef]
  6. Dubey, A.; Santoso, S. On Estimation and Sensitivity Analysis of Distribution Circuit’s Photovoltaic Hosting Capacity. IEEE Trans. Power Syst. 2017, 32, 2779–2789. [Google Scholar] [CrossRef]
  7. Xu, Z.; Zhang, N.; Li, J.; Zhong, C.; Dang, J.; Chang, R.; Yang, S.; Yu, F.; Zhang, G.; Zhang, J.; et al. Optimization of losses in active low-voltage distribution networks in mountainous areas considering photovoltaic integration. In Proceedings of the 2024 3rd International Conference on Energy, Power and Electrical Technology (ICEPET), Chengdu, China, 17–19 May 2024. [Google Scholar]
  8. Jun, C.; Ke, W.; Jun, L.; Chaoyang, C.; Junda, M.; Dong, S.; Qianyin, C. Research on Loss Reduction Strategies in Terrace Areas under High Penetration of Photovoltaics. Power Syst. Big Data 2023, 26, 36–43. [Google Scholar]
  9. Juan, Y.; Xiaowen, Z.; Jia, S.; Xinwei, D. Short-term load forecasting of power systems taking into account grid-connected photovoltaic and wind power. Power Syst. Big Data 2023, 26, 10–22. [Google Scholar]
  10. Abad, M.S.S.; Ma, J.; Zhang, D.; Ahmadyar, A.S.; Marzooghi, H. Probabilistic Assessment of Hosting Capacity in Radial Distribution Systems. IEEE Trans. Sustain. Energy 2018, 9, 1935–1947. [Google Scholar] [CrossRef]
  11. Chen, X.; Wu, W.; Zhang, B. Robust Capacity Assessment of Distributed Generation in Unbalanced Distribution Networks Incorporating ANM Techniques. IEEE Trans. Sustain. Energy 2018, 9, 651–663. [Google Scholar] [CrossRef]
  12. Astero, P.; Söder, L. Improving PV Dynamic Hosting Capacity Using Adaptive Controller for STATCOMs. IEEE Trans. Energy Convers. 2019, 34, 415–425. [Google Scholar] [CrossRef]
  13. Mahmoodi, M.; Attarha, A.; Mahdi Noori, R.A.S.; Scott, P.; Blackhall, L. Adjustable robust approach to increase DG hosting capacity in active distribution systems. Electr. Power Syst. Res. 2022, 211, 108347. [Google Scholar] [CrossRef]
  14. Naciri, S.; Moufid, I.; El Markhi, H. Dynamic hosting capacity of photovoltaic system analysis and enhancement using distributed SVC and STATCOM compensators: Case study of a university building. Renew. Energy Focus 2023, 45, 123–132. [Google Scholar] [CrossRef]
  15. Zhang, S.; Ge, S.; Liu, H.; Hou, G.; Wang, C. An Analytical Method for Delineating Feasible Region for PV Integration Capacities in Net-zero Distribution Systems Considering Battery Energy Storage System Flexibility. J. Mod. Power Syst. Clean Energy 2024, 12, 475–487. [Google Scholar] [CrossRef]
  16. Zheng, Z.; Liang, R.; Yang, B.; Liu, H.; Li, H.; Yin, Z. Distribution network distributed photovoltaic absorbing capacity calculation and energy storage optimization configuration method. In Proceedings of the 2022 2nd International Conference on Electrical Engineering and Mechatronics Technology (ICEEMT), Virtual, 1–3 July 2022. [Google Scholar]
  17. Juqin, X.; Lingui, Z.; Guilian, W.; Ming, L.; Zongli, W.; Jun, L. Research on optimal access capacity and location of distributed power supply in mountainous areas. Appl. Electron. Tech. 2015, 41, 162–166. [Google Scholar]
  18. Xuemeng, T. Optimization Analysis of Operation Strategies of Mountainous Distribution Networks. Appl. IC 2022, 39, 104–105. [Google Scholar]
  19. Xinghang, W.; Yongjin, C.; Hui, H.; Ning, X.; Zhongming, W. Planning method for feeder automation in mountainous distribution networks taking into account DG access. Mech. Electr. Eng. Technol. 2019, 48, 178–182. [Google Scholar]
  20. Zhang, Y.; Zheng, F.; Zhang, Y.; Xu, X. Automatic feeder planning method of distribution network in mountainous areas considering access to distributed energy. J. Phys. Conf. Ser. 2024, 2835, 12061. [Google Scholar] [CrossRef]
  21. Gang, T.; Min, Y.; Wang, G.; Yang, L. The Research on Bi-Level Programming for Distribution Network Energy Storage in Remote Areas. In Proceedings of the 2024 IEEE 5th International Conference on Advanced Electrical and Energy Systems (AEES), Lanzhou, China, 29 November–1 December 2024. [Google Scholar]
  22. Ye, B.; Zheng, Z.; Zhang, L.; Wang, K.; Yu, S.; Fan, S. Planning Method of Feeder Automation of Distribution Network in Mountain Area Considering Distributed Generation. In Proceedings of the 2019 9th International Conference on Power and Energy Systems (ICPES), Perth, Australia, 10–12 December 2019. [Google Scholar]
  23. Wei, L. Difficulty Analysis and Countermeasures of Automation Construction of Mountain Distribution Grids. New Technol. New Prod. China 2023, 17, 66–69. [Google Scholar]
  24. Peng, L. Planning direction and construction of distribution network automation in mountainous areas. Autom. Appl. 2018, 5, 110–111. [Google Scholar]
  25. Sarantakos, I.; Peker, M.; Zografou-Barredo, N.M.; Deakin, M.; Patsios, C.; Sayfutdinov, T.; Taylor, P.C.; Greenwood, D. A Robust Mixed-Integer Convex Model for Optimal Scheduling of Integrated Energy Storage—Soft Open Point Devices. In Proceedings of the 2023 IEEE Power & Energy Society General Meeting (PESGM), Orlando, FL, USA, 16–20 July 2023. [Google Scholar]
  26. Qian, T.; Ming, W.; Shao, C.; Hu, Q.; Wang, X.; Wu, J.; Wu, Z. An Edge Intelligence-Based Framework for Online Scheduling of Soft Open Points With Energy Storage. IEEE Trans. Smart Grid 2024, 15, 2934–2945. [Google Scholar] [CrossRef]
  27. Li, H. A Genetic Algorithm Based on Duality for Linear Bilevel Programming Problems. In Proceedings of the 2011 Seventh International Conference on Computational Intelligence and Security, Sanya, China, 3–4 December 2011. [Google Scholar]
  28. Wang, M.; Xu, Y.; Gu, Y. Multi-task nonconvex optimization with total budget constraint: A distributed algorithm using Monte Carlo estimates. In Proceedings of the 2014 19th International Conference on Digital Signal Processing, Hong Kong, China, 20–23 August 2014. [Google Scholar]
Figure 1. Model solving flowchart.
Energies 18 02394 g001
Figure 2. Equivalent model of distribution network: (a) traditional mountain distribution networks and (b) distribution grid in mountainous areas connected to distributed PVs.
Energies 18 02394 g002
Figure 3. Intelligent energy storage–soft switchgear (E-SOP) structure.
Energies 18 02394 g003
Figure 4. IEEE 33-node flexible distribution network in mountainous areas.
Energies 18 02394 g004
Figure 5. Load and distributed PV timing curves.
Energies 18 02394 g005
Figure 6. Comparison of the three methods and actual hosting capacity results with/without E-SOP consideration: (a) with E-SOP and (b) without E-SOP.
Energies 18 02394 g006
Figure 7. Nodal voltage profile of the mountainous distribution network with/without E-SOP consideration: (a) average value; (b) maximum values; (c) minimum values.
Energies 18 02394 g007
Figure 8. Distribution network hosting capacity under different robust budgets.
Energies 18 02394 g008
Figure 9. Topology of distribution networks of different sizes: (a) 69-node distribution network and (b) 135-node distribution network.
Energies 18 02394 g009
Figure 10. Results of hosting capacity assessment of distribution networks of different sizes: (a) 69-node distribution network, and (b) 135-node distribution network.
Energies 18 02394 g010aEnergies 18 02394 g010b
Table 1. Evaluation results of the three methods with/without consideration of E-SOPs.
Deterministic Assessment ModelTwo-Layer Robust ModelTraditional Methods
With E-SOP10.211 MW9.004 MW9.502 MW
Without E-SOP10.122 MW8.915 MW9.402 MW
Table 2. Calculation time of the three methods under different sizes of distribution networks.
Deterministic Assessment ModelTwo-Layer Robust ModelTraditional Methods
33-node distribution network14.37 s16.21 s11.84 s
69-node distribution network18.11 s30.06 s12.04 s
135-node distribution network23.32 s30.79 s14.26 s
Disclaimer/Publisher’s Note: The statements, opinions and data contained in all publications are solely those of the individual author(s) and contributor(s) and not of MDPI and/or the editor(s). MDPI and/or the editor(s) disclaim responsibility for any injury to people or property resulting from any ideas, methods, instructions or products referred to in the content.

