
A Bidding Strategy for Power Suppliers Based on Multi-Agent Reinforcement Learning in Carbon–Electricity–Coal Coupling Market

Abstract
1. Introduction
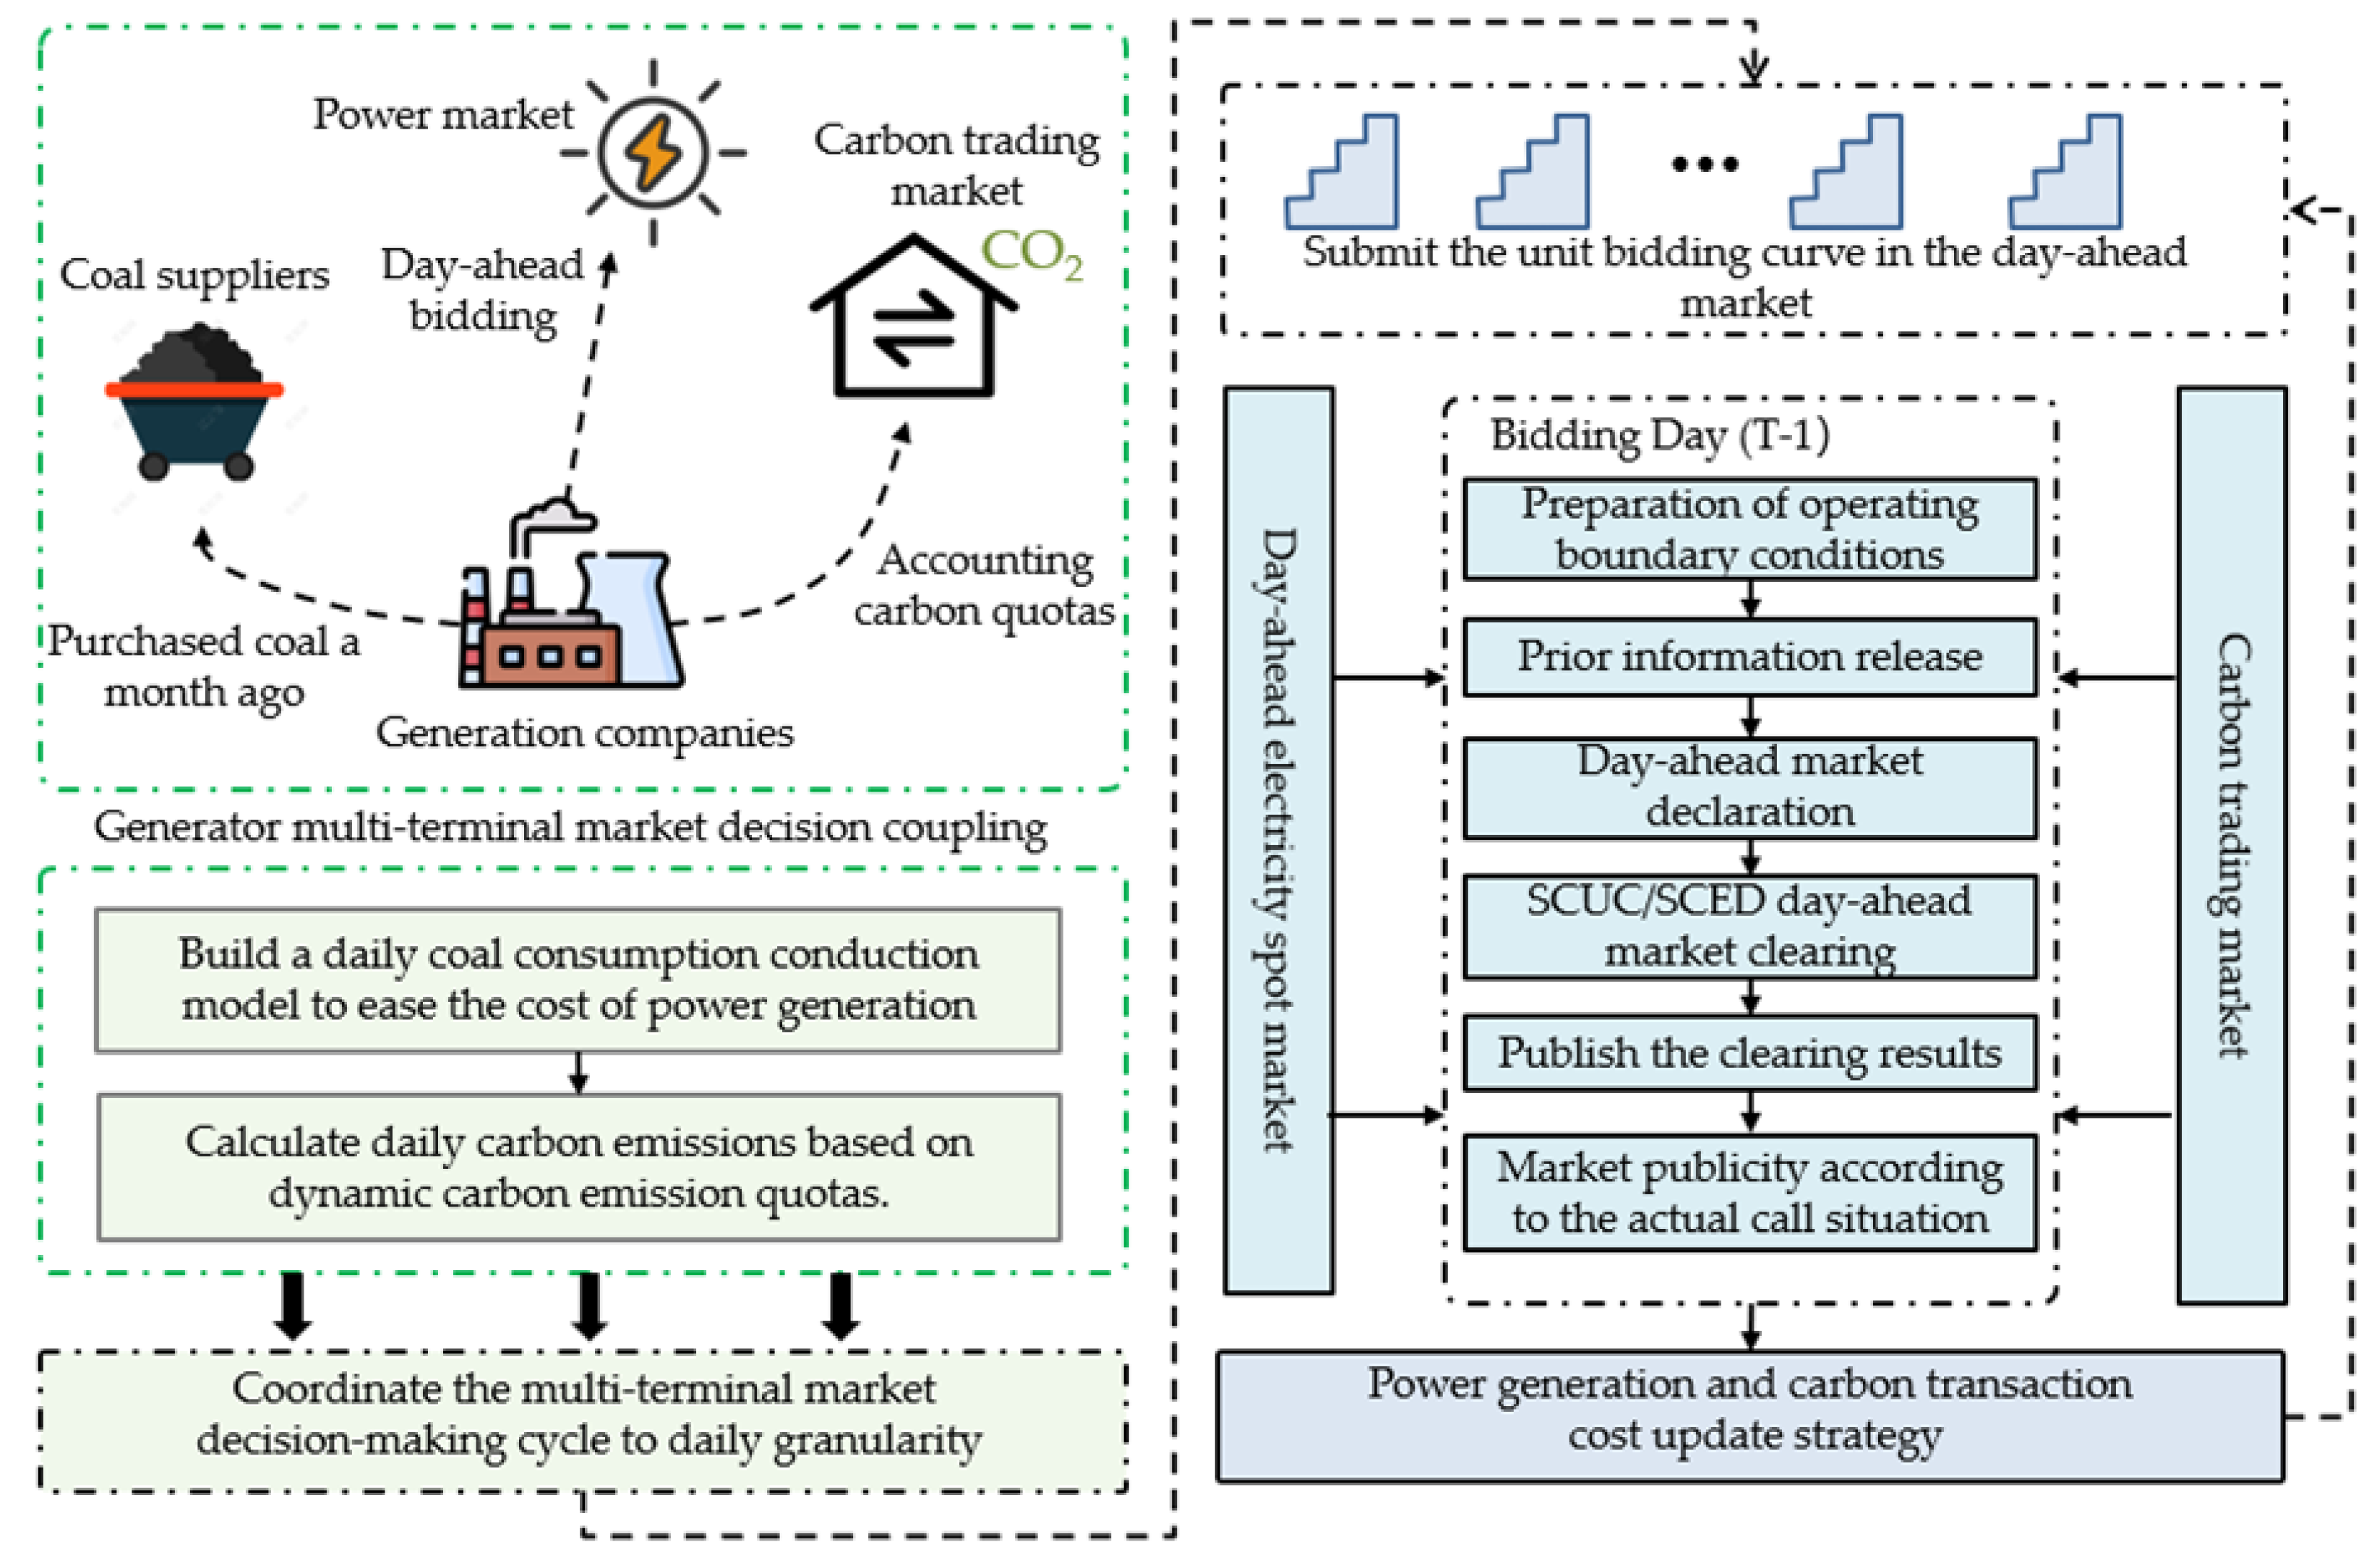
2. Carbon–Electricity–Coal Coupling Market Decision-Making Cycle Coordination
2.1. Analysis of Decision-Making Cycle of Power Suppliers Participating in Multi-Sided Market
2.2. Carbon–Electricity–Coal Coupling Market Decision-Making Cycle Coordination Model
2.2.1. Coordination of Monthly Coal Market Cost Decision Making
2.2.2. Coordination of Monthly Carbon Trading Market Decision Cycle
2.2.3. Day-Ahead Decision-Making Process of Carbon–Electricity–Coal Coupling Market
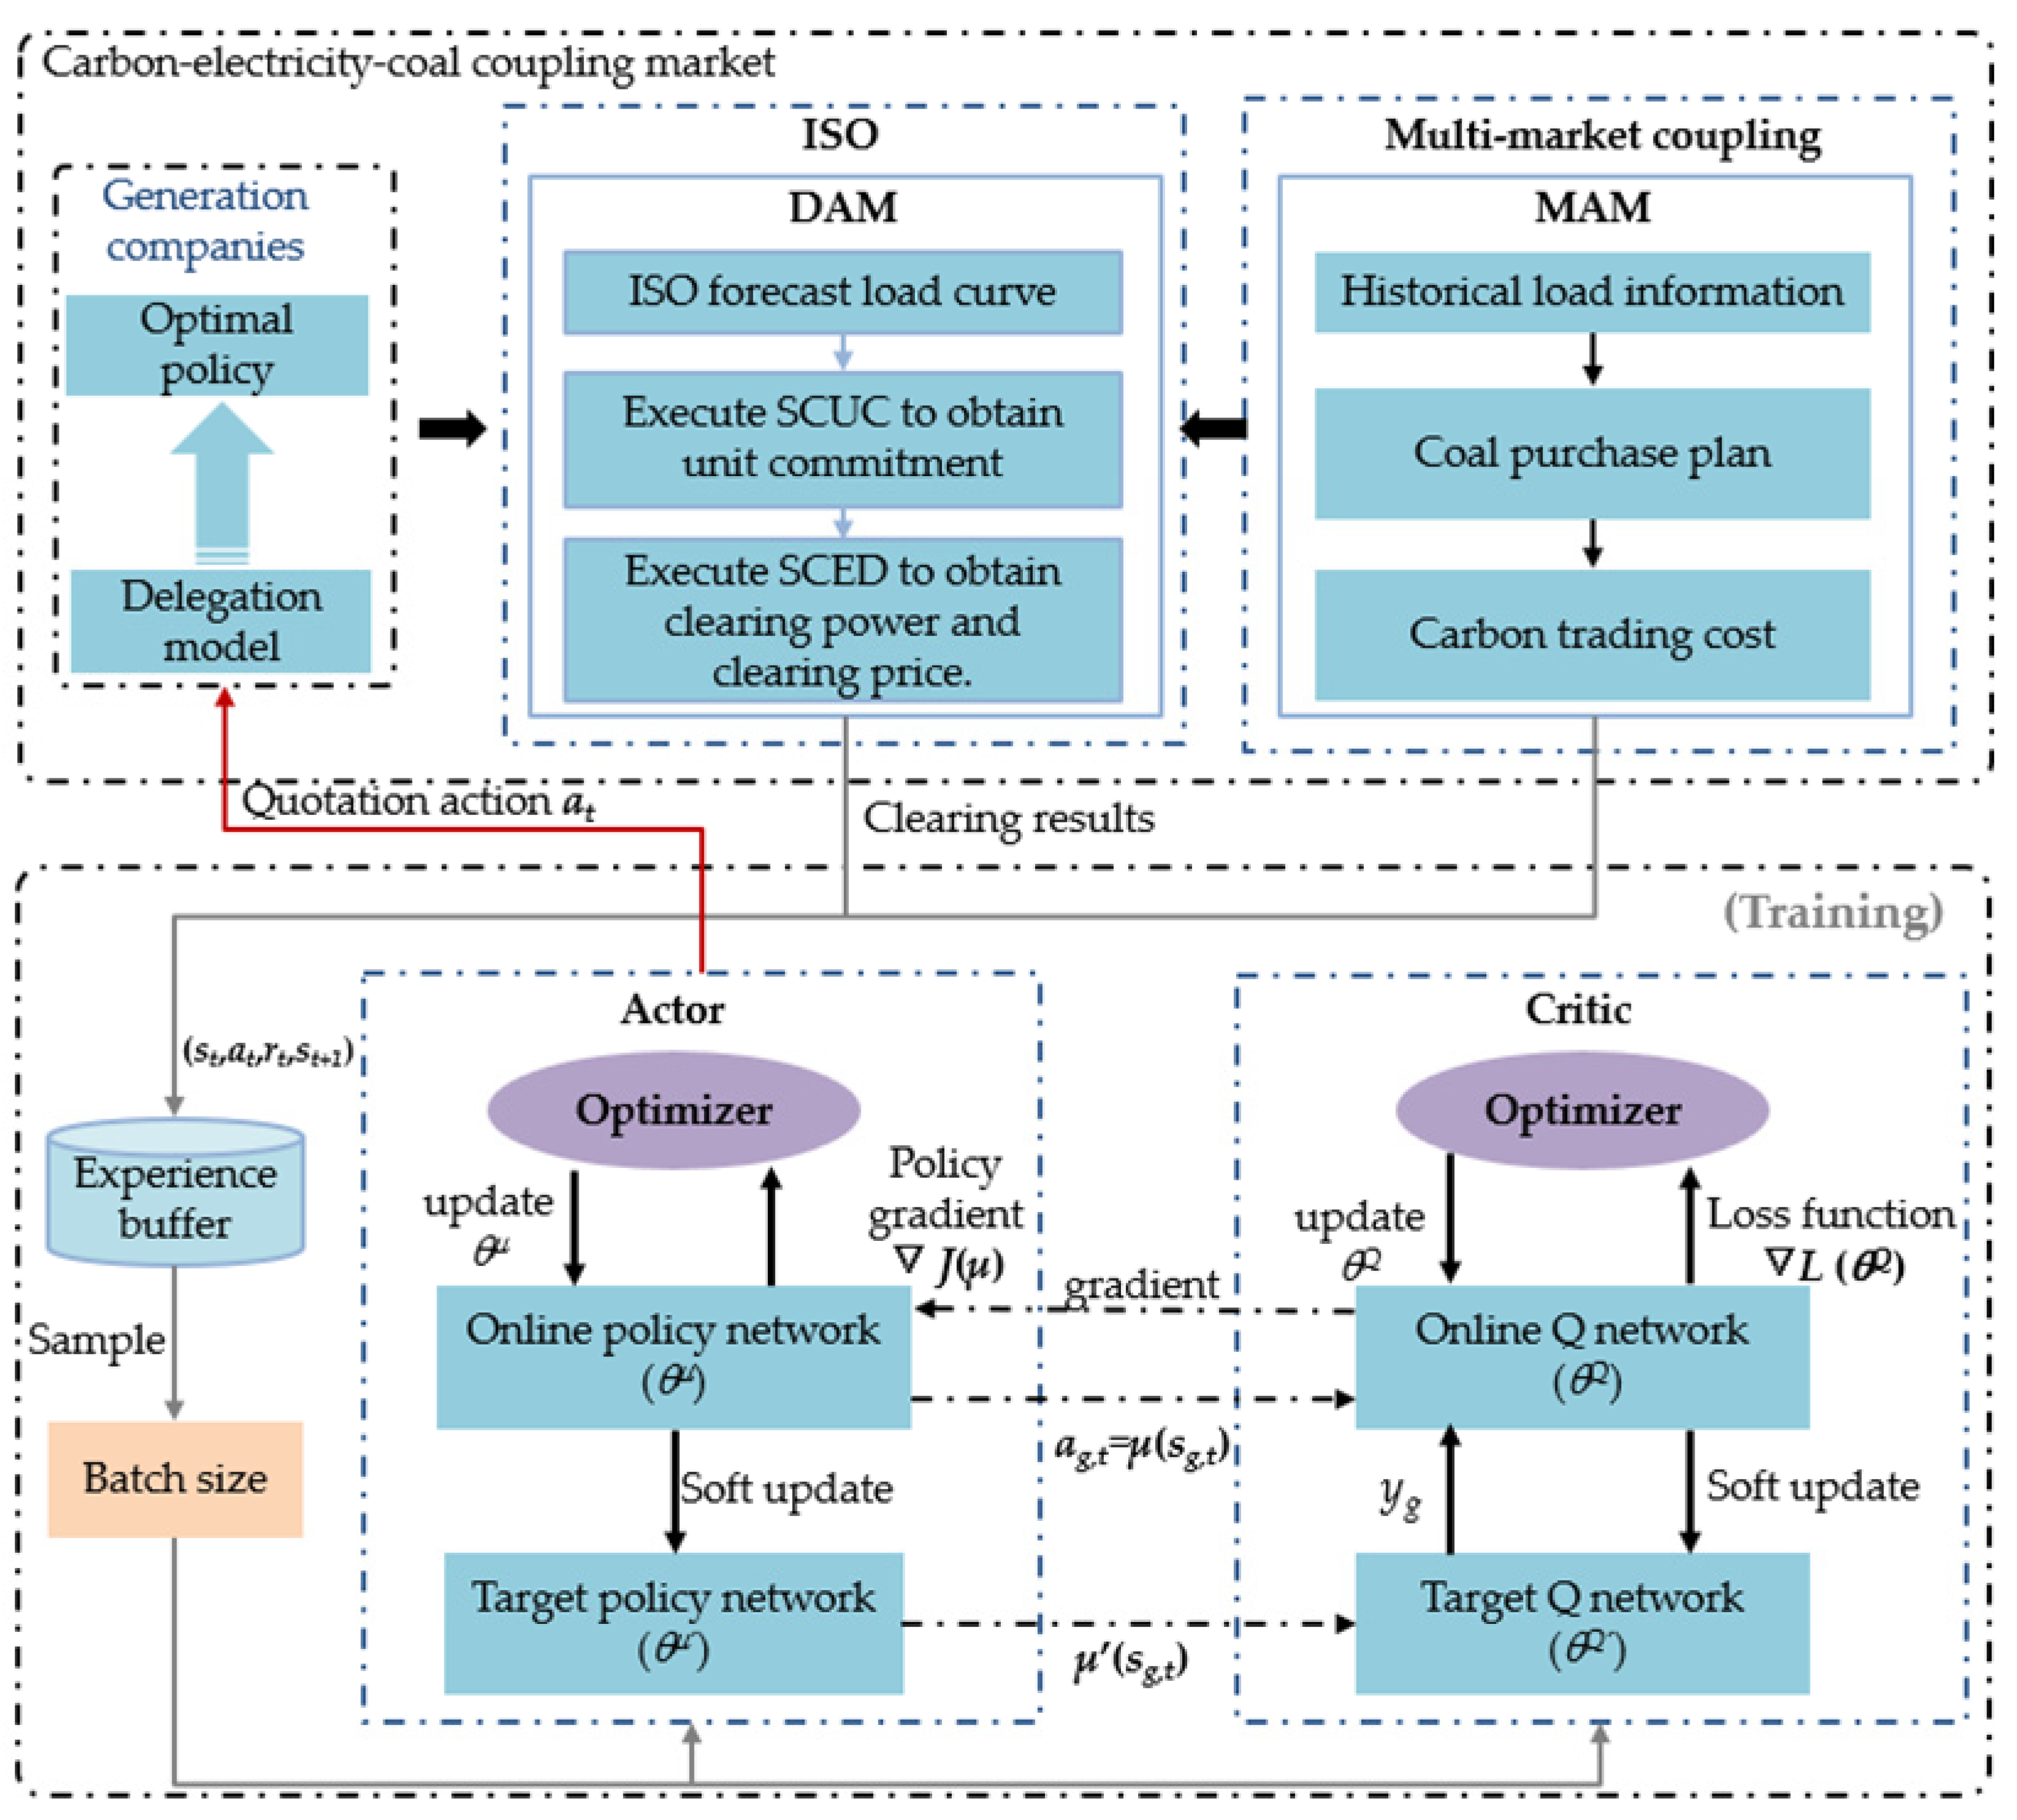
3. Bidding Decision Optimization Model of Power Suppliers in Carbon–Electricity–Coal Coupling Market
3.1. Bidding Decision Optimization Model of Power Suppliers
3.2. Day-Ahead Electricity Spot Market Clearing Model
4. Multi-Generator Bidding Strategy Based on MADDPG Algorithm
4.1. Bidding Strategy Design of Multi-Generator Market
4.2. Multi-Agent Deep Deterministic Gradient Strategy Algorithm
4.3. Multi-Generator Bidding Strategy Based on MADDPG
- (1)
- The parameters of the main value function network, the target value function network, the main policy function network, and the target strategy function network are initialized as θQ, θQ′, θμ, and θμ′, respectively. The number of iterations is set to M, and the time step is set to T;
- (2)
- Initialize the number of training iterations k = 0, and set the experience pool overflow flag;
- (3)
- The initial state of the random agent and the time interval of the initial iteration rounds is t = 0;
- (4)
- According to the current state st, the action of each agent is output through the main network of the policy function at= (a1,t, a2,t,…,aN,t). ISO calculates the clearing price and clearing power of each agent based on the market clearing program. Each agent calculates its own instant reward value according to Equation (6). Then, update the status value of the agent in the next period st+1 = (s1,t+1, s2,t+1,…, sN,t+1);
- (5)
- Store experiences (st, at, rt, st+1) in the experience pool and number them.
- (6)
- Check whether the current experience number is greater than the experience pool overflow flag. If the experience pool overflow flag is greater than the experience pool overflow flag, select Batch size samples at random to execute the training function. Otherwise, directly perform step 8;
- (7)
- Update the main network parameters of the policy function and the main network parameters of the value function according to Equation (19). After the update, the target network parameters of the policy function and the target network parameters of the value function are soft-updated according to Equation (20);
- (8)
- Let t = t + 1, and determine whether the number of iterations exceeds step T; if so, go to the next step; otherwise, go to step 4;
- (9)
- Let k = k + 1, and judge whether the number of iterations exceeds the total number of iterations. If so, end the iteration process and output the final clearing price and clearing power of each agent and save the parameters of the policy function model; otherwise, turn to step 3.
5. Results and Discussion
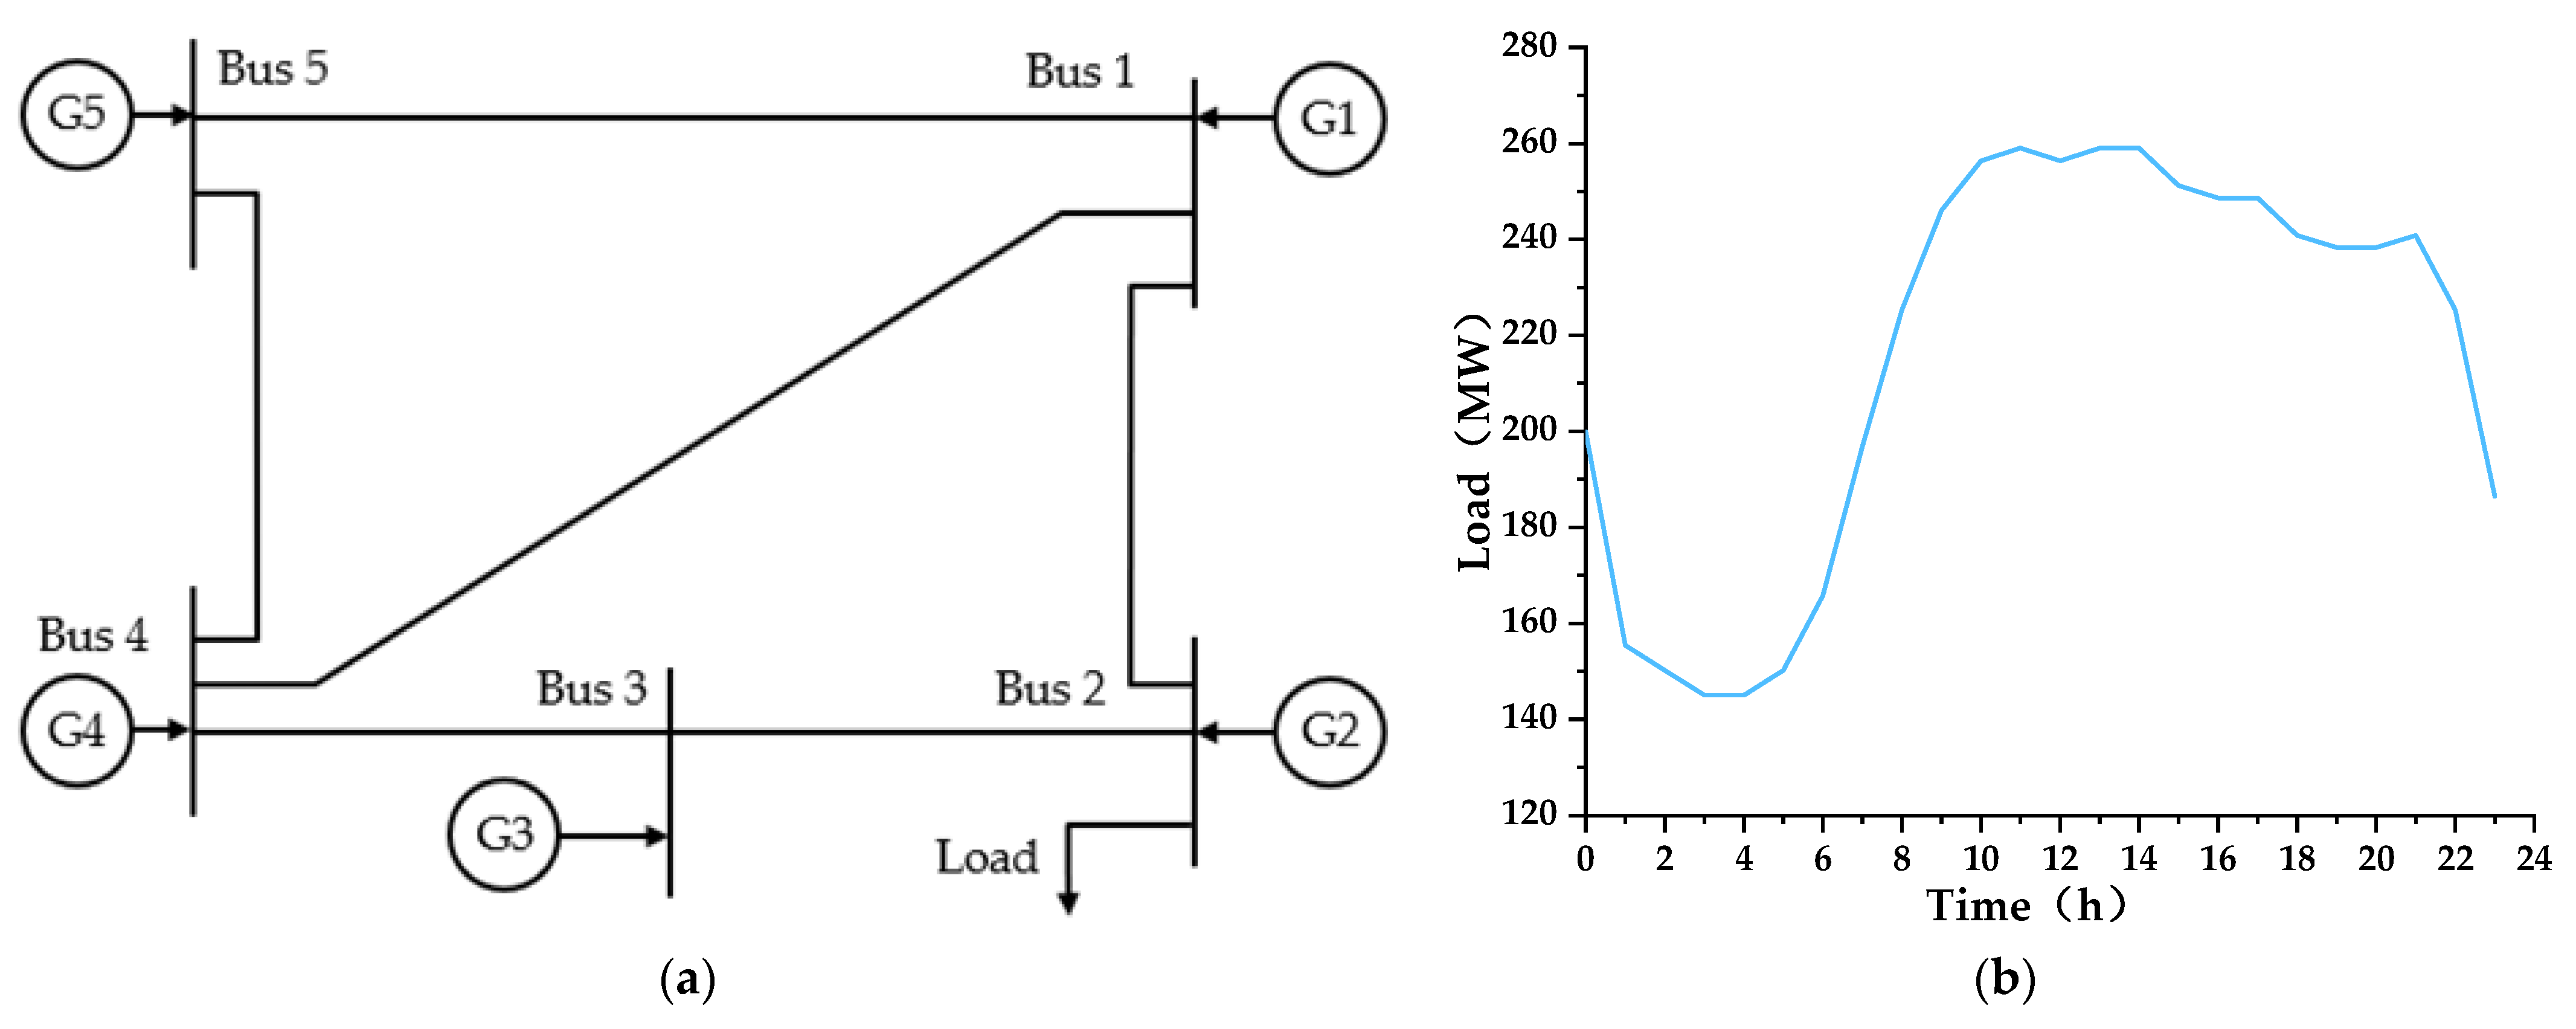
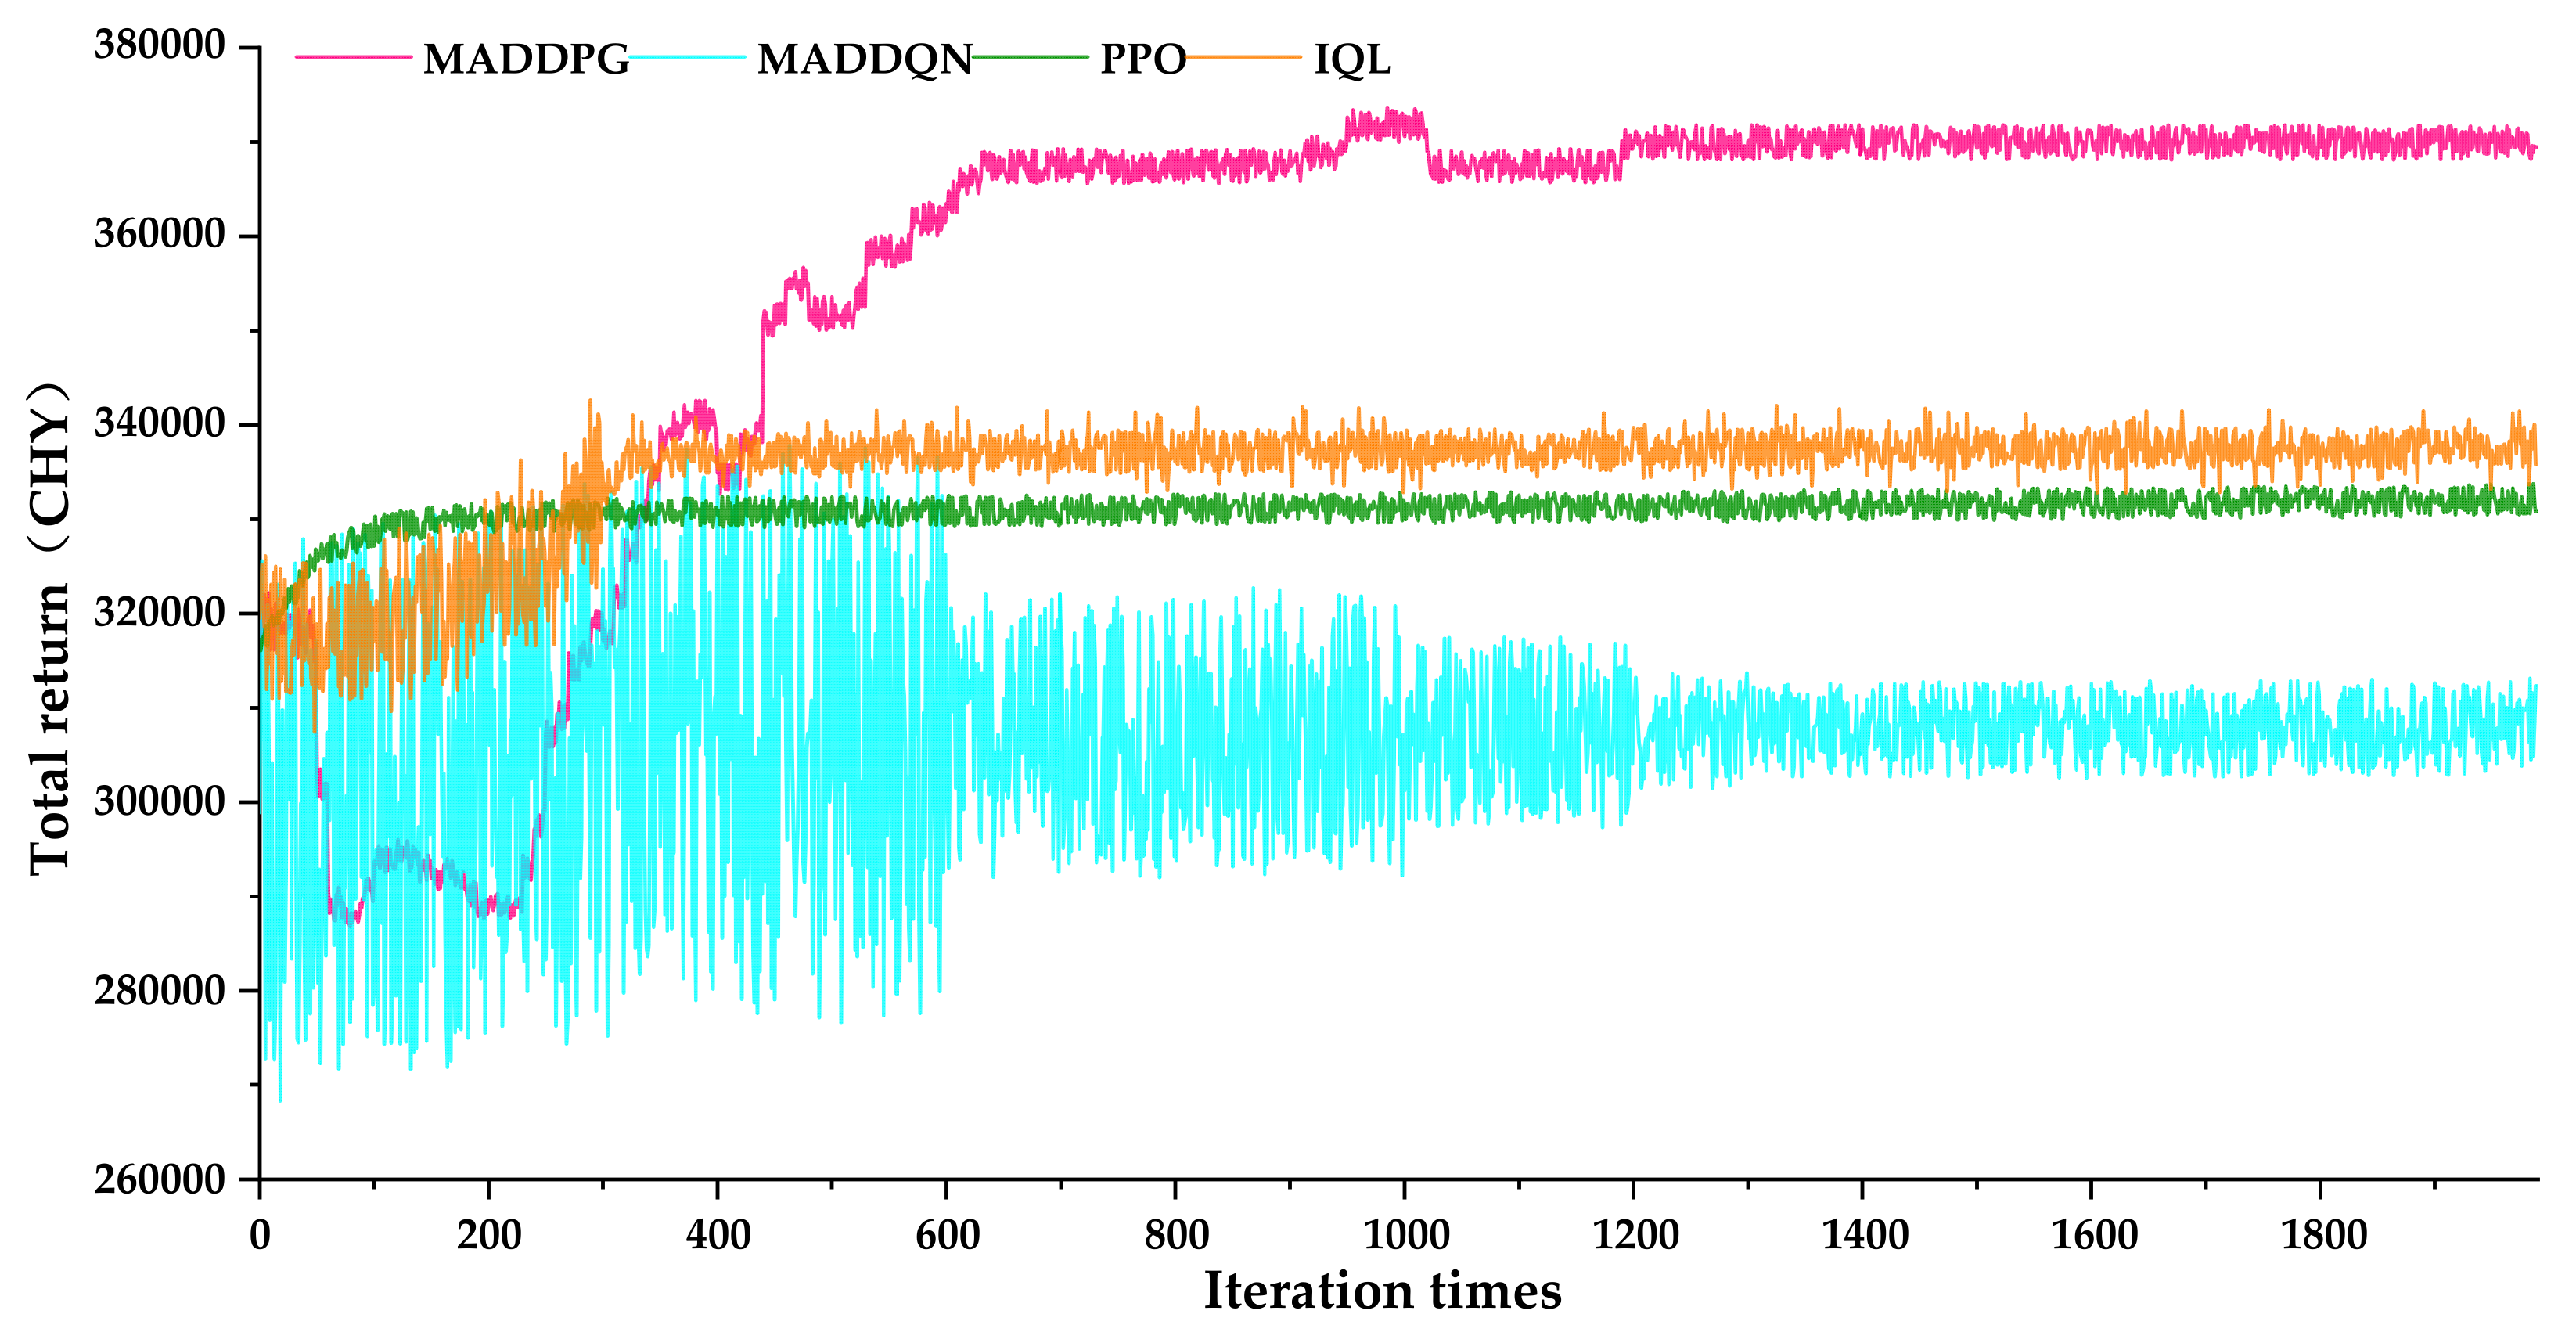
5.1. Feasibility and Effectiveness Analysis of MADDPG-Based Generator Equilibrium Game
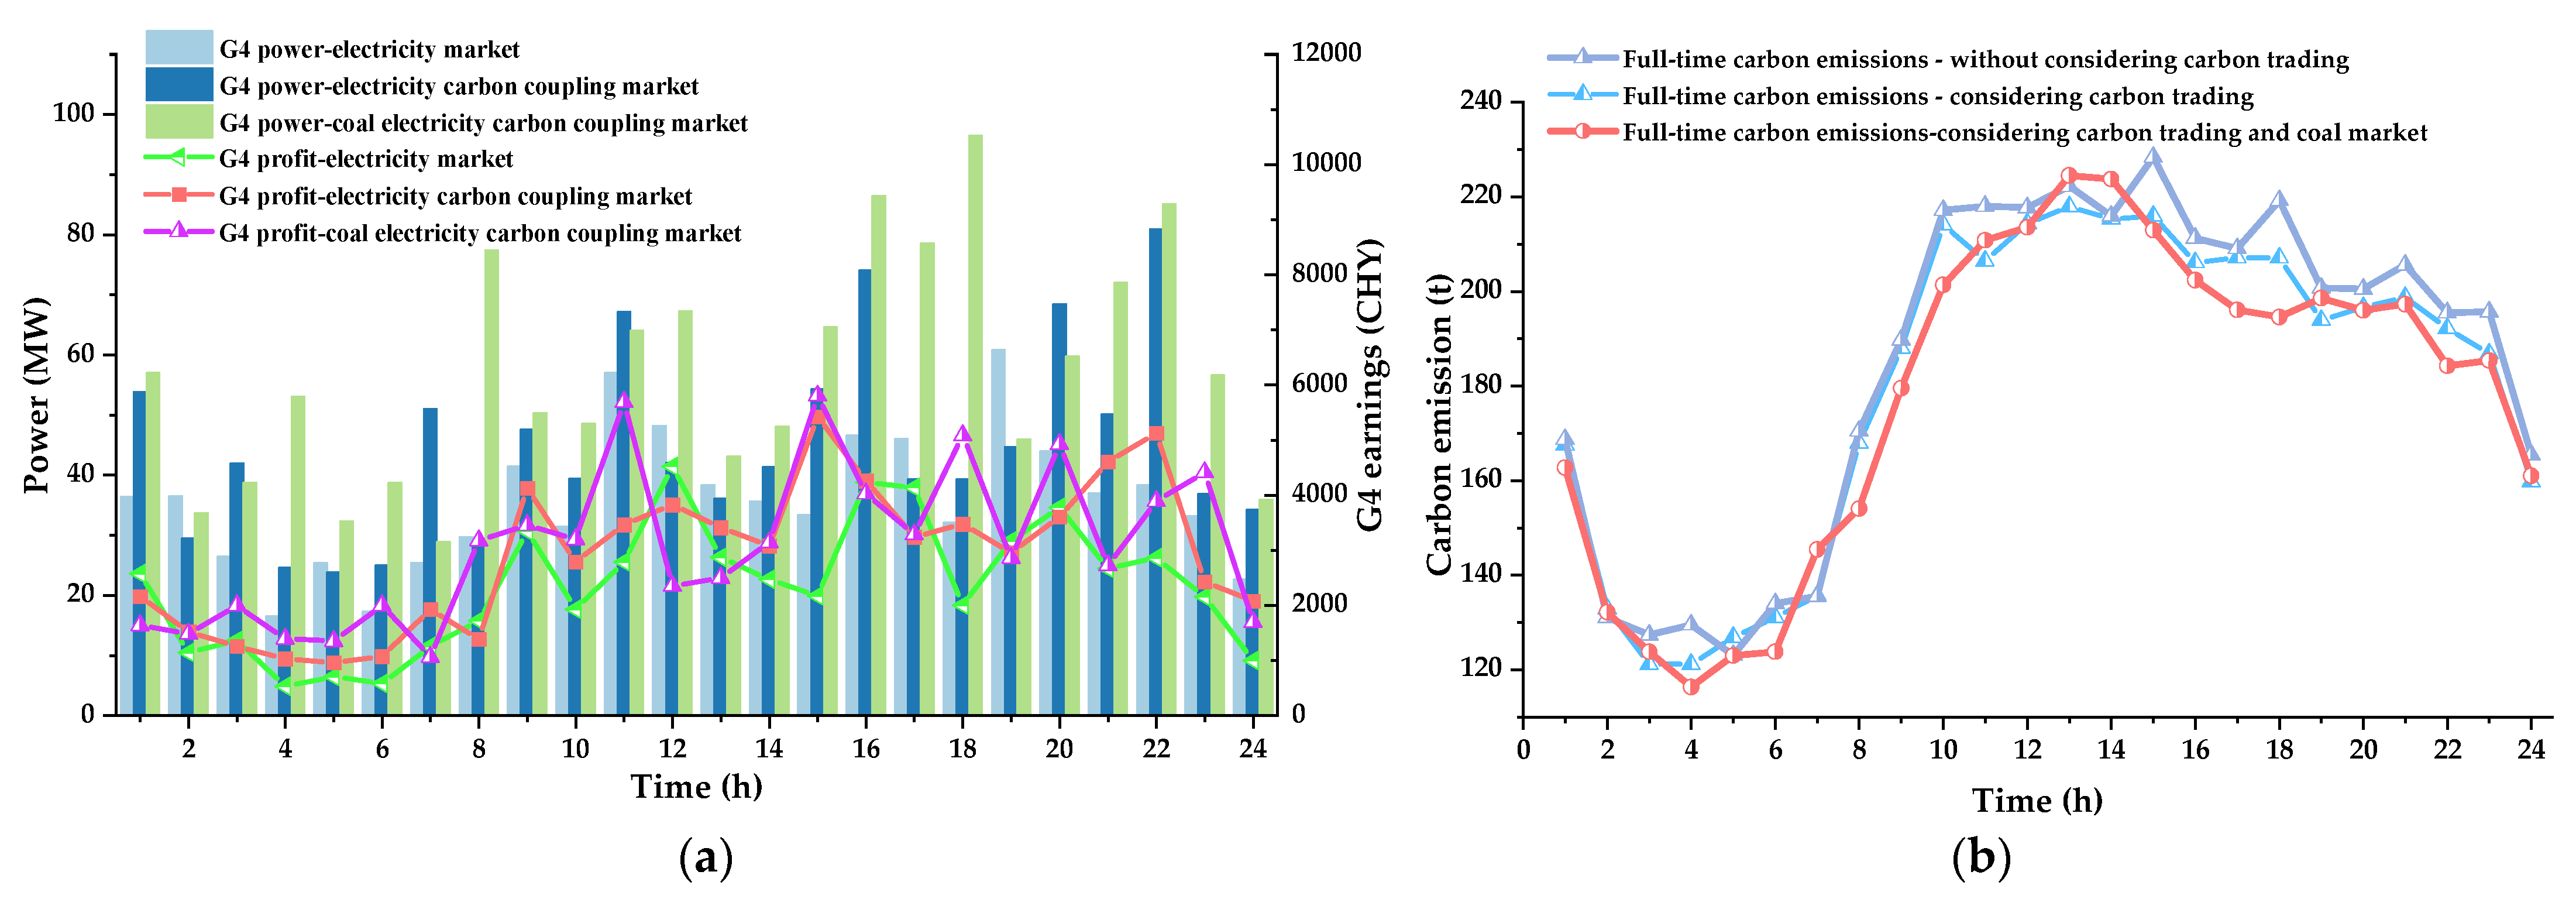
5.2. Bidding Decision of Power Suppliers Considering Carbon–Electricity–Coal Coupling Market
6. Conclusions
- (1)
- The results show that the proposed MADDPG algorithm-based multi-generator bidding strategy can effectively simulate the dynamic process of the bidding decision making of multi-generators. The performance of the MADDPG algorithm was compared with MADDQN, PPO, and IQL algorithms. The results show that the convergence performance of the MADDPG algorithm is better, and the optimized decision benefit is higher than that of other algorithms;
- (2)
- The coupling environment of the carbon–electricity–coal market has a significant impact on the bidding strategy of power suppliers. The carbon trading market reshapes the cost structure of power generation through cost internalization, which reduces the total carbon emissions while reducing the overall profit margin of the power generation side. Low-emission units rely on carbon quota income to form a competitive advantage, and high-emission units are subject to cost constraints. To reduce the share of output, the bidding process considers the coal market to update the power generation cost in real time, which can enhance the market competitiveness of power suppliers, enable power suppliers to obtain additional market advantages, and improve the clear power and profit income. The bidding decision optimization model of power suppliers in the carbon–electricity–coal coupling market as proposed in this paper will encourage power suppliers to upgrade and promote the energy conservation and emission reduction of generating units.
Author Contributions
Funding
Data Availability Statement
Acknowledgments
Conflicts of Interest
Appendix A

| Unit Number | a (CNY/MWh2) | b (CNY/MWh) | (MW) | (MW) | Ramp Rate (MW/min) | kT |
|---|---|---|---|---|---|---|
| G1 | 0.36 | 360 | 10 | 120 | 50 | - |
| G2 | 0.42 | 360 | 10 | 130 | 50 | - |
| G3 | 0.33 | 345 | 10 | 150 | 50 | - |
| G4 | 0.39 | 360 | 10 | 110 | 50 | 1.5 |
| G5 | 0.48 | 330 | 10 | 150 | 50 | - |
| Unit Number | pCO2 (CNY/t) | δG (t/MWh) | δT (t/MWh) |
|---|---|---|---|
| G1 | 120 | 0.975 | 0.575 |
| G2 | 120 | 0.6 | 0.575 |
| G3 | 120 | 0.975 | 0.575 |
| G4 | 120 | 0.6 | 0.575 |
| G5 | 120 | 0.975 | 0.575 |
| Parameters of MADDPG | Critic Network | Actor Network |
|---|---|---|
| Number of neural network layers | 3 | 3 |
| Batch size | 50 | 50 |
| Hidden layer activation function | Relu | Relu |
| Output layer activation function | Relu | Sigmoid |
| Buffer size | 50,000 | 50,000 |
| Discount factor | 0.95 | 0.95 |
| Learning rate | 1 × 10⁻³ | 1 × 10⁻⁴ |
| Number of rounds | 2000 | 2000 |
| Soft update rate | 0.01 | 0.01 |
| Number of agents | 5 | 5 |
References
- Xie, K.; Liu, D.; Li, Z.; Sun, T.; Pang, B.; Liu, S.; Zhang, X. Multi-dimensional Collaborative Electricity Market System for New Power System. Autom. Electr. Power Syst. 2024, 48, 2–12. [Google Scholar]
- Shang, J.; Jiang, X.; Xiao, D.; Li, Z.; Yin, S.; Gao, J. Marginal Cost Comparison Bidding Mode with Deep Fusion of Marginal Pricing and Economic Dispatching. Autom. Electr. Power Syst. 2024, 48, 185–193. [Google Scholar]
- Peng, C.; Yi, T.; Sun, H.; Chen, S. Power Generator Balanced Bidding Based on Multi-agent Deep Deterministic Strategy. Power Syst. Technol. 2023, 47, 4229–4239. [Google Scholar]
- Zhao, E.; Wang, H.; Lin, H. Ladder Bidding Strategy of Thermal Power Enterprises According to Evolutionary Game in Spot Market. Electr. Power Constr. 2020, 41, 68–77. [Google Scholar]
- Zheng, L.; Zhou, B.; Chung, C.; Li, J.; Cao, Y.; Zhao, Y. Coordinated Operation of Multi-energy Systems With Uncertainty Couplings in Electricity and Carbon Markets. IEEE Internet Things J. 2024, 11, 24414–24427. [Google Scholar] [CrossRef]
- Wang, Y.; Qiu, J.; Tao, Y.; Zhao, J. Carbon-oriented operational planning in coupled electricity and emission trading markets. IEEE Trans. Power Syst. 2020, 35, 3145–3157. [Google Scholar] [CrossRef]
- Liao, Z.; Zheng, G.; Xie, X.; Wang, B.; Zhang, W. Two-stage Decision Model for coal-fired Power Plant Based on Upstream and Downstream Market Linkage. Proc. CSEE 2024, 44, 3036–3046. [Google Scholar]
- Feng, H.; Yang, Z.; Zheng, Y.; Ye, F.; Zhang, X.; Shi, X. Intelligent Agent Based Bidding Simulation Method for Multi-input Decision Factors of Power Suppliers. Autom. Electr. Power Syst. 2018, 42, 72–77. [Google Scholar] [CrossRef]
- Wu, J.; Li, C.; Guan, X.; Gao, F. Unit Constraints Considered Genco’s Bidding Strategies in Hour-ahead Electricity Market. Proc. CSEE 2008, 16, 72–78. [Google Scholar]
- Wang, J.; Wu, J.; Kong, X. Multi-agent simulation for strategic bidding in electricity markets using reinforcement learning. CSEE J. Power Energy Syst. 2021, 9, 1051–1065. [Google Scholar]
- Gong, K.; Wang, X.; Deng, H.; Jiang, C.; Ma, J.; Fang, L. Deep Reinforcement Learning Based Optimal Energy Storage System Operation of Photovoltaic Power Stations With Energy Storage in Power Market. Power Syst. Technol. 2022, 46, 3365–3377. [Google Scholar]
- Ye, Y.; Qiu, D.; Sun, M.; Papadaskalopoulos, D.; Strbac, G. Deep reinforcement learning for strategic bidding in electricity markets. IEEE Trans. Smart Grid 2019, 11, 1343–1355. [Google Scholar] [CrossRef]
- Gao, Y.; Li, Y.; Cao, R. Simulation of Generators’ Bidding Behavior Based on Multi-agent Double DQN. Power Syst. Technol. 2020, 44, 4175–4183. [Google Scholar]
- Liu, D.; Gao, Y.; Wang, W.; Dong, Z. Research on bidding strategy of thermal power companies in electricity market based on multi-agent deep deterministic policy gradient. IEEE Access 2021, 9, 81750–81764. [Google Scholar] [CrossRef]
- Xu, D.; Hu, X.; Hu, F.; Cha, Y.; Zhang, C.; Yu, Y.; Zhao, Y. Strategic Bidding of Price-quantity Pairs in Electricity Market Based on Deep Reinforcement Learning. Power Syst. Technol. 2024, 48, 3278–3286. [Google Scholar]
- Ren, K.; Liu, J.; Liu, X.; Nie, Y. Reinforcement Learning-Based Bi-Level strategic bidding model of Gas-fired unit in integrated electricity and natural gas markets preventing market manipulation. Appl. Energy 2023, 336, 120813. [Google Scholar] [CrossRef]
- Liang, Y.; Guo, C.; Ding, Z.; Hua, H. Agent-based modeling in electricity market using deep deterministic policy gradient algorithm. IEEE Trans. Power Syst. 2020, 35, 4180–4192. [Google Scholar] [CrossRef]
- Wang, B.; Li, C.; Ban, Y.; Zhao, Z.; Wang, Z. A two-tier bidding model considering a multi-stage offer carbon joint incentive clearing mechanism for coupled electricity and carbon markets. Appl. Energy 2024, 368, 123497. [Google Scholar] [CrossRef]
- Jiang, W.; Wu, J.; Feng, W.; Duan, X.; Tang, H.; Wu, L. Bilateral Game Model of Power Supply and Demand Sides with Incomplete Information in Day-ahead Electricity Market. Autom. Electr. Power Syst. 2019, 43, 18–24+75. [Google Scholar]
- Lu, Z.; Shang, N.; Zhang, Y.; Chen, Z.; Yang, X.; Li, P. Nash-Stackelberg Game Model for Power Generation Enterprises Participating in Capacity Market. Autom. Electr. Power Syst. 2023, 47, 94–102. [Google Scholar]
- Yang, Y.; Ji, T.; Jing, Z. Selective learning for strategic bidding in uniform pricing electricity spot market. CSEE J. Power Energy Syst. 2021, 7, 1334–1344. [Google Scholar]
- PJM Interconnection. Markets Database Dictionary. Available online: https://pjm.com (accessed on 5 October 2024).
- Yuan, J.; Yang, M.; Liu, N.; Zhang, C.; Huang, S. Bidding Strategy of Generation Companies Based on Multi-agent Deep Deterministic Policy Gradient Algorithm Under Incomplete Information. Power Syst. Technol. 2022, 46, 4832–4844. [Google Scholar]
- Rashedi, N.; Mohammad, A.T.; Hamed, K. Markov game approach for multi-agent competitive bidding strategies in electricity market. IET Gener. Transm. Distrib. 2016, 10, 3756–3763. [Google Scholar] [CrossRef]


| Generation Revenue | Carbon Emissions | Carbon Trading Cost | Power-Production Cost | Gross Income | |
|---|---|---|---|---|---|
| Power market | 2,379,427.51 | 4431.80 | 0 | 2,009,452.54 | 369,975.63 |
| Electricity–carbon market | 2,500,657.82 | 4334.51 | 162,147.91 | 2,013,965.78 | 324,544.24 |
| Carbon–electricity–coal coupling market | 2,503,293.88 | 4263.37 | 153,611.72 | 2,018,970.71 | 330,711.45 |
Disclaimer/Publisher’s Note: The statements, opinions and data contained in all publications are solely those of the individual author(s) and contributor(s) and not of MDPI and/or the editor(s). MDPI and/or the editor(s) disclaim responsibility for any injury to people or property resulting from any ideas, methods, instructions or products referred to in the content. |
© 2025 by the authors. Licensee MDPI, Basel, Switzerland. This article is an open access article distributed under the terms and conditions of the Creative Commons Attribution (CC BY) license (https://creativecommons.org/licenses/by/4.0/).
Share and Cite
Liao, Z.; Li, C.; Zhang, X.; Hu, Q.; Wang, B. A Bidding Strategy for Power Suppliers Based on Multi-Agent Reinforcement Learning in Carbon–Electricity–Coal Coupling Market. Energies 2025, 18, 2388. https://doi.org/10.3390/en18092388
Liao Z, Li C, Zhang X, Hu Q, Wang B. A Bidding Strategy for Power Suppliers Based on Multi-Agent Reinforcement Learning in Carbon–Electricity–Coal Coupling Market. Energies. 2025; 18(9):2388. https://doi.org/10.3390/en18092388
Chicago/Turabian StyleLiao, Zhiwei, Chengjin Li, Xiang Zhang, Qiyun Hu, and Bowen Wang. 2025. "A Bidding Strategy for Power Suppliers Based on Multi-Agent Reinforcement Learning in Carbon–Electricity–Coal Coupling Market" Energies 18, no. 9: 2388. https://doi.org/10.3390/en18092388
APA StyleLiao, Z., Li, C., Zhang, X., Hu, Q., & Wang, B. (2025). A Bidding Strategy for Power Suppliers Based on Multi-Agent Reinforcement Learning in Carbon–Electricity–Coal Coupling Market. Energies, 18(9), 2388. https://doi.org/10.3390/en18092388