1. Introduction
Geologic carbon storage is an important component of carbon capture and storage (CCS) to reduce greenhouse gas emissions from carbon-intensive industries, power generation, hydrogen infrastructure, refineries, natural-gas processing, and other energy industries. CCS has advanced from pilot-scale to large-scale demonstrations and operational projects throughout the world as a proven, safe, effective, and economic technology [
1,
2,
3,
4,
5,
6]. Consequently, many industries are pursuing decarbonization technologies and “net zero” goals [
7,
8]. This article focuses on carbon-storage design strategies for the Appalachian Basin of the U.S., which has been a particular region of interest for deploying CCS.
The Appalachian Basin has a dense concentration of more than 200 large industrial CO
2 point sources with total CO
2 emissions of more than 200 million metric tons of CO
2 per year. However, this basin is known for its complex geology, which presents challenges and opportunities for decarbonizing industries and storing carbon in the subsurface. Several assessments have evaluated regional geological CO
2 storage resources in the Appalachian Basin, outlining many rock formations with large CO
2 storage resources [
9,
10,
11,
12,
13]. In addition, there have been several CO
2 storage field demonstrations [
14,
15,
16] and site-specific feasibility studies in the basin [
11,
12]. However, some researchers have questioned the feasibility of CO
2 storage in the Appalachian Basin due to a combination of geotechnical and economic factors [
17,
18].
The Appalachian Basin has a unique geologic setting for carbon storage that relies heavily on secondary porosity and permeability from its complex orogenic history. The work from regional research projects, field tests, and front-end engineering and design assessments offers an opportunity to understand the data needs, operational learnings, and numerical performance predictions of carbon storage in the Appalachian Basin. This study can serve as an analog for deploying CCS in basins with similar challenges and opportunities present in the Appalachian Basin. This study does not consider enhanced oil recovery or other “unconventional” (carbon storage in organic shales or un-mineable coals) plays, as the technology and storage resource estimates of carbon storage in conventional reservoirs are further along than unconventional plays and are more realistic to focus on for near-term decarbonization. In addition, there have been no large-scale CO2 injection operations in the Appalachian Basin to confirm injection performance. However, the three case studies provide insights into CCS deployment strategies that would support energy industry decarbonization in the region. Consequently, this site-specific front-end engineering design better defines the logistics, operational, and financial aspects of CO2 storage in the Appalachian Basin.
2. Geologic Context of the Appalachian Basin
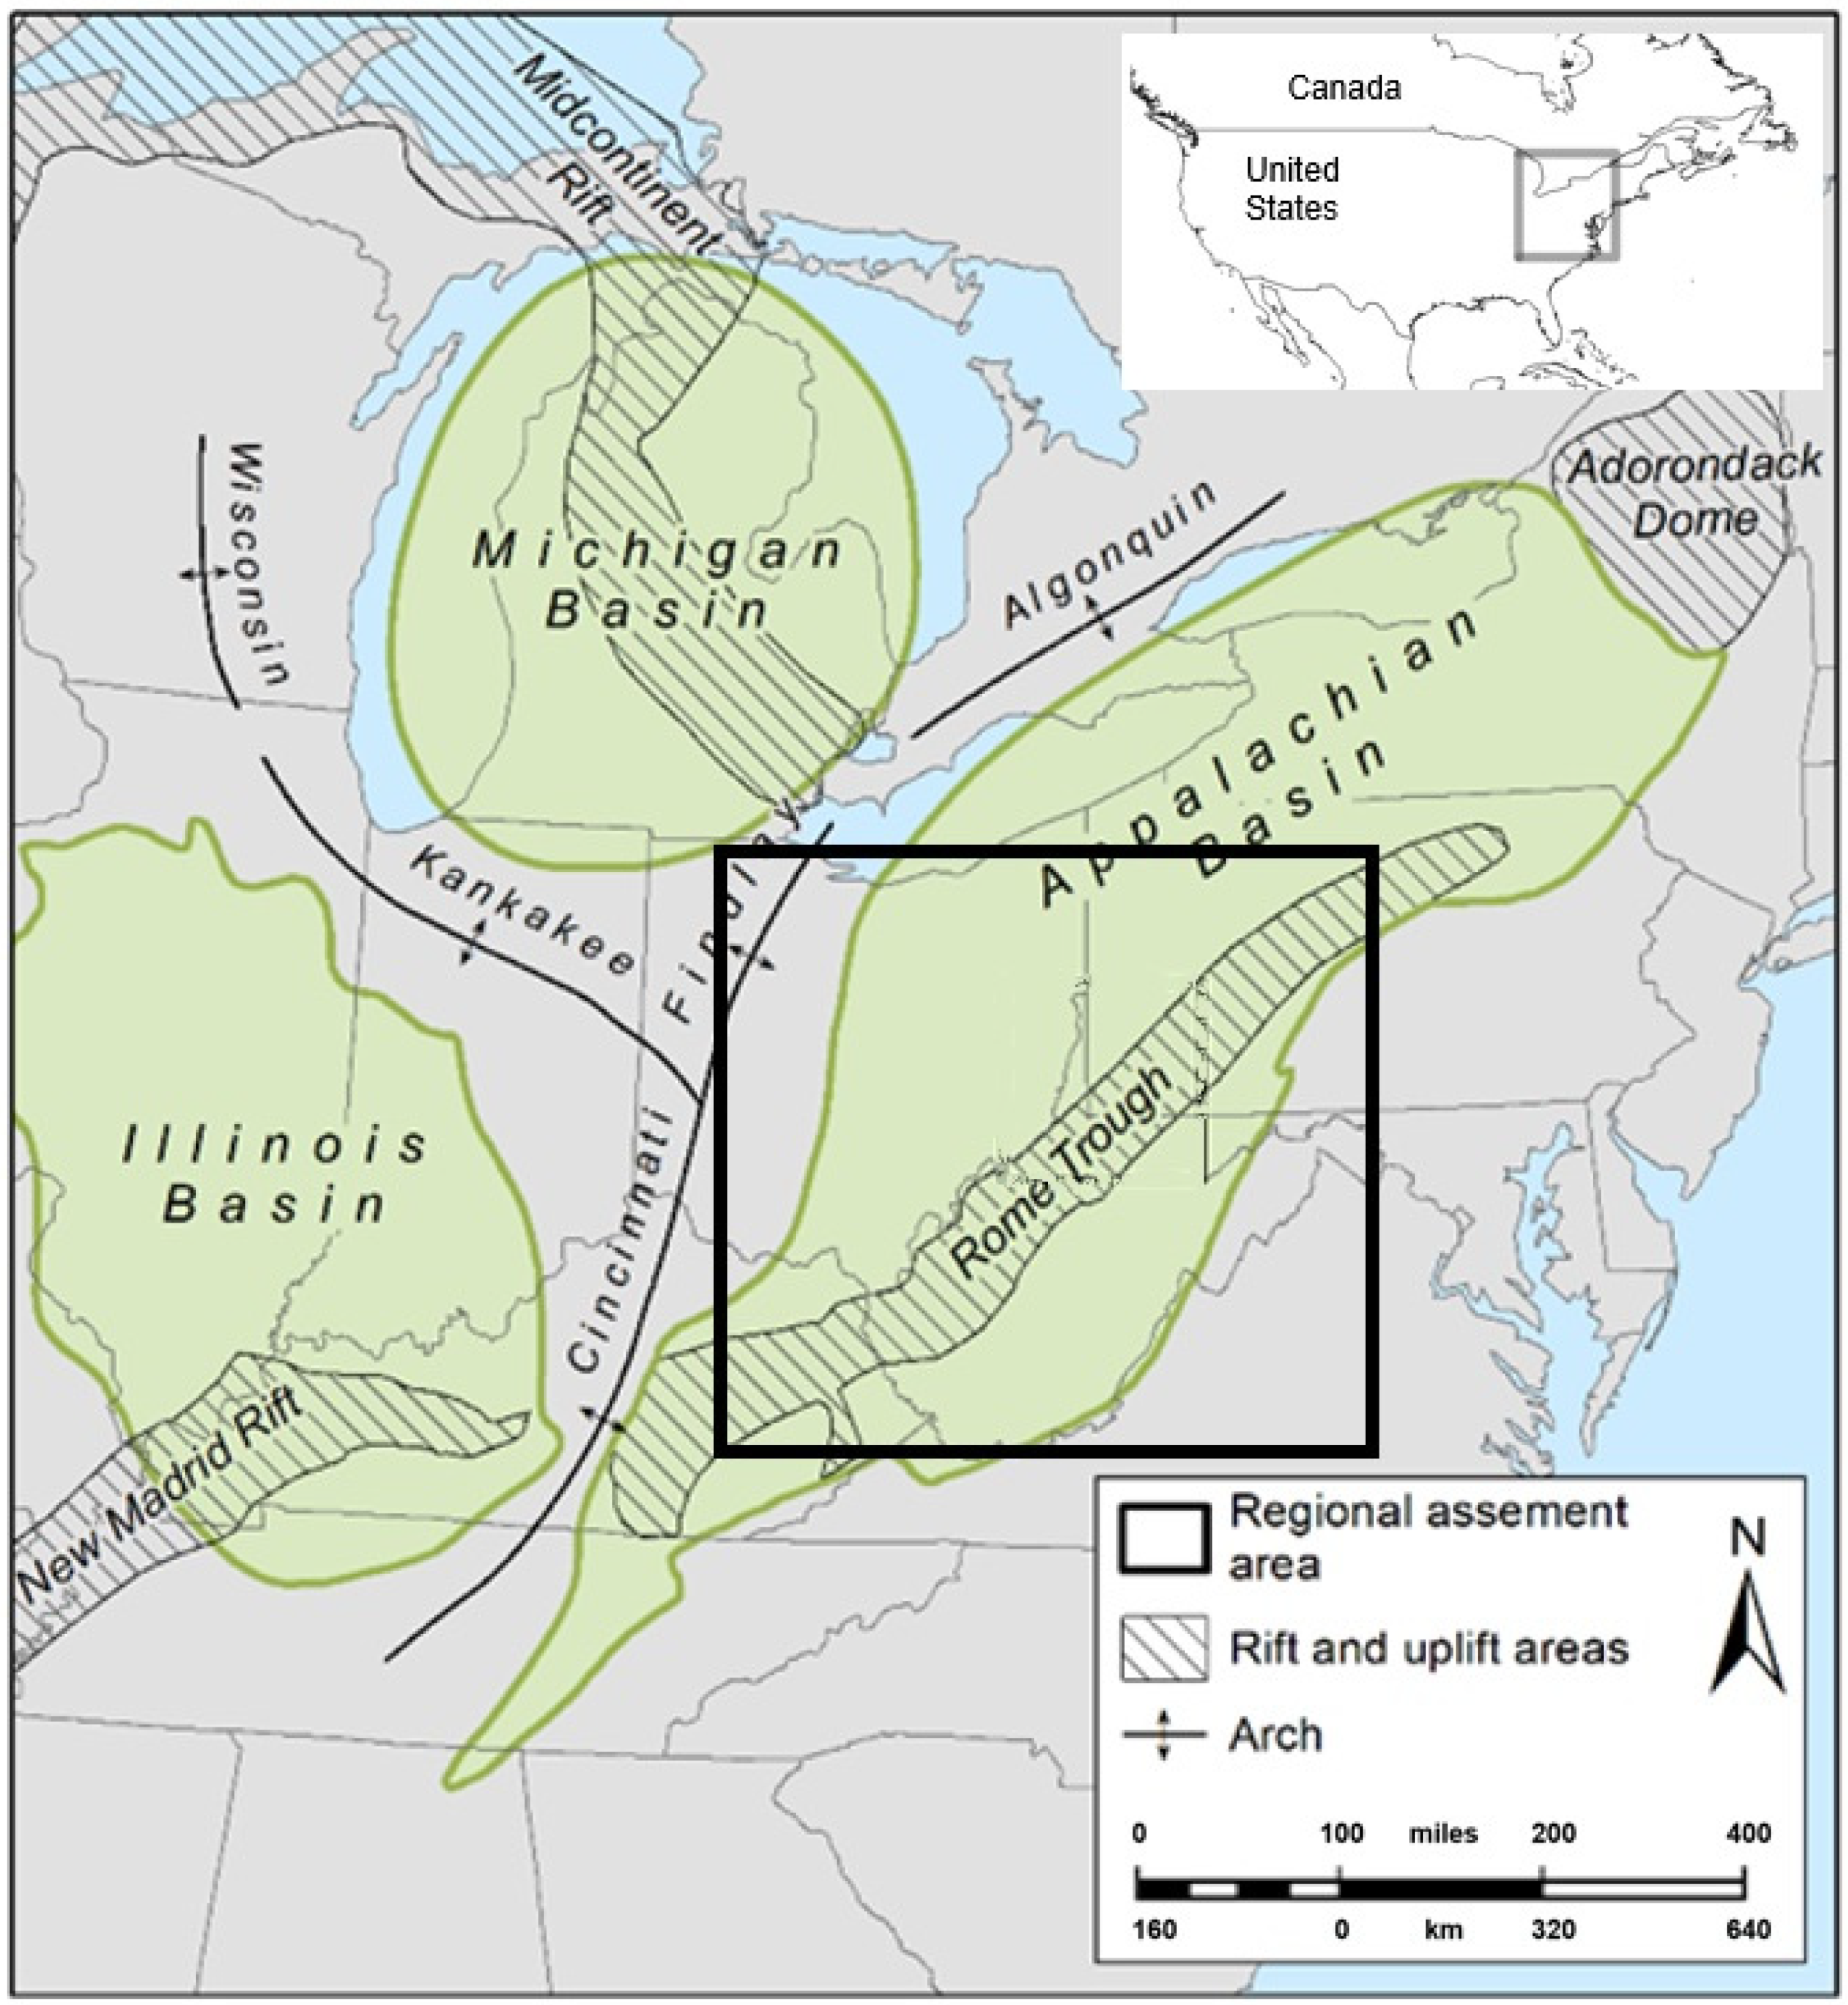
The Appalachian Basin is a geologic structure spanning 150,000 km
2 in the eastern portion of North America. The basin is commonly defined as an elongate foreland sedimentary basin structure extending from northern Alabama to the Canadian Shield in southern Ontario Province, Canada, and lies between the Allegheny front to the east and the Cincinnati-Findlay-Algonquin arches to the west [
19] (
Figure 1). Thick sequences of Paleozoic-age sedimentary rocks are present in the Appalachian Basin, which have been utilized for hydrocarbon production, natural-gas storage fields, and mining.
The Appalachian Basin has undergone multiple orogenic events that have shaped its structural and stratigraphic evolution, including the Taconic (Late Ordovician), Acadian (Middle to Late Devonian), and Alleghenian Orogenies (Late Carboniferous to Permian). These events were the result of the collision of various island-arc and micro-continents against the original Laurentian continent. These orogenies facilitated the fracturing, faulting, and hydrothermal fluid migration, which have played a critical role in the porosity and permeability development of key Appalachian Basin reservoirs, impacting hydrocarbon and CO
2 storage potential [
20,
21,
22].
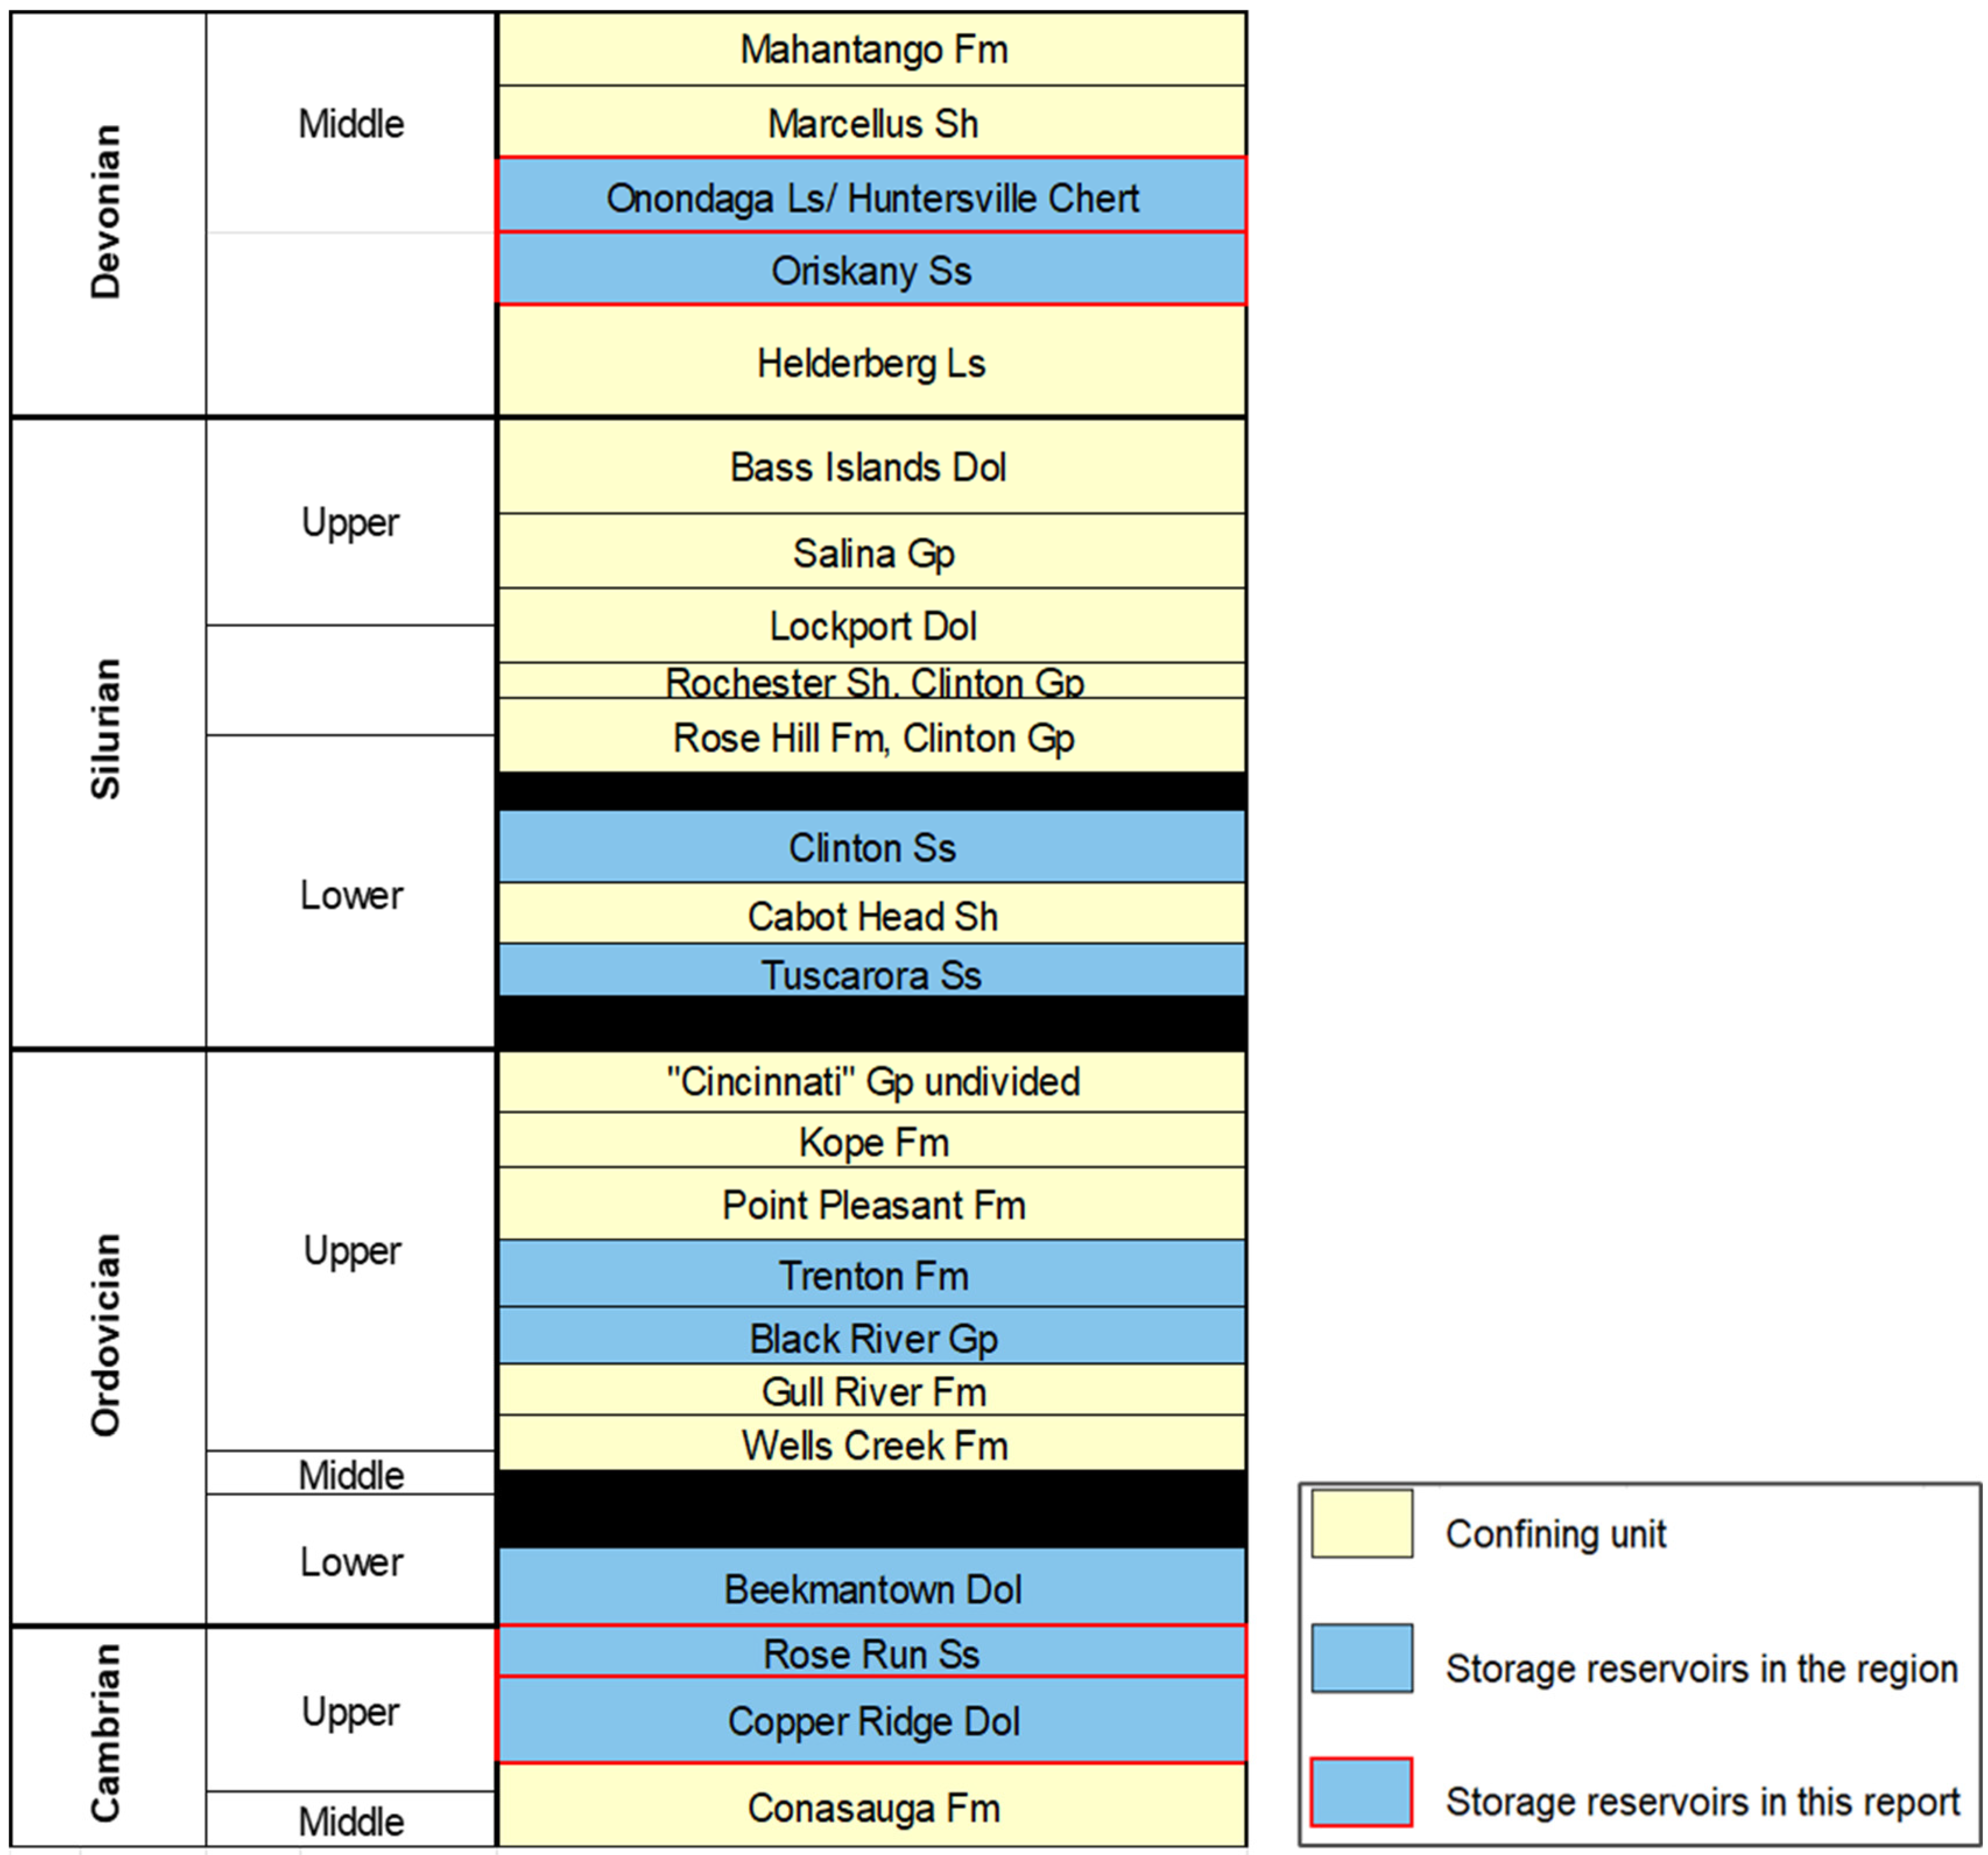
The stratigraphy of the Appalachian Basin is characterized by thick sedimentary succession influenced by the aforementioned orogenic events.
Figure 2 shows a stratigraphic column for the area showing some of the potential storage reservoirs and caprocks, with those discussed herein highlighted.
2.1. Appalachian CO2 Storage Reservoirs
While there are many different potential CO2 storage reservoirs in the Appalachian Basin, this study focuses on three zones: Knox Group Rose Run Sandstone and Copper Ridge Dolomite, Oriskany Sandstone, and Huntersville Chert. These three Appalachian storage CO2 reservoirs and caprocks are summarized as follows.
2.1.1. Knox Group Rose Run Sandstone and Copper Ridge Dolomite
The Rose Run Sandstone of the Appalachian Basin is an Upper Cambrian-age clastic unit included in the Knox Group that is a significant reservoir for hydrocarbons, particularly in Ohio. It consists primarily of well-sorted, fine- to medium-grained quartz sandstone with interbedded shale and carbonate layers [
19]. Depositional environments for the Rose Run Sandstone include shallow marine, tidal, and barrier island settings, leading to lateral and vertical facies variability [
23]. The reservoir properties are heterogeneous, with porosity generally ranging from 5% to 12% and permeability varying from less than 0.1 millidarcies (md) to over 100 md, depending on diagenesis and secondary porosity development [
24,
25]. Fractures related to structuring can locally improve permeability, and diagenetic modifications such as cementation and dissolution influence porosity distribution, particularly in regions affected by faulting and unconformities [
26]. The highly variable nature of Rose Run Sandstone rock properties has tempered earlier expectations about its potential as a carbon-storage reservoir.
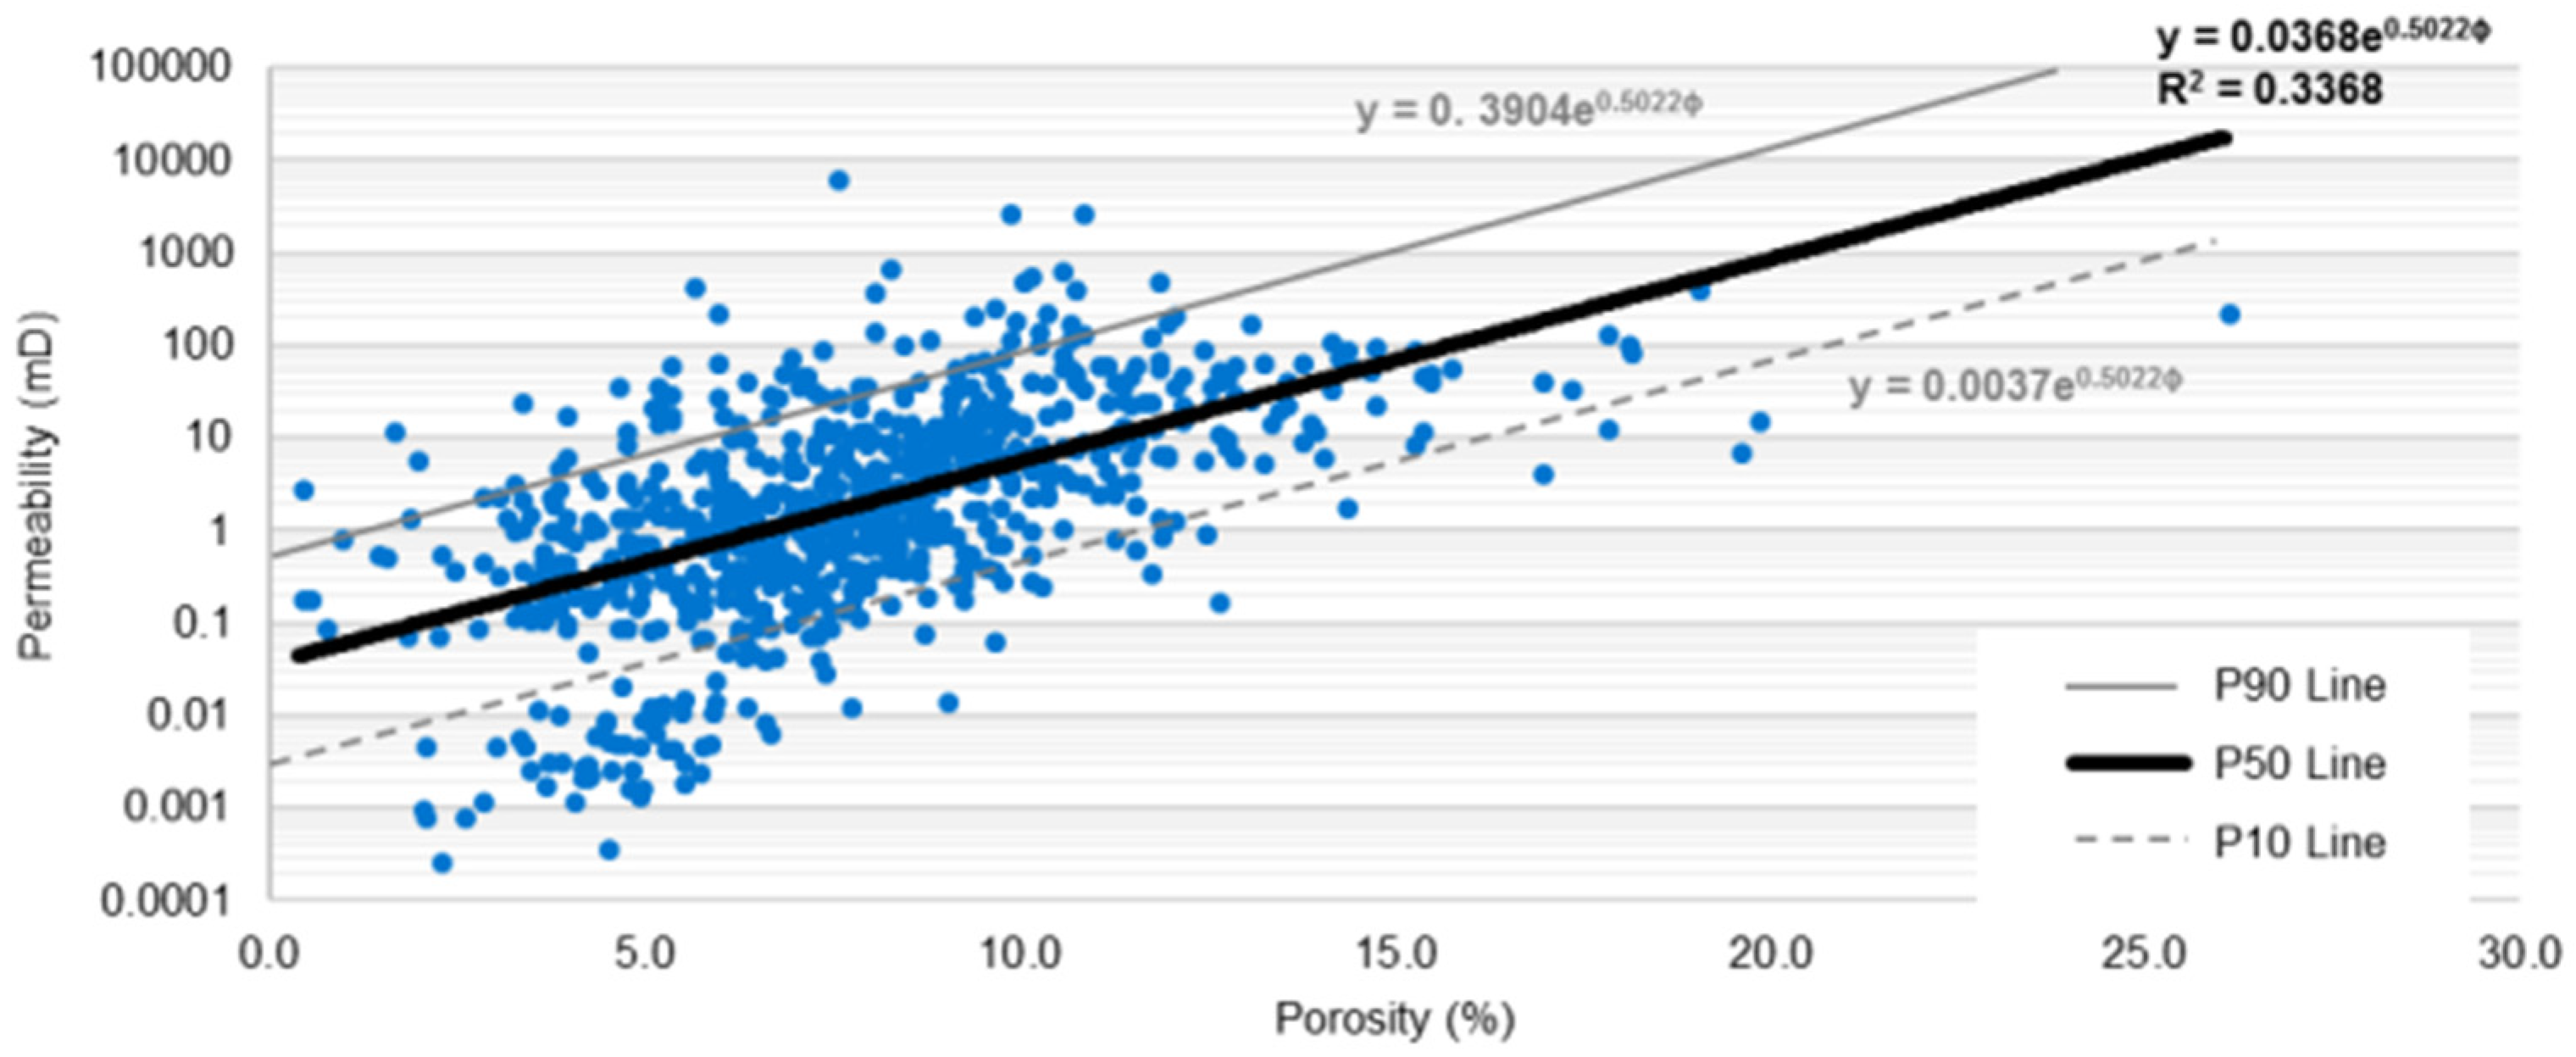
The Upper Cambrian Copper Ridge Dolomites are carbonates deposited in a hypersaline shallow marine setting. These units are characterized by fossiliferous limestones and dolostones, which are sometimes enhanced with secondary porosity through dissolution, creating vug-filled zones that are potentially good storage reservoirs. Porosities typically range from 5 to 11%, with permeabilities from 0.1 to 20 md (
Figure 3) [
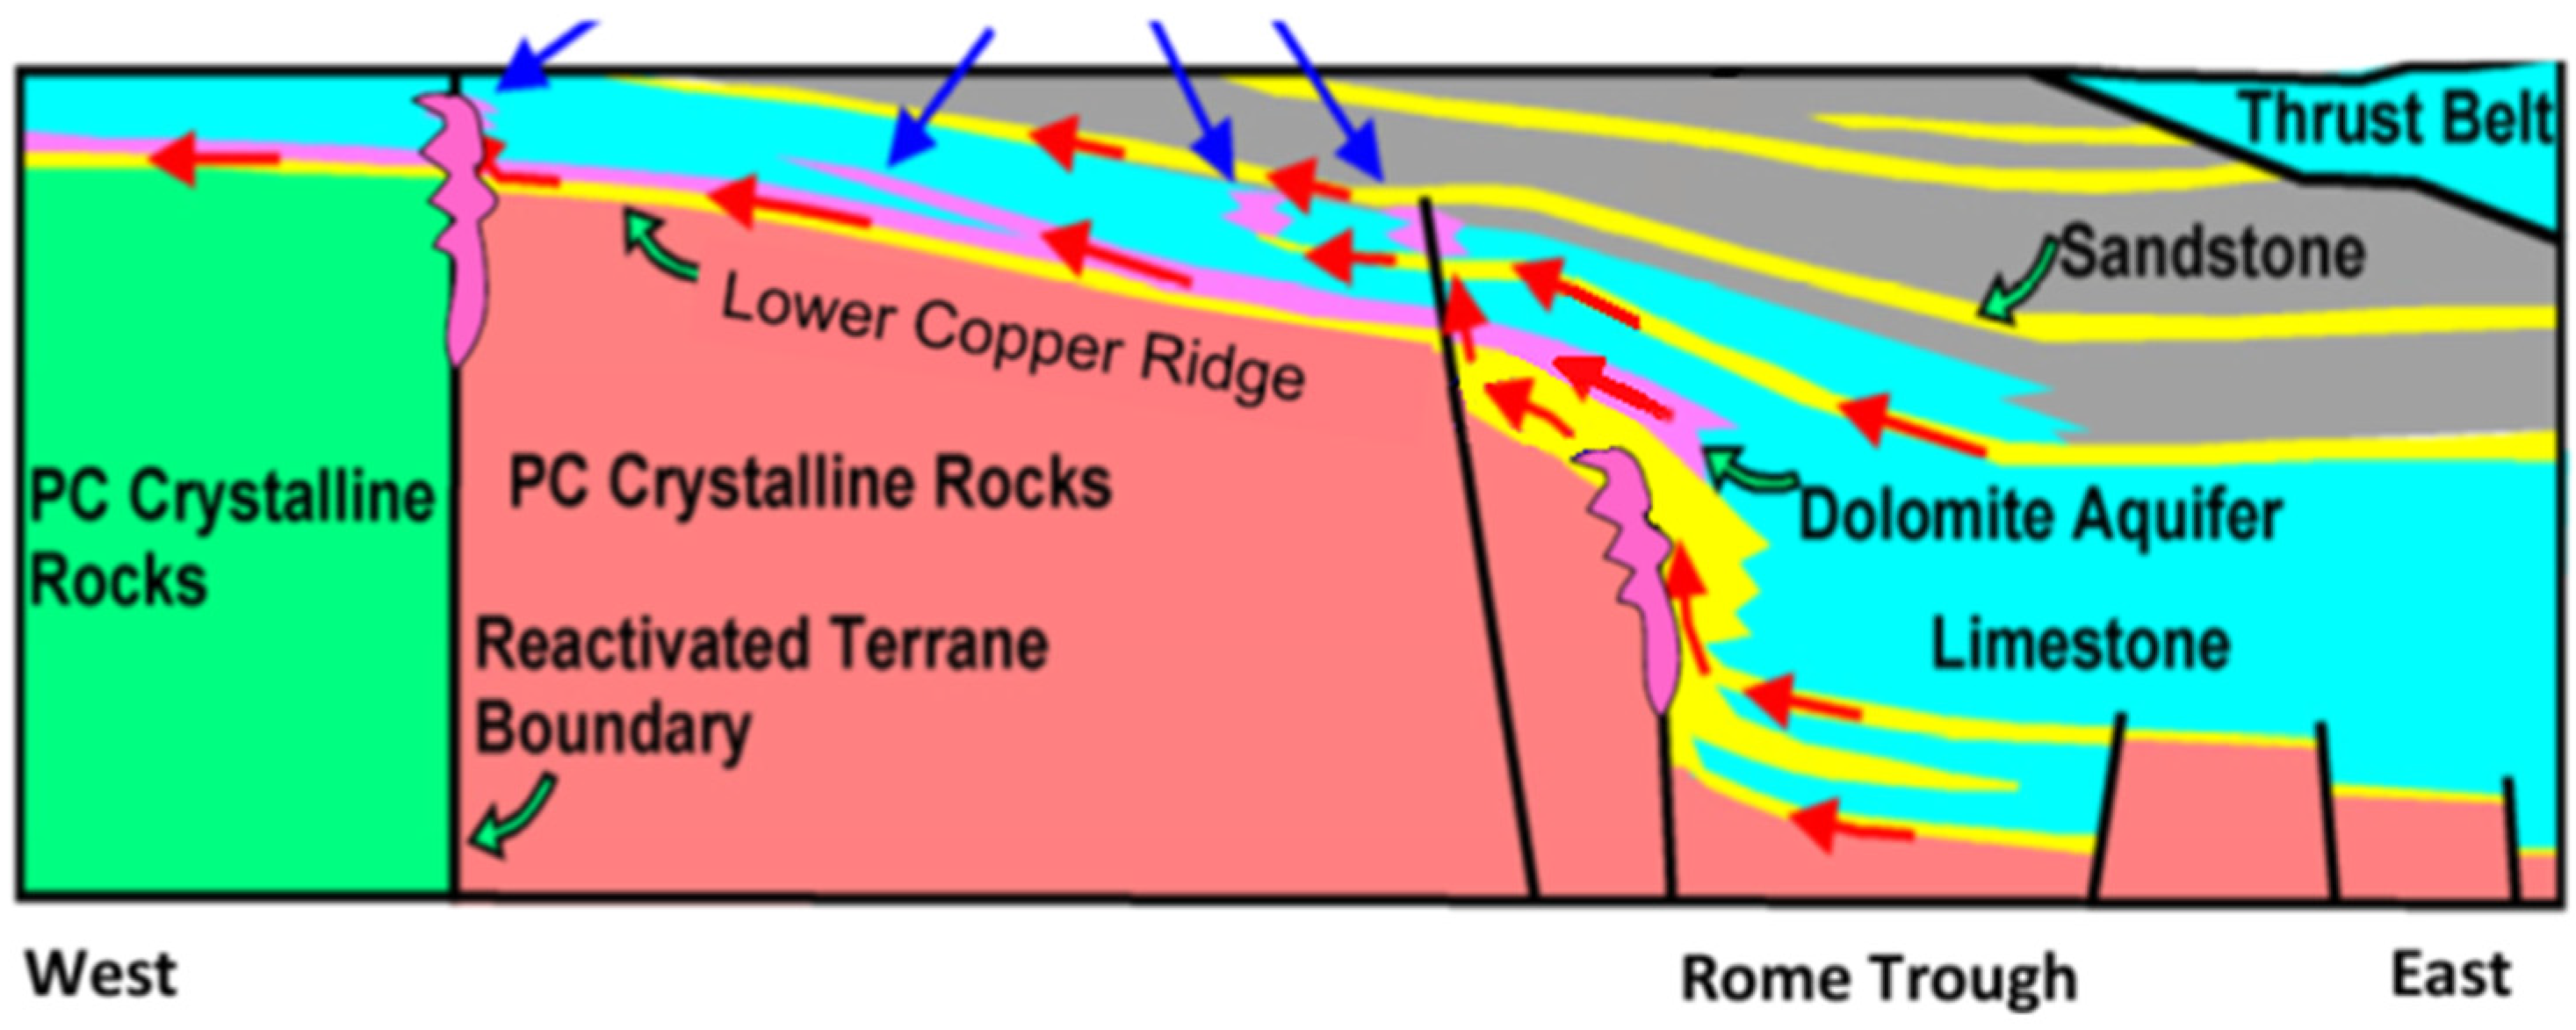
27], though vuggy dissolution porosity zones can have much higher values. Vug formation may be enhanced by hydrothermal dissolution processes, which are known to affect overlying carbonates in the Beekmantown and Trenton/Black River Formations (
Figure 4) [
28,
29].
2.1.2. Lower Devonian Huntersville Chert
The Huntersville Chert is a Lower Devonian rock formation in the Appalachian Basin with potential for CO
2 storage in local fields where it is fractured. The Huntersville Chert has variable percentages of clean chert, organic material, carbonates, mudstones, and carbonaceous and argillaceous cherts. The chert has moldic and interparticle porosity, which is formed through the diagenetic replacement of carbonate mudstones or siliceous deposition in tropical seas. It exhibits porosity averaging from 6 to 8% and is influenced by structural flexures and fractures, which enhance its permeability and, thus, storage capacity [
10].
2.1.3. Oriskany Sandstone
The Oriskany is a medium- to coarse-grained quartz sandstone with features suggesting significant clastic deposition following the cessation of carbonate sedimentation. This unit has widely variable porosity and permeability, with localized reservoir potential enhanced by fracturing and cement dissolution [
30,
31]. The Oriskany’s capacity for CO
2 sequestration has been assessed, with storage estimates in Washington County, Pennsylvania, reaching 6 to 30 million tons [
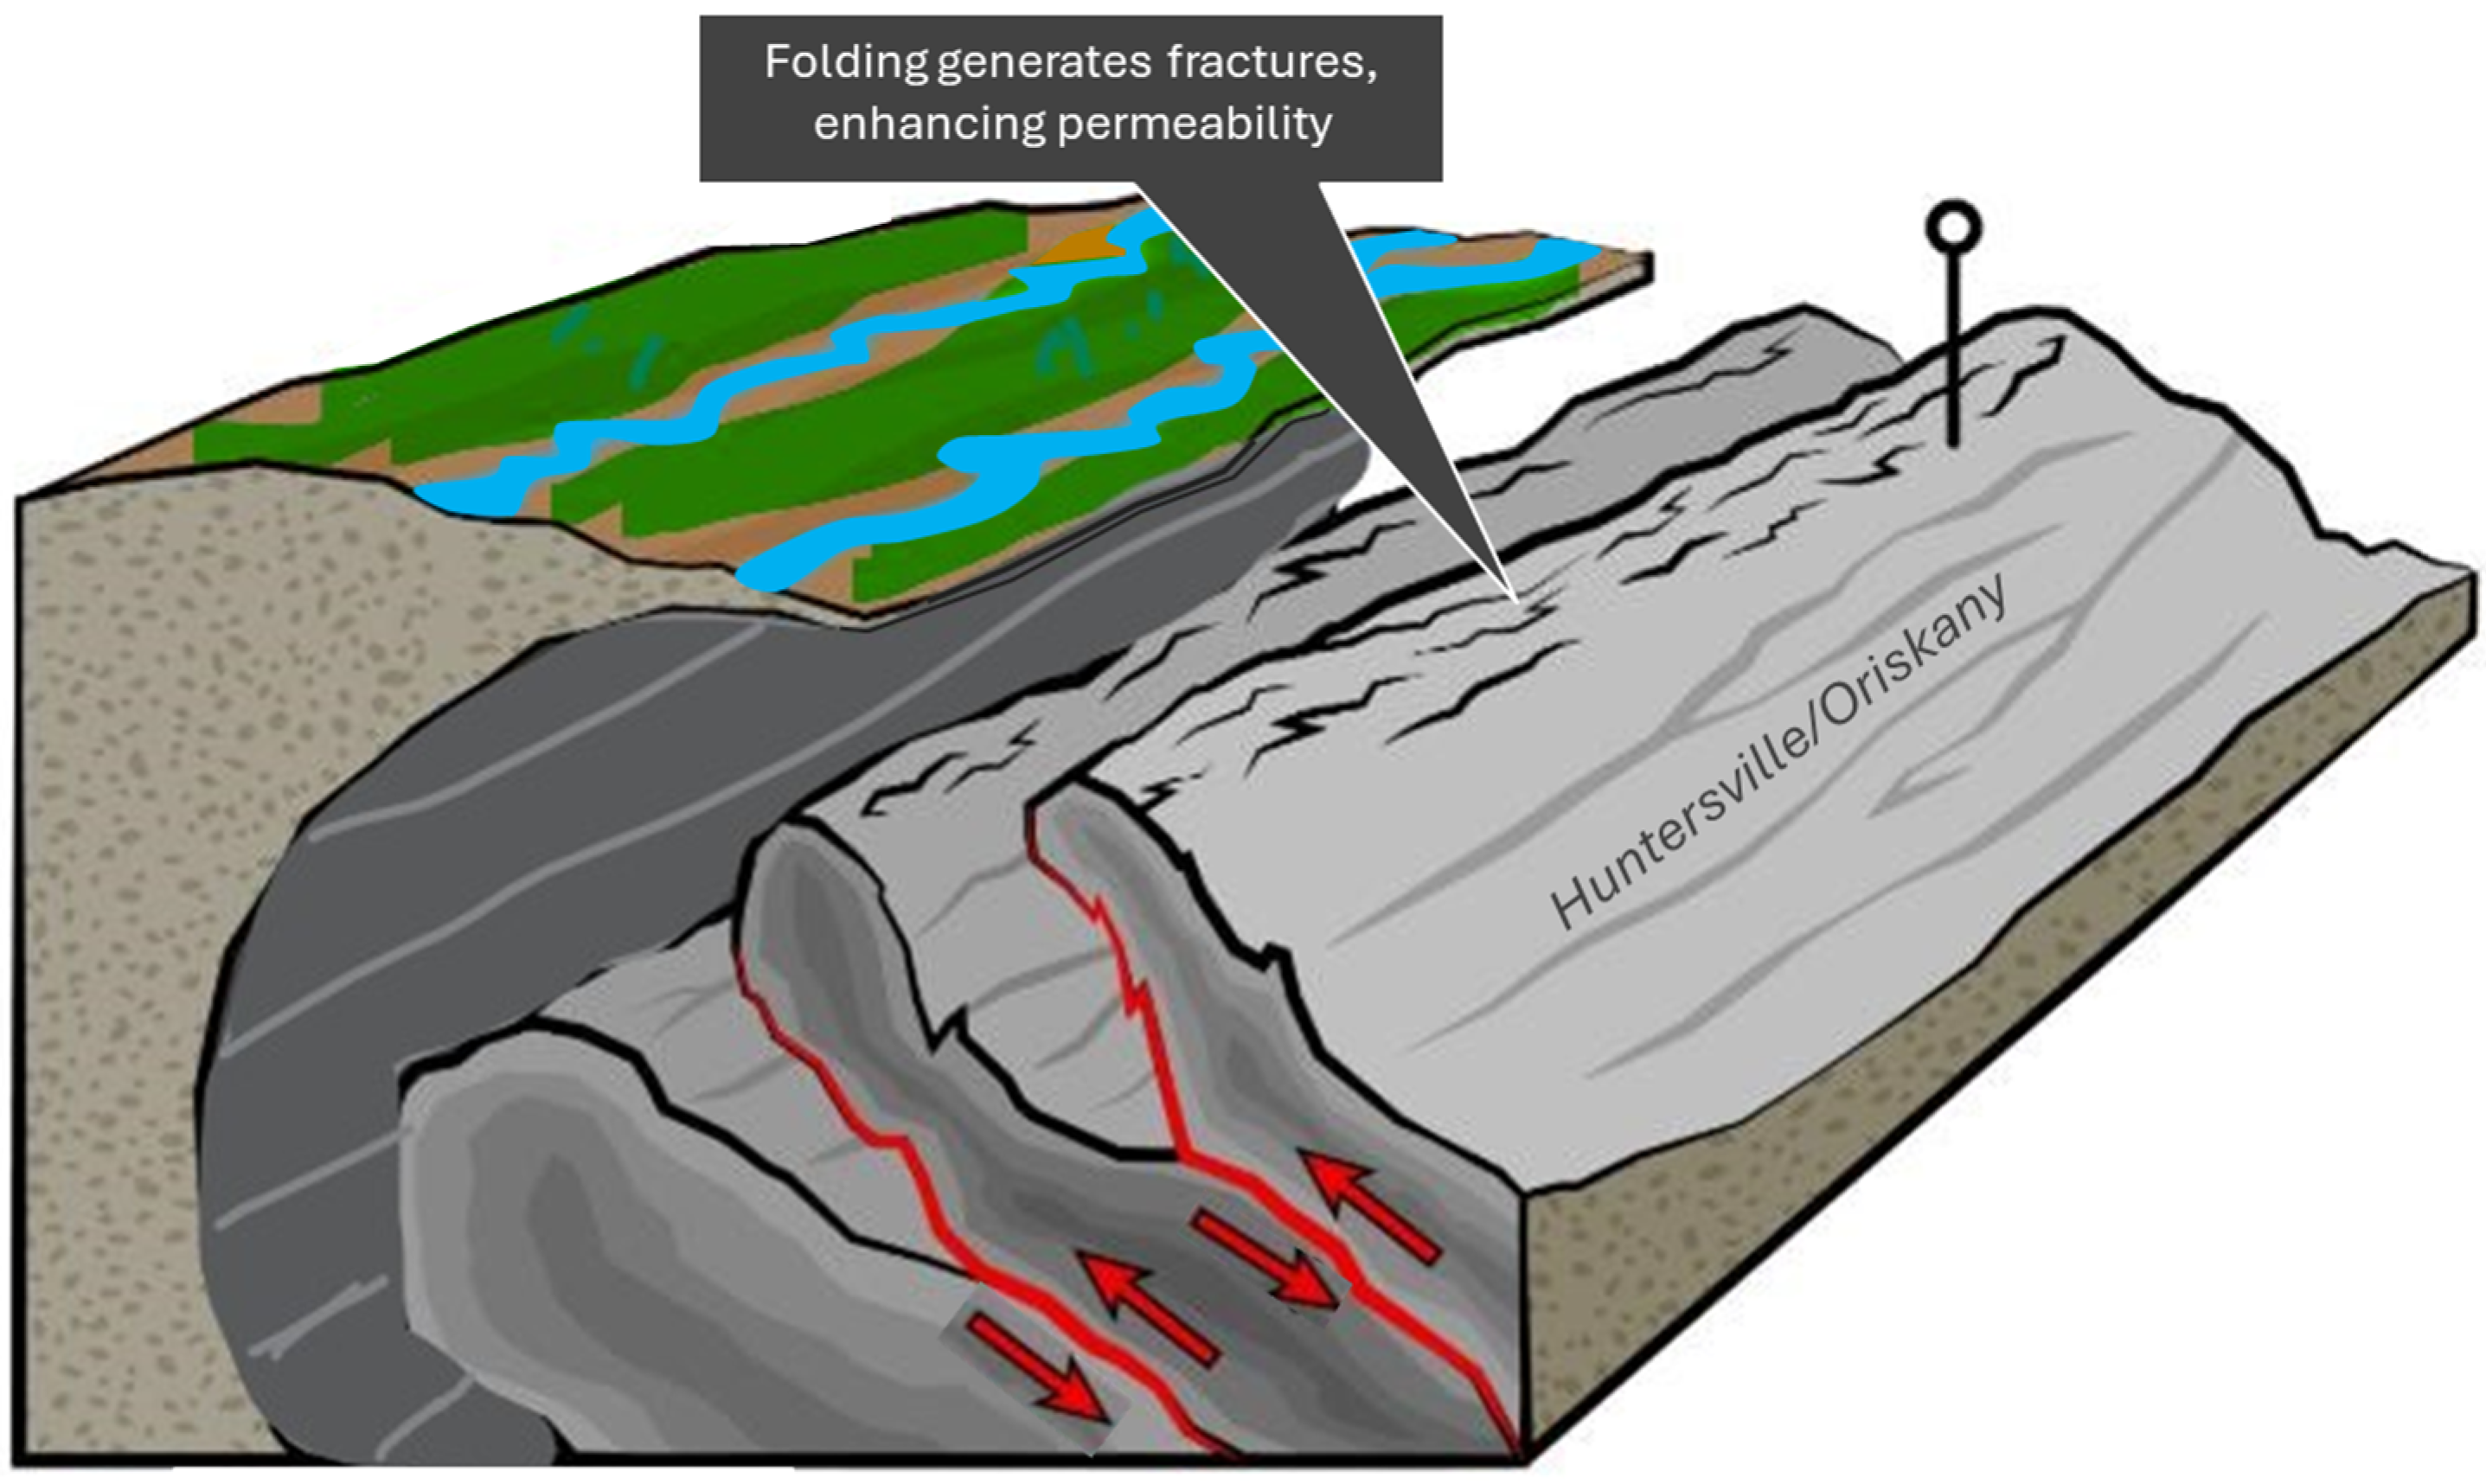
10]. Both the Huntersville and Oriskany formations are commonly fractured in the Appalachian foreland fold belts (
Figure 5), which enhances their reservoir potential [
31,
32].
2.2. Appalachian Caprocks
Appalachian rocks were deposited in the Paleozoic era 252–541 million years ago and have been deeply buried, so they are generally highly lithified and cemented. From organic shales to thick sections of tight limestones, there is no shortage of caprocks, which are more common than reservoirs. Previous studies have regionally characterized caprocks for carbon-storage systems [
11,
32]. A brief overview of caprocks relevant to this paper is described below:
Huntersville/Oriskany stacked storage is sealed immediately above by the normally non-porous but thin Onondaga Limestone, and above that, the Marcellus Shale, an excellent seal. The Onondaga Limestone normally has porosities from 2 to 3% with very low permeabilities. The Marcellus Shale is a world-class shale sealing facies with very low vertical permeabilities [
33]. Along fold belt trends, these caprocks may be impacted by Alleghenian Orogeny reverse/thrust faulting, which can potentially break the caprock and provide a conduit to the surface. Finally, Upper Cambrian Copper Ridge reservoirs are sealed by non-altered tight carbonate sections above/below them. Overlying caprocks include Ordovician shales and dense carbonates with a combined thickness of 100–1000 m or more. In general, numerous thick caprock layers throughout the Appalachian Basin would limit the upward migration of CO
2.
3. Existing Operational Knowhow
Operational data from oil and gas operations, wastewater injection, regional CO
2 storage resource characterization projects, and field tests aid in understanding CO
2 storage feasibility in the Appalachian Basin. There is a long history of oil and gas exploration and production in the Appalachian Basin dating back to the late 1800s. Currently, the basin has very active natural-gas production in the Marcellus Shale and Utica-Point Pleasant plays. In association with this oil and gas activity, there are >200 disposal wells that inject produced water from oil and gas production. These fluid disposal wells provide an analog for CO
2 injectivity in the region. The disposal wells inject more than 3,000,000 m
3 per year of wastewater into many different rock formations, including depleted hydrocarbon reservoirs and deep saline formations [
34]. Some of the more active disposal wells inject significant volumes of up to 2000 m
3 per day [
12].
Several regional studies have characterized the distribution, geotechnical parameters, and CO
2 storage resources in the Appalachian Basin, including the Midwest Regional Carbon Sequestration Partnership (part of the U.S. Department of Energy National Carbon Sequestration Partnership Program), the Midwest Regional Carbon Initiative, and several state programs to characterize CO
2 storage rock formations. These research programs have included a combination of regional mapping and volumetric CO
2 resource estimates [
13,
32,
35]. Overall, the regional studies suggest there are 100s of gigatons of prospective CO
2 storage resources in the Appalachian Basin. However, accessing these resources in terms of injecting large volumes of CO
2 is not as well tested.
There have been several stratigraphic test wells drilled in the Appalachian Basin to define key reservoirs and caprocks, along with limited injection tests [
11,
36]. These include the AEP Mountaineer Ohio River Valley CO
2 Storage Project, which was the first integrated carbon capture and storage project at an active coal-fired power plant in New Haven, West Virginia, USA. The Mountaineer project injected 36,500 metric tons of CO
2 into two different rock formations in the Rose Run Sandstone and Copper Ridge Dolomite at depths of 2285–2515 m. Feasibility studies of CO
2 injection were completed as part of the Midwest Regional Carbon Initiative. In addition, a front-end engineering design was completed for a depleted gas field in the central Appalachian Basin.
4. Simulations of CO2 Injection Systems
To better understand CO2 storage system feasibility in the Appalachian Basin, results from three different sites were evaluated. Each site was assessed in separate projects, and this paper compares the results of geological models and reservoir simulations completed at each site. The case studies include an integrated CCS demonstration site, a front-end engineering and design site, and an exploratory site. The demonstration site had a large amount of data from a stratigraphic test well, injection testing, CO2 injection operations, and reservoir monitoring. The front-end engineering design site was in a depleted gas field that had 150 wells in the field but no injection data and few modern geophysical logs. The exploratory site was a deep saline formation based on regional maps and geophysical logs.
Geocellular Static Earth Models (SEMs) were created and simulated in Dynamic Reservoir Simulations (DRMs) to better understand the CCS development potential of three carbon-storage scenarios in Appalachia. SEMs were created from regional and proximal well log data, core data, sedimentological and stratigraphic studies, analogs, production data, or a stratigraphic test well (as applicable) [
26,
31,
32,
36]. The three operational scenarios are the following: stacked storage in the Cambrian-Age Rose Run, Upper Copper Ridge, and Lower Copper Ridge; storage in the Devonian Oriskany Sandstone with a distributed well configuration; storage in the fractured Devonian Huntersville with a daisy-chain well configuration. Variations in injection performance from geological differences and operational concepts/limitations are summarized below.
4.1. Stacked Storage in the Rose Run and Copper Ridge Formations
The first geologic model was simulated as a radial model that extends outwards ~32 km (64-mile diameter model). It is a saline reservoir that targets the Rose Run, Upper Copper Ridge, and Lower Copper Ridge.
Table 1 shows the summary of formation porosity, thickness, and permeability values present in each of the storage zones.
The initial fluid in this model is in situ brine with a salinity of 223,000 ppm, featuring initial gradients of 0.011 MPa/m for fluid pressure, 0.018 MPa/m for fracture pressure, and 0.91 K/m for reservoir temperature. The operating constraint for this model is the maximum allowable bottom-hole injection pressure (90% of the fracture pressure) for each of the injection wells.
This model assumes two different injection locations with 750,000 MT/yr/site to achieve the commercial-scale rate of 1.5 MMT/yr in the field. Each site has 3 injection wells targeting the Rose Run, Upper Copper Ridge, and Lower Copper Ridge reservoirs as a potential stacked storage opportunity. The use of individual wells for targeting each of the reservoirs was selected as a potential plume balancing strategy due to the considerable differences in the quality of each of the three storage reservoirs.
Table 2 below shows the injection rates per reservoir target for the commercial-scale scenario.
Table 3 summarizes the maximum pressure buildup for each reservoir. Please note that Upper Copper Ridge has the least amount of pressure buildup and the highest amount of CO
2 injected due to the higher-quality storage properties relative to the other zones.
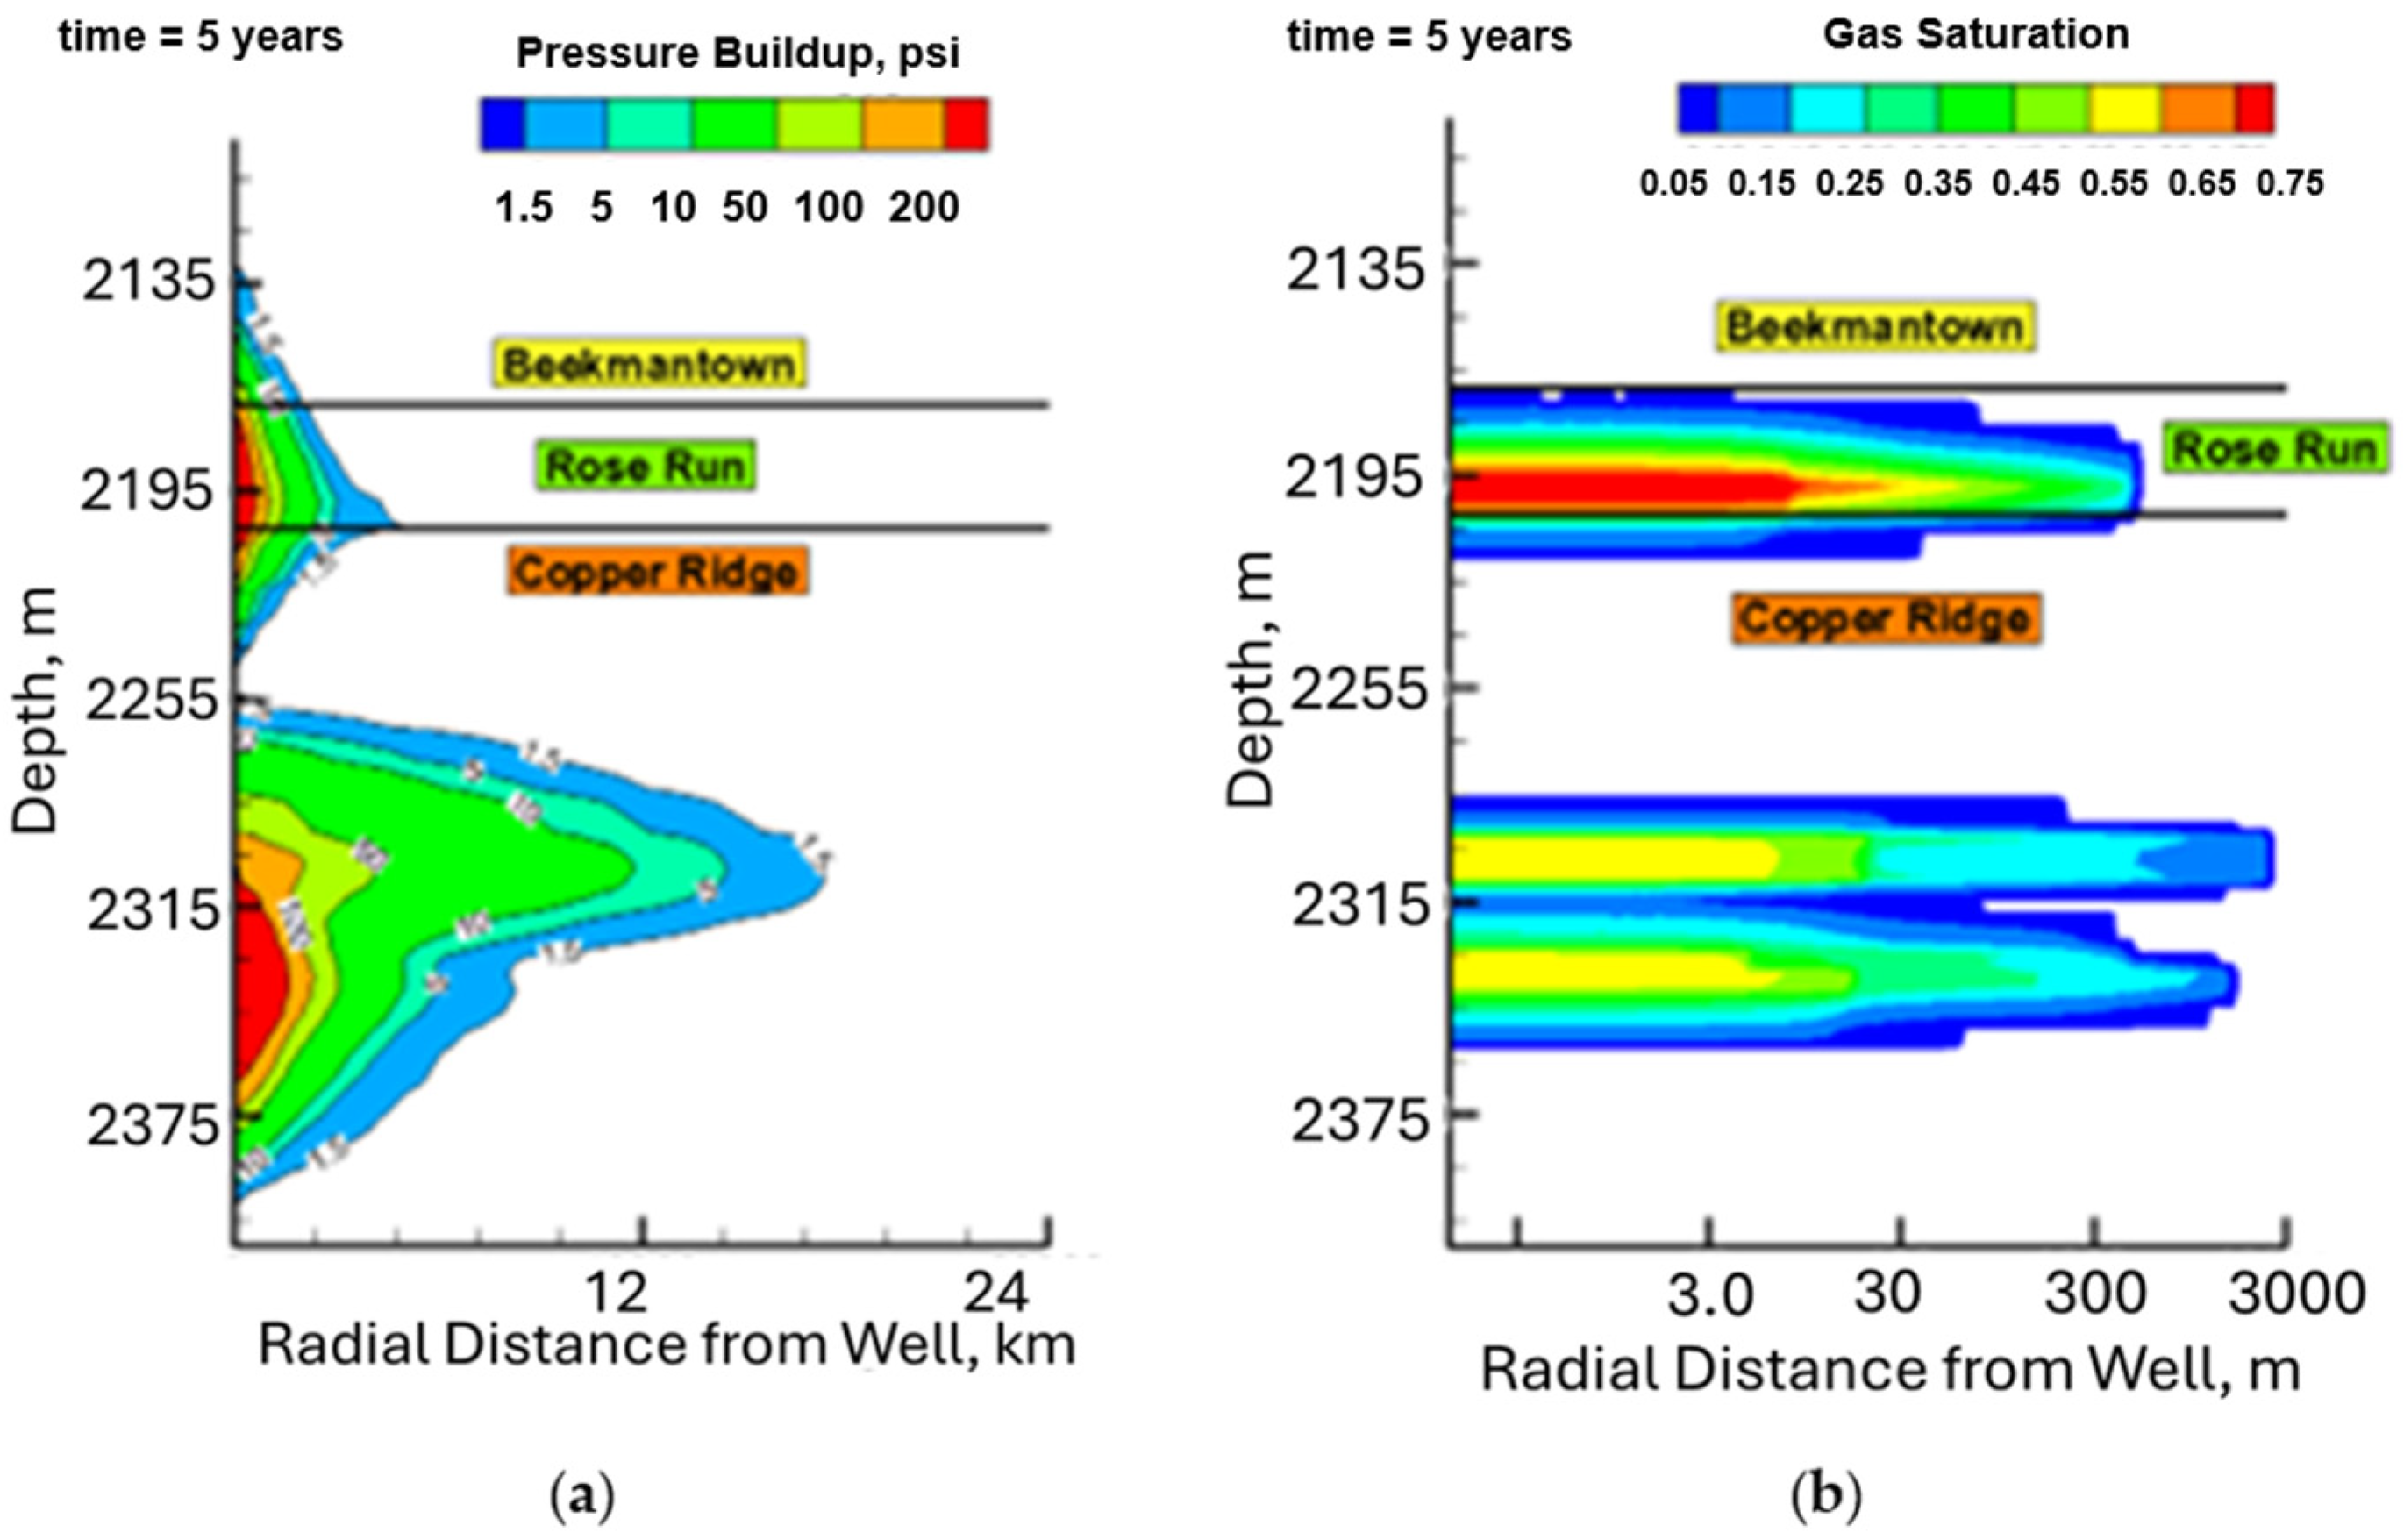
Two-dimensional contour plots of pressure buildup and CO
2 saturation after 5 years of injection for the 2-site 3-well injection scenario are shown below in
Figure 6.
Figure 6 depicts a small pressure front growing in the Rose Run relative to the Copper Ridge reservoirs, and the two pressure plumes from Upper Copper Ridge and Lower Copper Ridge form a single composite pressure front.
4.2. Distributed Storage in the Oriskany
The second model is a saline reservoir that covers a 32 by 32 km area. The reservoir is modeled as a medium porosity (12%), medium permeability (47 md) section within the Oriskany Sandstone that is roughly 6 m thick at a depth of 2180 m.
The initial fluid in the Oriskany model consists of in situ brine with a salinity of 200,000 ppm, featuring initial gradients of 0.0099 MPa/m for fluid pressure, 0.018 MPa/m for fracture pressure, and 1.82 K/m for reservoir temperature. The operating constraint for this model is the maximum allowable injection pressure (90% of the fracture pressure).
Table 4 lists the three different CO
2 injection scenarios that were evaluated for the Oriskany model. The simplified homogeneous model was more numerically efficient in assessing the CO
2 injectivity and commercial-scale feasibility in the modeled area and, therefore, is detailed in below.
Results from the dynamic modeling scenarios are summarized in
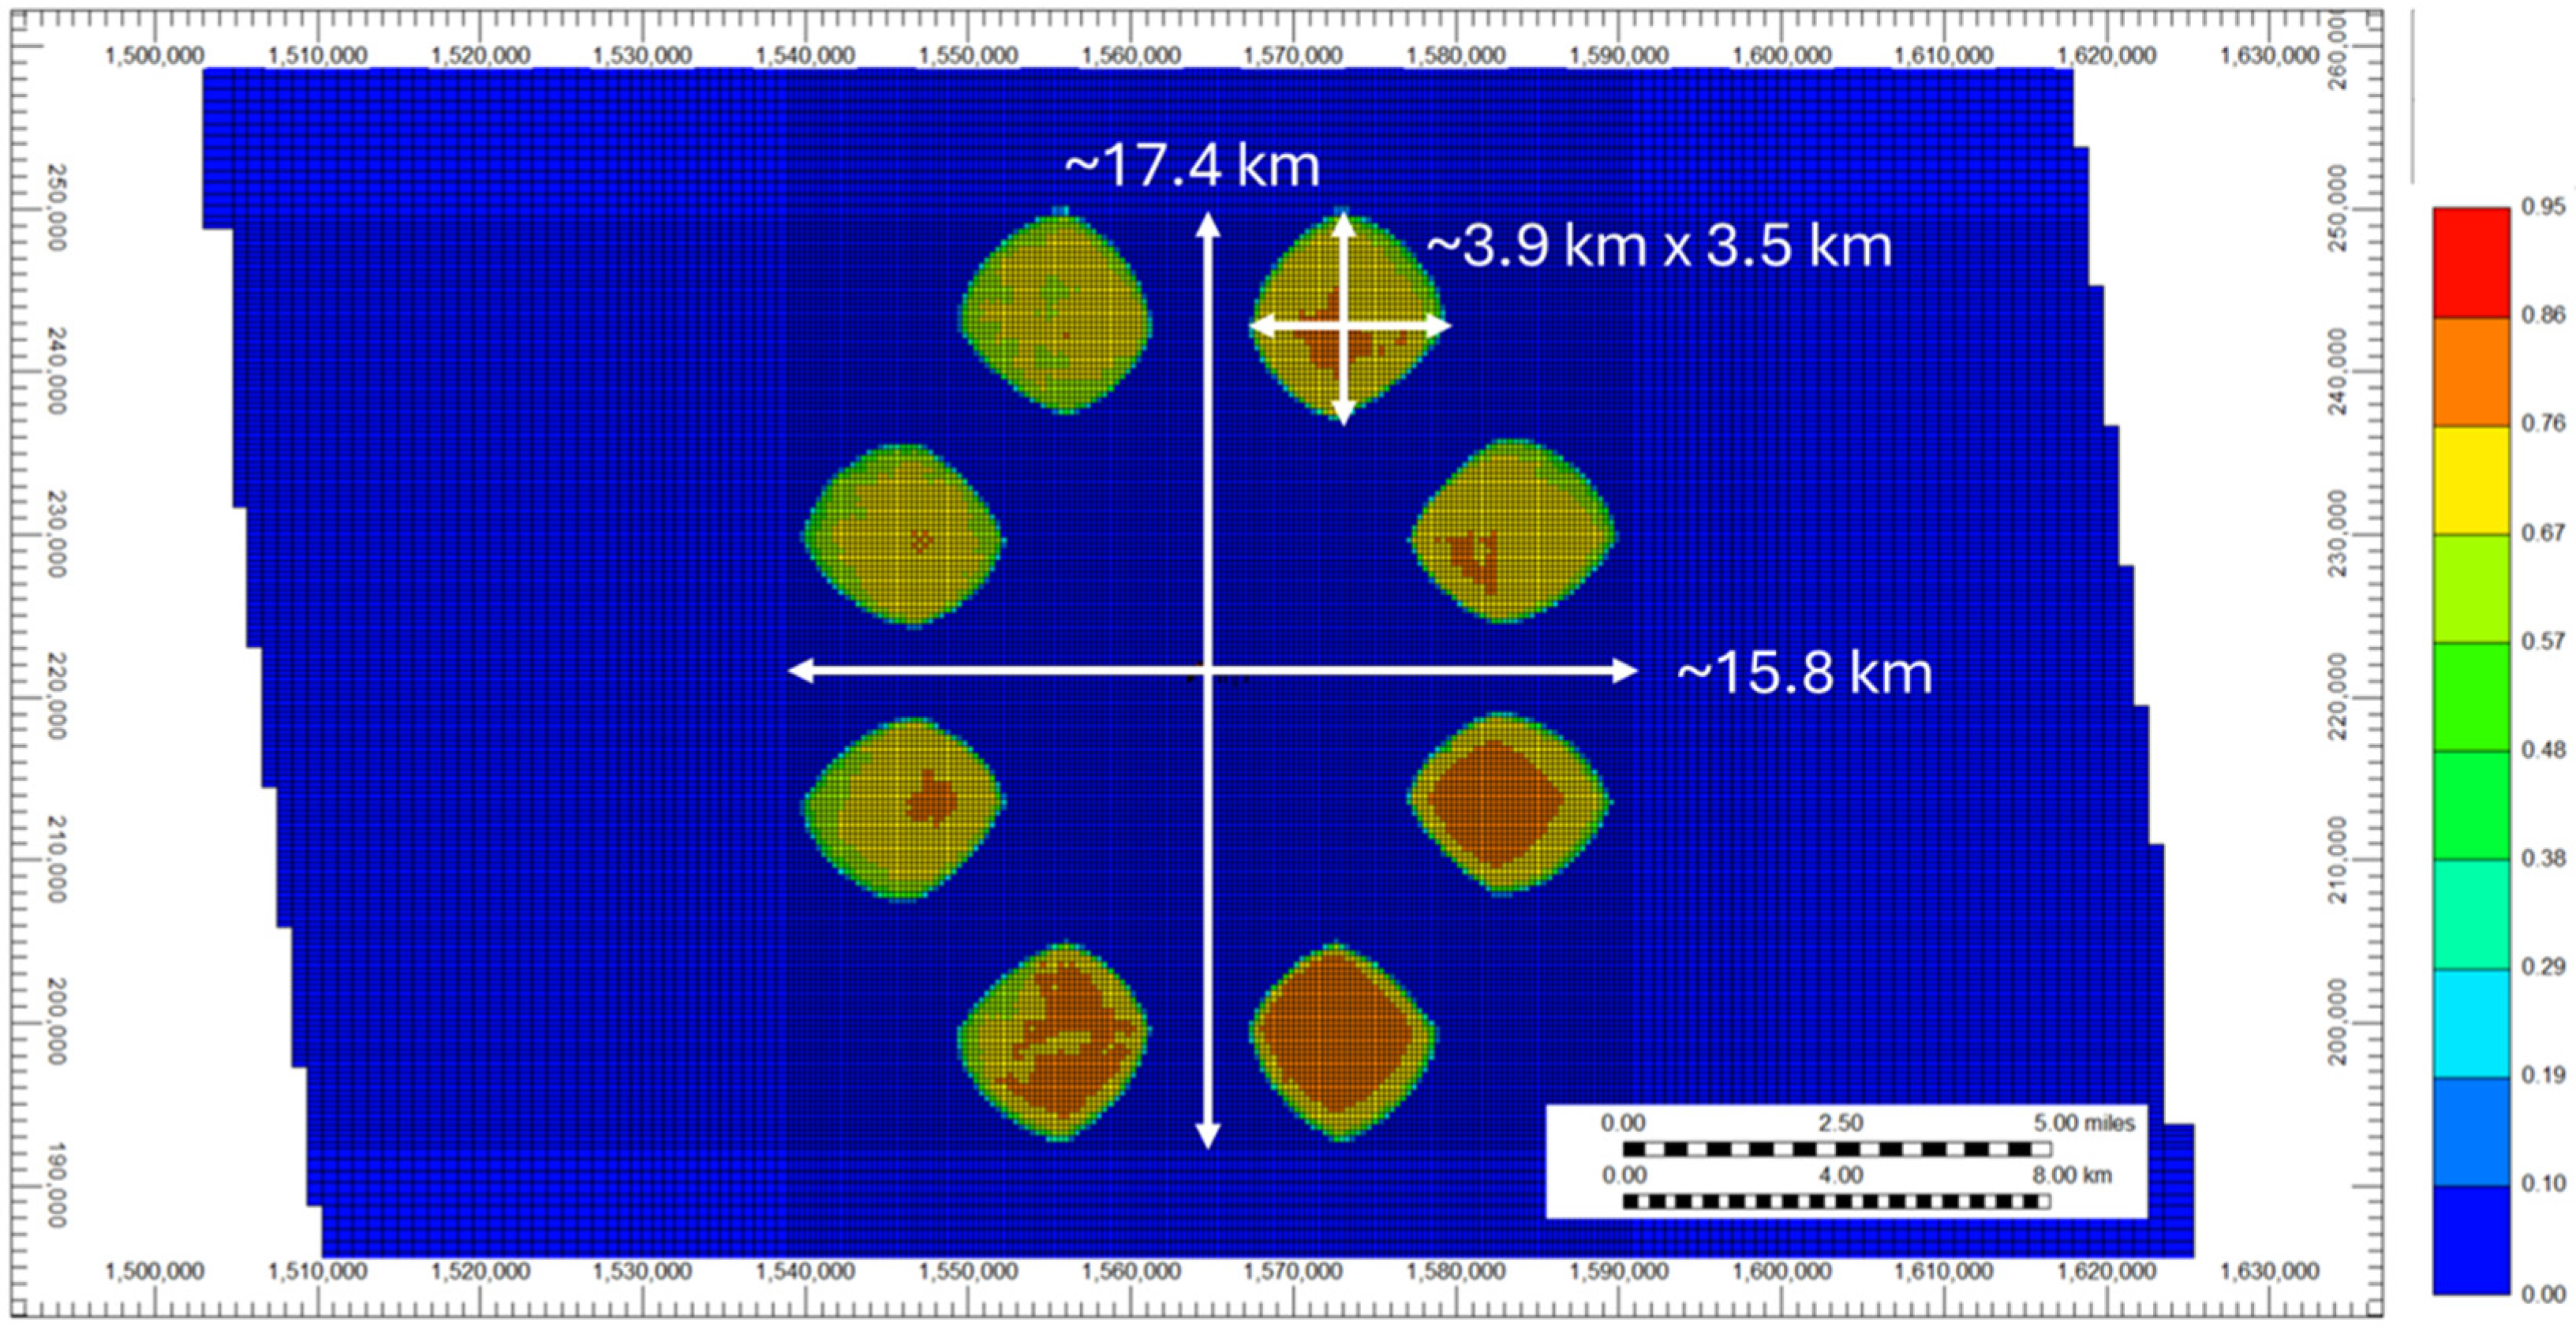
Table 5. Commercial-scale injection of 1 MMT CO
2/year was achieved with a total of eight vertical injection wells.
Wells were added incrementally to the system to examine the total injection volume. The wells were arranged in a polygon at the center of the reservoir with a minimum spacing of 5.6 km to minimize well interference. The cumulative mass injected for the eight-well scenario was 32 MMT of CO
2 over a 30-year injection period. The lateral extent of the plumes around the injection wells is shown below in
Figure 7.
4.3. Daisy-Chain Storage in the Fractured Huntersville
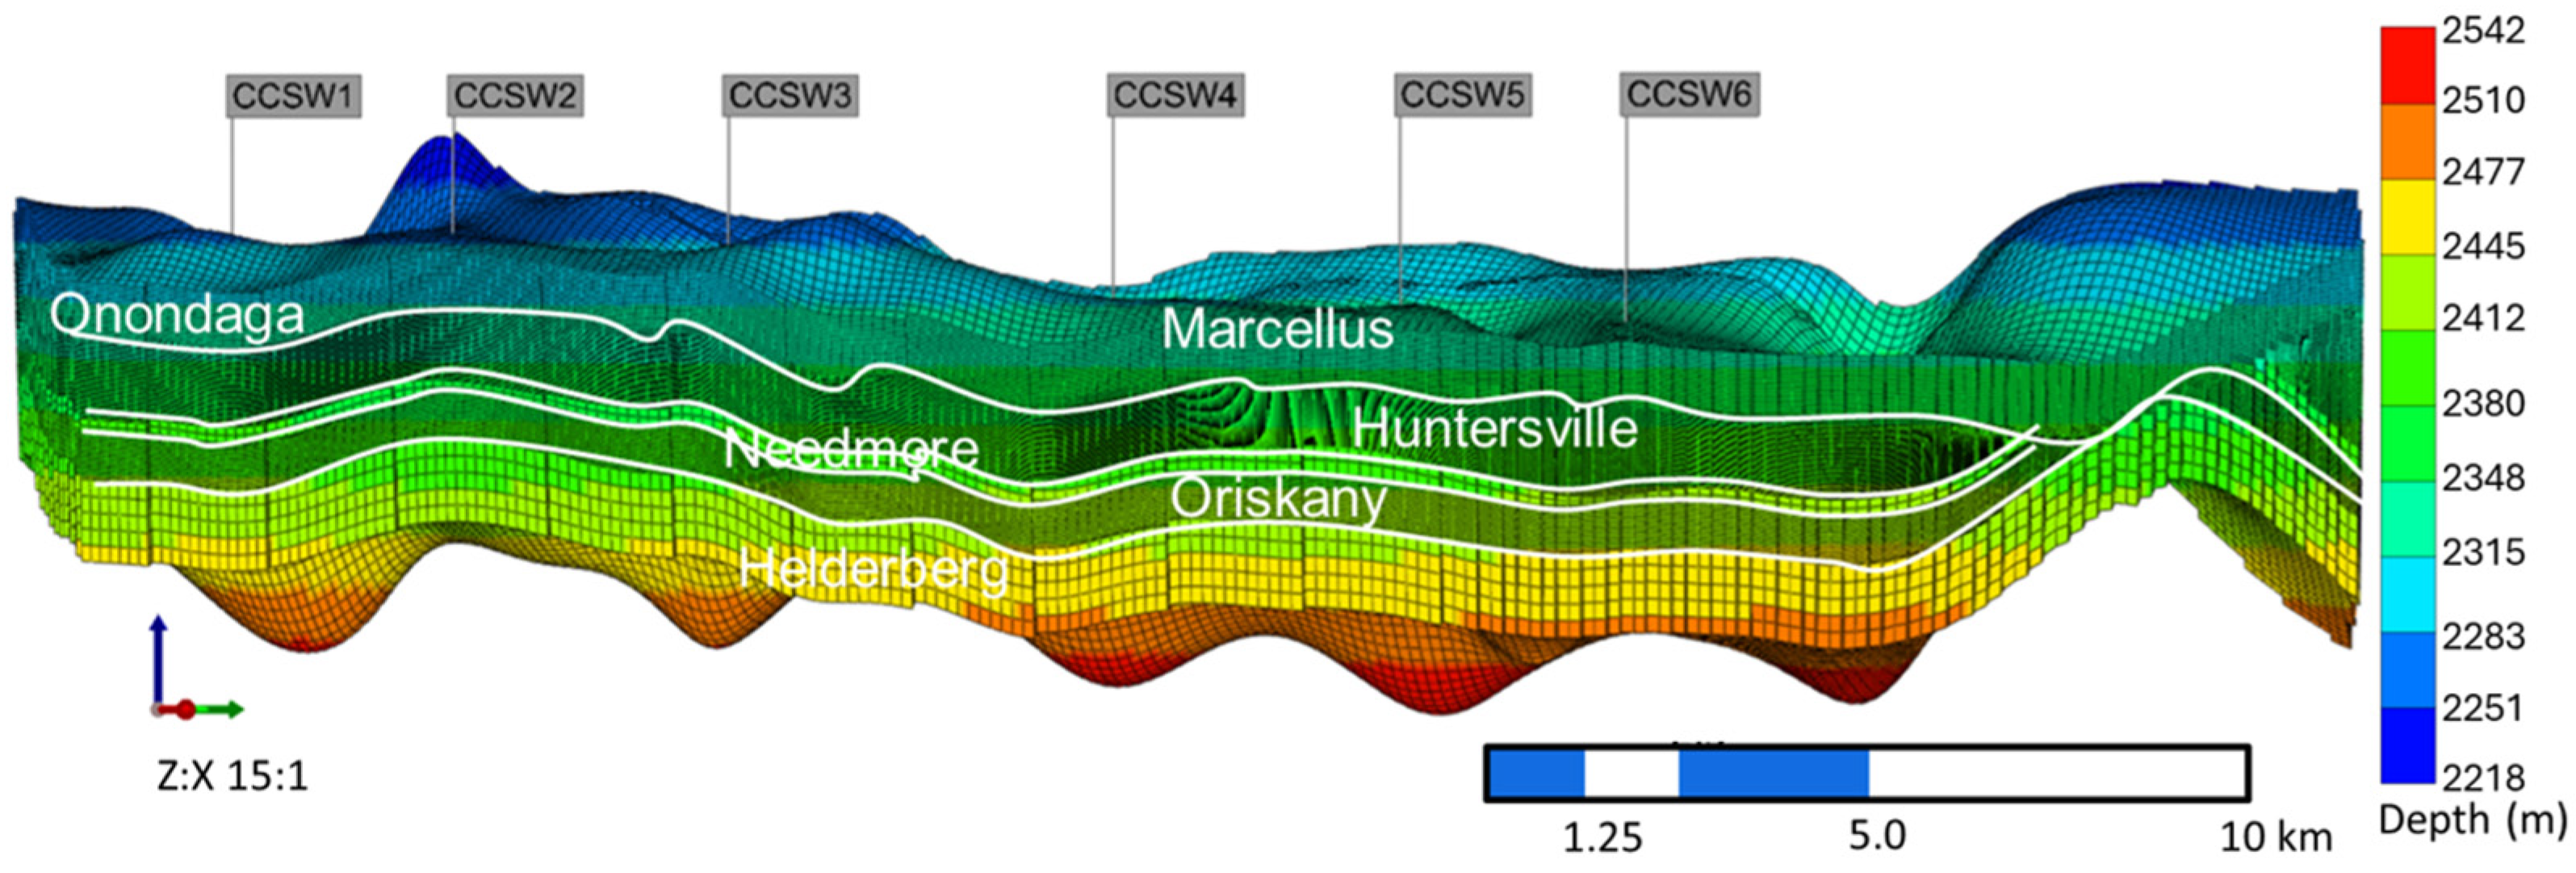
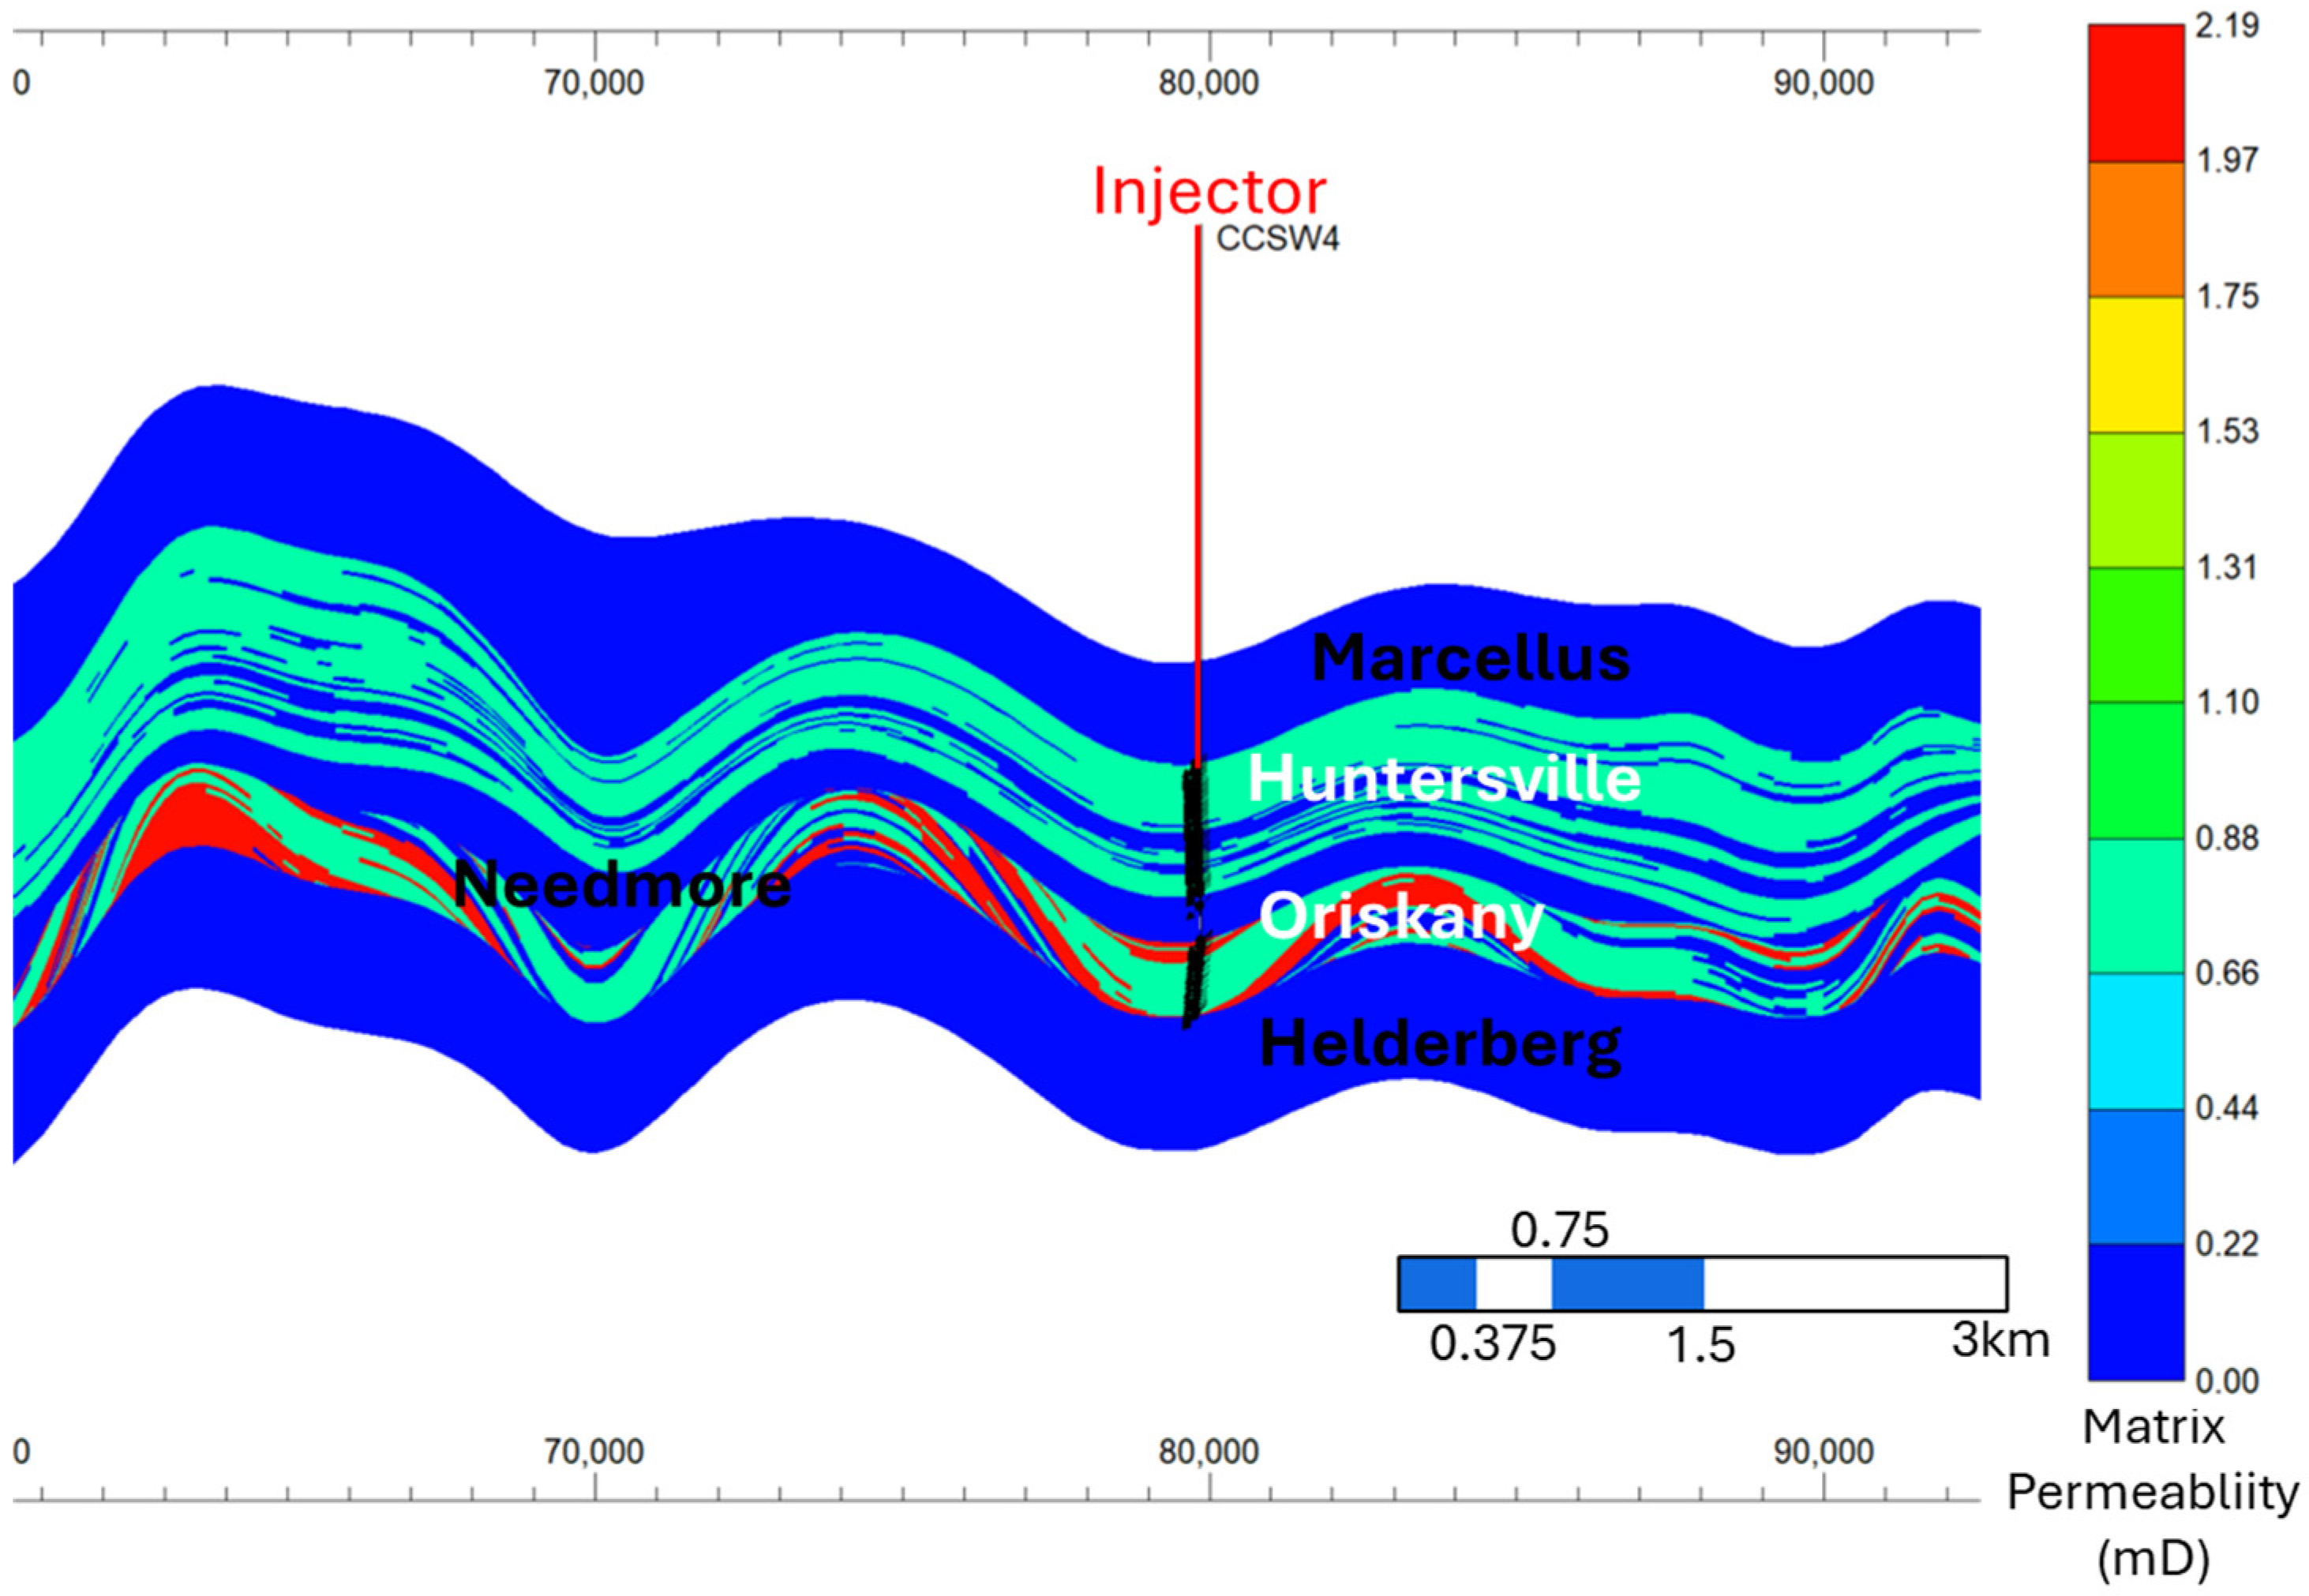
The third model is a depleted, dual permeability/porosity simulation model that covers a 21 × 3.2 km area. This model focuses on the Lower Devonian Huntersville and Oriskany formations present at depths of 2350–2500 m, separated by the low permeability Needmore Shale depicted in
Figure 8. The fractures present in Huntersville provide the essential permeability/transmissivity (145 md), while the matrix provides the essential porosity/capacity (~5%).
The initial fluids in the Huntersville model consist of natural gas and in situ brine with a salinity of 200,000 ppm, featuring initial gradients of 0.0098 MPa/m for fluid pressure, 0.016 MPa/m for fracture pressure, and 2.3 K/m for reservoir temperature. The two operating constraints for Huntersville are a maximum injection rate of 2.11 MMT/yr per field as the primary constraint and a maximum allowable injection pressure (90% of the fracture pressure) as the secondary constraint.
The dynamic model simulation includes a production and injection phase. The production phase, represented by three evenly spaced vertical wells, aims to simulate the historical volumetric depletion observed in the field, and the injection phase is a 10-year continuous injection period. Due to a few years of missing historical production data from the field of interest, a conservative estimate of produced gas was made during the missing years of production and, therefore, led to uncertainty in the total depletion of the field. The level of depletion in the field directly correlates to the injectivity and total storage capacity of the field.
Figure 9 shows cross-sectional views of the CO
2 plumes throughout and at the end of the 10-year injection period. Once the bottom of the Huntersville has been fully saturated with CO
2, the reservoir begins filling like a container from bottom to top. This behavior observed is due to the difference in density between methane and CO
2. The stratification of CO
2 and methane suggests potential for enhanced gas recovery, which may merit further research. The CO
2 plume measured at the end of the 10-year injection period was 17.2 km × 4.2 km (44.7 km
2). The cumulative injected CO
2 into Huntersville totals 18 MMT over 10 years. This indicates that this field will accommodate ~9 years of a commercial rate of 2.11 MMT/yr of CO
2.
5. Other Relevant Considerations for Large-Scale CCS Implementation
5.1. Multi-Well Injection-Field Design
In most cases, to achieve commercial-scale injection rates in moderate-quality reservoirs present in the Appalachian Basin, multi-well injection-field designs are imperative. For each of the case studies, as described above in
Section 4, multi-well injection-field plans were carried out. The first case study involves a two-site, three-well injection field (totaling six wells), the second highlights an eight-well field, and the third comprises a six-well field.
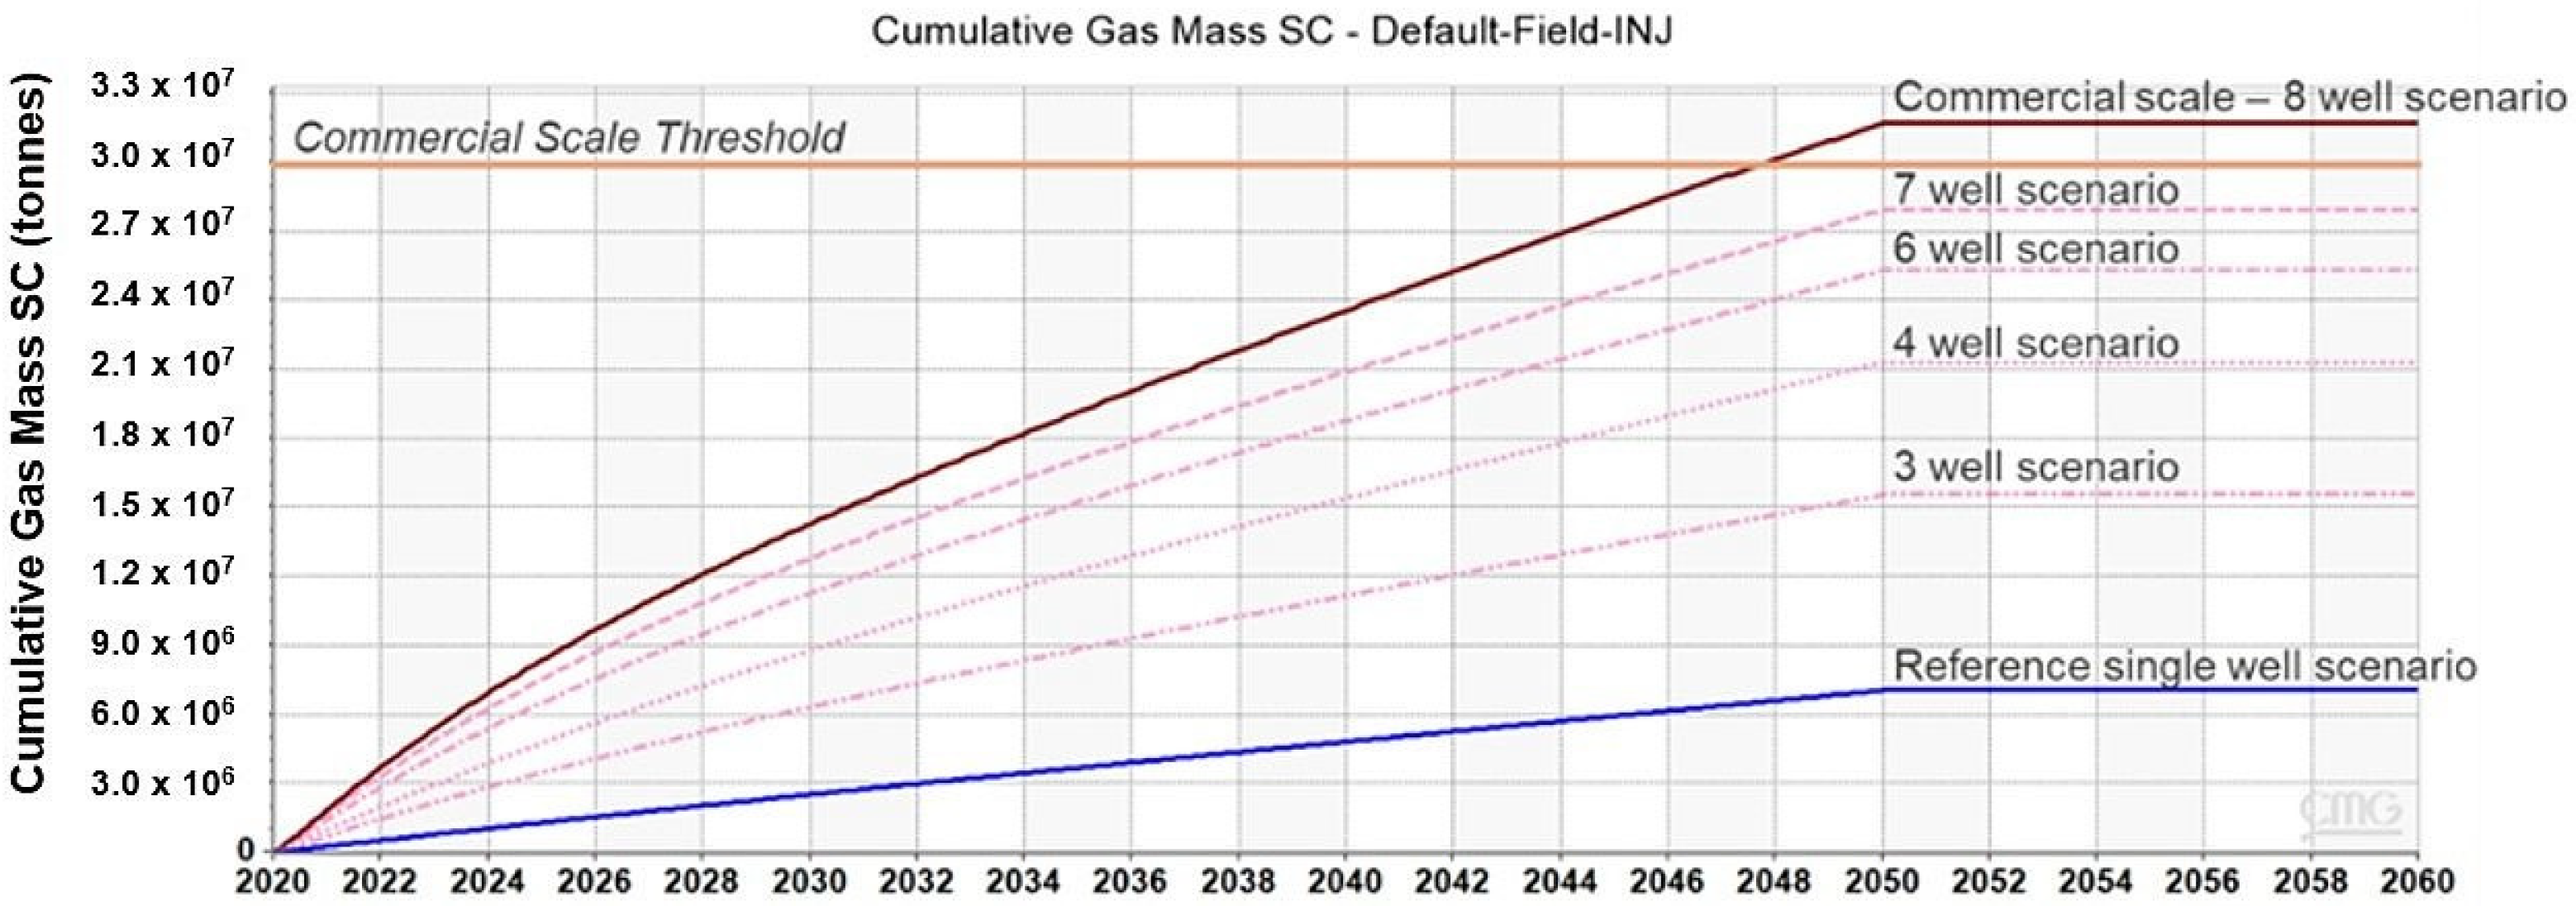
In the stacked storage model, the use of three injection wells at each site is a strategy to balance plume growth between each of the reservoirs, as well as an increase in the storage capacity of the field. For the distributed well-design model, injection wells were added incrementally to the system to examine the total injection volume. It was discovered that eight injection wells were needed in order to achieve the commercial-scale rate of 3.0 MMT/yr into the Oriskany Sandstone, as shown in
Figure 10 below.
For the daisy-chain well-design model, deviated injection wells were utilized to increase the contact area with high fracture permeability streaks present in the reservoir. Six wells were needed to achieve the commercial-scale rate of 2.1 MMT/yr into Huntersville.
5.2. Stacked Storage
The concept of stacked storage was showcased in the first model that targets the Rose Run, Upper, and Lower Copper Ridge units in
Figure 6 above. Each flow unit is separated by confining units, creating a series of discontinuous storage reservoirs suitable for stacked storage. The storage capacity of this field is heightened with 5% of the total injected volume of CO
2 going into the Rose Run, 30% into the Lower Copper Ridge, and the remaining 65% into the Upper Copper Ridge rather than using just the best unit, the Upper Copper Ridge. This not only balances the CO
2 plumes but also the pressure plumes accordingly.
The daisy-chain well-design model consists of the Huntersville and Oriskany separated by sealing facies (the Needmore Shale). While the Oriskany does not have the presence of natural fractures as the Huntersville does, there is potential for the stacked storage concept in this model as well for additional storage capacity, as shown below in
Figure 11.
5.3. Operational Strategies and Utilization of Complex Systems for Potential Injectivity Enhancement
In order to achieve commercial-scale injection rates in the Appalachian Basin, naturally fractured and depleted reservoirs must be considered. Considering these reservoirs for CO
2 storage will significantly expand the existing onshore storage options by utilizing various complex or “lower quality” reservoirs across the Appalachian region. Operational strategies and well configurations from the oil and gas industry must be employed to identify optimal CO
2 storage solutions to enhance the injectivity and storage efficiency of these “lower quality” reservoirs. The strategies and configurations outlined in this report—stacked storage, storage in naturally fractured/depleted reservoirs, and distributed and daisy-chain well configurations—are detailed in
Section 4 above.
Understanding the connectivity and subsurface fluid flow in natural fractures is critical for comprehending migration and safe/secure storage in complex subsurface systems. The existing understanding of the impact of natural fractures on enhancing CO
2 injectivity and storage performance comes from a handful of recent modeling efforts [
37,
38] and a couple of examples from pilot and demonstration projects such as the In Salah CO
2 storage site [
39,
40].
Well stimulation is a regulated practice that originates from the oil and gas industry that enhances near-wellbore permeability. Horizontal/deviated wellbores increase the reservoir contact surface area in thin, laterally extensive formations common to the Appalachian Basin. A scoping study [
41] was conducted to assess how well stimulation and lateral/deviated wellbores enhance formation injectivity. It was determined that these techniques could enhance CO
2 injectivity from ~25% to 150%, dependent on various factors such as formation properties (permeability, thickness, porosity, etc.), naturally fractured/unfractured systems, and natural fracture/stimulation properties.
6. Discussion
6.1. Lessons Learned from Simulations
With the increase in commercial interest in geologic CO2 sequestration in the Appalachian Basin, further evaluation of complex designs and systems will need to be considered to support large-scale CCS in the region. Modeling of subsurface fluid flow in fractured systems is an area of research that can continue to be built on. Increased data availability of fractured and depleted reservoirs can help decrease the uncertainty when building these complex models and, therefore, provide more certainty in results.
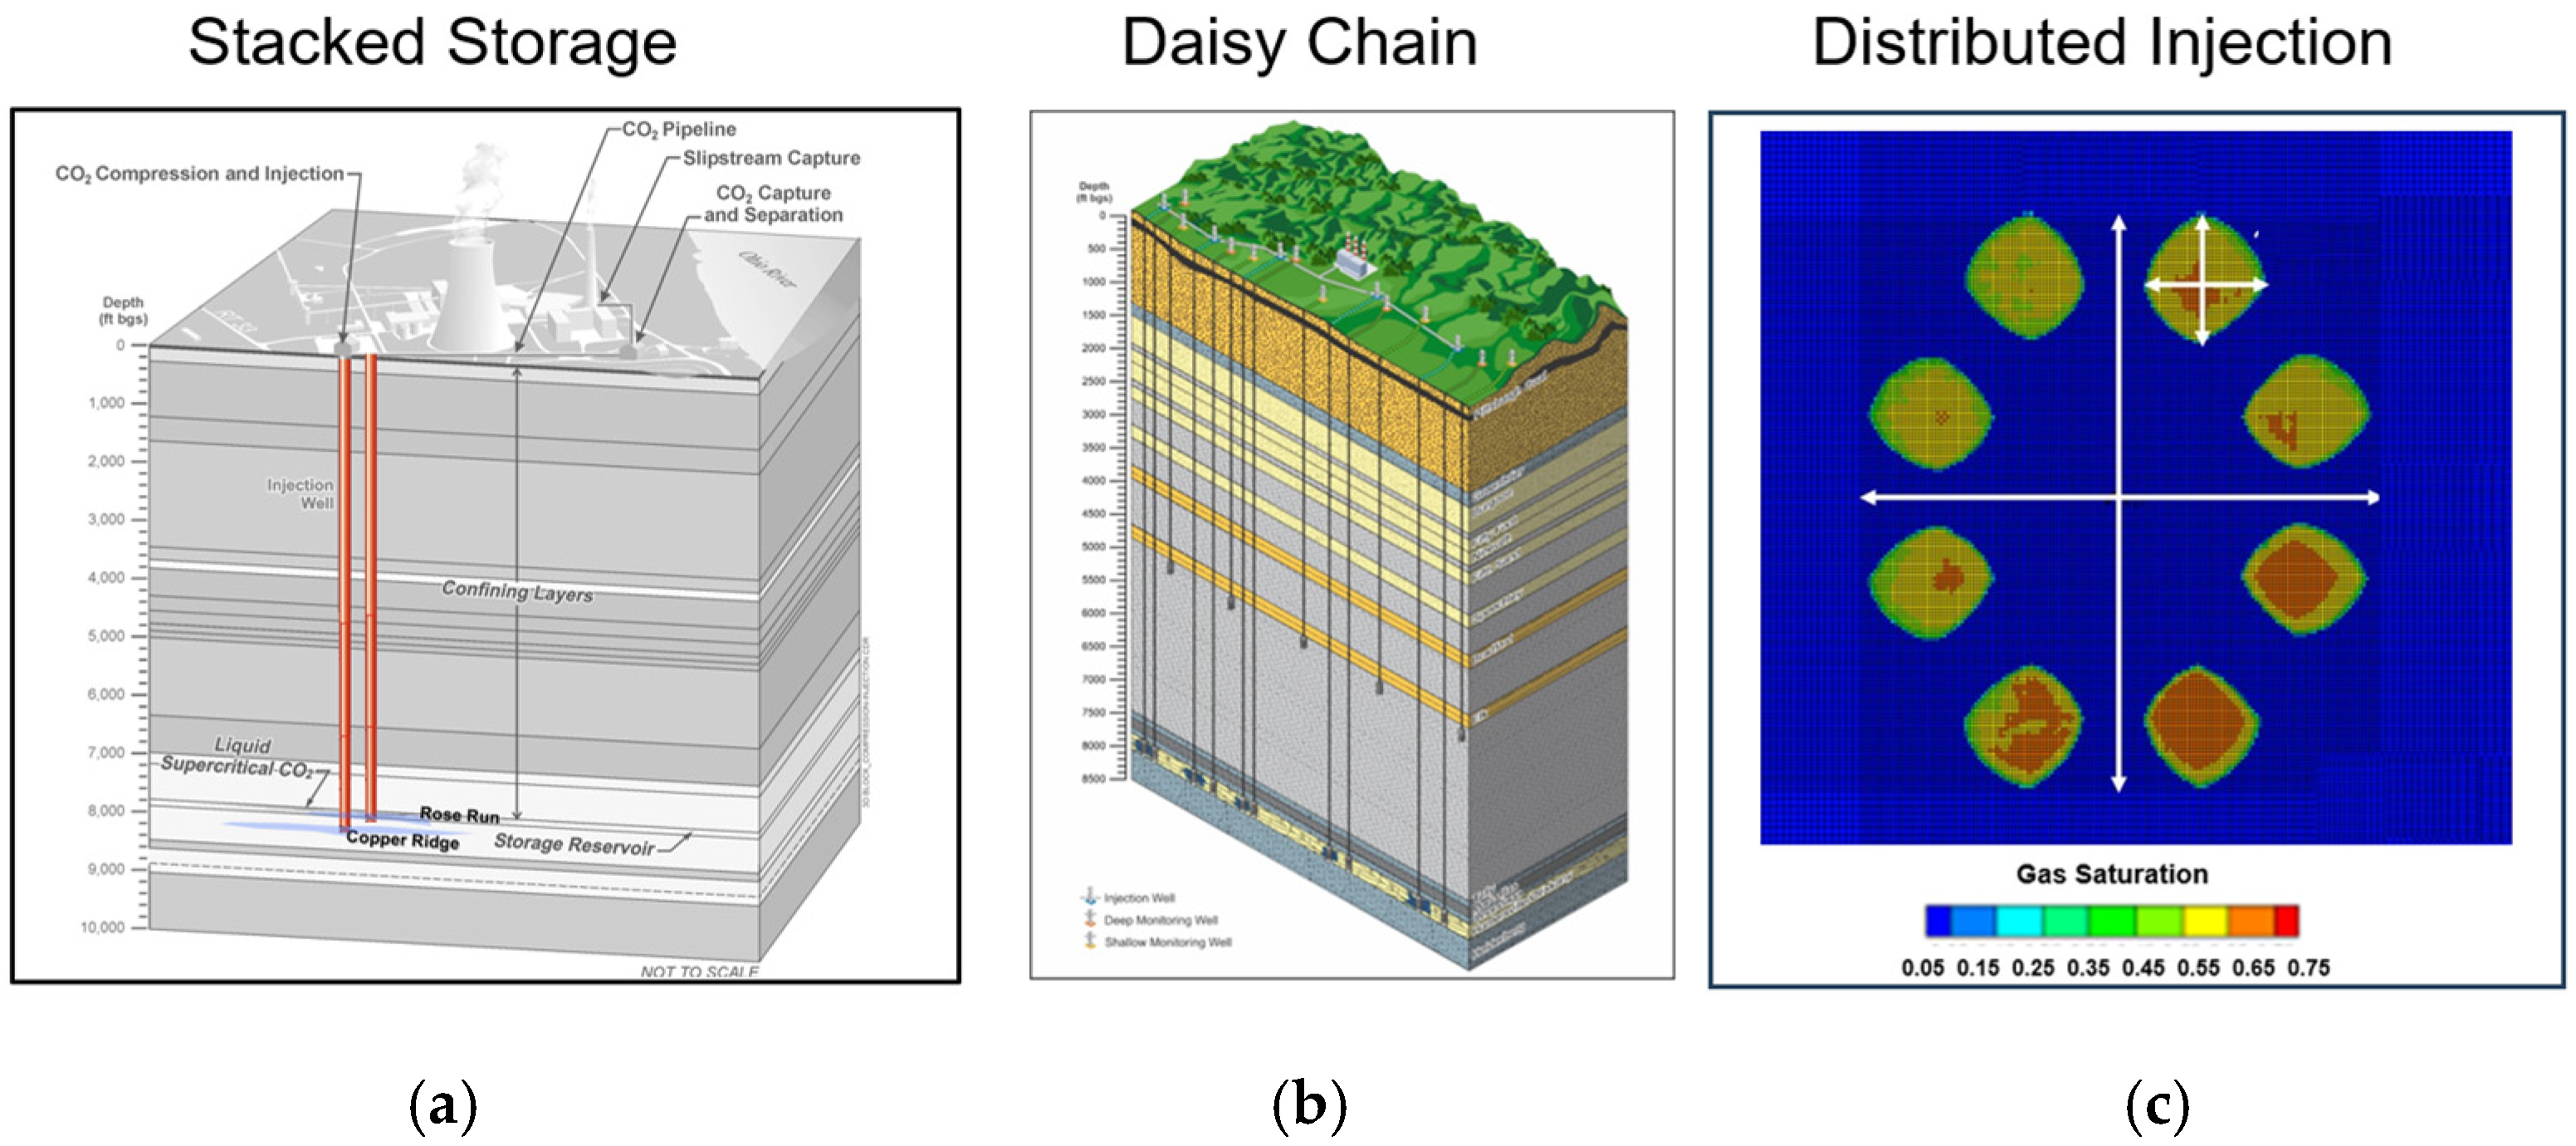
The three case studies previously discussed utilized various well designs in order to achieve commercial-scale injection. The conceptual design of each of the storage systems is showcased below in
Figure 12.
Utilization of these concepts and consideration of complex reservoirs (e.g., naturally fractured, depleted systems) commonly found in the Appalachian Basin paves a path for commercial-scale injection across the region. As detailed in
Section 4, the stacked storage model accommodated 1.5 MMT/yr with six injection wells, the distributed storage model managed 1.0 MMT/yr with eight wells, and the daisy-chain well model achieved 2.1 MMT/yr with six wells.
6.2. Relating Current US CCS Permit Activity to This Study
Several Class VI permits for CCS have been submitted and are in review for decarbonization projects in the Appalachian Basin [
42]. Tenaska, an energy utility and generation company, has submitted permit applications in Northern West Virginia, and Fidelis Energy has submitted applications in Western West Virginia. These companies plan to inject CO
2 into deep carbonate rocks of Appalachia, such as the Copper Ridge. Carbonates have not been discussed in detail in this study, as less data and more uncertainties are associated with deep carbonates with an oftentimes complex alteration history. The recent Class VI permit submissions also reflect this trend, as most permit-application submissions are currently for clastic rocks such as sandstones. However, as more data are collected and analyzed for carbonate reservoirs, their regional trends could be better understood for developing carbon-storage resources.
Additionally, it is possible that as more industries utilize geologic carbon storage as a decarbonization option, more depleted fields may be selected by decision-makers as viable options. Unlike many carbonate plays in the Appalachian Basin, clastic-depleted fields have a relatively high abundance of data such as well logs, core, production, seismic, and possibly injection data. For example, one depleted oil and gas permit has been approved in California to Carbon TerraVault (CTV), but several other permit applications are repurposing depleted oil and gas fields that are in review nationally [
42]. Moreover, depleted fields have the advantage of already having a proven seal that has kept oil and gas trapped for millions of years, and flooded depleted fields also ensure that legacy well integrity has been upheld. Repurposing depleted oil and gas fields will also have an emphasis on legacy well remediation. This study explores how these depleted fields could be developed in the future and highlights the major opportunities and limitations of various fields.
6.3. Geological Aspects of CCS in the Appalachian Basin
The old, hard rocks of Appalachia are challenging in regard to CO2 sequestration. Legacy depleted oil/gas fields, the “low-hanging fruit” of many basins, are problematic in an area with some of the oldest wells in the world, drilled before the hydrocarbon industry was adequately regulated. Incomplete or lost records have resulted in thousands of “orphan wells”, which are unplugged boreholes whose depth and location are not precisely known, forming a containment risk for any CO2 injection in some areas. Clastic reservoirs, another typical injection option, also have limitations. Fair to good quality Upper Devonian sands are often above the super-critical depth threshold, and older clastic reservoirs (such as the Cambrian Rose Run Sandstone) have been highly compacted and cemented, with low injectivities.
However, a possible storage upside exists in several rock formations, as described in this article. The complex structural history of the area has left Appalachia scarred with countless fault/fracture zones at regional to local scales. These zones often form conduits sourcing deep, hot fluids upward into the thick Cambro-Ordovician carbonates, creating secondary porosity from hydrothermal alteration [
43,
44,
45,
46]. Deep carbonate zones have shown evidence of hydrothermal porosity enhancement at various locations, suggesting these rocks are a significant potential storage resource [
47]. Lastly, research indicates that depleted shales, such as Appalachia’s prolific organic shales, may have the potential to store carbon while simultaneously enhancing gas production [
48].
7. Conclusions
These CO2 case studies illustrate the need for multiple injection wells and wellfield configurations for large-scale CO2 storage projects. A review of site-specific geology, injection simulations, and operational logistics for the Appalachian Basin demonstrates that well fields will require local pipeline distribution systems, metering, monitoring, and safety systems. Flow assurance calculations will also be required to determine CO2 flow rates, pressures, and temperature throughout the wellfield. CO2 buffer tanks or excess pipeline capacity may also be necessary to prevent interruptions in injection that could lead to hydrate buildup in the injection wells and/or local pipeline distribution system.
The injection well system configuration will also be an important factor in the wellfield design to prevent pressure interference and ensure injection wells can operate for 10–30 years. Geometric wellfield designs may be the most efficient design based on reservoir simulations. However, the geometry of the reservoir, land access constraints at the surface, and economic factors often favor a daisy-chain type injection design, or multiple lateral wells drilled off common well pads. These options tend to reduce the surface footprint of the injection system, which is often a major factor in facility development.
CCS in the Appalachian Basin is an important aspect of advances in energy transition, decarbonization, and economic development. This region of the U.S. has a dense concentration of power plants, chemical facilities, cement plants, refineries, and other industries that may be considering CCS. These three case studies illustrate both the opportunities and challenges of carbon storage in the Appalachian Basin. Since widespread geological storage resources are not present in the basin, more specialized CO2 storage system designs may be required to access storage resources. This may require more pipeline transport, injection wells, and monitoring infrastructure than a typical CO2 storage project. In addition, more exploration and characterization may be necessary to understand the distribution and hydraulics of these reservoirs. These CO2 storage designs also need to be validated with operational data from long-term field CO2 injection projects.
The Appalachian Basin was host to the first integrated CCS demonstration at an active coal-fired power plant in New Haven, West Virginia [
15,
16]. There are also more than 100 years of hydrocarbon exploration and production in the basin, supporting the feasibility of wide-scale subsurface operations in the region. Currently, many companies are developing CCS projects in the Appalachian Basin. Several permits for CO
2 injection wells have been submitted and are in review for decarbonization projects in the Appalachian Basin [
42]. These projects would benefit energy transition, increased power generation, and decarbonization developments in the region.
Author Contributions
Analysis and integration, J.S.; conceptualization, P.R.-G.; regional geology and geophysics, R.H.; geotechnical analysis, B.P.; reservoir simulations, J.H. All authors have read and agreed to the published version of the manuscript.
Funding
This work was supported by a sub-award for the CONSOL project Design Development and System Integration Design Study for an Advanced Pressurized Fluidized Bed Combustion Power Plant with Carbon Capture funded by the U.S. Department of Energy National Energy Technology Laboratory grant number DE-FE0031998. Additional support was provided through the U.S. Department of Energy Projects, including the Midwest Regional Carbon Initiative (Grant #DE-FE0031836) and the Mountaineer Ohio River Valley CO2 Storage Project DE-AC26-98FT40418.
Data Availability Statement
The original contributions presented in this study are included in the article. Further inquiries can be directed to the corresponding author. Reservoir simulations were completed with commercial computer programs.
Acknowledgments
The authors would like to acknowledge the U.S. Department of Energy National Energy Technology, CONSOL, and AEP for their support of CO2 storage research for the three case studies presented in this article. Neeraj Gupta (Battelle) provided research leadership on the projects. Significant support was provided by CONSOL via Stephen Winter, Evan Blumer, and Dan Connell. The Ohio Geological Survey, Pennsylvania Geological Survey, and West Virginia Geological and Economic Survey provided valuable assistance in regional geology analysis.
Conflicts of Interest
The authors declare no conflicts of interest. The funders of the research provided general information on the volume of CO2 for the CO2 storage analysis, but there was no influence on the collection, analyses, or interpretation of data or writing of the manuscript.
Abbreviations
The following abbreviations are used in this manuscript:
| CCS | carbon capture and storage |
| CO2 | carbon dioxide |
| DRM | dynamic reservoir model |
| md | millidarcy |
| MPa | megapascal |
| MT | metric tons |
| MMT | million metric tons |
| SEM | static earth model |
References
- Michael, K.; Golab, A.; Shulakova, V.; Ennis-King, J.; Allinson, G.; Sharma, S.; Aiken, T. Geological storage of CO2 in saline aquifers—A review of the experience from existing storage operations. Int. Jrn. Greenh. Gas. Control 2010, 4, 659–667. [Google Scholar] [CrossRef]
- Myer, L. Global Status of Geologic CO2 Storage Technology Development; U.S. Carbon Sequestration Council: Washington, DC, USA, 2011. [Google Scholar]
- Kheshgi, H.; de Coninck, H.; Kessels, J. Carbon dioxide capture and storage: Seven years after the IPCC special report. Mitig. Adapt. Strat. Glob. Change 2012, 17, 563–567. [Google Scholar] [CrossRef]
- Leung, D.; Caramanna, G.; Maroto-Valer, M. An overview of current status of carbon dioxide capture and storage technologies. Renew. Sustain. Energy Rev. 2014, 39, 26–443. [Google Scholar] [CrossRef]
- Raza, A.; Gholami, R.; Rezaee, R.; Rasouli, V.; Rabiei, M. Significant aspects of carbon capture and storage—A review. Petroleum 2019, 5, 335–340. [Google Scholar] [CrossRef]
- Damiani, D. Safe Geologic Storage of Captured Carbon Dioxide: Two Decades of DOE’s Carbon Storage R&D Program in Review; US DOE Office of Fossil Energy: Washington, DC, USA, 2020. [Google Scholar]
- International Energy Agency. Net Zero by 2050: A Roadmap for the Global Energy Sector; Revised Version; IEA: Paris, France, 2021. [Google Scholar]
- Carbon Sequestration Leadership Forum. The Carbon Sequestration Leadership Forum (CSLF) Technology Roadmap; CSLF Publications: Washington, DC, USA, 2021. [Google Scholar]
- Rodosta, T.; Litynski, J.; Plasynski, S.; Spangler, L.; Finley, R.; Steadman, E.; Vikara, D. US Department of Energy’s regional carbon sequestration partnership initiative: Update on validation and development phases. Energy Procedia 2011, 4, 3457–3464. [Google Scholar] [CrossRef]
- Gupta, N.; Ball, D.; Sminchak, J.; Gerst, J.; Kelley, M.; Place, M.; Bradbury, J.; Cumming, L. Geologic storage field tests in multiple basins in Midwestern USA–Lessons learned implications for commercial deployment. Energy Procedia 2011, 4, 5565–5572. [Google Scholar] [CrossRef]
- Cumming, L.; Hawkins, J.; Sminchak, J.; Valluri, M.; Gupta, N. Researching candidate sites for a carbon storage complex in the Central Appalachian Basin, USA. Int. J. Greenh. Gas. Control 2019, 88, 168–181. [Google Scholar] [CrossRef]
- Valluri, M.; Sminchak, J.; Cumming, L.; Main, J. and Larsen Leveraging operational information from wastewater injection wells to evaluate CO2 injection performance for carbon storage applications in the Appalachian Basin. Greenhouse Gas. Sci. Technol. 2020, 10, 268–282. [Google Scholar] [CrossRef]
- Lewis, E.; Moore, J.; McDowell, R.; Carter, K.; Dinterman, P.; Harrison, W.; Medina, C.; Ortt, R.; Slater, B.; Solis, M.; et al. The Midwest Regional Carbon Sequestration Partnership petroleum fields database: Compilation, utilization, and support for CCUS activities. Environ. Geosci. 2021, 28, 25–32. [Google Scholar] [CrossRef]
- Sminchak, J.; Jagucki, P.; Gerst, J.; Gupta, N. Exploring New Geosequestration Horizons in the Appalachian Basin: Midwest Regional Carbon Sequestration Partnership, R.E. Burger Test Site. In Proceedings of the 2007 AAPG Eastern Section Meeting, Lexington, KY, USA, 16–18 September 2007. [Google Scholar]
- Gupta, N.; Kelley, M.; Osborne, R.; Moody, M.; Gerst, J.; Mishra, S.; Howat, E.; Sullivan, C.; Spitznogle, G.; Bhattacharya, I.; et al. Development of conceptual design for commercial-scale geologic storage and monitoring system at American Electric Power Mountaineer Plant. Energy Procedia 2013, 37, 6156–6169. [Google Scholar] [CrossRef]
- McNeil, C.I.; Bhattacharya, T.; Lohner, H.J.; Holley, M.; Kennedy, S.; Mawalkar, N.; Gupta, S.; Mishra, R.; Osborne, M. Kelley. Lessons Learned from the Post-injection Site Care Program at the American Electric Power Mountaineer Product Validation Facility. Energy Procedia 2014, 63, 6141–6155. [Google Scholar] [CrossRef]
- Baily, S.; Grove, B.; Seligman. A New Look at Carbon Capture and Storage Opportunities in Pennsylvania Geologic Analysis Prepared by Advanced Resources International for the Clean Air Task Force. Available online: https://www.catf.us/resource/new-look-carbon-capture-storage-opportunities-pennsylvania/ (accessed on 21 April 2024).
- Canal, J.; Thibeau, S.; Seldon, R.L.; Masserano, F. Revisiting the Appalachian Basin for CO2 Storage Resources Using the SRMS Classification Framework. In Proceedings of the 14th International Conference on Greenhouse Gas Control Technologies, GHGT-14, Melbourne, Australia, 21–26 October 2018. [Google Scholar] [CrossRef]
- Donaldson, A.C.; Shumaker, R.; Laughrey, C.; Aminian, K.; Hohn, M.E. Measuring and Predicting Reservoir Heterogeneity in Complex Deposystems; Report DE93014539; Appalachian Oil and Natural Gas Research Consortium: Morgantown, WV, USA, 1996. [Google Scholar]
- Hatcher, D. The Appalachian orogen: A brief summary. Mem. Geol. Soc. Am. 2010, 206, 1–19. [Google Scholar] [CrossRef]
- Ettensohn, F.R. The Appalachian foreland basin in eastern United States, Sedimentary Basins of the world. In Sedimentary Basins of the United States and Canada; Miall, A.D., Ed.; Elsevier Science: Amsterdam, The Netherlands, 2008; Volume 5, pp. 105–179. [Google Scholar]
- Faill, R.T. A geologic history of the north-central Appalachians; Part 2, The Appalachian Basin from the Silurian through the Carboniferous. Am. J. Sci. 1997, 297, 729–761. [Google Scholar] [CrossRef]
- Mason, G.L. Depositional environment of the Early Ordovician Rose Run sandstone as inferred by core analysis. In Proceedings of the Ohio Geological Society Fourth Annual Technical Symposium, Hocking County, OH, USA, 9 October 1996; pp. 77–90. [Google Scholar]
- Bowersox, J.; Greb, S.; Harris, D. Reservoir properties and CO2 storage capacity of the Rose Run Sandstone (Lower Ordovician, Knox Group) in the Central Appalachian Basin, northeast Kentucky. Front. Energy Res. 2022, 10, 832969. [Google Scholar] [CrossRef]
- Greb, S.F.; Bowersox, J.R.; Solis, M.; Harris, D.C.; Riley, R.A.; Rupp, J.A.; Kelley, M.; Gupta, N. Ordovician Knox Carbonates and Sandstones of the Eastern Mid-continent: Potential Geologic Carbon Storage Reservoirs and Seals. In Great American Carbonate Bank; GeoScienceWorld: McLean, VA, USA, 2012. [Google Scholar] [CrossRef]
- Ryder, R.T.; Zagorski, W.A. Nature, origin, and production characteristics of the Lower Silurian regional oil and gas accumulation, central Appalachian Basin, United States. AAPG Bull. 2003, 87, 847–872. [Google Scholar] [CrossRef]
- Hawkins, J.; Mishra, S.; O’Reilly, B. Dev. porosity–permeability transforms in two important oil-bearing formations in Ohio: The Clinton Sandstone the Copper Ridge Dolomite. Env. Geosci. 2019, 26, 1–20. [Google Scholar] [CrossRef]
- Hickman, J.B. Major Lower Paleozoic Horizons of the Southern Illinois Basin: Kentucky Geological Survey. Res. Investig. 2005, 57. [Google Scholar] [CrossRef]
- Patchen, D.G.; Hohn, M.E.; Avary, K.L. Trenton-Black River Reservoir Characterization in the Appalachian Basin; West Virginia Geological and Economic Survey: Cheat Lake, WV, USA, 2013. [Google Scholar]
- Bruner, K.R. Depositional Environments, Petrology, and Diagenesis of the Oriskany Sandstone in the Subsurface in West Virginia. Ph.D. Thesis, West Virginia University, Morgantown, WV, USA, 1991. [Google Scholar]
- In the Subsurface in West Virginia. Graduate Theses, Dissertations, and Problem Reports 1991, 8542. Available online: https://researchrepository.wvu.edu/etd/8542 (accessed on 10 October 2024).
- Harper, J.A.; Patchen, D.G. Play Dos: The Lower Devonian Oriskany Sandstone Structural Play. West Va. Geo. Eco. Surv. Pub. 1996, 25, 109–117. [Google Scholar]
- Carter, K.M.; Kostelnik, J.; Laughrey, C.; Harper, J.A.; Barnes, D.A..; Harrison, W.B., III; Venteris, E.R.; McDonald, J.; Wells, J.G.; Wickstrom, L.H.; et al. Characterization of Geologic Sequestration Opportunities in the MRCSP Region, Middle Devonian-Middle Silurian Formations-MRCSP Phase II Topical Report, October 2005–October 2010: Midwest Regional Carbon Sequestration Partnership, Report Submitted to Battelle Memorial Institute and U. S. Department of Energy, Cooperative Agreement No. DE-FC26-05NT42589, 1–150. Available online: https://www.researchgate.net/publication/303197438_Characterization_of_geologic_sequestration_opportunities_in_the_MRCSP_region_Middle_Devonian_-_Middle_Silurian_Formations (accessed on 15 September 2024).
- Zagorski, W.; Emery, M.; Ventura, J. The Marcellus Shale Play: Its Discovery Emergence as a Major Global Hydrocarbon Accumulation. In Giant Fields of the Decade 2000–2010: AAPG Memoir; Merrill, R.K., Sternbach, C.A., Eds.; American Association of Petroleum Geologists: Tulsa, OK, USA, 2017; Volume 113, pp. 55–90. [Google Scholar]
- Sminchak, J.R.; Miller, J.; Ravi-Ganesh, P. Development of a Framework for Brine Disposal Wells in the Northern Appalachian Basin Based on Operational and Geologic Information. In Proceedings of the Ground Water Protection Council 2014 Underground Injection Control Conference, New Orleans, LA, USA, 23 January 2014. [Google Scholar]
- Wickstrom, L.H.; Venteris, E.R.; Harper, J.A.; McDonald, J.; Slucher, E.R.; Carter, K.M.; Greb, S.F.; Wells, J.G.; Harrison, W.B.; Nuttall, B.C.; et al. 2005, Characterization of Geologic Sequestration Opportunities in the MRCSP Region, Phase I Task Report: Prepared by the Ohio Division of Geological Survey Under Subcontract to Battelle Memorial Institute; Reaserch Performed under U.S. Department of Energy, DOE Cooperative Agreement No. DE-PS26-05NT42255, 152p. Available online: https://dam.assets.ohio.gov/image/upload/ohiodnr.gov/documents/geology/OFR2005_1_Wickstrom_2010.pdf (accessed on 15 August 2024).
- Bowersox, R.J.; Hickman, J.; Leetaru, H. An Evaluation of the Carbon Sequestration Potential of the Cambro-Ordovician Strata of the Illinois and Michigan Basins; Part 1. Evaluation of Phase 2 CO2 injection testing in the deep saline Gunter Sandstone reservoir (Cambro-Ordovician Knox Group), Marvin Blan No. 1 Hancock County, Kentucky. Topical Report DOE/FE0002068-3; U.S. Department of Energy: Washington, DC, USA, 2013; 90p. [Google Scholar]
- Raziperchikolaee, S.; Alvarado, V.; Yin, S. Effect of hydraulic fracturing on long-term storage of CO2 in stimulated saline aquifers. Appl. Energy 2013, 102, 1091–1104. [Google Scholar] [CrossRef]
- White, M.; Gupta, N.; Kelley, M.; Sminchak, J. Assessment of CO2 injection at the Mountaineer power plant site using scalable numerical simulation. Greenh. Gas Control. Technol. 2005, 7, 2269–2272. [Google Scholar]
- White, D. Monitoring CO2 Storage during EOR at the Weyburn-Midale Field. Lead. Edge 2009, 28, 838–842. [Google Scholar] [CrossRef]
- Ravi Ganesh, P.; Hershberger, J.; Vance, T.; Skopec, S.; Chundur, S.; Kelley, M.; Gupta, N. Adapting Oilfield Operational Strategies for Optimizing Injectivity in Complex CCS Systems—A Scoping Study. In Proceedings of the SPE Western Regional Meeting, Palo Alto, CA, USA, 16–18 April 2024. [Google Scholar]
- Alumbaugh, D.; Correa, J.; Jordan, P.; Petras, B.; Chundur, S.; Abriel, W. An assessment of the role of geophysics in future U.S. Geol. Carbon. Storage Proj. Lead. Edge 2024, 43, 72–83. [Google Scholar]
- Smith, L.B. Hydrothermal dolomite reservoirs in the Trenton-Black River formations of eastern North America. AAPG Bull. 2006, 90, 891–914. [Google Scholar]
- Smith, L.B. Origin and Reservoir Characteristics of Hydrothermal Dolomite Reservoirs in the Beekmantown Group, Appalachian Basin. AAPG Bull. 2006, 90, 1599–1622. [Google Scholar] [CrossRef]
- Davies, G.R.; Smith, L.B., Jr. Structurally controlled hydrothermal dolomite reservoir facies: An overview. AAPG Bull. 2006, 90, 1641–1690. [Google Scholar] [CrossRef]
- Wickstrom, L.H.; Slucher, E.R.; Baranoski, M.T. Geologic Assessment of the Burger Power Plant and Surrounding Vicinity for Potential Injection of Carbon Dioxide; Ohio Department of Natural Resources Open-File Report, Prepared for Midwest Regional Carbon Sequestration Partnership; Ohio Department of Natural Resources: Columbus, OH, USA, 2008; Volume 52. [Google Scholar]
- Hunt, R.; Petras, B.; James, D. Hydrothermal reservoirs as a CO2 storage resource in Appalachia. In Third International Meeting for Applied Geoscience Energy Expanded Abstracts; Society of Exploration Geophysicists and American Association of Petroleum Geologists: Houston, TX, USA, 2023; pp. 351–355. [Google Scholar]
- Wu, J.; Huang, P.; Shen, L. Microscale modeling of CO2 injection techniques for enhanced methane recovery and carbon storage. Sep. Purif. Technol. 2025, 360, 131208. [Google Scholar] [CrossRef]
Figure 1.
Tectonic setting and location of the regional assessment area in the Appalachian Basin.
Figure 1.
Tectonic setting and location of the regional assessment area in the Appalachian Basin.
Figure 2.
Geologic column for general stratigraphy in the Appalachian Basin illustrating confining units and CO2 storage reservoirs.
Figure 2.
Geologic column for general stratigraphy in the Appalachian Basin illustrating confining units and CO2 storage reservoirs.
Figure 3.
Porosity/permeability transform for the Copper Ridge Dolomite with 10%, 50%, and 90% probability percentiles [
27].
Figure 3.
Porosity/permeability transform for the Copper Ridge Dolomite with 10%, 50%, and 90% probability percentiles [
27].
Figure 4.
Conceptual diagram showing hydrothermal enhancement of Copper Ridge rock properties. Blue arrows indicate meteoric water migration and red arrows indicate migration of formation waters (Reprinted with permission from John Hickman [
28]).
Figure 4.
Conceptual diagram showing hydrothermal enhancement of Copper Ridge rock properties. Blue arrows indicate meteoric water migration and red arrows indicate migration of formation waters (Reprinted with permission from John Hickman [
28]).
Figure 5.
Conceptual diagram of Oriskany/Huntersville folding in the Appalachian foreland. The folding creates fractures, enhancing the reservoir quality. Red arrows indicate fault movement.
Figure 5.
Conceptual diagram of Oriskany/Huntersville folding in the Appalachian foreland. The folding creates fractures, enhancing the reservoir quality. Red arrows indicate fault movement.
Figure 6.
Contour plots of (a) pressure buildup and (b) CO2 saturation for the 2-site 3-well injection scenario at the end of the 5-year injection period, illustrating the stratified nature of injected CO2.
Figure 6.
Contour plots of (a) pressure buildup and (b) CO2 saturation for the 2-site 3-well injection scenario at the end of the 5-year injection period, illustrating the stratified nature of injected CO2.
Figure 7.
Aerial view of the gas saturation plumes in the commercial injection scenario at the end of the 30-year injection period for an 8-well injection scenario in the Oriskany Sandstone.
Figure 7.
Aerial view of the gas saturation plumes in the commercial injection scenario at the end of the 30-year injection period for an 8-well injection scenario in the Oriskany Sandstone.
Figure 8.
Three-dimensional view of the Lower Devonian Huntersville/Oriskany CO2 storage system.
Figure 8.
Three-dimensional view of the Lower Devonian Huntersville/Oriskany CO2 storage system.
Figure 9.
Cross-sectional view of the CO2 plume (color bar represents CO2 saturation) after 5 years of injection (a) and 10 years of injection (b) into the Huntersville model.
Figure 9.
Cross-sectional view of the CO2 plume (color bar represents CO2 saturation) after 5 years of injection (a) and 10 years of injection (b) into the Huntersville model.
Figure 10.
Cumulative gas injection over time(dates), noting that once the field operates 8 injection wells, the commercial-scale rate of 1.0 MMT/yr has been achieved for the distributed well model.
Figure 10.
Cumulative gas injection over time(dates), noting that once the field operates 8 injection wells, the commercial-scale rate of 1.0 MMT/yr has been achieved for the distributed well model.
Figure 11.
Cross-sectional view of the matrix permeability with perforations placed in the Huntersville and the underlying Oriskany for a potential stacked storage play. The injector well location is noted in red and perforations in black for the daisy-chain well-design model.
Figure 11.
Cross-sectional view of the matrix permeability with perforations placed in the Huntersville and the underlying Oriskany for a potential stacked storage play. The injector well location is noted in red and perforations in black for the daisy-chain well-design model.
Figure 12.
Conceptual diagram illustrating (a) stacked storage 3D diagram, (b) daisy-chain 3D diagram, and (c) distributed injection CO2 storage system design planar diagram.
Figure 12.
Conceptual diagram illustrating (a) stacked storage 3D diagram, (b) daisy-chain 3D diagram, and (c) distributed injection CO2 storage system design planar diagram.
Table 1.
Average reservoir parameters for the stacked storage model.
Table 1.
Average reservoir parameters for the stacked storage model.
| Flow Unit | Depth (m) | Total Thickness (m) | Porosity (%) | Permeability (md) |
|---|
| Rose Run | 2150 | 12 | 5.1 | 7.0 |
| Upper Copper Ridge | 2300 | 16 | 7.9 | 778.0 |
| Lower Copper Ridge | 2330 | 10 | 7.8 | 38.0 |
Table 2.
Injection rate allocation for the stacked storage scenario.
Table 2.
Injection rate allocation for the stacked storage scenario.
| Injection Reservoir | Injection Rate (MT/yr) |
|---|
| Rose Run | 40 K (5%) |
| Upper Copper Ridge | 490 K (65%) |
| Lower Copper Ridge | 220 K (30%) |
Table 3.
Maximum pressure buildup for the stacked storage scenario.
Table 3.
Maximum pressure buildup for the stacked storage scenario.
| Injection Reservoir | Maximum Pressure (psi) |
|---|
| Rose Run | 5140 |
| Upper Copper Ridge | 4790 |
| Lower Copper Ridge | 6240 |
Table 4.
Summary of dynamic modeling scenarios for the distributed storage model.
Table 4.
Summary of dynamic modeling scenarios for the distributed storage model.
| Scenario Name | Variable of Interest |
|---|
Single Well,
Heterogeneous Reservoir | Reference Vertical well; Oriskany injection zone in heterogeneous model realization |
Single Well,
Homogeneous Reservoir | Reference Vertical well; Timur permeability realization in equivalent homogeneous model; Oriskany injection zone |
Multiple Injection Wells,
Homogeneous Reservoir | Multiple injection wells for commercial scenario; Timur permeability realization in equivalent homogeneous model; Oriskany injection zone |
Table 5.
Summary of cumulative CO2 injected and plume dimensions for the reference heterogeneous and homogeneous model, as well as the commercial homogenous model.
Table 5.
Summary of cumulative CO2 injected and plume dimensions for the reference heterogeneous and homogeneous model, as well as the commercial homogenous model.
| Scenario 1 | Wells | Cumulative CO2 (MMT) | Plume Diameters
(X, Y) (km) |
|---|
Single Well,
Heterogeneous Reservoir | 1 | 12 | 8, 9.7 |
Single Well,
Homogeneous Reservoir | 1 | 7 | 4.8, 4.8 |
Multiple Injection Wells,
Homogeneous Reservoir | 8 | 32 | 3.9, 3.5 |
| Disclaimer/Publisher’s Note: The statements, opinions and data contained in all publications are solely those of the individual author(s) and contributor(s) and not of MDPI and/or the editor(s). MDPI and/or the editor(s) disclaim responsibility for any injury to people or property resulting from any ideas, methods, instructions or products referred to in the content. |
© 2025 by the authors. Licensee MDPI, Basel, Switzerland. This article is an open access article distributed under the terms and conditions of the Creative Commons Attribution (CC BY) license (https://creativecommons.org/licenses/by/4.0/).


