Abstract
In this paper, results of comparative studies on the positive lightning impulse breakdown voltage (LIBV) and accelerating voltage (Va) of six insulating liquids of different chemical composition are presented. This paper discusses the behavior of uninhibited naphthenic mineral oil (UMO), inhibited naphthenic mineral oil (IMO), natural ester (NE), synthetic ester (SE), and two modern dielectric fluids: bio-based hydrocarbon (BIO) and inhibited liquid produced using Gas-to-Liquids (GTL) technology. Measurements are taken in a point-to-sphere electrode system for two selected gap distances: 25 mm (which is suggested by the IEC 60897 standard) and 40 mm. After analyzing the obtained results, it is noted that positive LIBV does not differ significantly between the tested liquids. Noticeable differences are observed, however, for Va. The lowest values of this parameter characterize ester liquids, which is consistent with the common knowledge in this field. In addition, the obtained values of LIBV and Va are used to evaluate the maximum values of electric field intensity through the application of simulations for each specific case based on the finite element method. These simulations confirm that, for a given parameter, maximum electric field stress is on similar level, regardless of the gap distance. This proves that the breakdown and appearance of fast discharges are determined by specific field conditions.
1. Introduction
The fundamental elements of a power system are power transformers. Most of them are units with so-called paper–oil insulation. Transformer windings are immersed in a tank filled with an oil (dielectric liquid in general) in order to provide an appropriate level of insulation, impregnate the solid insulation, and dissipate heat generated in the transformer. Dielectric liquids also fulfill additional functions, when considering the goal of failure-free operation of the transformer. They protect the solid insulation from moisture or air, improve the electrical strength of the pressboard and paper, protect the transformer against corrosion, and are a medium for extinguishing electric arcs [1,2]. The most commonly used dielectric liquid is mineral oil, which is produced by refining crude oil. Growing awareness of ecological and sustainable development has contributed to an increased intensity and progress of work on alternative insulating fluids [1,2,3,4,5]. Due to the constant development and pursuit of the greatest possible availability of electricity, more and more transformers are operating in national parks, near drinking water intakes, or near offshore wind farms, i.e., in places where the leakage of conventional mineral oil would be destructive to the natural environment. This is the reason for the increasing tendency to use biodegradable dielectric liquids, such as esters (natural or synthetic), insulating liquids based on hydrocarbons of biological origin, or those produced using Gas-to-Liquids (GTL) technology. It is not only the need for environmental protection that contributes to this use of alternative dielectric liquids: it is also caused by, for example, units operating in difficult environmental conditions, where there is an increased risk of fire or very low temperatures. The use of mineral oil is also ineffective in such conditions as, e.g., mineral oil has a relatively low flash point. That is why new dielectric liquids are appearing on the market, exhibiting properties that allow them to meet increasing requirements [2,3,4,5,6,7].
A significant aspect of this is the proper testing of newly introduced liquids in terms of their electrical strength at alternating (AC) or lightning impulse (LI) voltages. Appropriate standards have been developed describing the methods that should be used for determining these dielectric features [8,9]. The electrical strengths of these liquids at AC voltage are usually very similar to each other when considering them either in their pre-treated form or in a form ready to be applied in high-voltage equipment. More ambiguity occurs when performing tests at lightning impulse voltage. Nevertheless, standardized tests of breakdown voltages at alternating or lightning impulse voltages seem to be insufficient [10,11,12,13]. The parameter of acceleration voltage at lightning impulse voltage, designated in the literature as Va, is also increasingly used, including by the authors of this paper [12,13,14,15,16,17,18,19,20,21]. Va is defined as a value of voltage at which a sudden increase in the propagation velocity of electric discharges is observed with increasing testing voltage. It is determined for the non-uniform electric fields represented by point–plane or point–sphere electrode gaps. Va, introduced for the first time by Lesaint [14], describes the value of voltage at which the change in the propagation mode of streamers may be clearly recognized solely on the basis of the evaluated propagation velocity. When discharges propagate with the velocity in the range of 1–4 mm/µs, they are called slow discharges and are designated to the slow-mode discharges. When the propagation velocity moves into 8–10 mm/µs or higher, the discharges are called fast and are designated to the fast mode. When the latter starts to develop, the formation of a highly energetic discharge channel is noticed, which leads to greater exposure of the solid insulation of the insulating system. Therefore, higher values of acceleration voltage are desirable for the dielectric liquid. Acceleration voltage was first introduced to explain the physical processes of breakdown in liquids, mainly of a hydrocarbon nature [14,16,17,22,23]. Since then, however, with the introduction of alternative dielectric liquids, Va has become a parameter of comparative significance, used to assess the differences in lightning performance of mineral oils and ester liquids [12,13,15,21].
Based on data available in the literature, it may be stated that at lightning impulse stress, lightning impulse breakdown voltage (LIBV) is more or less at a similar level for liquids of different origins [10,11,12,13]. This statement is true for both voltage polarities and mostly small gaps. For wider gaps, and especially for negative-polarity LI voltages, LIBV becomes higher for hydrocarbon-based liquids such as mineral oils (MOs) or GTLs [11,12,13,20]. In turn, when results on acceleration voltage are considered, significant differences are shown between liquids of different chemical origins which affect both their physical and electrical properties, such as heat of vaporization, ionization potential, etc. Due to polar molecules of lower ionization potential occurring in ester liquids, those liquids are characterized by much lower Va values than hydrocarbons [12,13,15,18]. Thus, long-accepted principles for transformer designs cannot be uncritically transferred to applications involving non-hydrocarbon-based dielectric liquids, and their properties require further investigation.
Thus far, tests designed by the authors of this paper and conducted using the same methodology and the same electrode configuration as presented here have been summarized in terms of negative polarity in the paper [20], wherein the same was discussed. In addition, the lightning performance of GTL-based liquids (four types), in terms of negative and positive polarity for a 25 mm gap distance, was discussed in [21] in relation to old Diala products of petroleum origin. Limited results have also been presented in [19]; however, none of the mentioned references have discussed collectively the positive-polarity behavior of a set of dielectric liquids of different origins.
Hence, in this paper, a comprehensive approach to assessing the dielectric behavior of a variety of insulating liquids is proposed with a focus on the positive polarity of lightning impulse voltage. Currently, as mentioned above, one of the most commonly used indicators for assessing the dielectric properties of liquids in the field of lightning performance is LIBV, which is determined largely according to the quoted standard [8]. However, due to the well-known fact that the LIBV of liquid dielectrics is not an objective factor describing lightning performance, the above-mentioned indicator of acceleration voltage is also used to show the lightning behavior of the liquids in a wider form. The liquids taken into account in this study represent a wide range of available materials; therefore, this study presents a complex assessment of different liquids, which has not been carried out up until now. Furthermore, the structure of the tests performed has a comprehensive nature, which significantly authenticates the conclusions drawn. Tests were carried out for positive lightning impulse voltage in a point-to-sphere electrode system for two inter-electrode gaps (25 mm and 40 mm).
2. Measurement Setup and Methodology
The following liquid dielectrics were the subject of the comparative tests:
- -
- naphthenic uninhibited mineral oil (UMO);
- -
- inhibited mineral oil (IMO);
- -
- soybean-based natural ester (NE);
- -
- pentaerythritol-based synthetic ester (SE);
- -
- bio-based hydrocarbon (BIO);
- -
- dielectric liquid made using Gas-to-Liquids technology (GTL).
First, two liquids commonly applied in transformers for many years were treated as reference liquids, to which the others, being biodegradable alternatives, were compared.
Table 1 summarizes the basic physicochemical properties of the mentioned liquids.

Table 1.
Basic physicochemical properties of the tested liquids.
In order to be sure that the liquid’s quality did not disturb the lightning tests, measurements of the moisture content using the Karl Fischer method and the AC breakdown voltage in accordance with the [9] were carried out. For all of the liquids, the AC breakdown voltage was clearly greater than 70 kV. In turn, the moisture content was less than 5 ppm for UMO, IMO, BIO, and GTL, and less than 50 ppm for NE and SE. This confirms that the liquids considered were of sufficient enough quality.
Figure 1 presents schematically the planned laboratory setup for the tests.
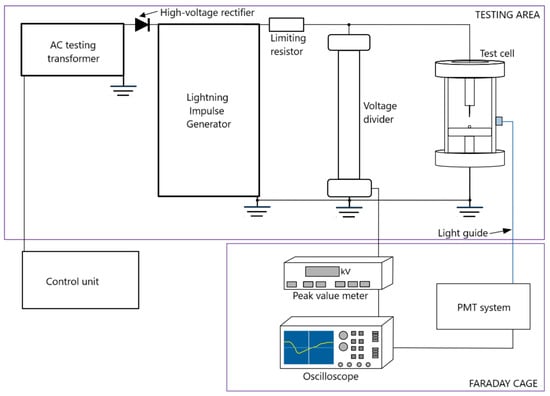
Figure 1.
Schematic illustration of the experimental setup.
The voltage source was a lightning impulse Marx generator with a rated voltage of 450 kV. However, although the nominal voltage of this generator is as high as 450 kV, during the experimental tests the value of 330 kV was not exceeded as a limit of the laboratory test room. The generator allowed for the generation of standard lightning impulse voltage with characteristic times: T1 = 1.2 µs ± 30% and T2 = 50 µs ± 20%. It was powered by a TP110 testing transformer with a voltage ratio of 110,000/230 V, and voltage was rectified using a matched high-voltage rectifier. The peak voltage value was measured using a resistive voltage divider and a peak value meter. The signal from divider was also recorded on an oscilloscope to show the actual shape of the voltage waveform. Lightning impulse voltage was supplied to the point–sphere electrode system located in a cylindrical test cell, connected to the generator via a limiting resistor. The design of the test cell was a modification of the system described in the standard [8]. The volume of the test cell was about 5 liters. As mentioned above, a point–sphere electrode system was used for the tests. The radius of curvature of the point electrode was 50 µm and it was made of tungsten. The grounded sphere electrode was a polished steel bearing ball with a diameter of 13 mm. This was mounted with a magnet. A diagram of the electrode system used is shown in Figure 2.
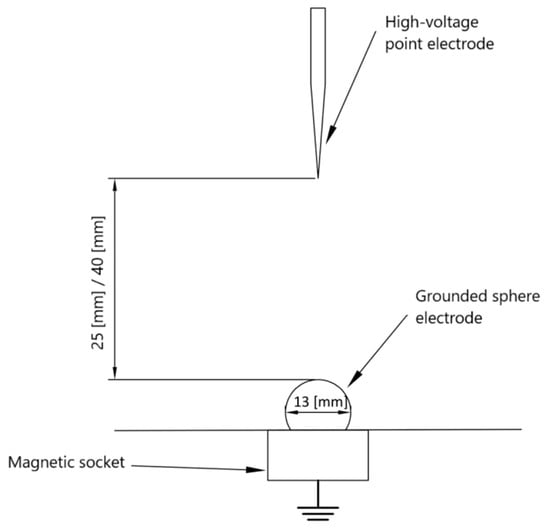
Figure 2.
Electrode system used in the tests.
A light guide was attached to the test cell as per Figure 1, which was a part of the light detection system. It is assumed that registering the light emitted by developing discharges may determine the degree of ionization of discharge channels [6,12,13,14,15,21]. However, the absorption and scattering of light by the liquid cause problems during its detection; hence, a sufficiently sensitive optical instrument such as a photomultiplier (PMT) must be used for the purpose of light detection. The amount of light reaching the end of the light guide is very limited, so the PMT must be selected appropriately. In addition, the PMT should be selected with regard to the wavelength range in which light emitted during discharge propagation will be contained. The spectrum of light emitted during discharges of positive and negative polarity in mineral oil is in the range of 350 nm to 700 nm [31,32,33], so for this range the Hamamatsu R1925 photomultiplier was applied with designated equipment in the form of a socket, a power supply, and an amplifier. In order to present the results of light detection as a time-related response, the output signal from the PMT was transmitted to a digital oscilloscope. Thanks to this, a time course was generated, which corresponded to light pulses of discharge. An oscilloscope with a high sampling rate of 5 GS/s and a transfer band of up to 500 MHz was used, which, besides the light pulse courses, records voltage waveform as well. It should be noted that the value of photomultiplier amplification is related to the supply voltage. This value was selected experimentally and maintained at the same level for all measurements. Thanks to this, the obtained results could be compared with one another.
LIBV was determined in accordance with a step method, with one shot per step. This means that tests were performed by successively applying a one-standard lightning impulse to the electrode system immersed in the tested liquid per measurement step. Peak voltage was increased until breakdown occurred. The adopted voltage step (ΔV) was 5 kV and a time interval of Δt1, which was 60 s, was maintained between subsequent voltage levels. For a test to be considered reliable, the sample needed to withstand at least 3 voltage steps before breakdown. After breakdown, the liquid was stirred to speed up its regeneration. A time interval Δt2 of 30 min was maintained before starting each subsequent test procedure. The point electrode was replaced after each breakdown, while the sphere electrode was rotated. The sphere electrode was replaced after 5 breakdowns. The number of measurement procedures was set to ten in order to obtain enough values for statistical analysis. Such an approach was in line with the authors’ previous works [19,20,21,34], but also with an approach applied in this field by others [6,11,15,35]. Figure 3 schematically illustrates the method of determining the LIBV of a liquid.
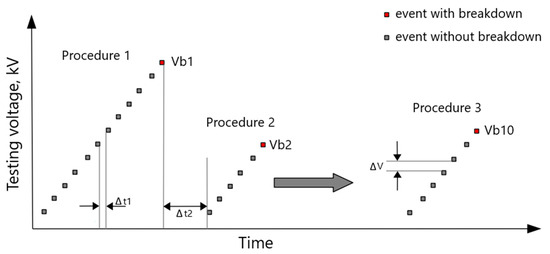
Figure 3.
Scheme of the procedure used to determine the LIBV of a dielectric liquid. ΔV—voltage step; Vb1, 2 … 10—determined LIBV; Δt1—time between subsequent discharges; Δt2—time between subsequent testing procedures.
The obtained LIBV results were subjected to statistical processing. In many studies, authors try to find an appropriate statistical distribution that reflects their observations in the best way. When analyzing values of 50% breakdown probability, results for individual statistical distributions do not differ significantly. From a technical point of view, values for low percentiles (e.g., 5% breakdown probability) are interesting due to the fact that they may be treated as the so-called withstand voltage [36,37,38]. Many conducted studies confirm the hypothesis that the Weibull distribution function is a suitable function for the statistical processing of data on LIBV [39,40]. Hence, for the purposes of this research, the analysis of obtained results was performed using the two-parameter Weibull distribution.
To determine the acceleration voltage (Va), the tests started from the earlier-evaluated LIBV for each liquid, respectively. Peak voltage was increased, as before, with a voltage step of ΔV = 5 kV, until a significant reduction in time to breakdown was achieved, indicating a transition from slow to fast discharges. As in the case of determining the LIBV, a break of Δt1 of 60 s was maintained between subsequent voltage levels. For each tested liquid, two measurement procedures were performed, maintaining the time between them at Δt2 of 30 min. As in the case of LIBV, the number of series remained the same, in accordance with the authors’ previous experience [19,20,21,34]. Figure 4 shows the method of determining the acceleration voltage graphically.
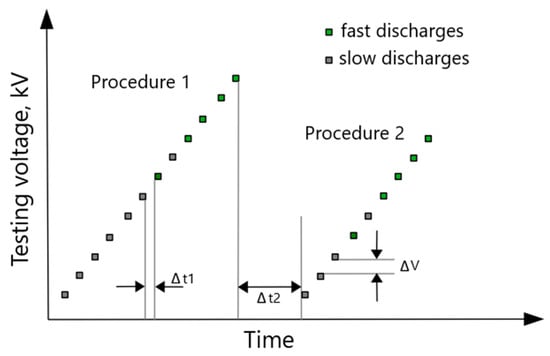
Figure 4.
Schematic representation of the adopted methodology for determining the Va of a dielectric liquid. ΔV—voltage step; ΔVa1,2—acceleration voltage; Δt1—time between successive discharges (approx. 60 s); Δt2—time between successive test series (approx. 30 min.).
3. Measurement Results and Discussion
3.1. LIBV
As previously stated, LIBV was assessed on the basis of the results obtained from ten measurement procedures. The data, individually for each tested liquid, are presented in the form of two-parameter Weibull distribution plots in Figure 5 and Figure 6, for 25 mm and 40 mm gap distances, respectively. ‘Shape’ and ‘Scale’ shown in the figures’ legends refer to the shape parameter and scale parameter of the Weibull distribution for the given set of data.
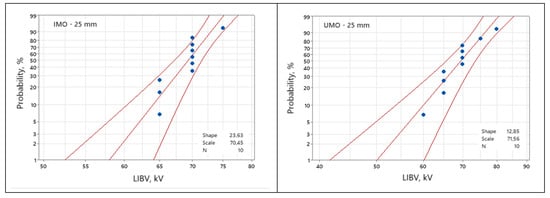
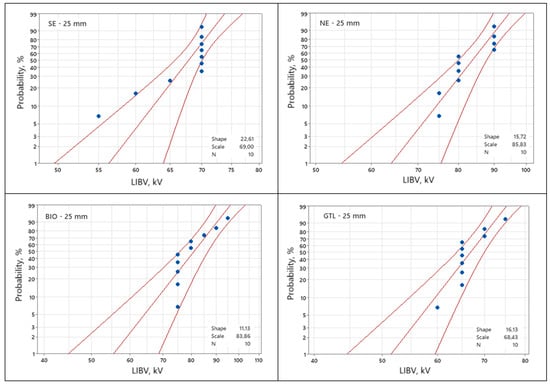
Figure 5.
Set of Weibull plots of LIBV for a 25 mm gap distance.
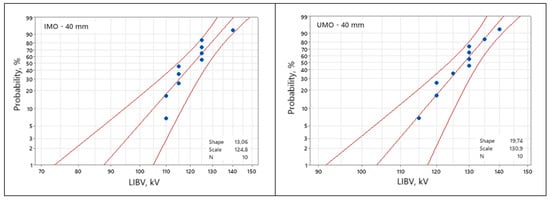
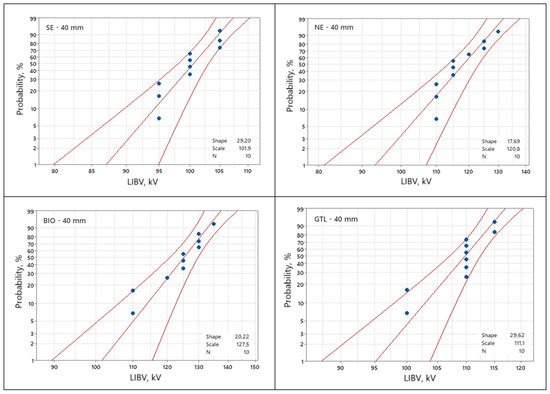
Figure 6.
Set of Weibull plots of LIBV for a 40 mm gap distance.
From the presented plots, the values of 5% (Vb5%) and 50% (Vb50%) breakdown probabilities were gathered as comparative factors. In Table 2, they are shown jointly for all liquids. Standard deviations (SD) and average values (Vb) calculated from the vector of random variables representing each given liquid are also included in this table. For improved result visualization, Figure 7 provides a graphic representation of 5% breakdown probabilities as the withstand voltages for the testing conditions.
Table 2.
Characteristic levels of positive LIBV and probabilities determined from the two-parameter Weibull distribution.
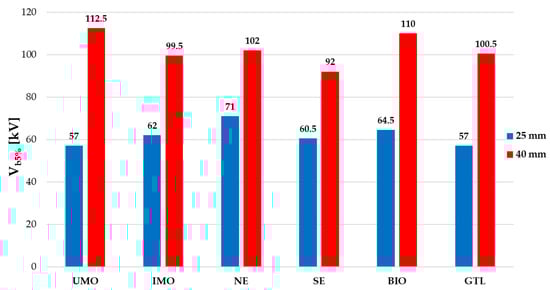
Figure 7.
Graph showing 5% (Vb5%) breakdown probabilities for the considered gap distances.
The level of 5% probability is a commonly accepted and used indicator in statistics concerning breakdown voltage data, both in terms of LI voltage and AC voltage, as seen in, for example, [12,13,15,35,39,40]. It may be treated, as previously mentioned, as the withstand voltage value and applied for comparative purposes. Hence, such a line of reasoning was adopted here for analyzing the results obtained.
Looking at the results for 5% LIBV, it may be stated that the liquids do not exhibit high discrepancy in terms of positive lightning impulse voltage. When putting together the results concerning 25 mm and 40 mm, it is noticeable that they fluctuate, which means that a liquid that has a lower LIBV for the 25 mm gap may have a higher LIBV for the 40 mm gap distance. Hence, it is clear that none of the liquids may be treated as clearly behaving better the others. For example, UMO has the lowest LIBV for the 25 mm gap and the highest for 40 mm. This shows and confirms the strong stochastic nature of breakdown phenomena in dielectric liquids under positive lightning impulse stress with a non-uniform electric field, which is consistent with the observations published in the literature [12,13,19,23].
In conclusion, the lightning performance of the variety of dielectric liquids tested here cannot be assessed only on the basis of LIBV; acceleration voltage should be considered as well in this regard to show a more in-depth comparison between the liquids.
3.2. Acceleration Voltage
As mentioned above, Va was determined through an analysis of the relationship between propagation velocity and applied voltage. The propagation velocity was determined from the registered oscillograms of voltage and light. The method used for reading this is shown in examples of oscillograms in Figure 8 and Figure 9. These examples were chosen to illustrate a case of a developing discharge causing a breakdown for slow and fast propagating discharges, respectively. The propagation velocity of discharges was obtained simply through dividing the gap distance by the time to breakdown read from the voltage waveform.
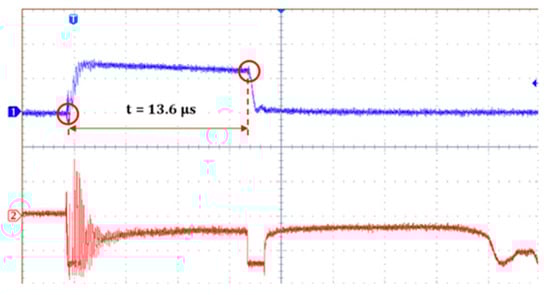
Figure 8.
Method of reading time to breakdown from an example oscillogram recorded during the determination of LIBV (70 kV) for the IMO liquid with a 25 mm gap and positive polarity, where 1—voltage, 2—light, with a time base of 4 µs/div and volts/div of 50 kV.
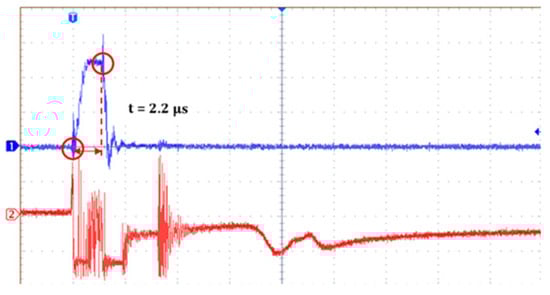
Figure 9.
Method of reading time to breakdown from an example oscillogram recorded during the determination of Va (245 kV) for the IMO liquid with a 25 mm gap and positive polarity, where 1—voltage, 2—light, with a time base of 4 µs/div and volts/div of 100 kV.
Results showing the relationship between propagation velocity and applied voltage, collectively for all liquids tested, are shown in Figure 10 and Figure 11 for the 25 mm gap distance (Figure 10) and 40 mm gap distance (Figure 11).
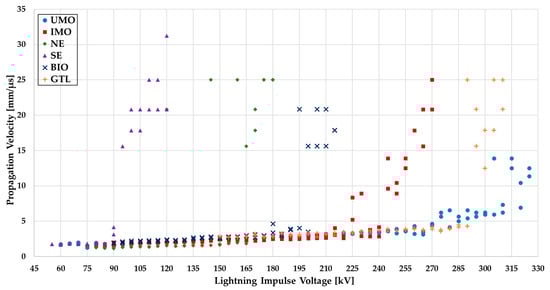
Figure 10.
Characteristics of propagation velocity of discharges versus applied peak impulse voltage—25 mm gap.
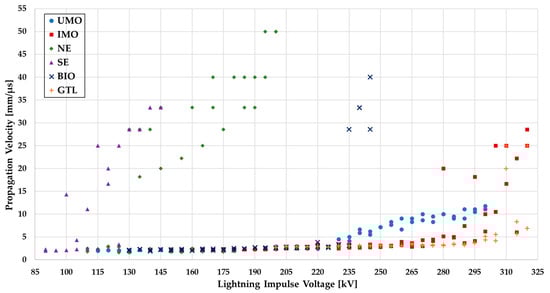
Figure 11.
Characteristics of propagation velocity of discharges versus applied peak impulse voltage—40 mm gap.
It is worth noting that in the case of tests under positive lightning impulse voltage, the propagation velocity of streamers does not increase uniformly with increases in applied voltage, unlike in the case of negative lightning impulse voltage. The moment of the change in propagation mode from slow to fast is, for positive polarity, always sudden, which facilitates the identification of the acceleration voltage [12,13,15,16,21,23]. Taking into account the authors’ previous experience in this field, for the purposes of this research the value of Va was assumed to be the moment when discharges reach a propagation velocity of about 10 mm/µs [19,21]. Approximate values of acceleration voltages, read from the above-quoted figures, are presented in graphical form in Figure 12.
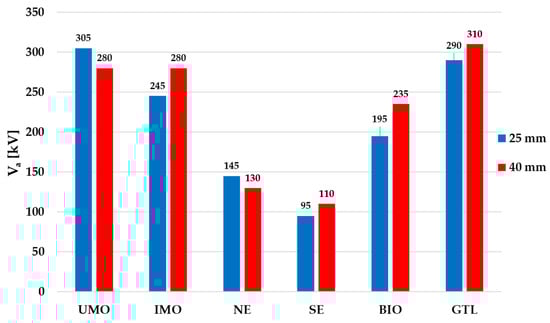
Figure 12.
Approximate acceleration voltages for positive polarity (≈Va).
The lowest values of Va were noticed for the ester fluids, NE and SE, which is not a surprise. The esters contain polar molecules in their chemical structure (double oxygen bonds in the ester group), which are characterized by a reduced ionization potential, and this may contribute to an acceleration of the development of discharges in esters; at lower voltage values (lower value of local electrical field stress), the molecules of reduced ionization potential are directly ionized and start to be involved in the discharge development process. The obtained results are consistent with theories and observations found in other studies [13,14,15,23]. In turn, higher values of Va were seen for the hydrocarbon fluids (UMO, IMO, BIO, and GTL). From this group of liquids, the lowest values were obtained for BIO. Since the aromatic molecules in this liquid volume are understood to slow down the propagation velocity due to their higher ionization potential, the above observation is not unexpected. BIO lacks aromatic hydrocarbons in its chemical composition in comparison to the other hydrocarbons tested (UMO, IMO, and GTL), which is seen in the reduced value of Va.
It should be noted that there are larger inaccuracies in predicting the discharge velocity for times to breakdown of approximately 1 µs or less. This is because discharges have the potential to be initialized before the voltage reaches its peak value, which may result in a time to breakdown that is less than the time to peak, which is equal to 1.2 µs. For this reason, it is possible to incorrectly determine the propagation velocity of fast discharges (i.e., those faster than 6–10 mm/µs).
3.3. Light Emission
Light emission is a qualitative indicator of discharge behavior in liquids under lightning impulse voltage. However, for positive polarity, light intensity is harder to analyze because positive-polarity emitted light is weaker than in the case of negative polarity. In other words, negative discharges always emit more light than their positive counterparts [12,13,21]. This is due to the lower value of voltage connected with discharge processes such as initiation and breakdown. Hence, especially for the hydrocarbon liquids, either light is not noticeable on the recorded oscillograms or only individual pulses can be observed, even at the voltage level preceding breakdown. Examples of oscillograms recorded at the voltage level directly before breakdown, confirming the above statement, are presented in Figure 13. Examples (a) and (b) show individual pulses after circa 20 µs, while examples (e) and (f) show no pulses at all. In turn, examples (c) and (d) present discharge processes that are quite intense in terms of time: discharge is initiated and disappears after 15–20 µs. Please note that during the first 1–2 µs, the signal recorded on the course of light (red course in the oscillogram) does not represent light itself. This is the disturbance caused by the impulse electric field from the lightning impulse generator and cannot be used in the assessment. In general, light intensity is always higher for ester liquids, but for hydrocarbons the intensity is very low and sometimes cannot be detected.
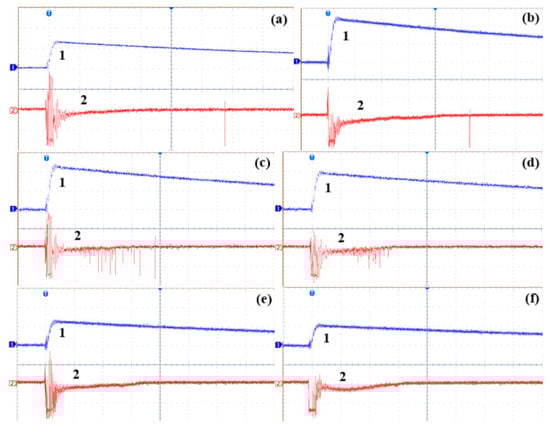
Figure 13.
Examples of oscillograms of voltage and light intensity generated under positive lightning impulse voltage in a point-to-sphere electrode system, with a 40 mm gap, registered just before breakdown happened: 1 (blue)—voltage; 2 (red)—light pulses; x-axis—time, 4 µs/div; y-axis—voltage, 50 kV/div (for b,c,d), 100 kV/div (for a,e,f). (a) UMO—125 kV, (b) IMO—120 kV, (c) NE—110 kV, (d) SE—95 kV, (e) BIO—120 kV, (f) GTL—105 kV.
From the perspective of light registration, the situation when breakdown occurs is interesting. The event of breakdown was not preceded by intense light emission as in the case of negative polarity. In the esters, some weak pulses are noticeable, but for other liquids the light courses were almost lacking any light activity, similar to observations at the voltage levels without breakdown. Examples of oscillograms concerning breakdown events are shown in Figure 14.
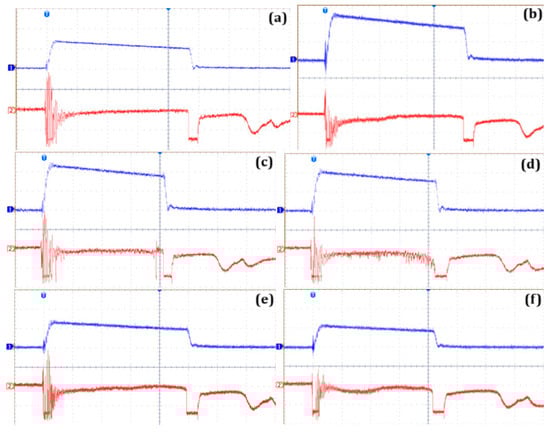
Figure 14.
Examples of oscillograms of voltage and light intensity generated under positive lightning impulse voltage in a point-to-sphere electrode system, with a 40 mm gap, registered when breakdown happened: 1 (blue)—voltage; 2 (red)—light pulses; x-axis—time, 4 µs/div; y-axis—voltage, 50 kV/div (for b,c,d), 100 kV/div (for a,e,f). (a) UMO—130 kV, (b) IMO—125 kV, (c) NE—115 kV, (d) SE—100 kV, (e) BIO—125 kV, (f) GTL—110 kV.
Looking at the above examples representing breakdown, it is clearly observed that they deal with slow-developing discharges, since the time to breakdown is at least equal to 16 µs and, when it comes to the gap distance of 40 mm, the propagation velocity of discharges causing breakdown is equal to maximum 2.5 mm/µs. For this reason, the liquids may be treated as equivalently good in terms of lightning performance at positive polarity.
In turn, Figure 15 presents a set of oscillograms for breakdown being a result of fast-developing discharges; breakdown happens in all cases after a few microseconds (less than 4 µs), which corresponds to a propagation velocity equal to 10 mm/µs or higher. Such a propagation velocity corresponds solely to the fast mode of discharge propagation.
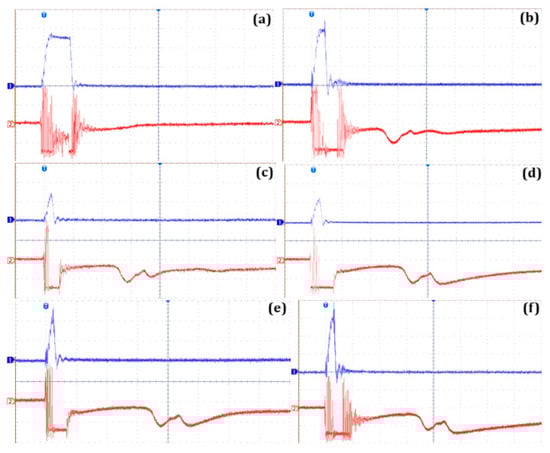
Figure 15.
Examples of oscillograms of voltage and light intensity generated under positive lightning impulse voltage in a point-to-sphere electrode system, with a 40 mm gap, registered when acceleration voltage was reached: 1 (blue)—voltage; 2 (red)—light pulses; x-axis—time, 4 µs/div; y-axis—voltage, 100 kV/div. (a) UMO—280 kV, (b) IMO—280 kV, (c) NE—130 kV, (d) SE—110 kV, (e) BIO—235 kV, (f) GTL—310 kV.
Obviously, for these oscillograms, differences are visible only in terms of the value of voltage at which the fast discharges are noticed. Hence, these oscillograms partially confirm what was presented earlier in this paper in terms of the discussion of the acceleration voltage parameter. In terms of light, due to the short time to breakdown, it is practically impossible to conduct a comparison.
In conclusion, positive discharges cannot easily be assessed qualitatively on the basis of recorded light. This statement is not, however, a surprise, because data from the literature, reported by both the authors and others, show similar observations [12,15,17,19]. The only phase in which differences between the liquids appear is the phase concerning the so-called stopping length discharges, i.e., discharges preceding breakdown. In such cases, there are always more pulses noticed in esters with higher peak values occurring simultaneously, which was pointed out earlier when discussing Figure 13 and Figure 14.
3.4. Electric Field Analysis
The obtained LIBV and Va results were used to carry out finite-element-method-based simulations of electric field distribution, with a special focus on the maximum values of electric field at the tip of the HV electrode. These simulations were intended to show the differences between the liquids in terms of the aforementioned values responsible for the same physical processes: breakdown or discharge acceleration. Thus, when applying the value of LIBV as voltage potential, we can obtain the maximum electric field around the tip of HV electrode, which causes the initiation of the discharges, leading to breakdown. In turn, when the values of Va are designated as the voltage potential of the HV electrode, we can state that the maximum electric field around the tip of the HV electrode causes the direct initiation of fast discharges. Only such issues were considered herein, which facilitated a comparison of the specific values for two gap distances. Simulating discharges (streamers) developing in liquids is a more complex issue, for which one must consider the transition from the gaseous phase to the liquid phase, the different ionization potentials of ionized molecules, etc. Until now, only a few studies have been conducted in this field, and although these works present some of the ways in which discharges develop in liquids, they simplify the discharge process a lot and do not relate fully to real pre-breakdown phenomena in liquids [41,42,43]. Hence, the values of maximum electric field obtained from simulations may be identified as the values causing the development of a given mode of discharges, especially when comparing these values with the electric field values in correspondence with the LIBV and Va. For the purpose of these simulations, the FEMM 4.2 software was utilized. This software uses two conditions to solve electrostatic problems: the first one is a differential form of Gauss law, and the second one is a differential form of Amperes loop law. The user may define the data range and boundary conditions.
As expected, in each case, the area with the highest values of electric field intensity was at the tip of the HV point electrode, and these values dropped very quickly with increases in the distance from the tip. This is a classic example of a field distribution in an electrode system with an extremely non-uniform field [11,12,16]. Figure 16 shows an example of the generated results for one specific case with a natural ester as the dielectric liquid. The legend presented on the right side of the figure was directly generated by the software, so it was not possible for the authors to change it.
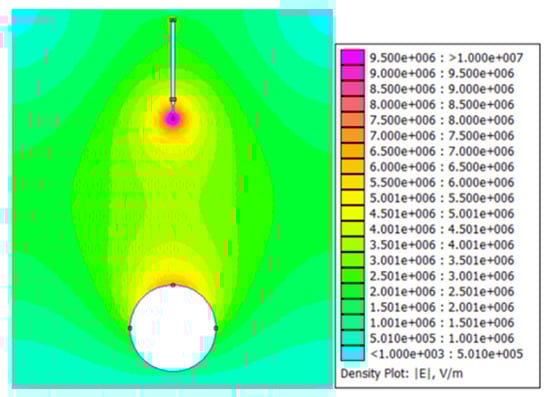
Figure 16.
An example of the generated results for a natural ester as a dielectric liquid.
Determination of the maximum values of electric field intensity was generally aimed at checking whether breakdown and then the appearance of fast discharges occurred under the tested conditions, which were, for each given liquid, similar regardless of the gap distance. This would facilitate, to some extent, a generalization of the conclusions obtained for the considered testing conditions. The results are illustrated collectively in Figure 17 and Figure 18.
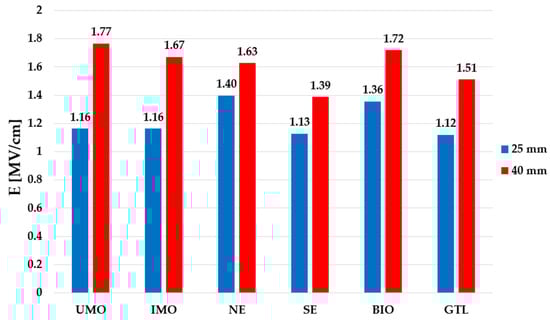
Figure 17.
Maximum electric field stress [MV/cm] for LIBV under positive polarity.
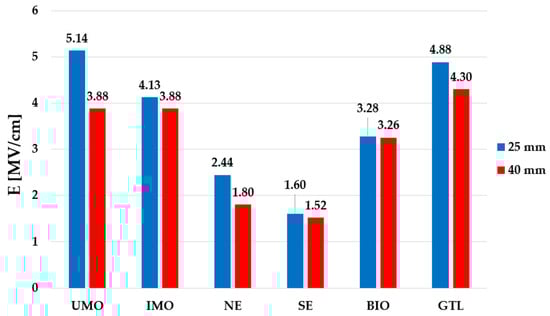
Figure 18.
Maximum electric field stress [MV/cm] for Va under positive polarity.
Analyzing the obtained characteristic values of maximum electric field stress corresponding to the LIBV, it can be noticed that slightly higher values occur at the 40 mm gap distance, and this is a true for all liquids considered. In addition, the values are consistent with the theory of breakdown in liquids, which says, in general, that electric field stress at the tip of the HV electrode responsible for breakdown fluctuates at around 1 MV/cm, independently of the radius of curvature of the HV electrode and the liquid type [16,17,22,23]. In turn, the electric field stress values calculated for Va show less differences between the results for the 25 and 40 mm gap distances, especially for IMO, SE, and BIO, and to a lesser extent for GTL. For the former three liquids, the differences are around 7% as far as comparing both gaps is considered. However, for the rest of the liquids, the differences are from 12% (for GTL) to as high as 25% (for UMO), which confirms the more unpredictable behavior of these liquid types under positive lightning impulse voltage, with acceleration voltage as a parameter and a non-uniform field as the experiment conditions.
4. Conclusions
The research results presented in this paper enable the formulation of the following conclusions:
The values of LIBV show that the tested liquids do not exhibit high discrepancy in terms of positive lightning impulse voltage, unlike what is seen for negative polarity. The values of LIBV obtained for 25 mm and 40 mm fluctuate, which means that a liquid that has a lower LIBV for the 25 mm gap may be characterized as having a higher value for the 40 mm gap distance. This confirms the stochastic nature of breakdown phenomena in dielectric liquids under lightning impulse stress with a non-uniform electric field.
Fast discharges, which are treated as being more energetic, being of a higher temperature, and allowing to excite and ionize the molecules to a greater degree of ionization, occur more easily in ester liquids. This conclusion is, of course, consistent with the literature in this field [12,13,15,21]. However, in terms of the remaining tested liquids (IMO, UMO, BIO, and GTL), advantages are observed for UMO and GTL.
The intensity of light emitted during discharge propagation, which is a useful indicator for describing the pre-breakdown phenomena in liquids at negative polarity, is not as valuable for positive discharge assessment. However, this statement is limited to the conditions of this study’s experiment. For larger gaps (>40 mm), light emission may be the equivalent factor for qualitative assessments of discharges in liquids, as in the case of negative polarity, which needs to be checked through a separately designed experiment.
Commonly performed tests of power transformers are limited to negative lightning impulse voltage. The above-mentioned measurement results show that performing tests at positive polarity is also worth considering, in which differences in terms of the analyzed parameters are more pronounced than in the case of negative polarity.
Based on the obtained results, it can be stated that determining the Va of discharges in a given insulating liquid at lightning impulse voltage can be a significant extension of a range of indicators defining the dielectric properties of liquids. Adding it to the existing set of standard indicators such as breakdown voltage at nominal frequency or LIBV, especially at a time when more and more alternative insulating liquids are appearing in mass use, could better facilitate decision-making on the use of a given solution in the insulation system of a power transformer with paper–oil insulation.
Author Contributions
Conceptualization, F.S. and P.R.; methodology, P.R.; validation, F.S. and P.R.; formal analysis, F.S. and P.R.; investigation, F.S.; data curation, F.S.; writing—original draft preparation, F.S. and P.R.; writing—review and editing, F.S. and P.R.; visualization, F.S. and P.R.; supervision, P.R. All authors have read and agreed to the published version of the manuscript.
Funding
This research received no external funding.
Data Availability Statement
The original contributions presented in this study are included in the article. Further inquiries can be directed to the corresponding author(s).
Conflicts of Interest
The authors declare no conflicts of interest.
References
- Fofana, I. 50 years in the development of insulating liquids. IEEE Electr. Insul. Mag. 2013, 29, 13–25. [Google Scholar] [CrossRef]
- Rozga, P.; Rao, U.M.; Fofana, I.; Beroual, A.; Calcara, L.; Pompili, M.; Wang, F.; Casserly, E.; Martin, R.; Malde, J. Next-Generation Ester Dielectric Liquids: Some Key Findings and Perspectives. IEEE Electr. Insul. Mag. 2024, 40, 23–35. [Google Scholar] [CrossRef]
- Working Group A2.35. Experiences in Service with New Insulating Liquids; CIGRE Brochure 436; CIGRE: Paris, France, 2011. [Google Scholar]
- Rozga, P.; Beroual, A.; Przybylek, P.; Jaroszewski, M.; Strzelecki, K. A Review on Synthetic Ester Liquids for Transformer Applications. Energies 2020, 13, 6429. [Google Scholar] [CrossRef]
- Rafiq, M.; Shafique, M.; Ateeq, M.; Zink, M.; Targitay, D. Natural esters as sustainable alternating dielectric liquids for transformer insulation system: Analyzing the state of the art. Clean Technol. Environ. Policy 2024, 26, 623–659. [Google Scholar] [CrossRef]
- Jayasree, T.; Rao, U.M.; Fofana, I.; Brettschneider, S.; Celis, E.M.R.; Picher, P. Pre-breakdown Phenomena and Influence of Aging Byproducts in Thermally Aged Low Pour Point Ester Fluids Under AC Stress. IEEE Trans. Dielectr. Electr. Insul. 2021, 28, 1563–1570. [Google Scholar] [CrossRef]
- Oparanti, S.O.; Rao, U.M.; Fofana, I. Natural Esters for Green Transformers: Challenges and Keys for Improved Serviceabil-ity. Energies 2023, 16, 61. [Google Scholar] [CrossRef]
- IEC 60897; Methods for the Determination of the Lightning Impulse Breakdown Voltage of Insulating Liquids. International Electrotechnical Commission (IEC): Geneva, Switzerland, 1987.
- IEC 60156; Insulating Liquids—Determination of the Breakdown Voltage at Power Frequency—Test Method. International Electrotechnical Commission (IEC): Geneva, Switzerland, 2018.
- Dang, V.-H.; Beroual, A.; Perrier, C. Comparative study of statistical breakdown in mineral, synthetic and natural ester oils under AC voltage. IEEE Trans. Dielectr. Electr. Insul. 2012, 19, 1508–1513. [Google Scholar] [CrossRef]
- Denat, A.; Lesaint, O.; Mc Cluskey, F. Breakdown of liquids in long gaps: Influence of distance, impulse shape, liquid nature, and interpretation of measurements. IEEE Trans. Dielectr. Electr. Insul. 2015, 22, 2581–2591. [Google Scholar] [CrossRef]
- Rao, U.M.; Fofana, I.; Beroual, A.; Rozga, P.; Pompili, M.; Calcara, L.; Rapp, K.J. A review on pre-breakdown phenomena in ester fluids: Prepared by the international study group of IEEE DEIS liquid dielectrics technical committee. IEEE Trans. Dielectr. Electr. Insul. 2020, 27, 1546–1560. [Google Scholar] [CrossRef]
- Working Group A2.35. Dielectric Performance of Insulating Liquids for Transformers; CIGRE Brochure 856; CIGRE: Paris, France, 2021. [Google Scholar]
- Lesaint, O.; Massala, G. Positive streamer propagation in large oil gaps: Experimental characterization of propagation modes. IEEE Trans. Dielectr. Electr. Insul. 1998, 5, 360–370. [Google Scholar] [CrossRef]
- Liu, Q.; Wang, Z.D. Streamer characteristic and breakdown in synthetic and natural ester transformer liquids under standard lightning impulse voltage. IEEE Trans. Dielectr. Electr. Insul. 2011, 18, 285–294. [Google Scholar] [CrossRef]
- Lesaint, O. Prebreakdown phenomena in liquids: Propagation ‘modes’ and basic physical properties. J. Phys. D Appl. Phys. 2016, 49, 14401–14422. [Google Scholar] [CrossRef]
- Linhjell, D.; Lundgaard, L.; Unge, M.; Hjortstam, O. Prebreakdown phenomena in hydrocarbon liquids in a point-plane gap under step voltage. Part 1: Behaviour at positive polarity. J. Phys. Commun. 2020, 4, 045012. [Google Scholar] [CrossRef]
- Lundgaard, L.E.; Liu, Q.; Lesaint, O.; Madshaven, I. Dielectric Performance of Transformer Liquids–Summary of a CIGRE Study. IEEE Electr. Insul. Mag. 2023, 39, 7–16. [Google Scholar] [CrossRef]
- Stuchała, F.; Małaczek, M.; Puchała, K.; Jakubowski, J.; Binek, M. Breakdown and acceleration voltage of biodegradable liquid made in GTL technology at positive lightning impulse voltage. Przeglad Elektrotechniczny 2024, 11, 182–185. [Google Scholar] [CrossRef]
- Stuchala, F.; Rozga, P.; Malaczek, M.; Staniewski, J. Comparative Analysis of Selected Insulating Liquids Including Bio-Based Hydrocarbon and GTL in Terms of Breakdown and Acceleration Voltage at Negative Lightning Impulse. IEEE Trans. Dielectr. Electr. Insul. 2024, 31, 2443–2450. [Google Scholar] [CrossRef]
- Rozga, P.; Stuchala, F.; Ungarala, M.R.; Sree, T.J. Assessing the lightning performance of sustainable GTL type dielectric liquids versus mineral oils and synthetic ester in a non-uniform electric field. Measurement 2025, 242, 116089. [Google Scholar] [CrossRef]
- Tobazcon, R. Prebreakdown phenomena in dielectric liquids. IEEE Trans. Dielectr. Electr. Insul. 1994, 1, 1132–1147. [Google Scholar] [CrossRef]
- Beroual, A.; Zahn, M.; Badent, A.; Kist, K.; Schwabe, A.; Yamashita, H.; Yamazawa, K.; Danikas, M.; Chadband, W.; Torshin, Y. Propagation and structure of streamers in liquid dielectrics. IEEE Electr. Insul. Mag. 1998, 14, 6–17. [Google Scholar] [CrossRef]
- ISO 12185; Crude Petroleum, Petroleum Products and Related Products—Determination of Density—Laboratory Density Meter with an Oscillating U-Tube Sensor. International Organization for Standardization (ISO): Geneva, Switzerland, 2024.
- ISO 3104; Petroleum Products—Transparent and Opaque Liquids—Determination of Kinematic Viscosity and Calculation of Dynamic Viscosity. International Organization for Standardization (ISO): Geneva, Switzerland, 2023.
- ISO 2719; Determination of Flash Point—Pensky-Martens Closed Cup Method. International Organization for Standardization (ISO): Geneva, Switzerland, 2016.
- ISO 3016; Petroleum and Related Products from Natural or Synthetic Sources—Determination of Pour Point. International Organization for Standardization (ISO): Geneva, Switzerland, 2019.
- OECD Guideline for Testing Chemicals, Test No. 301: Ready Biodegradability; Organisation for Economic Co-operation and Development (OECD): Paris, France, 1992.
- ASTM D6866-22; Standard Test Methods for Determining the Biobased Content of Solid, Liquid, and Gaseous Samples Using Radiocarbon Analysis. American Society for Testing and Materials (ASTM): West Conshohocken, PA, USA, 2024.
- IEC 60247; Insulating Liquids—Measurement of Relative Permittivity, Dielectric Dissipation Factor (tan d) and d.c. Resistivity. International Electrotechnical Commission (IEC): Geneva, Switzerland, 2004.
- Sunesson, A.; Barmann, P.; Kroll, S.; Walfridsson, L. Laser triggering of electric breakdown in liquids. IEEE Trans. Dielectr. Electr. Insul. 1994, 1, 680–691. [Google Scholar] [CrossRef]
- Bårmann, P.; Kröll, S.; Sunesson, A. Spectroscopic measurements of streamer filaments in electric breakdown in a dielectric liquid. J. Phys. D Appl. Phys. 1996, 29, 1188–1196. [Google Scholar] [CrossRef]
- Rozga, P.; Tabaka, P. Comparative analysis of breakdown spectra registered using optical spectrometry technique in biodegradable ester liquids and mineral oil. IET Sci. Meas. Technol. 2018, 12, 684–690. [Google Scholar] [CrossRef]
- Rozga, P.; Stuchala, F.; Pasternak, B.; Binek, M. Comparison of negative streamer development in synthetic ester and mineral oil in a point-sphere gap divided by a pressboard barrier. J. Electrost. 2023, 125, 103839. [Google Scholar] [CrossRef]
- Yu, H.; Liu, Q.; Wang, Z.; Krause, C.; Wilkinson, M. Breakdown Characteristics of Transformer Liquids with Winding Conductor Segments under Lightning Impulse. IEEE Trans. Dielectr. Electr. Insul. 2025; early access. [Google Scholar] [CrossRef]
- Trinh, N.G.; Vincent, C. Statistical Significance of Test Methods for Low Probability Breakdown and Withstand Voltages. IEEE Trans. Power Appar. Syst. 1980, PAS-99, 711–719. [Google Scholar] [CrossRef]
- Liu, Q.; Wang, Z.D.; Perrot, F. Impulse Breakdown Voltages of Ester-based Transformer Oils Determined by Using Different Test Methods. In Proceedings of the 2009 IEEE Conference on Electrical Insulation and Dielectric Phenomena, Virginia Beach, VA, USA, 18–21 October 2009; pp. 608–612. [Google Scholar]
- Haegele, S.; Vahidi, F.; Tenbohlen, S.; Rapp, K.J.; Sbravati, A. Lightning Impulse Withstand of Natural Ester Liquid. Energies 2018, 11, 1964. [Google Scholar] [CrossRef]
- Rozga, P.; Stuchala, F.; Wolmarans, C.; Milone, M. Discharge Inception and Breakdown of the Oil-Wedge Type Electrode Model Insulated with GTL based Die-lectric Liquids. In Proceedings of the 2025 IEEE 23rd International Conference on Dielectric Liquids (ICDL), Lodz, Poland, 18–22 May 2025. [Google Scholar]
- Chen, Q.; Beroual, A.; Sima, W.; Sun, P. AC and Lightning Impulse Breakdown Voltage Comparative Study of Mineral Oil-Based Fe3O4, Al2O3, and TiO2 Nanofluids. IEEE Trans. Dielectr. Electr. Insul. 2024, 31, 278–287. [Google Scholar] [CrossRef]
- Guo, R.; Becerra, M.; Li, J. Macroscopic Simulation of Streamer Development in Mineral Oil. In Proceedings of the 2022 IEEE 21st International Conference on Dielectric Liquids (ICDL), Sevilla, Spain, 29 May–2 June 2022; pp. 1–4. [Google Scholar]
- Li, S.; Wang, F.; Wang, Q.; Ouyang, L.; Chen, X.; Li, J. Numerical Modeling of Branching-Streamer Propagation in Ester-Based Insulating Oil Under Positive Lightning Impulse Voltage: Effects from Needle Curvature Radius. IEEE Trans. Dielectr. Electr. Insul. 2023, 30, 139–147. [Google Scholar] [CrossRef]
- Li, C.-H.; Liang, X.; Liu, T.; Wang, F.; Huang, Z.; Li, J. Three-Dimensional Features of Streamers in Natural Ester Insulating Oil Under Lightning Impulse Voltage. IEEE Trans. Dielectr. Electr. Insul. 2024, 31, 95–101. [Google Scholar] [CrossRef]
Disclaimer/Publisher’s Note: The statements, opinions and data contained in all publications are solely those of the individual author(s) and contributor(s) and not of MDPI and/or the editor(s). MDPI and/or the editor(s) disclaim responsibility for any injury to people or property resulting from any ideas, methods, instructions or products referred to in the content. |
© 2025 by the authors. Licensee MDPI, Basel, Switzerland. This article is an open access article distributed under the terms and conditions of the Creative Commons Attribution (CC BY) license (https://creativecommons.org/licenses/by/4.0/).